Zip Codes with the Highest Percentage of Local Government Employees in Elmira, NY
RELATED REPORTS & OPTIONS
Local Government Employees
Elmira
Compare Zip Codes
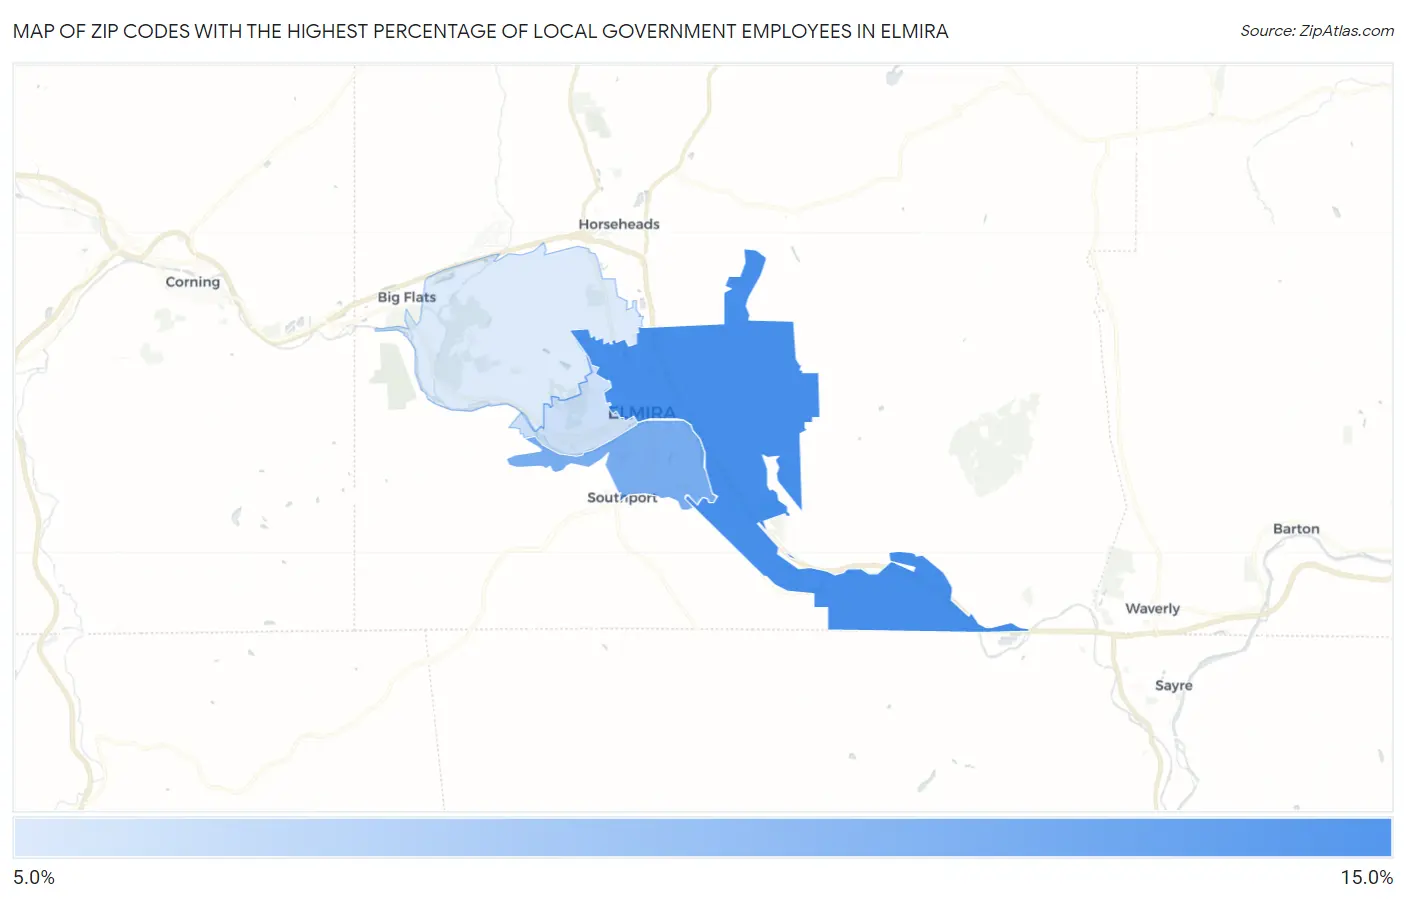
Map of Zip Codes with the Highest Percentage of Local Government Employees in Elmira
0.0%
15.0%
Zip Codes with the Highest Percentage of Local Government Employees in Elmira, NY
| Zip Code | % Local Government Employees | vs State | vs National | |
| 1. | 14901 | 12.8% | 9.9%(+2.98)#480 | 7.2%(+5.62)#4,413 |
| 2. | 14904 | 11.2% | 9.9%(+1.36)#665 | 7.2%(+4.00)#6,277 |
| 3. | 14905 | 8.4% | 9.9%(-1.44)#1,085 | 7.2%(+1.21)#11,977 |
| 4. | 14903 | 8.0% | 9.9%(-1.92)#1,154 | 7.2%(+0.725)#13,330 |
1
Common Questions
What are the Top 3 Zip Codes with the Highest Percentage of Local Government Employees in Elmira, NY?
Top 3 Zip Codes with the Highest Percentage of Local Government Employees in Elmira, NY are:
What zip code has the Highest Percentage of Local Government Employees in Elmira, NY?
14901 has the Highest Percentage of Local Government Employees in Elmira, NY with 12.8%.
What is the Percentage of Local Government Employees in Elmira, NY?
Percentage of Local Government Employees in Elmira is 12.4%.
What is the Percentage of Local Government Employees in New York?
Percentage of Local Government Employees in New York is 9.9%.
What is the Percentage of Local Government Employees in the United States?
Percentage of Local Government Employees in the United States is 7.2%.