Zip Codes with the Highest Percentage of Population Employed in Accommodation & Food Services in Farmington, NM
RELATED REPORTS & OPTIONS
Accommodation & Food Services
Farmington
Compare Zip Codes
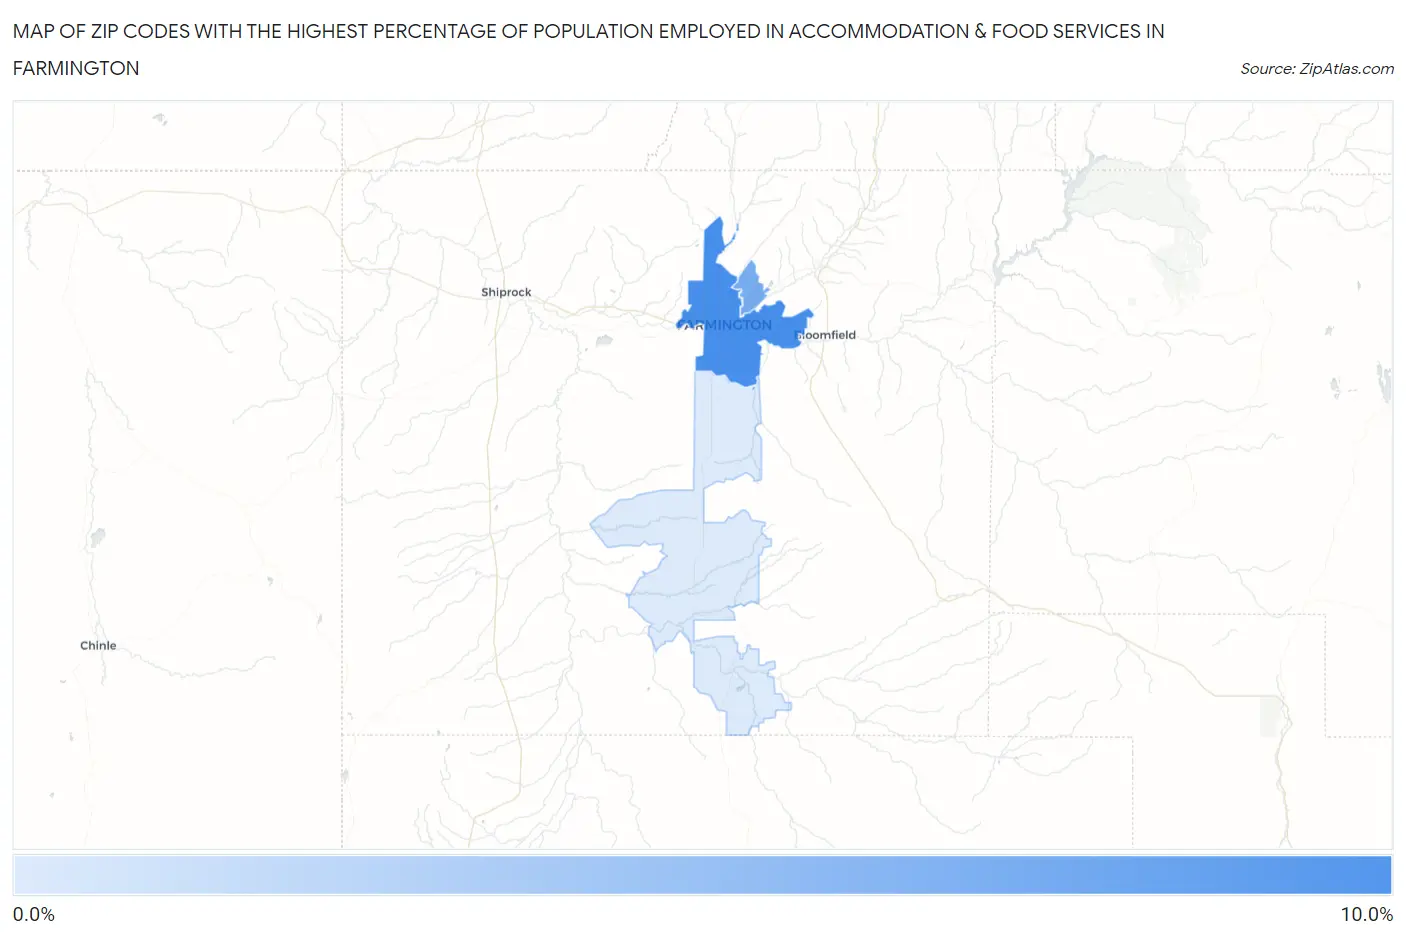
Map of Zip Codes with the Highest Percentage of Population Employed in Accommodation & Food Services in Farmington
0.0%
10.0%
Zip Codes with the Highest Percentage of Population Employed in Accommodation & Food Services in Farmington, NM
| Zip Code | % Employed | vs State | vs National | |
| 1. | 87401 | 8.6% | 7.9%(+0.620)#95 | 6.9%(+1.67)#6,725 |
| 2. | 87402 | 5.9% | 7.9%(-2.00)#148 | 6.9%(-0.952)#13,680 |
| 3. | 87499 | 0.69% | 7.9%(-7.24)#214 | 6.9%(-6.19)#27,695 |
1
Common Questions
What are the Top Zip Codes with the Highest Percentage of Population Employed in Accommodation & Food Services in Farmington, NM?
Top Zip Codes with the Highest Percentage of Population Employed in Accommodation & Food Services in Farmington, NM are:
What zip code has the Highest Percentage of Population Employed in Accommodation & Food Services in Farmington, NM?
87401 has the Highest Percentage of Population Employed in Accommodation & Food Services in Farmington, NM with 8.6%.
What is the Percentage of Population Employed in Accommodation & Food Services in Farmington, NM?
Percentage of Population Employed in Accommodation & Food Services in Farmington is 7.3%.
What is the Percentage of Population Employed in Accommodation & Food Services in New Mexico?
Percentage of Population Employed in Accommodation & Food Services in New Mexico is 7.9%.
What is the Percentage of Population Employed in Accommodation & Food Services in the United States?
Percentage of Population Employed in Accommodation & Food Services in the United States is 6.9%.