Zip Codes with the Highest Percentage of Immigrants from Asia in Paterson, NJ
RELATED REPORTS & OPTIONS
Asia
Paterson
Compare Zip Codes
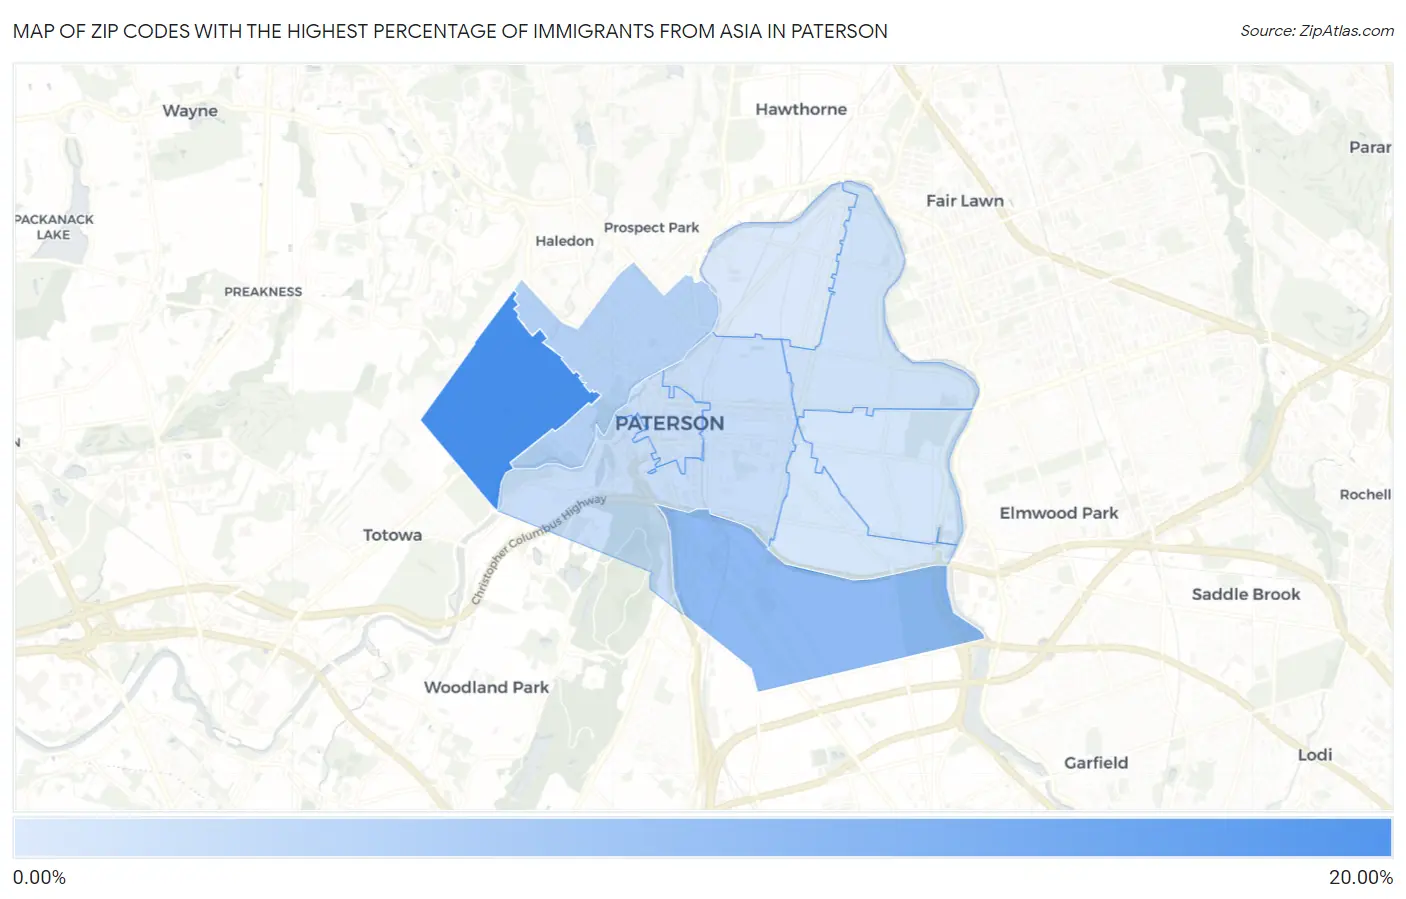
Map of Zip Codes with the Highest Percentage of Immigrants from Asia in Paterson
0.00%
20.00%
Zip Codes with the Highest Percentage of Immigrants from Asia in Paterson, NJ
| Zip Code | Asia | vs State | vs National | |
| 1. | 07502 | 18.68% | 7.48%(+11.2)#48 | 4.26%(+14.4)#463 |
| 2. | 07503 | 9.27% | 7.48%(+1.79)#117 | 4.26%(+5.01)#1,448 |
| 3. | 07522 | 4.66% | 7.48%(-2.82)#233 | 4.26%(+0.396)#3,217 |
| 4. | 07501 | 2.45% | 7.48%(-5.03)#343 | 4.26%(-1.81)#5,838 |
| 5. | 07505 | 2.11% | 7.48%(-5.37)#364 | 4.26%(-2.15)#6,534 |
| 6. | 07514 | 1.52% | 7.48%(-5.96)#405 | 4.26%(-2.74)#8,233 |
| 7. | 07504 | 1.12% | 7.48%(-6.35)#437 | 4.26%(-3.14)#9,713 |
| 8. | 07513 | 0.70% | 7.48%(-6.78)#484 | 4.26%(-3.56)#12,155 |
| 9. | 07524 | 0.19% | 7.48%(-7.29)#530 | 4.26%(-4.07)#17,185 |
1
Common Questions
What are the Top 5 Zip Codes with the Highest Percentage of Immigrants from Asia in Paterson, NJ?
Top 5 Zip Codes with the Highest Percentage of Immigrants from Asia in Paterson, NJ are:
What zip code has the Highest Percentage of Immigrants from Asia in Paterson, NJ?
07502 has the Highest Percentage of Immigrants from Asia in Paterson, NJ with 18.68%.
What is the Percentage of Immigrants from Asia in Paterson, NJ?
Percentage of Immigrants from Asia in Paterson is 4.82%.
What is the Percentage of Immigrants from Asia in New Jersey?
Percentage of Immigrants from Asia in New Jersey is 7.48%.
What is the Percentage of Immigrants from Asia in the United States?
Percentage of Immigrants from Asia in the United States is 4.26%.