Zip Codes with the Highest Percentage of Population Employed in Installation, Maintenance & Repair in Chesterfield, MO
RELATED REPORTS & OPTIONS
Installation, Maintenance & Repair
Chesterfield
Compare Zip Codes
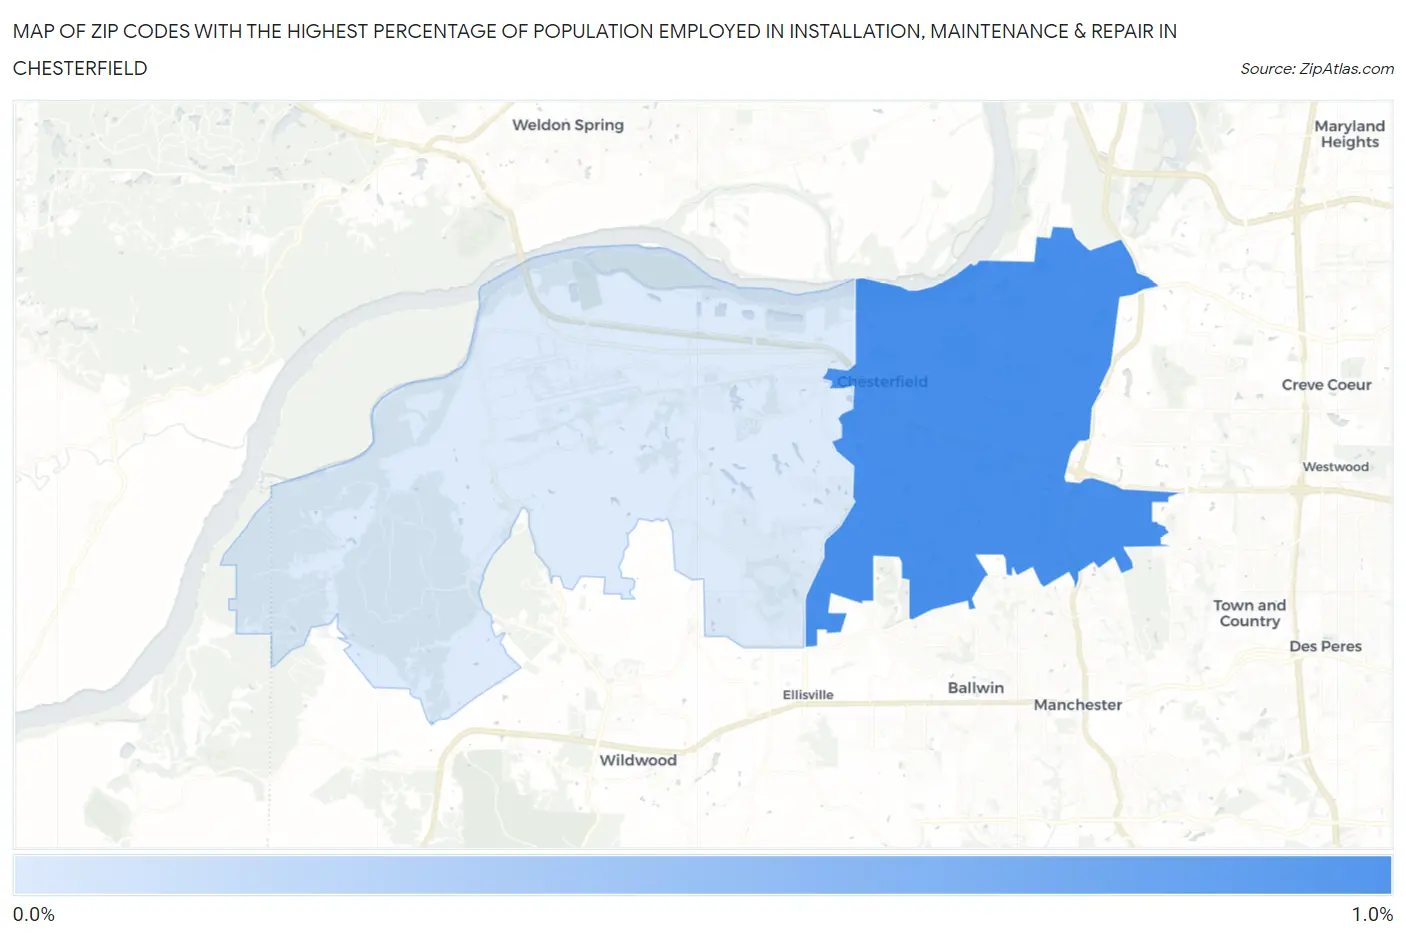
Map of Zip Codes with the Highest Percentage of Population Employed in Installation, Maintenance & Repair in Chesterfield
0.0%
1.0%
Zip Codes with the Highest Percentage of Population Employed in Installation, Maintenance & Repair in Chesterfield, MO
| Zip Code | % Employed | vs State | vs National | |
| 1. | 63017 | 0.95% | 3.2%(-2.26)#822 | 3.1%(-2.12)#26,061 |
| 2. | 63005 | 0.17% | 3.2%(-3.04)#877 | 3.1%(-2.90)#27,717 |
1
Common Questions
What are the Top Zip Codes with the Highest Percentage of Population Employed in Installation, Maintenance & Repair in Chesterfield, MO?
Top Zip Codes with the Highest Percentage of Population Employed in Installation, Maintenance & Repair in Chesterfield, MO are:
What zip code has the Highest Percentage of Population Employed in Installation, Maintenance & Repair in Chesterfield, MO?
63017 has the Highest Percentage of Population Employed in Installation, Maintenance & Repair in Chesterfield, MO with 0.95%.
What is the Percentage of Population Employed in Installation, Maintenance & Repair in Chesterfield, MO?
Percentage of Population Employed in Installation, Maintenance & Repair in Chesterfield is 0.81%.
What is the Percentage of Population Employed in Installation, Maintenance & Repair in Missouri?
Percentage of Population Employed in Installation, Maintenance & Repair in Missouri is 3.2%.
What is the Percentage of Population Employed in Installation, Maintenance & Repair in the United States?
Percentage of Population Employed in Installation, Maintenance & Repair in the United States is 3.1%.