Zip Codes with the Highest Percentage of Population Employed in Accommodation & Food Services in Mankato, MN
RELATED REPORTS & OPTIONS
Accommodation & Food Services
Mankato
Compare Zip Codes
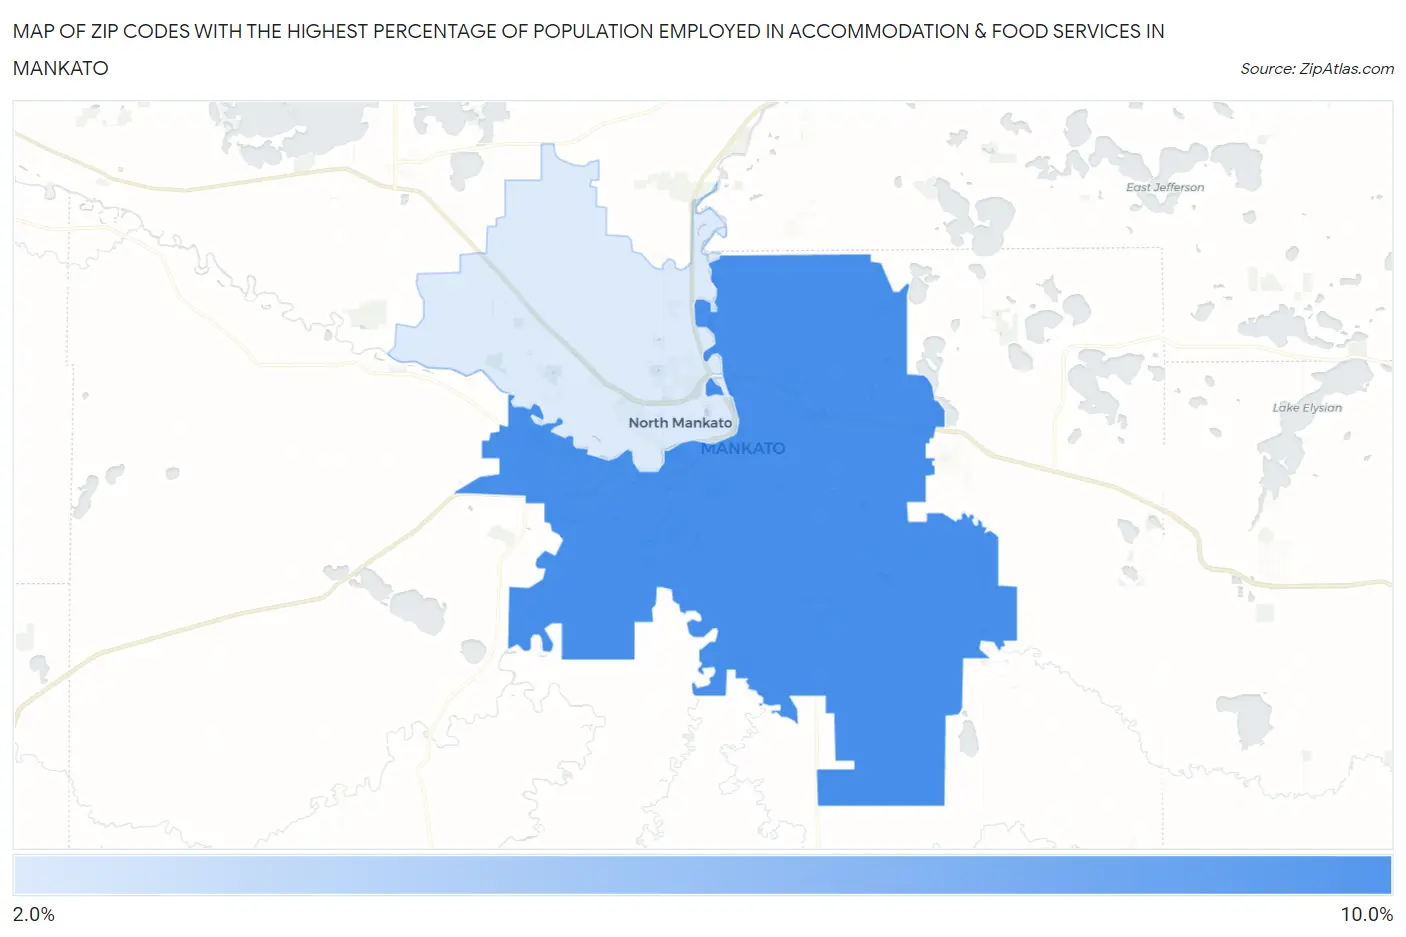
Map of Zip Codes with the Highest Percentage of Population Employed in Accommodation & Food Services in Mankato
0.0%
10.0%
Zip Codes with the Highest Percentage of Population Employed in Accommodation & Food Services in Mankato, MN
| Zip Code | % Employed | vs State | vs National | |
| 1. | 56001 | 9.3% | 5.5%(+3.80)#68 | 6.9%(+2.43)#5,481 |
| 2. | 56003 | 2.7% | 5.5%(-2.78)#653 | 6.9%(-4.14)#23,928 |
1
Common Questions
What are the Top Zip Codes with the Highest Percentage of Population Employed in Accommodation & Food Services in Mankato, MN?
Top Zip Codes with the Highest Percentage of Population Employed in Accommodation & Food Services in Mankato, MN are:
What zip code has the Highest Percentage of Population Employed in Accommodation & Food Services in Mankato, MN?
56001 has the Highest Percentage of Population Employed in Accommodation & Food Services in Mankato, MN with 9.3%.
What is the Percentage of Population Employed in Accommodation & Food Services in Mankato, MN?
Percentage of Population Employed in Accommodation & Food Services in Mankato is 9.9%.
What is the Percentage of Population Employed in Accommodation & Food Services in Minnesota?
Percentage of Population Employed in Accommodation & Food Services in Minnesota is 5.5%.
What is the Percentage of Population Employed in Accommodation & Food Services in the United States?
Percentage of Population Employed in Accommodation & Food Services in the United States is 6.9%.