Zip Codes with the Highest Percentage of Population Employed in Farming, Fishing & Forestry in Lansing, MI
RELATED REPORTS & OPTIONS
Farming, Fishing & Forestry
Lansing
Compare Zip Codes
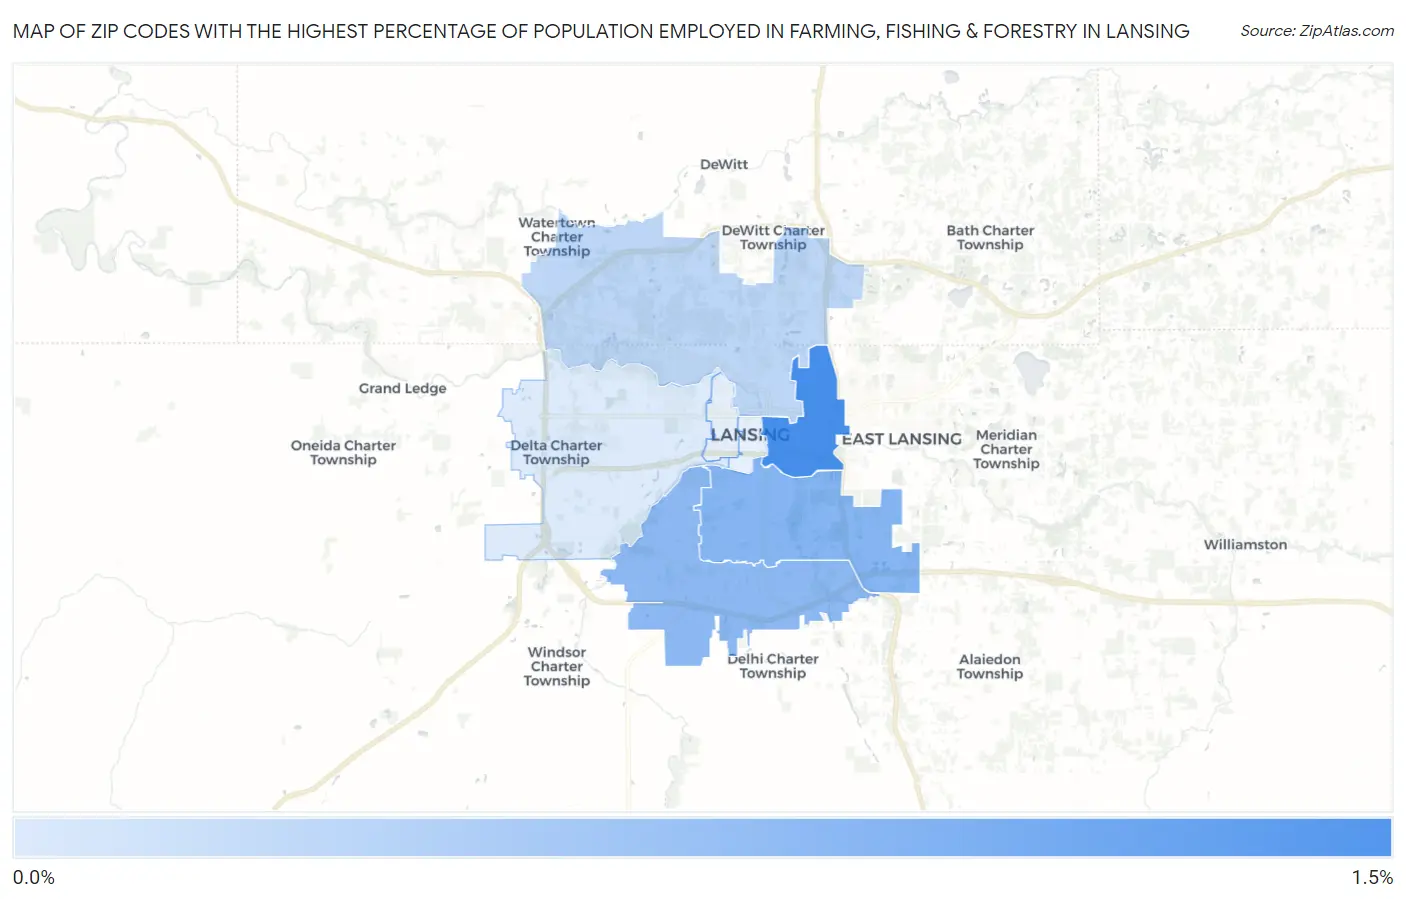
Map of Zip Codes with the Highest Percentage of Population Employed in Farming, Fishing & Forestry in Lansing
0.0%
1.5%
Zip Codes with the Highest Percentage of Population Employed in Farming, Fishing & Forestry in Lansing, MI
| Zip Code | % Employed | vs State | vs National | |
| 1. | 48912 | 1.5% | 0.47%(+1.02)#220 | 0.61%(+0.879)#7,930 |
| 2. | 48910 | 0.89% | 0.47%(+0.421)#312 | 0.61%(+0.282)#10,298 |
| 3. | 48911 | 0.82% | 0.47%(+0.358)#324 | 0.61%(+0.219)#10,638 |
| 4. | 48906 | 0.38% | 0.47%(-0.086)#467 | 0.61%(-0.225)#13,941 |
| 5. | 48917 | 0.068% | 0.47%(-0.398)#654 | 0.61%(-0.537)#18,327 |
1
Common Questions
What are the Top 5 Zip Codes with the Highest Percentage of Population Employed in Farming, Fishing & Forestry in Lansing, MI?
Top 5 Zip Codes with the Highest Percentage of Population Employed in Farming, Fishing & Forestry in Lansing, MI are:
What zip code has the Highest Percentage of Population Employed in Farming, Fishing & Forestry in Lansing, MI?
48912 has the Highest Percentage of Population Employed in Farming, Fishing & Forestry in Lansing, MI with 1.5%.
What is the Percentage of Population Employed in Farming, Fishing & Forestry in Lansing, MI?
Percentage of Population Employed in Farming, Fishing & Forestry in Lansing is 0.85%.
What is the Percentage of Population Employed in Farming, Fishing & Forestry in Michigan?
Percentage of Population Employed in Farming, Fishing & Forestry in Michigan is 0.47%.
What is the Percentage of Population Employed in Farming, Fishing & Forestry in the United States?
Percentage of Population Employed in Farming, Fishing & Forestry in the United States is 0.61%.