Cape Neddick, ME
Cape Neddick Map
Cape Neddick Overview
2,462
TOTAL POPULATION
1,149
MALE POPULATION
1,313
FEMALE POPULATION
87.51
MALES / 100 FEMALES
114.27
FEMALES / 100 MALES
63.7
MEDIAN AGE
2.5
AVG FAMILY SIZE
1.9
AVG HOUSEHOLD SIZE
$48,860
PER CAPITA INCOME
$123,709
AVG FAMILY INCOME
$76,701
AVG HOUSEHOLD INCOME
41.3%
WAGE / INCOME GAP [ % ]
58.7¢/ $1
WAGE / INCOME GAP [ $ ]
0.41
INEQUALITY / GINI INDEX
944
LABOR FORCE [ PEOPLE ]
43.2%
PERCENT IN LABOR FORCE
6.0%
UNEMPLOYMENT RATE
Cape Neddick Zip Codes
Cape Neddick Area Codes
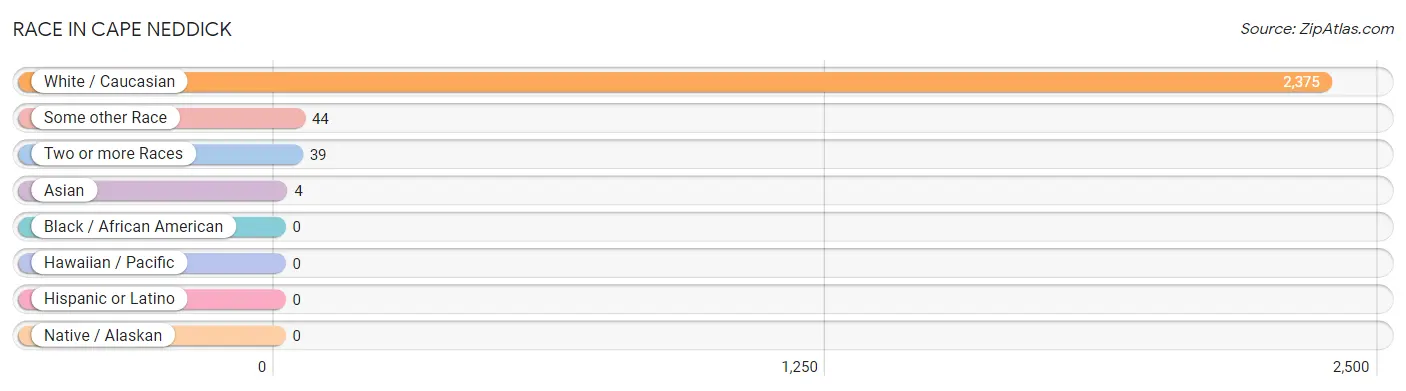
Race in Cape Neddick
The most populous races in Cape Neddick are White / Caucasian (2,375 | 96.5%), Some other Race (44 | 1.8%), and Two or more Races (39 | 1.6%).
| Race | # Population | % Population |
| Asian | 4 | 0.2% |
| Black / African American | 0 | 0.0% |
| Hawaiian / Pacific | 0 | 0.0% |
| Hispanic or Latino | 0 | 0.0% |
| Native / Alaskan | 0 | 0.0% |
| White / Caucasian | 2,375 | 96.5% |
| Two or more Races | 39 | 1.6% |
| Some other Race | 44 | 1.8% |
| Total | 2,462 | 100.0% |
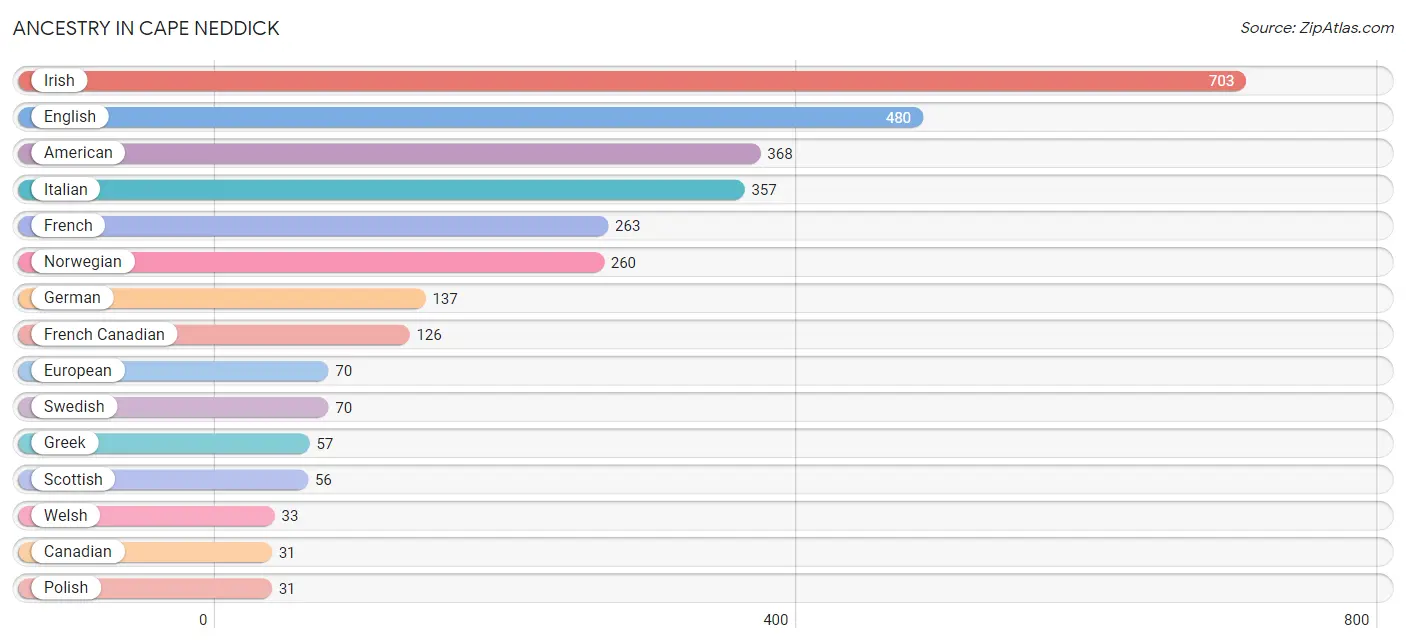
Ancestry in Cape Neddick
The most populous ancestries reported in Cape Neddick are Irish (703 | 28.5%), English (480 | 19.5%), American (368 | 14.9%), Italian (357 | 14.5%), and French (263 | 10.7%), together accounting for 88.2% of all Cape Neddick residents.
| Ancestry | # Population | % Population |
| American | 368 | 14.9% |
| Austrian | 23 | 0.9% |
| Canadian | 31 | 1.3% |
| English | 480 | 19.5% |
| European | 70 | 2.8% |
| French | 263 | 10.7% |
| French Canadian | 126 | 5.1% |
| German | 137 | 5.6% |
| Greek | 57 | 2.3% |
| Irish | 703 | 28.5% |
| Italian | 357 | 14.5% |
| Korean | 4 | 0.2% |
| Norwegian | 260 | 10.6% |
| Polish | 31 | 1.3% |
| Portuguese | 21 | 0.9% |
| Scottish | 56 | 2.3% |
| Swedish | 70 | 2.8% |
| Swiss | 18 | 0.7% |
| Ukrainian | 10 | 0.4% |
| Welsh | 33 | 1.3% | View All 20 Rows |
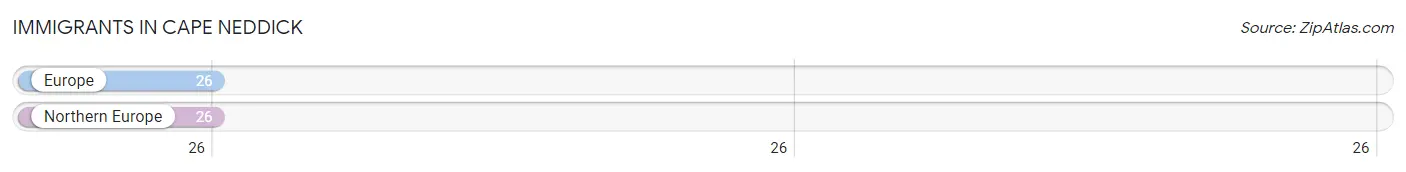
Immigrants in Cape Neddick
The most numerous immigrant groups reported in Cape Neddick came from Europe (26 | 1.1%), and Northern Europe (26 | 1.1%), together accounting for 2.1% of all Cape Neddick residents.
| Immigration Origin | # Population | % Population |
| Europe | 26 | 1.1% |
| Northern Europe | 26 | 1.1% | View All 2 Rows |
Sex and Age in Cape Neddick
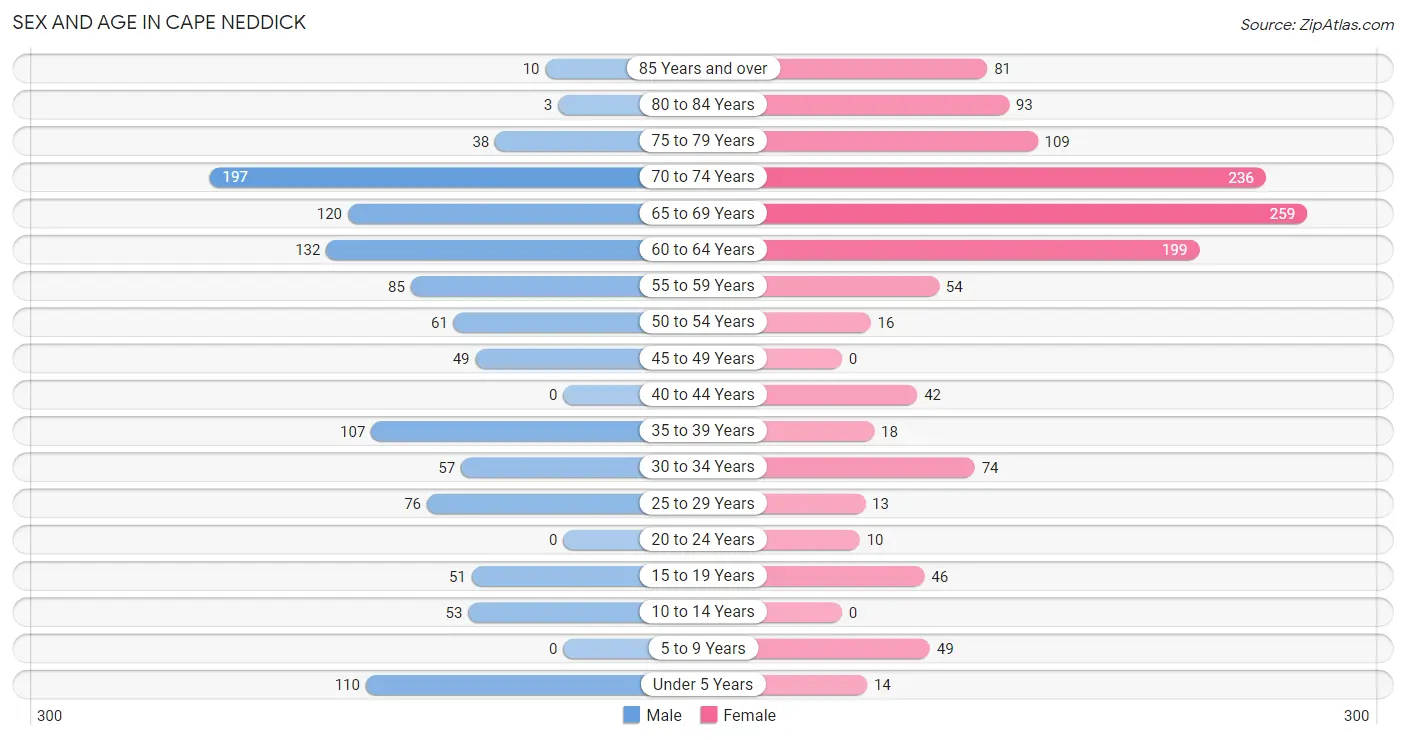
Sex and Age in Cape Neddick
The most populous age groups in Cape Neddick are 70 to 74 Years (197 | 17.2%) for men and 65 to 69 Years (259 | 19.7%) for women.
| Age Bracket | Male | Female |
| Under 5 Years | 110 (9.6%) | 14 (1.1%) |
| 5 to 9 Years | 0 (0.0%) | 49 (3.7%) |
| 10 to 14 Years | 53 (4.6%) | 0 (0.0%) |
| 15 to 19 Years | 51 (4.4%) | 46 (3.5%) |
| 20 to 24 Years | 0 (0.0%) | 10 (0.8%) |
| 25 to 29 Years | 76 (6.6%) | 13 (1.0%) |
| 30 to 34 Years | 57 (5.0%) | 74 (5.6%) |
| 35 to 39 Years | 107 (9.3%) | 18 (1.4%) |
| 40 to 44 Years | 0 (0.0%) | 42 (3.2%) |
| 45 to 49 Years | 49 (4.3%) | 0 (0.0%) |
| 50 to 54 Years | 61 (5.3%) | 16 (1.2%) |
| 55 to 59 Years | 85 (7.4%) | 54 (4.1%) |
| 60 to 64 Years | 132 (11.5%) | 199 (15.2%) |
| 65 to 69 Years | 120 (10.4%) | 259 (19.7%) |
| 70 to 74 Years | 197 (17.2%) | 236 (18.0%) |
| 75 to 79 Years | 38 (3.3%) | 109 (8.3%) |
| 80 to 84 Years | 3 (0.3%) | 93 (7.1%) |
| 85 Years and over | 10 (0.9%) | 81 (6.2%) |
| Total | 1,149 (100.0%) | 1,313 (100.0%) |
Families and Households in Cape Neddick
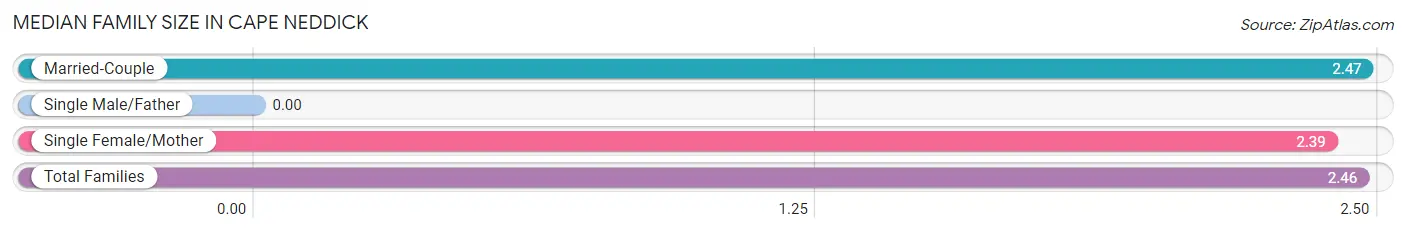
Median Family Size in Cape Neddick
| Family Type | # Families | Family Size |
| Married-Couple | 641 (85.6%) | 2.47 |
| Single Male/Father | 0 (0.0%) | - |
| Single Female/Mother | 108 (14.4%) | 2.39 |
| Total Families | 749 (100.0%) | 2.46 |
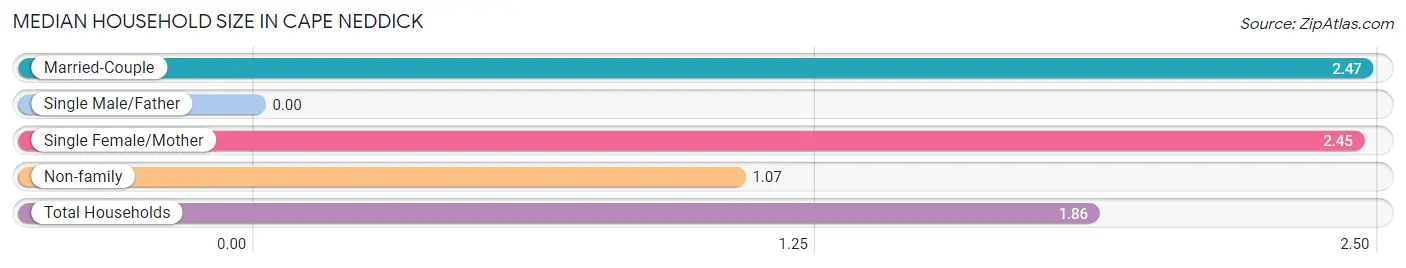
Median Household Size in Cape Neddick
| Household Type | # Households | Household Size |
| Married-Couple | 641 (48.5%) | 2.47 |
| Single Male/Father | 0 (0.0%) | - |
| Single Female/Mother | 108 (8.2%) | 2.45 |
| Non-family | 572 (43.3%) | 1.07 |
| Total Households | 1,321 (100.0%) | 1.86 |
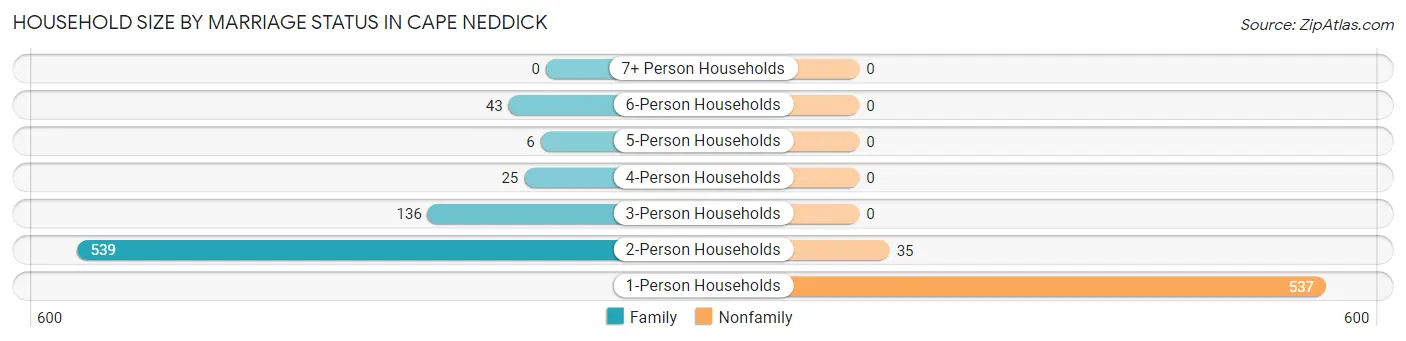
Household Size by Marriage Status in Cape Neddick
Out of a total of 1,321 households in Cape Neddick, 749 (56.7%) are family households, while 572 (43.3%) are nonfamily households. The most numerous type of family households are 2-person households, comprising 539, and the most common type of nonfamily households are 1-person households, comprising 537.
| Household Size | Family Households | Nonfamily Households |
| 1-Person Households | - | 537 (40.6%) |
| 2-Person Households | 539 (40.8%) | 35 (2.6%) |
| 3-Person Households | 136 (10.3%) | 0 (0.0%) |
| 4-Person Households | 25 (1.9%) | 0 (0.0%) |
| 5-Person Households | 6 (0.4%) | 0 (0.0%) |
| 6-Person Households | 43 (3.3%) | 0 (0.0%) |
| 7+ Person Households | 0 (0.0%) | 0 (0.0%) |
| Total | 749 (56.7%) | 572 (43.3%) |
Female Fertility in Cape Neddick
Fertility by Age in Cape Neddick
Average fertility rate in Cape Neddick is 325.0 births per 1,000 women. Women in the age bracket of 20 to 34 years have the highest fertility rate with 680.0 births per 1,000 women. Women in the age bracket of 20 to 34 years acount for 100.0% of all women with births.
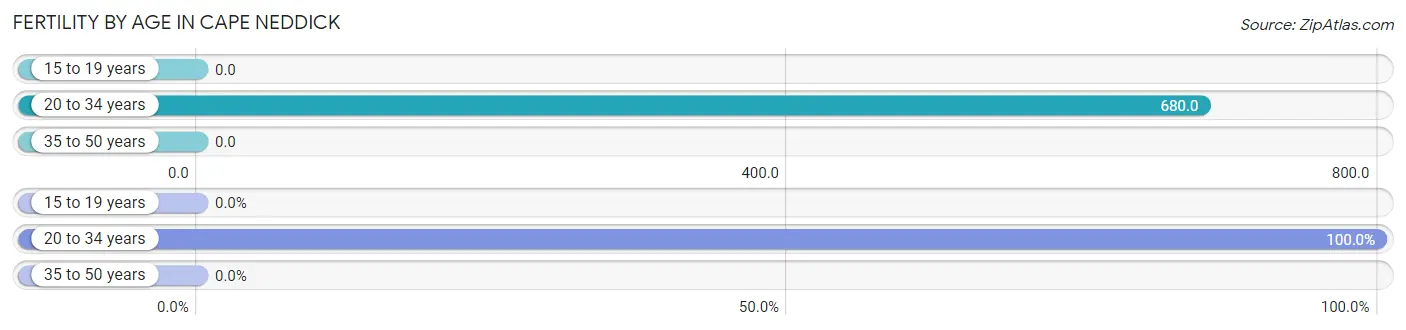
| Age Bracket | Women with Births | Births / 1,000 Women |
| 15 to 19 years | 0 (0.0%) | 0.0 |
| 20 to 34 years | 66 (100.0%) | 680.0 |
| 35 to 50 years | 0 (0.0%) | 0.0 |
| Total | 66 (100.0%) | 325.0 |
Fertility by Age by Marriage Status in Cape Neddick
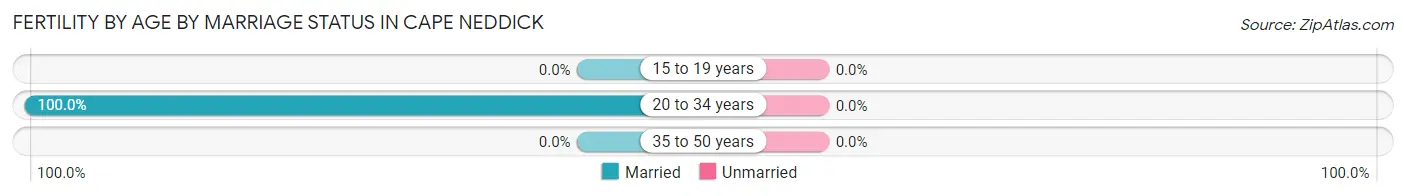
| Age Bracket | Married | Unmarried |
| 15 to 19 years | 0 (0.0%) | 0 (0.0%) |
| 20 to 34 years | 66 (100.0%) | 0 (0.0%) |
| 35 to 50 years | 0 (0.0%) | 0 (0.0%) |
| Total | 66 (100.0%) | 0 (0.0%) |
Fertility by Education in Cape Neddick
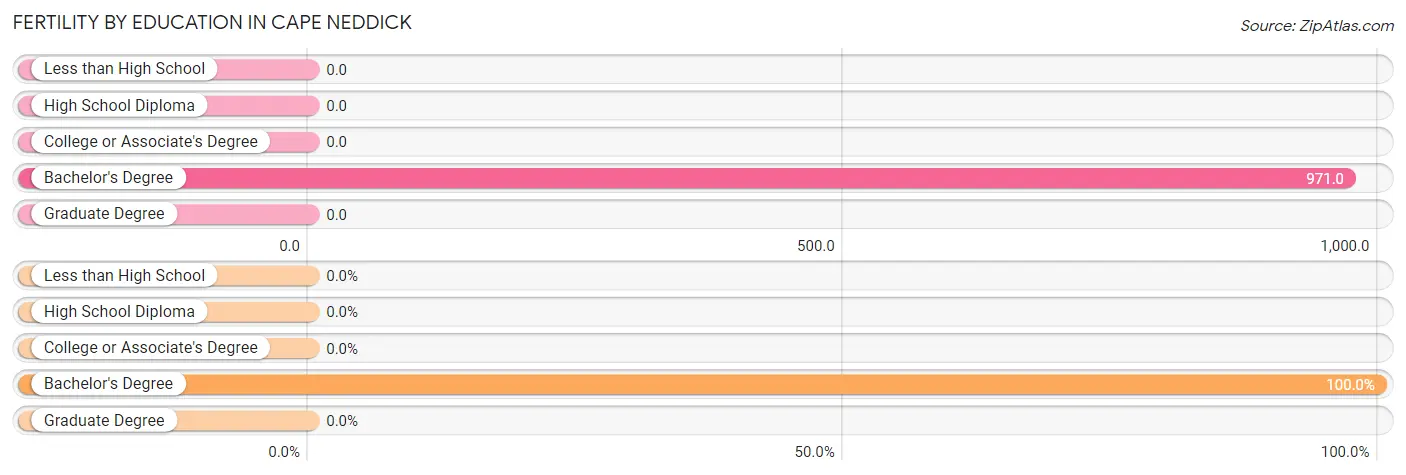
| Educational Attainment | Women with Births | Births / 1,000 Women |
| Less than High School | 0 (0.0%) | 0.0 |
| High School Diploma | 0 (0.0%) | 0.0 |
| College or Associate's Degree | 0 (0.0%) | 0.0 |
| Bachelor's Degree | 66 (100.0%) | 971.0 |
| Graduate Degree | 0 (0.0%) | 0.0 |
| Total | 66 (100.0%) | 325.0 |
Fertility by Education by Marriage Status in Cape Neddick
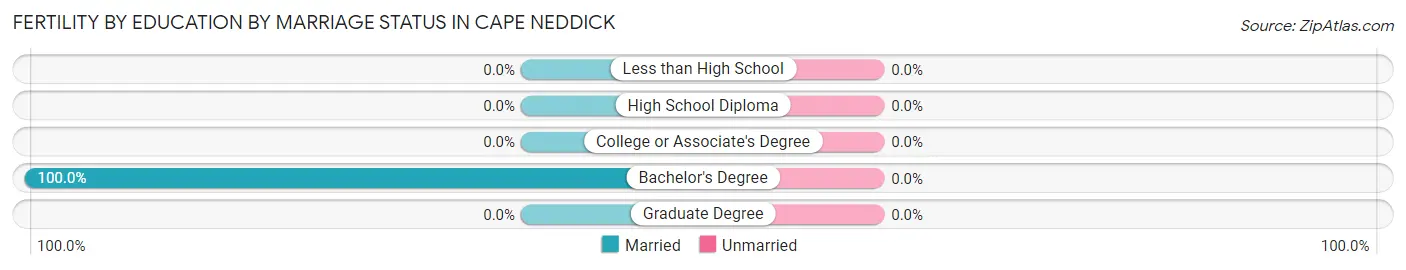
| Educational Attainment | Married | Unmarried |
| Less than High School | 0 (0.0%) | 0 (0.0%) |
| High School Diploma | 0 (0.0%) | 0 (0.0%) |
| College or Associate's Degree | 0 (0.0%) | 0 (0.0%) |
| Bachelor's Degree | 66 (100.0%) | 0 (0.0%) |
| Graduate Degree | 0 (0.0%) | 0 (0.0%) |
| Total | 66 (100.0%) | 0 (0.0%) |
Income in Cape Neddick
Income Overview in Cape Neddick
Per Capita Income in Cape Neddick is $48,860, while median incomes of families and households are $123,709 and $76,701 respectively.
| Characteristic | Number | Measure |
| Per Capita Income | 2,462 | $48,860 |
| Median Family Income | 749 | $123,709 |
| Mean Family Income | 749 | $130,420 |
| Median Household Income | 1,321 | $76,701 |
| Mean Household Income | 1,321 | $91,675 |
| Income Deficit | 749 | $0 |
| Wage / Income Gap (%) | 2,462 | 41.34% |
| Wage / Income Gap ($) | 2,462 | 58.66¢ per $1 |
| Gini / Inequality Index | 2,462 | 0.41 |
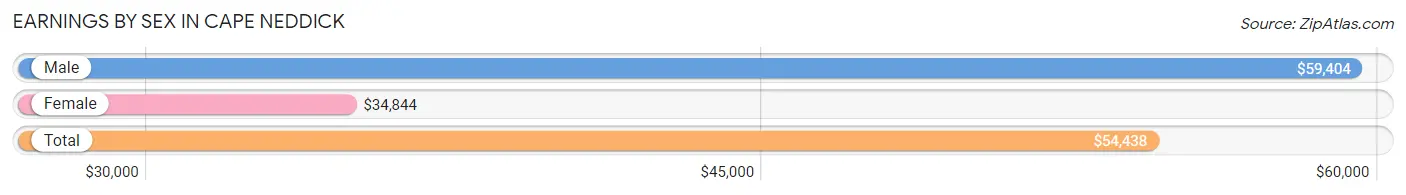
Earnings by Sex in Cape Neddick
Average Earnings in Cape Neddick are $54,438, $59,404 for men and $34,844 for women, a difference of 41.3%.
| Sex | Number | Average Earnings |
| Male | 624 (58.2%) | $59,404 |
| Female | 448 (41.8%) | $34,844 |
| Total | 1,072 (100.0%) | $54,438 |
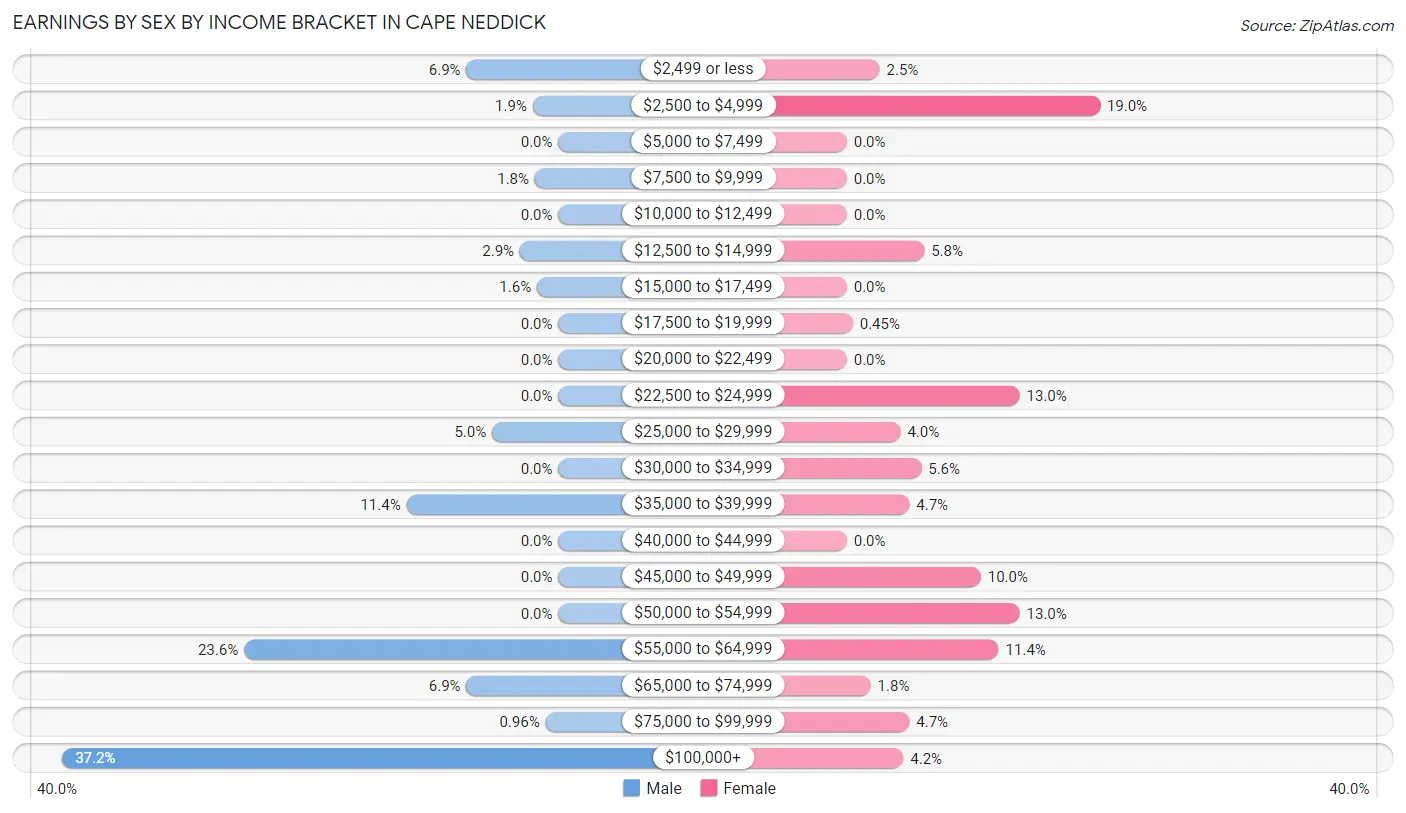
Earnings by Sex by Income Bracket in Cape Neddick
The most common earnings brackets in Cape Neddick are $100,000+ for men (232 | 37.2%) and $2,500 to $4,999 for women (85 | 19.0%).
| Income | Male | Female |
| $2,499 or less | 43 (6.9%) | 11 (2.5%) |
| $2,500 to $4,999 | 12 (1.9%) | 85 (19.0%) |
| $5,000 to $7,499 | 0 (0.0%) | 0 (0.0%) |
| $7,500 to $9,999 | 11 (1.8%) | 0 (0.0%) |
| $10,000 to $12,499 | 0 (0.0%) | 0 (0.0%) |
| $12,500 to $14,999 | 18 (2.9%) | 26 (5.8%) |
| $15,000 to $17,499 | 10 (1.6%) | 0 (0.0%) |
| $17,500 to $19,999 | 0 (0.0%) | 2 (0.4%) |
| $20,000 to $22,499 | 0 (0.0%) | 0 (0.0%) |
| $22,500 to $24,999 | 0 (0.0%) | 58 (13.0%) |
| $25,000 to $29,999 | 31 (5.0%) | 18 (4.0%) |
| $30,000 to $34,999 | 0 (0.0%) | 25 (5.6%) |
| $35,000 to $39,999 | 71 (11.4%) | 21 (4.7%) |
| $40,000 to $44,999 | 0 (0.0%) | 0 (0.0%) |
| $45,000 to $49,999 | 0 (0.0%) | 45 (10.0%) |
| $50,000 to $54,999 | 0 (0.0%) | 58 (13.0%) |
| $55,000 to $64,999 | 147 (23.6%) | 51 (11.4%) |
| $65,000 to $74,999 | 43 (6.9%) | 8 (1.8%) |
| $75,000 to $99,999 | 6 (1.0%) | 21 (4.7%) |
| $100,000+ | 232 (37.2%) | 19 (4.2%) |
| Total | 624 (100.0%) | 448 (100.0%) |
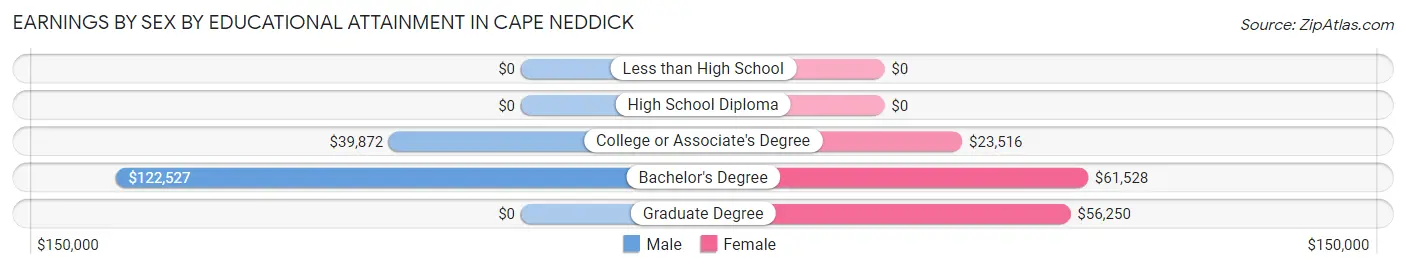
Earnings by Sex by Educational Attainment in Cape Neddick
Average earnings in Cape Neddick are $59,404 for men and $45,556 for women, a difference of 23.3%. Men with an educational attainment of bachelor's degree enjoy the highest average annual earnings of $122,527, while those with college or associate's degree education earn the least with $39,872. Women with an educational attainment of bachelor's degree earn the most with the average annual earnings of $61,528, while those with college or associate's degree education have the smallest earnings of $23,516.
| Educational Attainment | Male Income | Female Income |
| Less than High School | - | - |
| High School Diploma | - | - |
| College or Associate's Degree | $39,872 | $23,516 |
| Bachelor's Degree | $122,527 | $61,528 |
| Graduate Degree | - | - |
| Total | $59,404 | $45,556 |
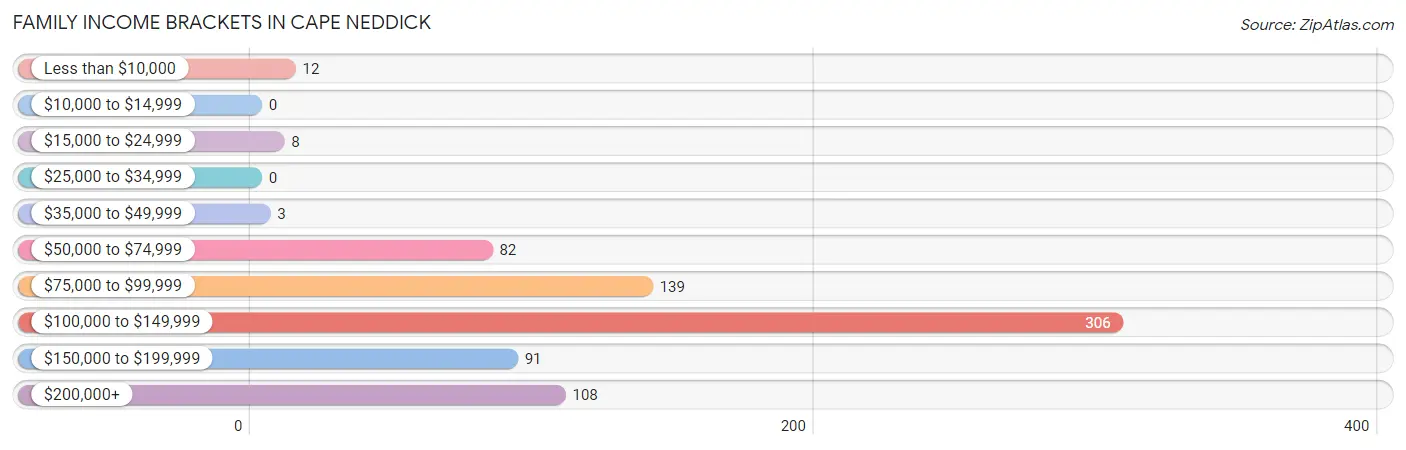
Family Income in Cape Neddick
Family Income Brackets in Cape Neddick
According to the Cape Neddick family income data, there are 306 families falling into the $100,000 to $149,999 income range, which is the most common income bracket and makes up 40.8% of all families.
| Income Bracket | # Families | % Families |
| Less than $10,000 | 12 | 1.6% |
| $10,000 to $14,999 | 0 | 0.0% |
| $15,000 to $24,999 | 8 | 1.1% |
| $25,000 to $34,999 | 0 | 0.0% |
| $35,000 to $49,999 | 3 | 0.4% |
| $50,000 to $74,999 | 82 | 10.9% |
| $75,000 to $99,999 | 139 | 18.6% |
| $100,000 to $149,999 | 306 | 40.9% |
| $150,000 to $199,999 | 91 | 12.1% |
| $200,000+ | 108 | 14.4% |
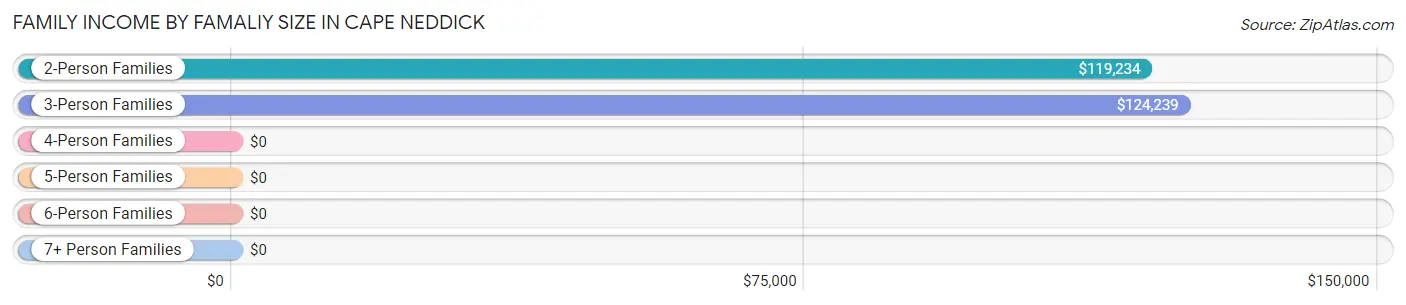
Family Income by Famaliy Size in Cape Neddick
3-person families (144 | 19.2%) account for the highest median family income in Cape Neddick with $124,239 per family, while 2-person families (539 | 72.0%) have the highest median income of $59,617 per family member.
| Income Bracket | # Families | Median Income |
| 2-Person Families | 539 (72.0%) | $119,234 |
| 3-Person Families | 144 (19.2%) | $124,239 |
| 4-Person Families | 17 (2.3%) | $0 |
| 5-Person Families | 6 (0.8%) | $0 |
| 6-Person Families | 43 (5.7%) | $0 |
| 7+ Person Families | 0 (0.0%) | $0 |
| Total | 749 (100.0%) | $123,709 |
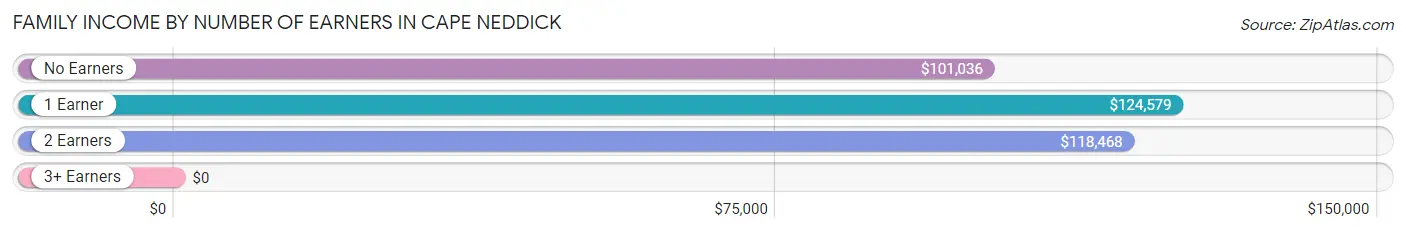
Family Income by Number of Earners in Cape Neddick
| Number of Earners | # Families | Median Income |
| No Earners | 225 (30.0%) | $101,036 |
| 1 Earner | 293 (39.1%) | $124,579 |
| 2 Earners | 216 (28.8%) | $118,468 |
| 3+ Earners | 15 (2.0%) | $0 |
| Total | 749 (100.0%) | $123,709 |
Household Income in Cape Neddick
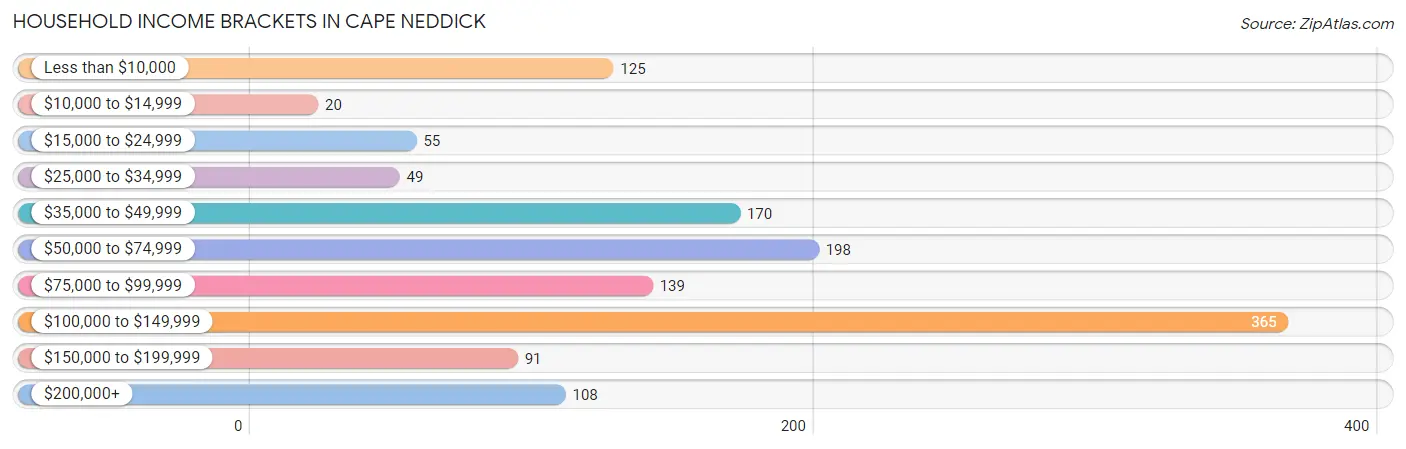
Household Income Brackets in Cape Neddick
With 365 households falling in the category, the $100,000 to $149,999 income range is the most frequent in Cape Neddick, accounting for 27.6% of all households. In contrast, only 20 households (1.5%) fall into the $10,000 to $14,999 income bracket, making it the least populous group.
| Income Bracket | # Households | % Households |
| Less than $10,000 | 125 | 9.5% |
| $10,000 to $14,999 | 20 | 1.5% |
| $15,000 to $24,999 | 55 | 4.2% |
| $25,000 to $34,999 | 49 | 3.7% |
| $35,000 to $49,999 | 170 | 12.9% |
| $50,000 to $74,999 | 198 | 15.0% |
| $75,000 to $99,999 | 139 | 10.5% |
| $100,000 to $149,999 | 365 | 27.6% |
| $150,000 to $199,999 | 91 | 6.9% |
| $200,000+ | 108 | 8.2% |
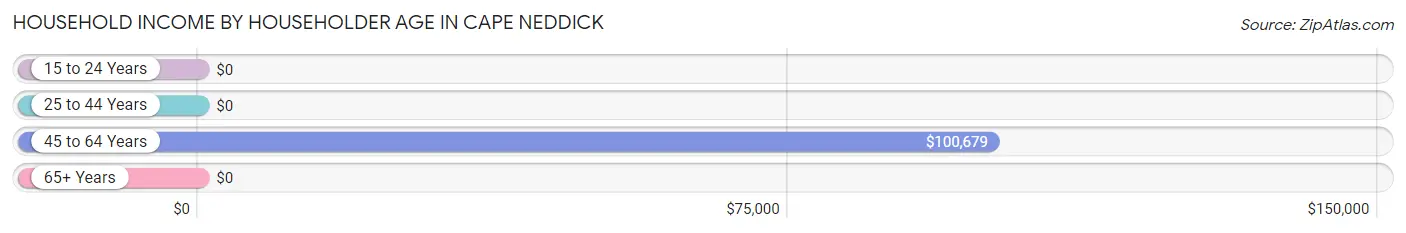
Household Income by Householder Age in Cape Neddick
The median household income in Cape Neddick is $76,701, with the highest median household income of $100,679 found in the 45 to 64 years age bracket for the primary householder. A total of 285 households (21.6%) fall into this category.
| Income Bracket | # Households | Median Income |
| 15 to 24 Years | 0 (0.0%) | $0 |
| 25 to 44 Years | 189 (14.3%) | $0 |
| 45 to 64 Years | 285 (21.6%) | $100,679 |
| 65+ Years | 847 (64.1%) | $0 |
| Total | 1,321 (100.0%) | $76,701 |
Poverty in Cape Neddick
Income Below Poverty by Sex and Age in Cape Neddick
With 5.5% poverty level for males and 9.1% for females among the residents of Cape Neddick, 12 to 14 year old males and 6 to 11 year old females are the most vulnerable to poverty, with 8 males (100.0%) and 8 females (16.3%) in their respective age groups living below the poverty level.
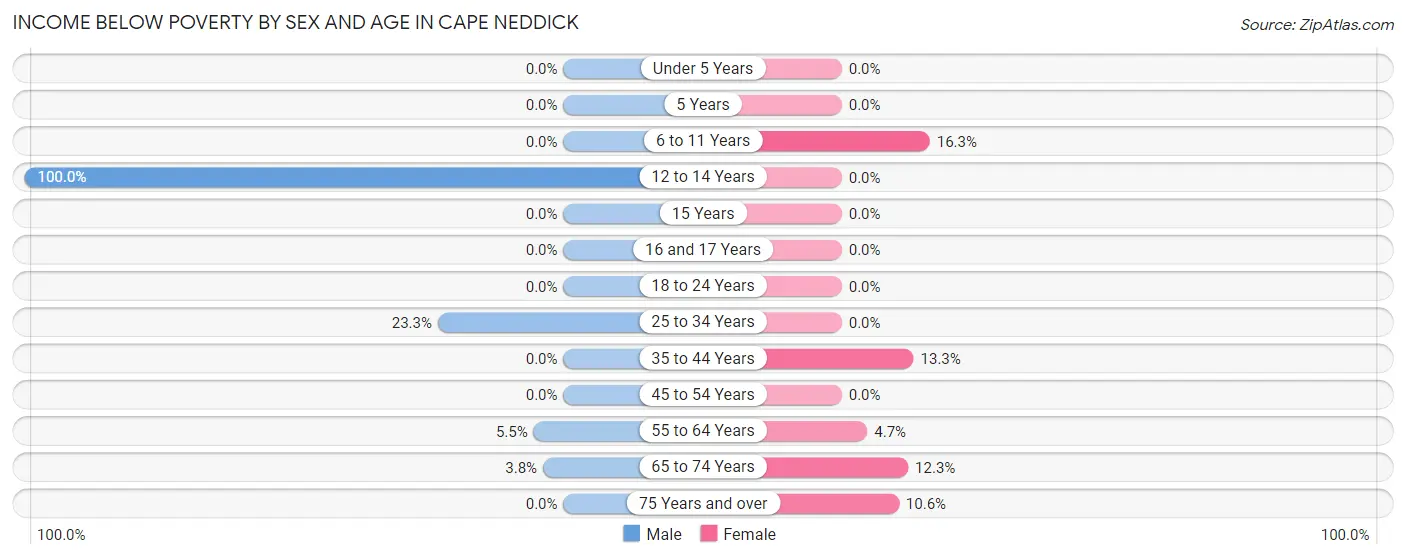
| Age Bracket | Male | Female |
| Under 5 Years | 0 (0.0%) | 0 (0.0%) |
| 5 Years | 0 (0.0%) | 0 (0.0%) |
| 6 to 11 Years | 0 (0.0%) | 8 (16.3%) |
| 12 to 14 Years | 8 (100.0%) | 0 (0.0%) |
| 15 Years | 0 (0.0%) | 0 (0.0%) |
| 16 and 17 Years | 0 (0.0%) | 0 (0.0%) |
| 18 to 24 Years | 0 (0.0%) | 0 (0.0%) |
| 25 to 34 Years | 31 (23.3%) | 0 (0.0%) |
| 35 to 44 Years | 0 (0.0%) | 8 (13.3%) |
| 45 to 54 Years | 0 (0.0%) | 0 (0.0%) |
| 55 to 64 Years | 12 (5.5%) | 12 (4.7%) |
| 65 to 74 Years | 12 (3.8%) | 61 (12.3%) |
| 75 Years and over | 0 (0.0%) | 30 (10.6%) |
| Total | 63 (5.5%) | 119 (9.1%) |
Income Above Poverty by Sex and Age in Cape Neddick
According to the poverty statistics in Cape Neddick, males aged under 5 years and females aged under 5 years are the age groups that are most secure financially, with 100.0% of males and 100.0% of females in these age groups living above the poverty line.
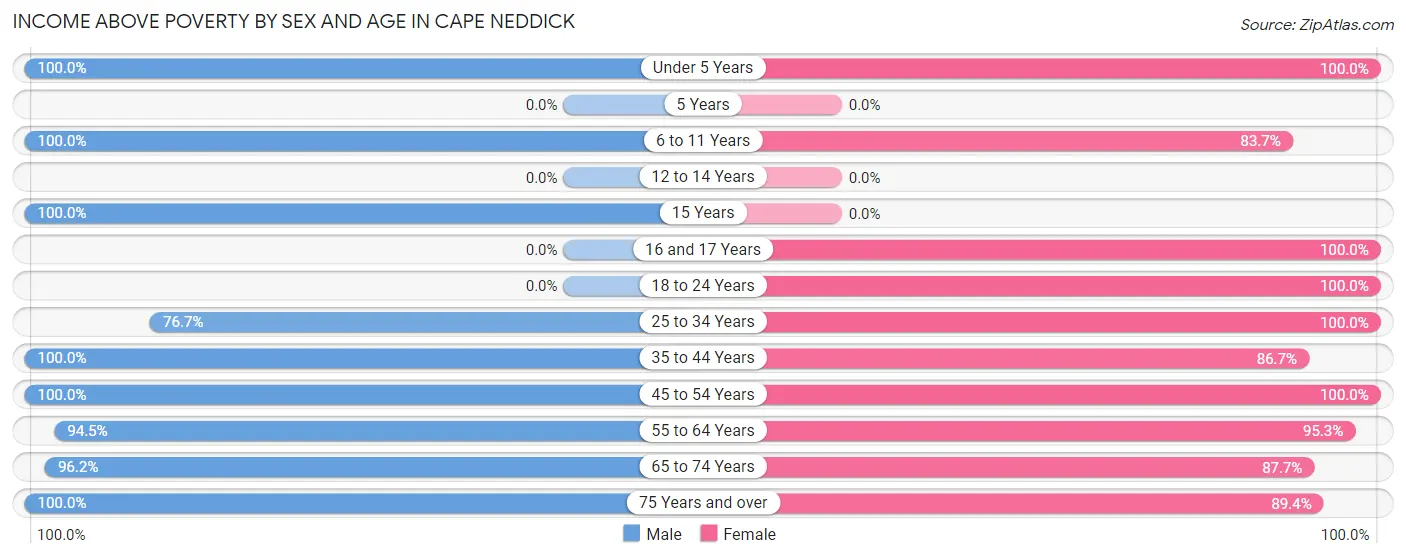
| Age Bracket | Male | Female |
| Under 5 Years | 110 (100.0%) | 14 (100.0%) |
| 5 Years | 0 (0.0%) | 0 (0.0%) |
| 6 to 11 Years | 45 (100.0%) | 41 (83.7%) |
| 12 to 14 Years | 0 (0.0%) | 0 (0.0%) |
| 15 Years | 51 (100.0%) | 0 (0.0%) |
| 16 and 17 Years | 0 (0.0%) | 46 (100.0%) |
| 18 to 24 Years | 0 (0.0%) | 10 (100.0%) |
| 25 to 34 Years | 102 (76.7%) | 87 (100.0%) |
| 35 to 44 Years | 107 (100.0%) | 52 (86.7%) |
| 45 to 54 Years | 110 (100.0%) | 16 (100.0%) |
| 55 to 64 Years | 205 (94.5%) | 241 (95.3%) |
| 65 to 74 Years | 305 (96.2%) | 434 (87.7%) |
| 75 Years and over | 51 (100.0%) | 253 (89.4%) |
| Total | 1,086 (94.5%) | 1,194 (90.9%) |
Income Below Poverty Among Married-Couple Families in Cape Neddick
The poverty statistics for married-couple families in Cape Neddick show that 1.9% or 12 of the total 641 families live below the poverty line. Families with no children have the highest poverty rate of 2.5%, comprising of 12 families. On the other hand, families with 1 or 2 children have the lowest poverty rate of 0.0%, which includes 0 families.
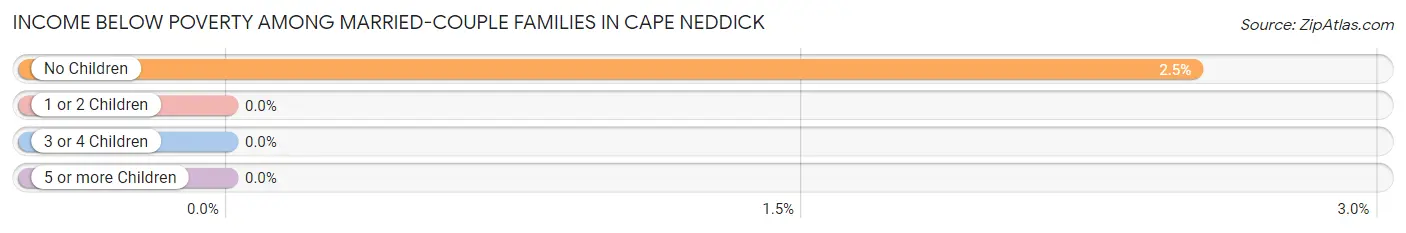
| Children | Above Poverty | Below Poverty |
| No Children | 464 (97.5%) | 12 (2.5%) |
| 1 or 2 Children | 122 (100.0%) | 0 (0.0%) |
| 3 or 4 Children | 43 (100.0%) | 0 (0.0%) |
| 5 or more Children | 0 (0.0%) | 0 (0.0%) |
| Total | 629 (98.1%) | 12 (1.9%) |
Income Below Poverty Among Single-Parent Households in Cape Neddick
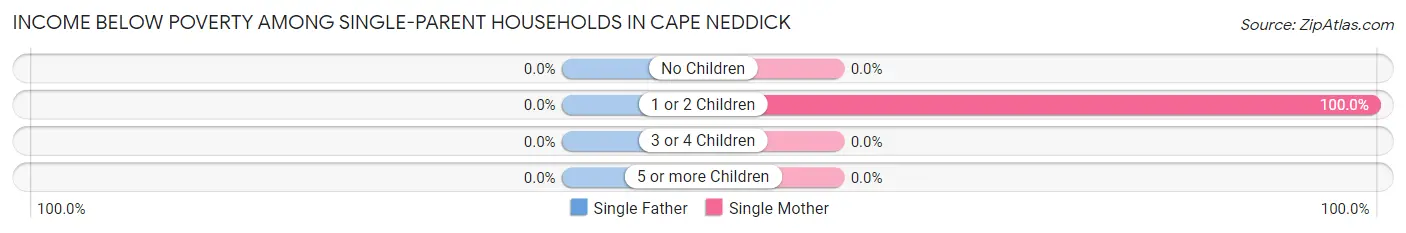
| Children | Single Father | Single Mother |
| No Children | 0 (0.0%) | 0 (0.0%) |
| 1 or 2 Children | 0 (0.0%) | 8 (100.0%) |
| 3 or 4 Children | 0 (0.0%) | 0 (0.0%) |
| 5 or more Children | 0 (0.0%) | 0 (0.0%) |
| Total | 0 (0.0%) | 8 (7.4%) |
Income Below Poverty Among Married-Couple vs Single-Parent Households in Cape Neddick
The poverty data for Cape Neddick shows that 12 of the married-couple family households (1.9%) and 8 of the single-parent households (7.4%) are living below the poverty level. Within the married-couple family households, those with no children have the highest poverty rate, with 12 households (2.5%) falling below the poverty line. Among the single-parent households, those with 1 or 2 children have the highest poverty rate, with 8 household (100.0%) living below poverty.
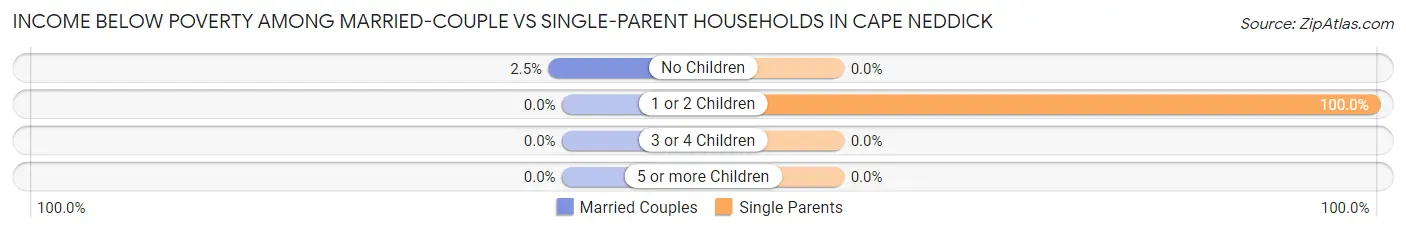
| Children | Married-Couple Families | Single-Parent Households |
| No Children | 12 (2.5%) | 0 (0.0%) |
| 1 or 2 Children | 0 (0.0%) | 8 (100.0%) |
| 3 or 4 Children | 0 (0.0%) | 0 (0.0%) |
| 5 or more Children | 0 (0.0%) | 0 (0.0%) |
| Total | 12 (1.9%) | 8 (7.4%) |
Employment Characteristics in Cape Neddick
Employment by Class of Employer in Cape Neddick
Among the 888 employed individuals in Cape Neddick, private company employees (595 | 67.0%), state government employees (81 | 9.1%), and not-for-profit organizations (70 | 7.9%) make up the most common classes of employment.
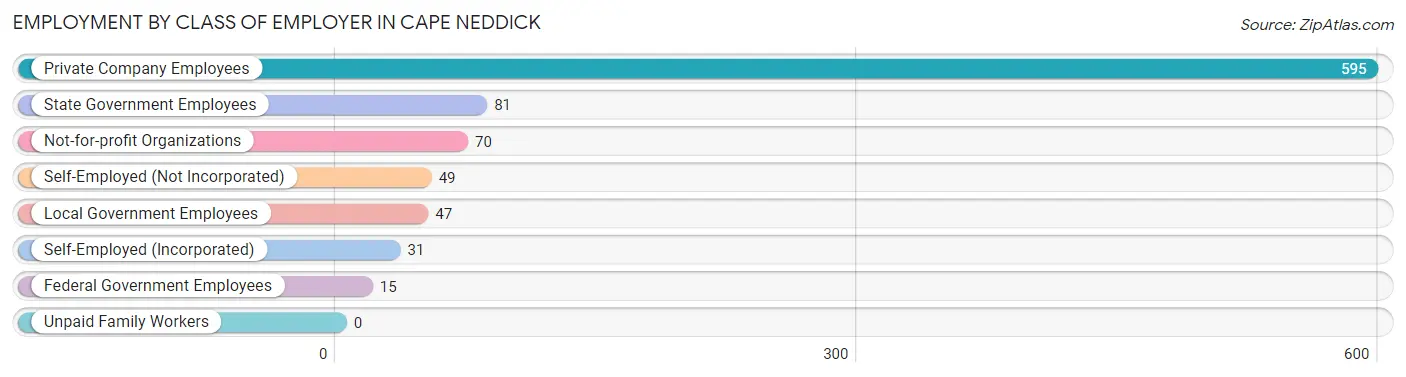
| Employer Class | # Employees | % Employees |
| Private Company Employees | 595 | 67.0% |
| Self-Employed (Incorporated) | 31 | 3.5% |
| Self-Employed (Not Incorporated) | 49 | 5.5% |
| Not-for-profit Organizations | 70 | 7.9% |
| Local Government Employees | 47 | 5.3% |
| State Government Employees | 81 | 9.1% |
| Federal Government Employees | 15 | 1.7% |
| Unpaid Family Workers | 0 | 0.0% |
| Total | 888 | 100.0% |
Employment Status by Age in Cape Neddick
According to the labor force statistics for Cape Neddick, out of the total population over 16 years of age (2,185), 43.2% or 944 individuals are in the labor force, with 6.0% or 57 of them unemployed. The age group with the highest labor force participation rate is 16 to 19 years, with 100.0% or 46 individuals in the labor force. Within the labor force, the 16 to 19 years age range has the highest percentage of unemployed individuals, with 100.0% or 46 of them being unemployed.
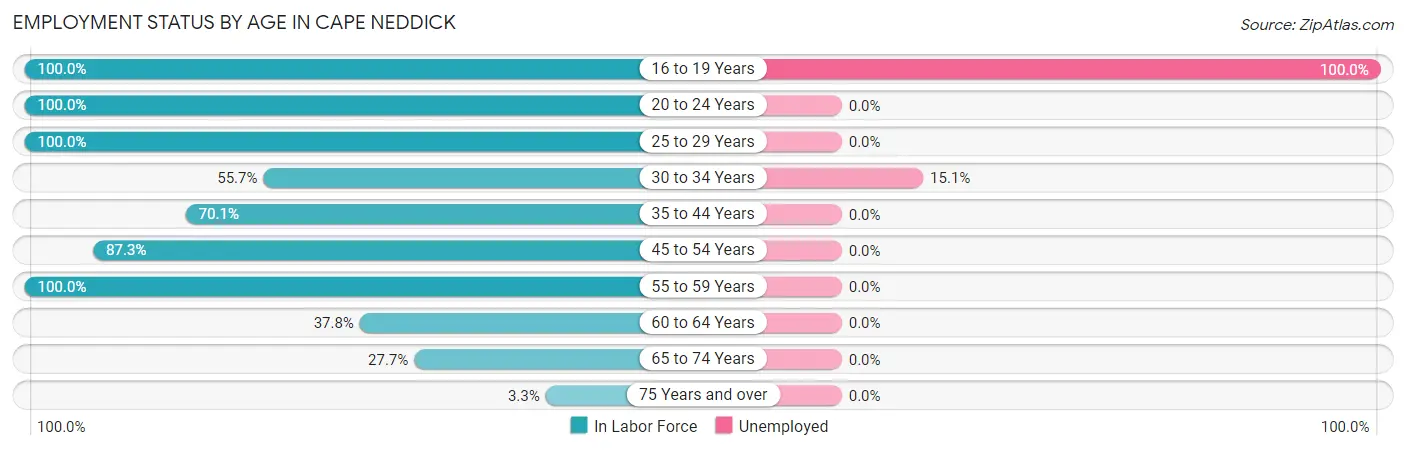
| Age Bracket | In Labor Force | Unemployed |
| 16 to 19 Years | 46 (100.0%) | 46 (100.0%) |
| 20 to 24 Years | 10 (100.0%) | 0 (0.0%) |
| 25 to 29 Years | 89 (100.0%) | 0 (0.0%) |
| 30 to 34 Years | 73 (55.7%) | 11 (15.1%) |
| 35 to 44 Years | 117 (70.1%) | 0 (0.0%) |
| 45 to 54 Years | 110 (87.3%) | 0 (0.0%) |
| 55 to 59 Years | 139 (100.0%) | 0 (0.0%) |
| 60 to 64 Years | 125 (37.8%) | 0 (0.0%) |
| 65 to 74 Years | 225 (27.7%) | 0 (0.0%) |
| 75 Years and over | 11 (3.3%) | 0 (0.0%) |
| Total | 944 (43.2%) | 57 (6.0%) |
Employment Status by Educational Attainment in Cape Neddick
According to labor force statistics for Cape Neddick, 66.4% of individuals (653) out of the total population between 25 and 64 years of age (983) are in the labor force, with 1.7% or 11 of them being unemployed. The group with the highest labor force participation rate are those with the educational attainment of college / associate degree, with 84.8% or 178 individuals in the labor force. Within the labor force, individuals with bachelor's degree or higher education have the highest percentage of unemployment, with 2.9% or 11 of them being unemployed.
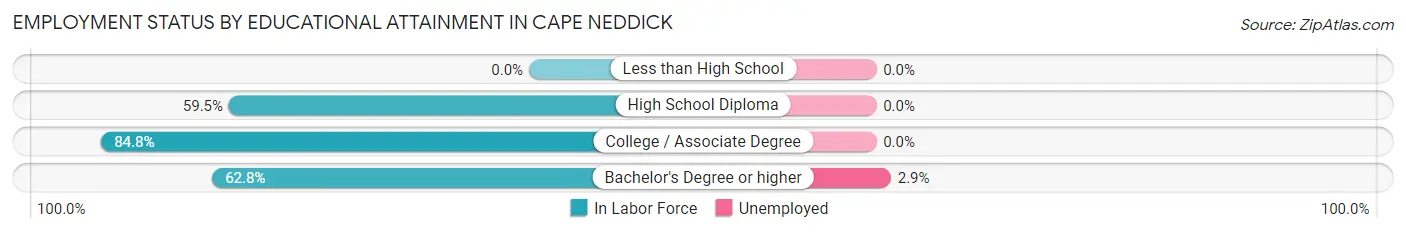
| Educational Attainment | In Labor Force | Unemployed |
| Less than High School | 0 (0.0%) | 0 (0.0%) |
| High School Diploma | 97 (59.5%) | 0 (0.0%) |
| College / Associate Degree | 178 (84.8%) | 0 (0.0%) |
| Bachelor's Degree or higher | 378 (62.8%) | 17 (2.9%) |
| Total | 653 (66.4%) | 17 (1.7%) |
Employment Occupations by Sex in Cape Neddick
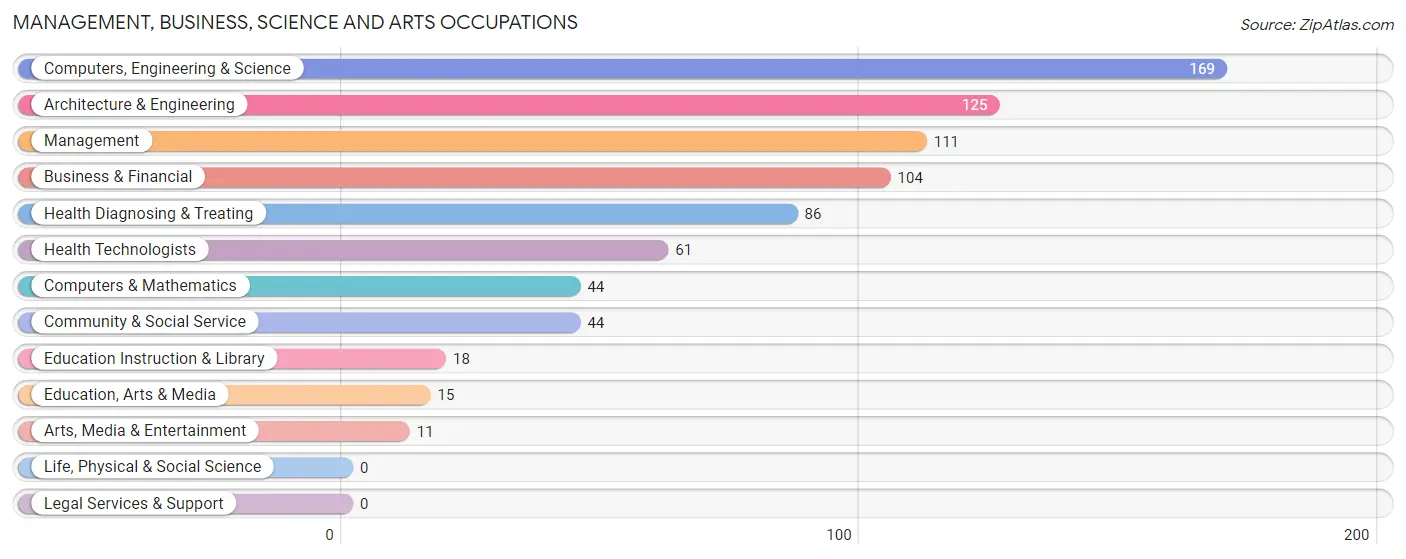
Management, Business, Science and Arts Occupations
The most common Management, Business, Science and Arts occupations in Cape Neddick are Computers, Engineering & Science (169 | 19.0%), Architecture & Engineering (125 | 14.1%), Management (111 | 12.5%), Business & Financial (104 | 11.7%), and Health Diagnosing & Treating (86 | 9.7%).
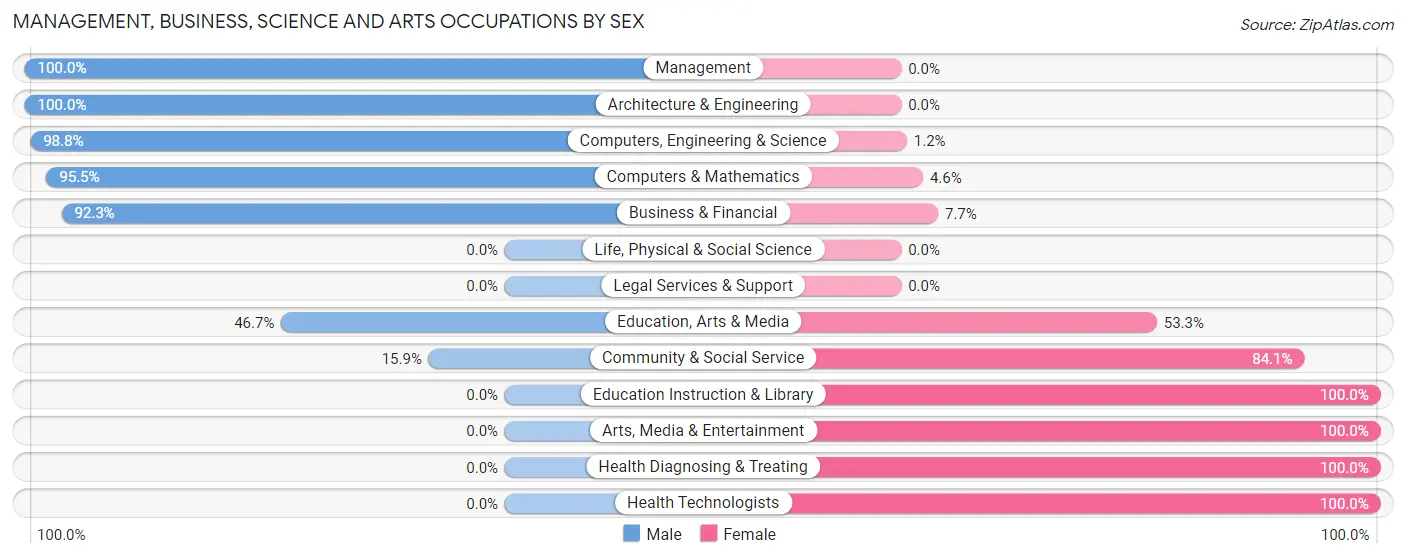
Management, Business, Science and Arts Occupations by Sex
Within the Management, Business, Science and Arts occupations in Cape Neddick, the most male-oriented occupations are Management (100.0%), Architecture & Engineering (100.0%), and Computers, Engineering & Science (98.8%), while the most female-oriented occupations are Education Instruction & Library (100.0%), Arts, Media & Entertainment (100.0%), and Health Diagnosing & Treating (100.0%).
| Occupation | Male | Female |
| Management | 111 (100.0%) | 0 (0.0%) |
| Business & Financial | 96 (92.3%) | 8 (7.7%) |
| Computers, Engineering & Science | 167 (98.8%) | 2 (1.2%) |
| Computers & Mathematics | 42 (95.5%) | 2 (4.5%) |
| Architecture & Engineering | 125 (100.0%) | 0 (0.0%) |
| Life, Physical & Social Science | 0 (0.0%) | 0 (0.0%) |
| Community & Social Service | 7 (15.9%) | 37 (84.1%) |
| Education, Arts & Media | 7 (46.7%) | 8 (53.3%) |
| Legal Services & Support | 0 (0.0%) | 0 (0.0%) |
| Education Instruction & Library | 0 (0.0%) | 18 (100.0%) |
| Arts, Media & Entertainment | 0 (0.0%) | 11 (100.0%) |
| Health Diagnosing & Treating | 0 (0.0%) | 86 (100.0%) |
| Health Technologists | 0 (0.0%) | 61 (100.0%) |
| Total (Category) | 381 (74.1%) | 133 (25.9%) |
| Total (Overall) | 543 (61.2%) | 345 (38.9%) |
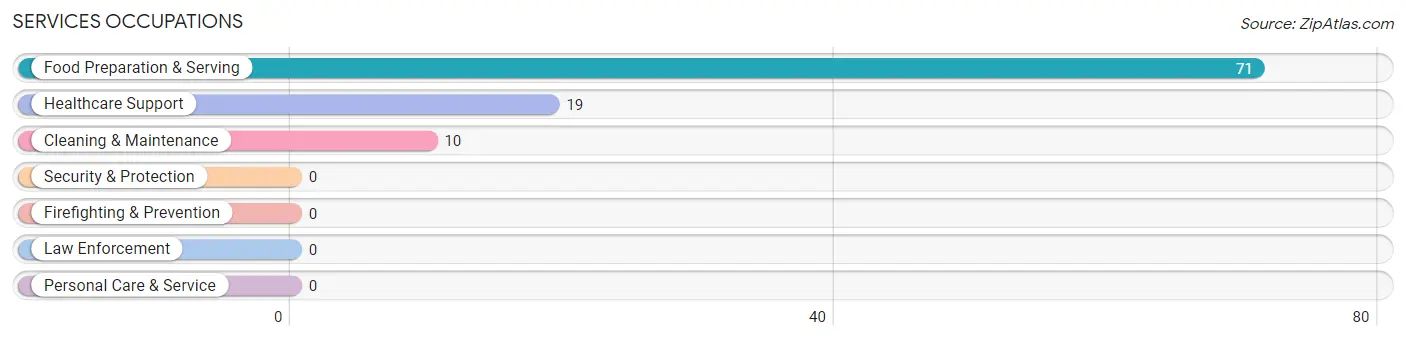
Services Occupations
The most common Services occupations in Cape Neddick are Food Preparation & Serving (71 | 8.0%), Healthcare Support (19 | 2.1%), and Cleaning & Maintenance (10 | 1.1%).
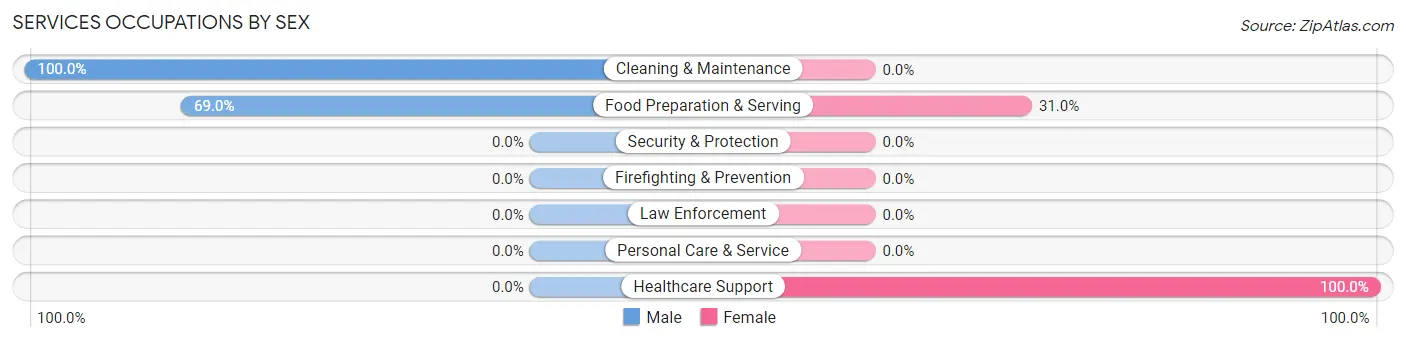
Services Occupations by Sex
Within the Services occupations in Cape Neddick, the most male-oriented occupations are Cleaning & Maintenance (100.0%), and Food Preparation & Serving (69.0%), while the most female-oriented occupations are Healthcare Support (100.0%), and Food Preparation & Serving (31.0%).
| Occupation | Male | Female |
| Healthcare Support | 0 (0.0%) | 19 (100.0%) |
| Security & Protection | 0 (0.0%) | 0 (0.0%) |
| Firefighting & Prevention | 0 (0.0%) | 0 (0.0%) |
| Law Enforcement | 0 (0.0%) | 0 (0.0%) |
| Food Preparation & Serving | 49 (69.0%) | 22 (31.0%) |
| Cleaning & Maintenance | 10 (100.0%) | 0 (0.0%) |
| Personal Care & Service | 0 (0.0%) | 0 (0.0%) |
| Total (Category) | 59 (59.0%) | 41 (41.0%) |
| Total (Overall) | 543 (61.2%) | 345 (38.9%) |
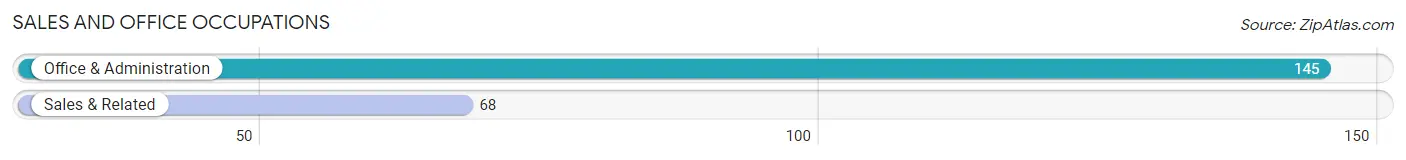
Sales and Office Occupations
The most common Sales and Office occupations in Cape Neddick are Office & Administration (145 | 16.3%), and Sales & Related (68 | 7.7%).
Sales and Office Occupations by Sex
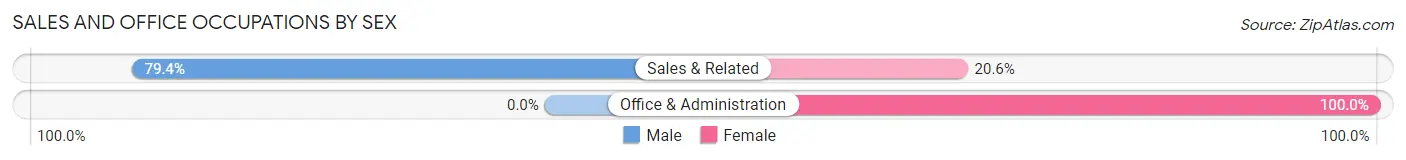
| Occupation | Male | Female |
| Sales & Related | 54 (79.4%) | 14 (20.6%) |
| Office & Administration | 0 (0.0%) | 145 (100.0%) |
| Total (Category) | 54 (25.4%) | 159 (74.7%) |
| Total (Overall) | 543 (61.2%) | 345 (38.9%) |
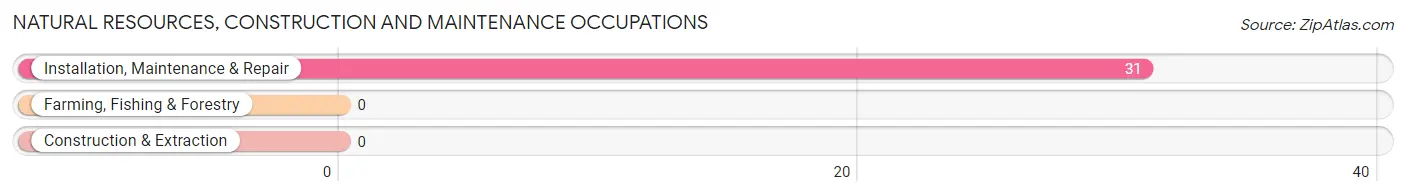
Natural Resources, Construction and Maintenance Occupations
The most common Natural Resources, Construction and Maintenance occupations in Cape Neddick are , and Installation, Maintenance & Repair (31 | 3.5%).
Natural Resources, Construction and Maintenance Occupations by Sex
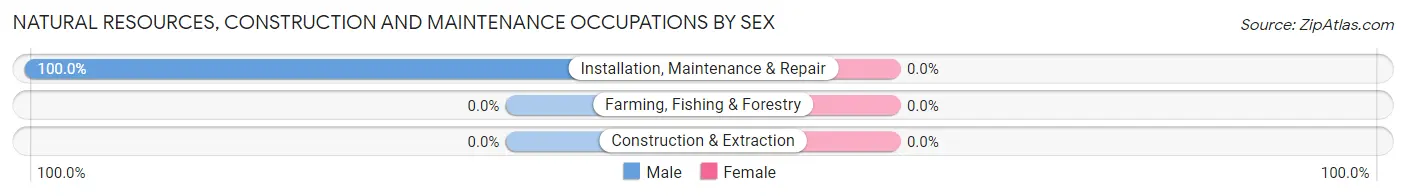
| Occupation | Male | Female |
| Farming, Fishing & Forestry | 0 (0.0%) | 0 (0.0%) |
| Construction & Extraction | 0 (0.0%) | 0 (0.0%) |
| Installation, Maintenance & Repair | 31 (100.0%) | 0 (0.0%) |
| Total (Category) | 31 (100.0%) | 0 (0.0%) |
| Total (Overall) | 543 (61.2%) | 345 (38.9%) |
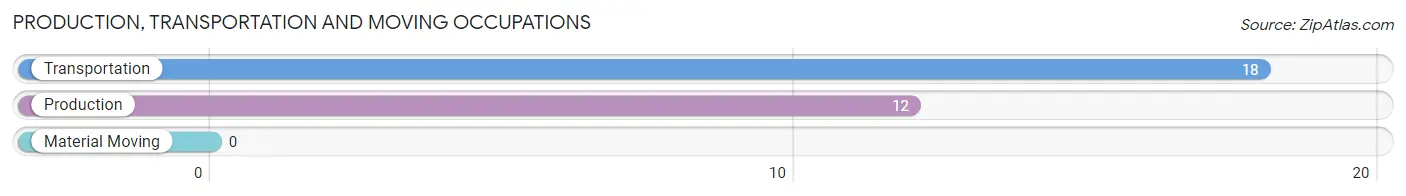
Production, Transportation and Moving Occupations
The most common Production, Transportation and Moving occupations in Cape Neddick are Transportation (18 | 2.0%), and Production (12 | 1.3%).
Production, Transportation and Moving Occupations by Sex
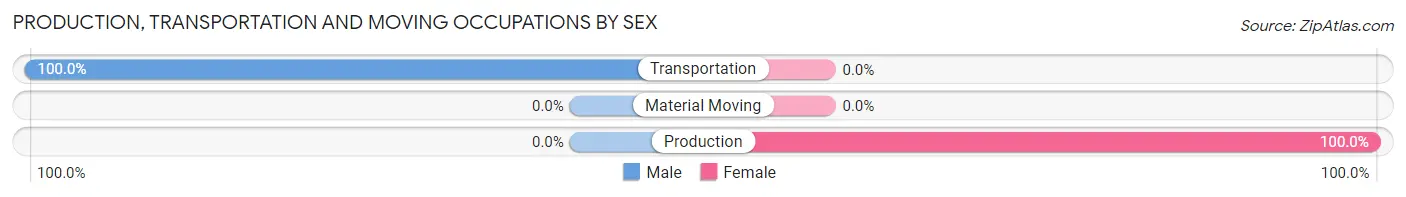
| Occupation | Male | Female |
| Production | 0 (0.0%) | 12 (100.0%) |
| Transportation | 18 (100.0%) | 0 (0.0%) |
| Material Moving | 0 (0.0%) | 0 (0.0%) |
| Total (Category) | 18 (60.0%) | 12 (40.0%) |
| Total (Overall) | 543 (61.2%) | 345 (38.9%) |
Employment Industries by Sex in Cape Neddick
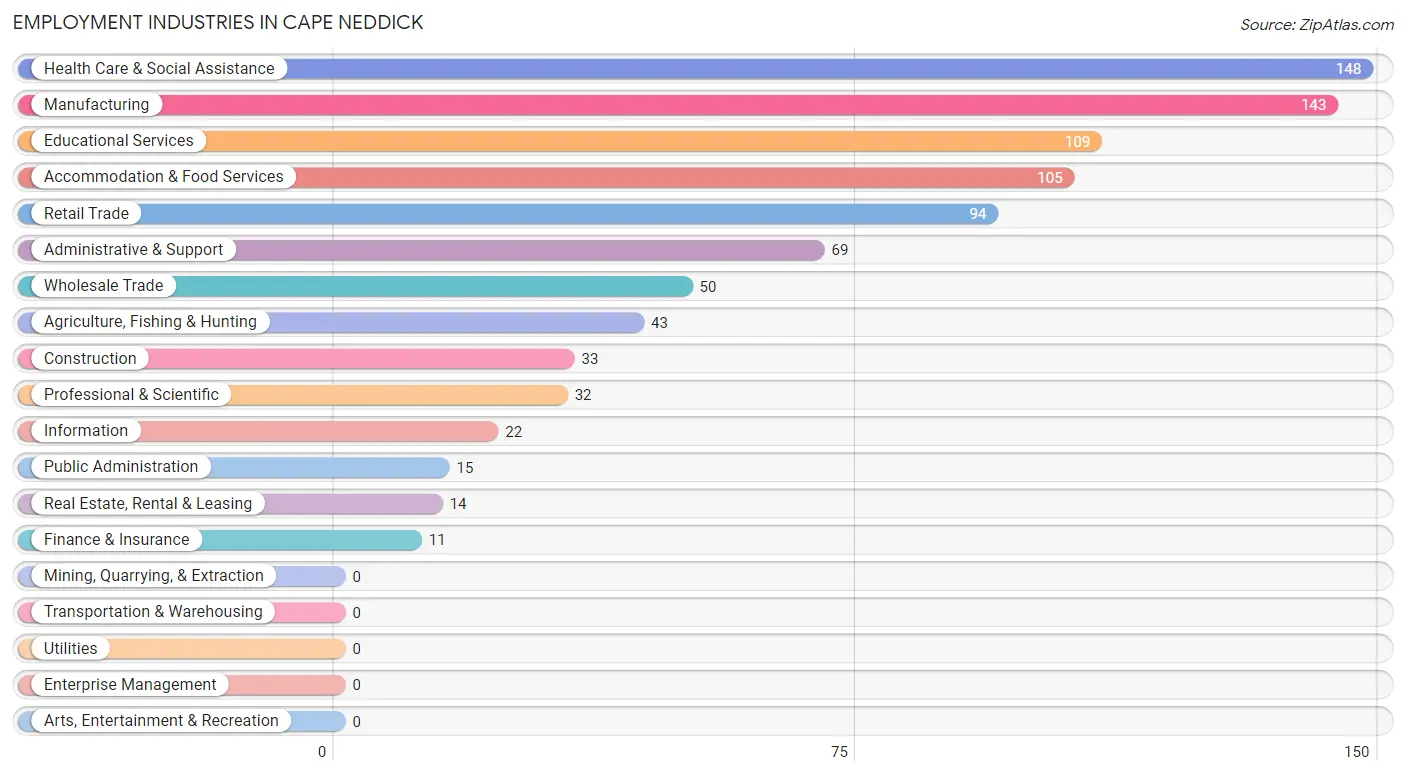
Employment Industries in Cape Neddick
The major employment industries in Cape Neddick include Health Care & Social Assistance (148 | 16.7%), Manufacturing (143 | 16.1%), Educational Services (109 | 12.3%), Accommodation & Food Services (105 | 11.8%), and Retail Trade (94 | 10.6%).
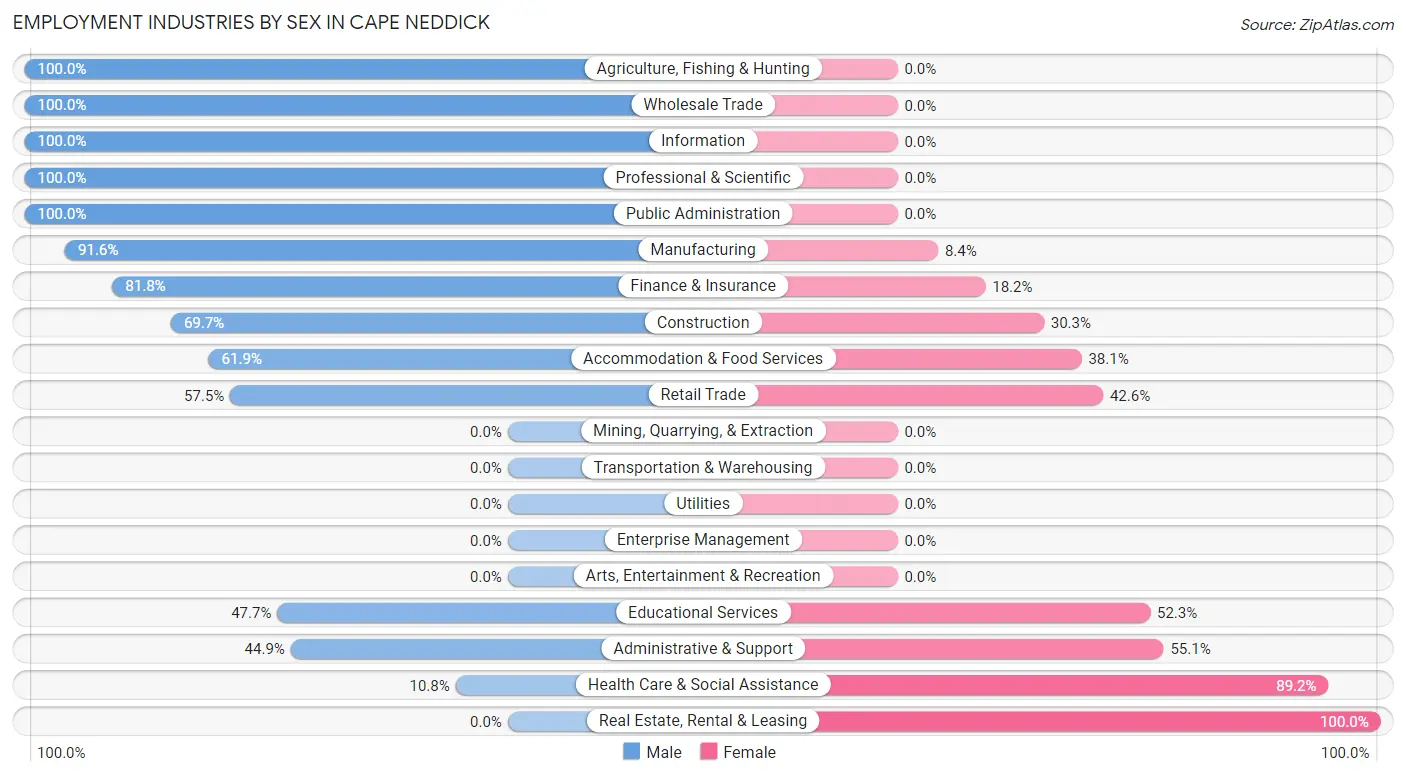
Employment Industries by Sex in Cape Neddick
The Cape Neddick industries that see more men than women are Agriculture, Fishing & Hunting (100.0%), Wholesale Trade (100.0%), and Information (100.0%), whereas the industries that tend to have a higher number of women are Real Estate, Rental & Leasing (100.0%), Health Care & Social Assistance (89.2%), and Administrative & Support (55.1%).
| Industry | Male | Female |
| Agriculture, Fishing & Hunting | 43 (100.0%) | 0 (0.0%) |
| Mining, Quarrying, & Extraction | 0 (0.0%) | 0 (0.0%) |
| Construction | 23 (69.7%) | 10 (30.3%) |
| Manufacturing | 131 (91.6%) | 12 (8.4%) |
| Wholesale Trade | 50 (100.0%) | 0 (0.0%) |
| Retail Trade | 54 (57.5%) | 40 (42.5%) |
| Transportation & Warehousing | 0 (0.0%) | 0 (0.0%) |
| Utilities | 0 (0.0%) | 0 (0.0%) |
| Information | 22 (100.0%) | 0 (0.0%) |
| Finance & Insurance | 9 (81.8%) | 2 (18.2%) |
| Real Estate, Rental & Leasing | 0 (0.0%) | 14 (100.0%) |
| Professional & Scientific | 32 (100.0%) | 0 (0.0%) |
| Enterprise Management | 0 (0.0%) | 0 (0.0%) |
| Administrative & Support | 31 (44.9%) | 38 (55.1%) |
| Educational Services | 52 (47.7%) | 57 (52.3%) |
| Health Care & Social Assistance | 16 (10.8%) | 132 (89.2%) |
| Arts, Entertainment & Recreation | 0 (0.0%) | 0 (0.0%) |
| Accommodation & Food Services | 65 (61.9%) | 40 (38.1%) |
| Public Administration | 15 (100.0%) | 0 (0.0%) |
| Total | 543 (61.2%) | 345 (38.9%) |
Education in Cape Neddick
School Enrollment in Cape Neddick
The most common levels of schooling among the 224 students in Cape Neddick are elementary school (94 | 42.0%), high school (61 | 27.2%), and middle school (44 | 19.6%).
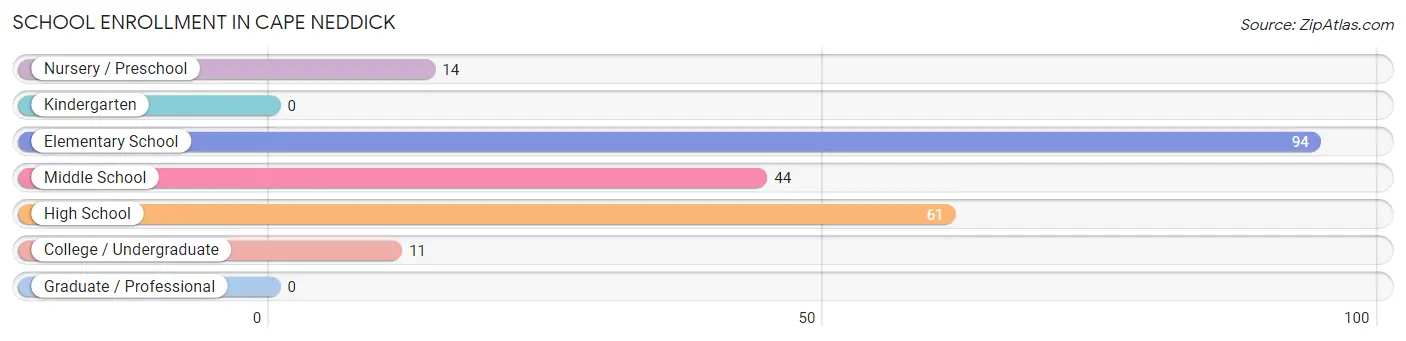
| School Level | # Students | % Students |
| Nursery / Preschool | 14 | 6.2% |
| Kindergarten | 0 | 0.0% |
| Elementary School | 94 | 42.0% |
| Middle School | 44 | 19.6% |
| High School | 61 | 27.2% |
| College / Undergraduate | 11 | 4.9% |
| Graduate / Professional | 0 | 0.0% |
| Total | 224 | 100.0% |
School Enrollment by Age by Funding Source in Cape Neddick
Out of a total of 224 students who are enrolled in schools in Cape Neddick, 14 (6.3%) attend a private institution, while the remaining 210 (93.7%) are enrolled in public schools. The age group of 3 to 4 year olds has the highest likelihood of being enrolled in private schools, with 14 (100.0% in the age bracket) enrolled. Conversely, the age group of 5 to 9 year old has the lowest likelihood of being enrolled in a private school, with 49 (100.0% in the age bracket) attending a public institution.
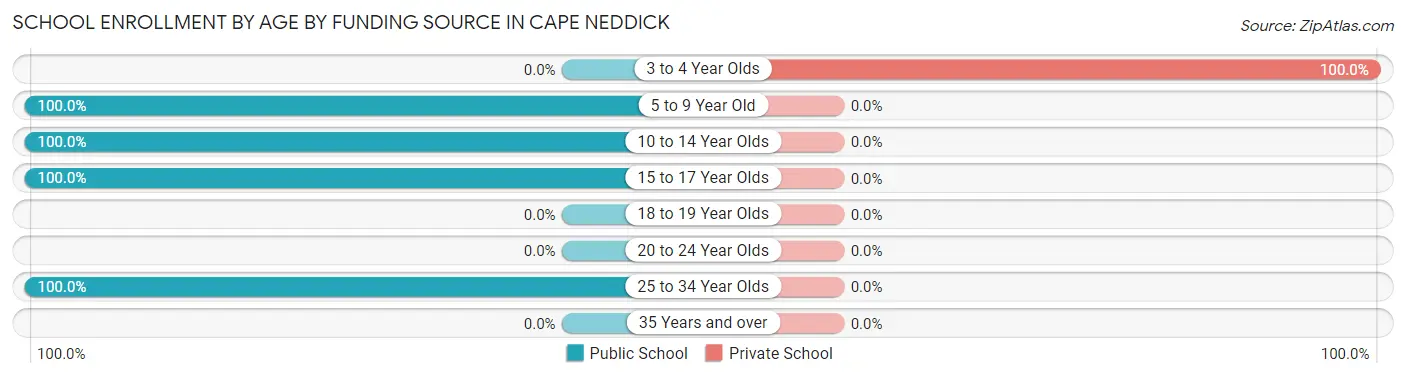
| Age Bracket | Public School | Private School |
| 3 to 4 Year Olds | 0 (0.0%) | 14 (100.0%) |
| 5 to 9 Year Old | 49 (100.0%) | 0 (0.0%) |
| 10 to 14 Year Olds | 53 (100.0%) | 0 (0.0%) |
| 15 to 17 Year Olds | 97 (100.0%) | 0 (0.0%) |
| 18 to 19 Year Olds | 0 (0.0%) | 0 (0.0%) |
| 20 to 24 Year Olds | 0 (0.0%) | 0 (0.0%) |
| 25 to 34 Year Olds | 11 (100.0%) | 0 (0.0%) |
| 35 Years and over | 0 (0.0%) | 0 (0.0%) |
| Total | 210 (93.8%) | 14 (6.3%) |
Educational Attainment by Field of Study in Cape Neddick
Business (219 | 18.3%), engineering (160 | 13.3%), education (140 | 11.7%), literature & languages (128 | 10.7%), and social sciences (115 | 9.6%) are the most common fields of study among 1,199 individuals in Cape Neddick who have obtained a bachelor's degree or higher.
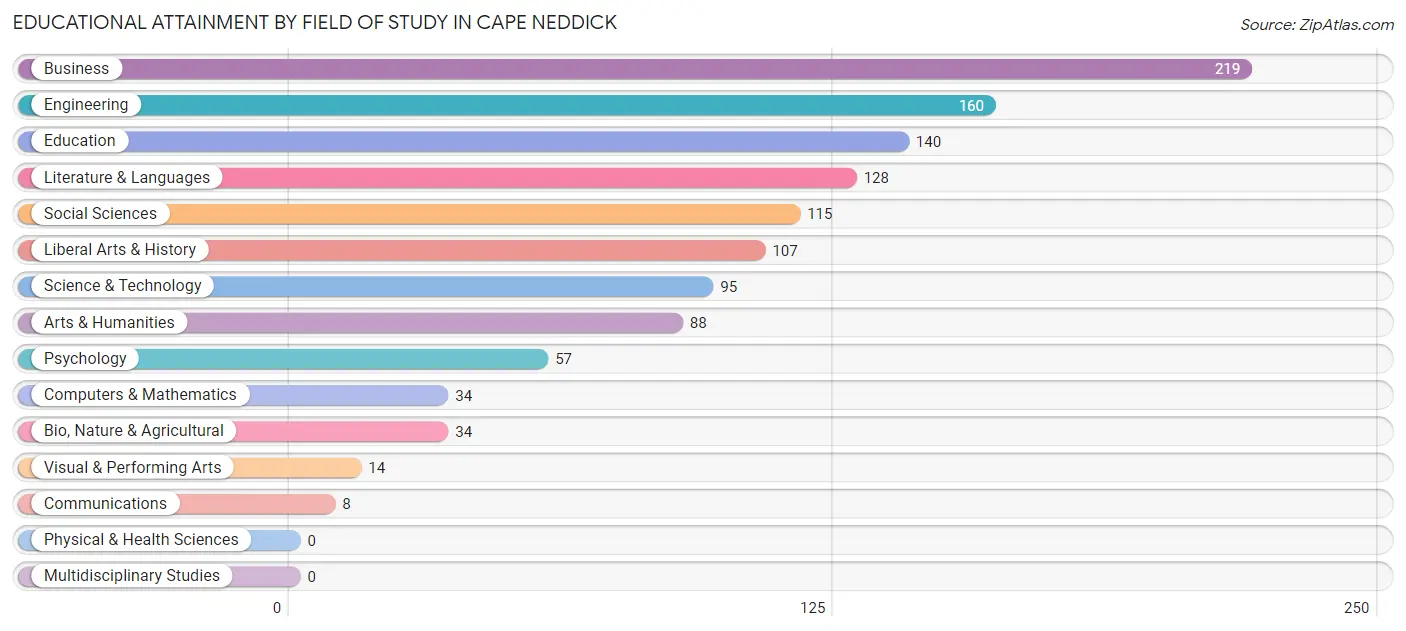
| Field of Study | # Graduates | % Graduates |
| Computers & Mathematics | 34 | 2.8% |
| Bio, Nature & Agricultural | 34 | 2.8% |
| Physical & Health Sciences | 0 | 0.0% |
| Psychology | 57 | 4.8% |
| Social Sciences | 115 | 9.6% |
| Engineering | 160 | 13.3% |
| Multidisciplinary Studies | 0 | 0.0% |
| Science & Technology | 95 | 7.9% |
| Business | 219 | 18.3% |
| Education | 140 | 11.7% |
| Literature & Languages | 128 | 10.7% |
| Liberal Arts & History | 107 | 8.9% |
| Visual & Performing Arts | 14 | 1.2% |
| Communications | 8 | 0.7% |
| Arts & Humanities | 88 | 7.3% |
| Total | 1,199 | 100.0% |
Transportation & Commute in Cape Neddick
Vehicle Availability by Sex in Cape Neddick
The most prevalent vehicle ownership categories in Cape Neddick are males with 2 vehicles (354, accounting for 65.2%) and females with 2 vehicles (240, making up 103.2%).
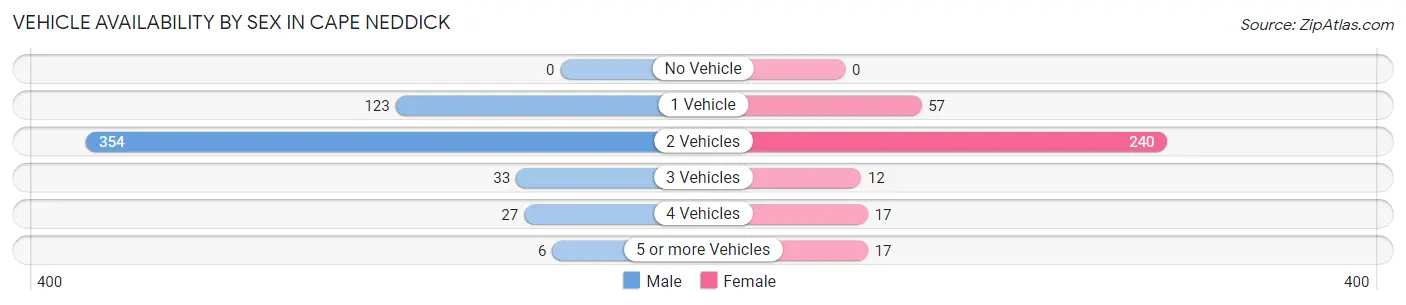
| Vehicles Available | Male | Female |
| No Vehicle | 0 (0.0%) | 0 (0.0%) |
| 1 Vehicle | 123 (22.7%) | 57 (16.6%) |
| 2 Vehicles | 354 (65.2%) | 240 (70.0%) |
| 3 Vehicles | 33 (6.1%) | 12 (3.5%) |
| 4 Vehicles | 27 (5.0%) | 17 (5.0%) |
| 5 or more Vehicles | 6 (1.1%) | 17 (5.0%) |
| Total | 543 (100.0%) | 343 (100.0%) |
Commute Time in Cape Neddick
The most frequently occuring commute durations in Cape Neddick are 5 to 9 minutes (207 commuters, 28.1%), 10 to 14 minutes (151 commuters, 20.5%), and 20 to 24 minutes (151 commuters, 20.5%).
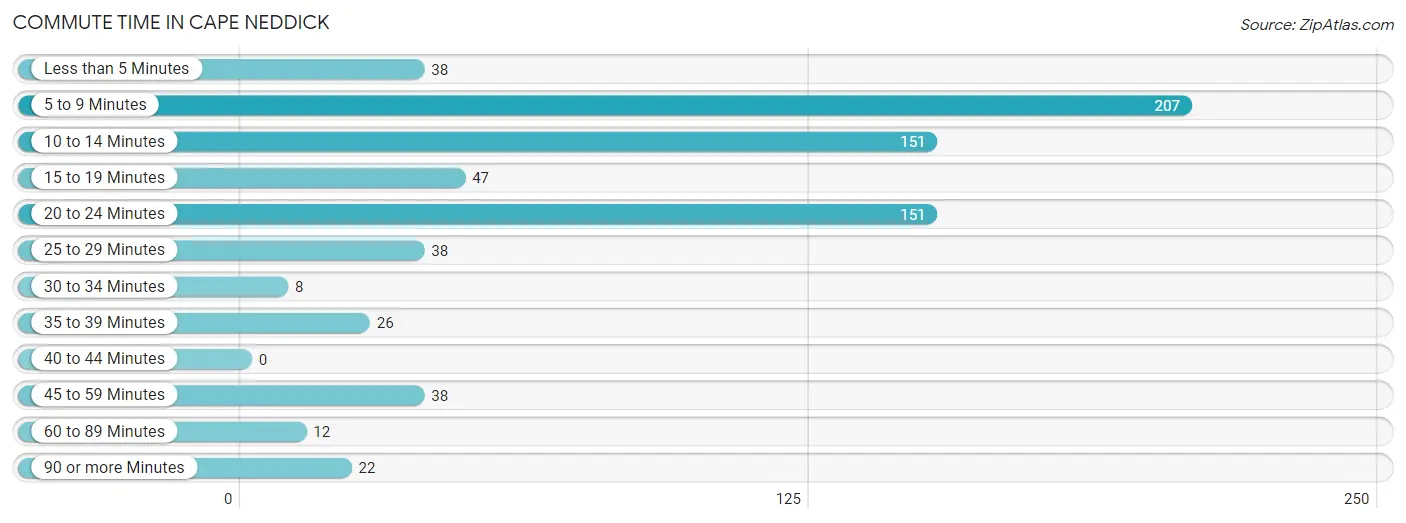
| Commute Time | # Commuters | % Commuters |
| Less than 5 Minutes | 38 | 5.1% |
| 5 to 9 Minutes | 207 | 28.1% |
| 10 to 14 Minutes | 151 | 20.5% |
| 15 to 19 Minutes | 47 | 6.4% |
| 20 to 24 Minutes | 151 | 20.5% |
| 25 to 29 Minutes | 38 | 5.1% |
| 30 to 34 Minutes | 8 | 1.1% |
| 35 to 39 Minutes | 26 | 3.5% |
| 40 to 44 Minutes | 0 | 0.0% |
| 45 to 59 Minutes | 38 | 5.1% |
| 60 to 89 Minutes | 12 | 1.6% |
| 90 or more Minutes | 22 | 3.0% |
Commute Time by Sex in Cape Neddick
The most common commute times in Cape Neddick are 5 to 9 minutes (160 commuters, 34.9%) for males and 20 to 24 minutes (60 commuters, 21.5%) for females.
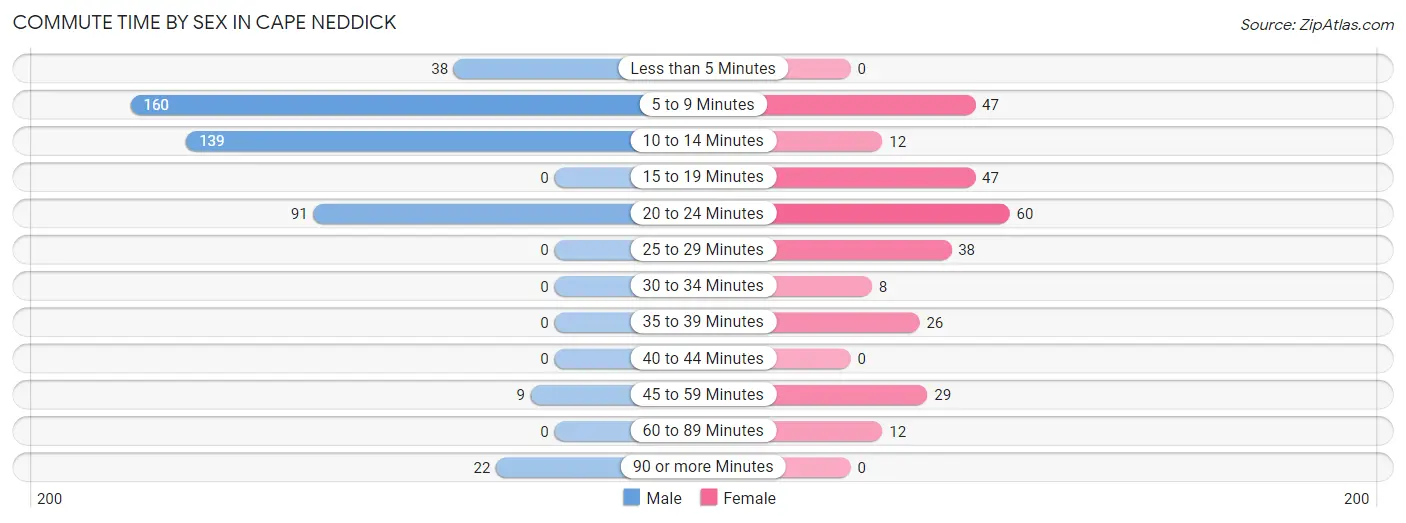
| Commute Time | Male | Female |
| Less than 5 Minutes | 38 (8.3%) | 0 (0.0%) |
| 5 to 9 Minutes | 160 (34.9%) | 47 (16.9%) |
| 10 to 14 Minutes | 139 (30.3%) | 12 (4.3%) |
| 15 to 19 Minutes | 0 (0.0%) | 47 (16.9%) |
| 20 to 24 Minutes | 91 (19.8%) | 60 (21.5%) |
| 25 to 29 Minutes | 0 (0.0%) | 38 (13.6%) |
| 30 to 34 Minutes | 0 (0.0%) | 8 (2.9%) |
| 35 to 39 Minutes | 0 (0.0%) | 26 (9.3%) |
| 40 to 44 Minutes | 0 (0.0%) | 0 (0.0%) |
| 45 to 59 Minutes | 9 (2.0%) | 29 (10.4%) |
| 60 to 89 Minutes | 0 (0.0%) | 12 (4.3%) |
| 90 or more Minutes | 22 (4.8%) | 0 (0.0%) |
Time of Departure to Work by Sex in Cape Neddick
The most frequent times of departure to work in Cape Neddick are 6:00 AM to 6:29 AM (98, 21.3%) for males and 6:30 AM to 6:59 AM (67, 24.0%) for females.
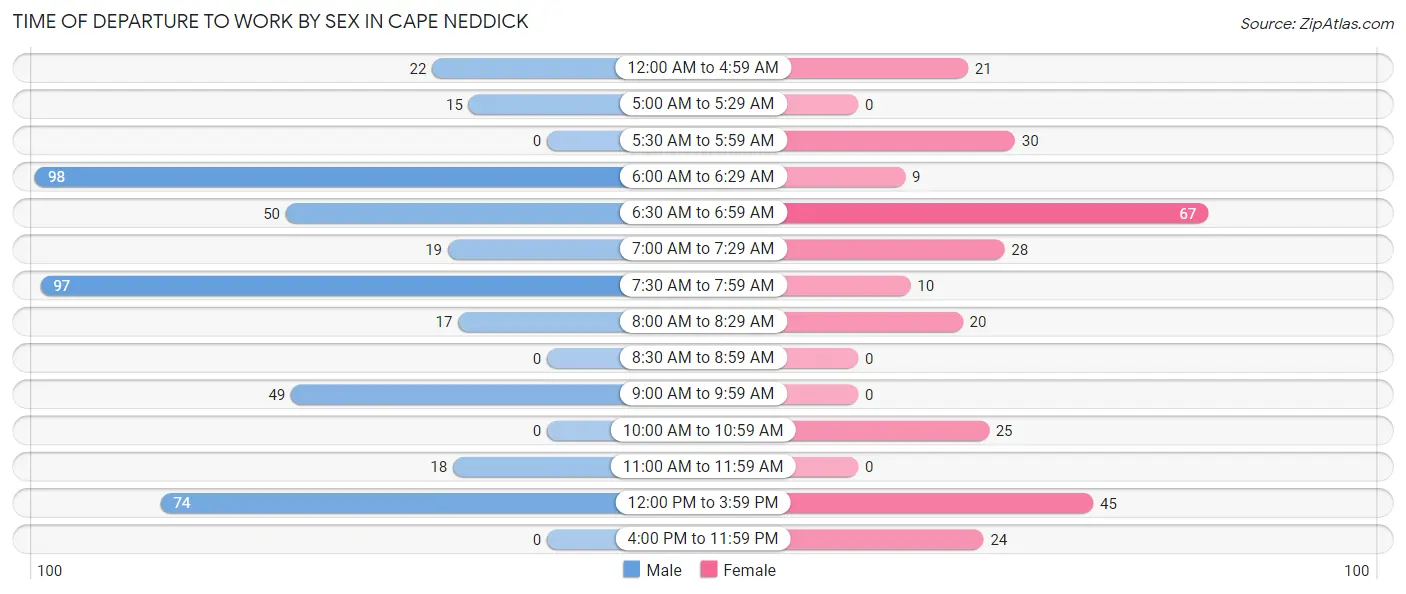
| Time of Departure | Male | Female |
| 12:00 AM to 4:59 AM | 22 (4.8%) | 21 (7.5%) |
| 5:00 AM to 5:29 AM | 15 (3.3%) | 0 (0.0%) |
| 5:30 AM to 5:59 AM | 0 (0.0%) | 30 (10.7%) |
| 6:00 AM to 6:29 AM | 98 (21.3%) | 9 (3.2%) |
| 6:30 AM to 6:59 AM | 50 (10.9%) | 67 (24.0%) |
| 7:00 AM to 7:29 AM | 19 (4.1%) | 28 (10.0%) |
| 7:30 AM to 7:59 AM | 97 (21.1%) | 10 (3.6%) |
| 8:00 AM to 8:29 AM | 17 (3.7%) | 20 (7.2%) |
| 8:30 AM to 8:59 AM | 0 (0.0%) | 0 (0.0%) |
| 9:00 AM to 9:59 AM | 49 (10.7%) | 0 (0.0%) |
| 10:00 AM to 10:59 AM | 0 (0.0%) | 25 (9.0%) |
| 11:00 AM to 11:59 AM | 18 (3.9%) | 0 (0.0%) |
| 12:00 PM to 3:59 PM | 74 (16.1%) | 45 (16.1%) |
| 4:00 PM to 11:59 PM | 0 (0.0%) | 24 (8.6%) |
| Total | 459 (100.0%) | 279 (100.0%) |
Housing Occupancy in Cape Neddick
Occupancy by Ownership in Cape Neddick
Of the total 1,321 dwellings in Cape Neddick, owner-occupied units account for 1,157 (87.6%), while renter-occupied units make up 164 (12.4%).
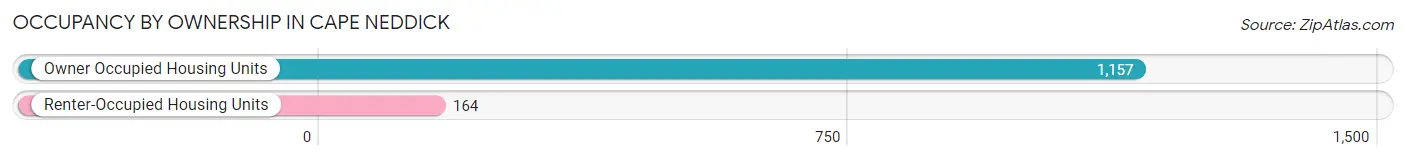
| Occupancy | # Housing Units | % Housing Units |
| Owner Occupied Housing Units | 1,157 | 87.6% |
| Renter-Occupied Housing Units | 164 | 12.4% |
| Total Occupied Housing Units | 1,321 | 100.0% |
Occupancy by Household Size in Cape Neddick
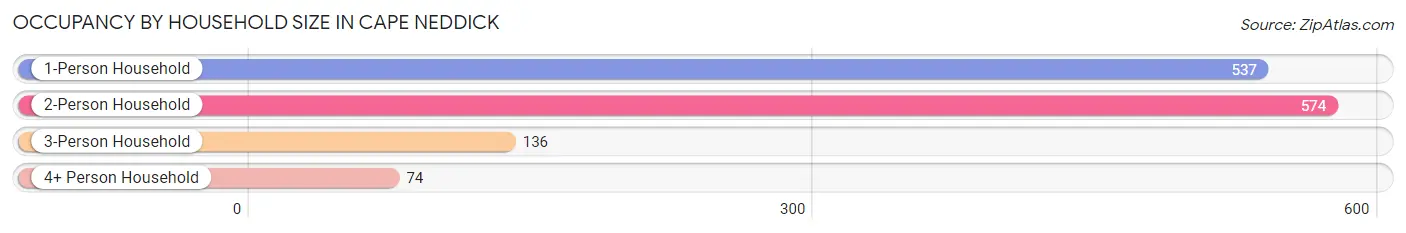
| Household Size | # Housing Units | % Housing Units |
| 1-Person Household | 537 | 40.6% |
| 2-Person Household | 574 | 43.4% |
| 3-Person Household | 136 | 10.3% |
| 4+ Person Household | 74 | 5.6% |
| Total Housing Units | 1,321 | 100.0% |
Occupancy by Ownership by Household Size in Cape Neddick
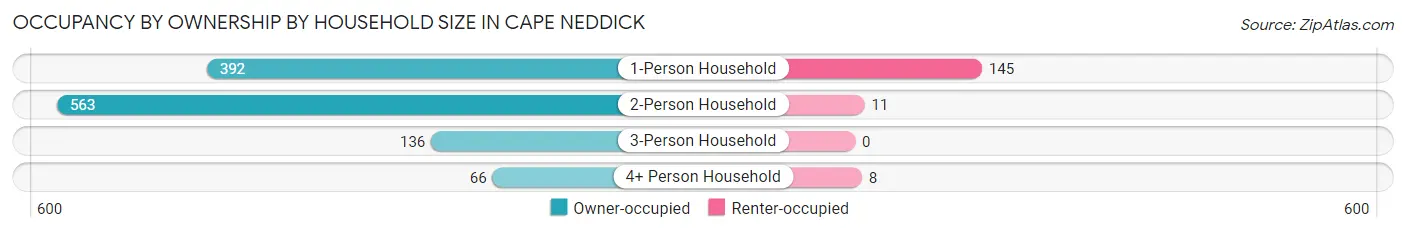
| Household Size | Owner-occupied | Renter-occupied |
| 1-Person Household | 392 (73.0%) | 145 (27.0%) |
| 2-Person Household | 563 (98.1%) | 11 (1.9%) |
| 3-Person Household | 136 (100.0%) | 0 (0.0%) |
| 4+ Person Household | 66 (89.2%) | 8 (10.8%) |
| Total Housing Units | 1,157 (87.6%) | 164 (12.4%) |
Occupancy by Educational Attainment in Cape Neddick
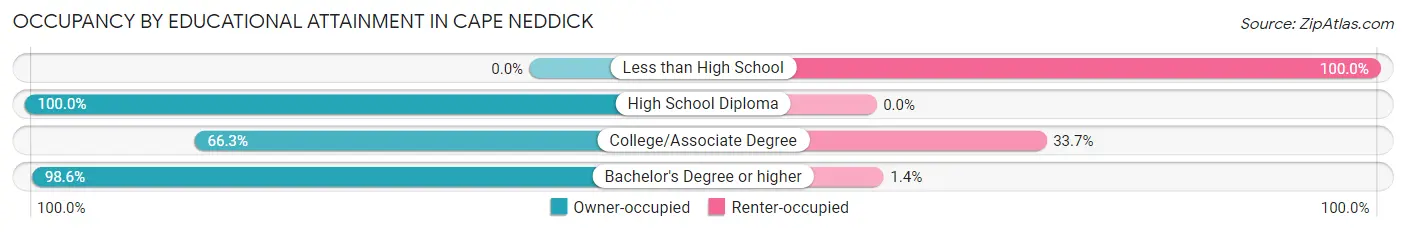
| Household Size | Owner-occupied | Renter-occupied |
| Less than High School | 0 (0.0%) | 8 (100.0%) |
| High School Diploma | 247 (100.0%) | 0 (0.0%) |
| College/Associate Degree | 289 (66.3%) | 147 (33.7%) |
| Bachelor's Degree or higher | 621 (98.6%) | 9 (1.4%) |
Occupancy by Age of Householder in Cape Neddick
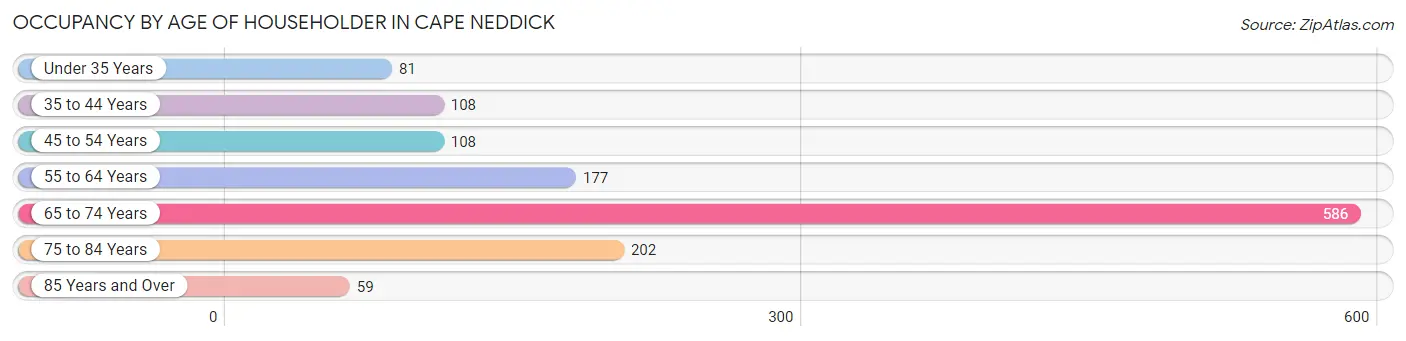
| Age Bracket | # Households | % Households |
| Under 35 Years | 81 | 6.1% |
| 35 to 44 Years | 108 | 8.2% |
| 45 to 54 Years | 108 | 8.2% |
| 55 to 64 Years | 177 | 13.4% |
| 65 to 74 Years | 586 | 44.4% |
| 75 to 84 Years | 202 | 15.3% |
| 85 Years and Over | 59 | 4.5% |
| Total | 1,321 | 100.0% |
Housing Finances in Cape Neddick
Median Income by Occupancy in Cape Neddick
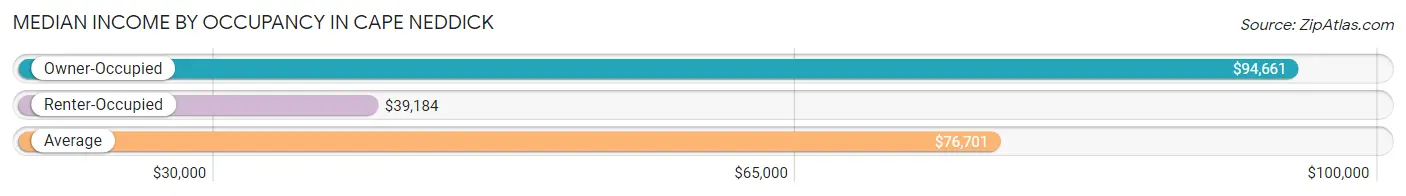
| Occupancy Type | # Households | Median Income |
| Owner-Occupied | 1,157 (87.6%) | $94,661 |
| Renter-Occupied | 164 (12.4%) | $39,184 |
| Average | 1,321 (100.0%) | $76,701 |
Occupancy by Householder Income Bracket in Cape Neddick
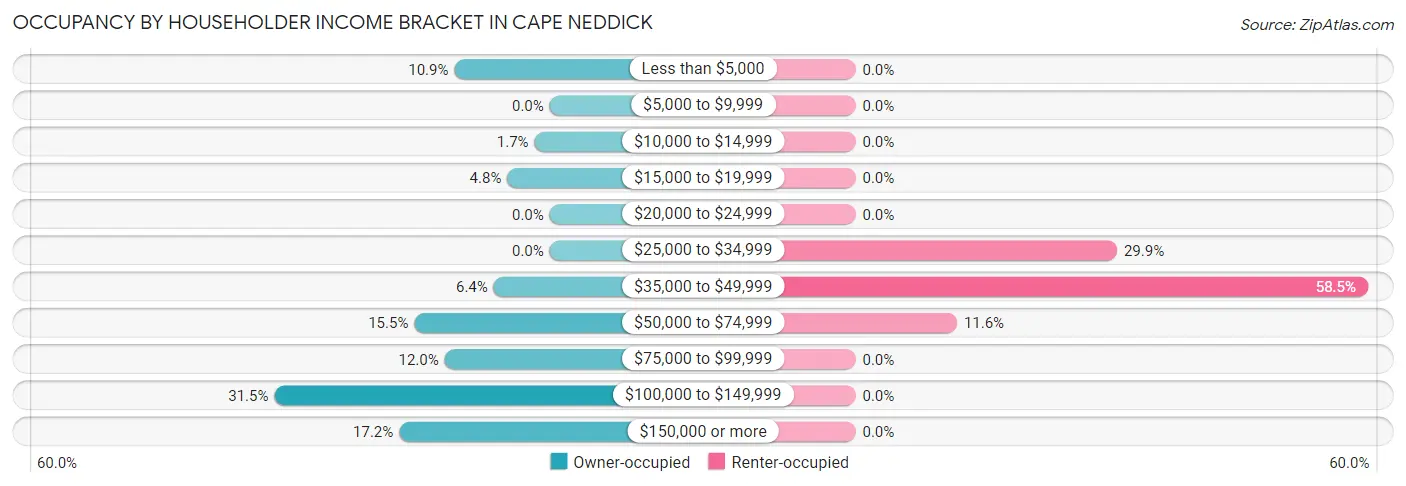
| Income Bracket | Owner-occupied | Renter-occupied |
| Less than $5,000 | 126 (10.9%) | 0 (0.0%) |
| $5,000 to $9,999 | 0 (0.0%) | 0 (0.0%) |
| $10,000 to $14,999 | 20 (1.7%) | 0 (0.0%) |
| $15,000 to $19,999 | 56 (4.8%) | 0 (0.0%) |
| $20,000 to $24,999 | 0 (0.0%) | 0 (0.0%) |
| $25,000 to $34,999 | 0 (0.0%) | 49 (29.9%) |
| $35,000 to $49,999 | 74 (6.4%) | 96 (58.5%) |
| $50,000 to $74,999 | 179 (15.5%) | 19 (11.6%) |
| $75,000 to $99,999 | 139 (12.0%) | 0 (0.0%) |
| $100,000 to $149,999 | 364 (31.5%) | 0 (0.0%) |
| $150,000 or more | 199 (17.2%) | 0 (0.0%) |
| Total | 1,157 (100.0%) | 164 (100.0%) |
Monthly Housing Cost Tiers in Cape Neddick
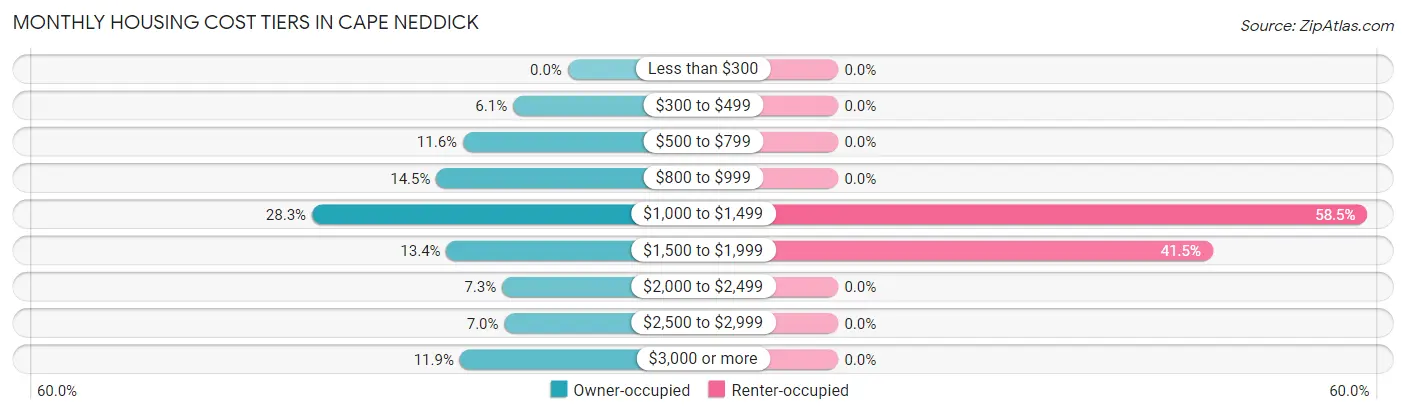
| Monthly Cost | Owner-occupied | Renter-occupied |
| Less than $300 | 0 (0.0%) | 0 (0.0%) |
| $300 to $499 | 70 (6.0%) | 0 (0.0%) |
| $500 to $799 | 134 (11.6%) | 0 (0.0%) |
| $800 to $999 | 168 (14.5%) | 0 (0.0%) |
| $1,000 to $1,499 | 327 (28.3%) | 96 (58.5%) |
| $1,500 to $1,999 | 155 (13.4%) | 68 (41.5%) |
| $2,000 to $2,499 | 84 (7.3%) | 0 (0.0%) |
| $2,500 to $2,999 | 81 (7.0%) | 0 (0.0%) |
| $3,000 or more | 138 (11.9%) | 0 (0.0%) |
| Total | 1,157 (100.0%) | 164 (100.0%) |
Physical Housing Characteristics in Cape Neddick
Housing Structures in Cape Neddick
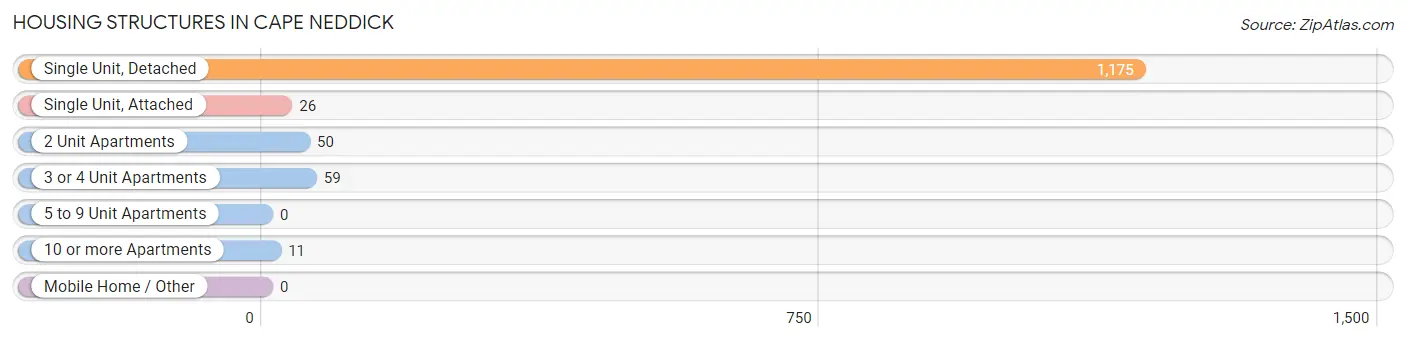
| Structure Type | # Housing Units | % Housing Units |
| Single Unit, Detached | 1,175 | 88.9% |
| Single Unit, Attached | 26 | 2.0% |
| 2 Unit Apartments | 50 | 3.8% |
| 3 or 4 Unit Apartments | 59 | 4.5% |
| 5 to 9 Unit Apartments | 0 | 0.0% |
| 10 or more Apartments | 11 | 0.8% |
| Mobile Home / Other | 0 | 0.0% |
| Total | 1,321 | 100.0% |
Housing Structures by Occupancy in Cape Neddick
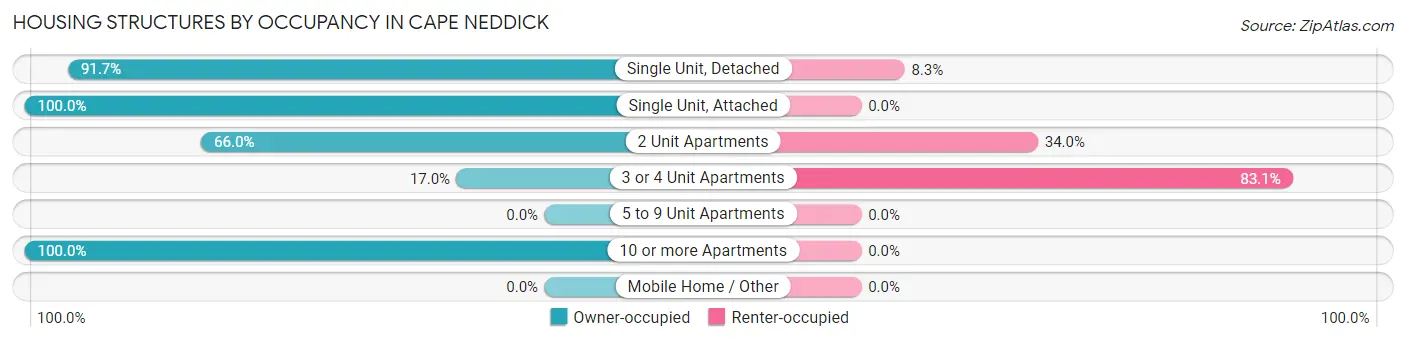
| Structure Type | Owner-occupied | Renter-occupied |
| Single Unit, Detached | 1,077 (91.7%) | 98 (8.3%) |
| Single Unit, Attached | 26 (100.0%) | 0 (0.0%) |
| 2 Unit Apartments | 33 (66.0%) | 17 (34.0%) |
| 3 or 4 Unit Apartments | 10 (17.0%) | 49 (83.1%) |
| 5 to 9 Unit Apartments | 0 (0.0%) | 0 (0.0%) |
| 10 or more Apartments | 11 (100.0%) | 0 (0.0%) |
| Mobile Home / Other | 0 (0.0%) | 0 (0.0%) |
| Total | 1,157 (87.6%) | 164 (12.4%) |
Housing Structures by Number of Rooms in Cape Neddick
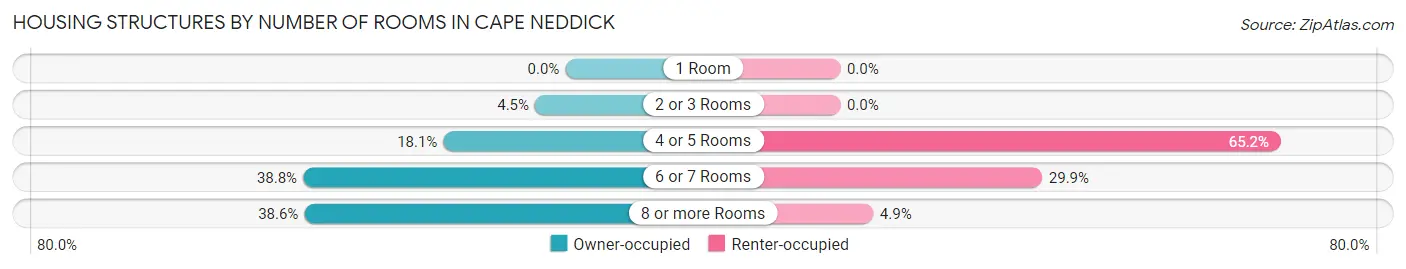
| Number of Rooms | Owner-occupied | Renter-occupied |
| 1 Room | 0 (0.0%) | 0 (0.0%) |
| 2 or 3 Rooms | 52 (4.5%) | 0 (0.0%) |
| 4 or 5 Rooms | 209 (18.1%) | 107 (65.2%) |
| 6 or 7 Rooms | 449 (38.8%) | 49 (29.9%) |
| 8 or more Rooms | 447 (38.6%) | 8 (4.9%) |
| Total | 1,157 (100.0%) | 164 (100.0%) |
Housing Structure by Heating Type in Cape Neddick
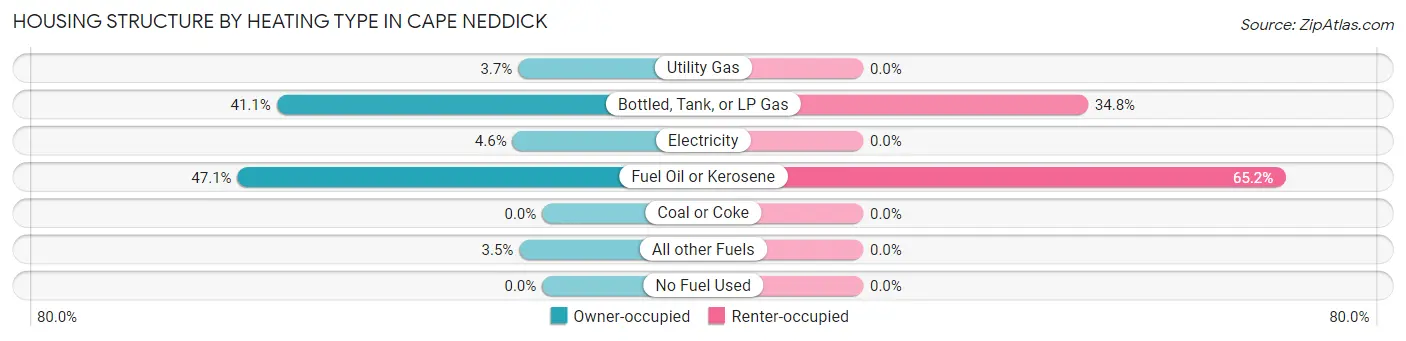
| Heating Type | Owner-occupied | Renter-occupied |
| Utility Gas | 43 (3.7%) | 0 (0.0%) |
| Bottled, Tank, or LP Gas | 475 (41.0%) | 57 (34.8%) |
| Electricity | 53 (4.6%) | 0 (0.0%) |
| Fuel Oil or Kerosene | 545 (47.1%) | 107 (65.2%) |
| Coal or Coke | 0 (0.0%) | 0 (0.0%) |
| All other Fuels | 41 (3.5%) | 0 (0.0%) |
| No Fuel Used | 0 (0.0%) | 0 (0.0%) |
| Total | 1,157 (100.0%) | 164 (100.0%) |
Household Vehicle Usage in Cape Neddick
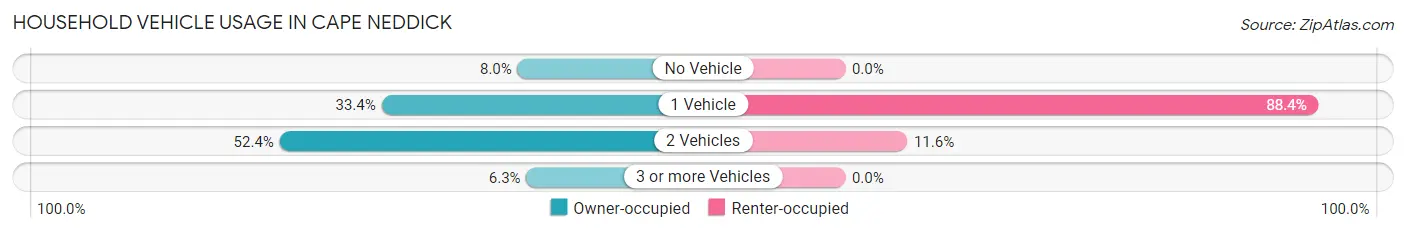
| Vehicles per Household | Owner-occupied | Renter-occupied |
| No Vehicle | 92 (8.0%) | 0 (0.0%) |
| 1 Vehicle | 386 (33.4%) | 145 (88.4%) |
| 2 Vehicles | 606 (52.4%) | 19 (11.6%) |
| 3 or more Vehicles | 73 (6.3%) | 0 (0.0%) |
| Total | 1,157 (100.0%) | 164 (100.0%) |
Real Estate & Mortgages in Cape Neddick
Real Estate and Mortgage Overview in Cape Neddick
| Characteristic | Without Mortgage | With Mortgage |
| Housing Units | 626 | 531 |
| Median Property Value | $568,000 | $582,800 |
| Median Household Income | $112,212 | $89 |
| Monthly Housing Costs | $931 | $117 |
| Real Estate Taxes | $5,955 | $0 |
Property Value by Mortgage Status in Cape Neddick
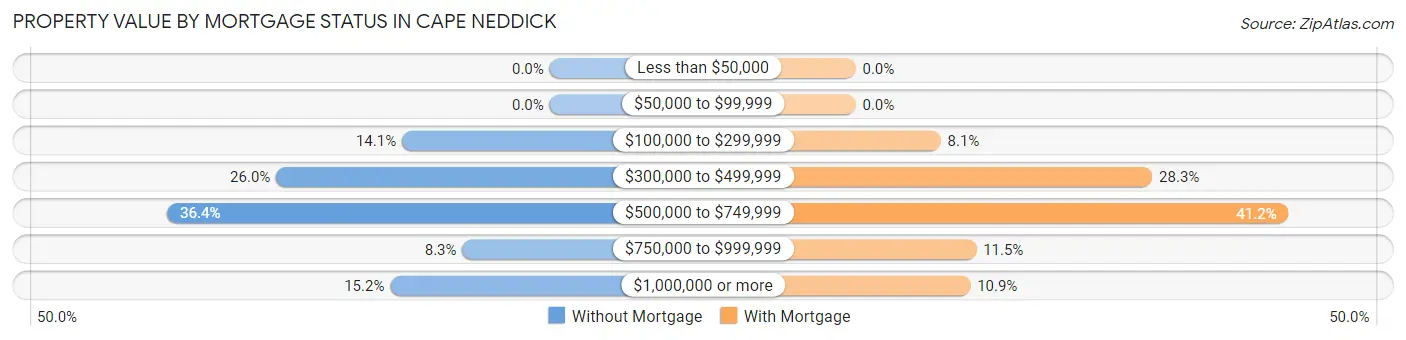
| Property Value | Without Mortgage | With Mortgage |
| Less than $50,000 | 0 (0.0%) | 0 (0.0%) |
| $50,000 to $99,999 | 0 (0.0%) | 0 (0.0%) |
| $100,000 to $299,999 | 88 (14.1%) | 43 (8.1%) |
| $300,000 to $499,999 | 163 (26.0%) | 150 (28.2%) |
| $500,000 to $749,999 | 228 (36.4%) | 219 (41.2%) |
| $750,000 to $999,999 | 52 (8.3%) | 61 (11.5%) |
| $1,000,000 or more | 95 (15.2%) | 58 (10.9%) |
| Total | 626 (100.0%) | 531 (100.0%) |
Household Income by Mortgage Status in Cape Neddick
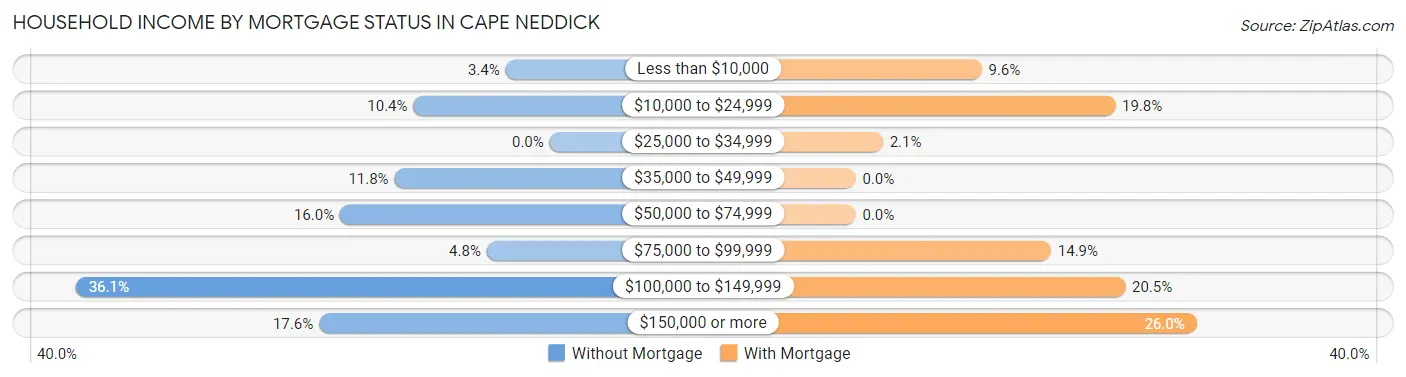
| Household Income | Without Mortgage | With Mortgage |
| Less than $10,000 | 21 (3.4%) | 51 (9.6%) |
| $10,000 to $24,999 | 65 (10.4%) | 105 (19.8%) |
| $25,000 to $34,999 | 0 (0.0%) | 11 (2.1%) |
| $35,000 to $49,999 | 74 (11.8%) | 0 (0.0%) |
| $50,000 to $74,999 | 100 (16.0%) | 0 (0.0%) |
| $75,000 to $99,999 | 30 (4.8%) | 79 (14.9%) |
| $100,000 to $149,999 | 226 (36.1%) | 109 (20.5%) |
| $150,000 or more | 110 (17.6%) | 138 (26.0%) |
| Total | 626 (100.0%) | 531 (100.0%) |
Property Value to Household Income Ratio in Cape Neddick
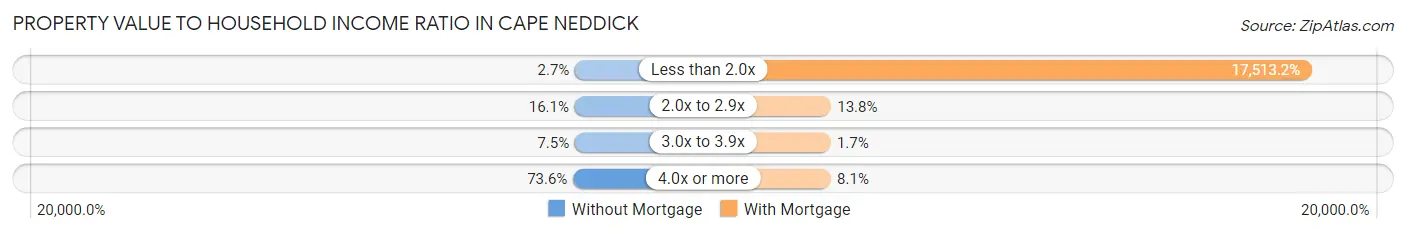
| Value-to-Income Ratio | Without Mortgage | With Mortgage |
| Less than 2.0x | 17 (2.7%) | 92,995 (17,513.2%) |
| 2.0x to 2.9x | 101 (16.1%) | 73 (13.8%) |
| 3.0x to 3.9x | 47 (7.5%) | 9 (1.7%) |
| 4.0x or more | 461 (73.6%) | 43 (8.1%) |
| Total | 626 (100.0%) | 531 (100.0%) |
Real Estate Taxes by Mortgage Status in Cape Neddick
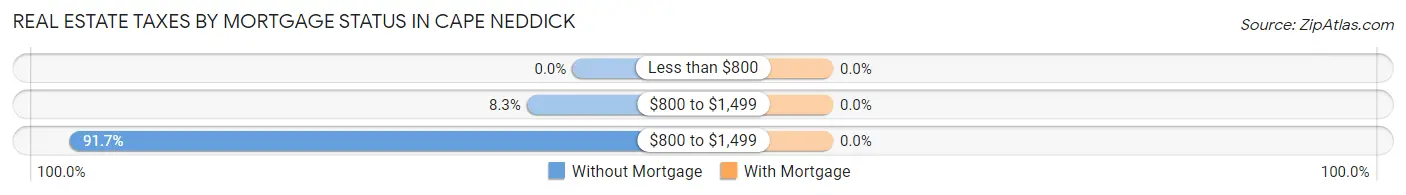
| Property Taxes | Without Mortgage | With Mortgage |
| Less than $800 | 0 (0.0%) | 0 (0.0%) |
| $800 to $1,499 | 52 (8.3%) | 0 (0.0%) |
| $800 to $1,499 | 574 (91.7%) | 0 (0.0%) |
| Total | 626 (100.0%) | 531 (100.0%) |
Health & Disability in Cape Neddick
Health Insurance Coverage by Age in Cape Neddick
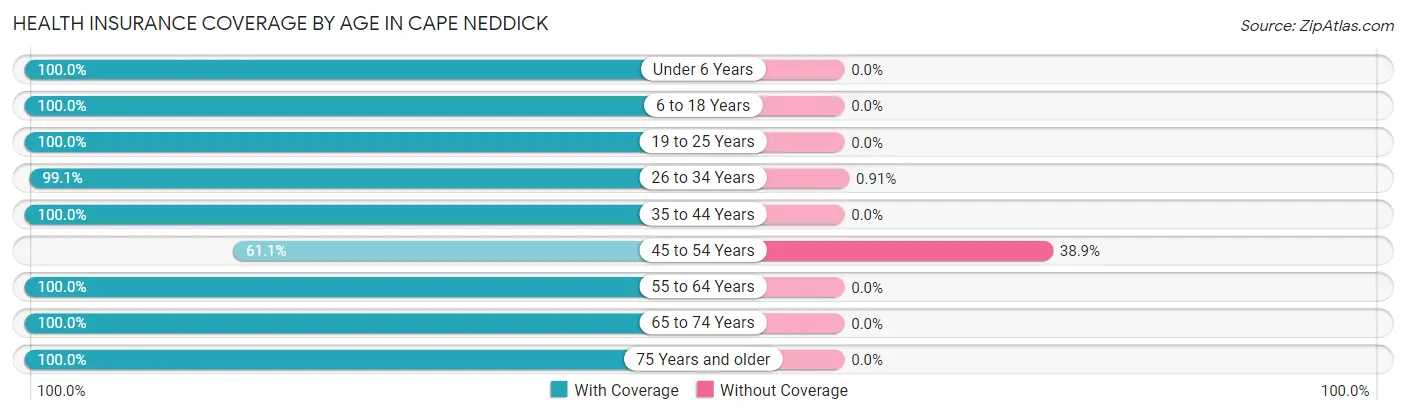
| Age Bracket | With Coverage | Without Coverage |
| Under 6 Years | 124 (100.0%) | 0 (0.0%) |
| 6 to 18 Years | 199 (100.0%) | 0 (0.0%) |
| 19 to 25 Years | 10 (100.0%) | 0 (0.0%) |
| 26 to 34 Years | 218 (99.1%) | 2 (0.9%) |
| 35 to 44 Years | 167 (100.0%) | 0 (0.0%) |
| 45 to 54 Years | 77 (61.1%) | 49 (38.9%) |
| 55 to 64 Years | 470 (100.0%) | 0 (0.0%) |
| 65 to 74 Years | 812 (100.0%) | 0 (0.0%) |
| 75 Years and older | 334 (100.0%) | 0 (0.0%) |
| Total | 2,411 (97.9%) | 51 (2.1%) |
Health Insurance Coverage by Citizenship Status in Cape Neddick
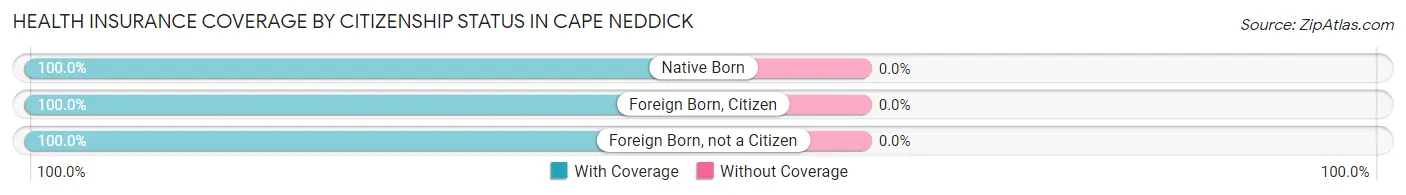
| Citizenship Status | With Coverage | Without Coverage |
| Native Born | 124 (100.0%) | 0 (0.0%) |
| Foreign Born, Citizen | 199 (100.0%) | 0 (0.0%) |
| Foreign Born, not a Citizen | 10 (100.0%) | 0 (0.0%) |
Health Insurance Coverage by Household Income in Cape Neddick
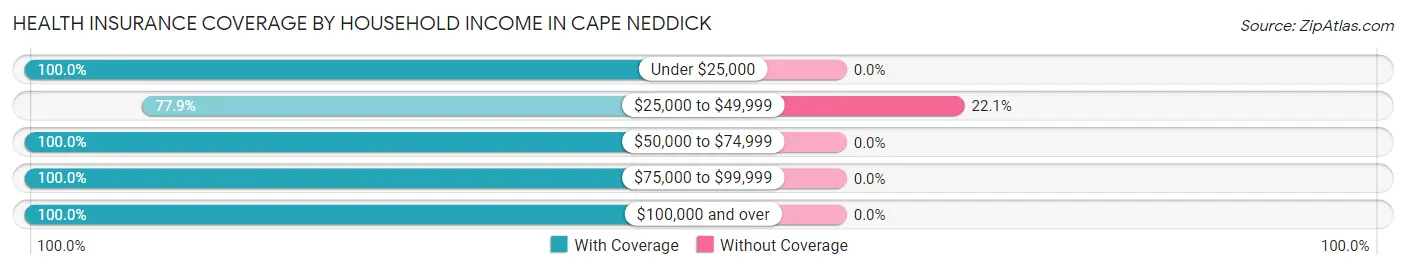
| Household Income | With Coverage | Without Coverage |
| Under $25,000 | 214 (100.0%) | 0 (0.0%) |
| $25,000 to $49,999 | 173 (77.9%) | 49 (22.1%) |
| $50,000 to $74,999 | 330 (100.0%) | 0 (0.0%) |
| $75,000 to $99,999 | 451 (100.0%) | 0 (0.0%) |
| $100,000 and over | 1,243 (100.0%) | 0 (0.0%) |
Public vs Private Health Insurance Coverage by Age in Cape Neddick
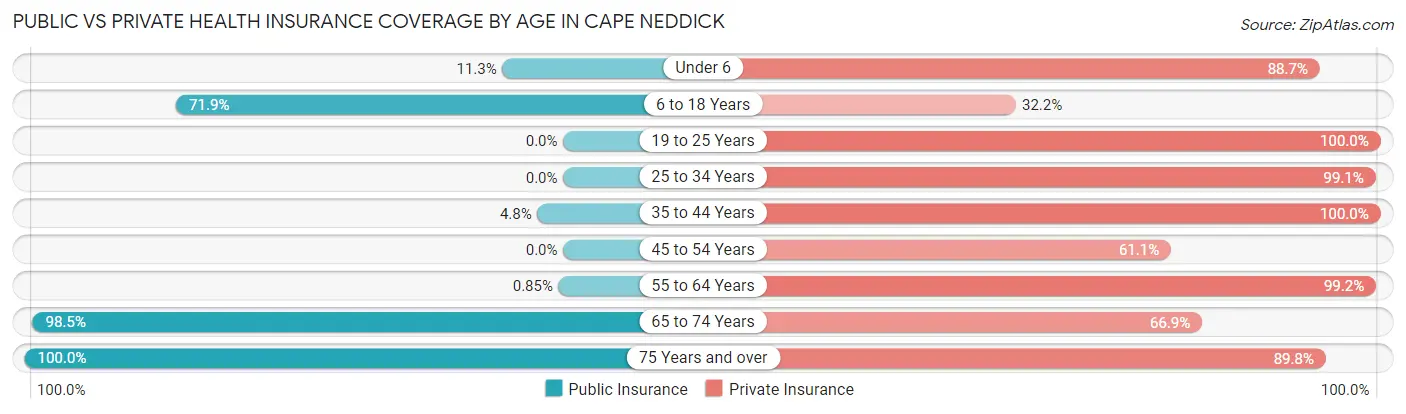
| Age Bracket | Public Insurance | Private Insurance |
| Under 6 | 14 (11.3%) | 110 (88.7%) |
| 6 to 18 Years | 143 (71.9%) | 64 (32.2%) |
| 19 to 25 Years | 0 (0.0%) | 10 (100.0%) |
| 25 to 34 Years | 0 (0.0%) | 218 (99.1%) |
| 35 to 44 Years | 8 (4.8%) | 167 (100.0%) |
| 45 to 54 Years | 0 (0.0%) | 77 (61.1%) |
| 55 to 64 Years | 4 (0.9%) | 466 (99.2%) |
| 65 to 74 Years | 800 (98.5%) | 543 (66.9%) |
| 75 Years and over | 334 (100.0%) | 300 (89.8%) |
| Total | 1,303 (52.9%) | 1,955 (79.4%) |
Disability Status by Sex by Age in Cape Neddick
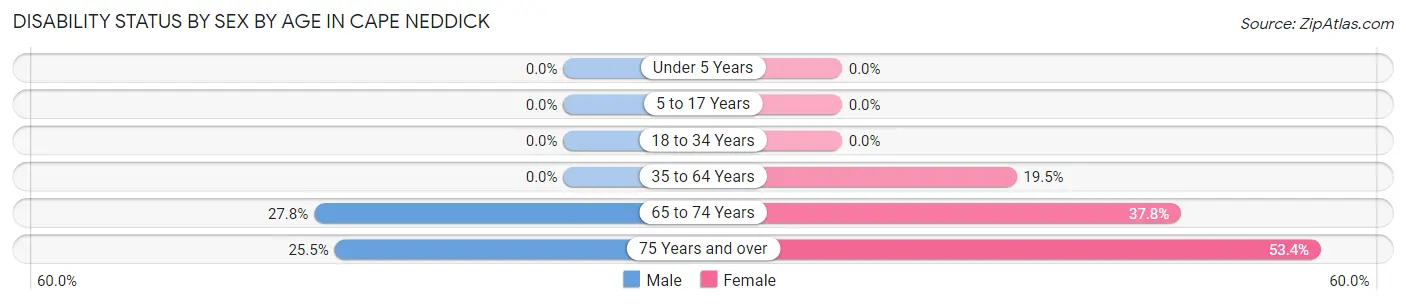
| Age Bracket | Male | Female |
| Under 5 Years | 0 (0.0%) | 0 (0.0%) |
| 5 to 17 Years | 0 (0.0%) | 0 (0.0%) |
| 18 to 34 Years | 0 (0.0%) | 0 (0.0%) |
| 35 to 64 Years | 0 (0.0%) | 64 (19.5%) |
| 65 to 74 Years | 88 (27.8%) | 187 (37.8%) |
| 75 Years and over | 13 (25.5%) | 151 (53.4%) |
Disability Class by Sex by Age in Cape Neddick
Disability Class: Hearing Difficulty
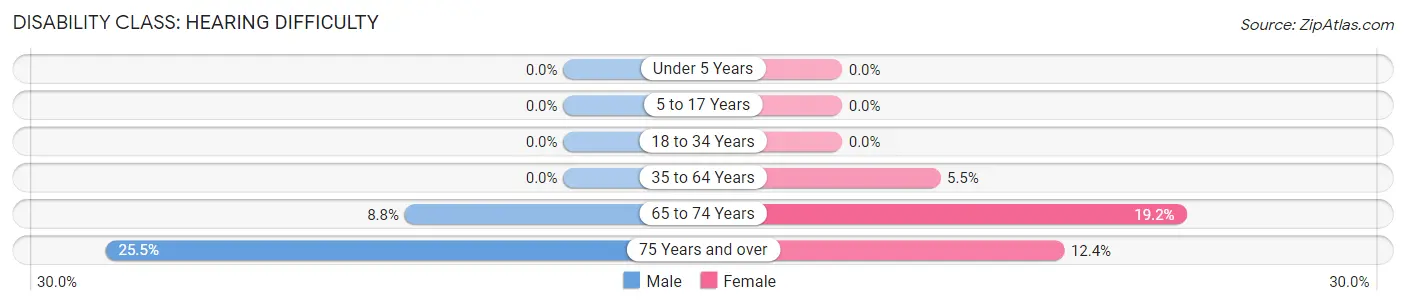
| Age Bracket | Male | Female |
| Under 5 Years | 0 (0.0%) | 0 (0.0%) |
| 5 to 17 Years | 0 (0.0%) | 0 (0.0%) |
| 18 to 34 Years | 0 (0.0%) | 0 (0.0%) |
| 35 to 64 Years | 0 (0.0%) | 18 (5.5%) |
| 65 to 74 Years | 28 (8.8%) | 95 (19.2%) |
| 75 Years and over | 13 (25.5%) | 35 (12.4%) |
Disability Class: Vision Difficulty
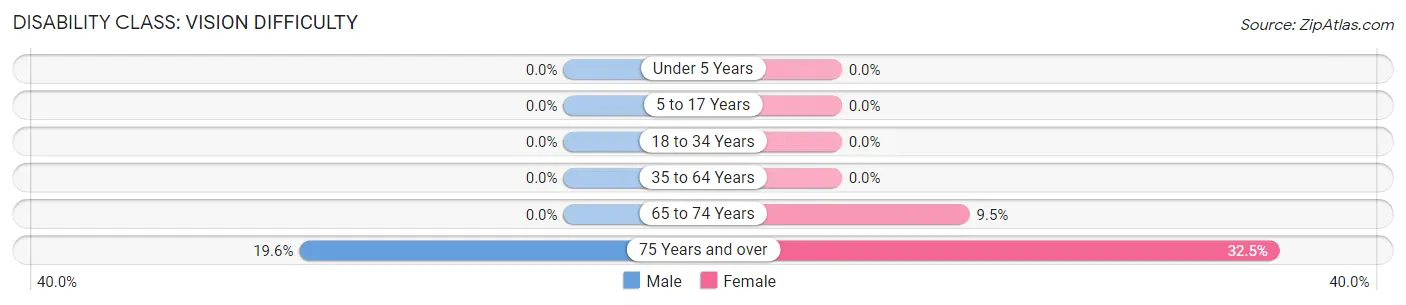
| Age Bracket | Male | Female |
| Under 5 Years | 0 (0.0%) | 0 (0.0%) |
| 5 to 17 Years | 0 (0.0%) | 0 (0.0%) |
| 18 to 34 Years | 0 (0.0%) | 0 (0.0%) |
| 35 to 64 Years | 0 (0.0%) | 0 (0.0%) |
| 65 to 74 Years | 0 (0.0%) | 47 (9.5%) |
| 75 Years and over | 10 (19.6%) | 92 (32.5%) |
Disability Class: Cognitive Difficulty
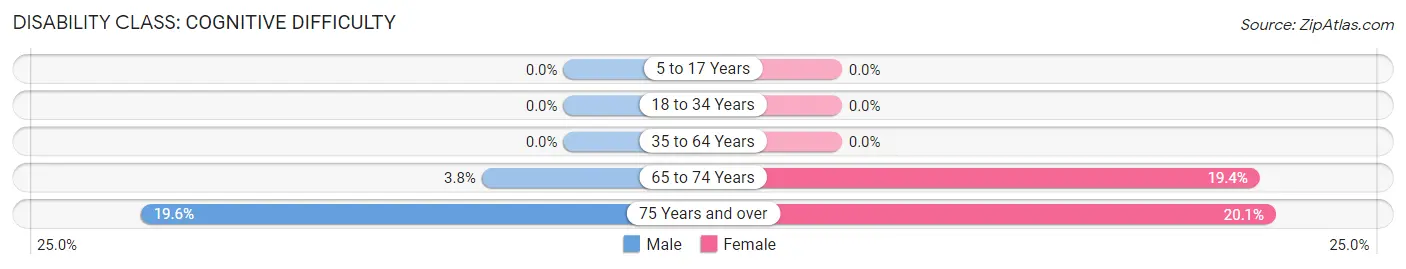
| Age Bracket | Male | Female |
| 5 to 17 Years | 0 (0.0%) | 0 (0.0%) |
| 18 to 34 Years | 0 (0.0%) | 0 (0.0%) |
| 35 to 64 Years | 0 (0.0%) | 0 (0.0%) |
| 65 to 74 Years | 12 (3.8%) | 96 (19.4%) |
| 75 Years and over | 10 (19.6%) | 57 (20.1%) |
Disability Class: Ambulatory Difficulty
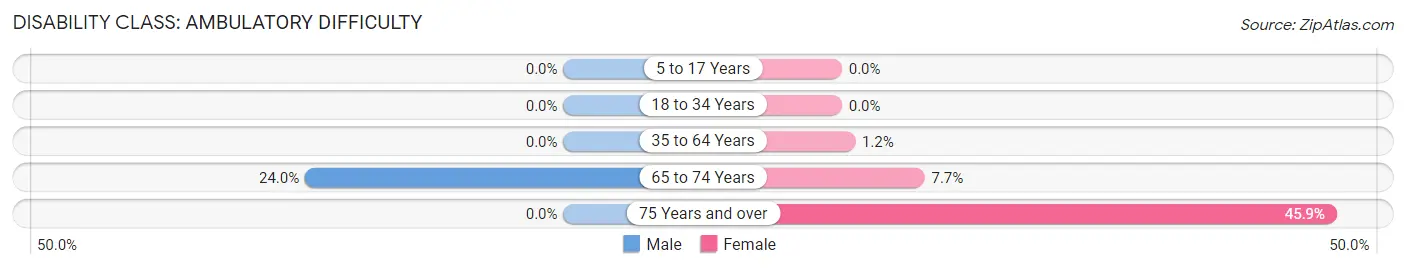
| Age Bracket | Male | Female |
| 5 to 17 Years | 0 (0.0%) | 0 (0.0%) |
| 18 to 34 Years | 0 (0.0%) | 0 (0.0%) |
| 35 to 64 Years | 0 (0.0%) | 4 (1.2%) |
| 65 to 74 Years | 76 (24.0%) | 38 (7.7%) |
| 75 Years and over | 0 (0.0%) | 130 (45.9%) |
Disability Class: Self-Care Difficulty
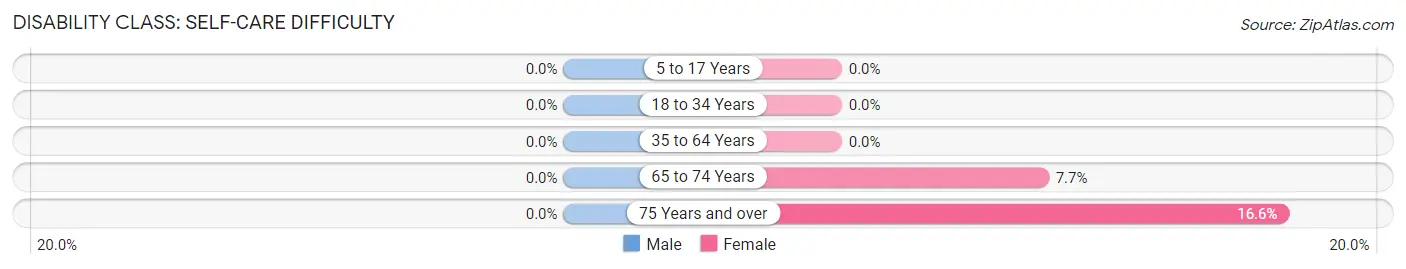
| Age Bracket | Male | Female |
| 5 to 17 Years | 0 (0.0%) | 0 (0.0%) |
| 18 to 34 Years | 0 (0.0%) | 0 (0.0%) |
| 35 to 64 Years | 0 (0.0%) | 0 (0.0%) |
| 65 to 74 Years | 0 (0.0%) | 38 (7.7%) |
| 75 Years and over | 0 (0.0%) | 47 (16.6%) |
Technology Access in Cape Neddick
Computing Device Access in Cape Neddick
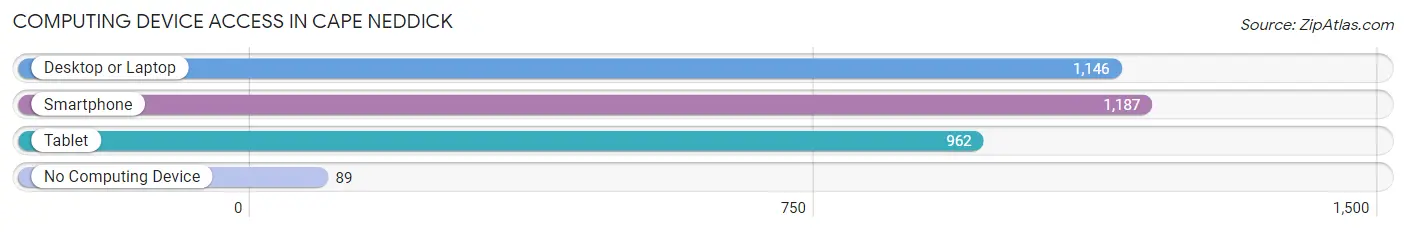
| Device Type | # Households | % Households |
| Desktop or Laptop | 1,146 | 86.8% |
| Smartphone | 1,187 | 89.9% |
| Tablet | 962 | 72.8% |
| No Computing Device | 89 | 6.7% |
| Total | 1,321 | 100.0% |
Internet Access in Cape Neddick
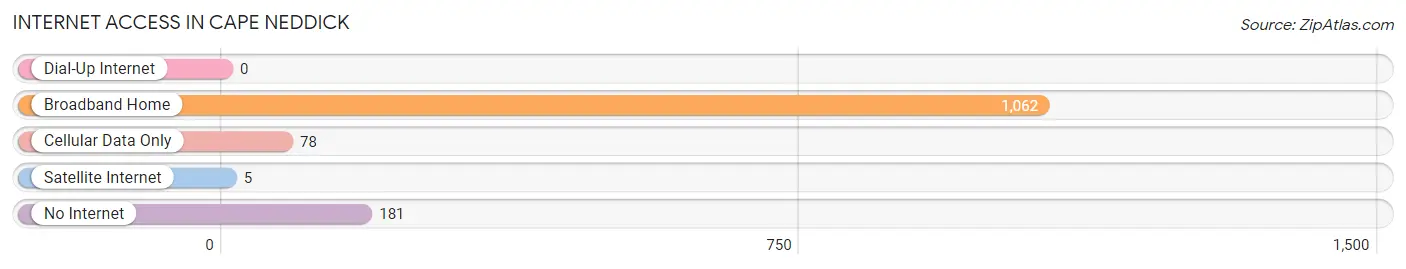
| Internet Type | # Households | % Households |
| Dial-Up Internet | 0 | 0.0% |
| Broadband Home | 1,062 | 80.4% |
| Cellular Data Only | 78 | 5.9% |
| Satellite Internet | 5 | 0.4% |
| No Internet | 181 | 13.7% |
| Total | 1,321 | 100.0% |
Cape Neddick Summary
Cape Neddick is a small town located in York County, Maine, United States. It is situated on the Atlantic Ocean, just south of the town of York. The population of Cape Neddick was 1,717 at the 2010 census.
History
The area that is now Cape Neddick was first settled in the early 1700s by English settlers. The town was originally known as "Neddick's Point" after the Neddick family, who were among the first settlers. The town was incorporated in 1762 and renamed Cape Neddick in 1820.
The town was a popular summer destination for wealthy families from Boston and New York City in the late 19th and early 20th centuries. The town was home to several grand hotels, including the Cape Neddick Inn, which was built in 1883 and was one of the most luxurious hotels in the area.
Geography
Cape Neddick is located at 43°10'N 70°37'W (43.17, -70.62). The town is situated on the Atlantic Ocean, just south of the town of York. The town is bordered by the towns of York to the north, Ogunquit to the south, and Wells to the west.
The town has a total area of 8.2 square miles, of which 7.9 square miles is land and 0.3 square miles is water. The town is located on a peninsula, with the Atlantic Ocean to the east and the York River to the west.
Economy
The economy of Cape Neddick is largely based on tourism. The town is a popular summer destination for visitors from all over the world. The town is home to several hotels, restaurants, and shops. The town is also home to several art galleries and museums, including the Cape Neddick Light Museum.
The town is also home to several businesses, including a lobster processing plant, a boatyard, and a marina. The town is also home to several small businesses, including a bakery, a grocery store, and a hardware store.
Demographics
As of the 2010 census, there were 1,717 people, 745 households, and 486 families residing in the town. The population density was 217.3 people per square mile. There were 845 housing units at an average density of 106.7 per square mile.
The racial makeup of the town was 97.2% White, 0.5% African American, 0.2% Native American, 0.6% Asian, 0.1% Pacific Islander, 0.3% from other races, and 1.1% from two or more races. Hispanic or Latino of any race were 1.2% of the population.
There were 745 households, out of which 24.3% had children under the age of 18 living with them, 51.2% were married couples living together, 9.2% had a female householder with no husband present, and 35.3% were non-families. 28.7% of all households were made up of individuals, and 11.2% had someone living alone who was 65 years of age or older. The average household size was 2.30 and the average family size was 2.81.
In the town, the population was spread out, with 20.2% under the age of 18, 5.7% from 18 to 24, 24.2% from 25 to 44, 32.2% from 45 to 64, and 17.7% who were 65 years of age or older. The median age was 44 years. For every 100 females, there were 95.2 males. For every 100 females age 18 and over, there were 92.2 males.
The median income for a household in the town was $45,000, and the median income for a family was $54,375. Males had a median income of $40,000 versus $30,000 for females. The per capita income for the town was $25,945. About 5.2% of families and 8.2% of the population were below the poverty line, including 10.2% of those under age 18 and 5.2% of those age 65 or over.
Common Questions
What is the Total Population of Cape Neddick?
Total Population of Cape Neddick is 2,462.
What is the Total Male Population of Cape Neddick?
Total Male Population of Cape Neddick is 1,149.
What is the Total Female Population of Cape Neddick?
Total Female Population of Cape Neddick is 1,313.
What is the Ratio of Males per 100 Females in Cape Neddick?
There are 87.51 Males per 100 Females in Cape Neddick.
What is the Ratio of Females per 100 Males in Cape Neddick?
There are 114.27 Females per 100 Males in Cape Neddick.
What is the Median Population Age in Cape Neddick?
Median Population Age in Cape Neddick is 63.7 Years.
What is the Average Family Size in Cape Neddick
Average Family Size in Cape Neddick is 2.5 People.
What is the Average Household Size in Cape Neddick
Average Household Size in Cape Neddick is 1.9 People.
What is Per Capita Income in Cape Neddick?
Per Capita income in Cape Neddick is $48,860.
What is the Median Family Income in Cape Neddick?
Median Family Income in Cape Neddick is $123,709.
What is the Median Household income in Cape Neddick?
Median Household Income in Cape Neddick is $76,701.
What is Income or Wage Gap in Cape Neddick?
Income or Wage Gap in Cape Neddick is 41.3%.
Women in Cape Neddick earn 58.7 cents for every dollar earned by a man.
What is Inequality or Gini Index in Cape Neddick?
Inequality or Gini Index in Cape Neddick is 0.41.
How Large is the Labor Force in Cape Neddick?
There are 944 People in the Labor Forcein in Cape Neddick.
What is the Percentage of People in the Labor Force in Cape Neddick?
43.2% of People are in the Labor Force in Cape Neddick.
What is the Unemployment Rate in Cape Neddick?
Unemployment Rate in Cape Neddick is 6.0%.