Knox County, ME
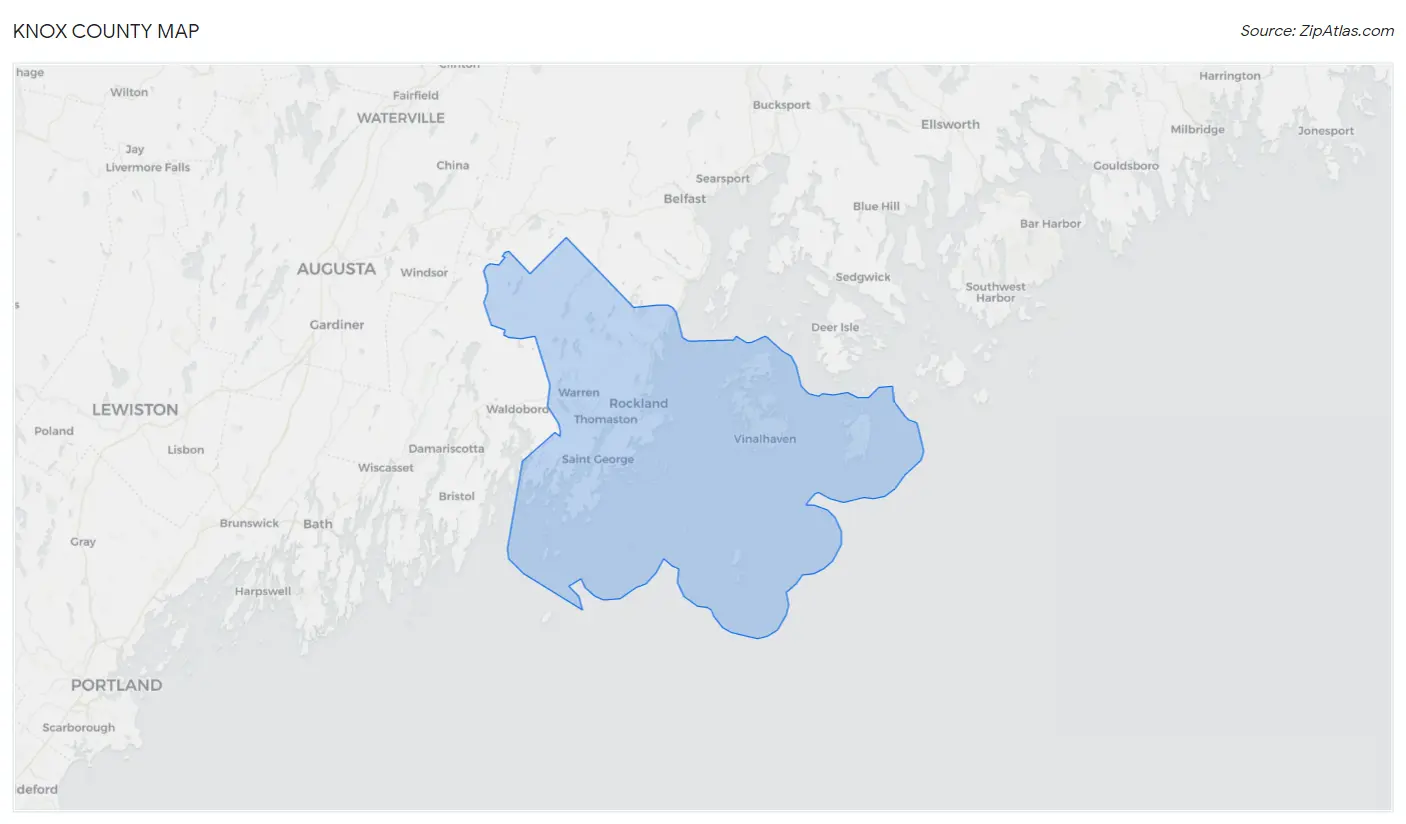
Knox County Map
Knox County Overview
40,729
TOTAL POPULATION
20,526
MALE POPULATION
20,203
FEMALE POPULATION
101.60
MALES / 100 FEMALES
98.43
FEMALES / 100 MALES
49.0
MEDIAN AGE
2.8
AVG FAMILY SIZE
2.2
AVG HOUSEHOLD SIZE
$39,379
PER CAPITA INCOME
$87,745
AVG FAMILY INCOME
$68,904
AVG HOUSEHOLD INCOME
30.7%
WAGE / INCOME GAP [ % ]
69.3¢/ $1
WAGE / INCOME GAP [ $ ]
0.44
INEQUALITY / GINI INDEX
20,224
LABOR FORCE [ PEOPLE ]
58.1%
PERCENT IN LABOR FORCE
3.8%
UNEMPLOYMENT RATE
Knox County Area Codes
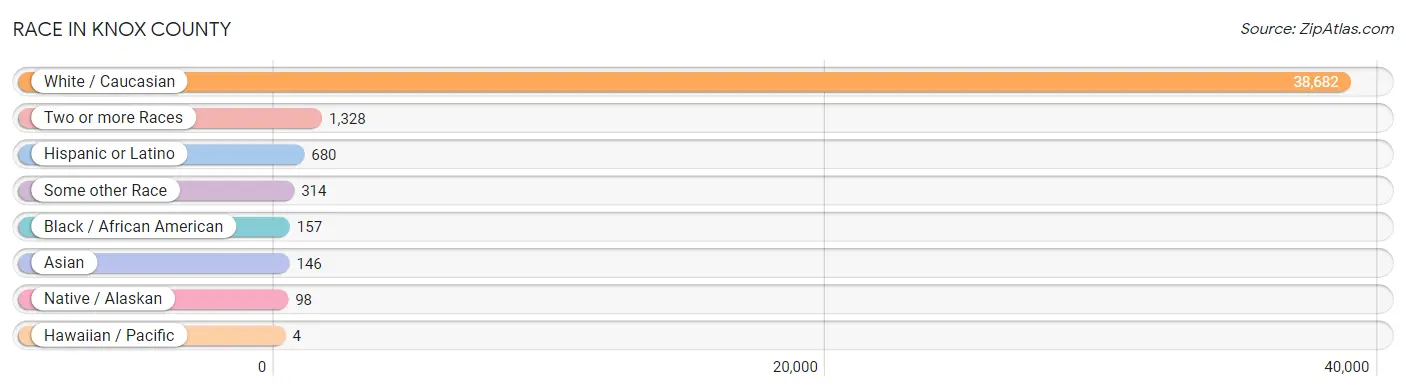
Race in Knox County
The most populous races in Knox County are White / Caucasian (38,682 | 95.0%), Two or more Races (1,328 | 3.3%), and Hispanic or Latino (680 | 1.7%).
| Race | # Population | % Population |
| Asian | 146 | 0.4% |
| Black / African American | 157 | 0.4% |
| Hawaiian / Pacific | 4 | 0.0% |
| Hispanic or Latino | 680 | 1.7% |
| Native / Alaskan | 98 | 0.2% |
| White / Caucasian | 38,682 | 95.0% |
| Two or more Races | 1,328 | 3.3% |
| Some other Race | 314 | 0.8% |
| Total | 40,729 | 100.0% |
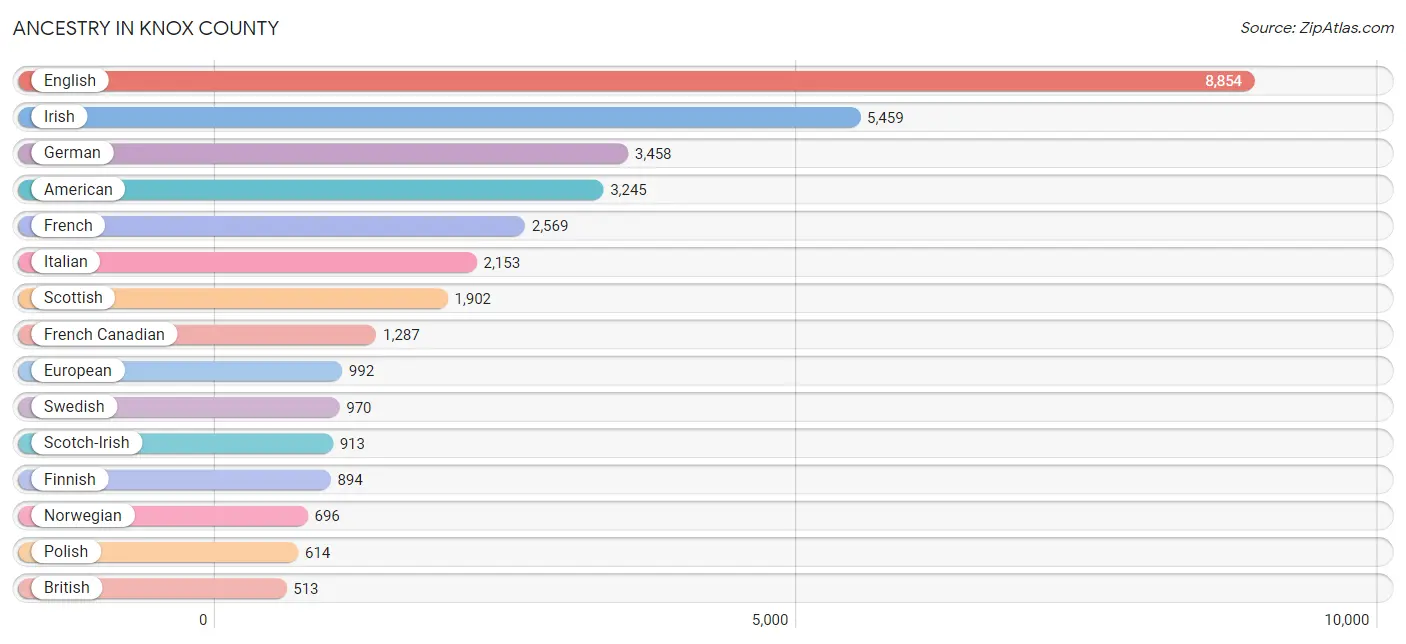
Ancestry in Knox County
The most populous ancestries reported in Knox County are English (8,854 | 21.7%), Irish (5,459 | 13.4%), German (3,458 | 8.5%), American (3,245 | 8.0%), and French (2,569 | 6.3%), together accounting for 57.9% of all Knox County residents.
| Ancestry | # Population | % Population |
| African | 13 | 0.0% |
| American | 3,245 | 8.0% |
| Arab | 124 | 0.3% |
| Armenian | 123 | 0.3% |
| Assyrian / Chaldean / Syriac | 18 | 0.0% |
| Australian | 27 | 0.1% |
| Austrian | 135 | 0.3% |
| Belgian | 48 | 0.1% |
| Bhutanese | 72 | 0.2% |
| Blackfeet | 11 | 0.0% |
| British | 513 | 1.3% |
| Bulgarian | 1 | 0.0% |
| Burmese | 19 | 0.1% |
| Canadian | 400 | 1.0% |
| Cape Verdean | 3 | 0.0% |
| Central American | 54 | 0.1% |
| Central American Indian | 1 | 0.0% |
| Cherokee | 44 | 0.1% |
| Chickasaw | 37 | 0.1% |
| Chippewa | 10 | 0.0% |
| Colombian | 18 | 0.0% |
| Costa Rican | 4 | 0.0% |
| Cuban | 50 | 0.1% |
| Czech | 91 | 0.2% |
| Czechoslovakian | 82 | 0.2% |
| Danish | 134 | 0.3% |
| Dominican | 19 | 0.1% |
| Dutch | 498 | 1.2% |
| Eastern European | 209 | 0.5% |
| Egyptian | 2 | 0.0% |
| English | 8,854 | 21.7% |
| Estonian | 4 | 0.0% |
| Ethiopian | 5 | 0.0% |
| European | 992 | 2.4% |
| Filipino | 42 | 0.1% |
| Finnish | 894 | 2.2% |
| French | 2,569 | 6.3% |
| French Canadian | 1,287 | 3.2% |
| German | 3,458 | 8.5% |
| Greek | 235 | 0.6% |
| Guamanian / Chamorro | 11 | 0.0% |
| Guatemalan | 20 | 0.1% |
| Hungarian | 80 | 0.2% |
| Indian (Asian) | 120 | 0.3% |
| Iranian | 15 | 0.0% |
| Iraqi | 7 | 0.0% |
| Irish | 5,459 | 13.4% |
| Iroquois | 3 | 0.0% |
| Israeli | 23 | 0.1% |
| Italian | 2,153 | 5.3% |
| Jamaican | 19 | 0.1% |
| Japanese | 12 | 0.0% |
| Jordanian | 7 | 0.0% |
| Korean | 28 | 0.1% |
| Laotian | 16 | 0.0% |
| Latvian | 11 | 0.0% |
| Lebanese | 83 | 0.2% |
| Lithuanian | 44 | 0.1% |
| Lumbee | 6 | 0.0% |
| Mexican | 188 | 0.5% |
| Mexican American Indian | 1 | 0.0% |
| Native Hawaiian | 16 | 0.0% |
| New Zealander | 4 | 0.0% |
| Nicaraguan | 4 | 0.0% |
| Nigerian | 7 | 0.0% |
| Northern European | 249 | 0.6% |
| Norwegian | 696 | 1.7% |
| Pakistani | 43 | 0.1% |
| Pennsylvania German | 4 | 0.0% |
| Peruvian | 213 | 0.5% |
| Polish | 614 | 1.5% |
| Portuguese | 379 | 0.9% |
| Puerto Rican | 68 | 0.2% |
| Romanian | 47 | 0.1% |
| Russian | 291 | 0.7% |
| Salvadoran | 26 | 0.1% |
| Samoan | 5 | 0.0% |
| Scandinavian | 154 | 0.4% |
| Scotch-Irish | 913 | 2.2% |
| Scottish | 1,902 | 4.7% |
| Slavic | 20 | 0.1% |
| Slovak | 116 | 0.3% |
| South African | 5 | 0.0% |
| South American | 239 | 0.6% |
| Spanish | 20 | 0.1% |
| Sri Lankan | 40 | 0.1% |
| Subsaharan African | 38 | 0.1% |
| Swedish | 970 | 2.4% |
| Swiss | 36 | 0.1% |
| Syrian | 10 | 0.0% |
| Thai | 10 | 0.0% |
| Turkish | 12 | 0.0% |
| U.S. Virgin Islander | 6 | 0.0% |
| Ukrainian | 64 | 0.2% |
| Venezuelan | 8 | 0.0% |
| Welsh | 458 | 1.1% |
| West Indian | 9 | 0.0% | View All 97 Rows |
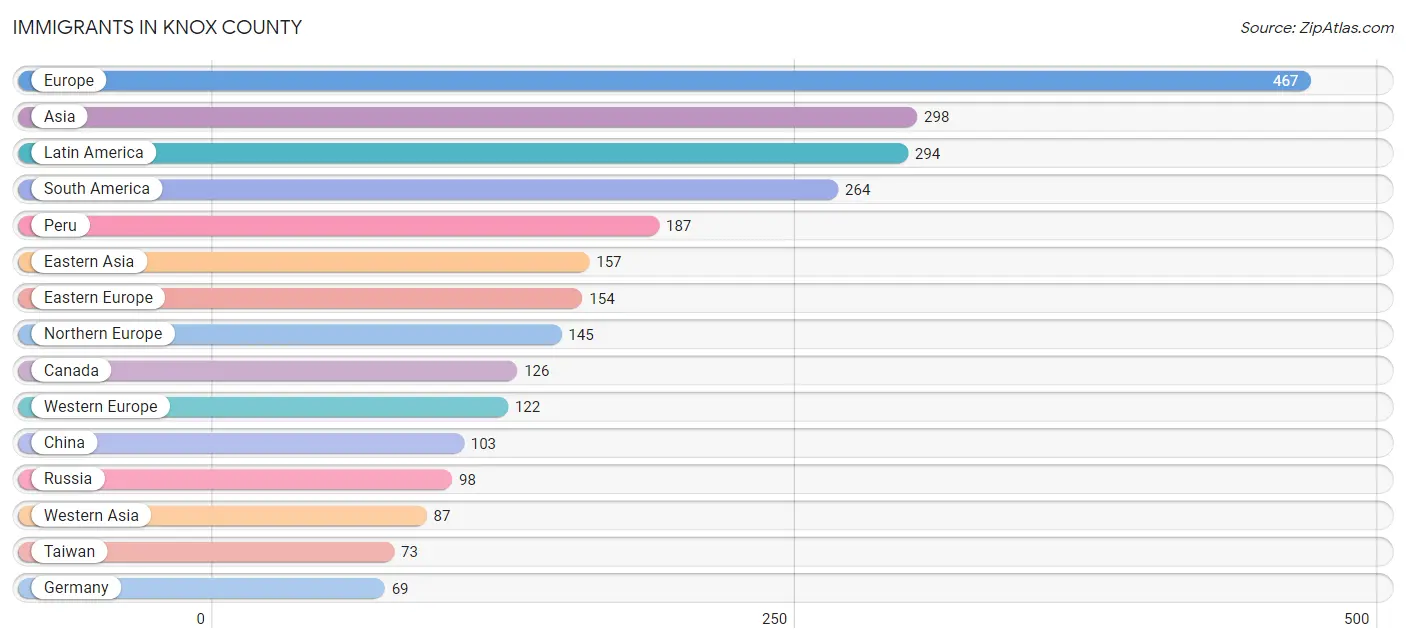
Immigrants in Knox County
The most numerous immigrant groups reported in Knox County came from Europe (467 | 1.1%), Asia (298 | 0.7%), Latin America (294 | 0.7%), South America (264 | 0.6%), and Peru (187 | 0.5%), together accounting for 3.7% of all Knox County residents.
| Immigration Origin | # Population | % Population |
| Africa | 17 | 0.0% |
| Asia | 298 | 0.7% |
| Australia | 30 | 0.1% |
| Austria | 3 | 0.0% |
| Azores | 11 | 0.0% |
| Belgium | 7 | 0.0% |
| Brazil | 8 | 0.0% |
| Bulgaria | 1 | 0.0% |
| Canada | 126 | 0.3% |
| Caribbean | 8 | 0.0% |
| Central America | 22 | 0.1% |
| Chile | 55 | 0.1% |
| China | 103 | 0.3% |
| Colombia | 6 | 0.0% |
| Czechoslovakia | 29 | 0.1% |
| Denmark | 3 | 0.0% |
| Eastern Africa | 5 | 0.0% |
| Eastern Asia | 157 | 0.4% |
| Eastern Europe | 154 | 0.4% |
| Egypt | 1 | 0.0% |
| El Salvador | 9 | 0.0% |
| England | 54 | 0.1% |
| Ethiopia | 5 | 0.0% |
| Europe | 467 | 1.1% |
| France | 8 | 0.0% |
| Germany | 69 | 0.2% |
| Guatemala | 13 | 0.0% |
| Iraq | 30 | 0.1% |
| Italy | 35 | 0.1% |
| Jamaica | 8 | 0.0% |
| Japan | 51 | 0.1% |
| Jordan | 7 | 0.0% |
| Korea | 3 | 0.0% |
| Latin America | 294 | 0.7% |
| Latvia | 2 | 0.0% |
| Lithuania | 6 | 0.0% |
| Netherlands | 28 | 0.1% |
| Nigeria | 4 | 0.0% |
| Northern Africa | 1 | 0.0% |
| Northern Europe | 145 | 0.4% |
| Oceania | 30 | 0.1% |
| Peru | 187 | 0.5% |
| Portugal | 11 | 0.0% |
| Russia | 98 | 0.2% |
| Scotland | 54 | 0.1% |
| South Africa | 4 | 0.0% |
| South America | 264 | 0.6% |
| South Central Asia | 3 | 0.0% |
| South Eastern Asia | 51 | 0.1% |
| Southern Europe | 46 | 0.1% |
| Sweden | 2 | 0.0% |
| Switzerland | 7 | 0.0% |
| Syria | 50 | 0.1% |
| Taiwan | 73 | 0.2% |
| Thailand | 37 | 0.1% |
| Ukraine | 14 | 0.0% |
| Uzbekistan | 3 | 0.0% |
| Venezuela | 8 | 0.0% |
| Vietnam | 14 | 0.0% |
| Western Africa | 4 | 0.0% |
| Western Asia | 87 | 0.2% |
| Western Europe | 122 | 0.3% | View All 62 Rows |
Sex and Age in Knox County
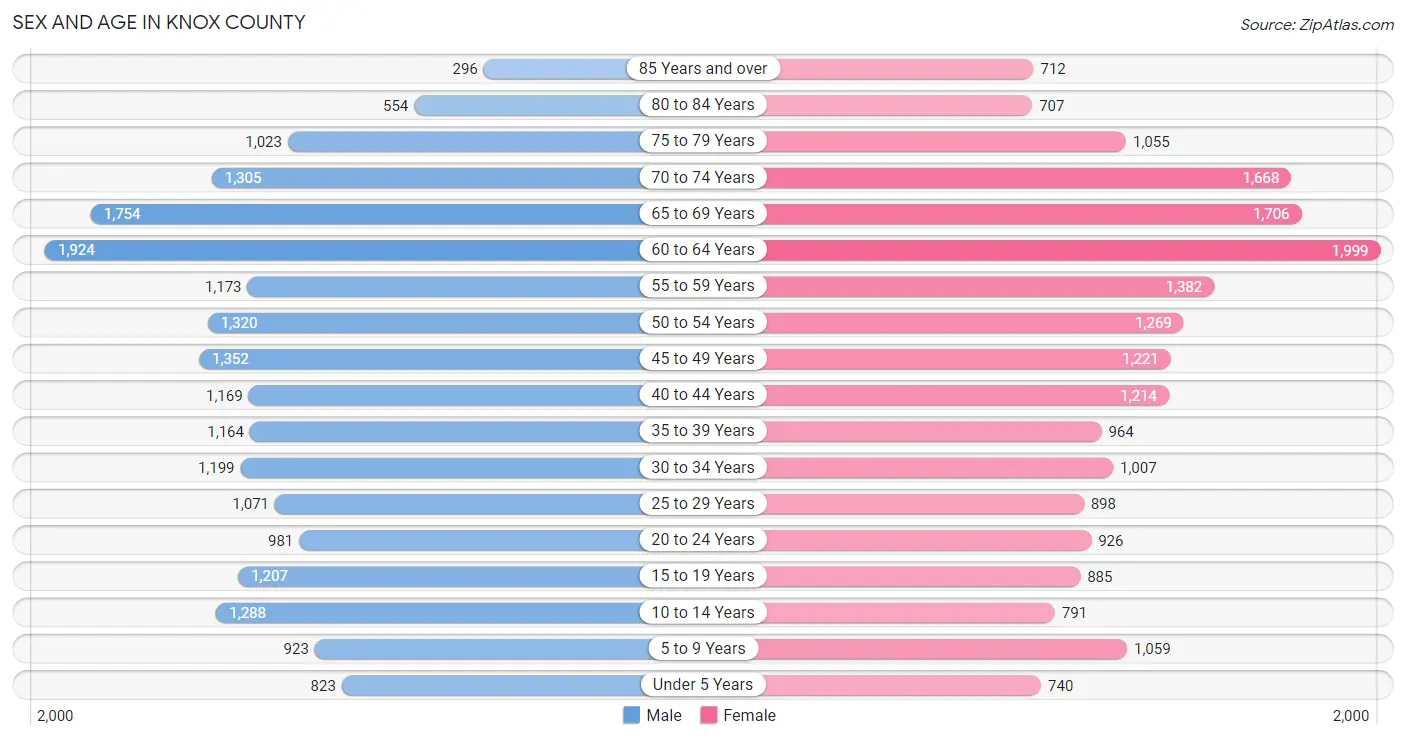
Sex and Age in Knox County
The most populous age groups in Knox County are 60 to 64 Years (1,924 | 9.4%) for men and 60 to 64 Years (1,999 | 9.9%) for women.
| Age Bracket | Male | Female |
| Under 5 Years | 823 (4.0%) | 740 (3.7%) |
| 5 to 9 Years | 923 (4.5%) | 1,059 (5.2%) |
| 10 to 14 Years | 1,288 (6.3%) | 791 (3.9%) |
| 15 to 19 Years | 1,207 (5.9%) | 885 (4.4%) |
| 20 to 24 Years | 981 (4.8%) | 926 (4.6%) |
| 25 to 29 Years | 1,071 (5.2%) | 898 (4.4%) |
| 30 to 34 Years | 1,199 (5.8%) | 1,007 (5.0%) |
| 35 to 39 Years | 1,164 (5.7%) | 964 (4.8%) |
| 40 to 44 Years | 1,169 (5.7%) | 1,214 (6.0%) |
| 45 to 49 Years | 1,352 (6.6%) | 1,221 (6.0%) |
| 50 to 54 Years | 1,320 (6.4%) | 1,269 (6.3%) |
| 55 to 59 Years | 1,173 (5.7%) | 1,382 (6.8%) |
| 60 to 64 Years | 1,924 (9.4%) | 1,999 (9.9%) |
| 65 to 69 Years | 1,754 (8.6%) | 1,706 (8.4%) |
| 70 to 74 Years | 1,305 (6.4%) | 1,668 (8.3%) |
| 75 to 79 Years | 1,023 (5.0%) | 1,055 (5.2%) |
| 80 to 84 Years | 554 (2.7%) | 707 (3.5%) |
| 85 Years and over | 296 (1.4%) | 712 (3.5%) |
| Total | 20,526 (100.0%) | 20,203 (100.0%) |
Families and Households in Knox County
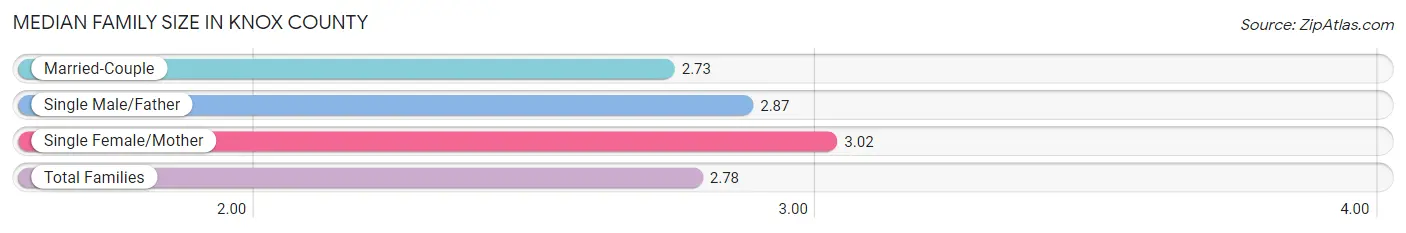
Median Family Size in Knox County
The median family size in Knox County is 2.78 persons per family, with single female/mother families (1,425 | 13.7%) accounting for the largest median family size of 3.02 persons per family. On the other hand, married-couple families (8,480 | 81.3%) represent the smallest median family size with 2.73 persons per family.
| Family Type | # Families | Family Size |
| Married-Couple | 8,480 (81.3%) | 2.73 |
| Single Male/Father | 530 (5.1%) | 2.87 |
| Single Female/Mother | 1,425 (13.7%) | 3.02 |
| Total Families | 10,435 (100.0%) | 2.78 |
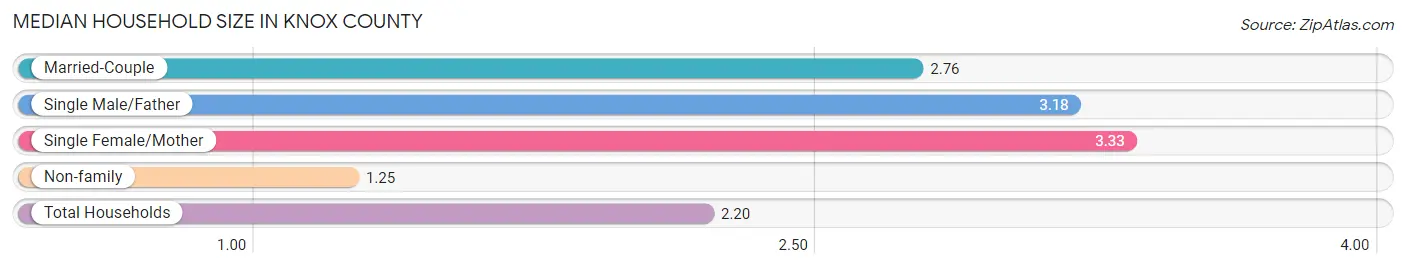
Median Household Size in Knox County
The median household size in Knox County is 2.20 persons per household, with single female/mother households (1,425 | 8.0%) accounting for the largest median household size of 3.33 persons per household. non-family households (7,345 | 41.3%) represent the smallest median household size with 1.25 persons per household.
| Household Type | # Households | Household Size |
| Married-Couple | 8,480 (47.7%) | 2.76 |
| Single Male/Father | 530 (3.0%) | 3.18 |
| Single Female/Mother | 1,425 (8.0%) | 3.33 |
| Non-family | 7,345 (41.3%) | 1.25 |
| Total Households | 17,780 (100.0%) | 2.20 |
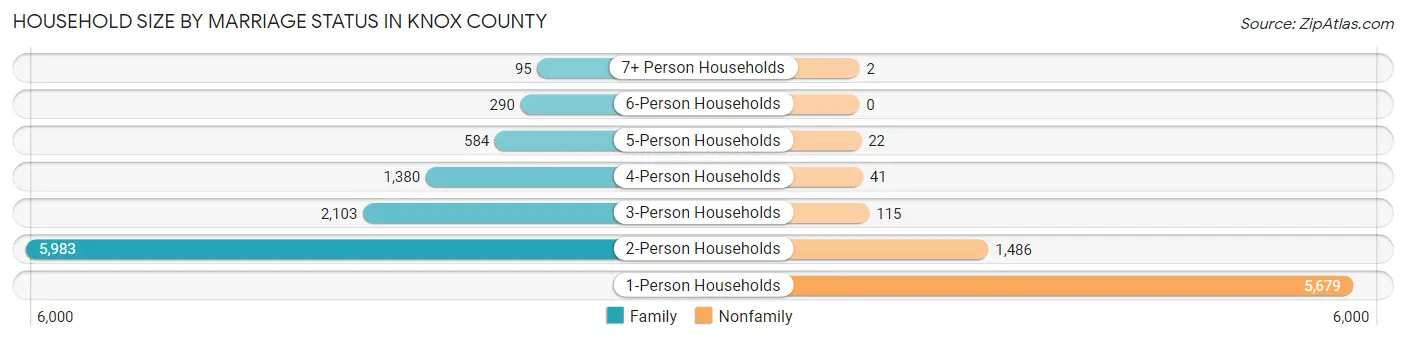
Household Size by Marriage Status in Knox County
Out of a total of 17,780 households in Knox County, 10,435 (58.7%) are family households, while 7,345 (41.3%) are nonfamily households. The most numerous type of family households are 2-person households, comprising 5,983, and the most common type of nonfamily households are 1-person households, comprising 5,679.
| Household Size | Family Households | Nonfamily Households |
| 1-Person Households | - | 5,679 (31.9%) |
| 2-Person Households | 5,983 (33.7%) | 1,486 (8.4%) |
| 3-Person Households | 2,103 (11.8%) | 115 (0.6%) |
| 4-Person Households | 1,380 (7.8%) | 41 (0.2%) |
| 5-Person Households | 584 (3.3%) | 22 (0.1%) |
| 6-Person Households | 290 (1.6%) | 0 (0.0%) |
| 7+ Person Households | 95 (0.5%) | 2 (0.0%) |
| Total | 10,435 (58.7%) | 7,345 (41.3%) |
Female Fertility in Knox County
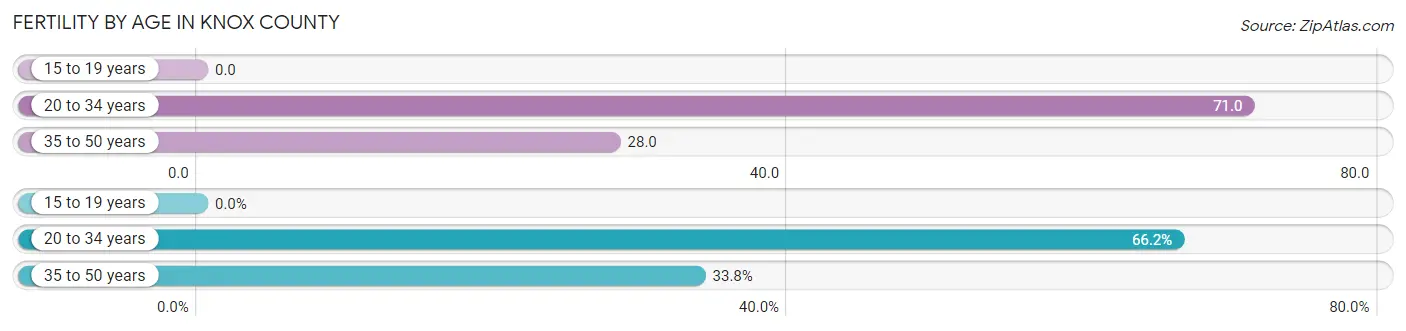
Fertility by Age in Knox County
Average fertility rate in Knox County is 41.0 births per 1,000 women. Women in the age bracket of 20 to 34 years have the highest fertility rate with 71.0 births per 1,000 women. Women in the age bracket of 20 to 34 years acount for 66.2% of all women with births.
| Age Bracket | Women with Births | Births / 1,000 Women |
| 15 to 19 years | 0 (0.0%) | 0.0 |
| 20 to 34 years | 202 (66.2%) | 71.0 |
| 35 to 50 years | 103 (33.8%) | 28.0 |
| Total | 305 (100.0%) | 41.0 |
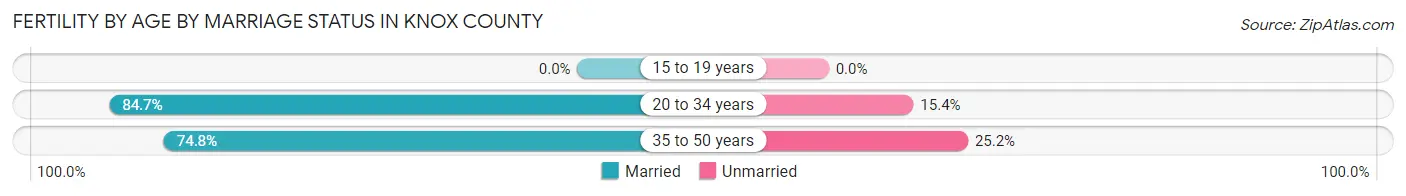
Fertility by Age by Marriage Status in Knox County
81.3% of women with births (305) in Knox County are married. The highest percentage of unmarried women with births falls into 35 to 50 years age bracket with 25.2% of them unmarried at the time of birth, while the lowest percentage of unmarried women with births belong to 20 to 34 years age bracket with 15.3% of them unmarried.
| Age Bracket | Married | Unmarried |
| 15 to 19 years | 0 (0.0%) | 0 (0.0%) |
| 20 to 34 years | 171 (84.7%) | 31 (15.3%) |
| 35 to 50 years | 77 (74.8%) | 26 (25.2%) |
| Total | 248 (81.3%) | 57 (18.7%) |
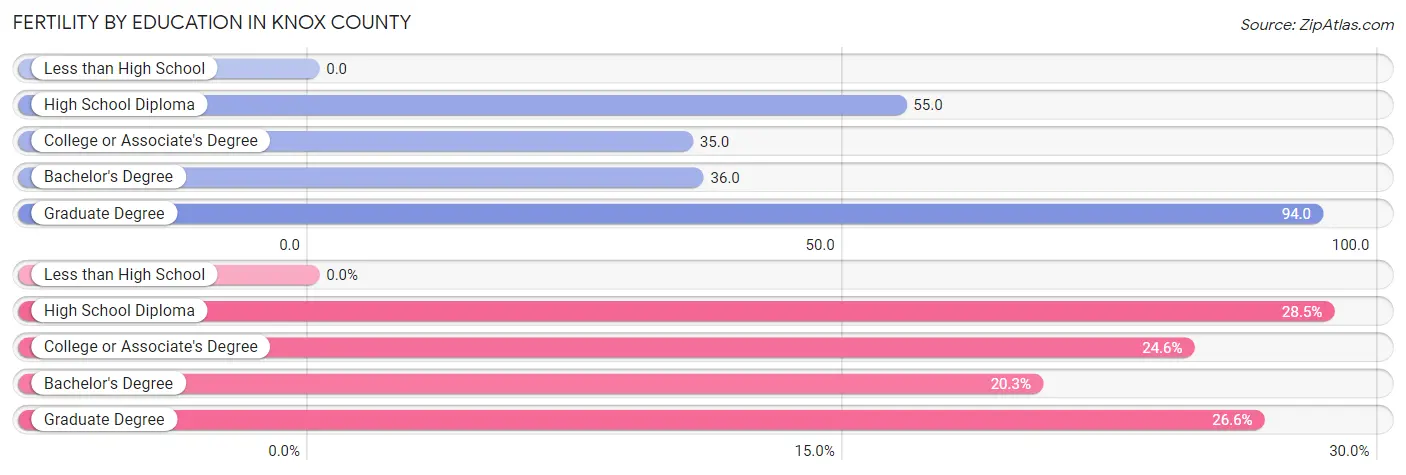
Fertility by Education in Knox County
| Educational Attainment | Women with Births | Births / 1,000 Women |
| Less than High School | 0 (0.0%) | 0.0 |
| High School Diploma | 87 (28.5%) | 55.0 |
| College or Associate's Degree | 75 (24.6%) | 35.0 |
| Bachelor's Degree | 62 (20.3%) | 36.0 |
| Graduate Degree | 81 (26.6%) | 94.0 |
| Total | 305 (100.0%) | 41.0 |
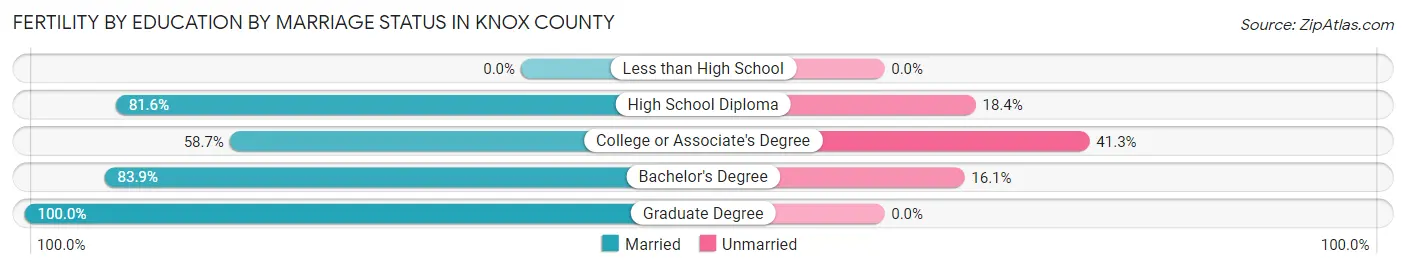
Fertility by Education by Marriage Status in Knox County
18.7% of women with births in Knox County are unmarried. Women with the educational attainment of graduate degree are most likely to be married with 100.0% of them married at childbirth, while women with the educational attainment of college or associate's degree are least likely to be married with 41.3% of them unmarried at childbirth.
| Educational Attainment | Married | Unmarried |
| Less than High School | 0 (0.0%) | 0 (0.0%) |
| High School Diploma | 71 (81.6%) | 16 (18.4%) |
| College or Associate's Degree | 44 (58.7%) | 31 (41.3%) |
| Bachelor's Degree | 52 (83.9%) | 10 (16.1%) |
| Graduate Degree | 81 (100.0%) | 0 (0.0%) |
| Total | 248 (81.3%) | 57 (18.7%) |
Income in Knox County
Income Overview in Knox County
Per Capita Income in Knox County is $39,379, while median incomes of families and households are $87,745 and $68,904 respectively.
| Characteristic | Number | Measure |
| Per Capita Income | 40,729 | $39,379 |
| Median Family Income | 10,435 | $87,745 |
| Mean Family Income | 10,435 | $108,798 |
| Median Household Income | 17,780 | $68,904 |
| Mean Household Income | 17,780 | $88,889 |
| Income Deficit | 10,435 | $0 |
| Wage / Income Gap (%) | 40,729 | 30.68% |
| Wage / Income Gap ($) | 40,729 | 69.32¢ per $1 |
| Gini / Inequality Index | 40,729 | 0.44 |
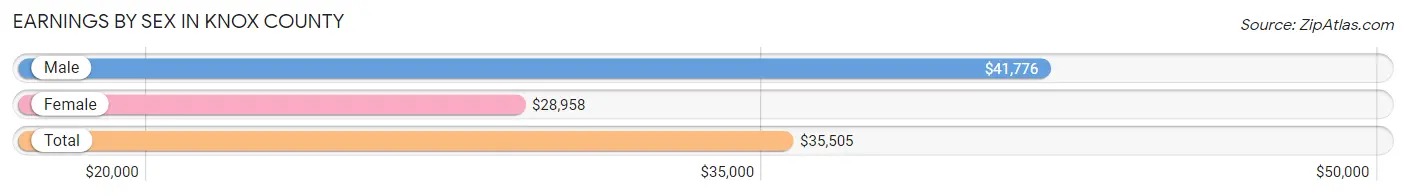
Earnings by Sex in Knox County
Average Earnings in Knox County are $35,505, $41,776 for men and $28,958 for women, a difference of 30.7%.
| Sex | Number | Average Earnings |
| Male | 11,899 (52.7%) | $41,776 |
| Female | 10,674 (47.3%) | $28,958 |
| Total | 22,573 (100.0%) | $35,505 |
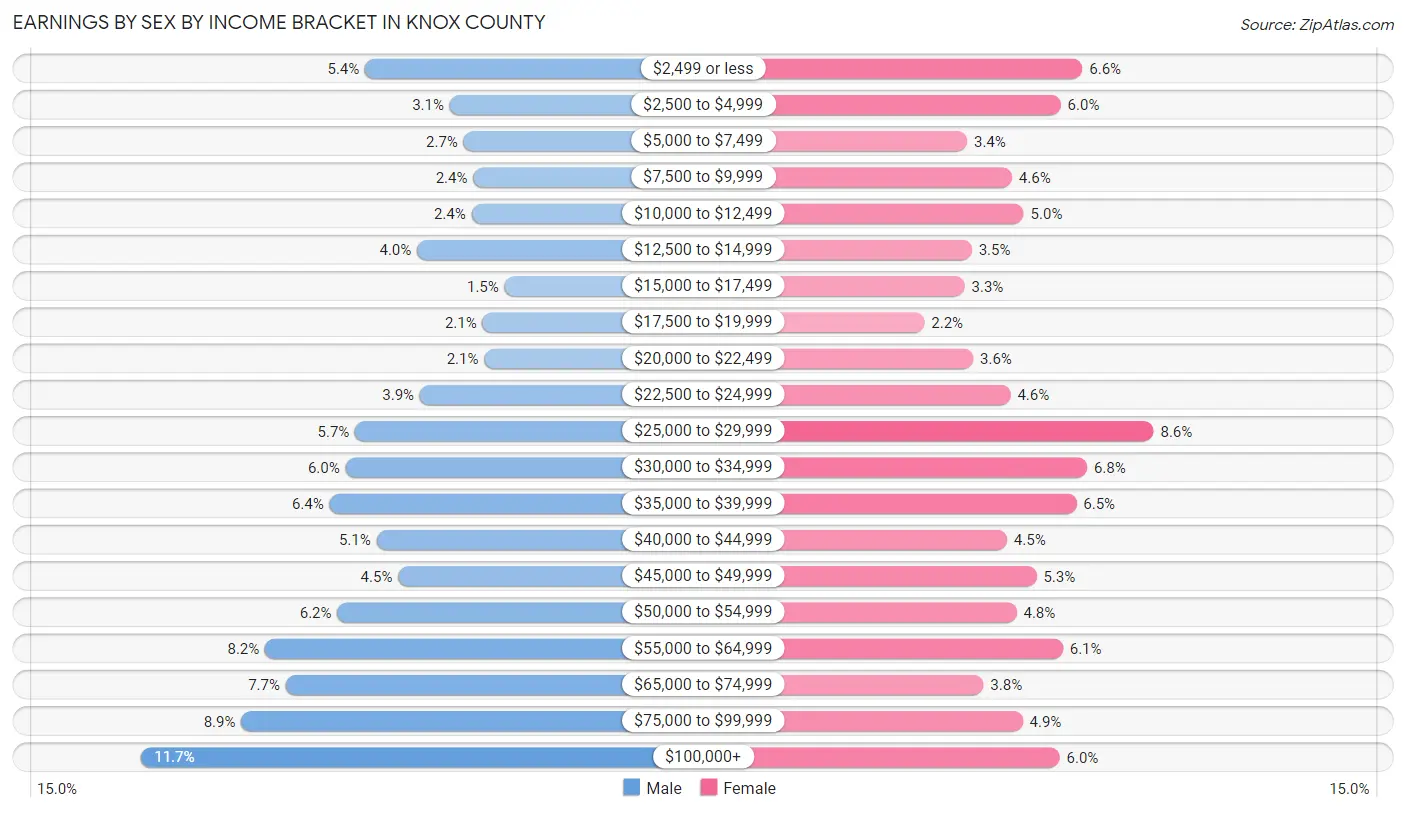
Earnings by Sex by Income Bracket in Knox County
The most common earnings brackets in Knox County are $100,000+ for men (1,394 | 11.7%) and $25,000 to $29,999 for women (920 | 8.6%).
| Income | Male | Female |
| $2,499 or less | 646 (5.4%) | 707 (6.6%) |
| $2,500 to $4,999 | 363 (3.0%) | 641 (6.0%) |
| $5,000 to $7,499 | 316 (2.7%) | 361 (3.4%) |
| $7,500 to $9,999 | 284 (2.4%) | 495 (4.6%) |
| $10,000 to $12,499 | 290 (2.4%) | 530 (5.0%) |
| $12,500 to $14,999 | 472 (4.0%) | 375 (3.5%) |
| $15,000 to $17,499 | 180 (1.5%) | 353 (3.3%) |
| $17,500 to $19,999 | 254 (2.1%) | 233 (2.2%) |
| $20,000 to $22,499 | 247 (2.1%) | 379 (3.5%) |
| $22,500 to $24,999 | 463 (3.9%) | 491 (4.6%) |
| $25,000 to $29,999 | 680 (5.7%) | 920 (8.6%) |
| $30,000 to $34,999 | 711 (6.0%) | 720 (6.8%) |
| $35,000 to $39,999 | 765 (6.4%) | 688 (6.5%) |
| $40,000 to $44,999 | 608 (5.1%) | 480 (4.5%) |
| $45,000 to $49,999 | 535 (4.5%) | 569 (5.3%) |
| $50,000 to $54,999 | 739 (6.2%) | 509 (4.8%) |
| $55,000 to $64,999 | 981 (8.2%) | 648 (6.1%) |
| $65,000 to $74,999 | 911 (7.7%) | 410 (3.8%) |
| $75,000 to $99,999 | 1,060 (8.9%) | 527 (4.9%) |
| $100,000+ | 1,394 (11.7%) | 638 (6.0%) |
| Total | 11,899 (100.0%) | 10,674 (100.0%) |
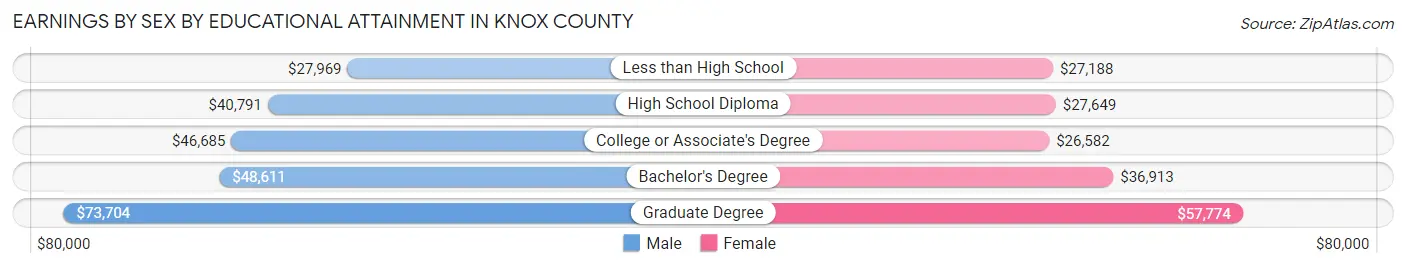
Earnings by Sex by Educational Attainment in Knox County
Average earnings in Knox County are $46,320 for men and $32,815 for women, a difference of 29.2%. Men with an educational attainment of graduate degree enjoy the highest average annual earnings of $73,704, while those with less than high school education earn the least with $27,969. Women with an educational attainment of graduate degree earn the most with the average annual earnings of $57,774, while those with college or associate's degree education have the smallest earnings of $26,582.
| Educational Attainment | Male Income | Female Income |
| Less than High School | $27,969 | $27,188 |
| High School Diploma | $40,791 | $27,649 |
| College or Associate's Degree | $46,685 | $26,582 |
| Bachelor's Degree | $48,611 | $36,913 |
| Graduate Degree | $73,704 | $57,774 |
| Total | $46,320 | $32,815 |
Family Income in Knox County
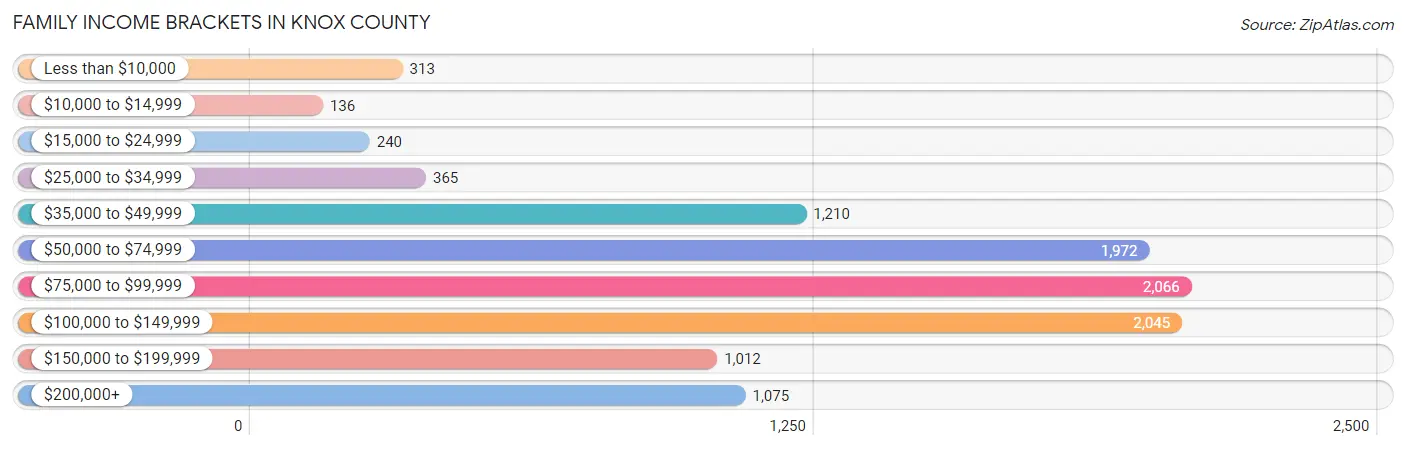
Family Income Brackets in Knox County
According to the Knox County family income data, there are 2,066 families falling into the $75,000 to $99,999 income range, which is the most common income bracket and makes up 19.8% of all families. Conversely, the $10,000 to $14,999 income bracket is the least frequent group with only 136 families (1.3%) belonging to this category.
| Income Bracket | # Families | % Families |
| Less than $10,000 | 313 | 3.0% |
| $10,000 to $14,999 | 136 | 1.3% |
| $15,000 to $24,999 | 240 | 2.3% |
| $25,000 to $34,999 | 365 | 3.5% |
| $35,000 to $49,999 | 1,210 | 11.6% |
| $50,000 to $74,999 | 1,972 | 18.9% |
| $75,000 to $99,999 | 2,066 | 19.8% |
| $100,000 to $149,999 | 2,045 | 19.6% |
| $150,000 to $199,999 | 1,012 | 9.7% |
| $200,000+ | 1,075 | 10.3% |
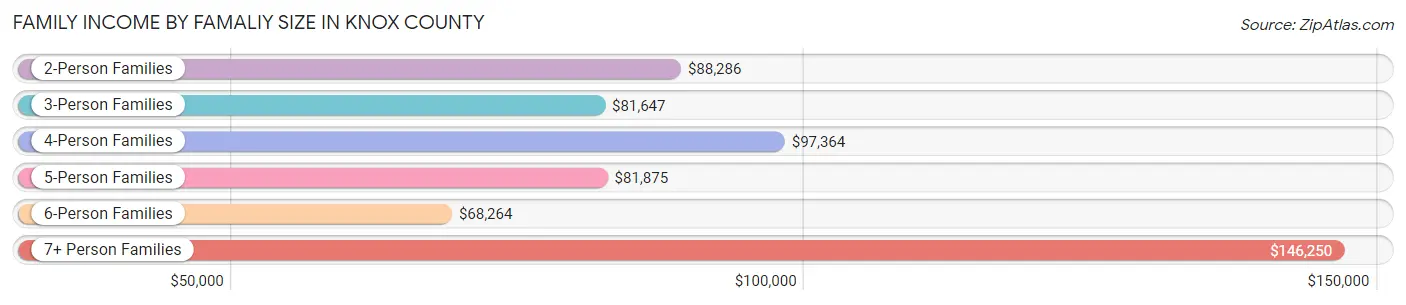
Family Income by Famaliy Size in Knox County
7+ person families (54 | 0.5%) account for the highest median family income in Knox County with $146,250 per family, while 2-person families (6,263 | 60.0%) have the highest median income of $44,143 per family member.
| Income Bracket | # Families | Median Income |
| 2-Person Families | 6,263 (60.0%) | $88,286 |
| 3-Person Families | 2,058 (19.7%) | $81,647 |
| 4-Person Families | 1,281 (12.3%) | $97,364 |
| 5-Person Families | 564 (5.4%) | $81,875 |
| 6-Person Families | 215 (2.1%) | $68,264 |
| 7+ Person Families | 54 (0.5%) | $146,250 |
| Total | 10,435 (100.0%) | $87,745 |
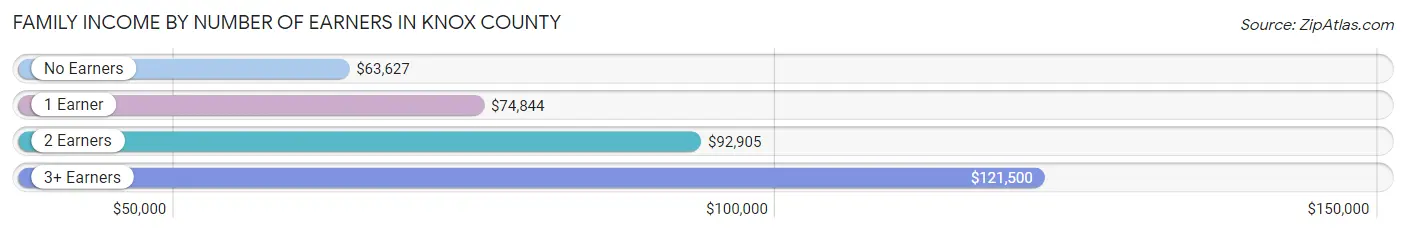
Family Income by Number of Earners in Knox County
The median family income in Knox County is $87,745, with families comprising 3+ earners (670) having the highest median family income of $121,500, while families with no earners (1,967) have the lowest median family income of $63,627, accounting for 6.4% and 18.9% of families, respectively.
| Number of Earners | # Families | Median Income |
| No Earners | 1,967 (18.9%) | $63,627 |
| 1 Earner | 2,881 (27.6%) | $74,844 |
| 2 Earners | 4,917 (47.1%) | $92,905 |
| 3+ Earners | 670 (6.4%) | $121,500 |
| Total | 10,435 (100.0%) | $87,745 |
Household Income in Knox County
Household Income Brackets in Knox County
With 3,289 households falling in the category, the $50,000 to $74,999 income range is the most frequent in Knox County, accounting for 18.5% of all households. In contrast, only 800 households (4.5%) fall into the $10,000 to $14,999 income bracket, making it the least populous group.

| Income Bracket | # Households | % Households |
| Less than $10,000 | 889 | 5.0% |
| $10,000 to $14,999 | 800 | 4.5% |
| $15,000 to $24,999 | 1,191 | 6.7% |
| $25,000 to $34,999 | 1,173 | 6.6% |
| $35,000 to $49,999 | 2,134 | 12.0% |
| $50,000 to $74,999 | 3,289 | 18.5% |
| $75,000 to $99,999 | 2,898 | 16.3% |
| $100,000 to $149,999 | 2,738 | 15.4% |
| $150,000 to $199,999 | 1,458 | 8.2% |
| $200,000+ | 1,209 | 6.8% |
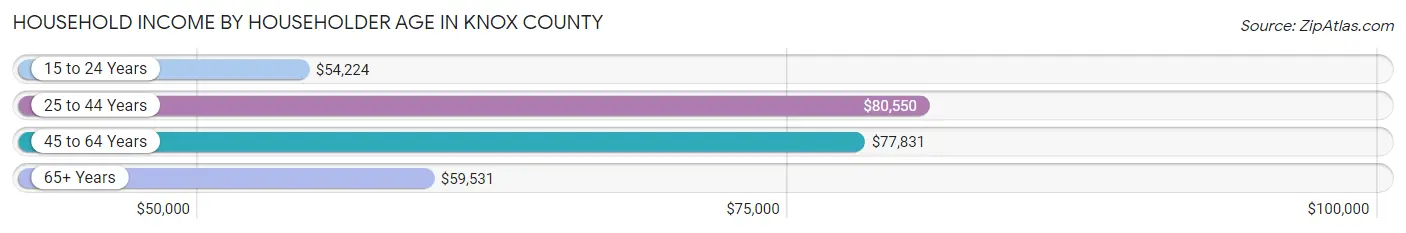
Household Income by Householder Age in Knox County
The median household income in Knox County is $68,904, with the highest median household income of $80,550 found in the 25 to 44 years age bracket for the primary householder. A total of 3,984 households (22.4%) fall into this category. Meanwhile, the 15 to 24 years age bracket for the primary householder has the lowest median household income of $54,224, with 586 households (3.3%) in this group.
| Income Bracket | # Households | Median Income |
| 15 to 24 Years | 586 (3.3%) | $54,224 |
| 25 to 44 Years | 3,984 (22.4%) | $80,550 |
| 45 to 64 Years | 6,197 (34.8%) | $77,831 |
| 65+ Years | 7,013 (39.4%) | $59,531 |
| Total | 17,780 (100.0%) | $68,904 |
Poverty in Knox County
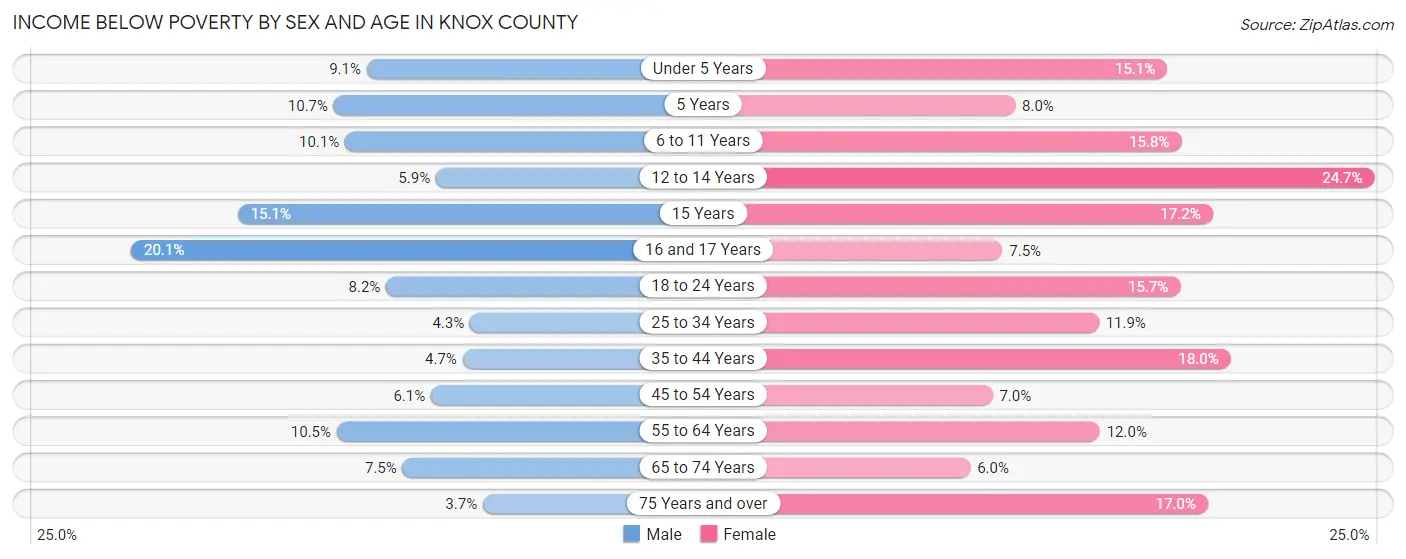
Income Below Poverty by Sex and Age in Knox County
With 7.5% poverty level for males and 12.3% for females among the residents of Knox County, 16 and 17 year old males and 12 to 14 year old females are the most vulnerable to poverty, with 138 males (20.1%) and 105 females (24.7%) in their respective age groups living below the poverty level.
| Age Bracket | Male | Female |
| Under 5 Years | 68 (9.1%) | 110 (15.1%) |
| 5 Years | 18 (10.6%) | 16 (8.0%) |
| 6 to 11 Years | 110 (10.1%) | 192 (15.8%) |
| 12 to 14 Years | 52 (5.9%) | 105 (24.7%) |
| 15 Years | 21 (15.1%) | 27 (17.2%) |
| 16 and 17 Years | 138 (20.1%) | 33 (7.4%) |
| 18 to 24 Years | 107 (8.2%) | 184 (15.7%) |
| 25 to 34 Years | 79 (4.3%) | 227 (11.9%) |
| 35 to 44 Years | 95 (4.7%) | 393 (18.0%) |
| 45 to 54 Years | 153 (6.1%) | 174 (7.0%) |
| 55 to 64 Years | 305 (10.5%) | 400 (12.0%) |
| 65 to 74 Years | 223 (7.5%) | 201 (6.0%) |
| 75 Years and over | 68 (3.7%) | 393 (17.0%) |
| Total | 1,437 (7.5%) | 2,455 (12.3%) |
Income Above Poverty by Sex and Age in Knox County
According to the poverty statistics in Knox County, males aged 75 years and over and females aged 65 to 74 years are the age groups that are most secure financially, with 96.3% of males and 94.0% of females in these age groups living above the poverty line.
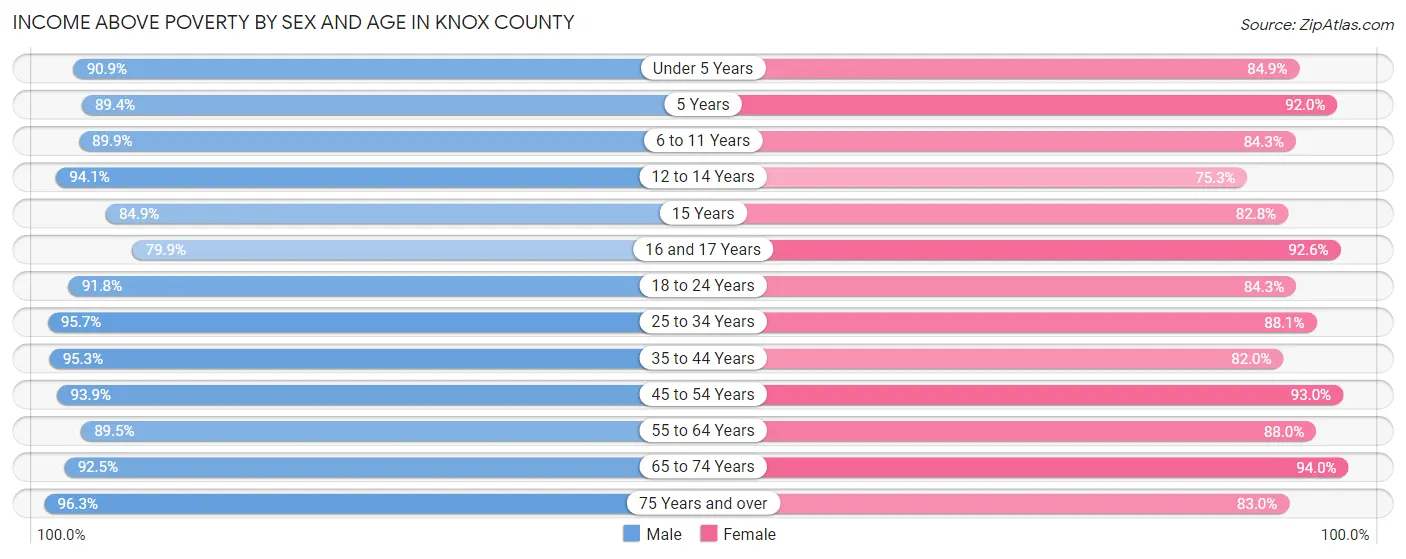
| Age Bracket | Male | Female |
| Under 5 Years | 678 (90.9%) | 619 (84.9%) |
| 5 Years | 151 (89.3%) | 183 (92.0%) |
| 6 to 11 Years | 976 (89.9%) | 1,027 (84.3%) |
| 12 to 14 Years | 828 (94.1%) | 320 (75.3%) |
| 15 Years | 118 (84.9%) | 130 (82.8%) |
| 16 and 17 Years | 550 (79.9%) | 410 (92.5%) |
| 18 to 24 Years | 1,194 (91.8%) | 988 (84.3%) |
| 25 to 34 Years | 1,744 (95.7%) | 1,678 (88.1%) |
| 35 to 44 Years | 1,941 (95.3%) | 1,785 (82.0%) |
| 45 to 54 Years | 2,337 (93.9%) | 2,316 (93.0%) |
| 55 to 64 Years | 2,596 (89.5%) | 2,942 (88.0%) |
| 65 to 74 Years | 2,768 (92.5%) | 3,173 (94.0%) |
| 75 Years and over | 1,755 (96.3%) | 1,922 (83.0%) |
| Total | 17,636 (92.5%) | 17,493 (87.7%) |
Income Below Poverty Among Married-Couple Families in Knox County
The poverty statistics for married-couple families in Knox County show that 2.2% or 186 of the total 8,480 families live below the poverty line. Families with no children have the highest poverty rate of 2.5%, comprising of 150 families. On the other hand, families with 5 or more children have the lowest poverty rate of 0.0%, which includes 0 families.
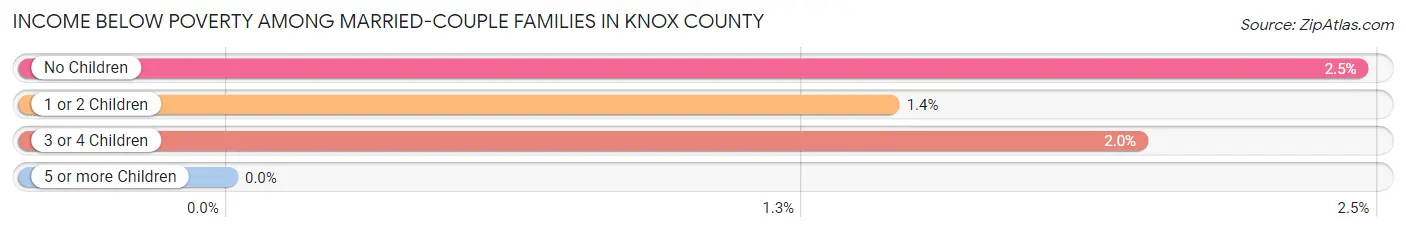
| Children | Above Poverty | Below Poverty |
| No Children | 5,946 (97.5%) | 150 (2.5%) |
| 1 or 2 Children | 1,916 (98.6%) | 28 (1.4%) |
| 3 or 4 Children | 396 (98.0%) | 8 (2.0%) |
| 5 or more Children | 36 (100.0%) | 0 (0.0%) |
| Total | 8,294 (97.8%) | 186 (2.2%) |
Income Below Poverty Among Single-Parent Households in Knox County
According to the poverty data in Knox County, 0.7% or 4 single-father households and 28.2% or 402 single-mother households are living below the poverty line. Among single-father households, those with 1 or 2 children have the highest poverty rate, with 4 households (1.4%) experiencing poverty. Likewise, among single-mother households, those with 5 or more children have the highest poverty rate, with 13 households (100.0%) falling below the poverty line.
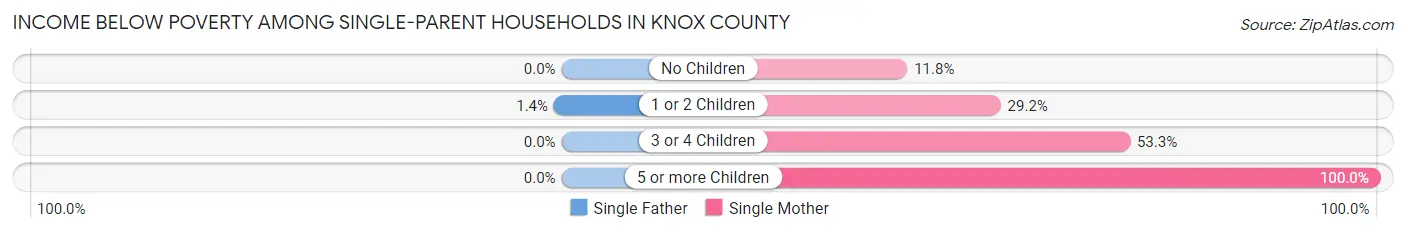
| Children | Single Father | Single Mother |
| No Children | 0 (0.0%) | 58 (11.8%) |
| 1 or 2 Children | 4 (1.4%) | 195 (29.2%) |
| 3 or 4 Children | 0 (0.0%) | 136 (53.3%) |
| 5 or more Children | 0 (0.0%) | 13 (100.0%) |
| Total | 4 (0.7%) | 402 (28.2%) |
Income Below Poverty Among Married-Couple vs Single-Parent Households in Knox County
The poverty data for Knox County shows that 186 of the married-couple family households (2.2%) and 406 of the single-parent households (20.8%) are living below the poverty level. Within the married-couple family households, those with no children have the highest poverty rate, with 150 households (2.5%) falling below the poverty line. Among the single-parent households, those with 5 or more children have the highest poverty rate, with 13 household (76.5%) living below poverty.
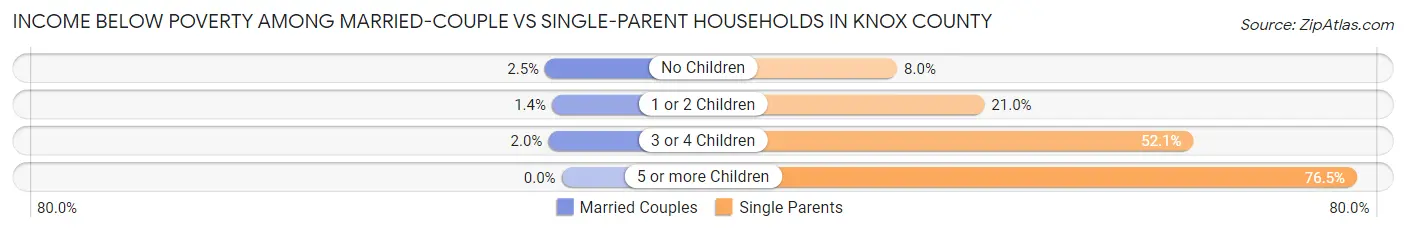
| Children | Married-Couple Families | Single-Parent Households |
| No Children | 150 (2.5%) | 58 (8.0%) |
| 1 or 2 Children | 28 (1.4%) | 199 (21.0%) |
| 3 or 4 Children | 8 (2.0%) | 136 (52.1%) |
| 5 or more Children | 0 (0.0%) | 13 (76.5%) |
| Total | 186 (2.2%) | 406 (20.8%) |
Employment Characteristics in Knox County
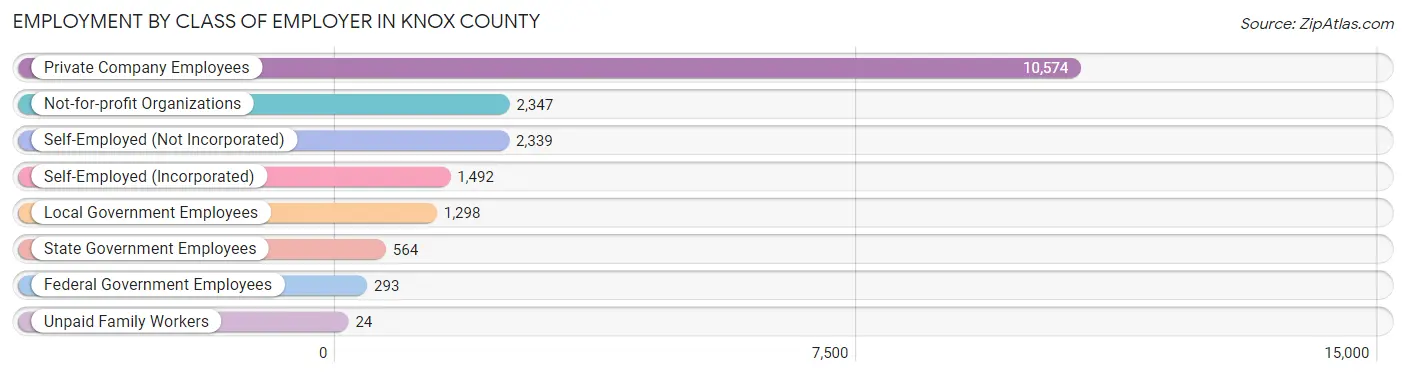
Employment by Class of Employer in Knox County
Among the 18,931 employed individuals in Knox County, private company employees (10,574 | 55.9%), not-for-profit organizations (2,347 | 12.4%), and self-employed (not incorporated) (2,339 | 12.4%) make up the most common classes of employment.
| Employer Class | # Employees | % Employees |
| Private Company Employees | 10,574 | 55.9% |
| Self-Employed (Incorporated) | 1,492 | 7.9% |
| Self-Employed (Not Incorporated) | 2,339 | 12.4% |
| Not-for-profit Organizations | 2,347 | 12.4% |
| Local Government Employees | 1,298 | 6.9% |
| State Government Employees | 564 | 3.0% |
| Federal Government Employees | 293 | 1.5% |
| Unpaid Family Workers | 24 | 0.1% |
| Total | 18,931 | 100.0% |
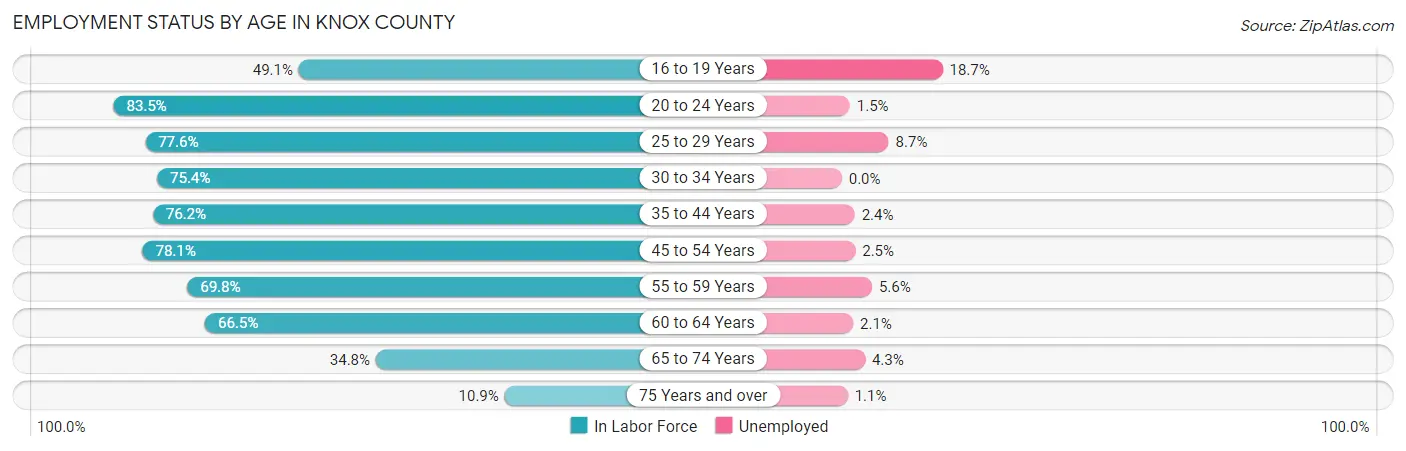
Employment Status by Age in Knox County
According to the labor force statistics for Knox County, out of the total population over 16 years of age (34,809), 58.1% or 20,224 individuals are in the labor force, with 3.8% or 769 of them unemployed. The age group with the highest labor force participation rate is 20 to 24 years, with 83.5% or 1,592 individuals in the labor force. Within the labor force, the 16 to 19 years age range has the highest percentage of unemployed individuals, with 18.7% or 165 of them being unemployed.
| Age Bracket | In Labor Force | Unemployed |
| 16 to 19 Years | 882 (49.1%) | 165 (18.7%) |
| 20 to 24 Years | 1,592 (83.5%) | 24 (1.5%) |
| 25 to 29 Years | 1,528 (77.6%) | 133 (8.7%) |
| 30 to 34 Years | 1,663 (75.4%) | 0 (0.0%) |
| 35 to 44 Years | 3,437 (76.2%) | 82 (2.4%) |
| 45 to 54 Years | 4,032 (78.1%) | 101 (2.5%) |
| 55 to 59 Years | 1,783 (69.8%) | 100 (5.6%) |
| 60 to 64 Years | 2,609 (66.5%) | 55 (2.1%) |
| 65 to 74 Years | 2,239 (34.8%) | 96 (4.3%) |
| 75 Years and over | 474 (10.9%) | 5 (1.1%) |
| Total | 20,224 (58.1%) | 769 (3.8%) |
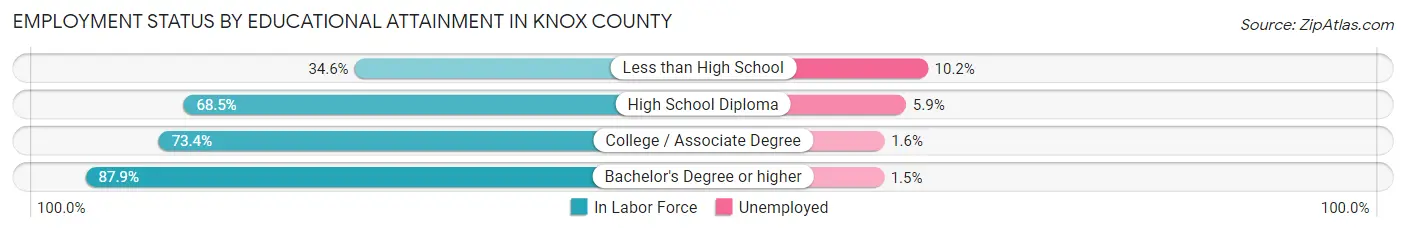
Employment Status by Educational Attainment in Knox County
According to labor force statistics for Knox County, 74.0% of individuals (15,041) out of the total population between 25 and 64 years of age (20,326) are in the labor force, with 3.1% or 466 of them being unemployed. The group with the highest labor force participation rate are those with the educational attainment of bachelor's degree or higher, with 87.9% or 6,073 individuals in the labor force. Within the labor force, individuals with less than high school education have the highest percentage of unemployment, with 10.2% or 50 of them being unemployed.
| Educational Attainment | In Labor Force | Unemployed |
| Less than High School | 492 (34.6%) | 145 (10.2%) |
| High School Diploma | 4,516 (68.5%) | 389 (5.9%) |
| College / Associate Degree | 3,966 (73.4%) | 86 (1.6%) |
| Bachelor's Degree or higher | 6,073 (87.9%) | 104 (1.5%) |
| Total | 15,041 (74.0%) | 630 (3.1%) |
Employment Occupations by Sex in Knox County
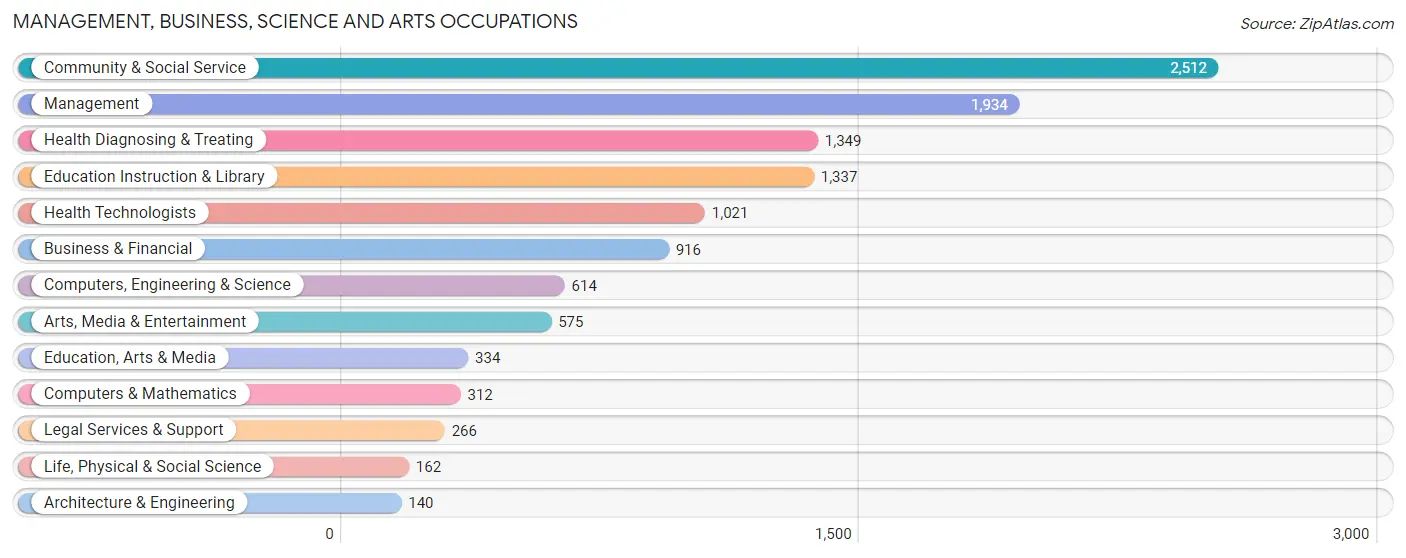
Management, Business, Science and Arts Occupations
The most common Management, Business, Science and Arts occupations in Knox County are Community & Social Service (2,512 | 12.9%), Management (1,934 | 10.0%), Health Diagnosing & Treating (1,349 | 6.9%), Education Instruction & Library (1,337 | 6.9%), and Health Technologists (1,021 | 5.3%).
Management, Business, Science and Arts Occupations by Sex
Within the Management, Business, Science and Arts occupations in Knox County, the most male-oriented occupations are Architecture & Engineering (87.9%), Legal Services & Support (74.1%), and Computers & Mathematics (64.1%), while the most female-oriented occupations are Life, Physical & Social Science (78.4%), Health Diagnosing & Treating (72.4%), and Education Instruction & Library (69.6%).
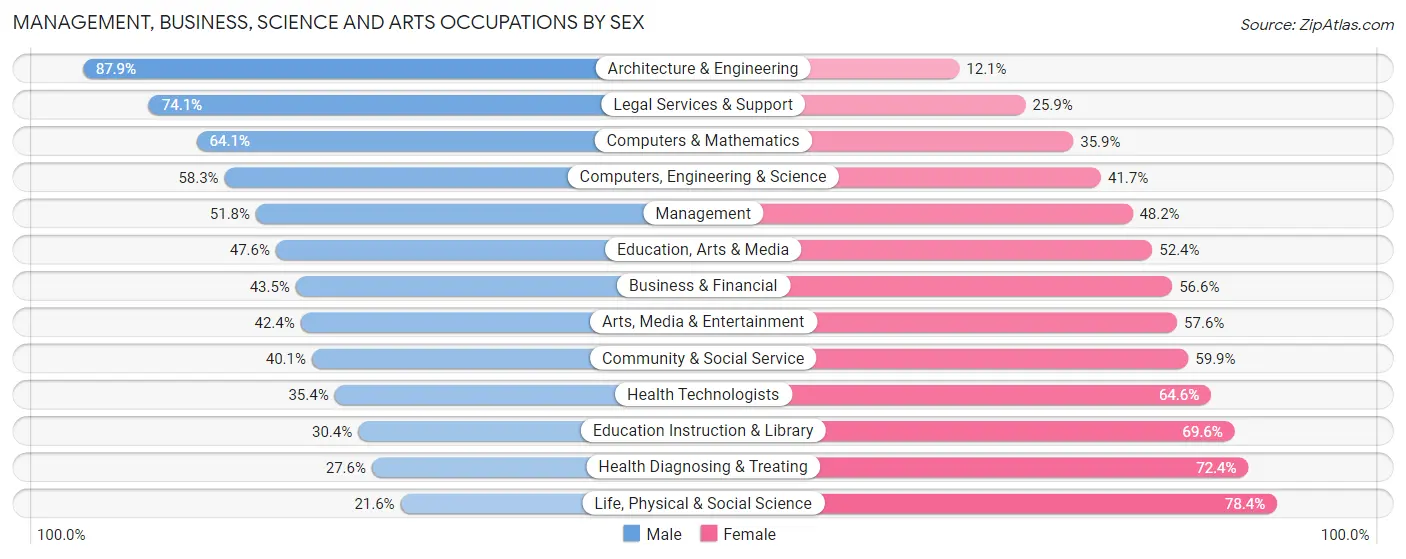
| Occupation | Male | Female |
| Management | 1,001 (51.8%) | 933 (48.2%) |
| Business & Financial | 398 (43.4%) | 518 (56.6%) |
| Computers, Engineering & Science | 358 (58.3%) | 256 (41.7%) |
| Computers & Mathematics | 200 (64.1%) | 112 (35.9%) |
| Architecture & Engineering | 123 (87.9%) | 17 (12.1%) |
| Life, Physical & Social Science | 35 (21.6%) | 127 (78.4%) |
| Community & Social Service | 1,007 (40.1%) | 1,505 (59.9%) |
| Education, Arts & Media | 159 (47.6%) | 175 (52.4%) |
| Legal Services & Support | 197 (74.1%) | 69 (25.9%) |
| Education Instruction & Library | 407 (30.4%) | 930 (69.6%) |
| Arts, Media & Entertainment | 244 (42.4%) | 331 (57.6%) |
| Health Diagnosing & Treating | 372 (27.6%) | 977 (72.4%) |
| Health Technologists | 361 (35.4%) | 660 (64.6%) |
| Total (Category) | 3,136 (42.8%) | 4,189 (57.2%) |
| Total (Overall) | 10,053 (51.7%) | 9,374 (48.2%) |
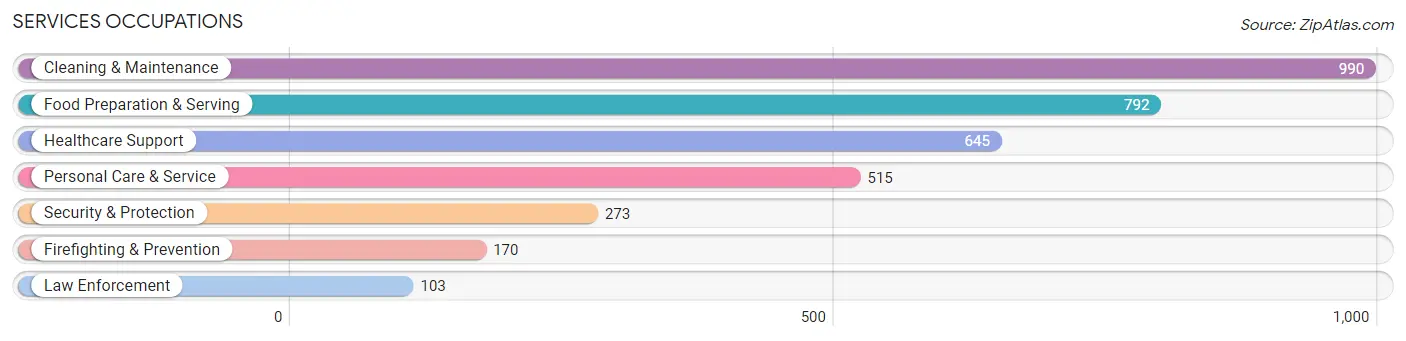
Services Occupations
The most common Services occupations in Knox County are Cleaning & Maintenance (990 | 5.1%), Food Preparation & Serving (792 | 4.1%), Healthcare Support (645 | 3.3%), Personal Care & Service (515 | 2.6%), and Security & Protection (273 | 1.4%).
Services Occupations by Sex
Within the Services occupations in Knox County, the most male-oriented occupations are Law Enforcement (93.2%), Security & Protection (93.0%), and Firefighting & Prevention (92.9%), while the most female-oriented occupations are Healthcare Support (95.8%), Personal Care & Service (82.7%), and Food Preparation & Serving (61.1%).
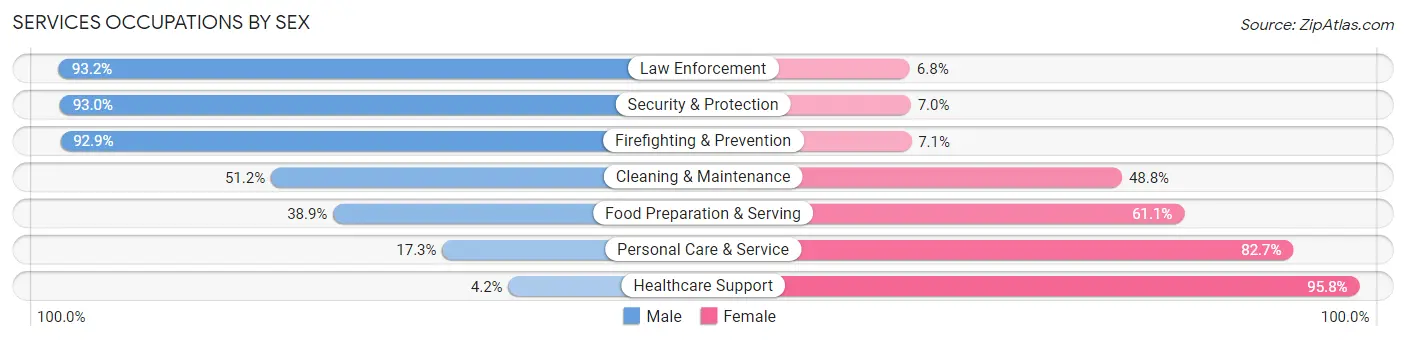
| Occupation | Male | Female |
| Healthcare Support | 27 (4.2%) | 618 (95.8%) |
| Security & Protection | 254 (93.0%) | 19 (7.0%) |
| Firefighting & Prevention | 158 (92.9%) | 12 (7.1%) |
| Law Enforcement | 96 (93.2%) | 7 (6.8%) |
| Food Preparation & Serving | 308 (38.9%) | 484 (61.1%) |
| Cleaning & Maintenance | 507 (51.2%) | 483 (48.8%) |
| Personal Care & Service | 89 (17.3%) | 426 (82.7%) |
| Total (Category) | 1,185 (36.9%) | 2,030 (63.1%) |
| Total (Overall) | 10,053 (51.7%) | 9,374 (48.2%) |
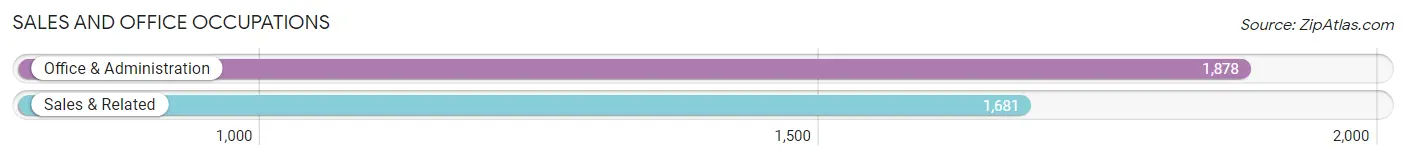
Sales and Office Occupations
The most common Sales and Office occupations in Knox County are Office & Administration (1,878 | 9.7%), and Sales & Related (1,681 | 8.6%).
Sales and Office Occupations by Sex
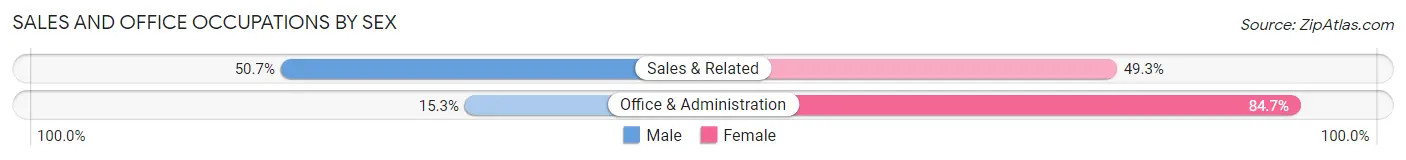
| Occupation | Male | Female |
| Sales & Related | 853 (50.7%) | 828 (49.3%) |
| Office & Administration | 288 (15.3%) | 1,590 (84.7%) |
| Total (Category) | 1,141 (32.1%) | 2,418 (67.9%) |
| Total (Overall) | 10,053 (51.7%) | 9,374 (48.2%) |
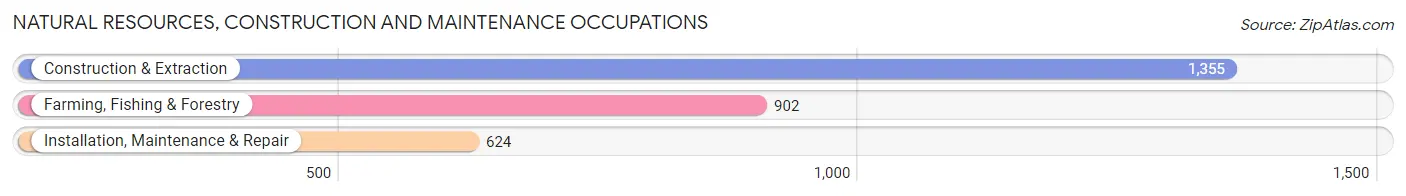
Natural Resources, Construction and Maintenance Occupations
The most common Natural Resources, Construction and Maintenance occupations in Knox County are Construction & Extraction (1,355 | 7.0%), Farming, Fishing & Forestry (902 | 4.6%), and Installation, Maintenance & Repair (624 | 3.2%).
Natural Resources, Construction and Maintenance Occupations by Sex
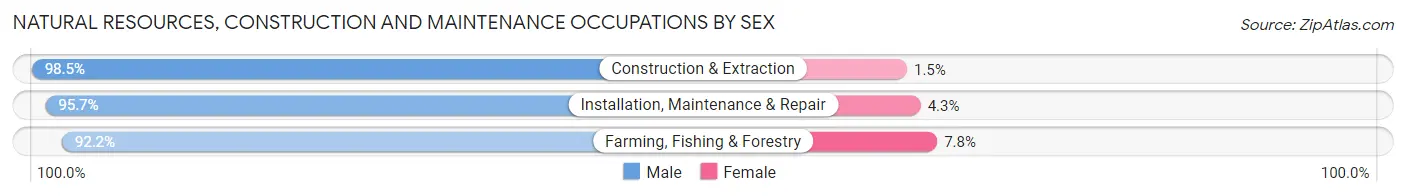
| Occupation | Male | Female |
| Farming, Fishing & Forestry | 832 (92.2%) | 70 (7.8%) |
| Construction & Extraction | 1,335 (98.5%) | 20 (1.5%) |
| Installation, Maintenance & Repair | 597 (95.7%) | 27 (4.3%) |
| Total (Category) | 2,764 (95.9%) | 117 (4.1%) |
| Total (Overall) | 10,053 (51.7%) | 9,374 (48.2%) |
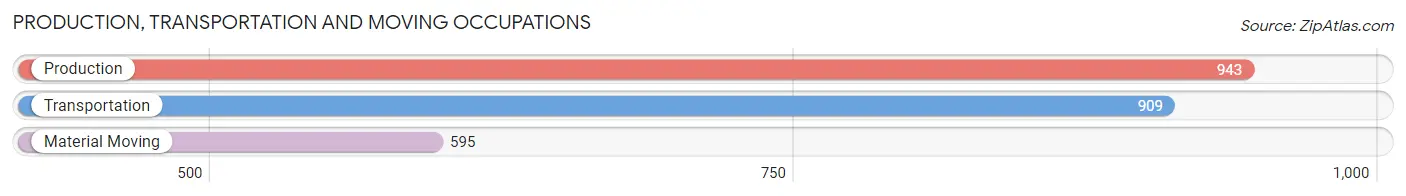
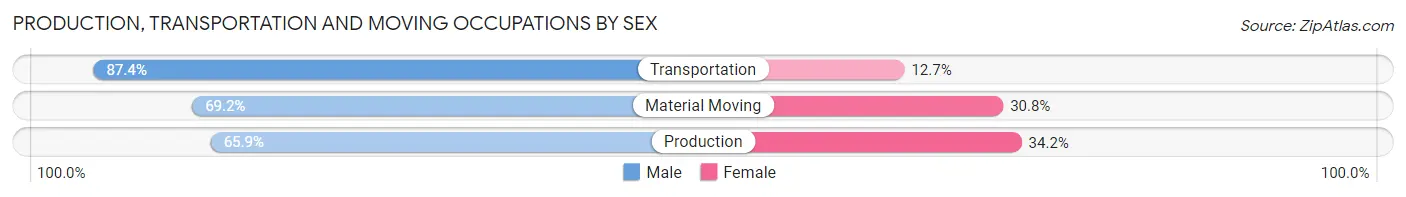
Production, Transportation and Moving Occupations
The most common Production, Transportation and Moving occupations in Knox County are Production (943 | 4.9%), Transportation (909 | 4.7%), and Material Moving (595 | 3.1%).
Production, Transportation and Moving Occupations by Sex
| Occupation | Male | Female |
| Production | 621 (65.8%) | 322 (34.2%) |
| Transportation | 794 (87.4%) | 115 (12.7%) |
| Material Moving | 412 (69.2%) | 183 (30.8%) |
| Total (Category) | 1,827 (74.7%) | 620 (25.3%) |
| Total (Overall) | 10,053 (51.7%) | 9,374 (48.2%) |
Employment Industries by Sex in Knox County
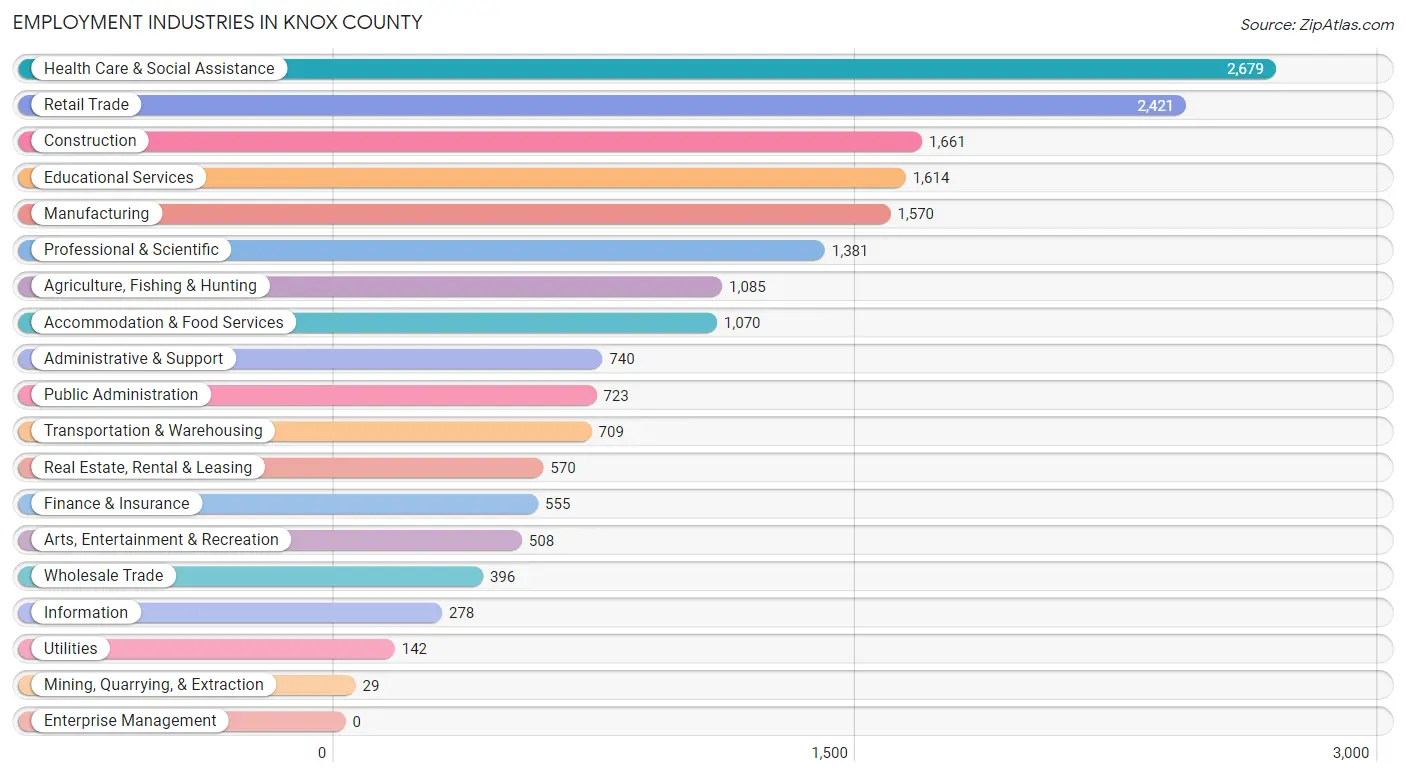
Employment Industries in Knox County
The major employment industries in Knox County include Health Care & Social Assistance (2,679 | 13.8%), Retail Trade (2,421 | 12.5%), Construction (1,661 | 8.6%), Educational Services (1,614 | 8.3%), and Manufacturing (1,570 | 8.1%).
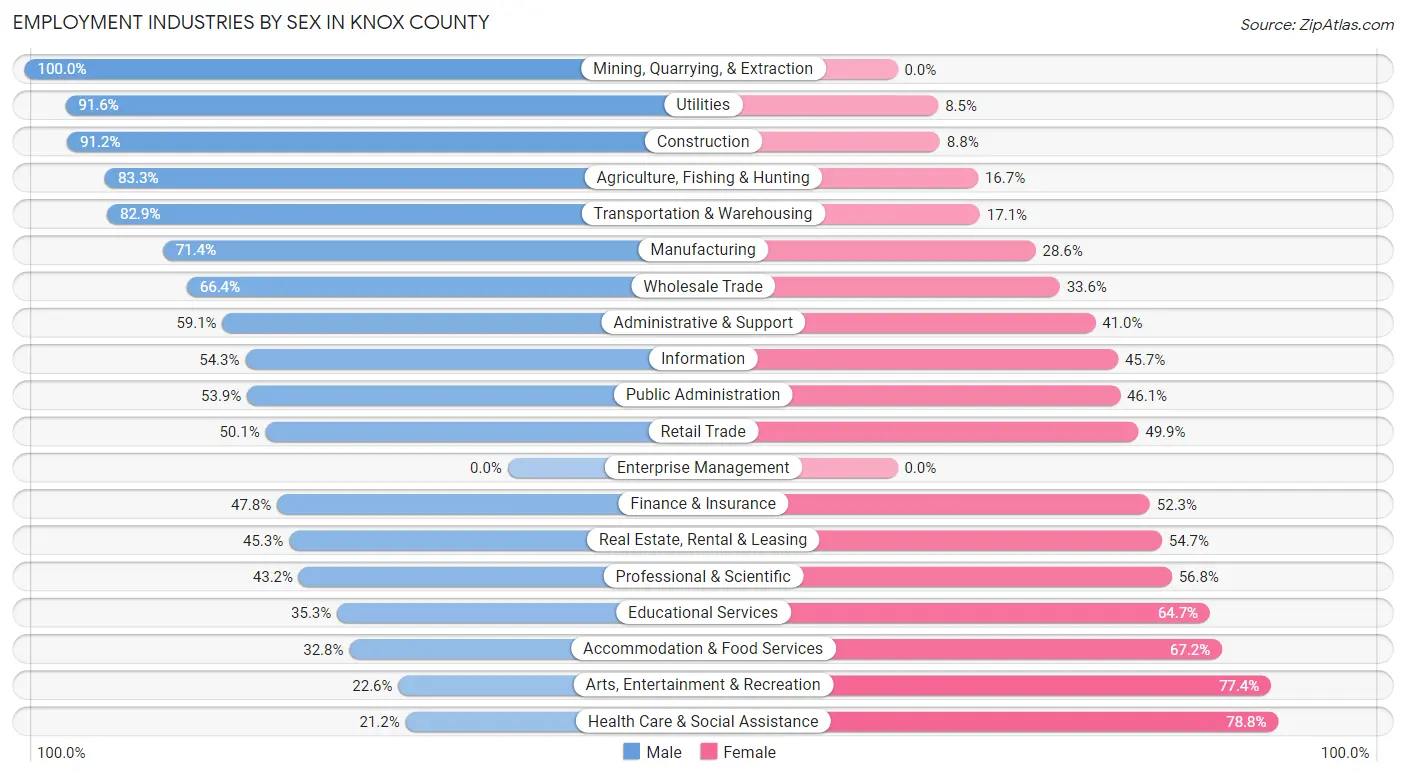
Employment Industries by Sex in Knox County
The Knox County industries that see more men than women are Mining, Quarrying, & Extraction (100.0%), Utilities (91.5%), and Construction (91.2%), whereas the industries that tend to have a higher number of women are Health Care & Social Assistance (78.8%), Arts, Entertainment & Recreation (77.4%), and Accommodation & Food Services (67.2%).
| Industry | Male | Female |
| Agriculture, Fishing & Hunting | 904 (83.3%) | 181 (16.7%) |
| Mining, Quarrying, & Extraction | 29 (100.0%) | 0 (0.0%) |
| Construction | 1,515 (91.2%) | 146 (8.8%) |
| Manufacturing | 1,121 (71.4%) | 449 (28.6%) |
| Wholesale Trade | 263 (66.4%) | 133 (33.6%) |
| Retail Trade | 1,214 (50.1%) | 1,207 (49.9%) |
| Transportation & Warehousing | 588 (82.9%) | 121 (17.1%) |
| Utilities | 130 (91.5%) | 12 (8.5%) |
| Information | 151 (54.3%) | 127 (45.7%) |
| Finance & Insurance | 265 (47.7%) | 290 (52.2%) |
| Real Estate, Rental & Leasing | 258 (45.3%) | 312 (54.7%) |
| Professional & Scientific | 597 (43.2%) | 784 (56.8%) |
| Enterprise Management | 0 (0.0%) | 0 (0.0%) |
| Administrative & Support | 437 (59.1%) | 303 (40.9%) |
| Educational Services | 570 (35.3%) | 1,044 (64.7%) |
| Health Care & Social Assistance | 567 (21.2%) | 2,112 (78.8%) |
| Arts, Entertainment & Recreation | 115 (22.6%) | 393 (77.4%) |
| Accommodation & Food Services | 351 (32.8%) | 719 (67.2%) |
| Public Administration | 390 (53.9%) | 333 (46.1%) |
| Total | 10,053 (51.7%) | 9,374 (48.2%) |
Education in Knox County
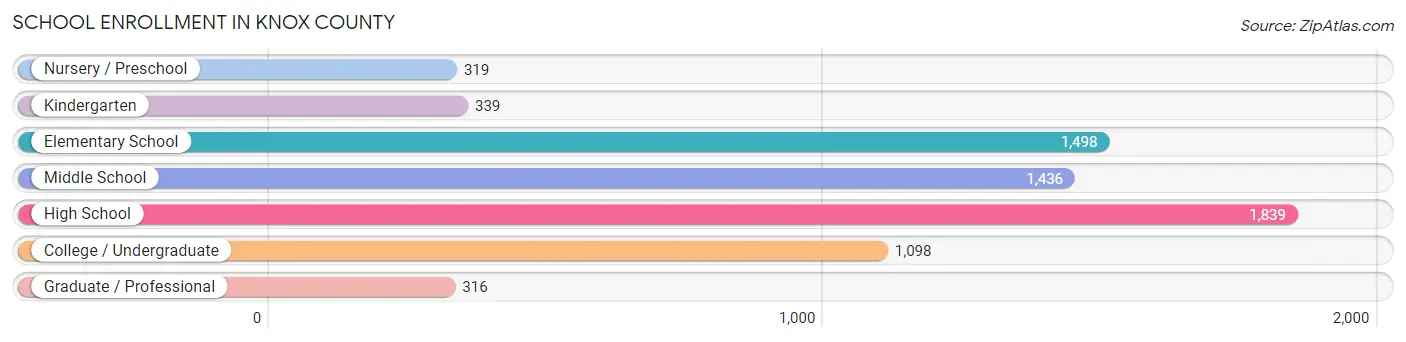
School Enrollment in Knox County
The most common levels of schooling among the 6,845 students in Knox County are high school (1,839 | 26.9%), elementary school (1,498 | 21.9%), and middle school (1,436 | 21.0%).
| School Level | # Students | % Students |
| Nursery / Preschool | 319 | 4.7% |
| Kindergarten | 339 | 5.0% |
| Elementary School | 1,498 | 21.9% |
| Middle School | 1,436 | 21.0% |
| High School | 1,839 | 26.9% |
| College / Undergraduate | 1,098 | 16.0% |
| Graduate / Professional | 316 | 4.6% |
| Total | 6,845 | 100.0% |
School Enrollment by Age by Funding Source in Knox County
Out of a total of 6,845 students who are enrolled in schools in Knox County, 1,355 (19.8%) attend a private institution, while the remaining 5,490 (80.2%) are enrolled in public schools. The age group of 3 to 4 year olds has the highest likelihood of being enrolled in private schools, with 91 (38.1% in the age bracket) enrolled. Conversely, the age group of 10 to 14 year olds has the lowest likelihood of being enrolled in a private school, with 1,642 (87.7% in the age bracket) attending a public institution.
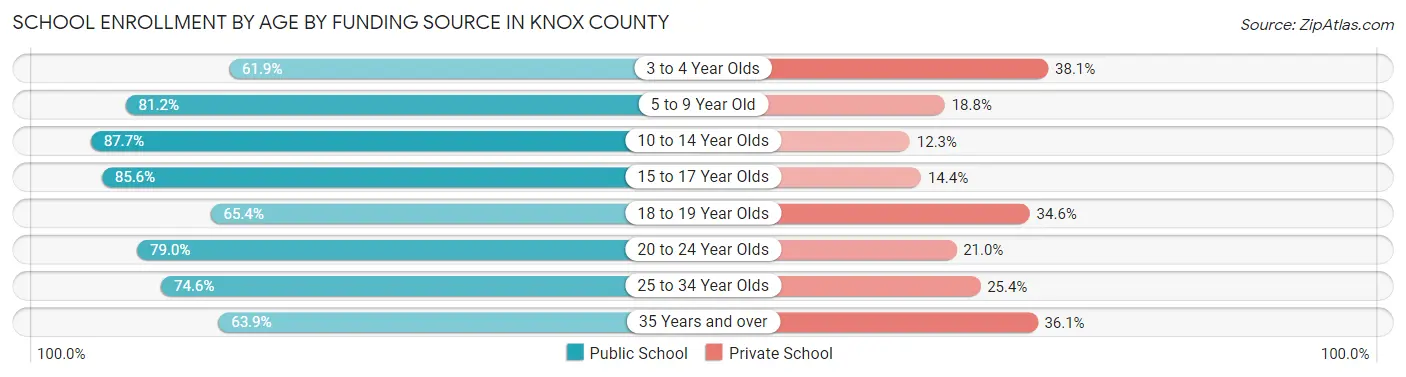
| Age Bracket | Public School | Private School |
| 3 to 4 Year Olds | 148 (61.9%) | 91 (38.1%) |
| 5 to 9 Year Old | 1,375 (81.2%) | 319 (18.8%) |
| 10 to 14 Year Olds | 1,642 (87.7%) | 231 (12.3%) |
| 15 to 17 Year Olds | 1,118 (85.6%) | 188 (14.4%) |
| 18 to 19 Year Olds | 283 (65.4%) | 150 (34.6%) |
| 20 to 24 Year Olds | 347 (79.0%) | 92 (21.0%) |
| 25 to 34 Year Olds | 173 (74.6%) | 59 (25.4%) |
| 35 Years and over | 402 (63.9%) | 227 (36.1%) |
| Total | 5,490 (80.2%) | 1,355 (19.8%) |
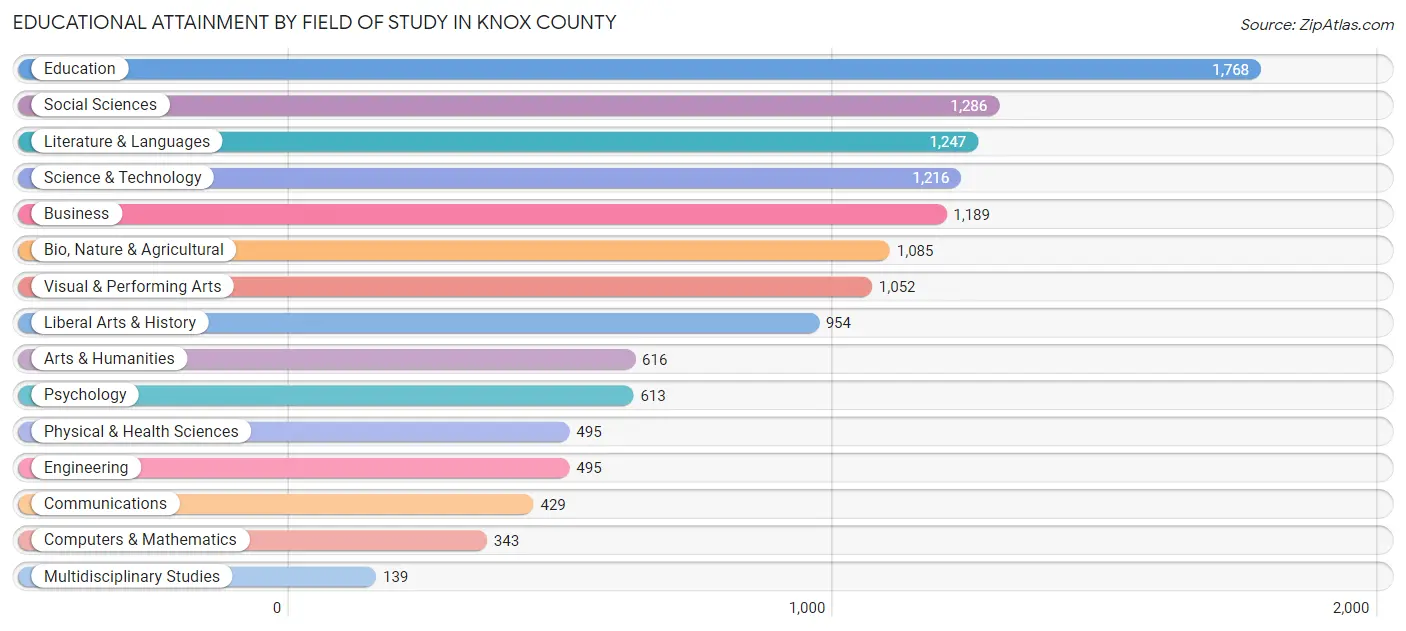
Educational Attainment by Field of Study in Knox County
Education (1,768 | 13.7%), social sciences (1,286 | 10.0%), literature & languages (1,247 | 9.7%), science & technology (1,216 | 9.4%), and business (1,189 | 9.2%) are the most common fields of study among 12,927 individuals in Knox County who have obtained a bachelor's degree or higher.
| Field of Study | # Graduates | % Graduates |
| Computers & Mathematics | 343 | 2.6% |
| Bio, Nature & Agricultural | 1,085 | 8.4% |
| Physical & Health Sciences | 495 | 3.8% |
| Psychology | 613 | 4.7% |
| Social Sciences | 1,286 | 10.0% |
| Engineering | 495 | 3.8% |
| Multidisciplinary Studies | 139 | 1.1% |
| Science & Technology | 1,216 | 9.4% |
| Business | 1,189 | 9.2% |
| Education | 1,768 | 13.7% |
| Literature & Languages | 1,247 | 9.7% |
| Liberal Arts & History | 954 | 7.4% |
| Visual & Performing Arts | 1,052 | 8.1% |
| Communications | 429 | 3.3% |
| Arts & Humanities | 616 | 4.8% |
| Total | 12,927 | 100.0% |
Transportation & Commute in Knox County
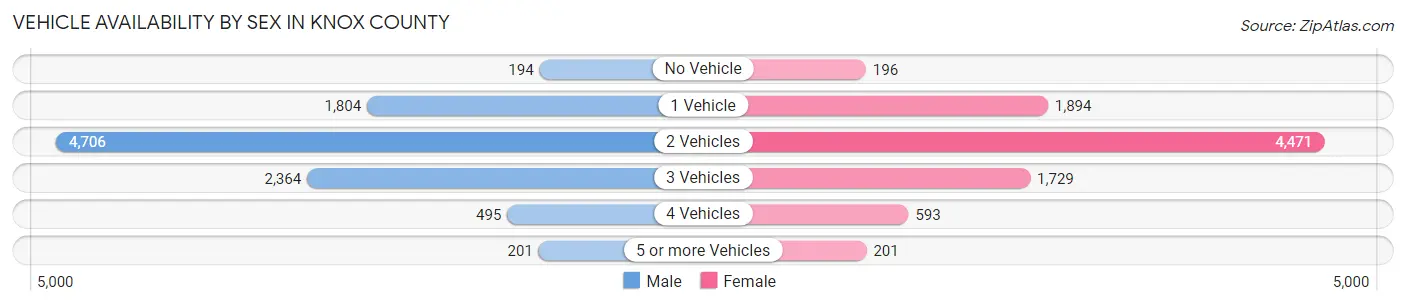
Vehicle Availability by Sex in Knox County
The most prevalent vehicle ownership categories in Knox County are males with 2 vehicles (4,706, accounting for 48.2%) and females with 2 vehicles (4,471, making up 51.8%).
| Vehicles Available | Male | Female |
| No Vehicle | 194 (2.0%) | 196 (2.2%) |
| 1 Vehicle | 1,804 (18.5%) | 1,894 (20.8%) |
| 2 Vehicles | 4,706 (48.2%) | 4,471 (49.2%) |
| 3 Vehicles | 2,364 (24.2%) | 1,729 (19.0%) |
| 4 Vehicles | 495 (5.1%) | 593 (6.5%) |
| 5 or more Vehicles | 201 (2.1%) | 201 (2.2%) |
| Total | 9,764 (100.0%) | 9,084 (100.0%) |
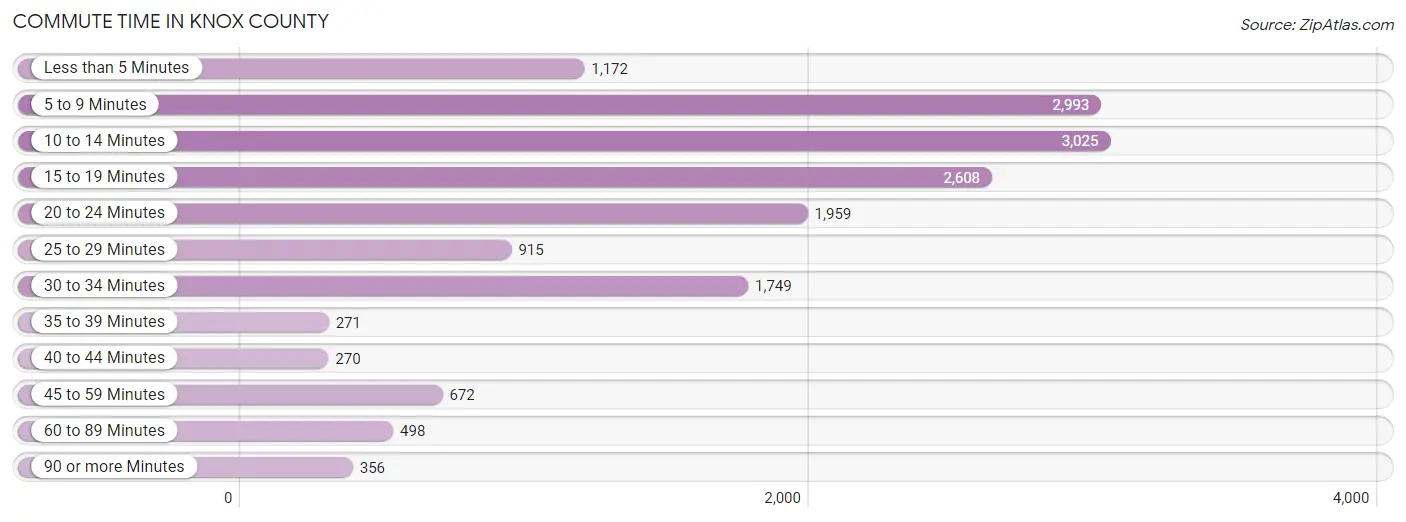
Commute Time in Knox County
The most frequently occuring commute durations in Knox County are 10 to 14 minutes (3,025 commuters, 18.3%), 5 to 9 minutes (2,993 commuters, 18.1%), and 15 to 19 minutes (2,608 commuters, 15.8%).
| Commute Time | # Commuters | % Commuters |
| Less than 5 Minutes | 1,172 | 7.1% |
| 5 to 9 Minutes | 2,993 | 18.1% |
| 10 to 14 Minutes | 3,025 | 18.3% |
| 15 to 19 Minutes | 2,608 | 15.8% |
| 20 to 24 Minutes | 1,959 | 11.9% |
| 25 to 29 Minutes | 915 | 5.6% |
| 30 to 34 Minutes | 1,749 | 10.6% |
| 35 to 39 Minutes | 271 | 1.6% |
| 40 to 44 Minutes | 270 | 1.6% |
| 45 to 59 Minutes | 672 | 4.1% |
| 60 to 89 Minutes | 498 | 3.0% |
| 90 or more Minutes | 356 | 2.2% |
Commute Time by Sex in Knox County
The most common commute times in Knox County are 5 to 9 minutes (1,690 commuters, 19.3%) for males and 10 to 14 minutes (1,410 commuters, 18.2%) for females.
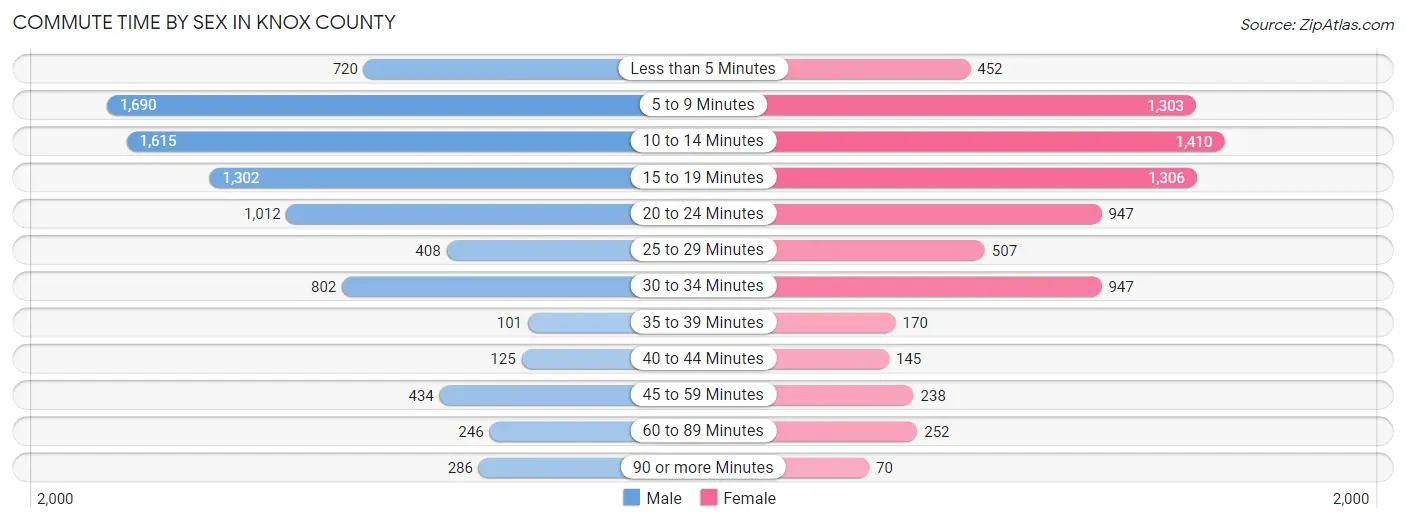
| Commute Time | Male | Female |
| Less than 5 Minutes | 720 (8.2%) | 452 (5.8%) |
| 5 to 9 Minutes | 1,690 (19.3%) | 1,303 (16.8%) |
| 10 to 14 Minutes | 1,615 (18.5%) | 1,410 (18.2%) |
| 15 to 19 Minutes | 1,302 (14.9%) | 1,306 (16.9%) |
| 20 to 24 Minutes | 1,012 (11.6%) | 947 (12.2%) |
| 25 to 29 Minutes | 408 (4.7%) | 507 (6.5%) |
| 30 to 34 Minutes | 802 (9.2%) | 947 (12.2%) |
| 35 to 39 Minutes | 101 (1.2%) | 170 (2.2%) |
| 40 to 44 Minutes | 125 (1.4%) | 145 (1.9%) |
| 45 to 59 Minutes | 434 (5.0%) | 238 (3.1%) |
| 60 to 89 Minutes | 246 (2.8%) | 252 (3.3%) |
| 90 or more Minutes | 286 (3.3%) | 70 (0.9%) |
Time of Departure to Work by Sex in Knox County
The most frequent times of departure to work in Knox County are 7:00 AM to 7:29 AM (1,347, 15.4%) for males and 7:00 AM to 7:29 AM (1,296, 16.7%) for females.
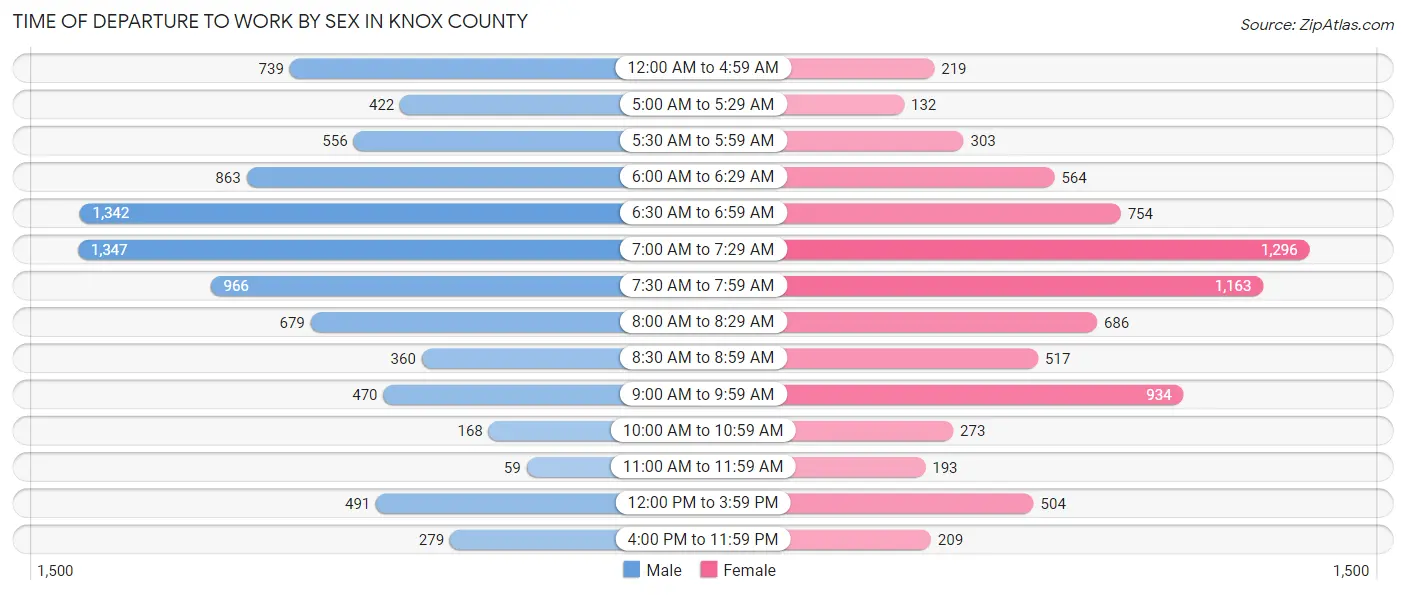
| Time of Departure | Male | Female |
| 12:00 AM to 4:59 AM | 739 (8.5%) | 219 (2.8%) |
| 5:00 AM to 5:29 AM | 422 (4.8%) | 132 (1.7%) |
| 5:30 AM to 5:59 AM | 556 (6.4%) | 303 (3.9%) |
| 6:00 AM to 6:29 AM | 863 (9.9%) | 564 (7.3%) |
| 6:30 AM to 6:59 AM | 1,342 (15.3%) | 754 (9.7%) |
| 7:00 AM to 7:29 AM | 1,347 (15.4%) | 1,296 (16.7%) |
| 7:30 AM to 7:59 AM | 966 (11.1%) | 1,163 (15.0%) |
| 8:00 AM to 8:29 AM | 679 (7.8%) | 686 (8.9%) |
| 8:30 AM to 8:59 AM | 360 (4.1%) | 517 (6.7%) |
| 9:00 AM to 9:59 AM | 470 (5.4%) | 934 (12.1%) |
| 10:00 AM to 10:59 AM | 168 (1.9%) | 273 (3.5%) |
| 11:00 AM to 11:59 AM | 59 (0.7%) | 193 (2.5%) |
| 12:00 PM to 3:59 PM | 491 (5.6%) | 504 (6.5%) |
| 4:00 PM to 11:59 PM | 279 (3.2%) | 209 (2.7%) |
| Total | 8,741 (100.0%) | 7,747 (100.0%) |
Housing Occupancy in Knox County
Occupancy by Ownership in Knox County
Of the total 17,780 dwellings in Knox County, owner-occupied units account for 14,084 (79.2%), while renter-occupied units make up 3,696 (20.8%).
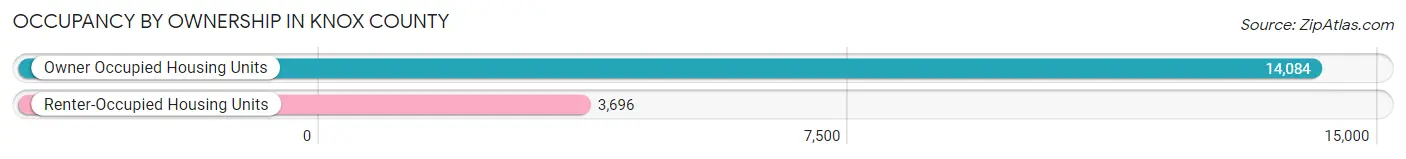
| Occupancy | # Housing Units | % Housing Units |
| Owner Occupied Housing Units | 14,084 | 79.2% |
| Renter-Occupied Housing Units | 3,696 | 20.8% |
| Total Occupied Housing Units | 17,780 | 100.0% |
Occupancy by Household Size in Knox County
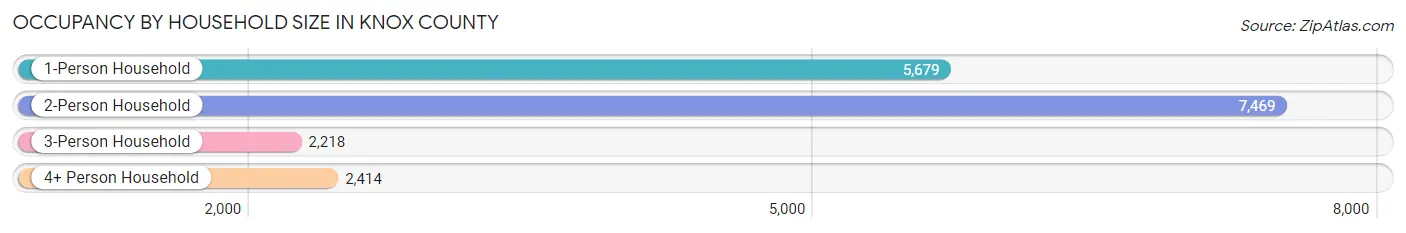
| Household Size | # Housing Units | % Housing Units |
| 1-Person Household | 5,679 | 31.9% |
| 2-Person Household | 7,469 | 42.0% |
| 3-Person Household | 2,218 | 12.5% |
| 4+ Person Household | 2,414 | 13.6% |
| Total Housing Units | 17,780 | 100.0% |
Occupancy by Ownership by Household Size in Knox County
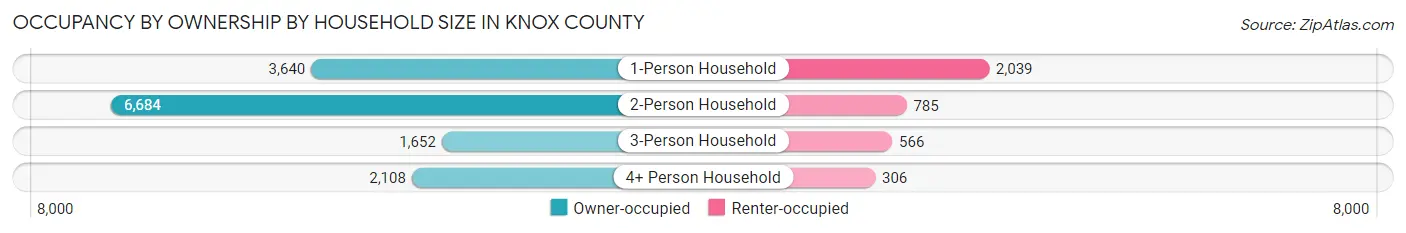
| Household Size | Owner-occupied | Renter-occupied |
| 1-Person Household | 3,640 (64.1%) | 2,039 (35.9%) |
| 2-Person Household | 6,684 (89.5%) | 785 (10.5%) |
| 3-Person Household | 1,652 (74.5%) | 566 (25.5%) |
| 4+ Person Household | 2,108 (87.3%) | 306 (12.7%) |
| Total Housing Units | 14,084 (79.2%) | 3,696 (20.8%) |
Occupancy by Educational Attainment in Knox County
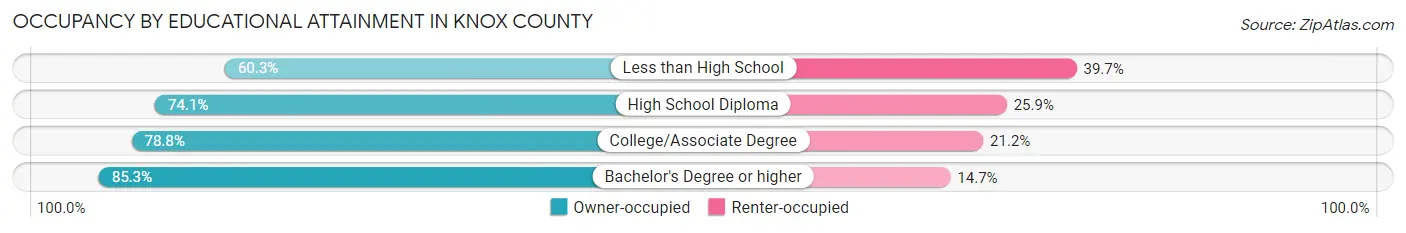
| Household Size | Owner-occupied | Renter-occupied |
| Less than High School | 540 (60.3%) | 356 (39.7%) |
| High School Diploma | 3,679 (74.1%) | 1,285 (25.9%) |
| College/Associate Degree | 3,652 (78.8%) | 983 (21.2%) |
| Bachelor's Degree or higher | 6,213 (85.3%) | 1,072 (14.7%) |
Occupancy by Age of Householder in Knox County
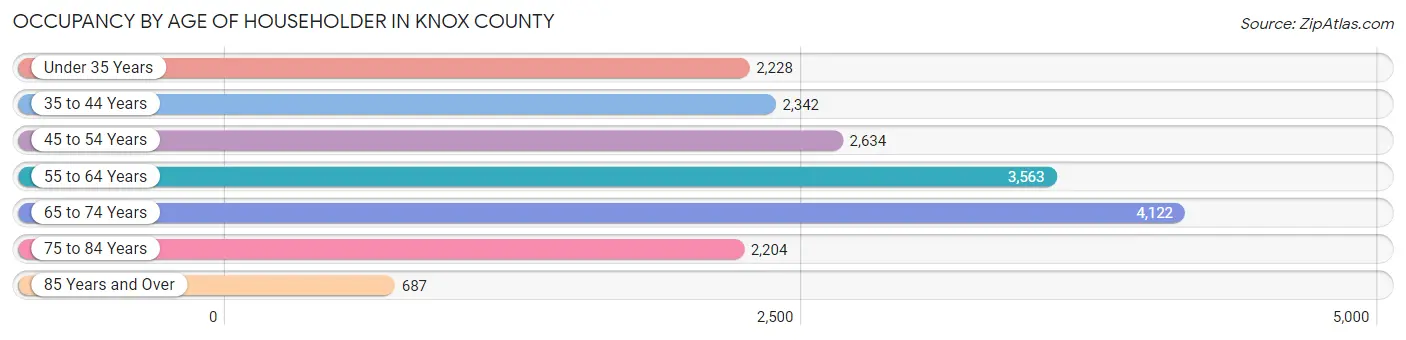
| Age Bracket | # Households | % Households |
| Under 35 Years | 2,228 | 12.5% |
| 35 to 44 Years | 2,342 | 13.2% |
| 45 to 54 Years | 2,634 | 14.8% |
| 55 to 64 Years | 3,563 | 20.0% |
| 65 to 74 Years | 4,122 | 23.2% |
| 75 to 84 Years | 2,204 | 12.4% |
| 85 Years and Over | 687 | 3.9% |
| Total | 17,780 | 100.0% |
Housing Finances in Knox County
Median Income by Occupancy in Knox County

| Occupancy Type | # Households | Median Income |
| Owner-Occupied | 14,084 (79.2%) | $80,538 |
| Renter-Occupied | 3,696 (20.8%) | $38,185 |
| Average | 17,780 (100.0%) | $68,904 |
Occupancy by Householder Income Bracket in Knox County
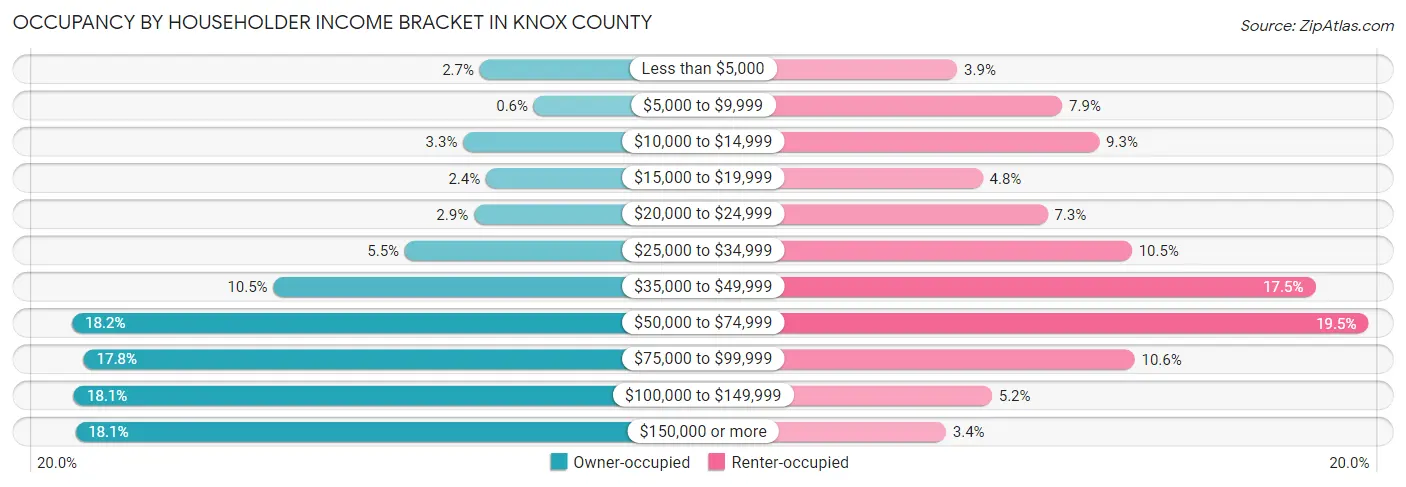
| Income Bracket | Owner-occupied | Renter-occupied |
| Less than $5,000 | 374 (2.7%) | 143 (3.9%) |
| $5,000 to $9,999 | 84 (0.6%) | 291 (7.9%) |
| $10,000 to $14,999 | 463 (3.3%) | 343 (9.3%) |
| $15,000 to $19,999 | 341 (2.4%) | 179 (4.8%) |
| $20,000 to $24,999 | 405 (2.9%) | 270 (7.3%) |
| $25,000 to $34,999 | 776 (5.5%) | 389 (10.5%) |
| $35,000 to $49,999 | 1,482 (10.5%) | 647 (17.5%) |
| $50,000 to $74,999 | 2,562 (18.2%) | 722 (19.5%) |
| $75,000 to $99,999 | 2,500 (17.7%) | 393 (10.6%) |
| $100,000 to $149,999 | 2,552 (18.1%) | 192 (5.2%) |
| $150,000 or more | 2,545 (18.1%) | 127 (3.4%) |
| Total | 14,084 (100.0%) | 3,696 (100.0%) |
Monthly Housing Cost Tiers in Knox County
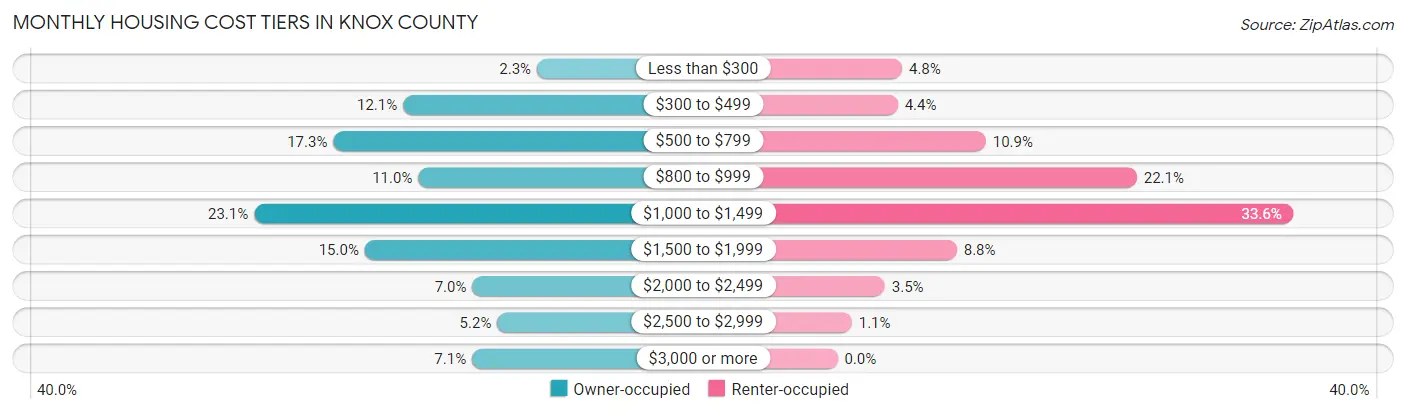
| Monthly Cost | Owner-occupied | Renter-occupied |
| Less than $300 | 320 (2.3%) | 176 (4.8%) |
| $300 to $499 | 1,708 (12.1%) | 164 (4.4%) |
| $500 to $799 | 2,432 (17.3%) | 404 (10.9%) |
| $800 to $999 | 1,551 (11.0%) | 815 (22.1%) |
| $1,000 to $1,499 | 3,253 (23.1%) | 1,242 (33.6%) |
| $1,500 to $1,999 | 2,106 (14.9%) | 325 (8.8%) |
| $2,000 to $2,499 | 990 (7.0%) | 129 (3.5%) |
| $2,500 to $2,999 | 731 (5.2%) | 39 (1.1%) |
| $3,000 or more | 993 (7.0%) | 0 (0.0%) |
| Total | 14,084 (100.0%) | 3,696 (100.0%) |
Physical Housing Characteristics in Knox County
Housing Structures in Knox County

| Structure Type | # Housing Units | % Housing Units |
| Single Unit, Detached | 13,484 | 75.8% |
| Single Unit, Attached | 358 | 2.0% |
| 2 Unit Apartments | 959 | 5.4% |
| 3 or 4 Unit Apartments | 562 | 3.2% |
| 5 to 9 Unit Apartments | 314 | 1.8% |
| 10 or more Apartments | 587 | 3.3% |
| Mobile Home / Other | 1,516 | 8.5% |
| Total | 17,780 | 100.0% |
Housing Structures by Occupancy in Knox County
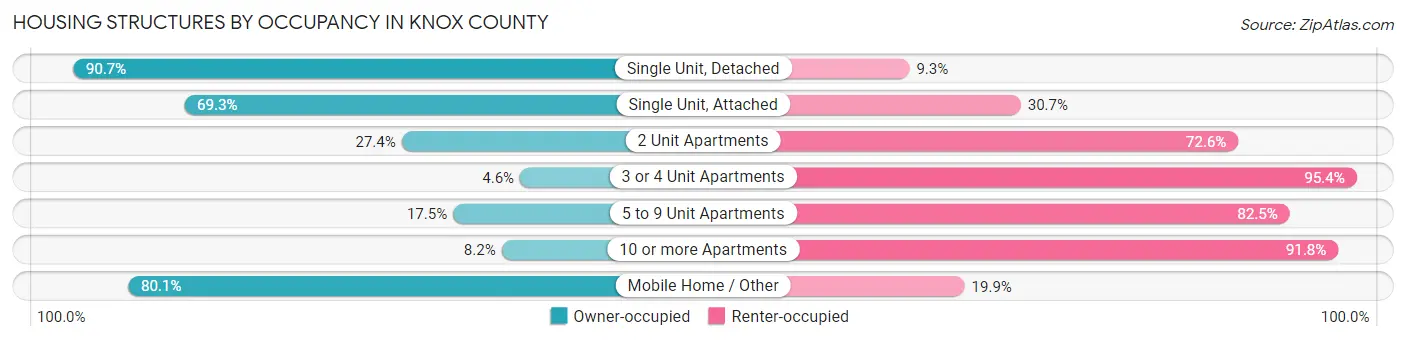
| Structure Type | Owner-occupied | Renter-occupied |
| Single Unit, Detached | 12,230 (90.7%) | 1,254 (9.3%) |
| Single Unit, Attached | 248 (69.3%) | 110 (30.7%) |
| 2 Unit Apartments | 263 (27.4%) | 696 (72.6%) |
| 3 or 4 Unit Apartments | 26 (4.6%) | 536 (95.4%) |
| 5 to 9 Unit Apartments | 55 (17.5%) | 259 (82.5%) |
| 10 or more Apartments | 48 (8.2%) | 539 (91.8%) |
| Mobile Home / Other | 1,214 (80.1%) | 302 (19.9%) |
| Total | 14,084 (79.2%) | 3,696 (20.8%) |
Housing Structures by Number of Rooms in Knox County
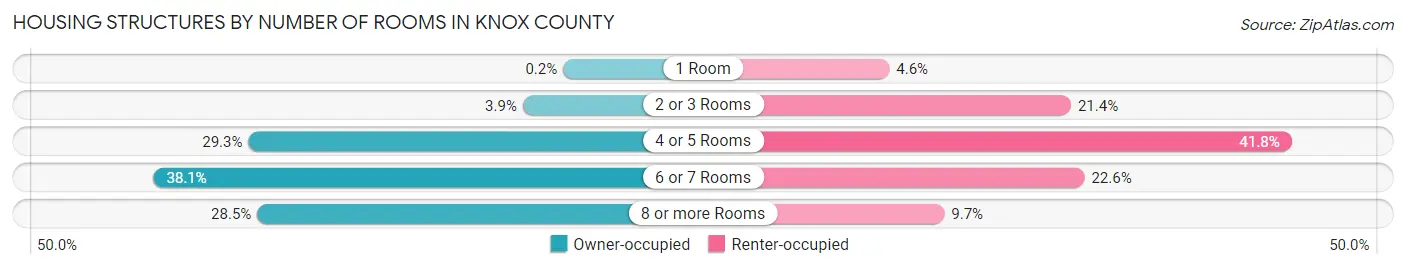
| Number of Rooms | Owner-occupied | Renter-occupied |
| 1 Room | 28 (0.2%) | 169 (4.6%) |
| 2 or 3 Rooms | 553 (3.9%) | 790 (21.4%) |
| 4 or 5 Rooms | 4,128 (29.3%) | 1,544 (41.8%) |
| 6 or 7 Rooms | 5,363 (38.1%) | 836 (22.6%) |
| 8 or more Rooms | 4,012 (28.5%) | 357 (9.7%) |
| Total | 14,084 (100.0%) | 3,696 (100.0%) |
Housing Structure by Heating Type in Knox County
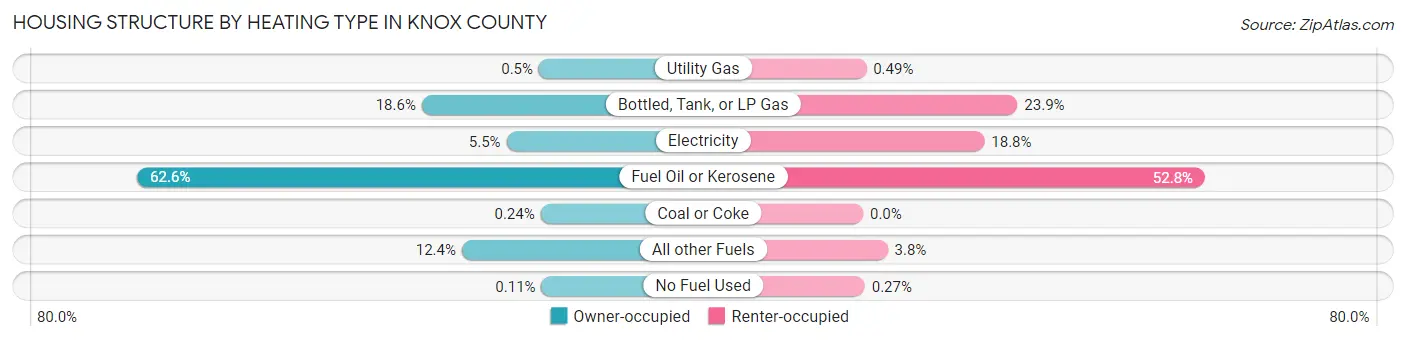
| Heating Type | Owner-occupied | Renter-occupied |
| Utility Gas | 70 (0.5%) | 18 (0.5%) |
| Bottled, Tank, or LP Gas | 2,621 (18.6%) | 882 (23.9%) |
| Electricity | 776 (5.5%) | 693 (18.8%) |
| Fuel Oil or Kerosene | 8,820 (62.6%) | 1,953 (52.8%) |
| Coal or Coke | 34 (0.2%) | 0 (0.0%) |
| All other Fuels | 1,748 (12.4%) | 140 (3.8%) |
| No Fuel Used | 15 (0.1%) | 10 (0.3%) |
| Total | 14,084 (100.0%) | 3,696 (100.0%) |
Household Vehicle Usage in Knox County
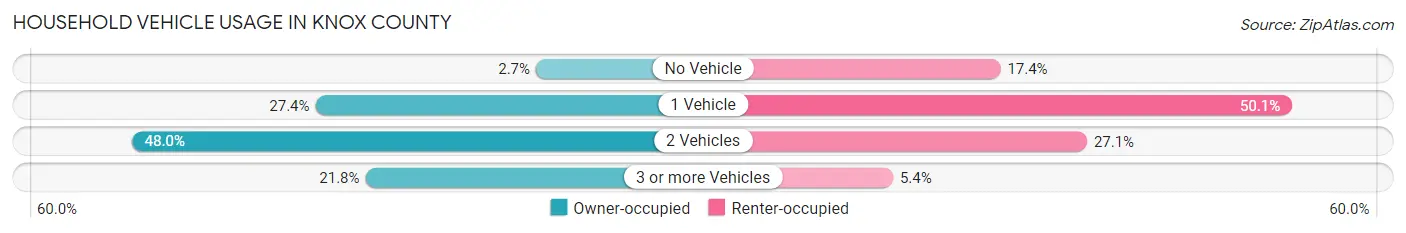
| Vehicles per Household | Owner-occupied | Renter-occupied |
| No Vehicle | 384 (2.7%) | 644 (17.4%) |
| 1 Vehicle | 3,863 (27.4%) | 1,851 (50.1%) |
| 2 Vehicles | 6,762 (48.0%) | 1,002 (27.1%) |
| 3 or more Vehicles | 3,075 (21.8%) | 199 (5.4%) |
| Total | 14,084 (100.0%) | 3,696 (100.0%) |
Real Estate & Mortgages in Knox County
Real Estate and Mortgage Overview in Knox County
| Characteristic | Without Mortgage | With Mortgage |
| Housing Units | 5,883 | 8,201 |
| Median Property Value | $264,200 | $258,500 |
| Median Household Income | $64,525 | $1,761 |
| Monthly Housing Costs | $646 | $968 |
| Real Estate Taxes | $3,468 | $3 |
Property Value by Mortgage Status in Knox County
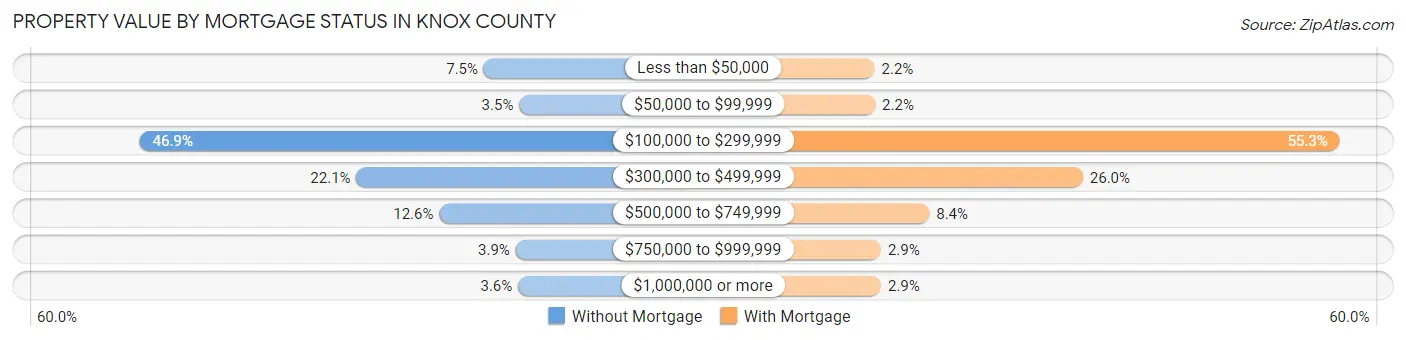
| Property Value | Without Mortgage | With Mortgage |
| Less than $50,000 | 442 (7.5%) | 179 (2.2%) |
| $50,000 to $99,999 | 204 (3.5%) | 184 (2.2%) |
| $100,000 to $299,999 | 2,756 (46.9%) | 4,538 (55.3%) |
| $300,000 to $499,999 | 1,299 (22.1%) | 2,131 (26.0%) |
| $500,000 to $749,999 | 742 (12.6%) | 691 (8.4%) |
| $750,000 to $999,999 | 228 (3.9%) | 239 (2.9%) |
| $1,000,000 or more | 212 (3.6%) | 239 (2.9%) |
| Total | 5,883 (100.0%) | 8,201 (100.0%) |
Household Income by Mortgage Status in Knox County
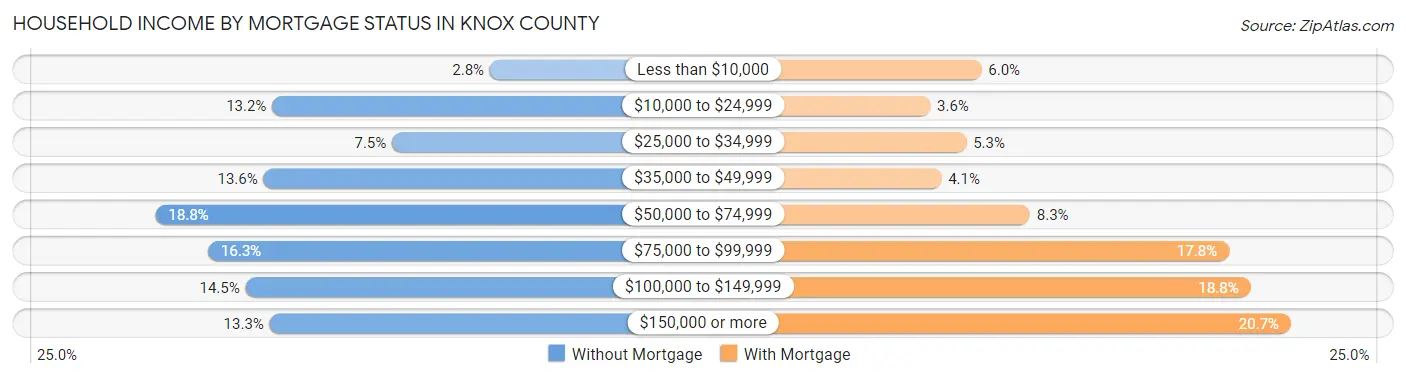
| Household Income | Without Mortgage | With Mortgage |
| Less than $10,000 | 167 (2.8%) | 491 (6.0%) |
| $10,000 to $24,999 | 777 (13.2%) | 291 (3.5%) |
| $25,000 to $34,999 | 441 (7.5%) | 432 (5.3%) |
| $35,000 to $49,999 | 801 (13.6%) | 335 (4.1%) |
| $50,000 to $74,999 | 1,104 (18.8%) | 681 (8.3%) |
| $75,000 to $99,999 | 957 (16.3%) | 1,458 (17.8%) |
| $100,000 to $149,999 | 852 (14.5%) | 1,543 (18.8%) |
| $150,000 or more | 784 (13.3%) | 1,700 (20.7%) |
| Total | 5,883 (100.0%) | 8,201 (100.0%) |
Property Value to Household Income Ratio in Knox County
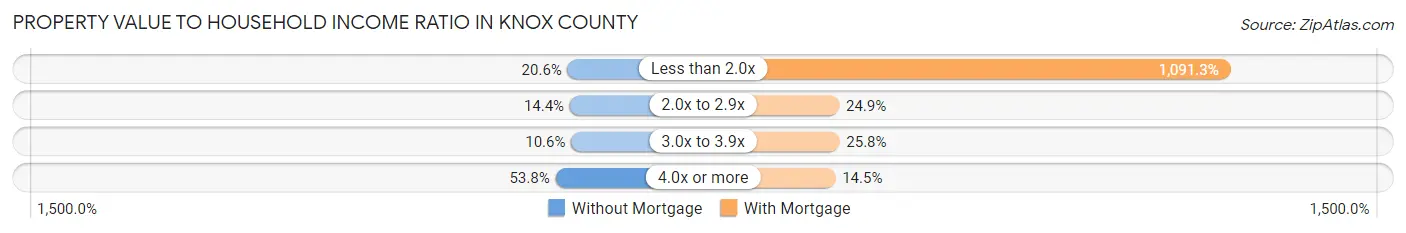
| Value-to-Income Ratio | Without Mortgage | With Mortgage |
| Less than 2.0x | 1,211 (20.6%) | 89,497 (1,091.3%) |
| 2.0x to 2.9x | 848 (14.4%) | 2,044 (24.9%) |
| 3.0x to 3.9x | 623 (10.6%) | 2,113 (25.8%) |
| 4.0x or more | 3,162 (53.7%) | 1,189 (14.5%) |
| Total | 5,883 (100.0%) | 8,201 (100.0%) |
Real Estate Taxes by Mortgage Status in Knox County
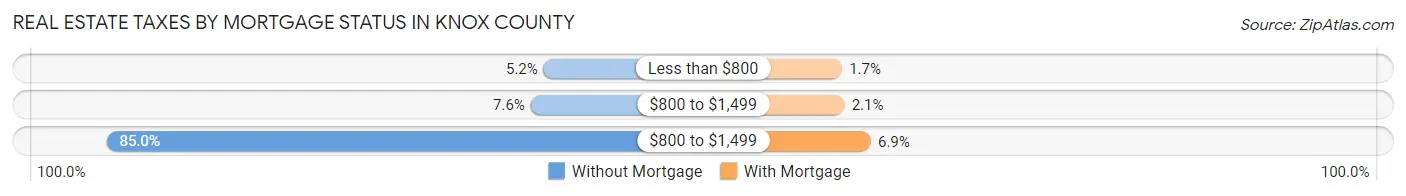
| Property Taxes | Without Mortgage | With Mortgage |
| Less than $800 | 306 (5.2%) | 137 (1.7%) |
| $800 to $1,499 | 445 (7.6%) | 175 (2.1%) |
| $800 to $1,499 | 5,003 (85.0%) | 569 (6.9%) |
| Total | 5,883 (100.0%) | 8,201 (100.0%) |
Health & Disability in Knox County
Health Insurance Coverage by Age in Knox County
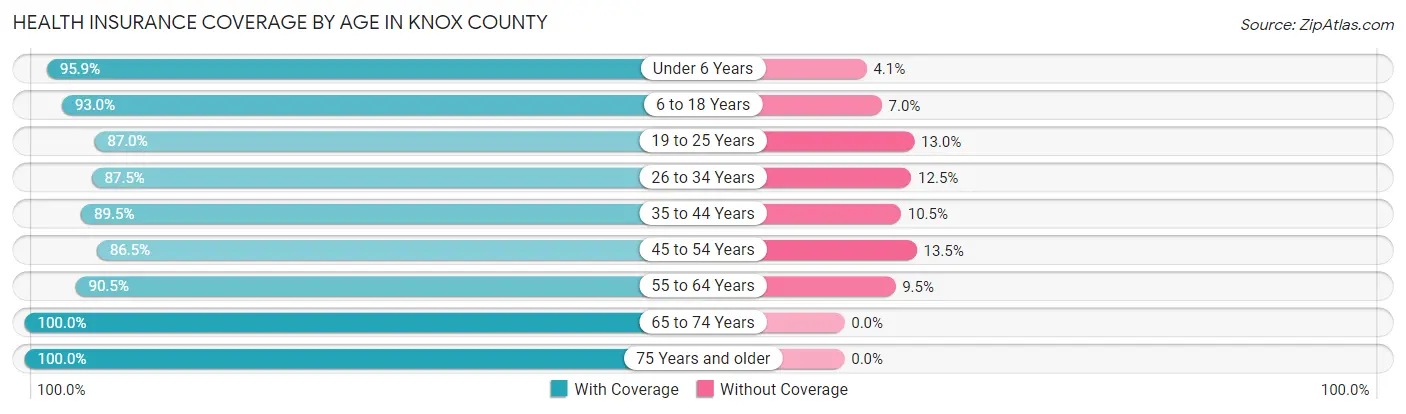
| Age Bracket | With Coverage | Without Coverage |
| Under 6 Years | 1,851 (95.9%) | 80 (4.1%) |
| 6 to 18 Years | 5,040 (93.0%) | 377 (7.0%) |
| 19 to 25 Years | 2,305 (87.0%) | 345 (13.0%) |
| 26 to 34 Years | 2,886 (87.5%) | 411 (12.5%) |
| 35 to 44 Years | 3,770 (89.5%) | 444 (10.5%) |
| 45 to 54 Years | 4,309 (86.5%) | 671 (13.5%) |
| 55 to 64 Years | 5,650 (90.5%) | 593 (9.5%) |
| 65 to 74 Years | 6,365 (100.0%) | 0 (0.0%) |
| 75 Years and older | 4,138 (100.0%) | 0 (0.0%) |
| Total | 36,314 (92.6%) | 2,921 (7.4%) |
Health Insurance Coverage by Citizenship Status in Knox County
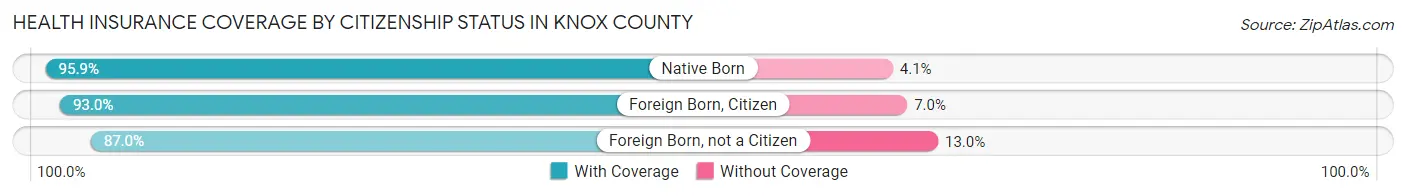
| Citizenship Status | With Coverage | Without Coverage |
| Native Born | 1,851 (95.9%) | 80 (4.1%) |
| Foreign Born, Citizen | 5,040 (93.0%) | 377 (7.0%) |
| Foreign Born, not a Citizen | 2,305 (87.0%) | 345 (13.0%) |
Health Insurance Coverage by Household Income in Knox County
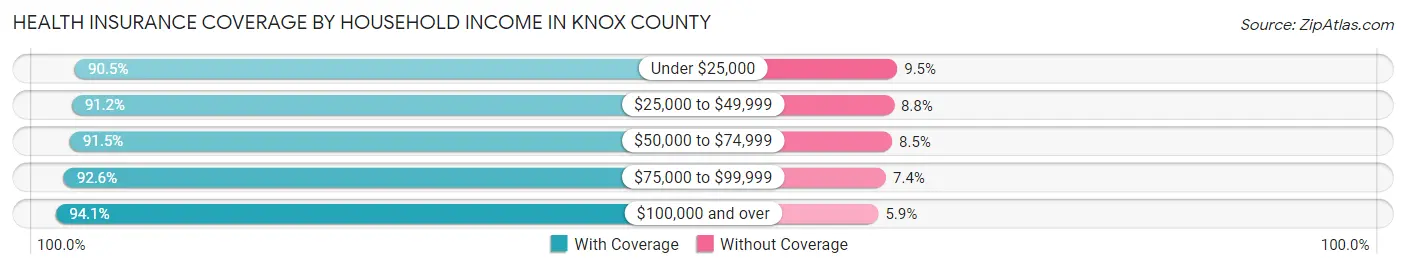
| Household Income | With Coverage | Without Coverage |
| Under $25,000 | 3,713 (90.5%) | 388 (9.5%) |
| $25,000 to $49,999 | 5,196 (91.2%) | 503 (8.8%) |
| $50,000 to $74,999 | 6,637 (91.5%) | 616 (8.5%) |
| $75,000 to $99,999 | 6,471 (92.6%) | 514 (7.4%) |
| $100,000 and over | 14,085 (94.1%) | 890 (5.9%) |
Public vs Private Health Insurance Coverage by Age in Knox County
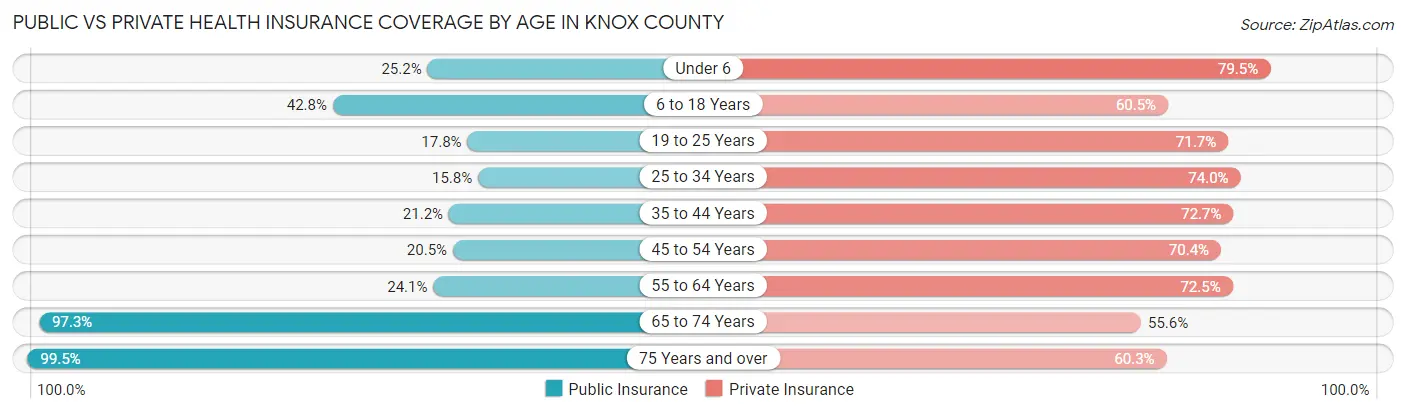
| Age Bracket | Public Insurance | Private Insurance |
| Under 6 | 487 (25.2%) | 1,535 (79.5%) |
| 6 to 18 Years | 2,318 (42.8%) | 3,279 (60.5%) |
| 19 to 25 Years | 472 (17.8%) | 1,900 (71.7%) |
| 25 to 34 Years | 522 (15.8%) | 2,439 (74.0%) |
| 35 to 44 Years | 895 (21.2%) | 3,062 (72.7%) |
| 45 to 54 Years | 1,021 (20.5%) | 3,504 (70.4%) |
| 55 to 64 Years | 1,507 (24.1%) | 4,527 (72.5%) |
| 65 to 74 Years | 6,195 (97.3%) | 3,536 (55.5%) |
| 75 Years and over | 4,116 (99.5%) | 2,493 (60.3%) |
| Total | 17,533 (44.7%) | 26,275 (67.0%) |
Disability Status by Sex by Age in Knox County
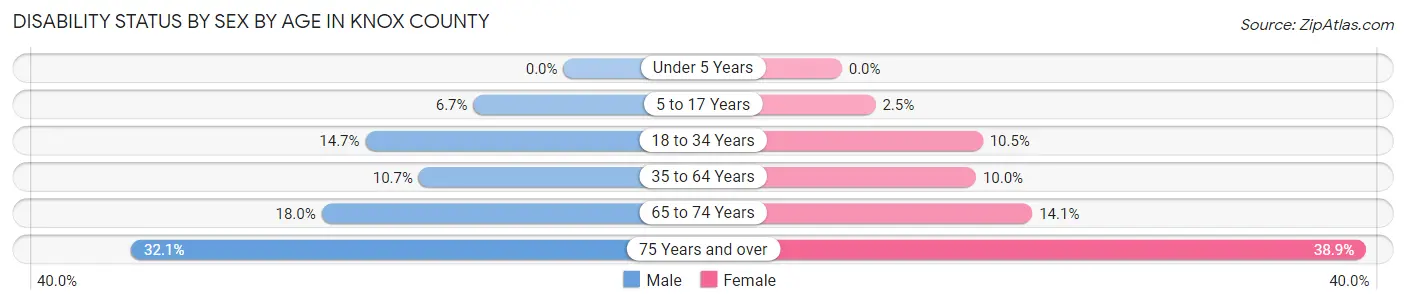
| Age Bracket | Male | Female |
| Under 5 Years | 0 (0.0%) | 0 (0.0%) |
| 5 to 17 Years | 203 (6.7%) | 61 (2.5%) |
| 18 to 34 Years | 461 (14.7%) | 326 (10.5%) |
| 35 to 64 Years | 797 (10.7%) | 798 (10.0%) |
| 65 to 74 Years | 537 (17.9%) | 477 (14.1%) |
| 75 Years and over | 585 (32.1%) | 901 (38.9%) |
Disability Class by Sex by Age in Knox County
Disability Class: Hearing Difficulty
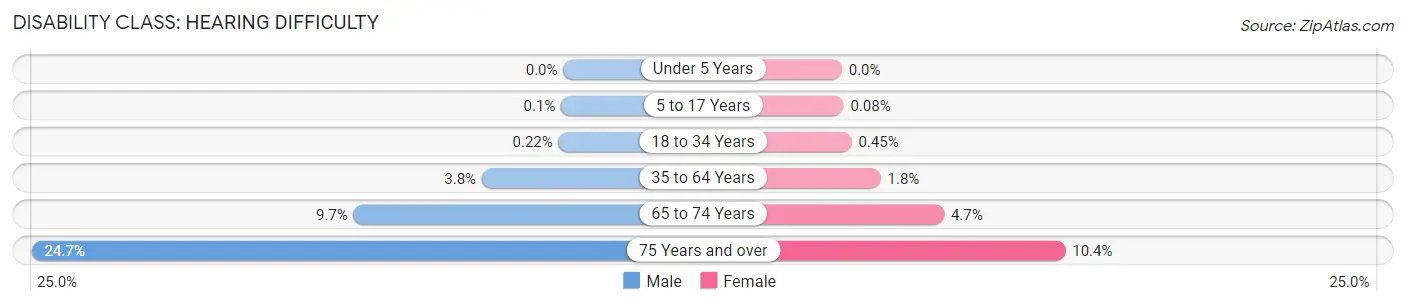
| Age Bracket | Male | Female |
| Under 5 Years | 0 (0.0%) | 0 (0.0%) |
| 5 to 17 Years | 3 (0.1%) | 2 (0.1%) |
| 18 to 34 Years | 7 (0.2%) | 14 (0.4%) |
| 35 to 64 Years | 281 (3.8%) | 144 (1.8%) |
| 65 to 74 Years | 291 (9.7%) | 160 (4.7%) |
| 75 Years and over | 450 (24.7%) | 240 (10.4%) |
Disability Class: Vision Difficulty
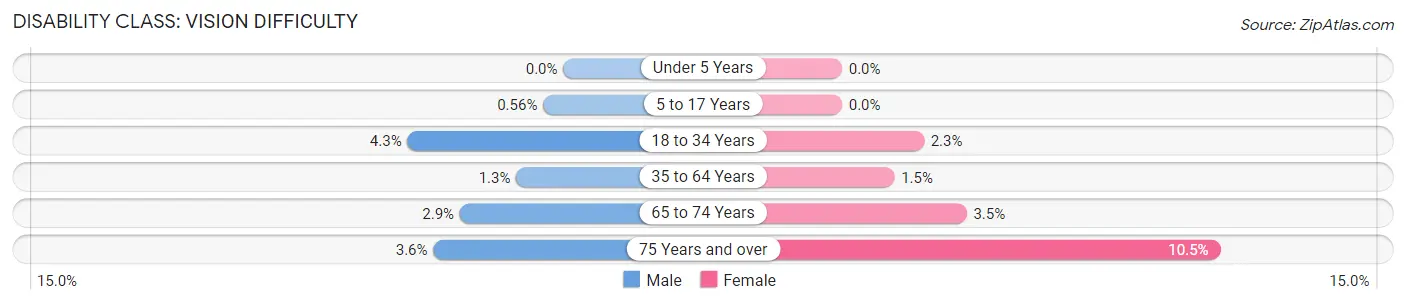
| Age Bracket | Male | Female |
| Under 5 Years | 0 (0.0%) | 0 (0.0%) |
| 5 to 17 Years | 17 (0.6%) | 0 (0.0%) |
| 18 to 34 Years | 136 (4.3%) | 71 (2.3%) |
| 35 to 64 Years | 97 (1.3%) | 117 (1.5%) |
| 65 to 74 Years | 86 (2.9%) | 117 (3.5%) |
| 75 Years and over | 66 (3.6%) | 244 (10.5%) |
Disability Class: Cognitive Difficulty
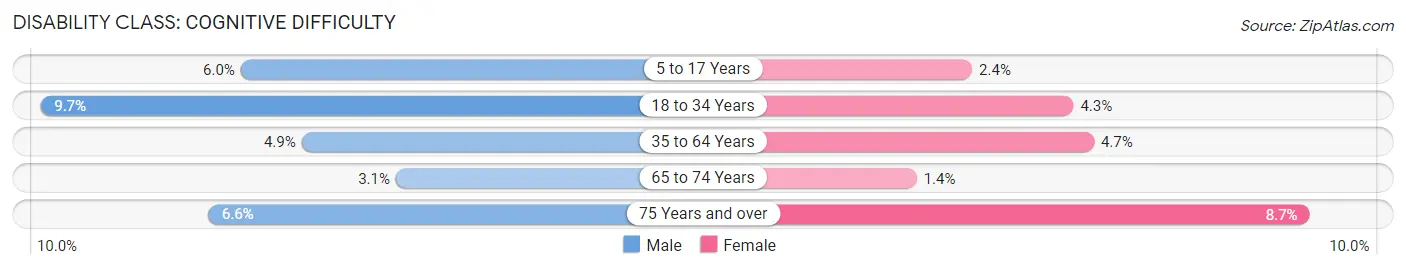
| Age Bracket | Male | Female |
| 5 to 17 Years | 182 (6.0%) | 59 (2.4%) |
| 18 to 34 Years | 304 (9.7%) | 134 (4.3%) |
| 35 to 64 Years | 361 (4.9%) | 375 (4.7%) |
| 65 to 74 Years | 93 (3.1%) | 47 (1.4%) |
| 75 Years and over | 120 (6.6%) | 201 (8.7%) |
Disability Class: Ambulatory Difficulty
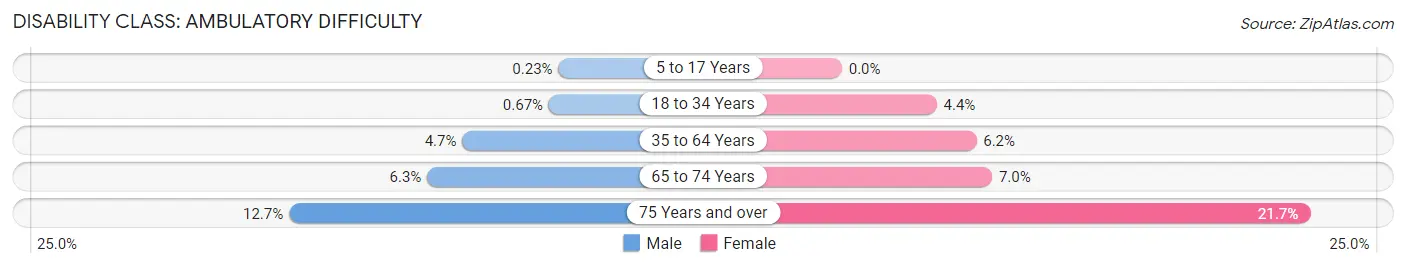
| Age Bracket | Male | Female |
| 5 to 17 Years | 7 (0.2%) | 0 (0.0%) |
| 18 to 34 Years | 21 (0.7%) | 137 (4.4%) |
| 35 to 64 Years | 348 (4.7%) | 500 (6.2%) |
| 65 to 74 Years | 189 (6.3%) | 235 (7.0%) |
| 75 Years and over | 232 (12.7%) | 503 (21.7%) |
Disability Class: Self-Care Difficulty
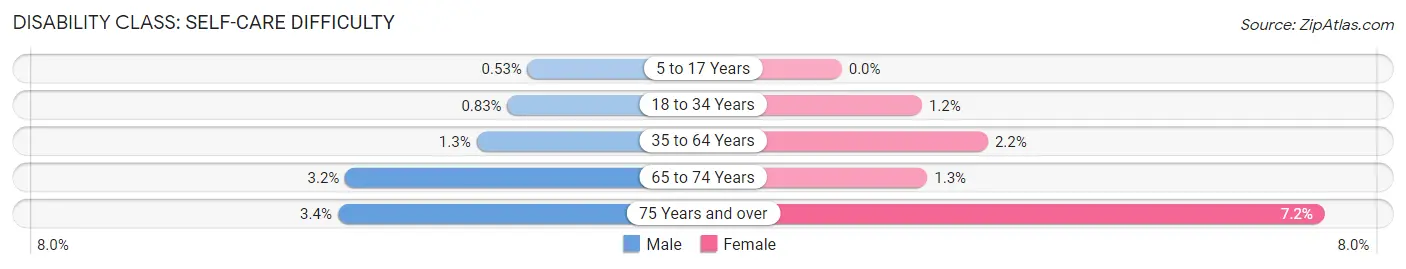
| Age Bracket | Male | Female |
| 5 to 17 Years | 16 (0.5%) | 0 (0.0%) |
| 18 to 34 Years | 26 (0.8%) | 37 (1.2%) |
| 35 to 64 Years | 96 (1.3%) | 174 (2.2%) |
| 65 to 74 Years | 97 (3.2%) | 43 (1.3%) |
| 75 Years and over | 61 (3.4%) | 166 (7.2%) |
Technology Access in Knox County
Computing Device Access in Knox County
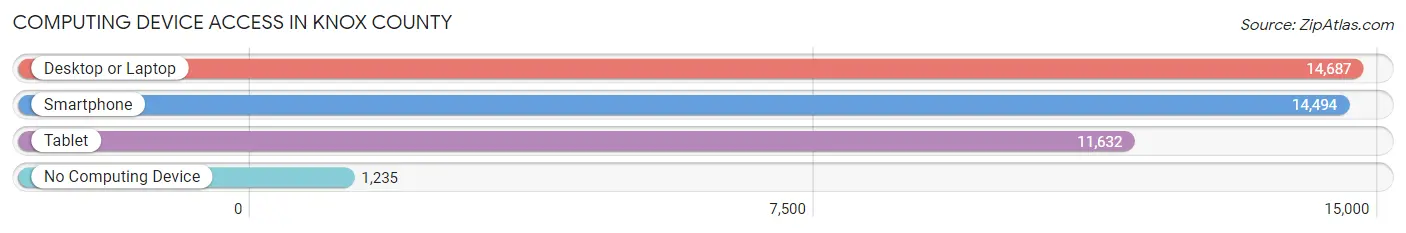
| Device Type | # Households | % Households |
| Desktop or Laptop | 14,687 | 82.6% |
| Smartphone | 14,494 | 81.5% |
| Tablet | 11,632 | 65.4% |
| No Computing Device | 1,235 | 7.0% |
| Total | 17,780 | 100.0% |
Internet Access in Knox County

| Internet Type | # Households | % Households |
| Dial-Up Internet | 133 | 0.7% |
| Broadband Home | 13,540 | 76.1% |
| Cellular Data Only | 1,421 | 8.0% |
| Satellite Internet | 947 | 5.3% |
| No Internet | 1,908 | 10.7% |
| Total | 17,780 | 100.0% |
Knox County Summary
Knox County, Maine is located in the Mid-Coast region of the state and is bordered by Lincoln County to the east, Waldo County to the north, and Penobscot Bay to the south. The county seat is Rockland, and the county is home to a population of 39,736 people, as of the 2010 census.
History
Knox County was established in 1860 from parts of Lincoln and Waldo counties. The county was named after Major General Henry Knox, who served as the first United States Secretary of War. The county was originally home to the Abenaki Native American tribe, who were displaced by European settlers in the 17th century.
The county was largely agricultural in the 19th century, with the primary crops being potatoes, hay, and apples. The county also had a thriving fishing industry, with the primary catches being cod, haddock, and mackerel.
In the late 19th century, the county began to experience an influx of immigrants from Europe, particularly from Italy and Poland. This influx of immigrants helped to diversify the county’s economy and population.
Geography
Knox County is located in the Mid-Coast region of Maine and is bordered by Lincoln County to the east, Waldo County to the north, and Penobscot Bay to the south. The county is home to a total area of 1,053 square miles, of which 990 square miles is land and 63 square miles is water.
The county is home to several islands, including Vinalhaven, North Haven, and Matinicus. The highest point in the county is Mount Kineo, which has an elevation of 1,906 feet.
Economy
The economy of Knox County is largely based on tourism, fishing, and agriculture. The county is home to several tourist attractions, including the Farnsworth Art Museum, the Maine Lighthouse Museum, and the Owls Head Transportation Museum.
The county is also home to a thriving fishing industry, with the primary catches being cod, haddock, and mackerel. The county is also home to several farms, which produce a variety of crops, including potatoes, hay, and apples.
Demographics
As of the 2010 census, the population of Knox County was 39,736 people. The racial makeup of the county was 94.3% White, 1.2% African American, 0.7% Native American, 0.7% Asian, 0.1% Pacific Islander, 1.2% from other races, and 2.0% from two or more races.
The median household income in the county was $41,945, and the median family income was $50,945. The per capita income in the county was $22,945. Approximately 11.2% of the population was below the poverty line.
Common Questions
What is the Total Population of Knox County?
Total Population of Knox County is 40,729.
What is the Total Male Population of Knox County?
Total Male Population of Knox County is 20,526.
What is the Total Female Population of Knox County?
Total Female Population of Knox County is 20,203.
What is the Ratio of Males per 100 Females in Knox County?
There are 101.60 Males per 100 Females in Knox County.
What is the Ratio of Females per 100 Males in Knox County?
There are 98.43 Females per 100 Males in Knox County.
What is the Median Population Age in Knox County?
Median Population Age in Knox County is 49.0 Years.
What is the Average Family Size in Knox County
Average Family Size in Knox County is 2.8 People.
What is the Average Household Size in Knox County
Average Household Size in Knox County is 2.2 People.
What is Per Capita Income in Knox County?
Per Capita income in Knox County is $39,379.
What is the Median Family Income in Knox County?
Median Family Income in Knox County is $87,745.
What is the Median Household income in Knox County?
Median Household Income in Knox County is $68,904.
What is Income or Wage Gap in Knox County?
Income or Wage Gap in Knox County is 30.7%.
Women in Knox County earn 69.3 cents for every dollar earned by a man.
What is Inequality or Gini Index in Knox County?
Inequality or Gini Index in Knox County is 0.44.
How Large is the Labor Force in Knox County?
There are 20,224 People in the Labor Forcein in Knox County.
What is the Percentage of People in the Labor Force in Knox County?
58.1% of People are in the Labor Force in Knox County.
What is the Unemployment Rate in Knox County?
Unemployment Rate in Knox County is 3.8%.