Hancock County, ME
Hancock County Map
Hancock County Overview
55,851
TOTAL POPULATION
27,342
MALE POPULATION
28,509
FEMALE POPULATION
95.91
MALES / 100 FEMALES
104.27
FEMALES / 100 MALES
48.9
MEDIAN AGE
2.8
AVG FAMILY SIZE
2.2
AVG HOUSEHOLD SIZE
$38,785
PER CAPITA INCOME
$83,194
AVG FAMILY INCOME
$64,149
AVG HOUSEHOLD INCOME
24.5%
WAGE / INCOME GAP [ % ]
75.5¢/ $1
WAGE / INCOME GAP [ $ ]
$10,396
FAMILY INCOME DEFICIT
0.45
INEQUALITY / GINI INDEX
29,274
LABOR FORCE [ PEOPLE ]
61.2%
PERCENT IN LABOR FORCE
3.9%
UNEMPLOYMENT RATE
Hancock County Area Codes
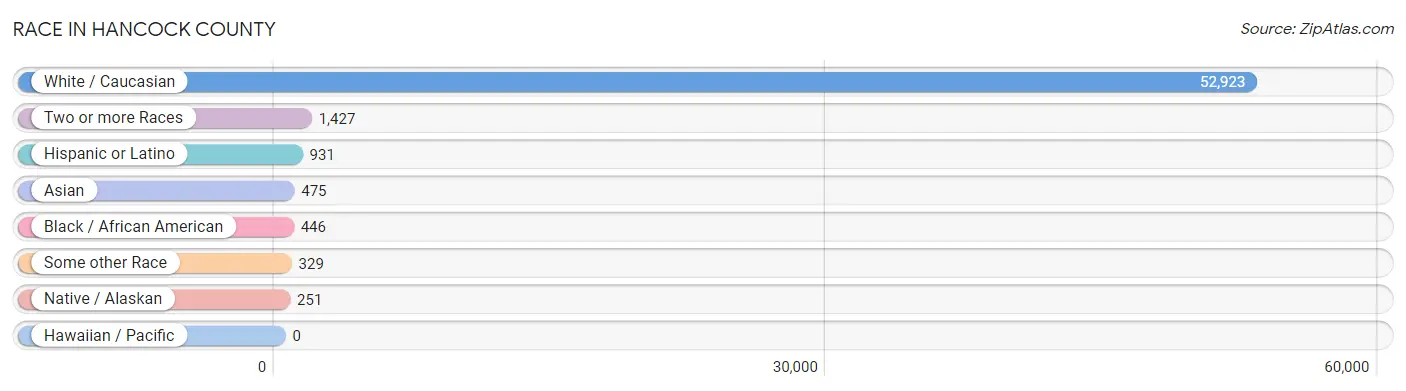
Race in Hancock County
The most populous races in Hancock County are White / Caucasian (52,923 | 94.8%), Two or more Races (1,427 | 2.6%), and Hispanic or Latino (931 | 1.7%).
| Race | # Population | % Population |
| Asian | 475 | 0.9% |
| Black / African American | 446 | 0.8% |
| Hawaiian / Pacific | 0 | 0.0% |
| Hispanic or Latino | 931 | 1.7% |
| Native / Alaskan | 251 | 0.4% |
| White / Caucasian | 52,923 | 94.8% |
| Two or more Races | 1,427 | 2.6% |
| Some other Race | 329 | 0.6% |
| Total | 55,851 | 100.0% |
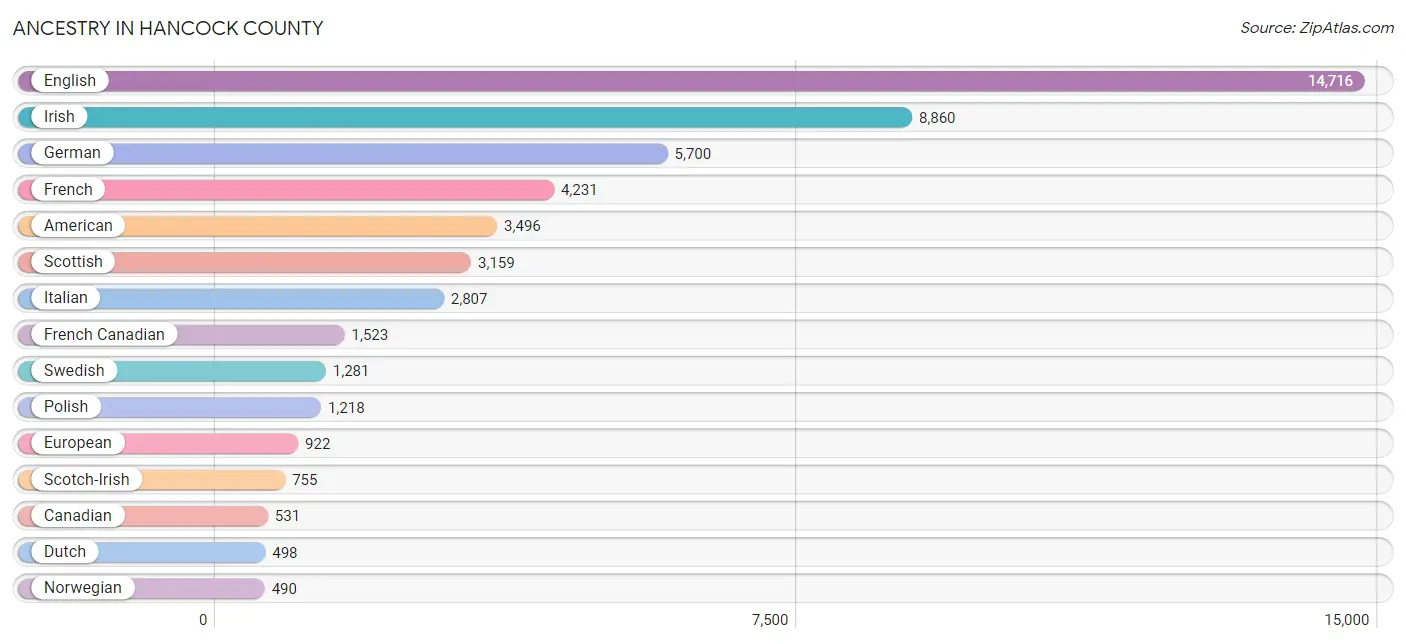
Ancestry in Hancock County
The most populous ancestries reported in Hancock County are English (14,716 | 26.4%), Irish (8,860 | 15.9%), German (5,700 | 10.2%), French (4,231 | 7.6%), and American (3,496 | 6.3%), together accounting for 66.3% of all Hancock County residents.
| Ancestry | # Population | % Population |
| African | 69 | 0.1% |
| Alsatian | 2 | 0.0% |
| American | 3,496 | 6.3% |
| Arab | 123 | 0.2% |
| Armenian | 87 | 0.2% |
| Australian | 11 | 0.0% |
| Austrian | 83 | 0.2% |
| Basque | 4 | 0.0% |
| Belgian | 25 | 0.0% |
| Bhutanese | 96 | 0.2% |
| Blackfeet | 3 | 0.0% |
| British | 450 | 0.8% |
| Bulgarian | 48 | 0.1% |
| Burmese | 206 | 0.4% |
| Cajun | 24 | 0.0% |
| Canadian | 531 | 0.9% |
| Celtic | 19 | 0.0% |
| Central American | 50 | 0.1% |
| Central American Indian | 2 | 0.0% |
| Cherokee | 25 | 0.0% |
| Chilean | 6 | 0.0% |
| Chippewa | 18 | 0.0% |
| Choctaw | 4 | 0.0% |
| Croatian | 4 | 0.0% |
| Cuban | 6 | 0.0% |
| Czech | 93 | 0.2% |
| Czechoslovakian | 109 | 0.2% |
| Danish | 393 | 0.7% |
| Dominican | 30 | 0.1% |
| Dutch | 498 | 0.9% |
| Eastern European | 112 | 0.2% |
| Ecuadorian | 27 | 0.1% |
| English | 14,716 | 26.4% |
| Estonian | 7 | 0.0% |
| Ethiopian | 6 | 0.0% |
| European | 922 | 1.7% |
| Finnish | 198 | 0.4% |
| French | 4,231 | 7.6% |
| French American Indian | 37 | 0.1% |
| French Canadian | 1,523 | 2.7% |
| German | 5,700 | 10.2% |
| Greek | 331 | 0.6% |
| Guatemalan | 31 | 0.1% |
| Haitian | 26 | 0.1% |
| Honduran | 1 | 0.0% |
| Hungarian | 212 | 0.4% |
| Icelander | 6 | 0.0% |
| Indian (Asian) | 166 | 0.3% |
| Iranian | 13 | 0.0% |
| Irish | 8,860 | 15.9% |
| Iroquois | 20 | 0.0% |
| Israeli | 7 | 0.0% |
| Italian | 2,807 | 5.0% |
| Jamaican | 87 | 0.2% |
| Korean | 208 | 0.4% |
| Laotian | 18 | 0.0% |
| Latvian | 16 | 0.0% |
| Lebanese | 102 | 0.2% |
| Lithuanian | 134 | 0.2% |
| Macedonian | 8 | 0.0% |
| Mexican | 244 | 0.4% |
| Native Hawaiian | 4 | 0.0% |
| Navajo | 5 | 0.0% |
| New Zealander | 6 | 0.0% |
| Nigerian | 5 | 0.0% |
| Northern European | 84 | 0.2% |
| Norwegian | 490 | 0.9% |
| Pakistani | 42 | 0.1% |
| Panamanian | 5 | 0.0% |
| Pennsylvania German | 100 | 0.2% |
| Peruvian | 9 | 0.0% |
| Polish | 1,218 | 2.2% |
| Portuguese | 315 | 0.6% |
| Puerto Rican | 399 | 0.7% |
| Romanian | 27 | 0.1% |
| Russian | 390 | 0.7% |
| Salvadoran | 13 | 0.0% |
| Scandinavian | 160 | 0.3% |
| Scotch-Irish | 755 | 1.3% |
| Scottish | 3,159 | 5.7% |
| Sioux | 58 | 0.1% |
| Slavic | 7 | 0.0% |
| Slovak | 106 | 0.2% |
| Slovene | 26 | 0.1% |
| South American | 45 | 0.1% |
| South American Indian | 2 | 0.0% |
| Spaniard | 88 | 0.2% |
| Spanish | 47 | 0.1% |
| Sri Lankan | 38 | 0.1% |
| Subsaharan African | 93 | 0.2% |
| Sudanese | 5 | 0.0% |
| Swedish | 1,281 | 2.3% |
| Swiss | 97 | 0.2% |
| Syrian | 8 | 0.0% |
| Thai | 44 | 0.1% |
| Tlingit-Haida | 2 | 0.0% |
| Trinidadian and Tobagonian | 5 | 0.0% |
| Turkish | 9 | 0.0% |
| U.S. Virgin Islander | 2 | 0.0% |
| Ugandan | 6 | 0.0% |
| Ukrainian | 237 | 0.4% |
| Welsh | 397 | 0.7% |
| Yugoslavian | 11 | 0.0% | View All 103 Rows |
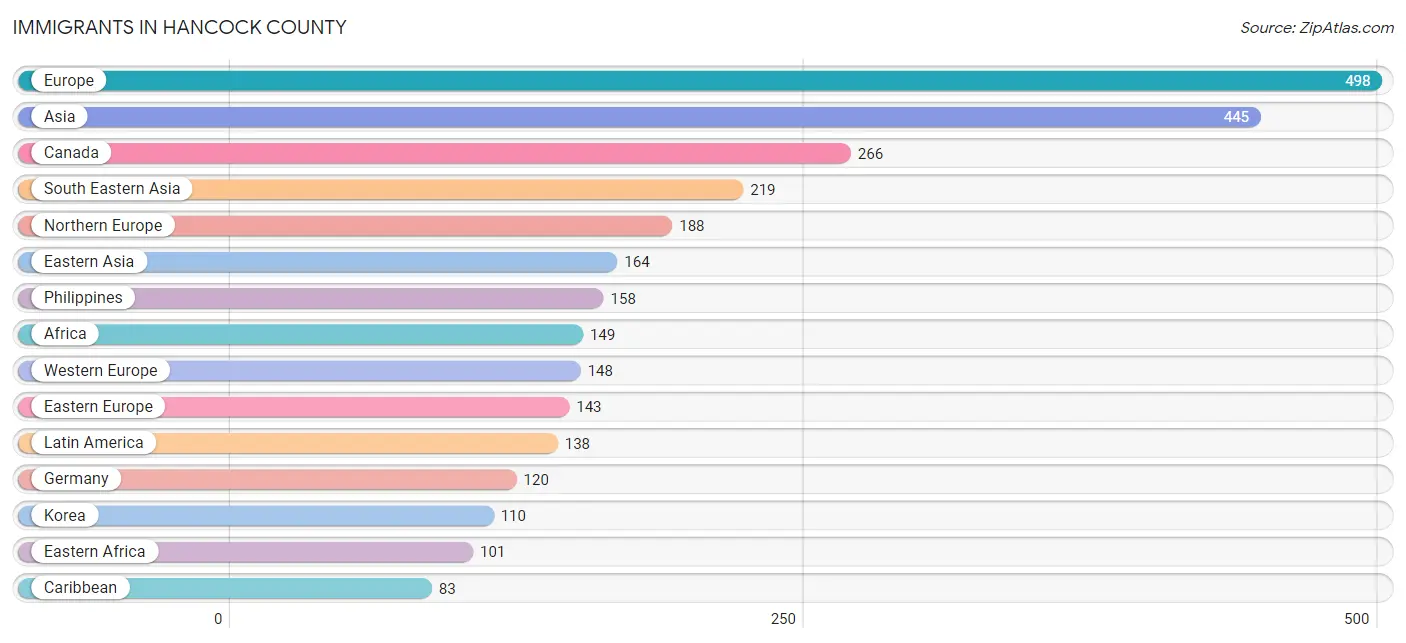
Immigrants in Hancock County
The most numerous immigrant groups reported in Hancock County came from Europe (498 | 0.9%), Asia (445 | 0.8%), Canada (266 | 0.5%), South Eastern Asia (219 | 0.4%), and Northern Europe (188 | 0.3%), together accounting for 2.9% of all Hancock County residents.
| Immigration Origin | # Population | % Population |
| Africa | 149 | 0.3% |
| Asia | 445 | 0.8% |
| Australia | 5 | 0.0% |
| Belgium | 5 | 0.0% |
| Cameroon | 7 | 0.0% |
| Canada | 266 | 0.5% |
| Caribbean | 83 | 0.2% |
| Central America | 28 | 0.1% |
| Chile | 17 | 0.0% |
| China | 28 | 0.1% |
| Congo | 13 | 0.0% |
| Cuba | 6 | 0.0% |
| Czechoslovakia | 6 | 0.0% |
| Denmark | 7 | 0.0% |
| Dominican Republic | 3 | 0.0% |
| Eastern Africa | 101 | 0.2% |
| Eastern Asia | 164 | 0.3% |
| Eastern Europe | 143 | 0.3% |
| El Salvador | 15 | 0.0% |
| England | 67 | 0.1% |
| Ethiopia | 6 | 0.0% |
| Europe | 498 | 0.9% |
| France | 10 | 0.0% |
| Germany | 120 | 0.2% |
| Honduras | 1 | 0.0% |
| Hungary | 43 | 0.1% |
| India | 27 | 0.1% |
| Indonesia | 18 | 0.0% |
| Iran | 13 | 0.0% |
| Ireland | 4 | 0.0% |
| Israel | 7 | 0.0% |
| Jamaica | 67 | 0.1% |
| Japan | 26 | 0.1% |
| Kenya | 75 | 0.1% |
| Korea | 110 | 0.2% |
| Latin America | 138 | 0.3% |
| Mexico | 7 | 0.0% |
| Middle Africa | 20 | 0.0% |
| Nepal | 8 | 0.0% |
| Netherlands | 13 | 0.0% |
| Nigeria | 2 | 0.0% |
| North Macedonia | 5 | 0.0% |
| Northern Europe | 188 | 0.3% |
| Oceania | 56 | 0.1% |
| Panama | 5 | 0.0% |
| Peru | 10 | 0.0% |
| Philippines | 158 | 0.3% |
| Poland | 20 | 0.0% |
| Portugal | 5 | 0.0% |
| Romania | 5 | 0.0% |
| Russia | 38 | 0.1% |
| South Africa | 26 | 0.1% |
| South America | 27 | 0.1% |
| South Central Asia | 48 | 0.1% |
| South Eastern Asia | 219 | 0.4% |
| Southern Europe | 19 | 0.0% |
| Spain | 14 | 0.0% |
| Thailand | 11 | 0.0% |
| Trinidad and Tobago | 7 | 0.0% |
| Uganda | 6 | 0.0% |
| Vietnam | 32 | 0.1% |
| Western Africa | 2 | 0.0% |
| Western Asia | 7 | 0.0% |
| Western Europe | 148 | 0.3% | View All 64 Rows |
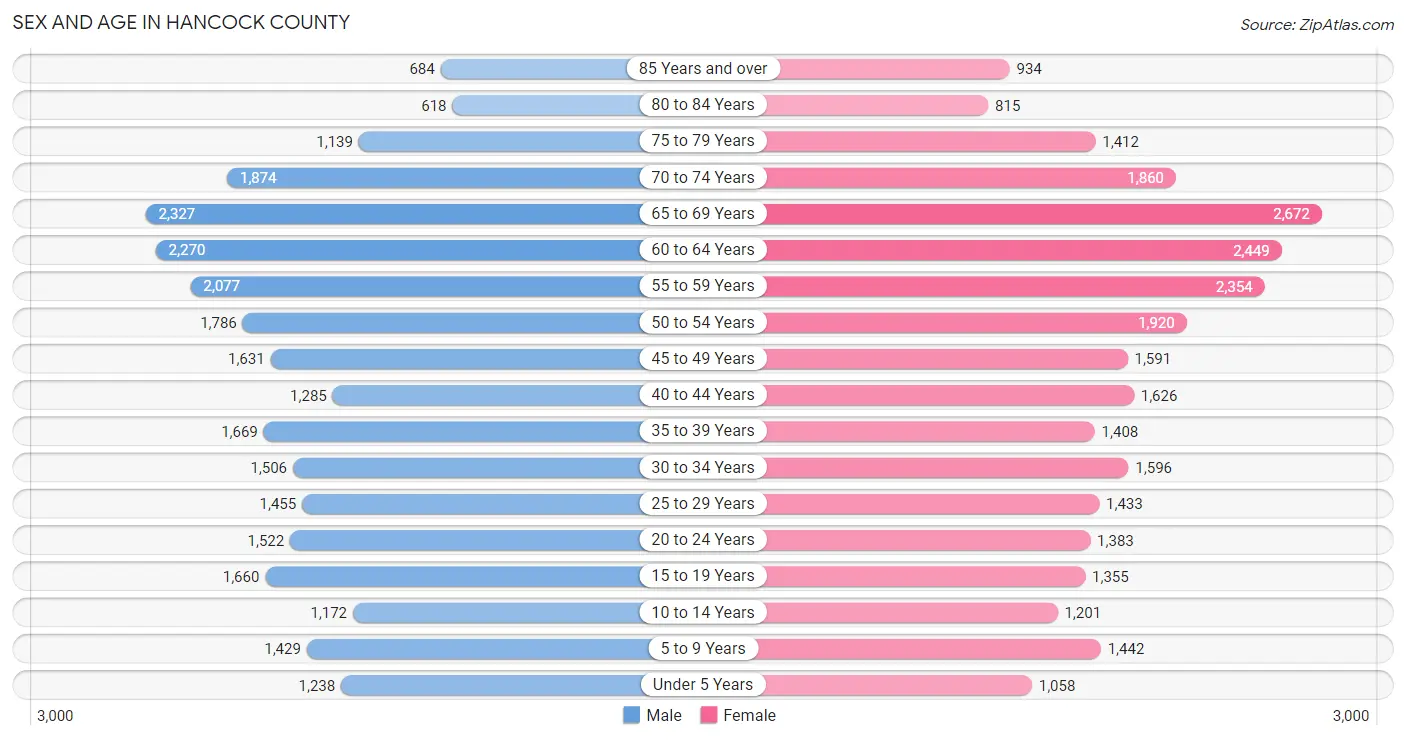
Sex and Age in Hancock County
Sex and Age in Hancock County
The most populous age groups in Hancock County are 65 to 69 Years (2,327 | 8.5%) for men and 65 to 69 Years (2,672 | 9.4%) for women.
| Age Bracket | Male | Female |
| Under 5 Years | 1,238 (4.5%) | 1,058 (3.7%) |
| 5 to 9 Years | 1,429 (5.2%) | 1,442 (5.1%) |
| 10 to 14 Years | 1,172 (4.3%) | 1,201 (4.2%) |
| 15 to 19 Years | 1,660 (6.1%) | 1,355 (4.8%) |
| 20 to 24 Years | 1,522 (5.6%) | 1,383 (4.9%) |
| 25 to 29 Years | 1,455 (5.3%) | 1,433 (5.0%) |
| 30 to 34 Years | 1,506 (5.5%) | 1,596 (5.6%) |
| 35 to 39 Years | 1,669 (6.1%) | 1,408 (4.9%) |
| 40 to 44 Years | 1,285 (4.7%) | 1,626 (5.7%) |
| 45 to 49 Years | 1,631 (6.0%) | 1,591 (5.6%) |
| 50 to 54 Years | 1,786 (6.5%) | 1,920 (6.7%) |
| 55 to 59 Years | 2,077 (7.6%) | 2,354 (8.3%) |
| 60 to 64 Years | 2,270 (8.3%) | 2,449 (8.6%) |
| 65 to 69 Years | 2,327 (8.5%) | 2,672 (9.4%) |
| 70 to 74 Years | 1,874 (6.9%) | 1,860 (6.5%) |
| 75 to 79 Years | 1,139 (4.2%) | 1,412 (5.0%) |
| 80 to 84 Years | 618 (2.3%) | 815 (2.9%) |
| 85 Years and over | 684 (2.5%) | 934 (3.3%) |
| Total | 27,342 (100.0%) | 28,509 (100.0%) |
Families and Households in Hancock County
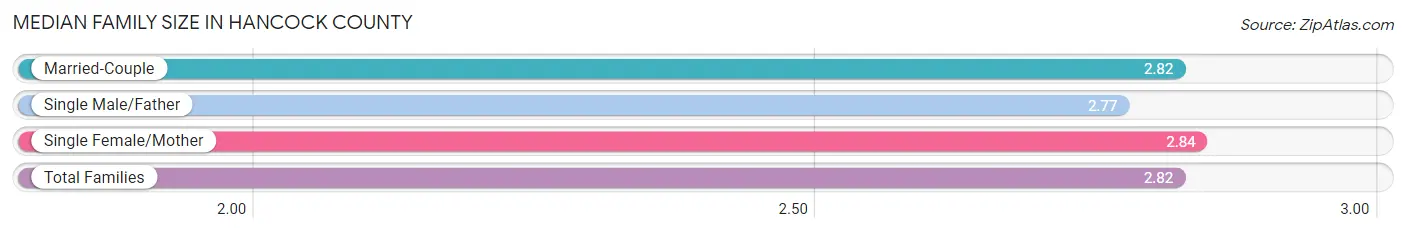
Median Family Size in Hancock County
The median family size in Hancock County is 2.82 persons per family, with single female/mother families (1,826 | 12.9%) accounting for the largest median family size of 2.84 persons per family. On the other hand, single male/father families (628 | 4.4%) represent the smallest median family size with 2.77 persons per family.
| Family Type | # Families | Family Size |
| Married-Couple | 11,689 (82.7%) | 2.82 |
| Single Male/Father | 628 (4.4%) | 2.77 |
| Single Female/Mother | 1,826 (12.9%) | 2.84 |
| Total Families | 14,143 (100.0%) | 2.82 |
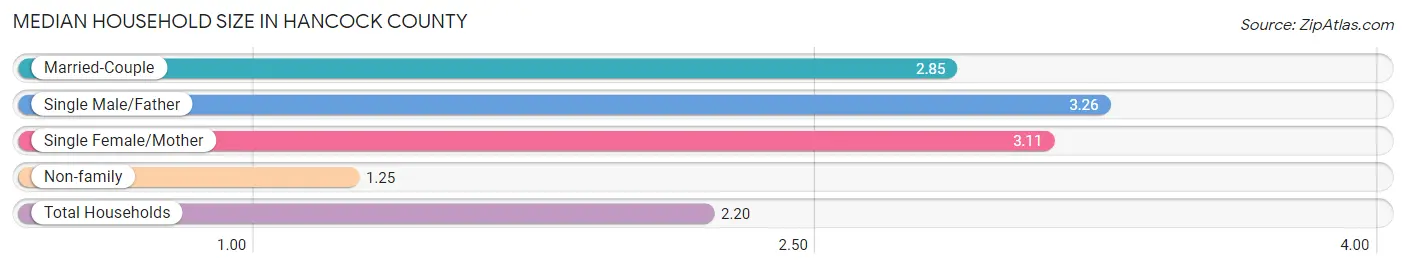
Median Household Size in Hancock County
The median household size in Hancock County is 2.20 persons per household, with single male/father households (628 | 2.5%) accounting for the largest median household size of 3.26 persons per household. non-family households (10,517 | 42.6%) represent the smallest median household size with 1.25 persons per household.
| Household Type | # Households | Household Size |
| Married-Couple | 11,689 (47.4%) | 2.85 |
| Single Male/Father | 628 (2.5%) | 3.26 |
| Single Female/Mother | 1,826 (7.4%) | 3.11 |
| Non-family | 10,517 (42.6%) | 1.25 |
| Total Households | 24,660 (100.0%) | 2.20 |
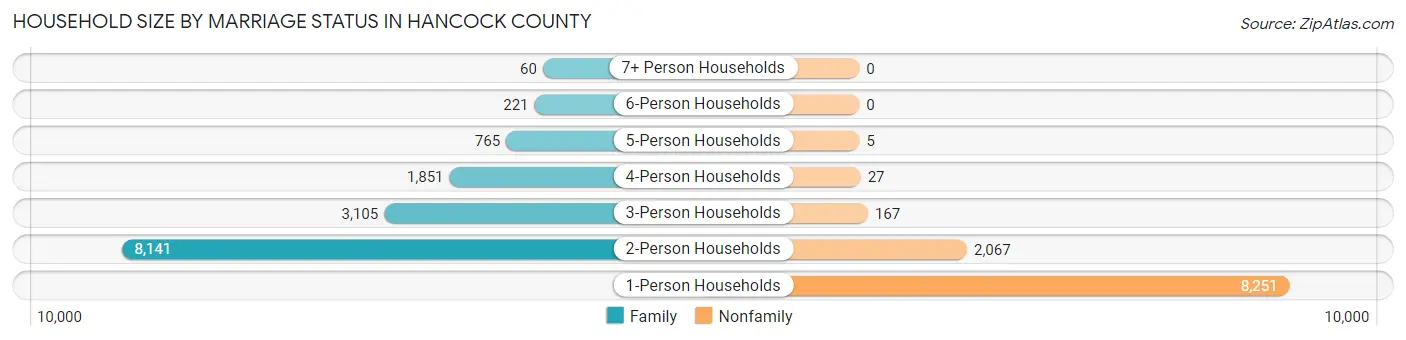
Household Size by Marriage Status in Hancock County
Out of a total of 24,660 households in Hancock County, 14,143 (57.4%) are family households, while 10,517 (42.6%) are nonfamily households. The most numerous type of family households are 2-person households, comprising 8,141, and the most common type of nonfamily households are 1-person households, comprising 8,251.
| Household Size | Family Households | Nonfamily Households |
| 1-Person Households | - | 8,251 (33.5%) |
| 2-Person Households | 8,141 (33.0%) | 2,067 (8.4%) |
| 3-Person Households | 3,105 (12.6%) | 167 (0.7%) |
| 4-Person Households | 1,851 (7.5%) | 27 (0.1%) |
| 5-Person Households | 765 (3.1%) | 5 (0.0%) |
| 6-Person Households | 221 (0.9%) | 0 (0.0%) |
| 7+ Person Households | 60 (0.2%) | 0 (0.0%) |
| Total | 14,143 (57.4%) | 10,517 (42.6%) |
Female Fertility in Hancock County
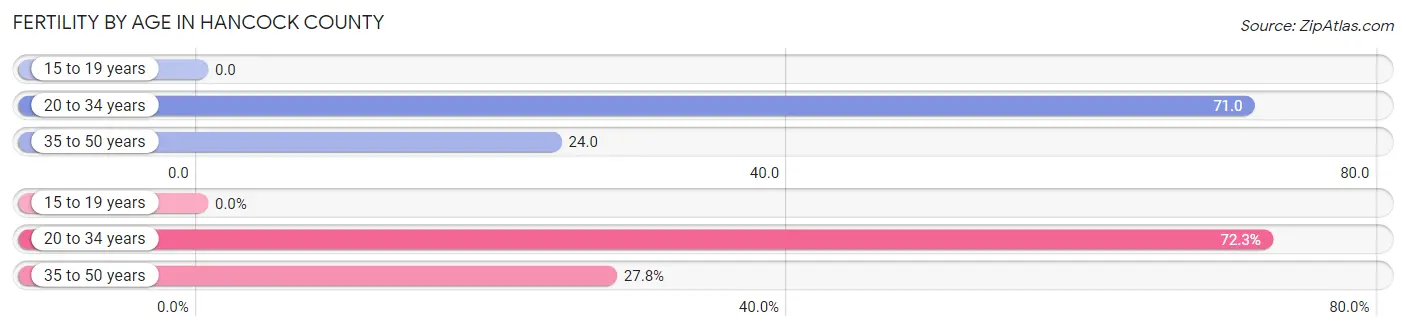
Fertility by Age in Hancock County
Average fertility rate in Hancock County is 40.0 births per 1,000 women. Women in the age bracket of 20 to 34 years have the highest fertility rate with 71.0 births per 1,000 women. Women in the age bracket of 20 to 34 years acount for 72.3% of all women with births.
| Age Bracket | Women with Births | Births / 1,000 Women |
| 15 to 19 years | 0 (0.0%) | 0.0 |
| 20 to 34 years | 315 (72.3%) | 71.0 |
| 35 to 50 years | 121 (27.8%) | 24.0 |
| Total | 436 (100.0%) | 40.0 |
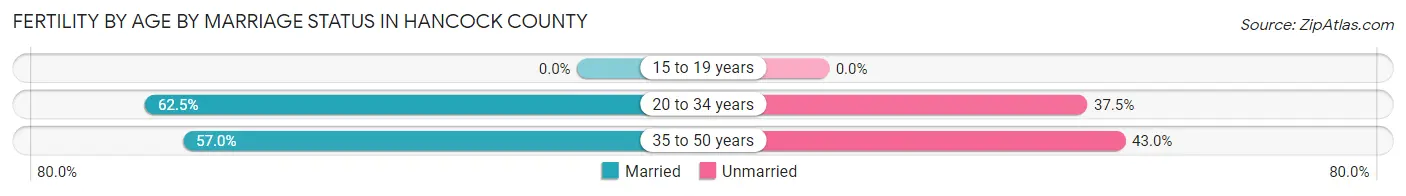
Fertility by Age by Marriage Status in Hancock County
61.0% of women with births (436) in Hancock County are married. The highest percentage of unmarried women with births falls into 35 to 50 years age bracket with 43.0% of them unmarried at the time of birth, while the lowest percentage of unmarried women with births belong to 20 to 34 years age bracket with 37.5% of them unmarried.
| Age Bracket | Married | Unmarried |
| 15 to 19 years | 0 (0.0%) | 0 (0.0%) |
| 20 to 34 years | 197 (62.5%) | 118 (37.5%) |
| 35 to 50 years | 69 (57.0%) | 52 (43.0%) |
| Total | 266 (61.0%) | 170 (39.0%) |
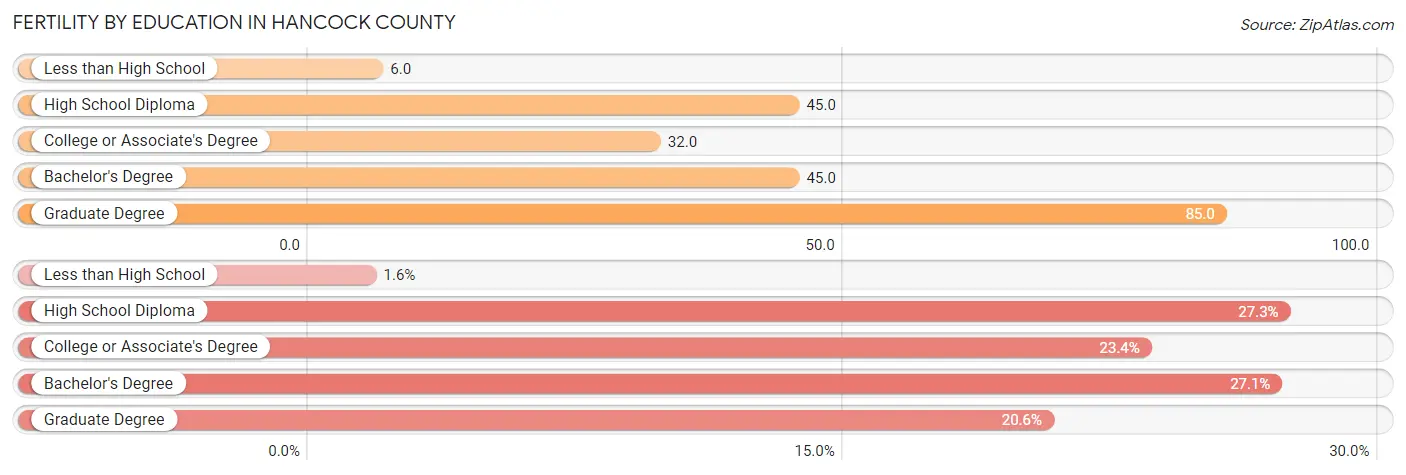
Fertility by Education in Hancock County
Average fertility rate in Hancock County is 40.0 births per 1,000 women. Women with the education attainment of graduate degree have the highest fertility rate of 85.0 births per 1,000 women, while women with the education attainment of less than high school have the lowest fertility at 6.0 births per 1,000 women. Women with the education attainment of high school diploma represent 27.3% of all women with births.
| Educational Attainment | Women with Births | Births / 1,000 Women |
| Less than High School | 7 (1.6%) | 6.0 |
| High School Diploma | 119 (27.3%) | 45.0 |
| College or Associate's Degree | 102 (23.4%) | 32.0 |
| Bachelor's Degree | 118 (27.1%) | 45.0 |
| Graduate Degree | 90 (20.6%) | 85.0 |
| Total | 436 (100.0%) | 40.0 |
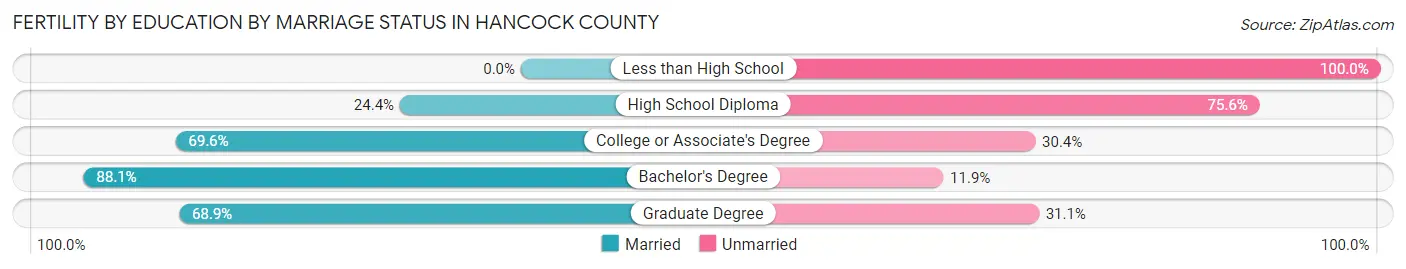
Fertility by Education by Marriage Status in Hancock County
39.0% of women with births in Hancock County are unmarried. Women with the educational attainment of bachelor's degree are most likely to be married with 88.1% of them married at childbirth, while women with the educational attainment of less than high school are least likely to be married with 100.0% of them unmarried at childbirth.
| Educational Attainment | Married | Unmarried |
| Less than High School | 0 (0.0%) | 7 (100.0%) |
| High School Diploma | 29 (24.4%) | 90 (75.6%) |
| College or Associate's Degree | 71 (69.6%) | 31 (30.4%) |
| Bachelor's Degree | 104 (88.1%) | 14 (11.9%) |
| Graduate Degree | 62 (68.9%) | 28 (31.1%) |
| Total | 266 (61.0%) | 170 (39.0%) |
Income in Hancock County
Income Overview in Hancock County
Per Capita Income in Hancock County is $38,785, while median incomes of families and households are $83,194 and $64,149 respectively.
| Characteristic | Number | Measure |
| Per Capita Income | 55,851 | $38,785 |
| Median Family Income | 14,143 | $83,194 |
| Mean Family Income | 14,143 | $104,586 |
| Median Household Income | 24,660 | $64,149 |
| Mean Household Income | 24,660 | $84,942 |
| Income Deficit | 14,143 | $10,396 |
| Wage / Income Gap (%) | 55,851 | 24.48% |
| Wage / Income Gap ($) | 55,851 | 75.52¢ per $1 |
| Gini / Inequality Index | 55,851 | 0.45 |
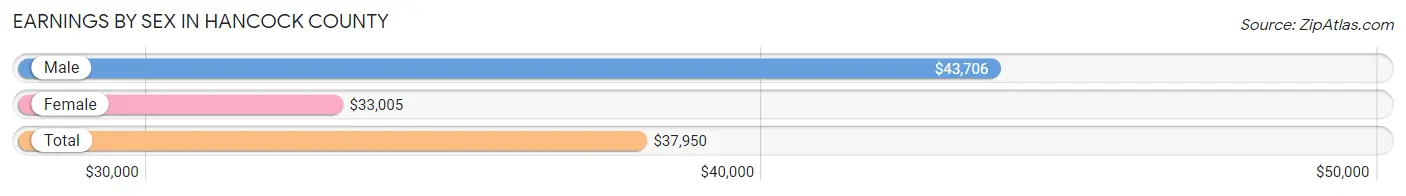
Earnings by Sex in Hancock County
Average Earnings in Hancock County are $37,950, $43,706 for men and $33,005 for women, a difference of 24.5%.
| Sex | Number | Average Earnings |
| Male | 16,205 (51.4%) | $43,706 |
| Female | 15,329 (48.6%) | $33,005 |
| Total | 31,534 (100.0%) | $37,950 |
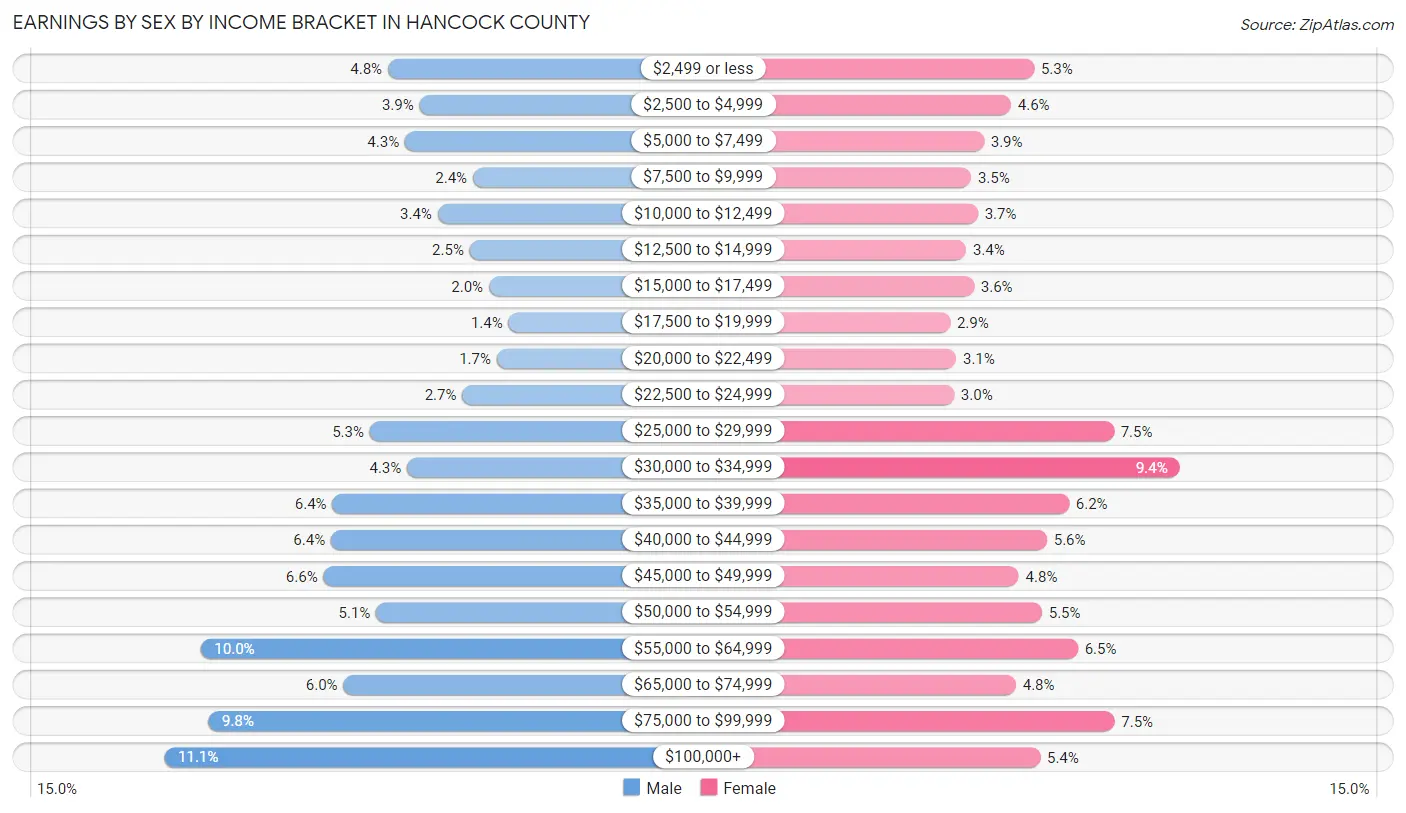
Earnings by Sex by Income Bracket in Hancock County
The most common earnings brackets in Hancock County are $100,000+ for men (1,790 | 11.1%) and $30,000 to $34,999 for women (1,434 | 9.3%).
| Income | Male | Female |
| $2,499 or less | 776 (4.8%) | 806 (5.3%) |
| $2,500 to $4,999 | 632 (3.9%) | 707 (4.6%) |
| $5,000 to $7,499 | 699 (4.3%) | 590 (3.8%) |
| $7,500 to $9,999 | 389 (2.4%) | 535 (3.5%) |
| $10,000 to $12,499 | 550 (3.4%) | 564 (3.7%) |
| $12,500 to $14,999 | 403 (2.5%) | 513 (3.4%) |
| $15,000 to $17,499 | 316 (1.9%) | 548 (3.6%) |
| $17,500 to $19,999 | 227 (1.4%) | 444 (2.9%) |
| $20,000 to $22,499 | 280 (1.7%) | 471 (3.1%) |
| $22,500 to $24,999 | 437 (2.7%) | 462 (3.0%) |
| $25,000 to $29,999 | 859 (5.3%) | 1,149 (7.5%) |
| $30,000 to $34,999 | 688 (4.3%) | 1,434 (9.3%) |
| $35,000 to $39,999 | 1,029 (6.4%) | 956 (6.2%) |
| $40,000 to $44,999 | 1,036 (6.4%) | 862 (5.6%) |
| $45,000 to $49,999 | 1,070 (6.6%) | 740 (4.8%) |
| $50,000 to $54,999 | 830 (5.1%) | 840 (5.5%) |
| $55,000 to $64,999 | 1,625 (10.0%) | 995 (6.5%) |
| $65,000 to $74,999 | 978 (6.0%) | 728 (4.8%) |
| $75,000 to $99,999 | 1,591 (9.8%) | 1,153 (7.5%) |
| $100,000+ | 1,790 (11.1%) | 832 (5.4%) |
| Total | 16,205 (100.0%) | 15,329 (100.0%) |
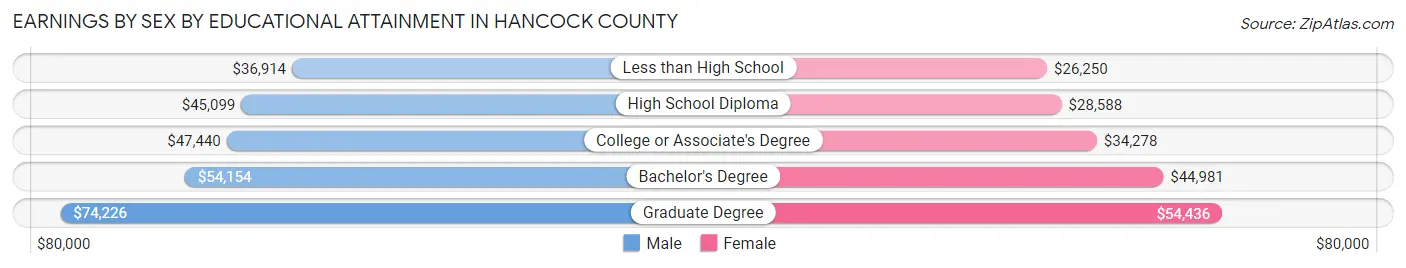
Earnings by Sex by Educational Attainment in Hancock County
Average earnings in Hancock County are $47,878 for men and $36,247 for women, a difference of 24.3%. Men with an educational attainment of graduate degree enjoy the highest average annual earnings of $74,226, while those with less than high school education earn the least with $36,914. Women with an educational attainment of graduate degree earn the most with the average annual earnings of $54,436, while those with less than high school education have the smallest earnings of $26,250.
| Educational Attainment | Male Income | Female Income |
| Less than High School | $36,914 | $26,250 |
| High School Diploma | $45,099 | $28,588 |
| College or Associate's Degree | $47,440 | $34,278 |
| Bachelor's Degree | $54,154 | $44,981 |
| Graduate Degree | $74,226 | $54,436 |
| Total | $47,878 | $36,247 |
Family Income in Hancock County
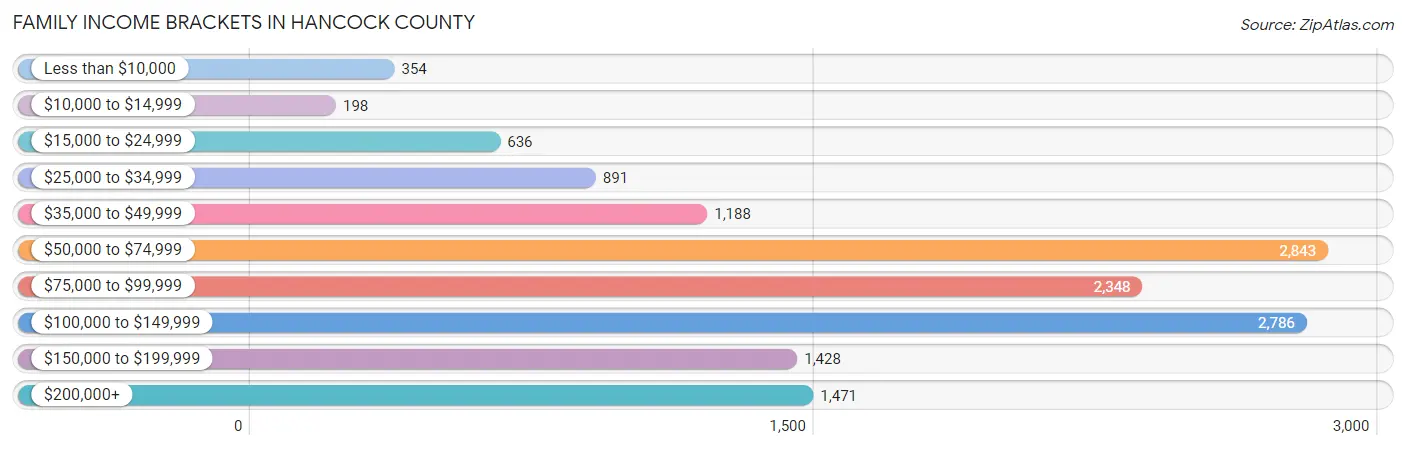
Family Income Brackets in Hancock County
According to the Hancock County family income data, there are 2,843 families falling into the $50,000 to $74,999 income range, which is the most common income bracket and makes up 20.1% of all families. Conversely, the $10,000 to $14,999 income bracket is the least frequent group with only 198 families (1.4%) belonging to this category.
| Income Bracket | # Families | % Families |
| Less than $10,000 | 354 | 2.5% |
| $10,000 to $14,999 | 198 | 1.4% |
| $15,000 to $24,999 | 636 | 4.5% |
| $25,000 to $34,999 | 891 | 6.3% |
| $35,000 to $49,999 | 1,188 | 8.4% |
| $50,000 to $74,999 | 2,843 | 20.1% |
| $75,000 to $99,999 | 2,348 | 16.6% |
| $100,000 to $149,999 | 2,786 | 19.7% |
| $150,000 to $199,999 | 1,428 | 10.1% |
| $200,000+ | 1,471 | 10.4% |
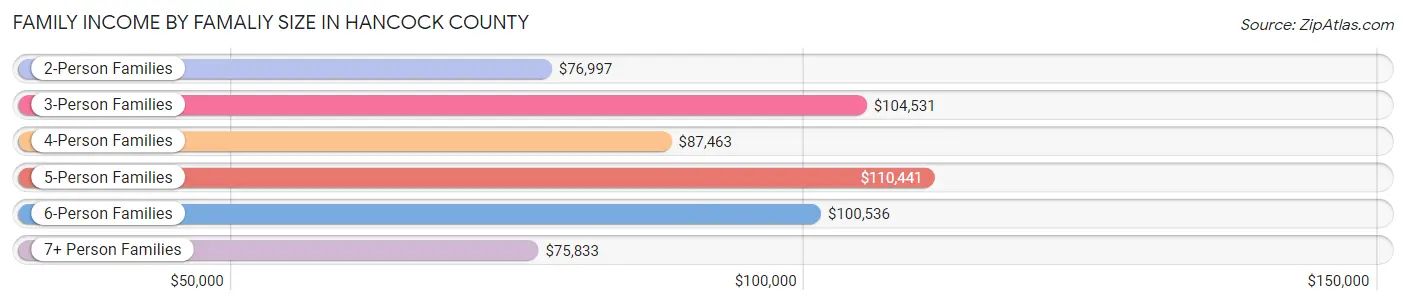
Family Income by Famaliy Size in Hancock County
5-person families (616 | 4.4%) account for the highest median family income in Hancock County with $110,441 per family, while 2-person families (8,600 | 60.8%) have the highest median income of $38,498 per family member.
| Income Bracket | # Families | Median Income |
| 2-Person Families | 8,600 (60.8%) | $76,997 |
| 3-Person Families | 2,861 (20.2%) | $104,531 |
| 4-Person Families | 1,817 (12.9%) | $87,463 |
| 5-Person Families | 616 (4.4%) | $110,441 |
| 6-Person Families | 209 (1.5%) | $100,536 |
| 7+ Person Families | 40 (0.3%) | $75,833 |
| Total | 14,143 (100.0%) | $83,194 |
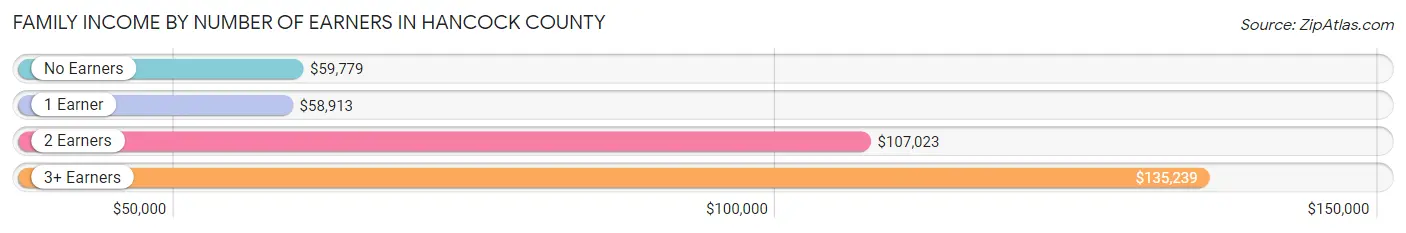
Family Income by Number of Earners in Hancock County
The median family income in Hancock County is $83,194, with families comprising 3+ earners (1,345) having the highest median family income of $135,239, while families with 1 earner (4,316) have the lowest median family income of $58,913, accounting for 9.5% and 30.5% of families, respectively.
| Number of Earners | # Families | Median Income |
| No Earners | 2,725 (19.3%) | $59,779 |
| 1 Earner | 4,316 (30.5%) | $58,913 |
| 2 Earners | 5,757 (40.7%) | $107,023 |
| 3+ Earners | 1,345 (9.5%) | $135,239 |
| Total | 14,143 (100.0%) | $83,194 |
Household Income in Hancock County
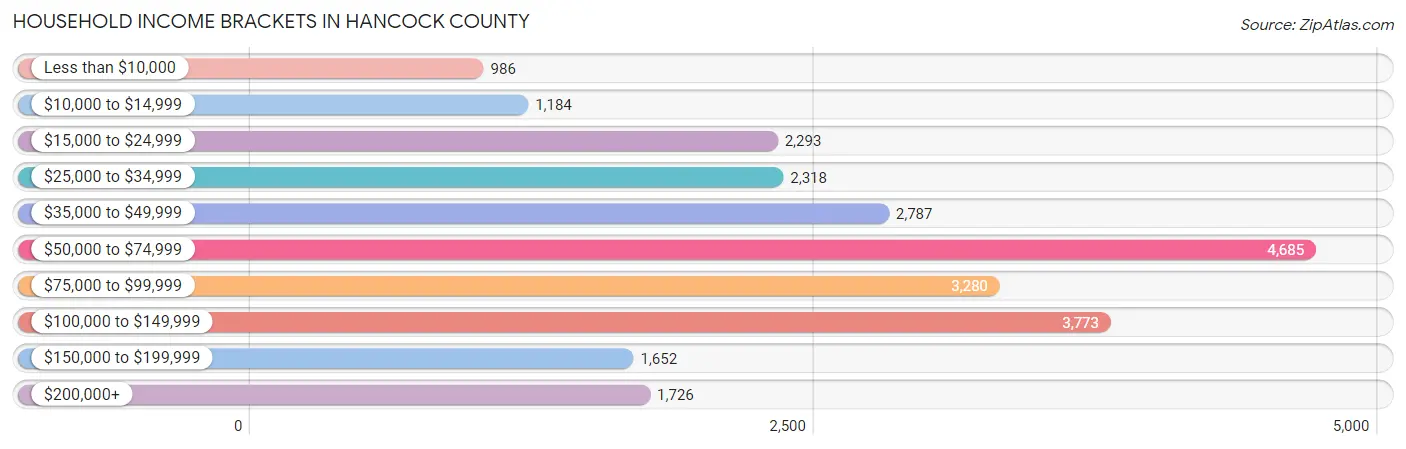
Household Income Brackets in Hancock County
With 4,685 households falling in the category, the $50,000 to $74,999 income range is the most frequent in Hancock County, accounting for 19.0% of all households. In contrast, only 986 households (4.0%) fall into the less than $10,000 income bracket, making it the least populous group.
| Income Bracket | # Households | % Households |
| Less than $10,000 | 986 | 4.0% |
| $10,000 to $14,999 | 1,184 | 4.8% |
| $15,000 to $24,999 | 2,293 | 9.3% |
| $25,000 to $34,999 | 2,318 | 9.4% |
| $35,000 to $49,999 | 2,787 | 11.3% |
| $50,000 to $74,999 | 4,685 | 19.0% |
| $75,000 to $99,999 | 3,280 | 13.3% |
| $100,000 to $149,999 | 3,773 | 15.3% |
| $150,000 to $199,999 | 1,652 | 6.7% |
| $200,000+ | 1,726 | 7.0% |
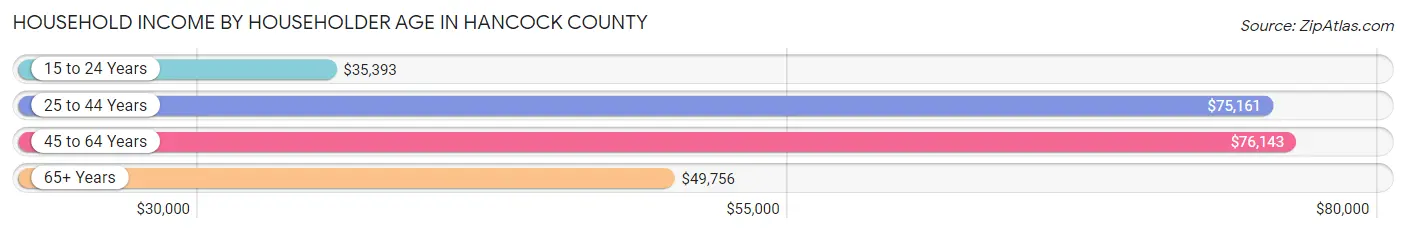
Household Income by Householder Age in Hancock County
The median household income in Hancock County is $64,149, with the highest median household income of $76,143 found in the 45 to 64 years age bracket for the primary householder. A total of 9,230 households (37.4%) fall into this category. Meanwhile, the 15 to 24 years age bracket for the primary householder has the lowest median household income of $35,393, with 475 households (1.9%) in this group.
| Income Bracket | # Households | Median Income |
| 15 to 24 Years | 475 (1.9%) | $35,393 |
| 25 to 44 Years | 5,916 (24.0%) | $75,161 |
| 45 to 64 Years | 9,230 (37.4%) | $76,143 |
| 65+ Years | 9,039 (36.6%) | $49,756 |
| Total | 24,660 (100.0%) | $64,149 |
Poverty in Hancock County
Income Below Poverty by Sex and Age in Hancock County
With 10.2% poverty level for males and 11.7% for females among the residents of Hancock County, 16 and 17 year old males and 5 year old females are the most vulnerable to poverty, with 133 males (21.6%) and 42 females (26.3%) in their respective age groups living below the poverty level.
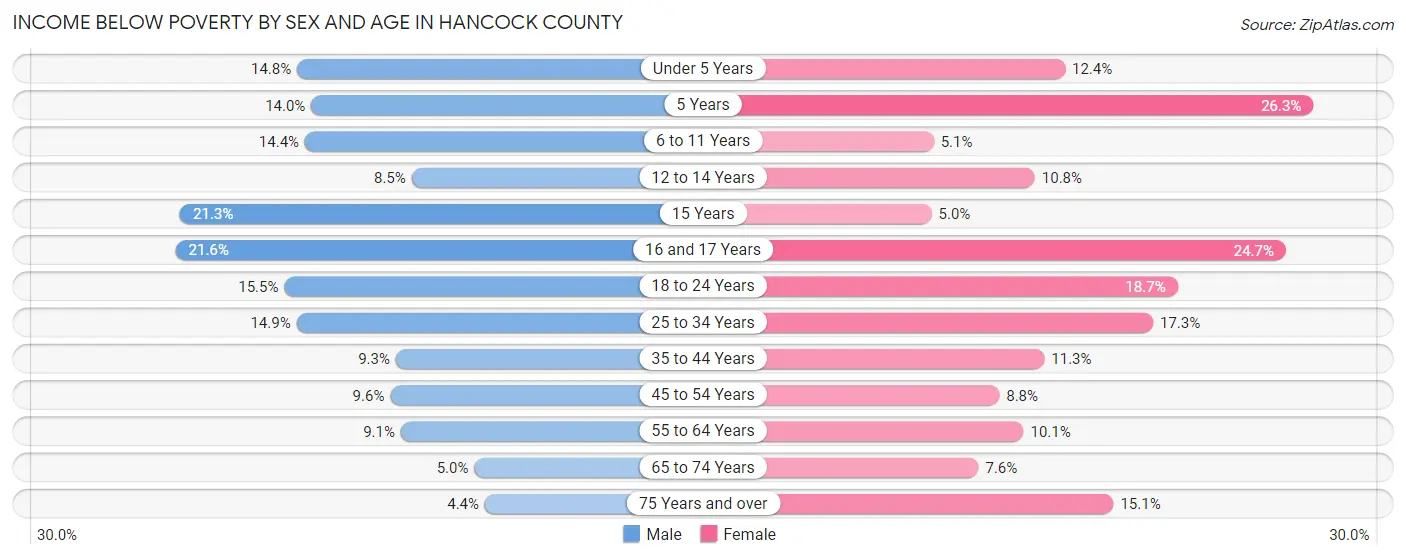
| Age Bracket | Male | Female |
| Under 5 Years | 179 (14.8%) | 130 (12.4%) |
| 5 Years | 41 (14.0%) | 42 (26.3%) |
| 6 to 11 Years | 222 (14.4%) | 87 (5.1%) |
| 12 to 14 Years | 63 (8.5%) | 80 (10.7%) |
| 15 Years | 54 (21.3%) | 11 (5.0%) |
| 16 and 17 Years | 133 (21.6%) | 154 (24.7%) |
| 18 to 24 Years | 244 (15.5%) | 319 (18.7%) |
| 25 to 34 Years | 438 (14.9%) | 524 (17.3%) |
| 35 to 44 Years | 274 (9.3%) | 342 (11.3%) |
| 45 to 54 Years | 329 (9.6%) | 307 (8.8%) |
| 55 to 64 Years | 390 (9.0%) | 485 (10.1%) |
| 65 to 74 Years | 208 (5.0%) | 342 (7.6%) |
| 75 Years and over | 103 (4.4%) | 448 (15.1%) |
| Total | 2,678 (10.2%) | 3,271 (11.7%) |
Income Above Poverty by Sex and Age in Hancock County
According to the poverty statistics in Hancock County, males aged 75 years and over and females aged 15 years are the age groups that are most secure financially, with 95.6% of males and 95.0% of females in these age groups living above the poverty line.
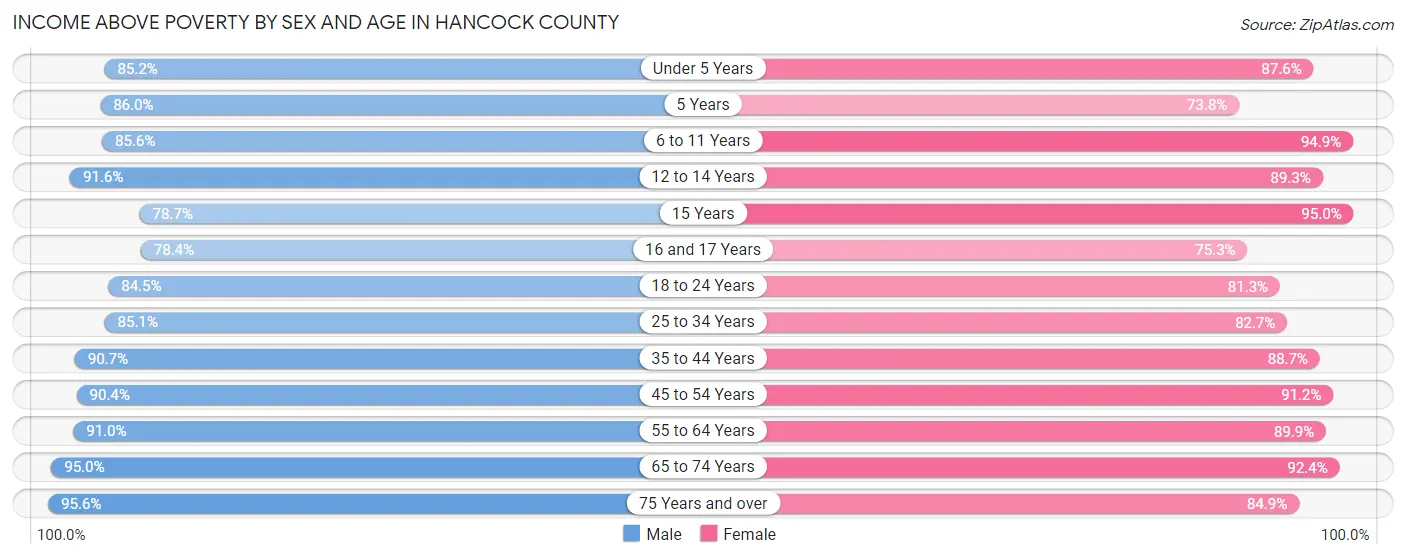
| Age Bracket | Male | Female |
| Under 5 Years | 1,028 (85.2%) | 916 (87.6%) |
| 5 Years | 251 (86.0%) | 118 (73.8%) |
| 6 to 11 Years | 1,321 (85.6%) | 1,611 (94.9%) |
| 12 to 14 Years | 683 (91.5%) | 664 (89.2%) |
| 15 Years | 199 (78.7%) | 209 (95.0%) |
| 16 and 17 Years | 483 (78.4%) | 469 (75.3%) |
| 18 to 24 Years | 1,326 (84.5%) | 1,388 (81.3%) |
| 25 to 34 Years | 2,510 (85.1%) | 2,500 (82.7%) |
| 35 to 44 Years | 2,663 (90.7%) | 2,690 (88.7%) |
| 45 to 54 Years | 3,083 (90.4%) | 3,195 (91.2%) |
| 55 to 64 Years | 3,921 (90.9%) | 4,309 (89.9%) |
| 65 to 74 Years | 3,982 (95.0%) | 4,155 (92.4%) |
| 75 Years and over | 2,253 (95.6%) | 2,513 (84.9%) |
| Total | 23,703 (89.8%) | 24,737 (88.3%) |
Income Below Poverty Among Married-Couple Families in Hancock County
The poverty statistics for married-couple families in Hancock County show that 3.6% or 416 of the total 11,689 families live below the poverty line. Families with 5 or more children have the highest poverty rate of 39.3%, comprising of 11 families. On the other hand, families with no children have the lowest poverty rate of 2.4%, which includes 200 families.
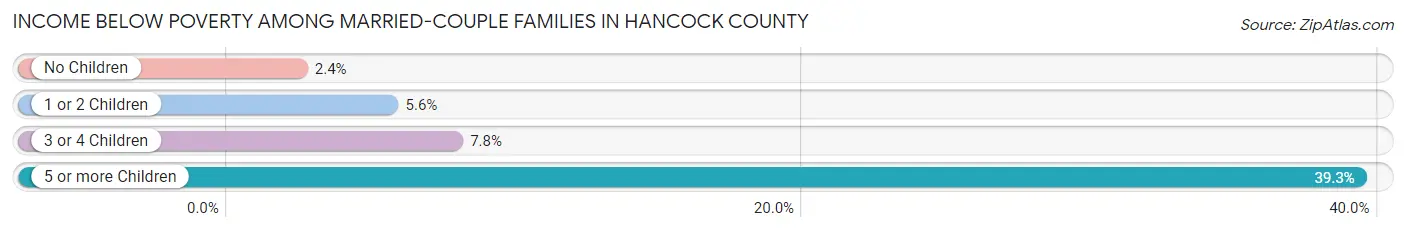
| Children | Above Poverty | Below Poverty |
| No Children | 8,038 (97.6%) | 200 (2.4%) |
| 1 or 2 Children | 2,654 (94.4%) | 157 (5.6%) |
| 3 or 4 Children | 564 (92.2%) | 48 (7.8%) |
| 5 or more Children | 17 (60.7%) | 11 (39.3%) |
| Total | 11,273 (96.4%) | 416 (3.6%) |
Income Below Poverty Among Single-Parent Households in Hancock County
According to the poverty data in Hancock County, 12.4% or 78 single-father households and 25.6% or 467 single-mother households are living below the poverty line. Among single-father households, those with no children have the highest poverty rate, with 48 households (21.3%) experiencing poverty. Likewise, among single-mother households, those with 3 or 4 children have the highest poverty rate, with 94 households (64.8%) falling below the poverty line.
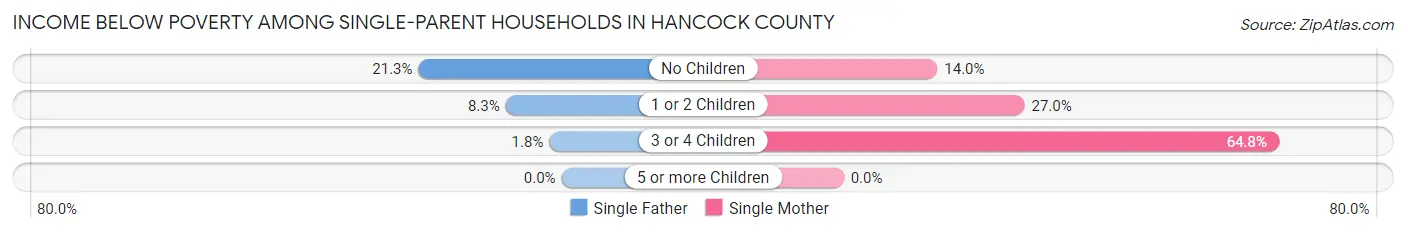
| Children | Single Father | Single Mother |
| No Children | 48 (21.3%) | 86 (14.0%) |
| 1 or 2 Children | 29 (8.3%) | 287 (27.0%) |
| 3 or 4 Children | 1 (1.8%) | 94 (64.8%) |
| 5 or more Children | 0 (0.0%) | 0 (0.0%) |
| Total | 78 (12.4%) | 467 (25.6%) |
Income Below Poverty Among Married-Couple vs Single-Parent Households in Hancock County
The poverty data for Hancock County shows that 416 of the married-couple family households (3.6%) and 545 of the single-parent households (22.2%) are living below the poverty level. Within the married-couple family households, those with 5 or more children have the highest poverty rate, with 11 households (39.3%) falling below the poverty line. Among the single-parent households, those with 3 or 4 children have the highest poverty rate, with 95 household (47.5%) living below poverty.
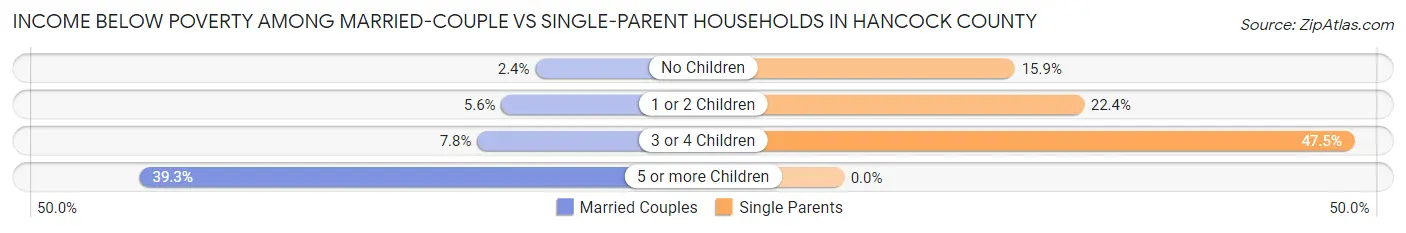
| Children | Married-Couple Families | Single-Parent Households |
| No Children | 200 (2.4%) | 134 (15.9%) |
| 1 or 2 Children | 157 (5.6%) | 316 (22.4%) |
| 3 or 4 Children | 48 (7.8%) | 95 (47.5%) |
| 5 or more Children | 11 (39.3%) | 0 (0.0%) |
| Total | 416 (3.6%) | 545 (22.2%) |
Employment Characteristics in Hancock County
Employment by Class of Employer in Hancock County
Among the 27,161 employed individuals in Hancock County, private company employees (13,337 | 49.1%), not-for-profit organizations (4,656 | 17.1%), and self-employed (not incorporated) (3,753 | 13.8%) make up the most common classes of employment.
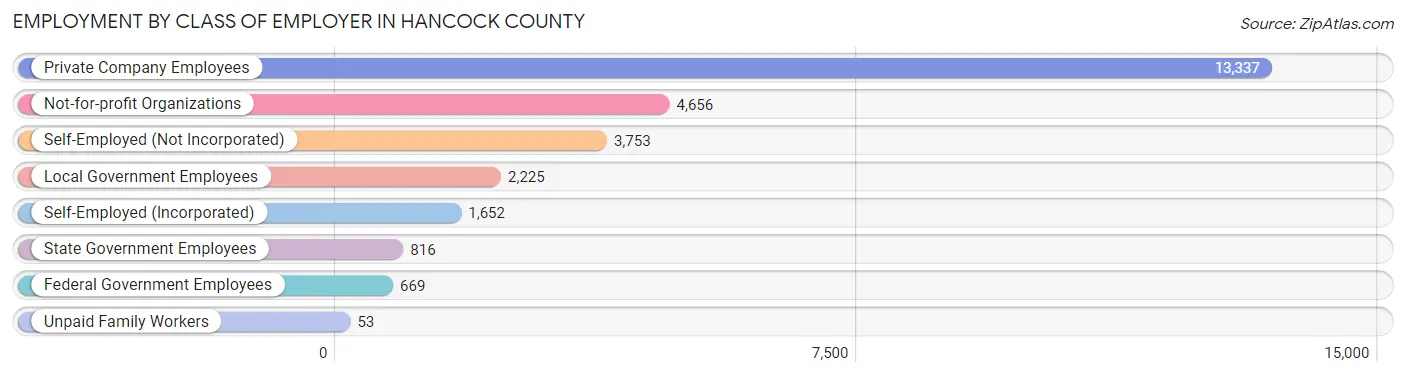
| Employer Class | # Employees | % Employees |
| Private Company Employees | 13,337 | 49.1% |
| Self-Employed (Incorporated) | 1,652 | 6.1% |
| Self-Employed (Not Incorporated) | 3,753 | 13.8% |
| Not-for-profit Organizations | 4,656 | 17.1% |
| Local Government Employees | 2,225 | 8.2% |
| State Government Employees | 816 | 3.0% |
| Federal Government Employees | 669 | 2.5% |
| Unpaid Family Workers | 53 | 0.2% |
| Total | 27,161 | 100.0% |
Employment Status by Age in Hancock County
According to the labor force statistics for Hancock County, out of the total population over 16 years of age (47,833), 61.2% or 29,274 individuals are in the labor force, with 3.9% or 1,142 of them unemployed. The age group with the highest labor force participation rate is 30 to 34 years, with 90.7% or 2,814 individuals in the labor force. Within the labor force, the 65 to 74 years age range has the highest percentage of unemployed individuals, with 9.7% or 266 of them being unemployed.
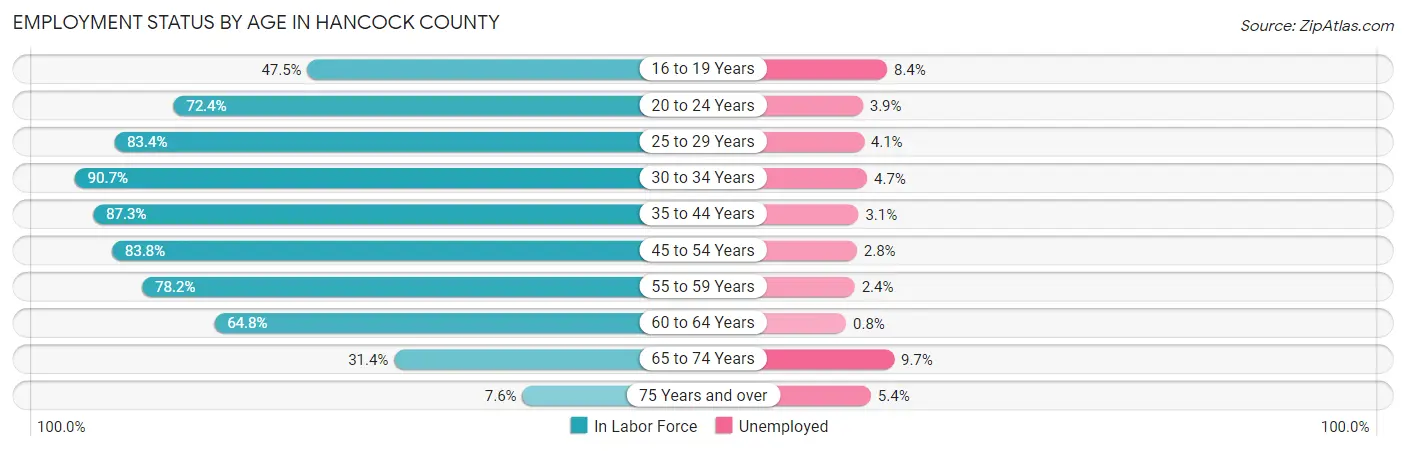
| Age Bracket | In Labor Force | Unemployed |
| 16 to 19 Years | 1,205 (47.5%) | 101 (8.4%) |
| 20 to 24 Years | 2,103 (72.4%) | 82 (3.9%) |
| 25 to 29 Years | 2,409 (83.4%) | 99 (4.1%) |
| 30 to 34 Years | 2,814 (90.7%) | 132 (4.7%) |
| 35 to 44 Years | 5,228 (87.3%) | 162 (3.1%) |
| 45 to 54 Years | 5,806 (83.8%) | 163 (2.8%) |
| 55 to 59 Years | 3,465 (78.2%) | 83 (2.4%) |
| 60 to 64 Years | 3,058 (64.8%) | 24 (0.8%) |
| 65 to 74 Years | 2,742 (31.4%) | 266 (9.7%) |
| 75 Years and over | 426 (7.6%) | 23 (5.4%) |
| Total | 29,274 (61.2%) | 1,142 (3.9%) |
Employment Status by Educational Attainment in Hancock County
According to labor force statistics for Hancock County, 81.2% of individuals (22,781) out of the total population between 25 and 64 years of age (28,056) are in the labor force, with 2.9% or 661 of them being unemployed. The group with the highest labor force participation rate are those with the educational attainment of bachelor's degree or higher, with 87.8% or 8,601 individuals in the labor force. Within the labor force, individuals with less than high school education have the highest percentage of unemployment, with 6.4% or 63 of them being unemployed.
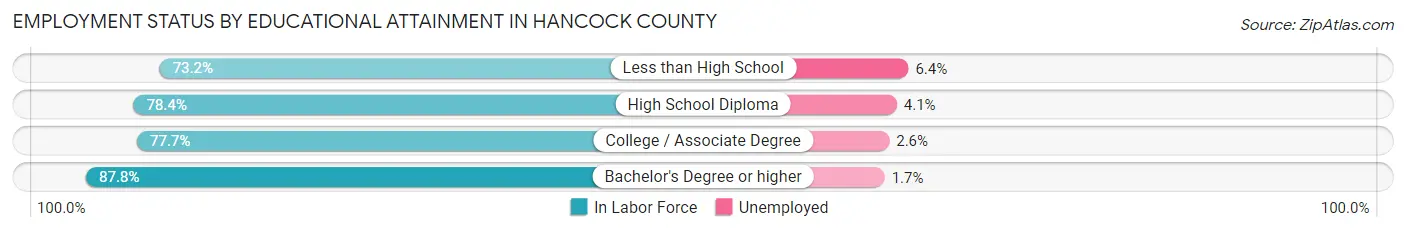
| Educational Attainment | In Labor Force | Unemployed |
| Less than High School | 979 (73.2%) | 86 (6.4%) |
| High School Diploma | 6,920 (78.4%) | 362 (4.1%) |
| College / Associate Degree | 6,291 (77.7%) | 210 (2.6%) |
| Bachelor's Degree or higher | 8,601 (87.8%) | 167 (1.7%) |
| Total | 22,781 (81.2%) | 814 (2.9%) |
Employment Occupations by Sex in Hancock County
Management, Business, Science and Arts Occupations
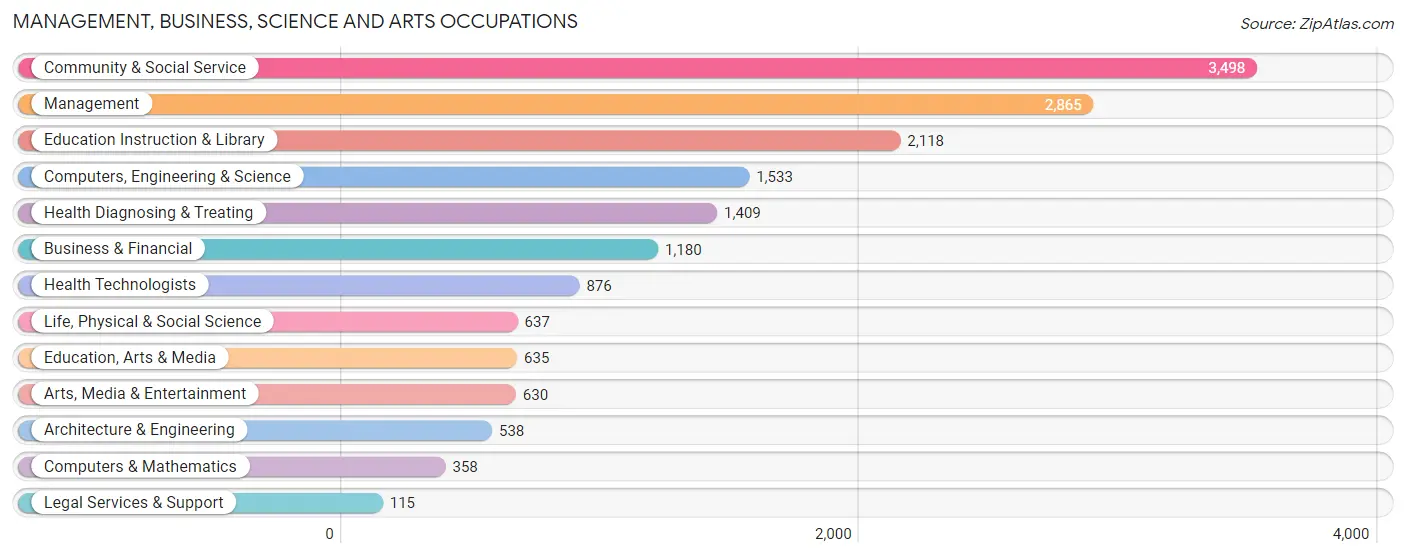
The most common Management, Business, Science and Arts occupations in Hancock County are Community & Social Service (3,498 | 12.5%), Management (2,865 | 10.2%), Education Instruction & Library (2,118 | 7.6%), Computers, Engineering & Science (1,533 | 5.5%), and Health Diagnosing & Treating (1,409 | 5.0%).
Management, Business, Science and Arts Occupations by Sex
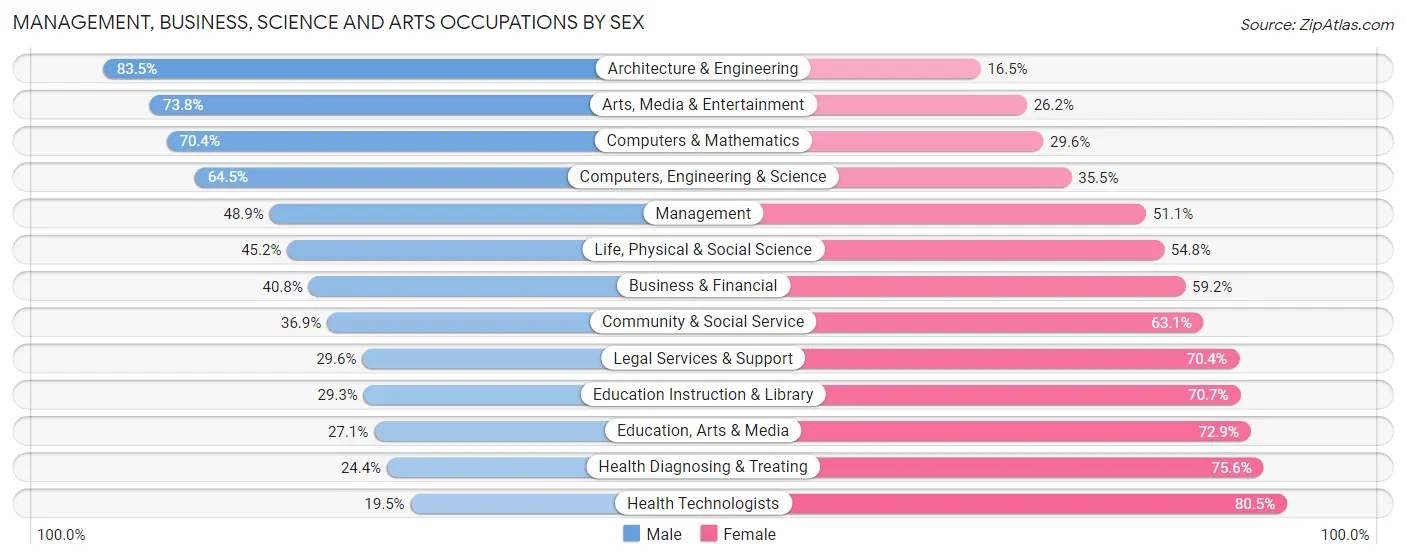
Within the Management, Business, Science and Arts occupations in Hancock County, the most male-oriented occupations are Architecture & Engineering (83.5%), Arts, Media & Entertainment (73.8%), and Computers & Mathematics (70.4%), while the most female-oriented occupations are Health Technologists (80.5%), Health Diagnosing & Treating (75.6%), and Education, Arts & Media (72.9%).
| Occupation | Male | Female |
| Management | 1,401 (48.9%) | 1,464 (51.1%) |
| Business & Financial | 481 (40.8%) | 699 (59.2%) |
| Computers, Engineering & Science | 989 (64.5%) | 544 (35.5%) |
| Computers & Mathematics | 252 (70.4%) | 106 (29.6%) |
| Architecture & Engineering | 449 (83.5%) | 89 (16.5%) |
| Life, Physical & Social Science | 288 (45.2%) | 349 (54.8%) |
| Community & Social Service | 1,291 (36.9%) | 2,207 (63.1%) |
| Education, Arts & Media | 172 (27.1%) | 463 (72.9%) |
| Legal Services & Support | 34 (29.6%) | 81 (70.4%) |
| Education Instruction & Library | 620 (29.3%) | 1,498 (70.7%) |
| Arts, Media & Entertainment | 465 (73.8%) | 165 (26.2%) |
| Health Diagnosing & Treating | 344 (24.4%) | 1,065 (75.6%) |
| Health Technologists | 171 (19.5%) | 705 (80.5%) |
| Total (Category) | 4,506 (43.0%) | 5,979 (57.0%) |
| Total (Overall) | 14,272 (51.0%) | 13,734 (49.0%) |
Services Occupations
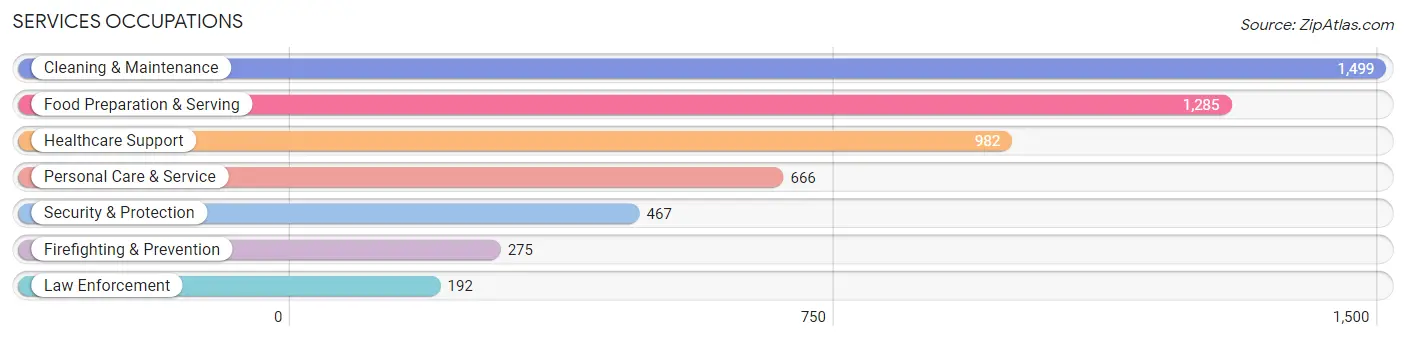
The most common Services occupations in Hancock County are Cleaning & Maintenance (1,499 | 5.3%), Food Preparation & Serving (1,285 | 4.6%), Healthcare Support (982 | 3.5%), Personal Care & Service (666 | 2.4%), and Security & Protection (467 | 1.7%).
Services Occupations by Sex
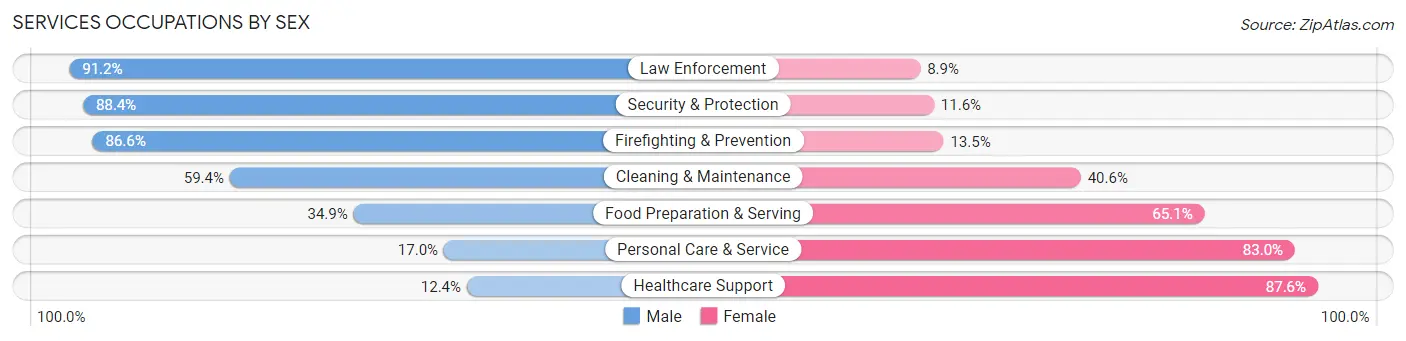
Within the Services occupations in Hancock County, the most male-oriented occupations are Law Enforcement (91.1%), Security & Protection (88.4%), and Firefighting & Prevention (86.6%), while the most female-oriented occupations are Healthcare Support (87.6%), Personal Care & Service (83.0%), and Food Preparation & Serving (65.1%).
| Occupation | Male | Female |
| Healthcare Support | 122 (12.4%) | 860 (87.6%) |
| Security & Protection | 413 (88.4%) | 54 (11.6%) |
| Firefighting & Prevention | 238 (86.6%) | 37 (13.5%) |
| Law Enforcement | 175 (91.1%) | 17 (8.8%) |
| Food Preparation & Serving | 448 (34.9%) | 837 (65.1%) |
| Cleaning & Maintenance | 890 (59.4%) | 609 (40.6%) |
| Personal Care & Service | 113 (17.0%) | 553 (83.0%) |
| Total (Category) | 1,986 (40.5%) | 2,913 (59.5%) |
| Total (Overall) | 14,272 (51.0%) | 13,734 (49.0%) |
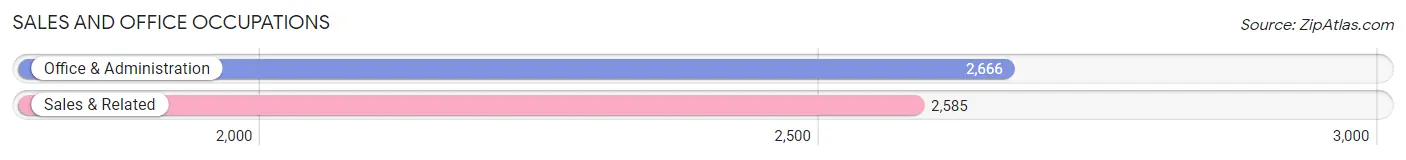
Sales and Office Occupations
The most common Sales and Office occupations in Hancock County are Office & Administration (2,666 | 9.5%), and Sales & Related (2,585 | 9.2%).
Sales and Office Occupations by Sex
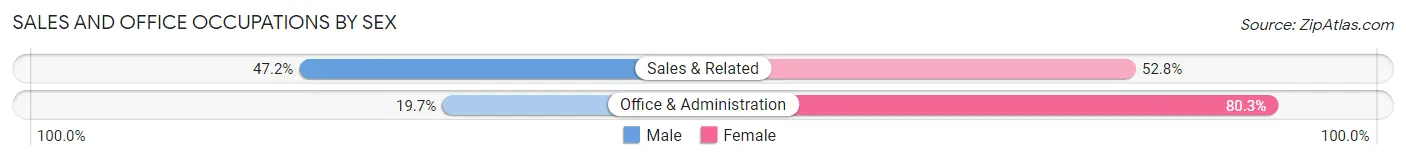
| Occupation | Male | Female |
| Sales & Related | 1,220 (47.2%) | 1,365 (52.8%) |
| Office & Administration | 526 (19.7%) | 2,140 (80.3%) |
| Total (Category) | 1,746 (33.3%) | 3,505 (66.7%) |
| Total (Overall) | 14,272 (51.0%) | 13,734 (49.0%) |
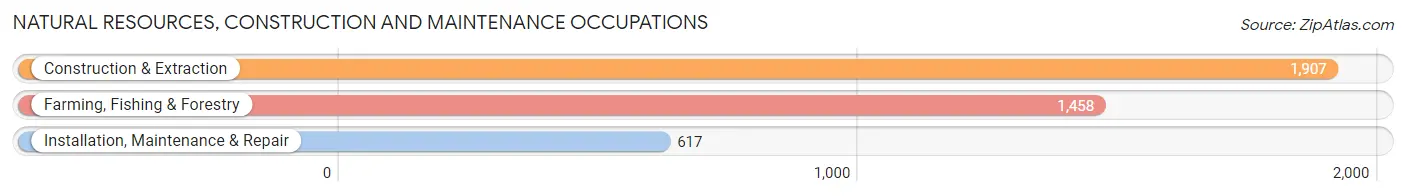
Natural Resources, Construction and Maintenance Occupations
The most common Natural Resources, Construction and Maintenance occupations in Hancock County are Construction & Extraction (1,907 | 6.8%), Farming, Fishing & Forestry (1,458 | 5.2%), and Installation, Maintenance & Repair (617 | 2.2%).
Natural Resources, Construction and Maintenance Occupations by Sex
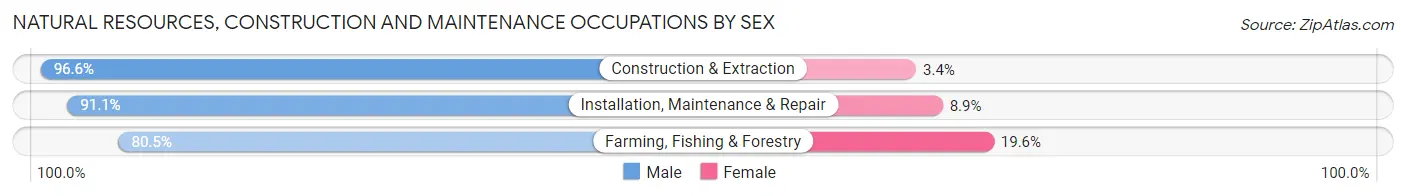
| Occupation | Male | Female |
| Farming, Fishing & Forestry | 1,173 (80.4%) | 285 (19.6%) |
| Construction & Extraction | 1,843 (96.6%) | 64 (3.4%) |
| Installation, Maintenance & Repair | 562 (91.1%) | 55 (8.9%) |
| Total (Category) | 3,578 (89.8%) | 404 (10.2%) |
| Total (Overall) | 14,272 (51.0%) | 13,734 (49.0%) |
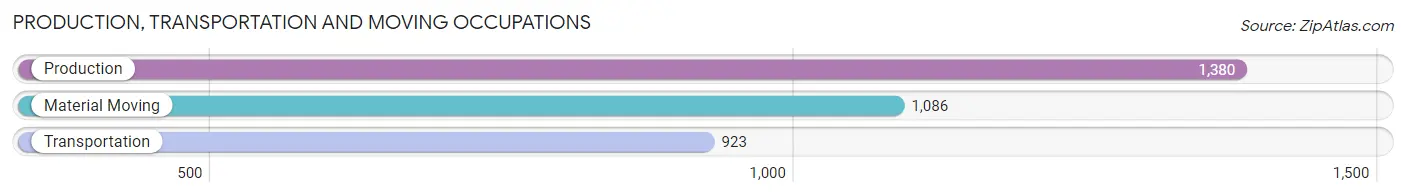
Production, Transportation and Moving Occupations
The most common Production, Transportation and Moving occupations in Hancock County are Production (1,380 | 4.9%), Material Moving (1,086 | 3.9%), and Transportation (923 | 3.3%).
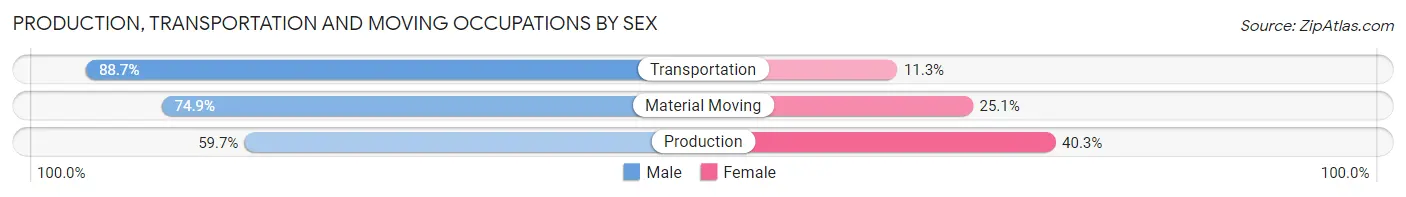
Production, Transportation and Moving Occupations by Sex
| Occupation | Male | Female |
| Production | 824 (59.7%) | 556 (40.3%) |
| Transportation | 819 (88.7%) | 104 (11.3%) |
| Material Moving | 813 (74.9%) | 273 (25.1%) |
| Total (Category) | 2,456 (72.5%) | 933 (27.5%) |
| Total (Overall) | 14,272 (51.0%) | 13,734 (49.0%) |
Employment Industries by Sex in Hancock County
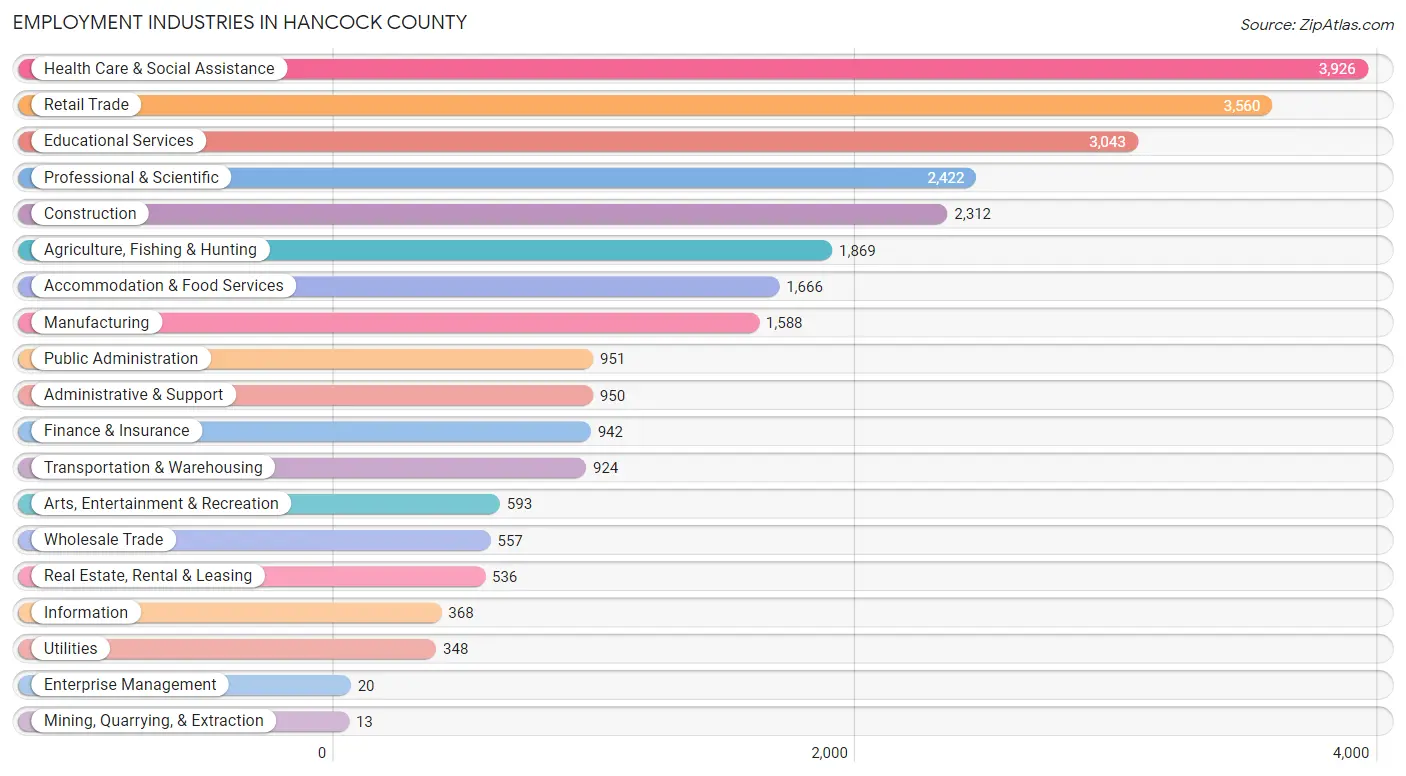
Employment Industries in Hancock County
The major employment industries in Hancock County include Health Care & Social Assistance (3,926 | 14.0%), Retail Trade (3,560 | 12.7%), Educational Services (3,043 | 10.9%), Professional & Scientific (2,422 | 8.6%), and Construction (2,312 | 8.3%).
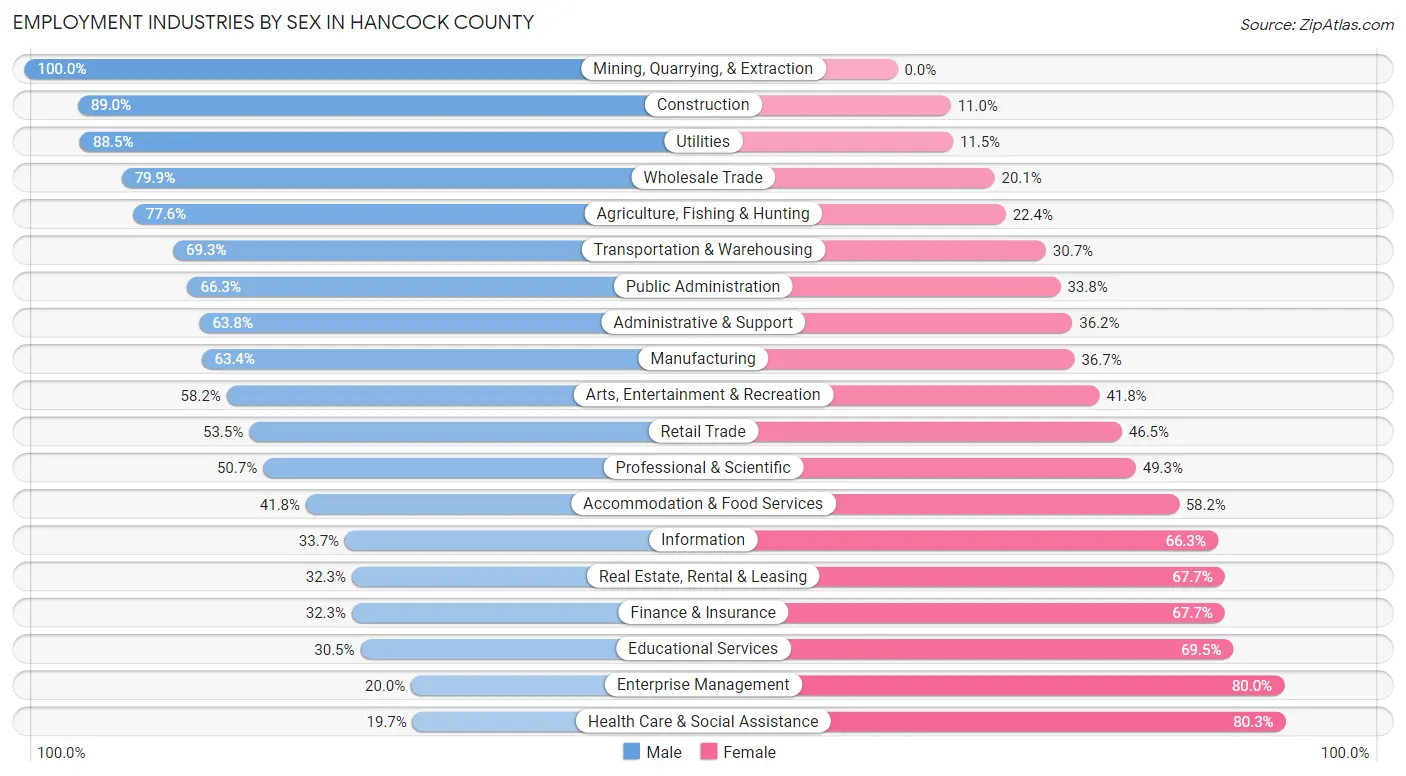
Employment Industries by Sex in Hancock County
The Hancock County industries that see more men than women are Mining, Quarrying, & Extraction (100.0%), Construction (89.0%), and Utilities (88.5%), whereas the industries that tend to have a higher number of women are Health Care & Social Assistance (80.3%), Enterprise Management (80.0%), and Educational Services (69.5%).
| Industry | Male | Female |
| Agriculture, Fishing & Hunting | 1,450 (77.6%) | 419 (22.4%) |
| Mining, Quarrying, & Extraction | 13 (100.0%) | 0 (0.0%) |
| Construction | 2,057 (89.0%) | 255 (11.0%) |
| Manufacturing | 1,006 (63.3%) | 582 (36.6%) |
| Wholesale Trade | 445 (79.9%) | 112 (20.1%) |
| Retail Trade | 1,906 (53.5%) | 1,654 (46.5%) |
| Transportation & Warehousing | 640 (69.3%) | 284 (30.7%) |
| Utilities | 308 (88.5%) | 40 (11.5%) |
| Information | 124 (33.7%) | 244 (66.3%) |
| Finance & Insurance | 304 (32.3%) | 638 (67.7%) |
| Real Estate, Rental & Leasing | 173 (32.3%) | 363 (67.7%) |
| Professional & Scientific | 1,227 (50.7%) | 1,195 (49.3%) |
| Enterprise Management | 4 (20.0%) | 16 (80.0%) |
| Administrative & Support | 606 (63.8%) | 344 (36.2%) |
| Educational Services | 928 (30.5%) | 2,115 (69.5%) |
| Health Care & Social Assistance | 773 (19.7%) | 3,153 (80.3%) |
| Arts, Entertainment & Recreation | 345 (58.2%) | 248 (41.8%) |
| Accommodation & Food Services | 696 (41.8%) | 970 (58.2%) |
| Public Administration | 630 (66.2%) | 321 (33.8%) |
| Total | 14,272 (51.0%) | 13,734 (49.0%) |
Education in Hancock County
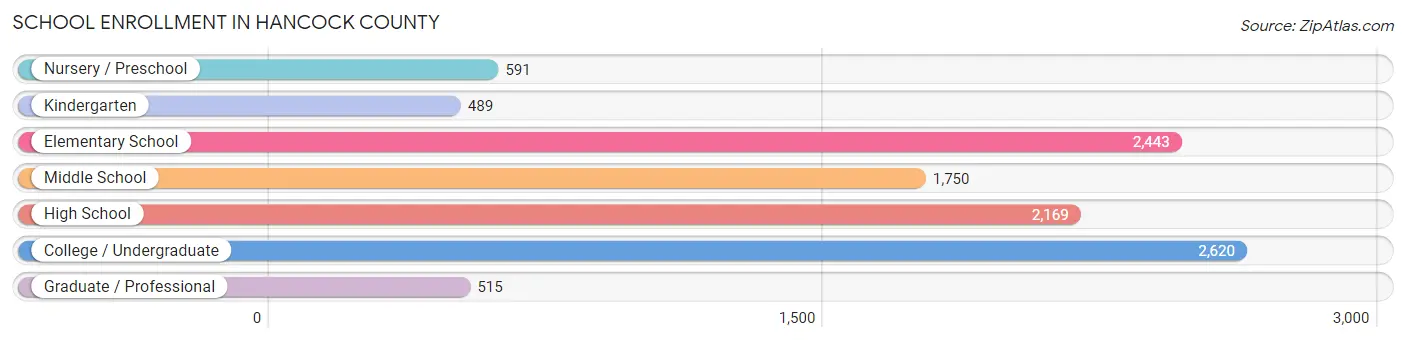
School Enrollment in Hancock County
The most common levels of schooling among the 10,577 students in Hancock County are college / undergraduate (2,620 | 24.8%), elementary school (2,443 | 23.1%), and high school (2,169 | 20.5%).
| School Level | # Students | % Students |
| Nursery / Preschool | 591 | 5.6% |
| Kindergarten | 489 | 4.6% |
| Elementary School | 2,443 | 23.1% |
| Middle School | 1,750 | 16.6% |
| High School | 2,169 | 20.5% |
| College / Undergraduate | 2,620 | 24.8% |
| Graduate / Professional | 515 | 4.9% |
| Total | 10,577 | 100.0% |
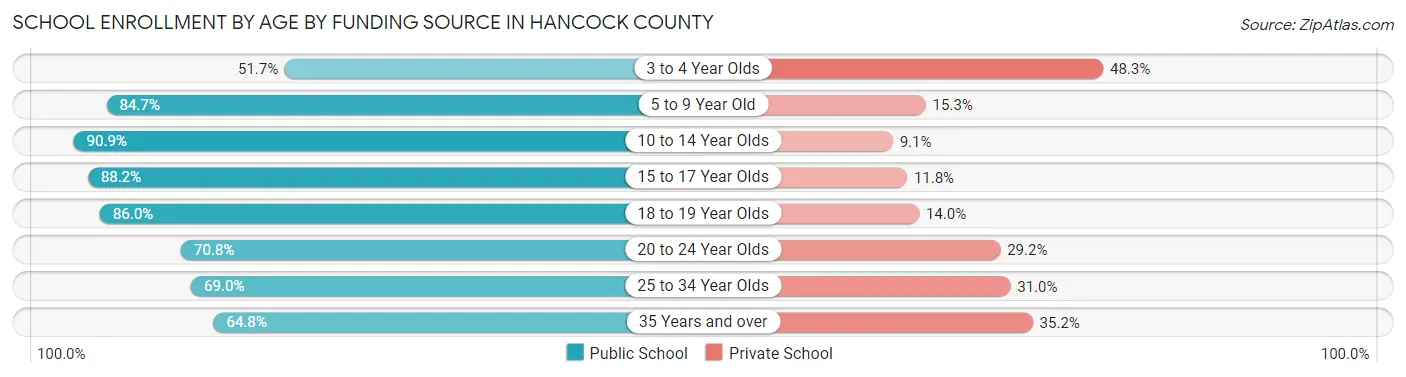
School Enrollment by Age by Funding Source in Hancock County
Out of a total of 10,577 students who are enrolled in schools in Hancock County, 1,925 (18.2%) attend a private institution, while the remaining 8,652 (81.8%) are enrolled in public schools. The age group of 3 to 4 year olds has the highest likelihood of being enrolled in private schools, with 216 (48.3% in the age bracket) enrolled. Conversely, the age group of 10 to 14 year olds has the lowest likelihood of being enrolled in a private school, with 2,128 (90.9% in the age bracket) attending a public institution.
| Age Bracket | Public School | Private School |
| 3 to 4 Year Olds | 231 (51.7%) | 216 (48.3%) |
| 5 to 9 Year Old | 2,375 (84.7%) | 428 (15.3%) |
| 10 to 14 Year Olds | 2,128 (90.9%) | 214 (9.1%) |
| 15 to 17 Year Olds | 1,407 (88.2%) | 188 (11.8%) |
| 18 to 19 Year Olds | 925 (86.0%) | 151 (14.0%) |
| 20 to 24 Year Olds | 753 (70.8%) | 310 (29.2%) |
| 25 to 34 Year Olds | 420 (69.0%) | 189 (31.0%) |
| 35 Years and over | 416 (64.8%) | 226 (35.2%) |
| Total | 8,652 (81.8%) | 1,925 (18.2%) |
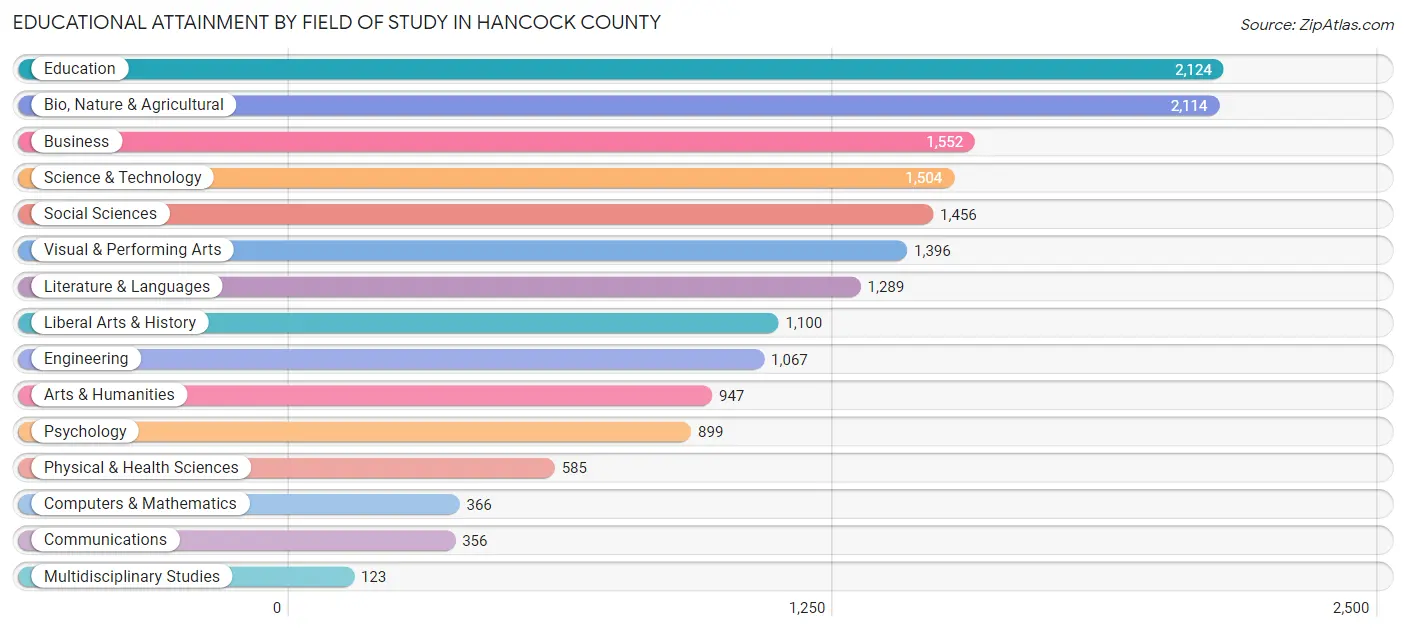
Educational Attainment by Field of Study in Hancock County
Education (2,124 | 12.6%), bio, nature & agricultural (2,114 | 12.5%), business (1,552 | 9.2%), science & technology (1,504 | 8.9%), and social sciences (1,456 | 8.6%) are the most common fields of study among 16,878 individuals in Hancock County who have obtained a bachelor's degree or higher.
| Field of Study | # Graduates | % Graduates |
| Computers & Mathematics | 366 | 2.2% |
| Bio, Nature & Agricultural | 2,114 | 12.5% |
| Physical & Health Sciences | 585 | 3.5% |
| Psychology | 899 | 5.3% |
| Social Sciences | 1,456 | 8.6% |
| Engineering | 1,067 | 6.3% |
| Multidisciplinary Studies | 123 | 0.7% |
| Science & Technology | 1,504 | 8.9% |
| Business | 1,552 | 9.2% |
| Education | 2,124 | 12.6% |
| Literature & Languages | 1,289 | 7.6% |
| Liberal Arts & History | 1,100 | 6.5% |
| Visual & Performing Arts | 1,396 | 8.3% |
| Communications | 356 | 2.1% |
| Arts & Humanities | 947 | 5.6% |
| Total | 16,878 | 100.0% |
Transportation & Commute in Hancock County
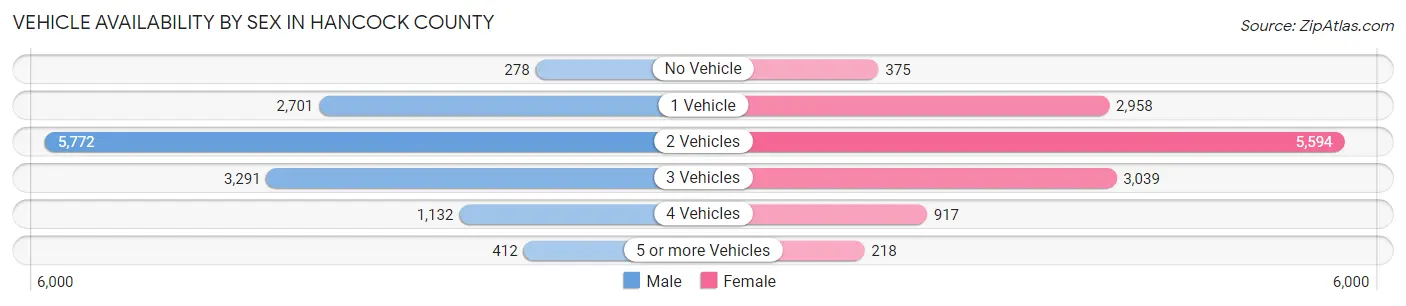
Vehicle Availability by Sex in Hancock County
The most prevalent vehicle ownership categories in Hancock County are males with 2 vehicles (5,772, accounting for 42.5%) and females with 2 vehicles (5,594, making up 44.1%).
| Vehicles Available | Male | Female |
| No Vehicle | 278 (2.1%) | 375 (2.9%) |
| 1 Vehicle | 2,701 (19.9%) | 2,958 (22.6%) |
| 2 Vehicles | 5,772 (42.5%) | 5,594 (42.7%) |
| 3 Vehicles | 3,291 (24.2%) | 3,039 (23.2%) |
| 4 Vehicles | 1,132 (8.3%) | 917 (7.0%) |
| 5 or more Vehicles | 412 (3.0%) | 218 (1.7%) |
| Total | 13,586 (100.0%) | 13,101 (100.0%) |
Commute Time in Hancock County
The most frequently occuring commute durations in Hancock County are 10 to 14 minutes (3,495 commuters, 14.4%), 15 to 19 minutes (3,236 commuters, 13.4%), and 5 to 9 minutes (3,065 commuters, 12.6%).
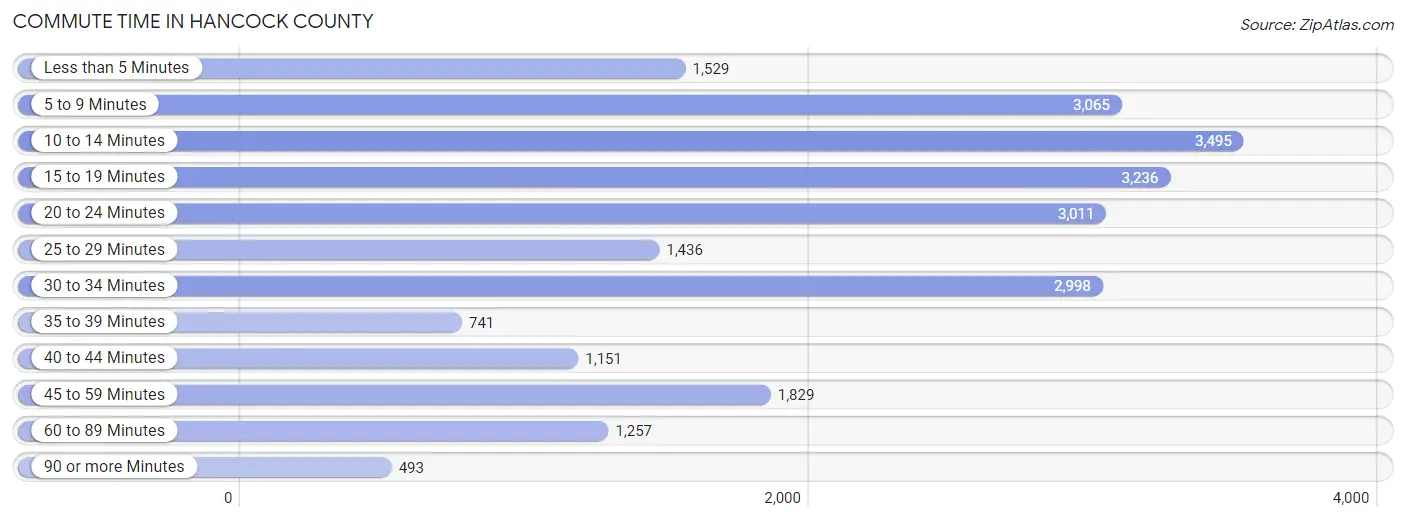
| Commute Time | # Commuters | % Commuters |
| Less than 5 Minutes | 1,529 | 6.3% |
| 5 to 9 Minutes | 3,065 | 12.6% |
| 10 to 14 Minutes | 3,495 | 14.4% |
| 15 to 19 Minutes | 3,236 | 13.4% |
| 20 to 24 Minutes | 3,011 | 12.4% |
| 25 to 29 Minutes | 1,436 | 5.9% |
| 30 to 34 Minutes | 2,998 | 12.4% |
| 35 to 39 Minutes | 741 | 3.1% |
| 40 to 44 Minutes | 1,151 | 4.8% |
| 45 to 59 Minutes | 1,829 | 7.5% |
| 60 to 89 Minutes | 1,257 | 5.2% |
| 90 or more Minutes | 493 | 2.0% |
Commute Time by Sex in Hancock County
The most common commute times in Hancock County are 20 to 24 minutes (1,664 commuters, 13.5%) for males and 10 to 14 minutes (1,847 commuters, 15.6%) for females.
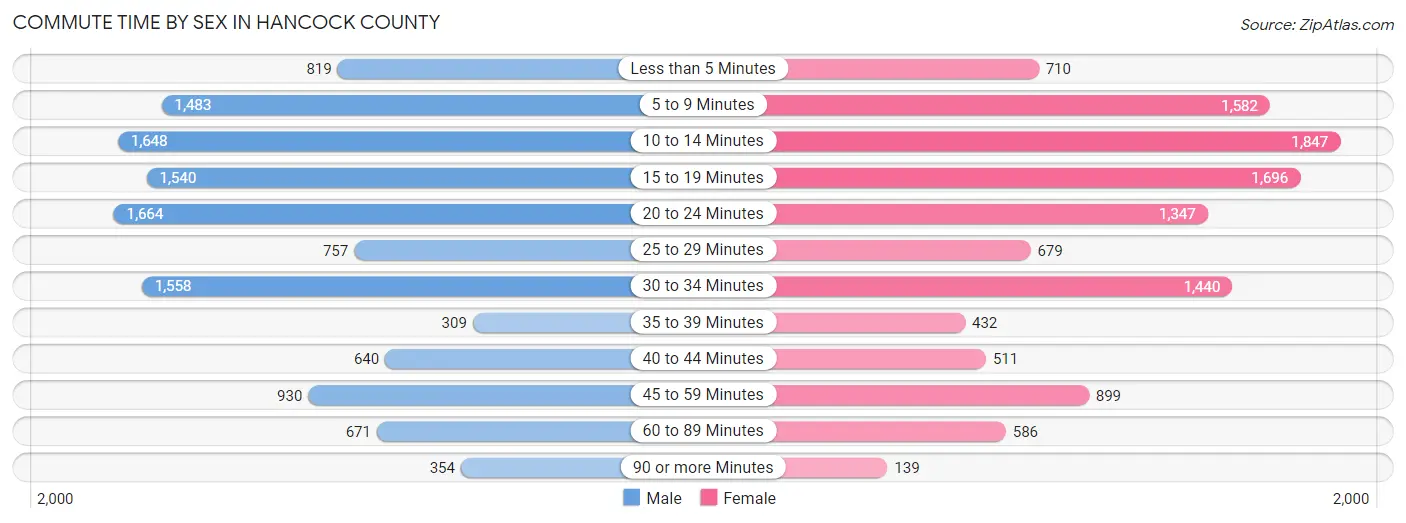
| Commute Time | Male | Female |
| Less than 5 Minutes | 819 (6.6%) | 710 (6.0%) |
| 5 to 9 Minutes | 1,483 (12.0%) | 1,582 (13.3%) |
| 10 to 14 Minutes | 1,648 (13.3%) | 1,847 (15.6%) |
| 15 to 19 Minutes | 1,540 (12.4%) | 1,696 (14.3%) |
| 20 to 24 Minutes | 1,664 (13.5%) | 1,347 (11.4%) |
| 25 to 29 Minutes | 757 (6.1%) | 679 (5.7%) |
| 30 to 34 Minutes | 1,558 (12.6%) | 1,440 (12.1%) |
| 35 to 39 Minutes | 309 (2.5%) | 432 (3.6%) |
| 40 to 44 Minutes | 640 (5.2%) | 511 (4.3%) |
| 45 to 59 Minutes | 930 (7.5%) | 899 (7.6%) |
| 60 to 89 Minutes | 671 (5.4%) | 586 (4.9%) |
| 90 or more Minutes | 354 (2.9%) | 139 (1.2%) |
Time of Departure to Work by Sex in Hancock County
The most frequent times of departure to work in Hancock County are 7:00 AM to 7:29 AM (1,860, 15.0%) for males and 7:30 AM to 7:59 AM (1,765, 14.9%) for females.
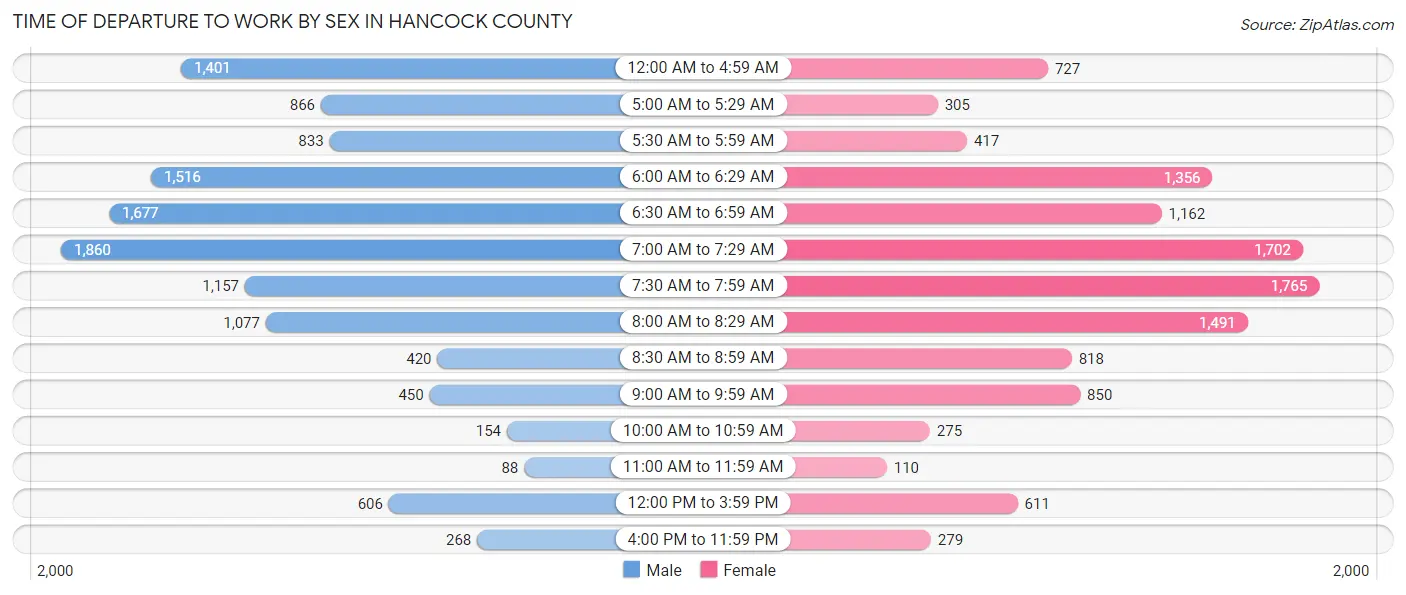
| Time of Departure | Male | Female |
| 12:00 AM to 4:59 AM | 1,401 (11.3%) | 727 (6.1%) |
| 5:00 AM to 5:29 AM | 866 (7.0%) | 305 (2.6%) |
| 5:30 AM to 5:59 AM | 833 (6.7%) | 417 (3.5%) |
| 6:00 AM to 6:29 AM | 1,516 (12.2%) | 1,356 (11.4%) |
| 6:30 AM to 6:59 AM | 1,677 (13.6%) | 1,162 (9.8%) |
| 7:00 AM to 7:29 AM | 1,860 (15.0%) | 1,702 (14.3%) |
| 7:30 AM to 7:59 AM | 1,157 (9.3%) | 1,765 (14.9%) |
| 8:00 AM to 8:29 AM | 1,077 (8.7%) | 1,491 (12.6%) |
| 8:30 AM to 8:59 AM | 420 (3.4%) | 818 (6.9%) |
| 9:00 AM to 9:59 AM | 450 (3.6%) | 850 (7.2%) |
| 10:00 AM to 10:59 AM | 154 (1.2%) | 275 (2.3%) |
| 11:00 AM to 11:59 AM | 88 (0.7%) | 110 (0.9%) |
| 12:00 PM to 3:59 PM | 606 (4.9%) | 611 (5.1%) |
| 4:00 PM to 11:59 PM | 268 (2.2%) | 279 (2.4%) |
| Total | 12,373 (100.0%) | 11,868 (100.0%) |
Housing Occupancy in Hancock County
Occupancy by Ownership in Hancock County
Of the total 24,660 dwellings in Hancock County, owner-occupied units account for 19,411 (78.7%), while renter-occupied units make up 5,249 (21.3%).
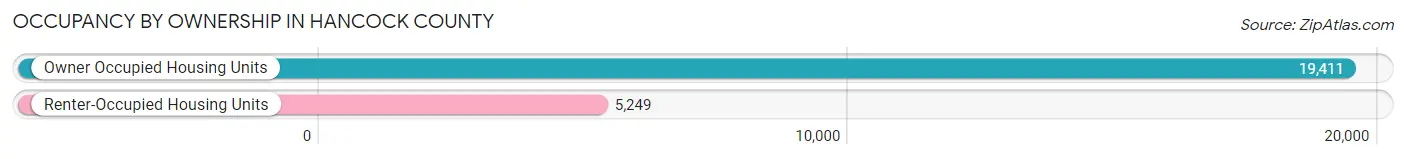
| Occupancy | # Housing Units | % Housing Units |
| Owner Occupied Housing Units | 19,411 | 78.7% |
| Renter-Occupied Housing Units | 5,249 | 21.3% |
| Total Occupied Housing Units | 24,660 | 100.0% |
Occupancy by Household Size in Hancock County
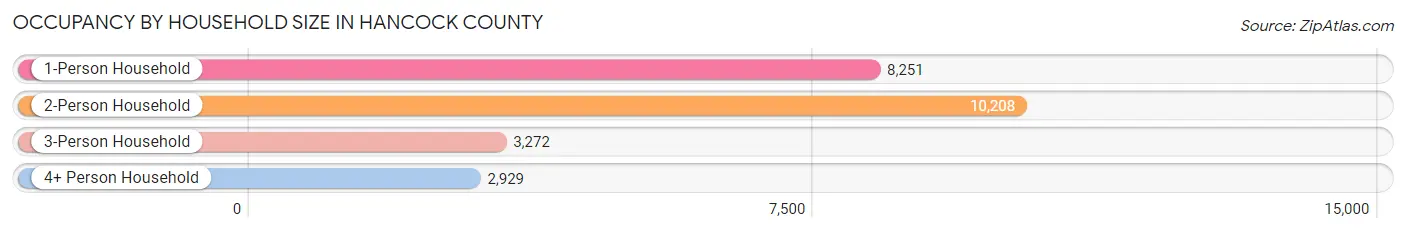
| Household Size | # Housing Units | % Housing Units |
| 1-Person Household | 8,251 | 33.5% |
| 2-Person Household | 10,208 | 41.4% |
| 3-Person Household | 3,272 | 13.3% |
| 4+ Person Household | 2,929 | 11.9% |
| Total Housing Units | 24,660 | 100.0% |
Occupancy by Ownership by Household Size in Hancock County
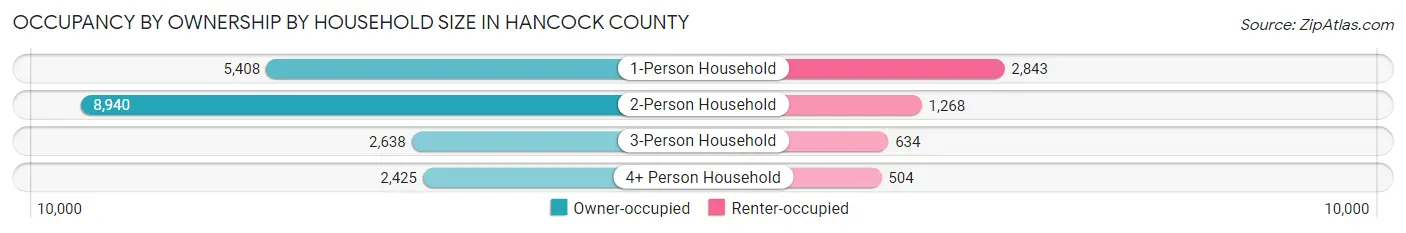
| Household Size | Owner-occupied | Renter-occupied |
| 1-Person Household | 5,408 (65.5%) | 2,843 (34.5%) |
| 2-Person Household | 8,940 (87.6%) | 1,268 (12.4%) |
| 3-Person Household | 2,638 (80.6%) | 634 (19.4%) |
| 4+ Person Household | 2,425 (82.8%) | 504 (17.2%) |
| Total Housing Units | 19,411 (78.7%) | 5,249 (21.3%) |
Occupancy by Educational Attainment in Hancock County
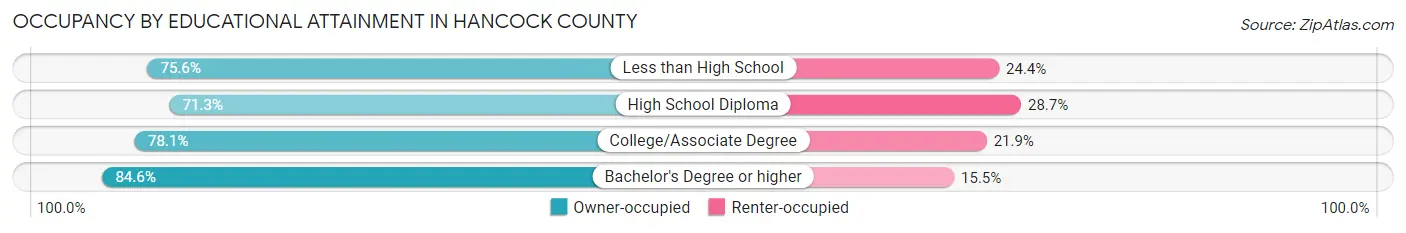
| Household Size | Owner-occupied | Renter-occupied |
| Less than High School | 726 (75.6%) | 234 (24.4%) |
| High School Diploma | 4,860 (71.3%) | 1,959 (28.7%) |
| College/Associate Degree | 5,413 (78.1%) | 1,519 (21.9%) |
| Bachelor's Degree or higher | 8,412 (84.6%) | 1,537 (15.4%) |
Occupancy by Age of Householder in Hancock County
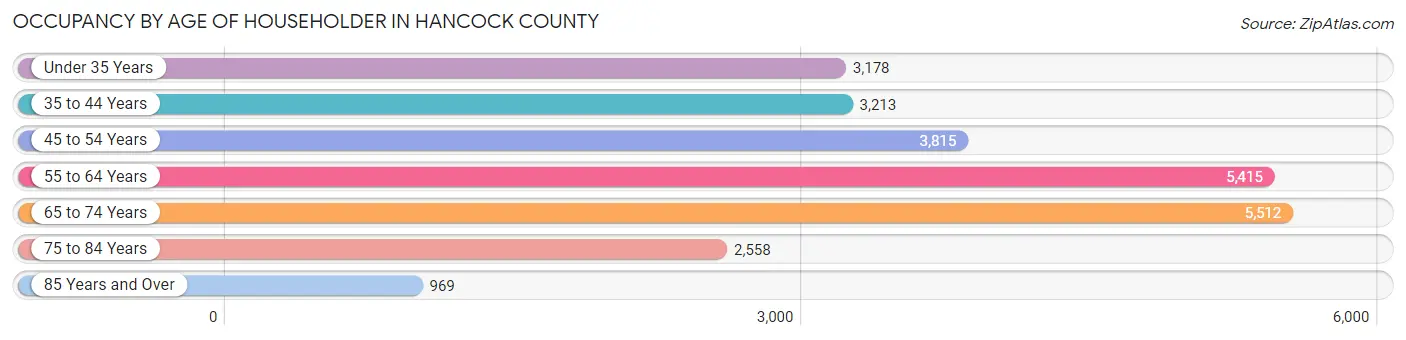
| Age Bracket | # Households | % Households |
| Under 35 Years | 3,178 | 12.9% |
| 35 to 44 Years | 3,213 | 13.0% |
| 45 to 54 Years | 3,815 | 15.5% |
| 55 to 64 Years | 5,415 | 22.0% |
| 65 to 74 Years | 5,512 | 22.4% |
| 75 to 84 Years | 2,558 | 10.4% |
| 85 Years and Over | 969 | 3.9% |
| Total | 24,660 | 100.0% |
Housing Finances in Hancock County
Median Income by Occupancy in Hancock County
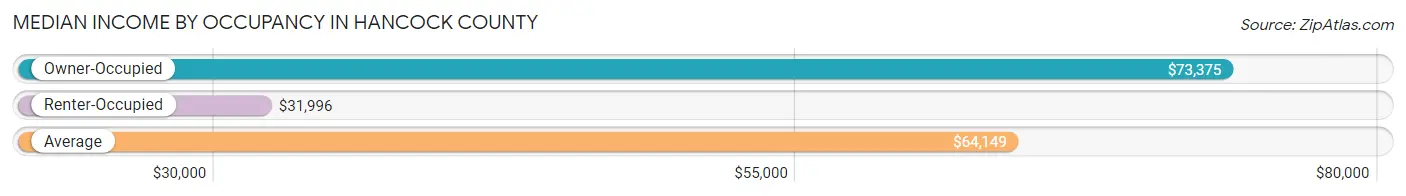
| Occupancy Type | # Households | Median Income |
| Owner-Occupied | 19,411 (78.7%) | $73,375 |
| Renter-Occupied | 5,249 (21.3%) | $31,996 |
| Average | 24,660 (100.0%) | $64,149 |
Occupancy by Householder Income Bracket in Hancock County
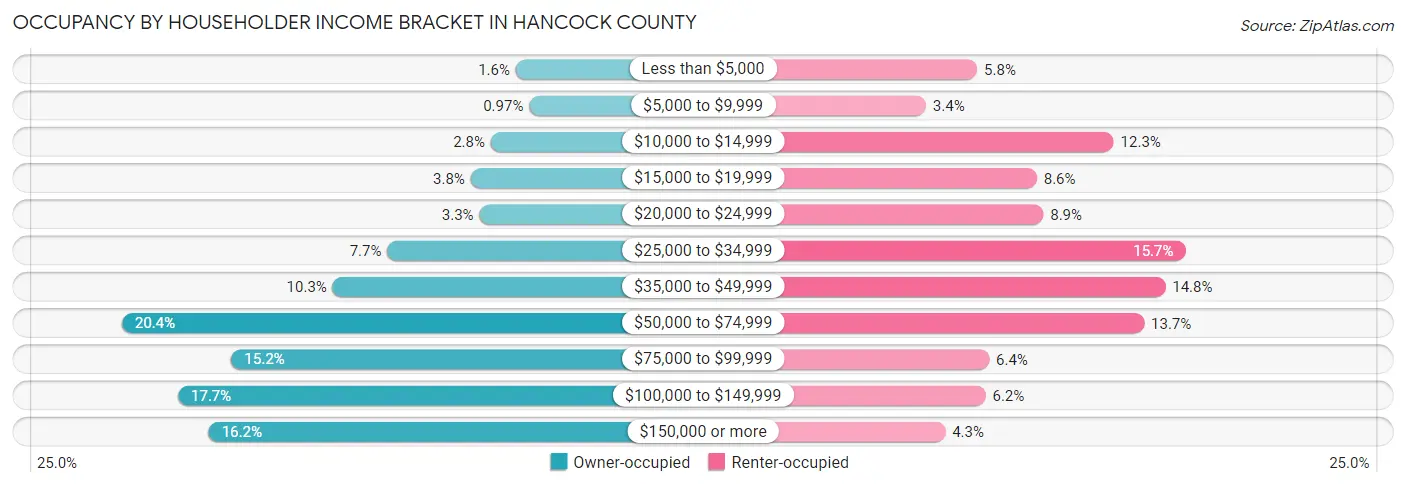
| Income Bracket | Owner-occupied | Renter-occupied |
| Less than $5,000 | 312 (1.6%) | 304 (5.8%) |
| $5,000 to $9,999 | 189 (1.0%) | 176 (3.4%) |
| $10,000 to $14,999 | 543 (2.8%) | 645 (12.3%) |
| $15,000 to $19,999 | 730 (3.8%) | 453 (8.6%) |
| $20,000 to $24,999 | 648 (3.3%) | 469 (8.9%) |
| $25,000 to $34,999 | 1,501 (7.7%) | 824 (15.7%) |
| $35,000 to $49,999 | 2,006 (10.3%) | 774 (14.7%) |
| $50,000 to $74,999 | 3,954 (20.4%) | 721 (13.7%) |
| $75,000 to $99,999 | 2,941 (15.1%) | 334 (6.4%) |
| $100,000 to $149,999 | 3,436 (17.7%) | 325 (6.2%) |
| $150,000 or more | 3,151 (16.2%) | 224 (4.3%) |
| Total | 19,411 (100.0%) | 5,249 (100.0%) |
Monthly Housing Cost Tiers in Hancock County
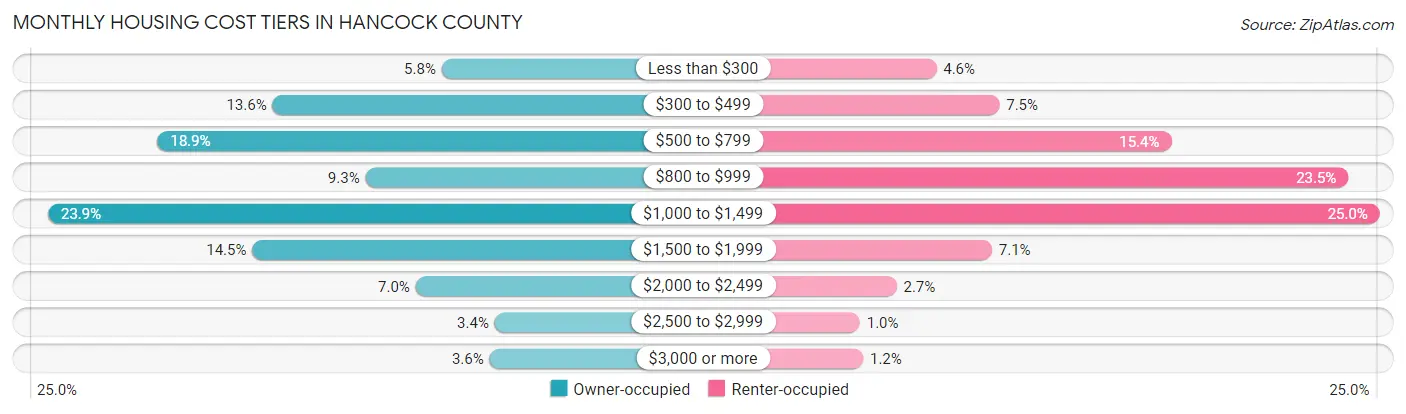
| Monthly Cost | Owner-occupied | Renter-occupied |
| Less than $300 | 1,125 (5.8%) | 239 (4.5%) |
| $300 to $499 | 2,637 (13.6%) | 391 (7.4%) |
| $500 to $799 | 3,667 (18.9%) | 807 (15.4%) |
| $800 to $999 | 1,807 (9.3%) | 1,234 (23.5%) |
| $1,000 to $1,499 | 4,646 (23.9%) | 1,310 (25.0%) |
| $1,500 to $1,999 | 2,819 (14.5%) | 373 (7.1%) |
| $2,000 to $2,499 | 1,358 (7.0%) | 143 (2.7%) |
| $2,500 to $2,999 | 653 (3.4%) | 54 (1.0%) |
| $3,000 or more | 699 (3.6%) | 62 (1.2%) |
| Total | 19,411 (100.0%) | 5,249 (100.0%) |
Physical Housing Characteristics in Hancock County
Housing Structures in Hancock County
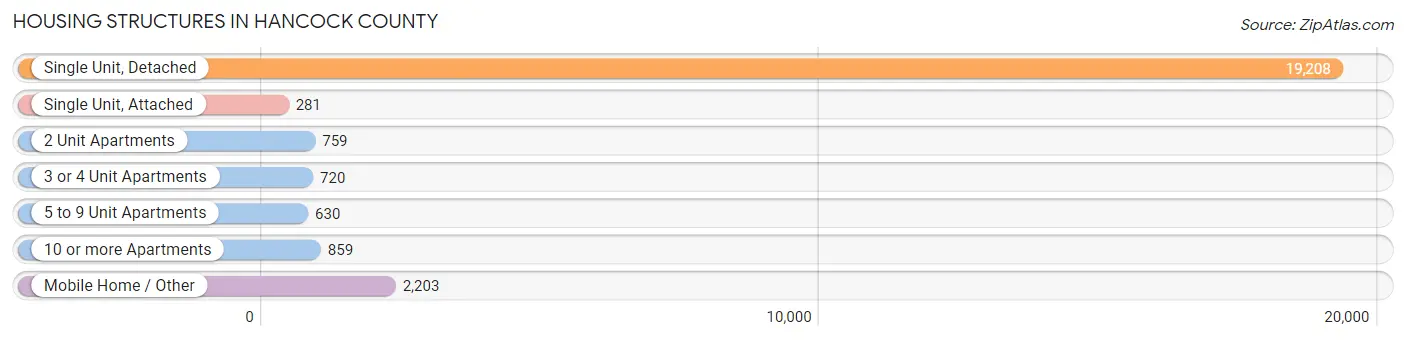
| Structure Type | # Housing Units | % Housing Units |
| Single Unit, Detached | 19,208 | 77.9% |
| Single Unit, Attached | 281 | 1.1% |
| 2 Unit Apartments | 759 | 3.1% |
| 3 or 4 Unit Apartments | 720 | 2.9% |
| 5 to 9 Unit Apartments | 630 | 2.5% |
| 10 or more Apartments | 859 | 3.5% |
| Mobile Home / Other | 2,203 | 8.9% |
| Total | 24,660 | 100.0% |
Housing Structures by Occupancy in Hancock County
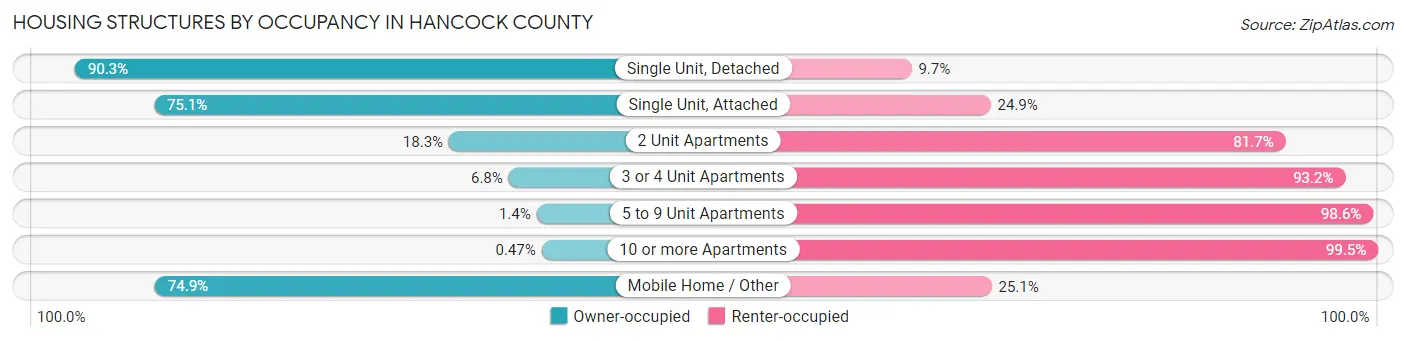
| Structure Type | Owner-occupied | Renter-occupied |
| Single Unit, Detached | 17,349 (90.3%) | 1,859 (9.7%) |
| Single Unit, Attached | 211 (75.1%) | 70 (24.9%) |
| 2 Unit Apartments | 139 (18.3%) | 620 (81.7%) |
| 3 or 4 Unit Apartments | 49 (6.8%) | 671 (93.2%) |
| 5 to 9 Unit Apartments | 9 (1.4%) | 621 (98.6%) |
| 10 or more Apartments | 4 (0.5%) | 855 (99.5%) |
| Mobile Home / Other | 1,650 (74.9%) | 553 (25.1%) |
| Total | 19,411 (78.7%) | 5,249 (21.3%) |
Housing Structures by Number of Rooms in Hancock County
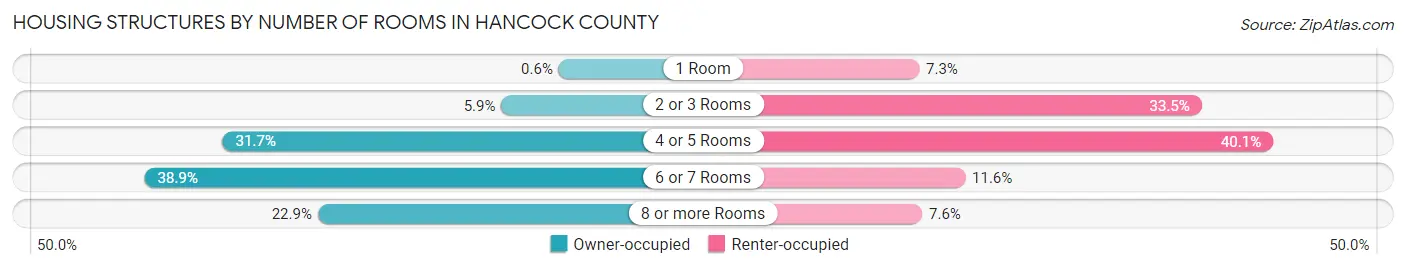
| Number of Rooms | Owner-occupied | Renter-occupied |
| 1 Room | 117 (0.6%) | 384 (7.3%) |
| 2 or 3 Rooms | 1,147 (5.9%) | 1,756 (33.5%) |
| 4 or 5 Rooms | 6,152 (31.7%) | 2,102 (40.1%) |
| 6 or 7 Rooms | 7,552 (38.9%) | 608 (11.6%) |
| 8 or more Rooms | 4,443 (22.9%) | 399 (7.6%) |
| Total | 19,411 (100.0%) | 5,249 (100.0%) |
Housing Structure by Heating Type in Hancock County
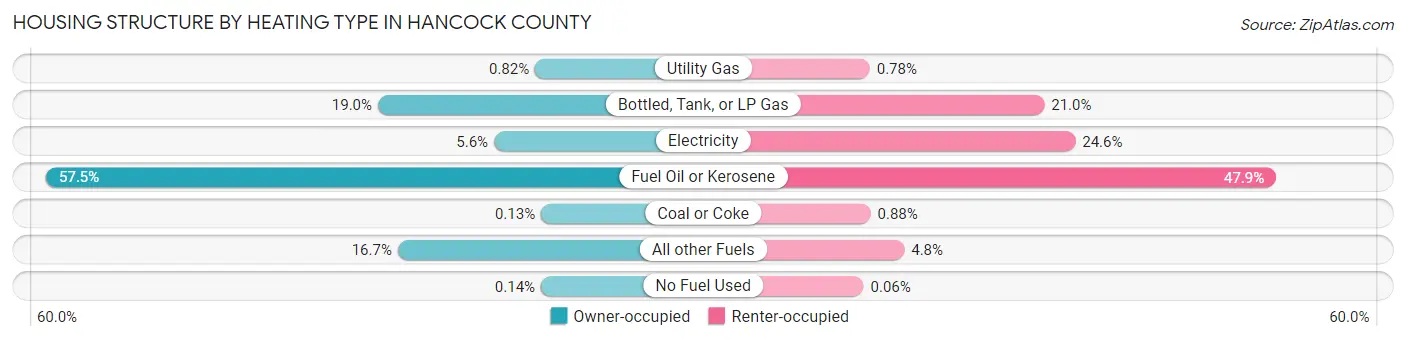
| Heating Type | Owner-occupied | Renter-occupied |
| Utility Gas | 159 (0.8%) | 41 (0.8%) |
| Bottled, Tank, or LP Gas | 3,696 (19.0%) | 1,103 (21.0%) |
| Electricity | 1,084 (5.6%) | 1,292 (24.6%) |
| Fuel Oil or Kerosene | 11,168 (57.5%) | 2,513 (47.9%) |
| Coal or Coke | 26 (0.1%) | 46 (0.9%) |
| All other Fuels | 3,250 (16.7%) | 251 (4.8%) |
| No Fuel Used | 28 (0.1%) | 3 (0.1%) |
| Total | 19,411 (100.0%) | 5,249 (100.0%) |
Household Vehicle Usage in Hancock County
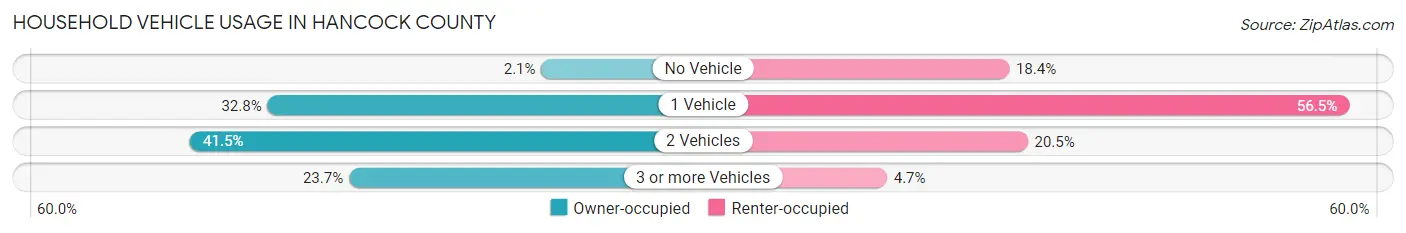
| Vehicles per Household | Owner-occupied | Renter-occupied |
| No Vehicle | 409 (2.1%) | 965 (18.4%) |
| 1 Vehicle | 6,364 (32.8%) | 2,964 (56.5%) |
| 2 Vehicles | 8,046 (41.4%) | 1,074 (20.5%) |
| 3 or more Vehicles | 4,592 (23.7%) | 246 (4.7%) |
| Total | 19,411 (100.0%) | 5,249 (100.0%) |
Real Estate & Mortgages in Hancock County
Real Estate and Mortgage Overview in Hancock County
| Characteristic | Without Mortgage | With Mortgage |
| Housing Units | 8,403 | 11,008 |
| Median Property Value | $260,300 | $246,500 |
| Median Household Income | $55,869 | $2,187 |
| Monthly Housing Costs | $534 | $685 |
| Real Estate Taxes | $2,329 | $48 |
Property Value by Mortgage Status in Hancock County
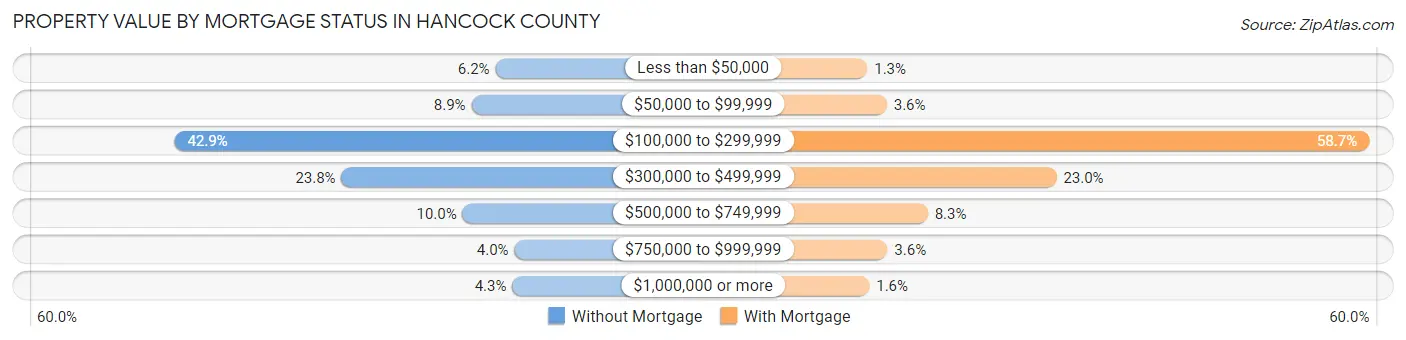
| Property Value | Without Mortgage | With Mortgage |
| Less than $50,000 | 520 (6.2%) | 147 (1.3%) |
| $50,000 to $99,999 | 750 (8.9%) | 393 (3.6%) |
| $100,000 to $299,999 | 3,602 (42.9%) | 6,459 (58.7%) |
| $300,000 to $499,999 | 1,999 (23.8%) | 2,527 (23.0%) |
| $500,000 to $749,999 | 836 (10.0%) | 908 (8.3%) |
| $750,000 to $999,999 | 338 (4.0%) | 401 (3.6%) |
| $1,000,000 or more | 358 (4.3%) | 173 (1.6%) |
| Total | 8,403 (100.0%) | 11,008 (100.0%) |
Household Income by Mortgage Status in Hancock County
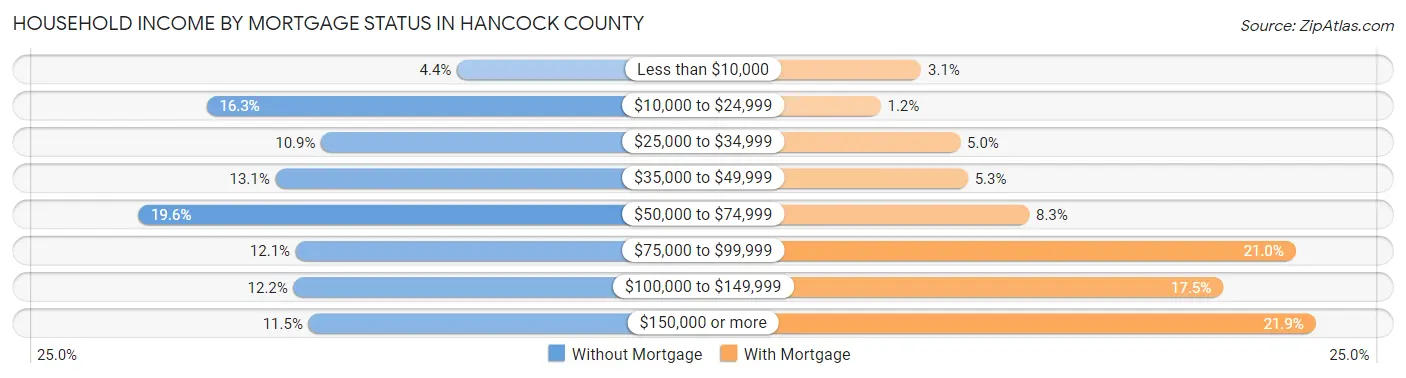
| Household Income | Without Mortgage | With Mortgage |
| Less than $10,000 | 370 (4.4%) | 344 (3.1%) |
| $10,000 to $24,999 | 1,373 (16.3%) | 131 (1.2%) |
| $25,000 to $34,999 | 913 (10.9%) | 548 (5.0%) |
| $35,000 to $49,999 | 1,097 (13.1%) | 588 (5.3%) |
| $50,000 to $74,999 | 1,647 (19.6%) | 909 (8.3%) |
| $75,000 to $99,999 | 1,015 (12.1%) | 2,307 (21.0%) |
| $100,000 to $149,999 | 1,024 (12.2%) | 1,926 (17.5%) |
| $150,000 or more | 964 (11.5%) | 2,412 (21.9%) |
| Total | 8,403 (100.0%) | 11,008 (100.0%) |
Property Value to Household Income Ratio in Hancock County
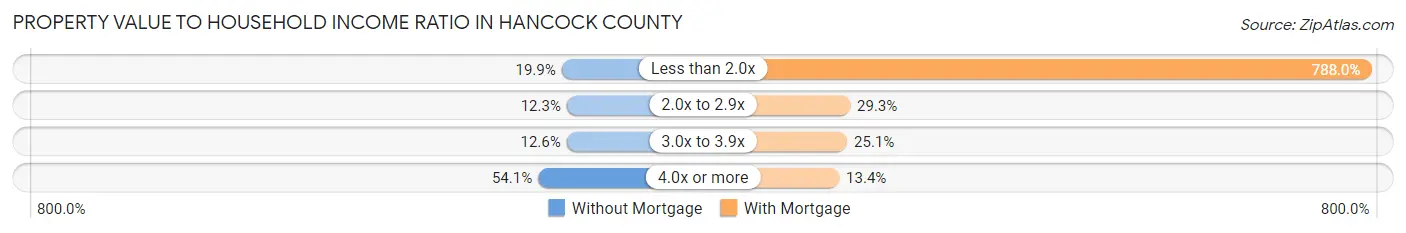
| Value-to-Income Ratio | Without Mortgage | With Mortgage |
| Less than 2.0x | 1,673 (19.9%) | 86,740 (788.0%) |
| 2.0x to 2.9x | 1,036 (12.3%) | 3,225 (29.3%) |
| 3.0x to 3.9x | 1,060 (12.6%) | 2,758 (25.1%) |
| 4.0x or more | 4,546 (54.1%) | 1,476 (13.4%) |
| Total | 8,403 (100.0%) | 11,008 (100.0%) |
Real Estate Taxes by Mortgage Status in Hancock County
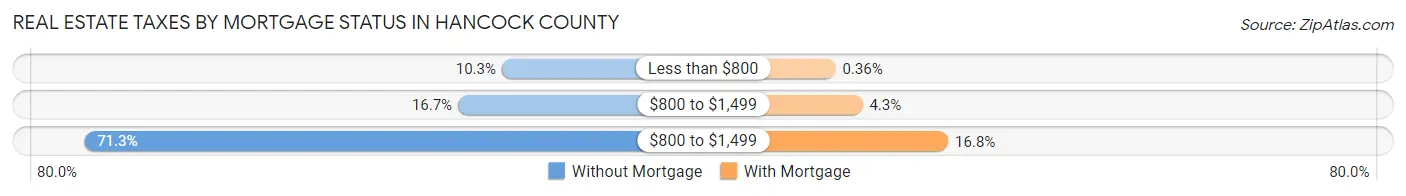
| Property Taxes | Without Mortgage | With Mortgage |
| Less than $800 | 863 (10.3%) | 40 (0.4%) |
| $800 to $1,499 | 1,402 (16.7%) | 473 (4.3%) |
| $800 to $1,499 | 5,990 (71.3%) | 1,852 (16.8%) |
| Total | 8,403 (100.0%) | 11,008 (100.0%) |
Health & Disability in Hancock County
Health Insurance Coverage by Age in Hancock County
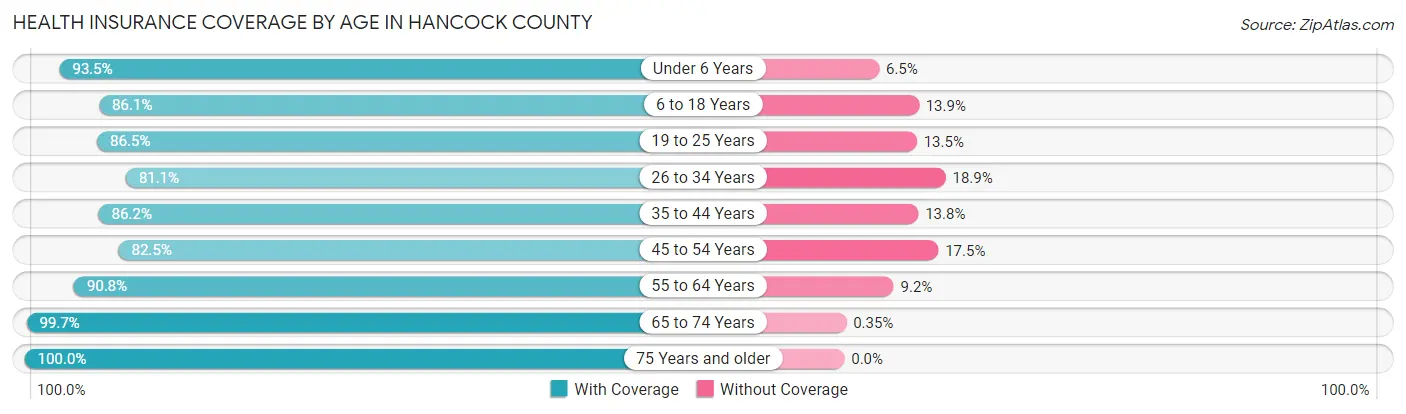
| Age Bracket | With Coverage | Without Coverage |
| Under 6 Years | 2,570 (93.5%) | 178 (6.5%) |
| 6 to 18 Years | 6,165 (86.1%) | 994 (13.9%) |
| 19 to 25 Years | 3,642 (86.5%) | 569 (13.5%) |
| 26 to 34 Years | 4,272 (81.1%) | 994 (18.9%) |
| 35 to 44 Years | 5,097 (86.2%) | 815 (13.8%) |
| 45 to 54 Years | 5,683 (82.5%) | 1,207 (17.5%) |
| 55 to 64 Years | 8,268 (90.8%) | 837 (9.2%) |
| 65 to 74 Years | 8,657 (99.7%) | 30 (0.4%) |
| 75 Years and older | 5,317 (100.0%) | 0 (0.0%) |
| Total | 49,671 (89.8%) | 5,624 (10.2%) |
Health Insurance Coverage by Citizenship Status in Hancock County
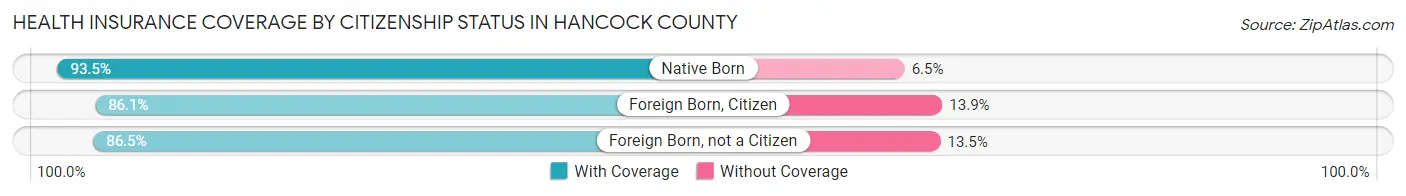
| Citizenship Status | With Coverage | Without Coverage |
| Native Born | 2,570 (93.5%) | 178 (6.5%) |
| Foreign Born, Citizen | 6,165 (86.1%) | 994 (13.9%) |
| Foreign Born, not a Citizen | 3,642 (86.5%) | 569 (13.5%) |
Health Insurance Coverage by Household Income in Hancock County
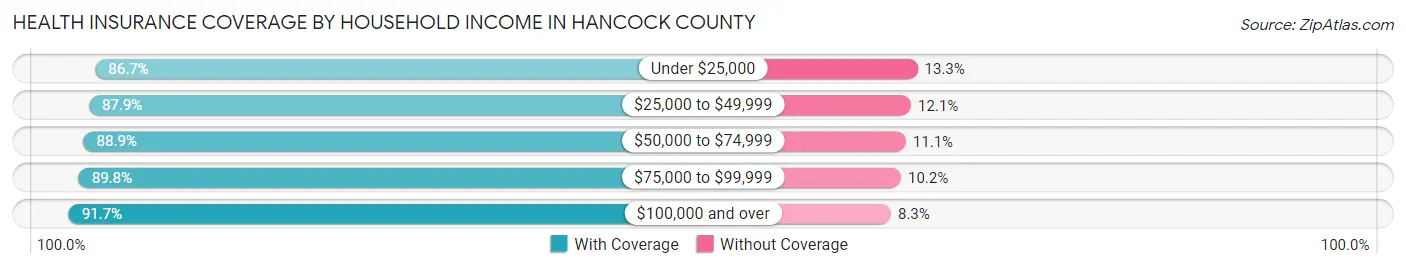
| Household Income | With Coverage | Without Coverage |
| Under $25,000 | 5,699 (86.7%) | 872 (13.3%) |
| $25,000 to $49,999 | 7,795 (87.9%) | 1,069 (12.1%) |
| $50,000 to $74,999 | 9,210 (88.9%) | 1,147 (11.1%) |
| $75,000 to $99,999 | 7,222 (89.8%) | 817 (10.2%) |
| $100,000 and over | 18,564 (91.7%) | 1,678 (8.3%) |
Public vs Private Health Insurance Coverage by Age in Hancock County
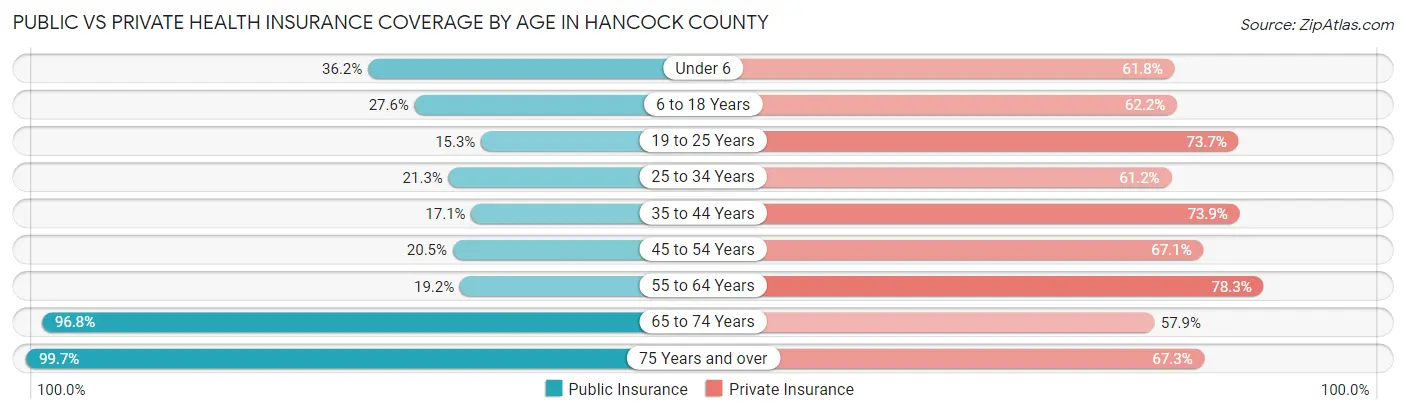
| Age Bracket | Public Insurance | Private Insurance |
| Under 6 | 996 (36.2%) | 1,697 (61.8%) |
| 6 to 18 Years | 1,975 (27.6%) | 4,456 (62.2%) |
| 19 to 25 Years | 642 (15.2%) | 3,102 (73.7%) |
| 25 to 34 Years | 1,121 (21.3%) | 3,222 (61.2%) |
| 35 to 44 Years | 1,009 (17.1%) | 4,366 (73.9%) |
| 45 to 54 Years | 1,413 (20.5%) | 4,626 (67.1%) |
| 55 to 64 Years | 1,746 (19.2%) | 7,127 (78.3%) |
| 65 to 74 Years | 8,408 (96.8%) | 5,031 (57.9%) |
| 75 Years and over | 5,303 (99.7%) | 3,580 (67.3%) |
| Total | 22,613 (40.9%) | 37,207 (67.3%) |
Disability Status by Sex by Age in Hancock County
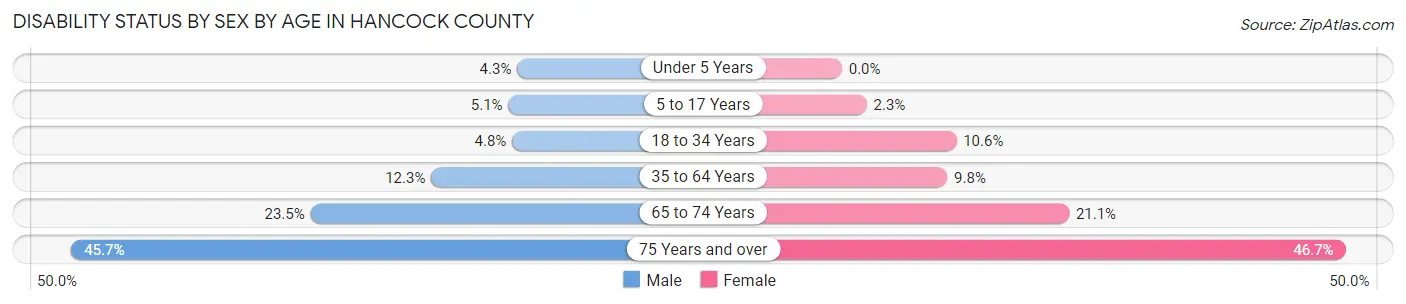
| Age Bracket | Male | Female |
| Under 5 Years | 53 (4.3%) | 0 (0.0%) |
| 5 to 17 Years | 177 (5.1%) | 80 (2.3%) |
| 18 to 34 Years | 248 (4.8%) | 522 (10.6%) |
| 35 to 64 Years | 1,297 (12.3%) | 1,108 (9.8%) |
| 65 to 74 Years | 983 (23.5%) | 948 (21.1%) |
| 75 Years and over | 1,076 (45.7%) | 1,384 (46.7%) |
Disability Class by Sex by Age in Hancock County
Disability Class: Hearing Difficulty
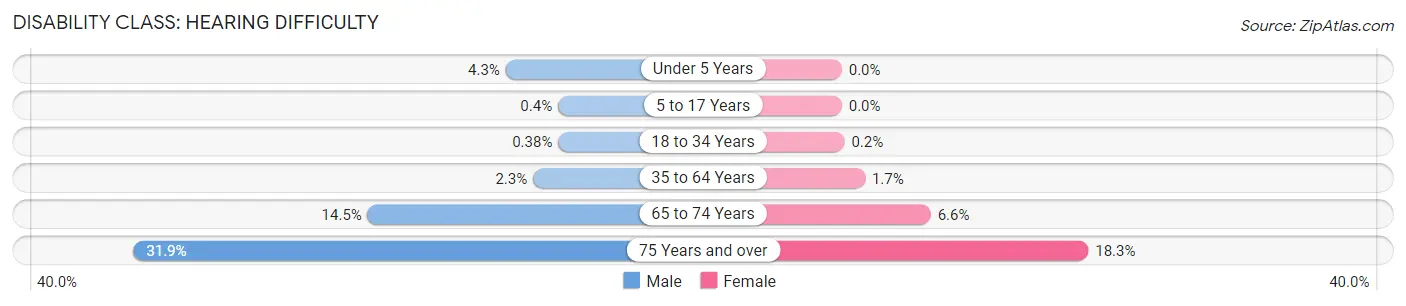
| Age Bracket | Male | Female |
| Under 5 Years | 53 (4.3%) | 0 (0.0%) |
| 5 to 17 Years | 14 (0.4%) | 0 (0.0%) |
| 18 to 34 Years | 20 (0.4%) | 10 (0.2%) |
| 35 to 64 Years | 238 (2.2%) | 195 (1.7%) |
| 65 to 74 Years | 609 (14.5%) | 297 (6.6%) |
| 75 Years and over | 752 (31.9%) | 542 (18.3%) |
Disability Class: Vision Difficulty
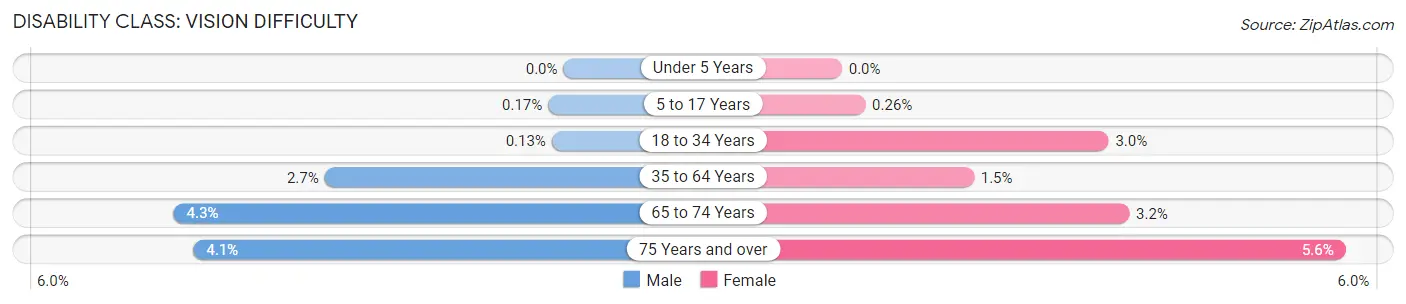
| Age Bracket | Male | Female |
| Under 5 Years | 0 (0.0%) | 0 (0.0%) |
| 5 to 17 Years | 6 (0.2%) | 9 (0.3%) |
| 18 to 34 Years | 7 (0.1%) | 146 (3.0%) |
| 35 to 64 Years | 281 (2.7%) | 167 (1.5%) |
| 65 to 74 Years | 182 (4.3%) | 144 (3.2%) |
| 75 Years and over | 97 (4.1%) | 166 (5.6%) |
Disability Class: Cognitive Difficulty
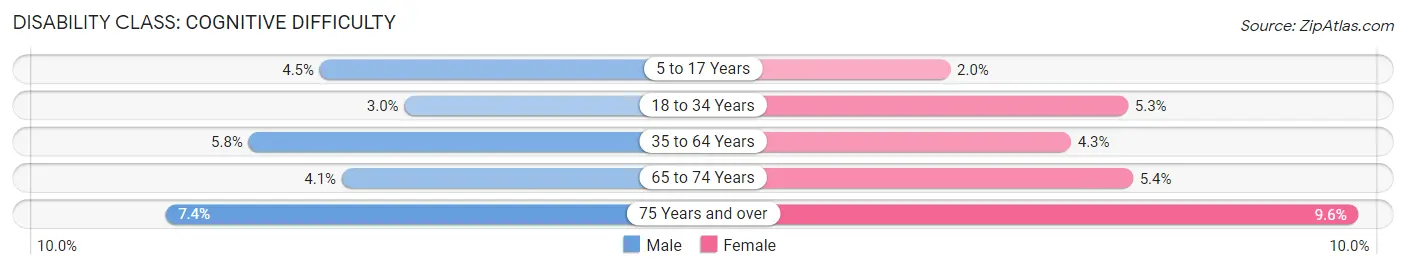
| Age Bracket | Male | Female |
| 5 to 17 Years | 157 (4.5%) | 70 (2.0%) |
| 18 to 34 Years | 154 (2.9%) | 261 (5.3%) |
| 35 to 64 Years | 618 (5.8%) | 481 (4.3%) |
| 65 to 74 Years | 172 (4.1%) | 243 (5.4%) |
| 75 Years and over | 174 (7.4%) | 284 (9.6%) |
Disability Class: Ambulatory Difficulty
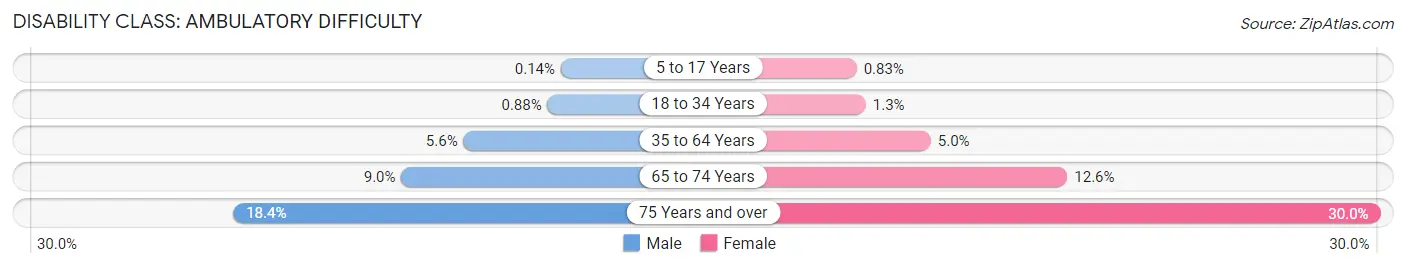
| Age Bracket | Male | Female |
| 5 to 17 Years | 5 (0.1%) | 29 (0.8%) |
| 18 to 34 Years | 46 (0.9%) | 66 (1.3%) |
| 35 to 64 Years | 588 (5.6%) | 562 (5.0%) |
| 65 to 74 Years | 378 (9.0%) | 565 (12.6%) |
| 75 Years and over | 433 (18.4%) | 888 (30.0%) |
Disability Class: Self-Care Difficulty
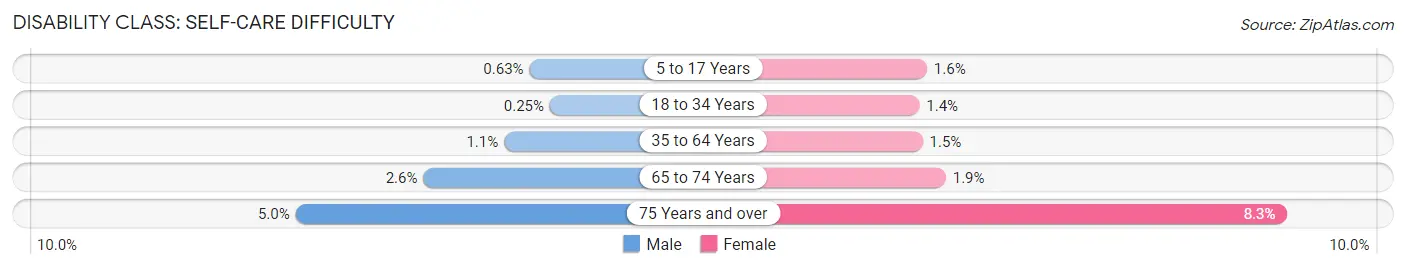
| Age Bracket | Male | Female |
| 5 to 17 Years | 22 (0.6%) | 55 (1.6%) |
| 18 to 34 Years | 13 (0.3%) | 71 (1.4%) |
| 35 to 64 Years | 116 (1.1%) | 170 (1.5%) |
| 65 to 74 Years | 109 (2.6%) | 87 (1.9%) |
| 75 Years and over | 117 (5.0%) | 245 (8.3%) |
Technology Access in Hancock County
Computing Device Access in Hancock County
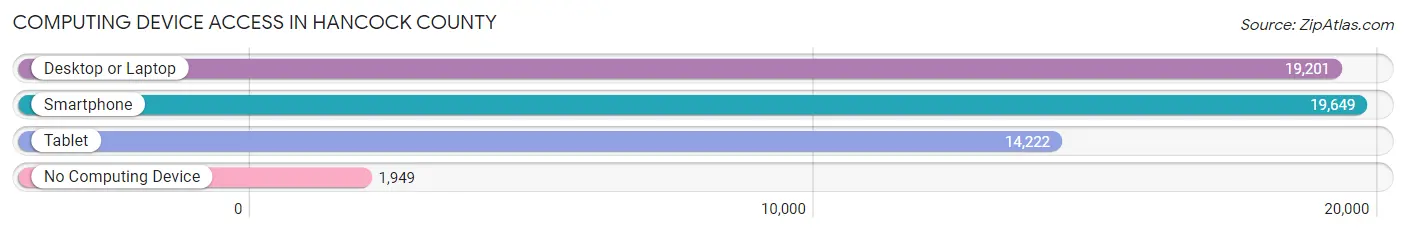
| Device Type | # Households | % Households |
| Desktop or Laptop | 19,201 | 77.9% |
| Smartphone | 19,649 | 79.7% |
| Tablet | 14,222 | 57.7% |
| No Computing Device | 1,949 | 7.9% |
| Total | 24,660 | 100.0% |
Internet Access in Hancock County
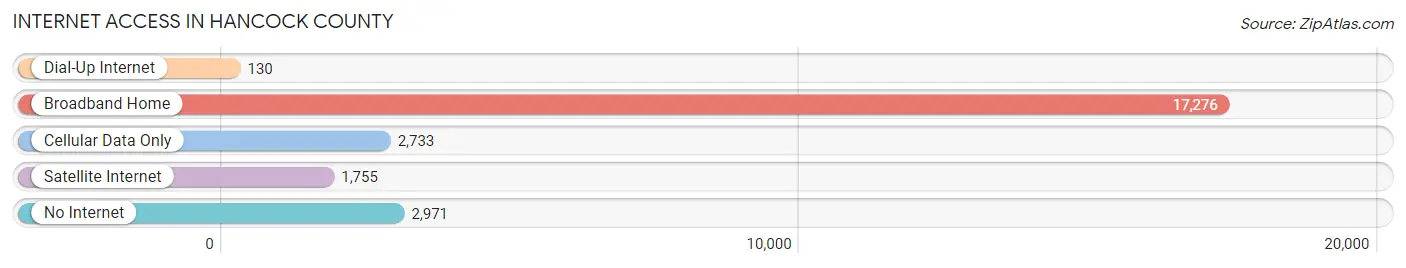
| Internet Type | # Households | % Households |
| Dial-Up Internet | 130 | 0.5% |
| Broadband Home | 17,276 | 70.1% |
| Cellular Data Only | 2,733 | 11.1% |
| Satellite Internet | 1,755 | 7.1% |
| No Internet | 2,971 | 12.0% |
| Total | 24,660 | 100.0% |
Hancock County Summary
Hancock County is located in the state of Maine, in the United States of America. It is bordered by Penobscot County to the north, Washington County to the east, and Waldo County to the south. The county seat is Ellsworth, and the county has a total area of 1,541 square miles. As of the 2010 census, the population was 54,418, making it the third-most populous county in Maine.
Hancock County was established in 1827 from parts of Washington and Penobscot counties. It was named for John Hancock, the first signer of the Declaration of Independence. The county was originally divided into two townships, Ellsworth and Trenton. The county has since grown to include a total of sixteen townships.
The geography of Hancock County is varied, with a mix of mountains, forests, and coastal areas. The highest point in the county is Cadillac Mountain, located in Acadia National Park. The county is home to several rivers, including the Union River, the Narraguagus River, and the Pleasant River. The county also includes several islands, including Mount Desert Island, Swan's Island, and Frenchboro.
The economy of Hancock County is largely based on tourism, fishing, and forestry. The county is home to several popular tourist destinations, including Acadia National Park, Bar Harbor, and Mount Desert Island. The county is also home to several fishing villages, such as Corea, Prospect Harbor, and Winter Harbor. The county is also home to several large forestry operations, including the Hancock County Forest Products Company.
Demographically, Hancock County is predominantly white, with a population that is 94.3% non-Hispanic white. The county has a median household income of $50,845, and a poverty rate of 11.2%. The county is home to several colleges and universities, including the University of Maine at Machias, the University of Maine at Presque Isle, and the Maine Maritime Academy.
Hancock County is a beautiful and diverse county, with a rich history and a vibrant economy. From its stunning coastal areas to its bustling towns and villages, Hancock County is a great place to live, work, and visit.
Common Questions
What is the Total Population of Hancock County?
Total Population of Hancock County is 55,851.
What is the Total Male Population of Hancock County?
Total Male Population of Hancock County is 27,342.
What is the Total Female Population of Hancock County?
Total Female Population of Hancock County is 28,509.
What is the Ratio of Males per 100 Females in Hancock County?
There are 95.91 Males per 100 Females in Hancock County.
What is the Ratio of Females per 100 Males in Hancock County?
There are 104.27 Females per 100 Males in Hancock County.
What is the Median Population Age in Hancock County?
Median Population Age in Hancock County is 48.9 Years.
What is the Average Family Size in Hancock County
Average Family Size in Hancock County is 2.8 People.
What is the Average Household Size in Hancock County
Average Household Size in Hancock County is 2.2 People.
What is Per Capita Income in Hancock County?
Per Capita income in Hancock County is $38,785.
What is the Median Family Income in Hancock County?
Median Family Income in Hancock County is $83,194.
What is the Median Household income in Hancock County?
Median Household Income in Hancock County is $64,149.
What is Income or Wage Gap in Hancock County?
Income or Wage Gap in Hancock County is 24.5%.
Women in Hancock County earn 75.5 cents for every dollar earned by a man.
What is Family Income Deficit in Hancock County?
Family Income Deficit in Hancock County is $10,396.
Families that are below poverty line in Hancock County earn $10,396 less on average than the poverty threshold level.
What is Inequality or Gini Index in Hancock County?
Inequality or Gini Index in Hancock County is 0.45.
How Large is the Labor Force in Hancock County?
There are 29,274 People in the Labor Forcein in Hancock County.
What is the Percentage of People in the Labor Force in Hancock County?
61.2% of People are in the Labor Force in Hancock County.
What is the Unemployment Rate in Hancock County?
Unemployment Rate in Hancock County is 3.9%.