Franklin County, ME
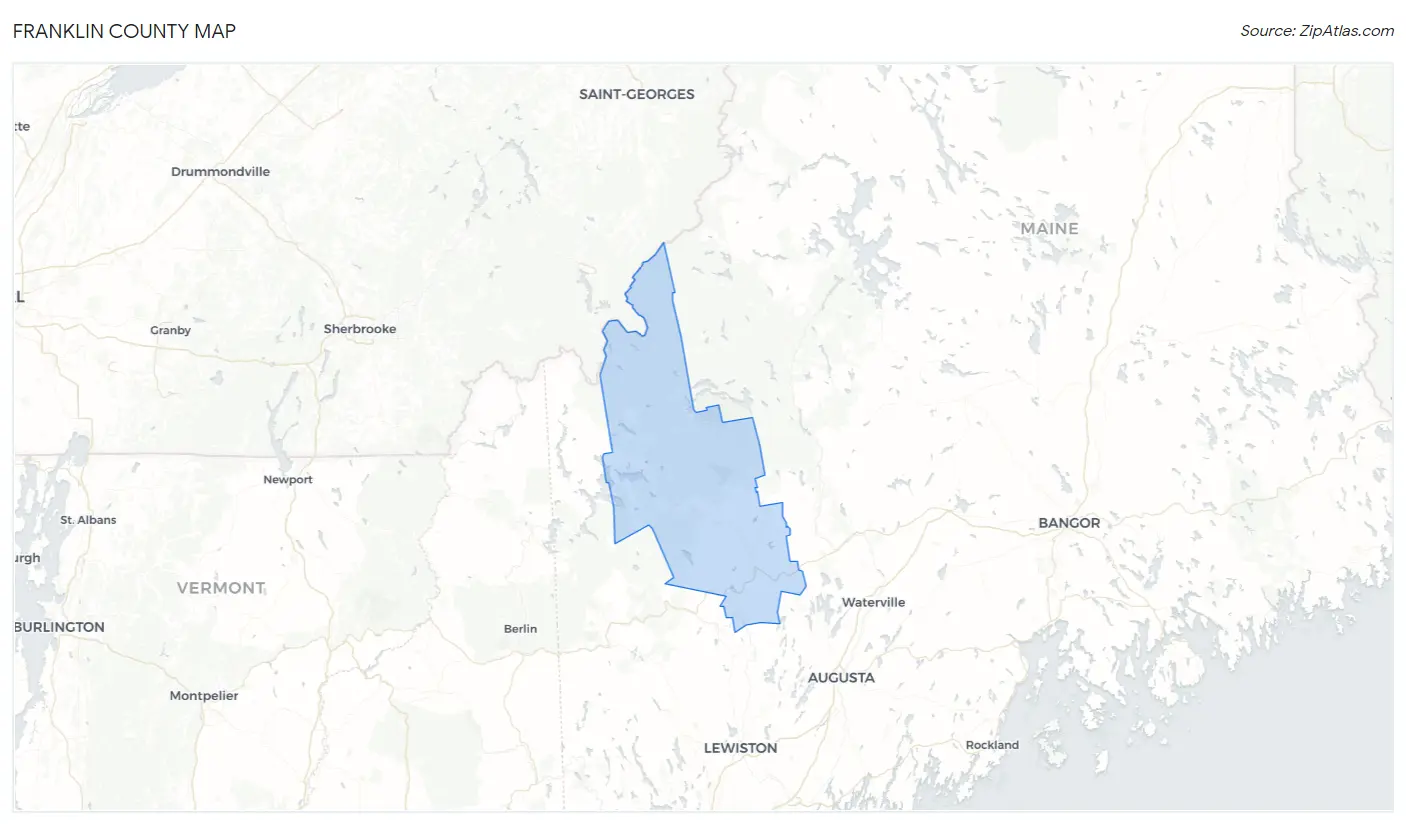
Franklin County Map
Franklin County Overview
29,839
TOTAL POPULATION
14,662
MALE POPULATION
15,177
FEMALE POPULATION
96.61
MALES / 100 FEMALES
103.51
FEMALES / 100 MALES
46.3
MEDIAN AGE
3.0
AVG FAMILY SIZE
2.3
AVG HOUSEHOLD SIZE
$33,161
PER CAPITA INCOME
$75,776
AVG FAMILY INCOME
$56,890
AVG HOUSEHOLD INCOME
36.5%
WAGE / INCOME GAP [ % ]
63.5¢/ $1
WAGE / INCOME GAP [ $ ]
$9,659
FAMILY INCOME DEFICIT
0.45
INEQUALITY / GINI INDEX
14,653
LABOR FORCE [ PEOPLE ]
57.8%
PERCENT IN LABOR FORCE
4.4%
UNEMPLOYMENT RATE
Franklin County Area Codes
Race in Franklin County
The most populous races in Franklin County are White / Caucasian (28,413 | 95.2%), Two or more Races (989 | 3.3%), and Hispanic or Latino (462 | 1.5%).

| Race | # Population | % Population |
| Asian | 155 | 0.5% |
| Black / African American | 120 | 0.4% |
| Hawaiian / Pacific | 3 | 0.0% |
| Hispanic or Latino | 462 | 1.5% |
| Native / Alaskan | 38 | 0.1% |
| White / Caucasian | 28,413 | 95.2% |
| Two or more Races | 989 | 3.3% |
| Some other Race | 121 | 0.4% |
| Total | 29,839 | 100.0% |
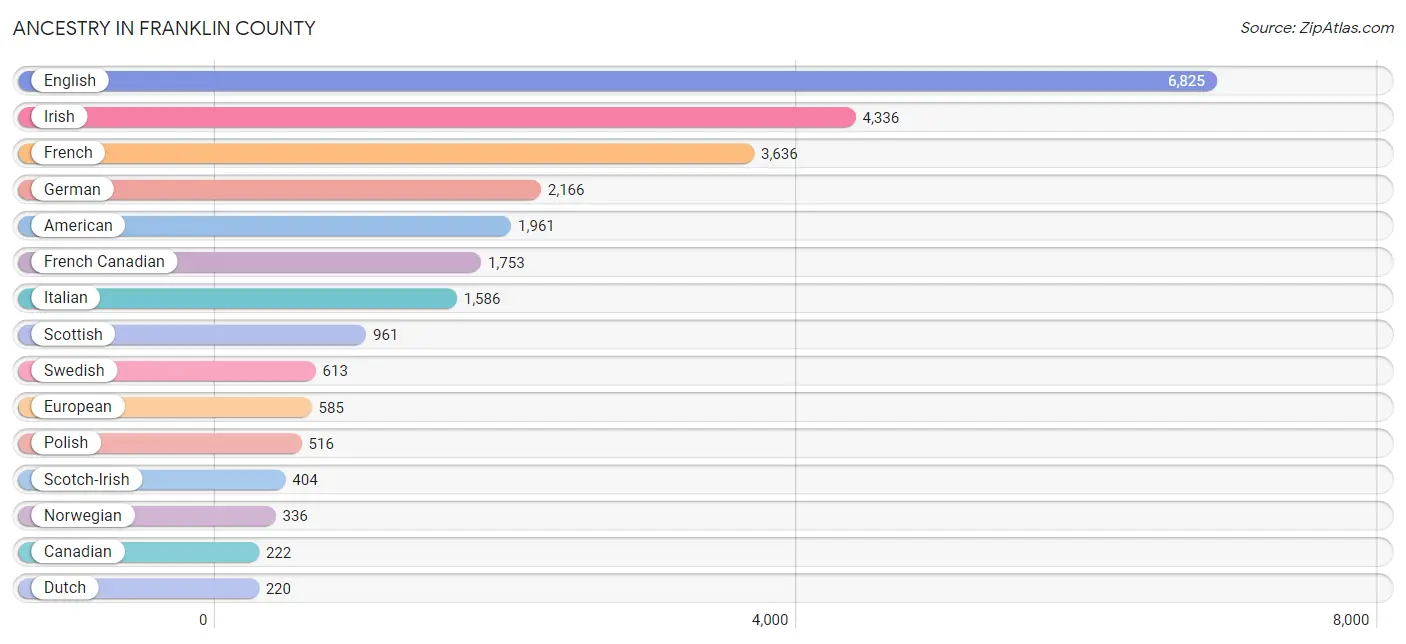
Ancestry in Franklin County
The most populous ancestries reported in Franklin County are English (6,825 | 22.9%), Irish (4,336 | 14.5%), French (3,636 | 12.2%), German (2,166 | 7.3%), and American (1,961 | 6.6%), together accounting for 63.4% of all Franklin County residents.
| Ancestry | # Population | % Population |
| Afghan | 4 | 0.0% |
| African | 119 | 0.4% |
| Albanian | 8 | 0.0% |
| Aleut | 10 | 0.0% |
| American | 1,961 | 6.6% |
| Arab | 5 | 0.0% |
| Argentinean | 19 | 0.1% |
| Armenian | 5 | 0.0% |
| Australian | 13 | 0.0% |
| Austrian | 64 | 0.2% |
| Barbadian | 3 | 0.0% |
| Basque | 14 | 0.1% |
| Bhutanese | 11 | 0.0% |
| Blackfeet | 39 | 0.1% |
| Brazilian | 4 | 0.0% |
| British | 210 | 0.7% |
| Bulgarian | 11 | 0.0% |
| Burmese | 39 | 0.1% |
| Cajun | 57 | 0.2% |
| Canadian | 222 | 0.7% |
| Central American | 54 | 0.2% |
| Central American Indian | 6 | 0.0% |
| Cherokee | 12 | 0.0% |
| Chilean | 3 | 0.0% |
| Chippewa | 5 | 0.0% |
| Choctaw | 1 | 0.0% |
| Colombian | 13 | 0.0% |
| Costa Rican | 43 | 0.1% |
| Cuban | 4 | 0.0% |
| Czech | 43 | 0.1% |
| Czechoslovakian | 10 | 0.0% |
| Danish | 40 | 0.1% |
| Delaware | 2 | 0.0% |
| Dutch | 220 | 0.7% |
| Eastern European | 33 | 0.1% |
| Ecuadorian | 23 | 0.1% |
| English | 6,825 | 22.9% |
| European | 585 | 2.0% |
| Filipino | 7 | 0.0% |
| Finnish | 178 | 0.6% |
| French | 3,636 | 12.2% |
| French American Indian | 18 | 0.1% |
| French Canadian | 1,753 | 5.9% |
| German | 2,166 | 7.3% |
| Greek | 101 | 0.3% |
| Honduran | 8 | 0.0% |
| Hungarian | 43 | 0.1% |
| Icelander | 4 | 0.0% |
| Indian (Asian) | 41 | 0.1% |
| Inupiat | 10 | 0.0% |
| Iraqi | 2 | 0.0% |
| Irish | 4,336 | 14.5% |
| Italian | 1,586 | 5.3% |
| Jamaican | 6 | 0.0% |
| Korean | 77 | 0.3% |
| Lebanese | 2 | 0.0% |
| Lithuanian | 21 | 0.1% |
| Mexican | 141 | 0.5% |
| Native Hawaiian | 3 | 0.0% |
| Northern European | 12 | 0.0% |
| Norwegian | 336 | 1.1% |
| Pakistani | 20 | 0.1% |
| Panamanian | 3 | 0.0% |
| Polish | 516 | 1.7% |
| Portuguese | 110 | 0.4% |
| Puerto Rican | 142 | 0.5% |
| Russian | 75 | 0.3% |
| Scandinavian | 43 | 0.1% |
| Scotch-Irish | 404 | 1.3% |
| Scottish | 961 | 3.2% |
| Senegalese | 4 | 0.0% |
| Slavic | 28 | 0.1% |
| Slovak | 17 | 0.1% |
| Slovene | 30 | 0.1% |
| South American | 58 | 0.2% |
| Spaniard | 44 | 0.2% |
| Spanish | 4 | 0.0% |
| Sri Lankan | 50 | 0.2% |
| Subsaharan African | 136 | 0.5% |
| Swedish | 613 | 2.1% |
| Swiss | 9 | 0.0% |
| Syrian | 1 | 0.0% |
| Thai | 5 | 0.0% |
| Ukrainian | 111 | 0.4% |
| Welsh | 145 | 0.5% |
| Yup'ik | 11 | 0.0% | View All 86 Rows |
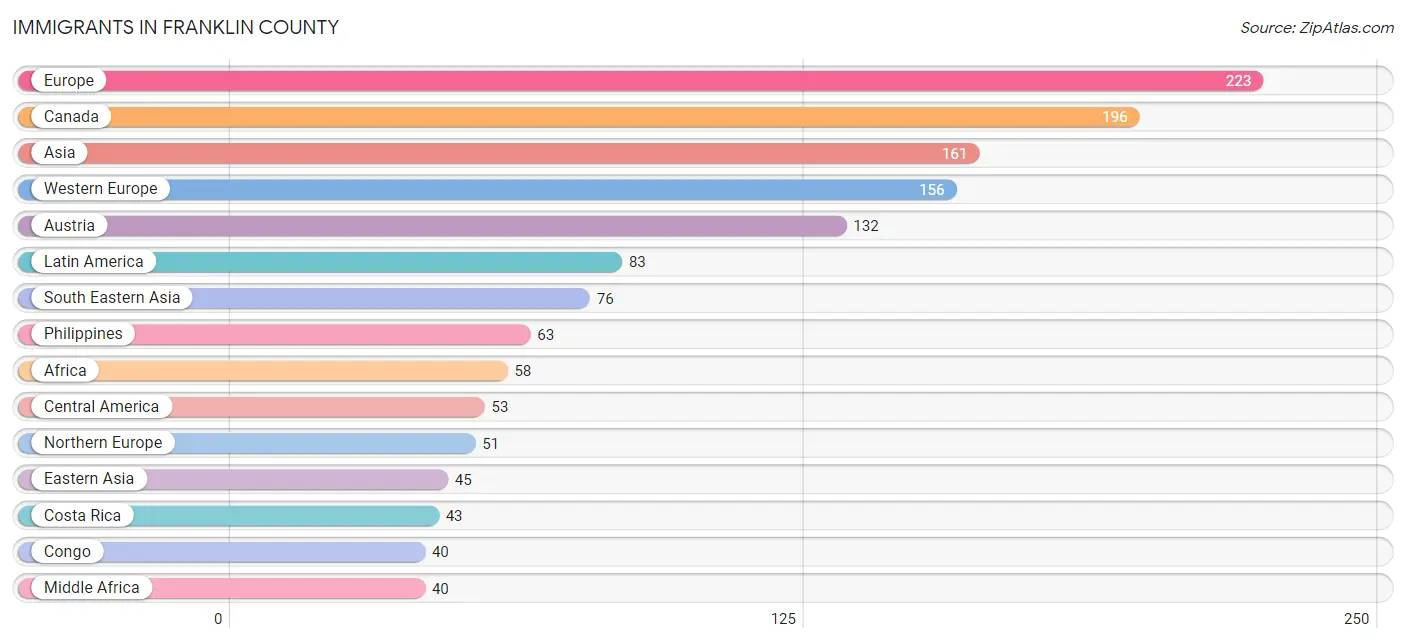
Immigrants in Franklin County
The most numerous immigrant groups reported in Franklin County came from Europe (223 | 0.7%), Canada (196 | 0.7%), Asia (161 | 0.5%), Western Europe (156 | 0.5%), and Austria (132 | 0.4%), together accounting for 2.9% of all Franklin County residents.
| Immigration Origin | # Population | % Population |
| Africa | 58 | 0.2% |
| Albania | 8 | 0.0% |
| Argentina | 11 | 0.0% |
| Asia | 161 | 0.5% |
| Australia | 2 | 0.0% |
| Austria | 132 | 0.4% |
| Brazil | 10 | 0.0% |
| Bulgaria | 6 | 0.0% |
| Canada | 196 | 0.7% |
| Caribbean | 6 | 0.0% |
| Central America | 53 | 0.2% |
| Chile | 3 | 0.0% |
| China | 37 | 0.1% |
| Congo | 40 | 0.1% |
| Costa Rica | 43 | 0.1% |
| Eastern Africa | 11 | 0.0% |
| Eastern Asia | 45 | 0.2% |
| Eastern Europe | 16 | 0.1% |
| England | 10 | 0.0% |
| Europe | 223 | 0.7% |
| France | 9 | 0.0% |
| Germany | 15 | 0.1% |
| Ireland | 20 | 0.1% |
| Jamaica | 6 | 0.0% |
| Jordan | 2 | 0.0% |
| Kazakhstan | 2 | 0.0% |
| Korea | 8 | 0.0% |
| Latin America | 83 | 0.3% |
| Mexico | 10 | 0.0% |
| Middle Africa | 40 | 0.1% |
| Northern Africa | 3 | 0.0% |
| Northern Europe | 51 | 0.2% |
| Oceania | 2 | 0.0% |
| Philippines | 63 | 0.2% |
| Poland | 2 | 0.0% |
| Somalia | 7 | 0.0% |
| South Africa | 4 | 0.0% |
| South America | 24 | 0.1% |
| South Central Asia | 2 | 0.0% |
| South Eastern Asia | 76 | 0.3% |
| Sudan | 3 | 0.0% |
| Thailand | 13 | 0.0% |
| Turkey | 36 | 0.1% |
| Western Asia | 38 | 0.1% |
| Western Europe | 156 | 0.5% | View All 45 Rows |
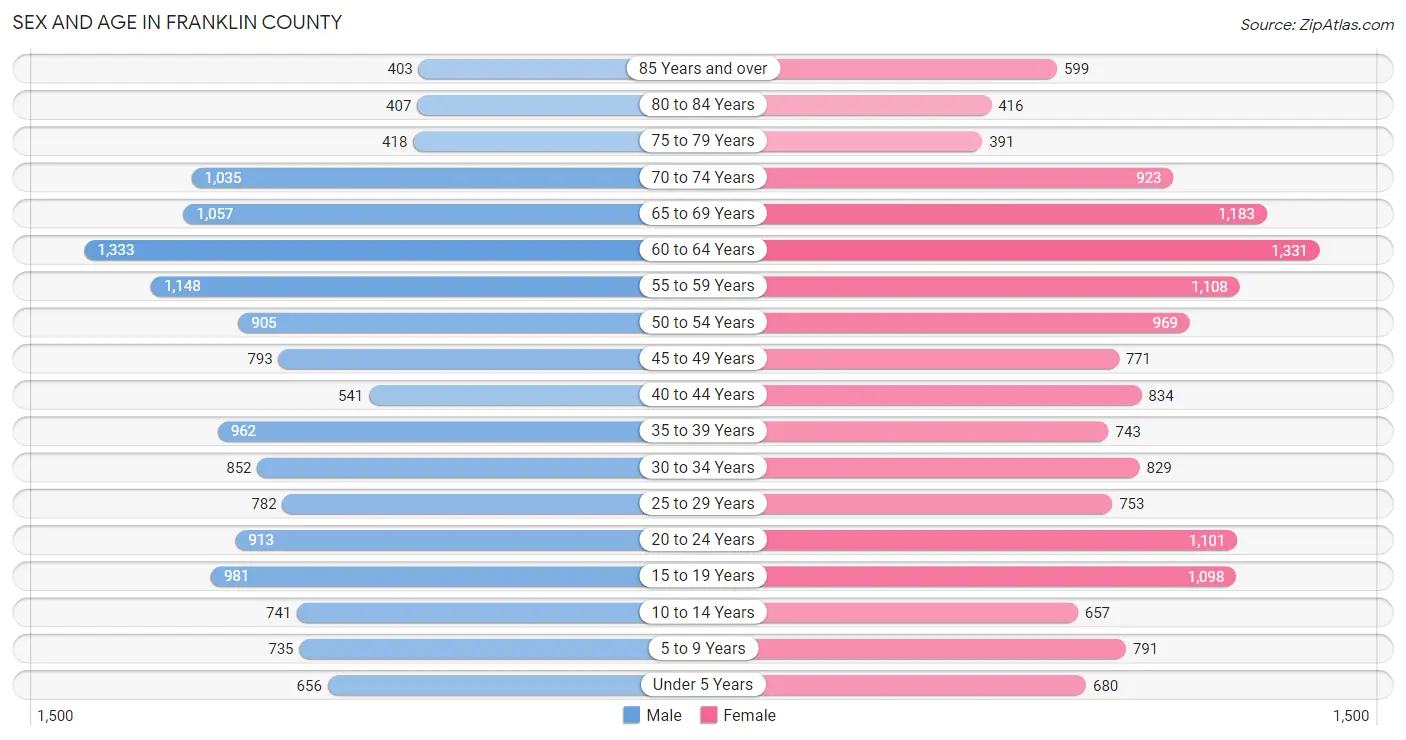
Sex and Age in Franklin County
Sex and Age in Franklin County
The most populous age groups in Franklin County are 60 to 64 Years (1,333 | 9.1%) for men and 60 to 64 Years (1,331 | 8.8%) for women.
| Age Bracket | Male | Female |
| Under 5 Years | 656 (4.5%) | 680 (4.5%) |
| 5 to 9 Years | 735 (5.0%) | 791 (5.2%) |
| 10 to 14 Years | 741 (5.1%) | 657 (4.3%) |
| 15 to 19 Years | 981 (6.7%) | 1,098 (7.2%) |
| 20 to 24 Years | 913 (6.2%) | 1,101 (7.2%) |
| 25 to 29 Years | 782 (5.3%) | 753 (5.0%) |
| 30 to 34 Years | 852 (5.8%) | 829 (5.5%) |
| 35 to 39 Years | 962 (6.6%) | 743 (4.9%) |
| 40 to 44 Years | 541 (3.7%) | 834 (5.5%) |
| 45 to 49 Years | 793 (5.4%) | 771 (5.1%) |
| 50 to 54 Years | 905 (6.2%) | 969 (6.4%) |
| 55 to 59 Years | 1,148 (7.8%) | 1,108 (7.3%) |
| 60 to 64 Years | 1,333 (9.1%) | 1,331 (8.8%) |
| 65 to 69 Years | 1,057 (7.2%) | 1,183 (7.8%) |
| 70 to 74 Years | 1,035 (7.1%) | 923 (6.1%) |
| 75 to 79 Years | 418 (2.9%) | 391 (2.6%) |
| 80 to 84 Years | 407 (2.8%) | 416 (2.7%) |
| 85 Years and over | 403 (2.8%) | 599 (4.0%) |
| Total | 14,662 (100.0%) | 15,177 (100.0%) |
Families and Households in Franklin County
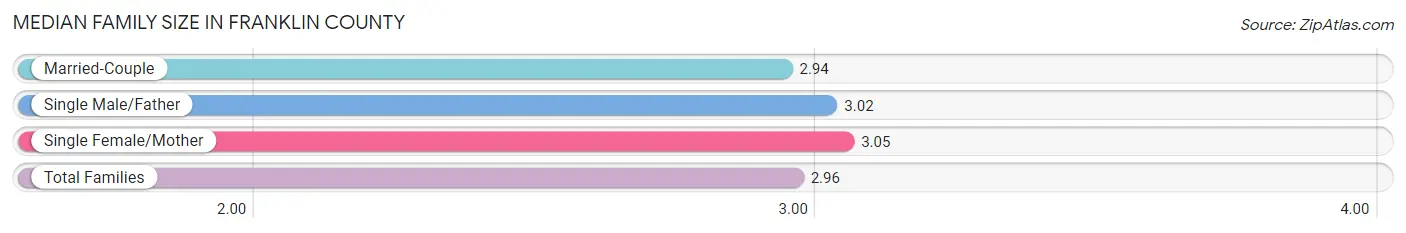
Median Family Size in Franklin County
The median family size in Franklin County is 2.96 persons per family, with single female/mother families (954 | 13.2%) accounting for the largest median family size of 3.05 persons per family. On the other hand, married-couple families (5,765 | 79.8%) represent the smallest median family size with 2.94 persons per family.
| Family Type | # Families | Family Size |
| Married-Couple | 5,765 (79.8%) | 2.94 |
| Single Male/Father | 509 (7.0%) | 3.02 |
| Single Female/Mother | 954 (13.2%) | 3.05 |
| Total Families | 7,228 (100.0%) | 2.96 |
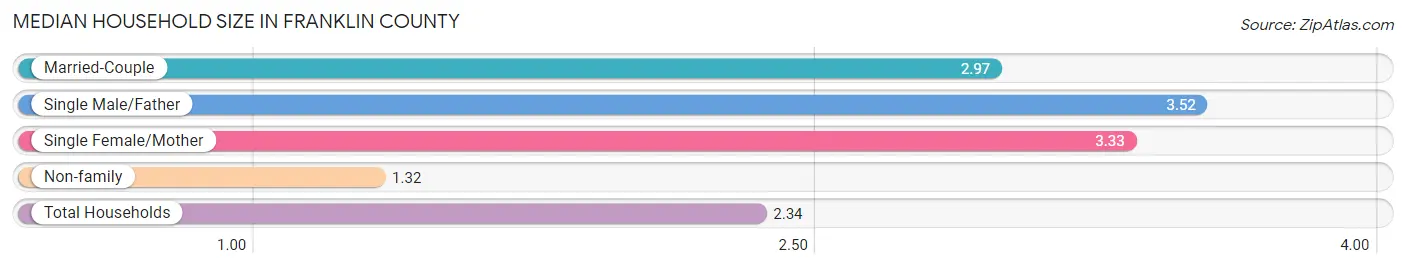
Median Household Size in Franklin County
The median household size in Franklin County is 2.34 persons per household, with single male/father households (509 | 4.2%) accounting for the largest median household size of 3.52 persons per household. non-family households (5,048 | 41.1%) represent the smallest median household size with 1.32 persons per household.
| Household Type | # Households | Household Size |
| Married-Couple | 5,765 (47.0%) | 2.97 |
| Single Male/Father | 509 (4.2%) | 3.52 |
| Single Female/Mother | 954 (7.8%) | 3.33 |
| Non-family | 5,048 (41.1%) | 1.32 |
| Total Households | 12,276 (100.0%) | 2.34 |
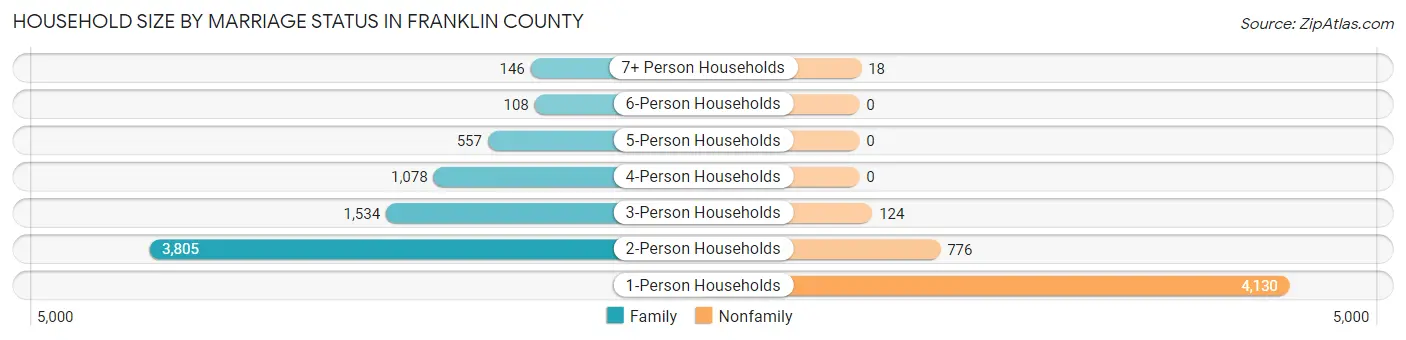
Household Size by Marriage Status in Franklin County
Out of a total of 12,276 households in Franklin County, 7,228 (58.9%) are family households, while 5,048 (41.1%) are nonfamily households. The most numerous type of family households are 2-person households, comprising 3,805, and the most common type of nonfamily households are 1-person households, comprising 4,130.
| Household Size | Family Households | Nonfamily Households |
| 1-Person Households | - | 4,130 (33.6%) |
| 2-Person Households | 3,805 (31.0%) | 776 (6.3%) |
| 3-Person Households | 1,534 (12.5%) | 124 (1.0%) |
| 4-Person Households | 1,078 (8.8%) | 0 (0.0%) |
| 5-Person Households | 557 (4.5%) | 0 (0.0%) |
| 6-Person Households | 108 (0.9%) | 0 (0.0%) |
| 7+ Person Households | 146 (1.2%) | 18 (0.2%) |
| Total | 7,228 (58.9%) | 5,048 (41.1%) |
Female Fertility in Franklin County
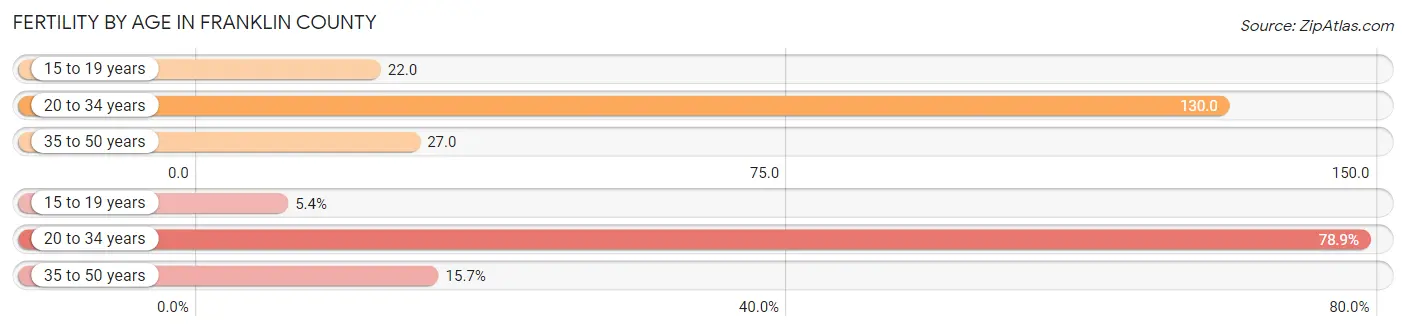
Fertility by Age in Franklin County
Average fertility rate in Franklin County is 70.0 births per 1,000 women. Women in the age bracket of 20 to 34 years have the highest fertility rate with 130.0 births per 1,000 women. Women in the age bracket of 20 to 34 years acount for 78.9% of all women with births.
| Age Bracket | Women with Births | Births / 1,000 Women |
| 15 to 19 years | 24 (5.4%) | 22.0 |
| 20 to 34 years | 348 (78.9%) | 130.0 |
| 35 to 50 years | 69 (15.7%) | 27.0 |
| Total | 441 (100.0%) | 70.0 |
Fertility by Age by Marriage Status in Franklin County
68.9% of women with births (441) in Franklin County are married. The highest percentage of unmarried women with births falls into 15 to 19 years age bracket with 100.0% of them unmarried at the time of birth, while the lowest percentage of unmarried women with births belong to 35 to 50 years age bracket with 14.5% of them unmarried.
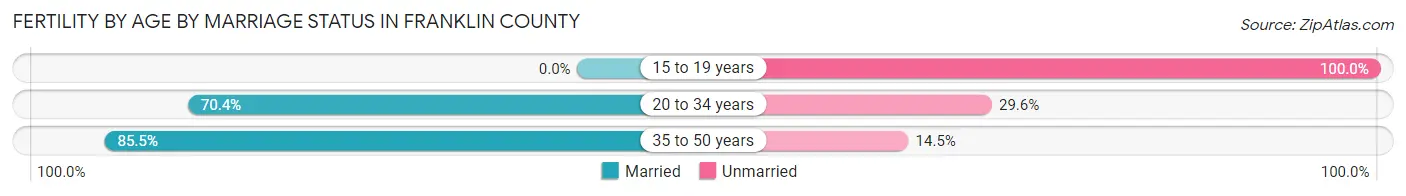
| Age Bracket | Married | Unmarried |
| 15 to 19 years | 0 (0.0%) | 24 (100.0%) |
| 20 to 34 years | 245 (70.4%) | 103 (29.6%) |
| 35 to 50 years | 59 (85.5%) | 10 (14.5%) |
| Total | 304 (68.9%) | 137 (31.1%) |
Fertility by Education in Franklin County
Average fertility rate in Franklin County is 70.0 births per 1,000 women. Women with the education attainment of graduate degree have the highest fertility rate of 138.0 births per 1,000 women, while women with the education attainment of less than high school have the lowest fertility at 34.0 births per 1,000 women. Women with the education attainment of high school diploma represent 29.7% of all women with births.
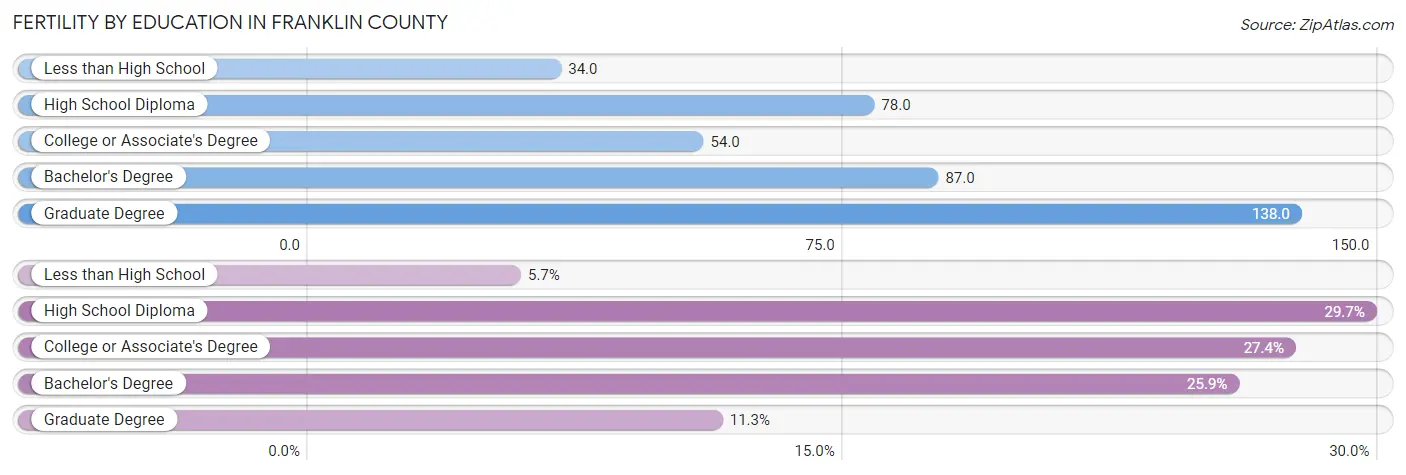
| Educational Attainment | Women with Births | Births / 1,000 Women |
| Less than High School | 25 (5.7%) | 34.0 |
| High School Diploma | 131 (29.7%) | 78.0 |
| College or Associate's Degree | 121 (27.4%) | 54.0 |
| Bachelor's Degree | 114 (25.9%) | 87.0 |
| Graduate Degree | 50 (11.3%) | 138.0 |
| Total | 441 (100.0%) | 70.0 |
Fertility by Education by Marriage Status in Franklin County
31.1% of women with births in Franklin County are unmarried. Women with the educational attainment of bachelor's degree are most likely to be married with 100.0% of them married at childbirth, while women with the educational attainment of less than high school are least likely to be married with 96.0% of them unmarried at childbirth.
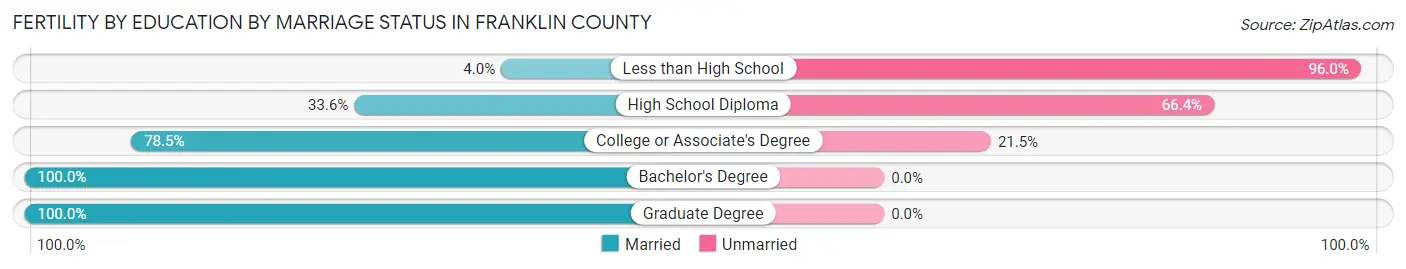
| Educational Attainment | Married | Unmarried |
| Less than High School | 1 (4.0%) | 24 (96.0%) |
| High School Diploma | 44 (33.6%) | 87 (66.4%) |
| College or Associate's Degree | 95 (78.5%) | 26 (21.5%) |
| Bachelor's Degree | 114 (100.0%) | 0 (0.0%) |
| Graduate Degree | 50 (100.0%) | 0 (0.0%) |
| Total | 304 (68.9%) | 137 (31.1%) |
Income in Franklin County
Income Overview in Franklin County
Per Capita Income in Franklin County is $33,161, while median incomes of families and households are $75,776 and $56,890 respectively.
| Characteristic | Number | Measure |
| Per Capita Income | 29,839 | $33,161 |
| Median Family Income | 7,228 | $75,776 |
| Mean Family Income | 7,228 | $96,718 |
| Median Household Income | 12,276 | $56,890 |
| Mean Household Income | 12,276 | $77,513 |
| Income Deficit | 7,228 | $9,659 |
| Wage / Income Gap (%) | 29,839 | 36.53% |
| Wage / Income Gap ($) | 29,839 | 63.47¢ per $1 |
| Gini / Inequality Index | 29,839 | 0.45 |
Earnings by Sex in Franklin County
Average Earnings in Franklin County are $32,249, $39,295 for men and $24,942 for women, a difference of 36.5%.
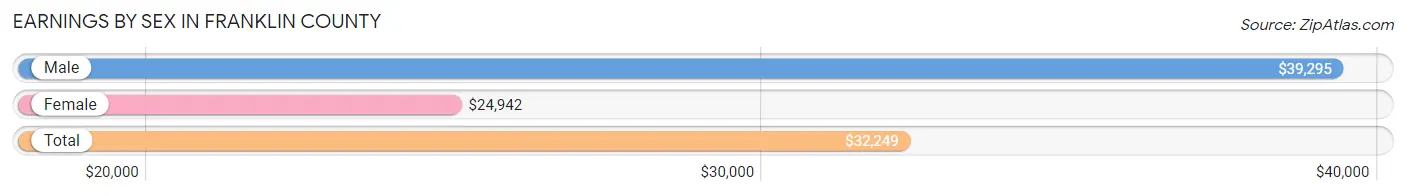
| Sex | Number | Average Earnings |
| Male | 8,286 (51.6%) | $39,295 |
| Female | 7,775 (48.4%) | $24,942 |
| Total | 16,061 (100.0%) | $32,249 |
Earnings by Sex by Income Bracket in Franklin County
The most common earnings brackets in Franklin County are $75,000 to $99,999 for men (762 | 9.2%) and $2,499 or less for women (759 | 9.8%).
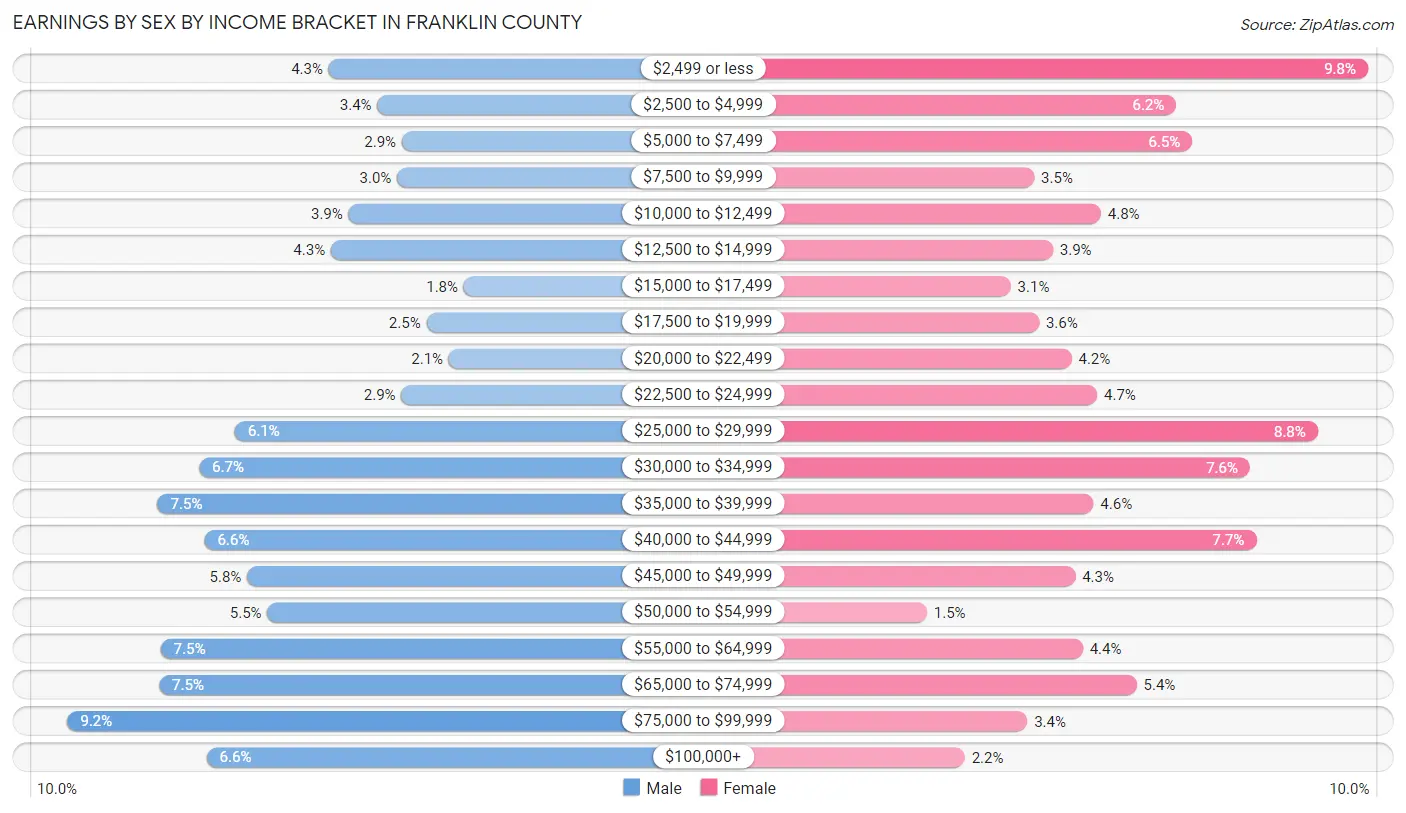
| Income | Male | Female |
| $2,499 or less | 356 (4.3%) | 759 (9.8%) |
| $2,500 to $4,999 | 281 (3.4%) | 480 (6.2%) |
| $5,000 to $7,499 | 243 (2.9%) | 503 (6.5%) |
| $7,500 to $9,999 | 250 (3.0%) | 273 (3.5%) |
| $10,000 to $12,499 | 326 (3.9%) | 370 (4.8%) |
| $12,500 to $14,999 | 353 (4.3%) | 300 (3.9%) |
| $15,000 to $17,499 | 147 (1.8%) | 239 (3.1%) |
| $17,500 to $19,999 | 205 (2.5%) | 280 (3.6%) |
| $20,000 to $22,499 | 170 (2.1%) | 327 (4.2%) |
| $22,500 to $24,999 | 244 (2.9%) | 365 (4.7%) |
| $25,000 to $29,999 | 502 (6.1%) | 686 (8.8%) |
| $30,000 to $34,999 | 558 (6.7%) | 587 (7.5%) |
| $35,000 to $39,999 | 622 (7.5%) | 359 (4.6%) |
| $40,000 to $44,999 | 549 (6.6%) | 596 (7.7%) |
| $45,000 to $49,999 | 483 (5.8%) | 333 (4.3%) |
| $50,000 to $54,999 | 452 (5.4%) | 117 (1.5%) |
| $55,000 to $64,999 | 617 (7.4%) | 344 (4.4%) |
| $65,000 to $74,999 | 620 (7.5%) | 422 (5.4%) |
| $75,000 to $99,999 | 762 (9.2%) | 263 (3.4%) |
| $100,000+ | 546 (6.6%) | 172 (2.2%) |
| Total | 8,286 (100.0%) | 7,775 (100.0%) |
Earnings by Sex by Educational Attainment in Franklin County
Average earnings in Franklin County are $44,726 for men and $30,435 for women, a difference of 32.0%. Men with an educational attainment of graduate degree enjoy the highest average annual earnings of $69,658, while those with less than high school education earn the least with $40,489. Women with an educational attainment of graduate degree earn the most with the average annual earnings of $58,333, while those with less than high school education have the smallest earnings of $20,313.
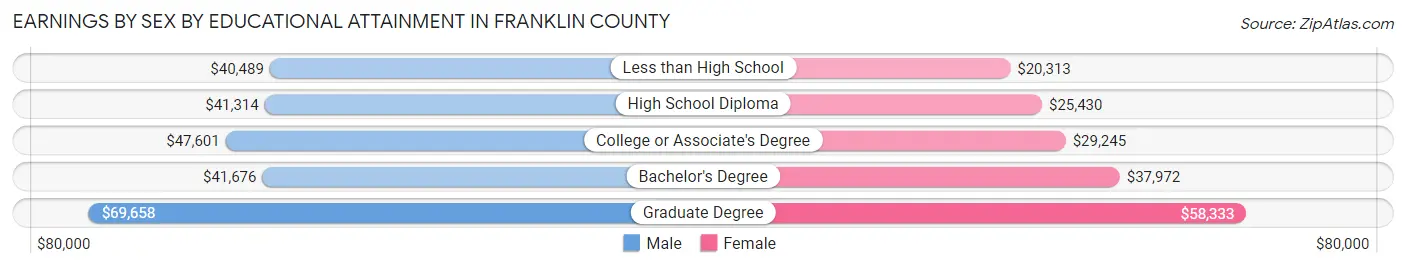
| Educational Attainment | Male Income | Female Income |
| Less than High School | $40,489 | $20,313 |
| High School Diploma | $41,314 | $25,430 |
| College or Associate's Degree | $47,601 | $29,245 |
| Bachelor's Degree | $41,676 | $37,972 |
| Graduate Degree | $69,658 | $58,333 |
| Total | $44,726 | $30,435 |
Family Income in Franklin County
Family Income Brackets in Franklin County
According to the Franklin County family income data, there are 1,670 families falling into the $50,000 to $74,999 income range, which is the most common income bracket and makes up 23.1% of all families. Conversely, the less than $10,000 income bracket is the least frequent group with only 94 families (1.3%) belonging to this category.
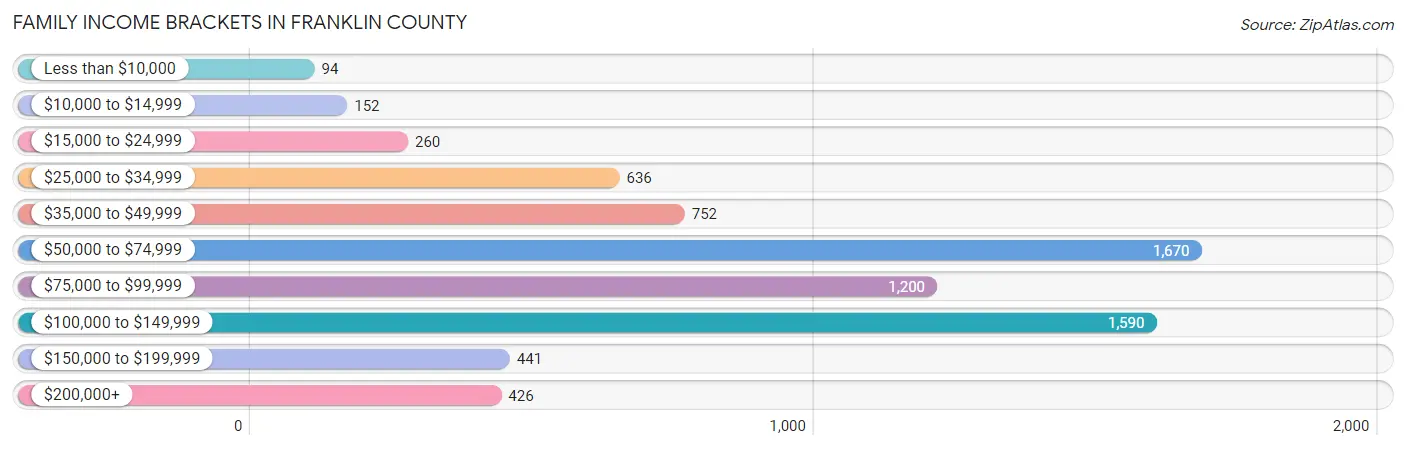
| Income Bracket | # Families | % Families |
| Less than $10,000 | 94 | 1.3% |
| $10,000 to $14,999 | 152 | 2.1% |
| $15,000 to $24,999 | 260 | 3.6% |
| $25,000 to $34,999 | 636 | 8.8% |
| $35,000 to $49,999 | 752 | 10.4% |
| $50,000 to $74,999 | 1,670 | 23.1% |
| $75,000 to $99,999 | 1,200 | 16.6% |
| $100,000 to $149,999 | 1,590 | 22.0% |
| $150,000 to $199,999 | 441 | 6.1% |
| $200,000+ | 426 | 5.9% |
Family Income by Famaliy Size in Franklin County
6-person families (131 | 1.8%) account for the highest median family income in Franklin County with $135,817 per family, while 2-person families (4,054 | 56.1%) have the highest median income of $34,272 per family member.
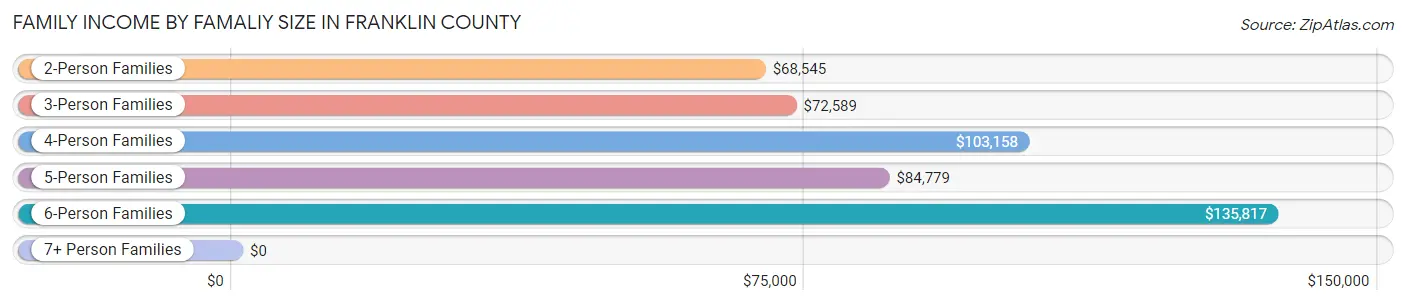
| Income Bracket | # Families | Median Income |
| 2-Person Families | 4,054 (56.1%) | $68,545 |
| 3-Person Families | 1,477 (20.4%) | $72,589 |
| 4-Person Families | 944 (13.1%) | $103,158 |
| 5-Person Families | 527 (7.3%) | $84,779 |
| 6-Person Families | 131 (1.8%) | $135,817 |
| 7+ Person Families | 95 (1.3%) | $0 |
| Total | 7,228 (100.0%) | $75,776 |
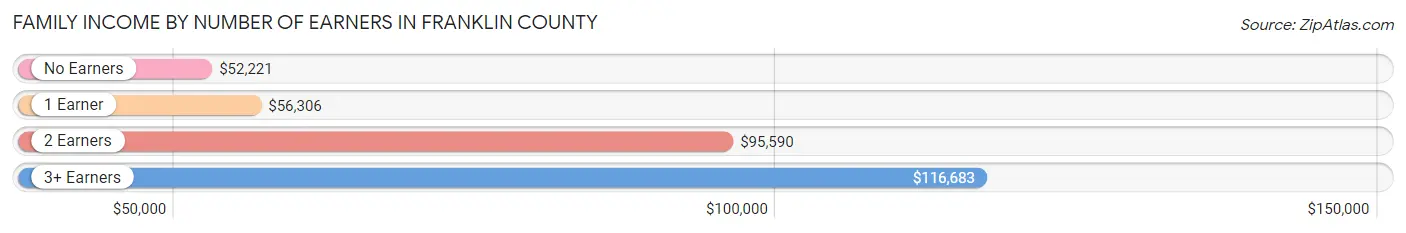
Family Income by Number of Earners in Franklin County
The median family income in Franklin County is $75,776, with families comprising 3+ earners (747) having the highest median family income of $116,683, while families with no earners (1,275) have the lowest median family income of $52,221, accounting for 10.3% and 17.6% of families, respectively.
| Number of Earners | # Families | Median Income |
| No Earners | 1,275 (17.6%) | $52,221 |
| 1 Earner | 2,435 (33.7%) | $56,306 |
| 2 Earners | 2,771 (38.3%) | $95,590 |
| 3+ Earners | 747 (10.3%) | $116,683 |
| Total | 7,228 (100.0%) | $75,776 |
Household Income in Franklin County
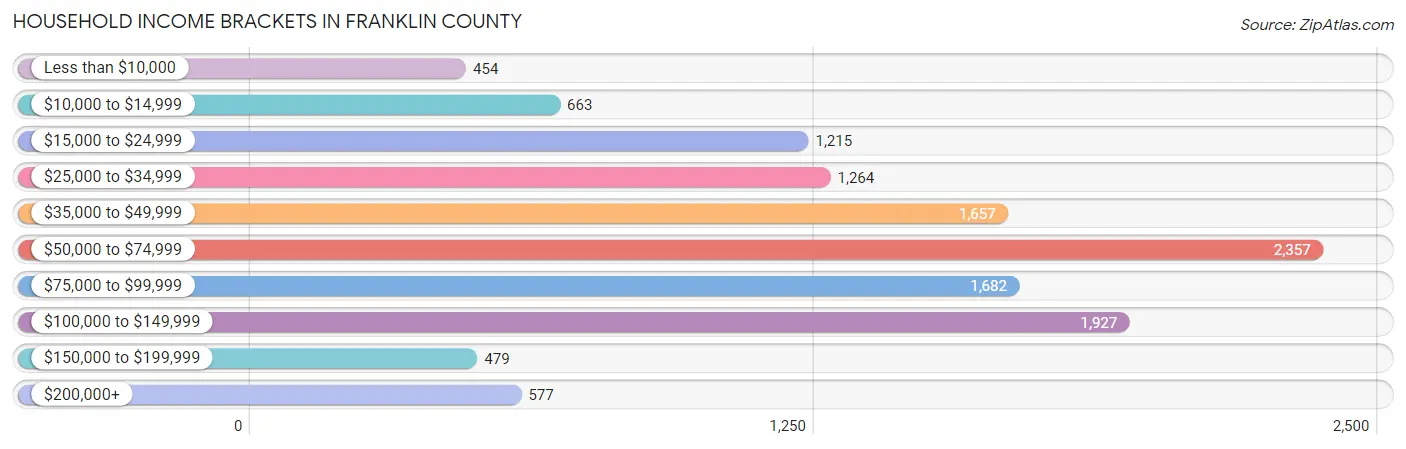
Household Income Brackets in Franklin County
With 2,357 households falling in the category, the $50,000 to $74,999 income range is the most frequent in Franklin County, accounting for 19.2% of all households. In contrast, only 454 households (3.7%) fall into the less than $10,000 income bracket, making it the least populous group.
| Income Bracket | # Households | % Households |
| Less than $10,000 | 454 | 3.7% |
| $10,000 to $14,999 | 663 | 5.4% |
| $15,000 to $24,999 | 1,215 | 9.9% |
| $25,000 to $34,999 | 1,264 | 10.3% |
| $35,000 to $49,999 | 1,657 | 13.5% |
| $50,000 to $74,999 | 2,357 | 19.2% |
| $75,000 to $99,999 | 1,682 | 13.7% |
| $100,000 to $149,999 | 1,927 | 15.7% |
| $150,000 to $199,999 | 479 | 3.9% |
| $200,000+ | 577 | 4.7% |
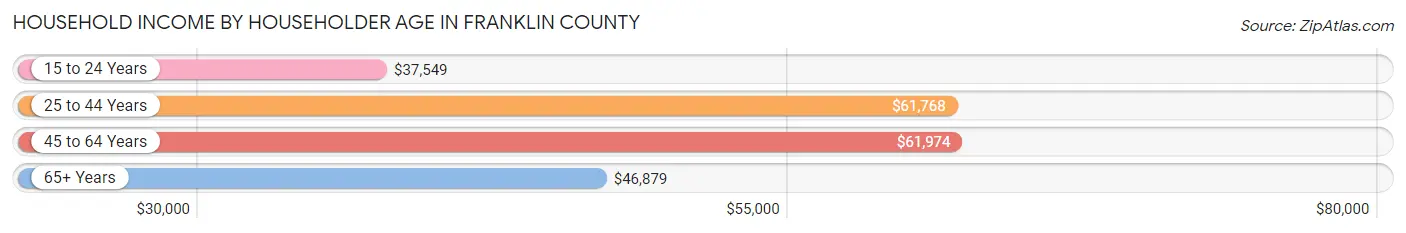
Household Income by Householder Age in Franklin County
The median household income in Franklin County is $56,890, with the highest median household income of $61,974 found in the 45 to 64 years age bracket for the primary householder. A total of 4,712 households (38.4%) fall into this category. Meanwhile, the 15 to 24 years age bracket for the primary householder has the lowest median household income of $37,549, with 498 households (4.1%) in this group.
| Income Bracket | # Households | Median Income |
| 15 to 24 Years | 498 (4.1%) | $37,549 |
| 25 to 44 Years | 3,060 (24.9%) | $61,768 |
| 45 to 64 Years | 4,712 (38.4%) | $61,974 |
| 65+ Years | 4,006 (32.6%) | $46,879 |
| Total | 12,276 (100.0%) | $56,890 |
Poverty in Franklin County
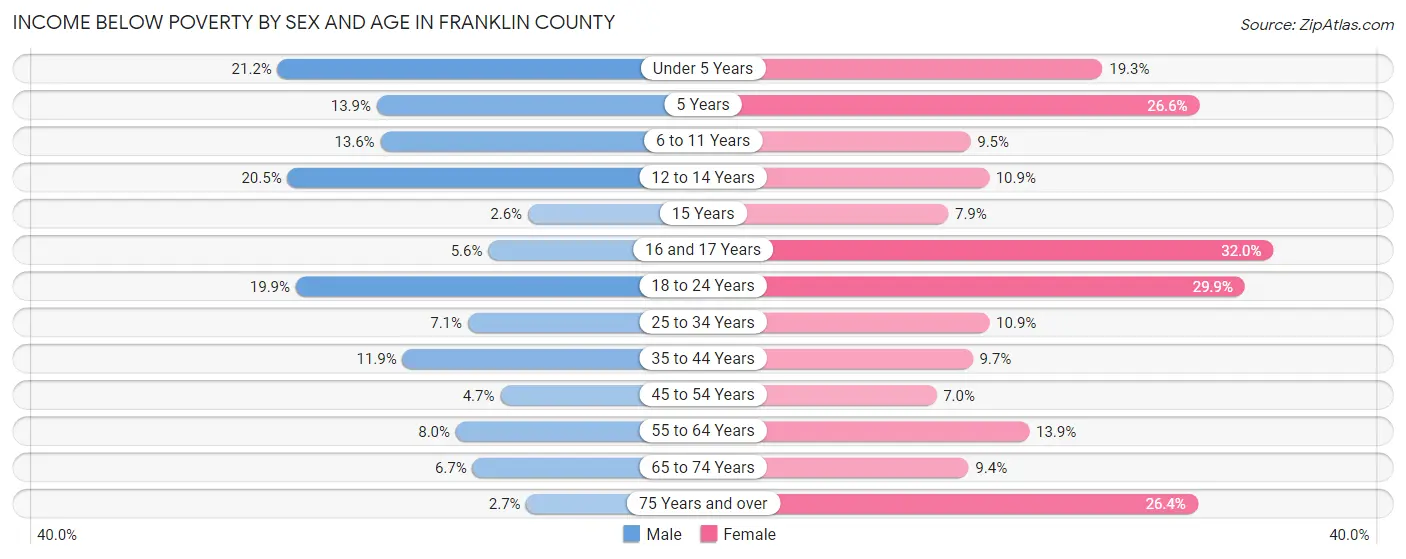
Income Below Poverty by Sex and Age in Franklin County
With 9.5% poverty level for males and 14.6% for females among the residents of Franklin County, under 5 year old males and 16 and 17 year old females are the most vulnerable to poverty, with 137 males (21.2%) and 124 females (32.0%) in their respective age groups living below the poverty level.
| Age Bracket | Male | Female |
| Under 5 Years | 137 (21.2%) | 129 (19.3%) |
| 5 Years | 9 (13.9%) | 60 (26.6%) |
| 6 to 11 Years | 112 (13.6%) | 83 (9.5%) |
| 12 to 14 Years | 110 (20.5%) | 36 (10.9%) |
| 15 Years | 4 (2.6%) | 6 (7.9%) |
| 16 and 17 Years | 18 (5.6%) | 124 (32.0%) |
| 18 to 24 Years | 220 (19.9%) | 353 (29.9%) |
| 25 to 34 Years | 115 (7.1%) | 173 (10.9%) |
| 35 to 44 Years | 177 (11.9%) | 153 (9.7%) |
| 45 to 54 Years | 79 (4.7%) | 122 (7.0%) |
| 55 to 64 Years | 198 (8.0%) | 339 (13.9%) |
| 65 to 74 Years | 141 (6.7%) | 198 (9.4%) |
| 75 Years and over | 32 (2.7%) | 349 (26.4%) |
| Total | 1,352 (9.5%) | 2,125 (14.6%) |
Income Above Poverty by Sex and Age in Franklin County
According to the poverty statistics in Franklin County, males aged 15 years and females aged 45 to 54 years are the age groups that are most secure financially, with 97.4% of males and 93.0% of females in these age groups living above the poverty line.
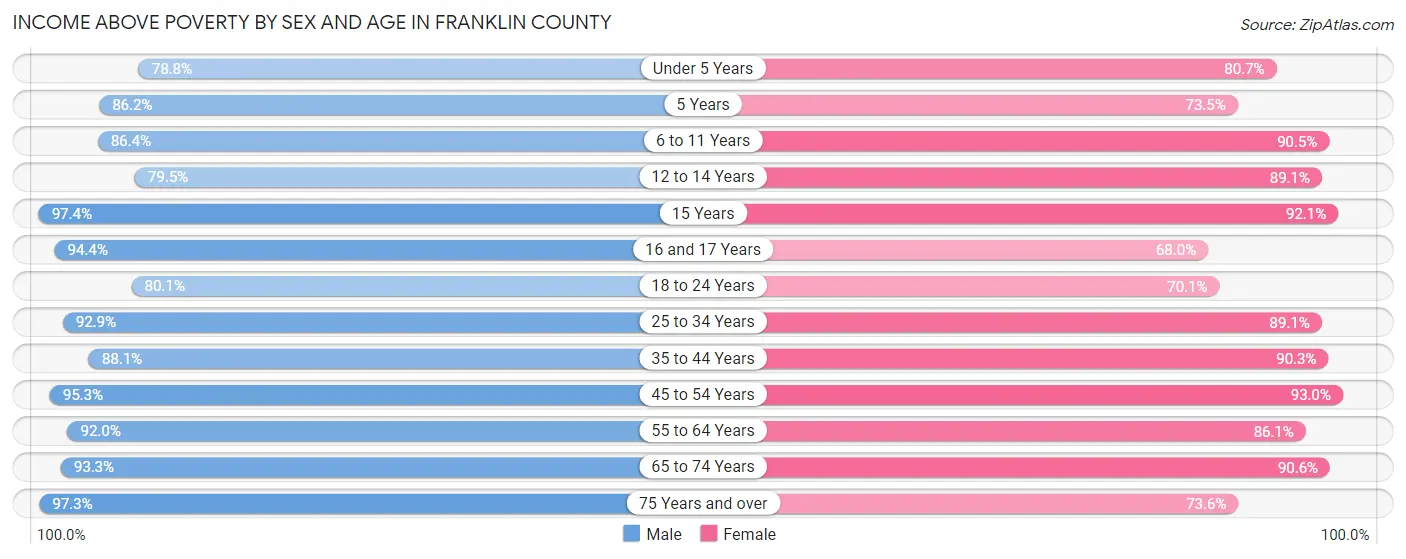
| Age Bracket | Male | Female |
| Under 5 Years | 509 (78.8%) | 538 (80.7%) |
| 5 Years | 56 (86.2%) | 166 (73.5%) |
| 6 to 11 Years | 713 (86.4%) | 787 (90.5%) |
| 12 to 14 Years | 427 (79.5%) | 294 (89.1%) |
| 15 Years | 148 (97.4%) | 70 (92.1%) |
| 16 and 17 Years | 305 (94.4%) | 263 (68.0%) |
| 18 to 24 Years | 888 (80.1%) | 827 (70.1%) |
| 25 to 34 Years | 1,506 (92.9%) | 1,409 (89.1%) |
| 35 to 44 Years | 1,306 (88.1%) | 1,424 (90.3%) |
| 45 to 54 Years | 1,610 (95.3%) | 1,618 (93.0%) |
| 55 to 64 Years | 2,283 (92.0%) | 2,100 (86.1%) |
| 65 to 74 Years | 1,951 (93.3%) | 1,908 (90.6%) |
| 75 Years and over | 1,137 (97.3%) | 972 (73.6%) |
| Total | 12,839 (90.5%) | 12,376 (85.4%) |
Income Below Poverty Among Married-Couple Families in Franklin County
The poverty statistics for married-couple families in Franklin County show that 2.9% or 166 of the total 5,765 families live below the poverty line. Families with 3 or 4 children have the highest poverty rate of 8.6%, comprising of 33 families. On the other hand, families with no children have the lowest poverty rate of 2.3%, which includes 91 families.
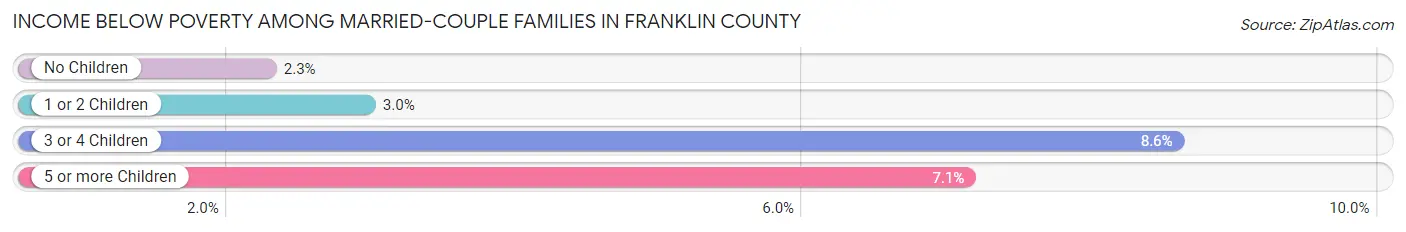
| Children | Above Poverty | Below Poverty |
| No Children | 3,911 (97.7%) | 91 (2.3%) |
| 1 or 2 Children | 1,311 (97.0%) | 40 (3.0%) |
| 3 or 4 Children | 351 (91.4%) | 33 (8.6%) |
| 5 or more Children | 26 (92.9%) | 2 (7.1%) |
| Total | 5,599 (97.1%) | 166 (2.9%) |
Income Below Poverty Among Single-Parent Households in Franklin County
According to the poverty data in Franklin County, 8.3% or 42 single-father households and 24.6% or 235 single-mother households are living below the poverty line. Among single-father households, those with 3 or 4 children have the highest poverty rate, with 22 households (61.1%) experiencing poverty. Likewise, among single-mother households, those with 5 or more children have the highest poverty rate, with 32 households (100.0%) falling below the poverty line.

| Children | Single Father | Single Mother |
| No Children | 0 (0.0%) | 9 (3.1%) |
| 1 or 2 Children | 20 (7.5%) | 186 (31.4%) |
| 3 or 4 Children | 22 (61.1%) | 8 (20.5%) |
| 5 or more Children | 0 (0.0%) | 32 (100.0%) |
| Total | 42 (8.3%) | 235 (24.6%) |
Income Below Poverty Among Married-Couple vs Single-Parent Households in Franklin County
The poverty data for Franklin County shows that 166 of the married-couple family households (2.9%) and 277 of the single-parent households (18.9%) are living below the poverty level. Within the married-couple family households, those with 3 or 4 children have the highest poverty rate, with 33 households (8.6%) falling below the poverty line. Among the single-parent households, those with 5 or more children have the highest poverty rate, with 32 household (100.0%) living below poverty.
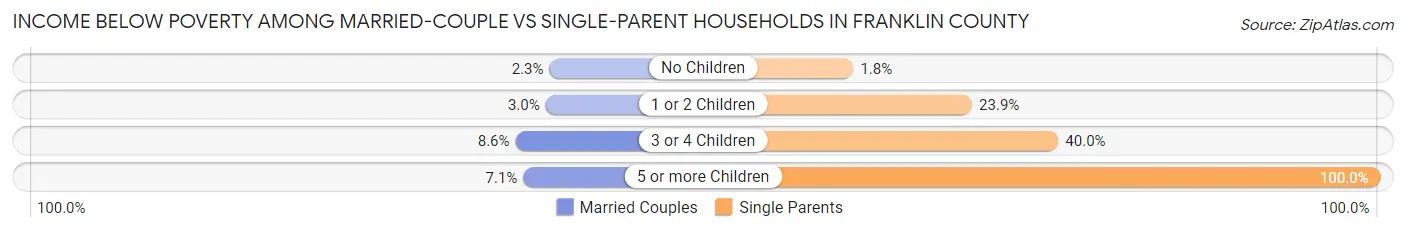
| Children | Married-Couple Families | Single-Parent Households |
| No Children | 91 (2.3%) | 9 (1.8%) |
| 1 or 2 Children | 40 (3.0%) | 206 (23.9%) |
| 3 or 4 Children | 33 (8.6%) | 30 (40.0%) |
| 5 or more Children | 2 (7.1%) | 32 (100.0%) |
| Total | 166 (2.9%) | 277 (18.9%) |
Employment Characteristics in Franklin County
Employment by Class of Employer in Franklin County
Among the 13,669 employed individuals in Franklin County, private company employees (7,663 | 56.1%), not-for-profit organizations (1,936 | 14.2%), and self-employed (not incorporated) (1,277 | 9.3%) make up the most common classes of employment.
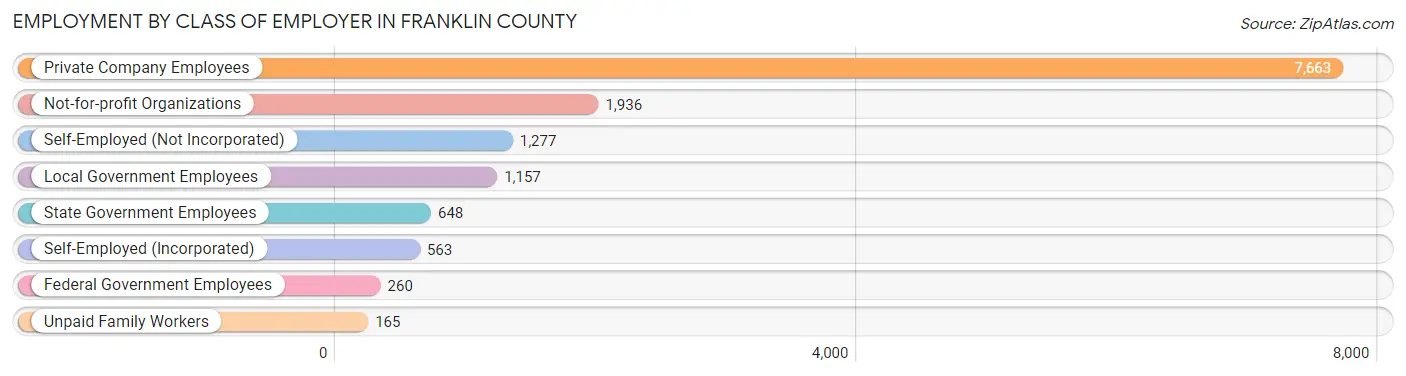
| Employer Class | # Employees | % Employees |
| Private Company Employees | 7,663 | 56.1% |
| Self-Employed (Incorporated) | 563 | 4.1% |
| Self-Employed (Not Incorporated) | 1,277 | 9.3% |
| Not-for-profit Organizations | 1,936 | 14.2% |
| Local Government Employees | 1,157 | 8.5% |
| State Government Employees | 648 | 4.7% |
| Federal Government Employees | 260 | 1.9% |
| Unpaid Family Workers | 165 | 1.2% |
| Total | 13,669 | 100.0% |
Employment Status by Age in Franklin County
According to the labor force statistics for Franklin County, out of the total population over 16 years of age (25,351), 57.8% or 14,653 individuals are in the labor force, with 4.4% or 645 of them unemployed. The age group with the highest labor force participation rate is 20 to 24 years, with 86.0% or 1,732 individuals in the labor force. Within the labor force, the 16 to 19 years age range has the highest percentage of unemployed individuals, with 17.4% or 153 of them being unemployed.
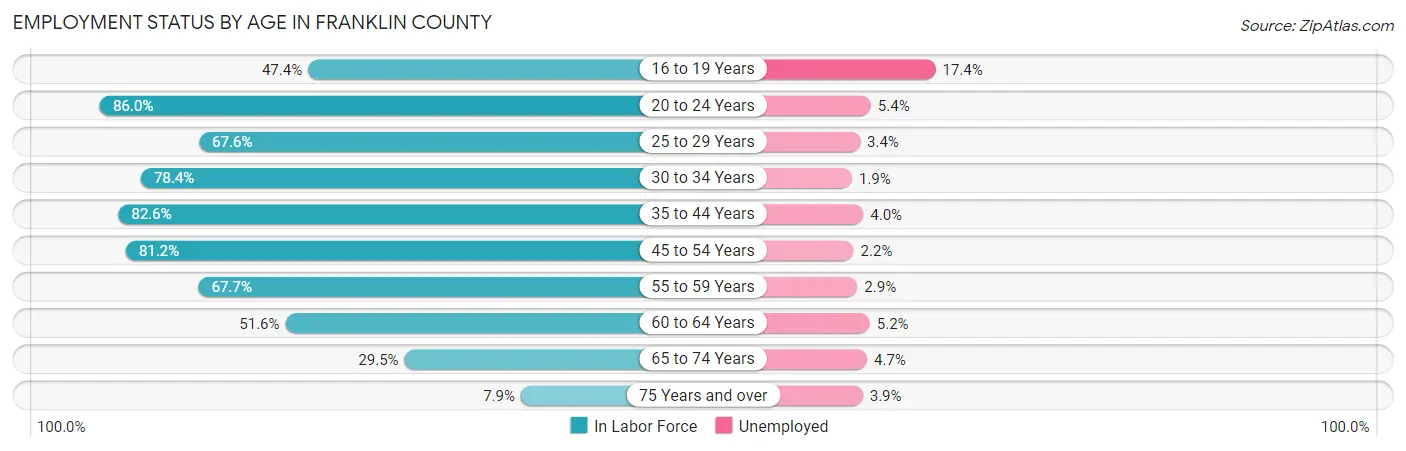
| Age Bracket | In Labor Force | Unemployed |
| 16 to 19 Years | 877 (47.4%) | 153 (17.4%) |
| 20 to 24 Years | 1,732 (86.0%) | 94 (5.4%) |
| 25 to 29 Years | 1,038 (67.6%) | 35 (3.4%) |
| 30 to 34 Years | 1,318 (78.4%) | 25 (1.9%) |
| 35 to 44 Years | 2,544 (82.6%) | 102 (4.0%) |
| 45 to 54 Years | 2,792 (81.2%) | 61 (2.2%) |
| 55 to 59 Years | 1,527 (67.7%) | 44 (2.9%) |
| 60 to 64 Years | 1,375 (51.6%) | 72 (5.2%) |
| 65 to 74 Years | 1,238 (29.5%) | 58 (4.7%) |
| 75 Years and over | 208 (7.9%) | 8 (3.9%) |
| Total | 14,653 (57.8%) | 645 (4.4%) |
Employment Status by Educational Attainment in Franklin County
According to labor force statistics for Franklin County, 72.3% of individuals (10,595) out of the total population between 25 and 64 years of age (14,654) are in the labor force, with 3.2% or 339 of them being unemployed. The group with the highest labor force participation rate are those with the educational attainment of bachelor's degree or higher, with 81.0% or 3,198 individuals in the labor force. Within the labor force, individuals with less than high school education have the highest percentage of unemployment, with 9.2% or 40 of them being unemployed.
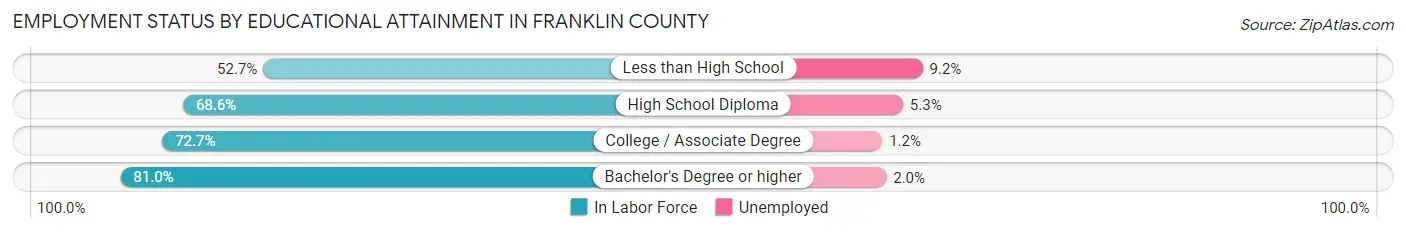
| Educational Attainment | In Labor Force | Unemployed |
| Less than High School | 436 (52.7%) | 76 (9.2%) |
| High School Diploma | 3,631 (68.6%) | 281 (5.3%) |
| College / Associate Degree | 3,333 (72.7%) | 55 (1.2%) |
| Bachelor's Degree or higher | 3,198 (81.0%) | 79 (2.0%) |
| Total | 10,595 (72.3%) | 469 (3.2%) |
Employment Occupations by Sex in Franklin County
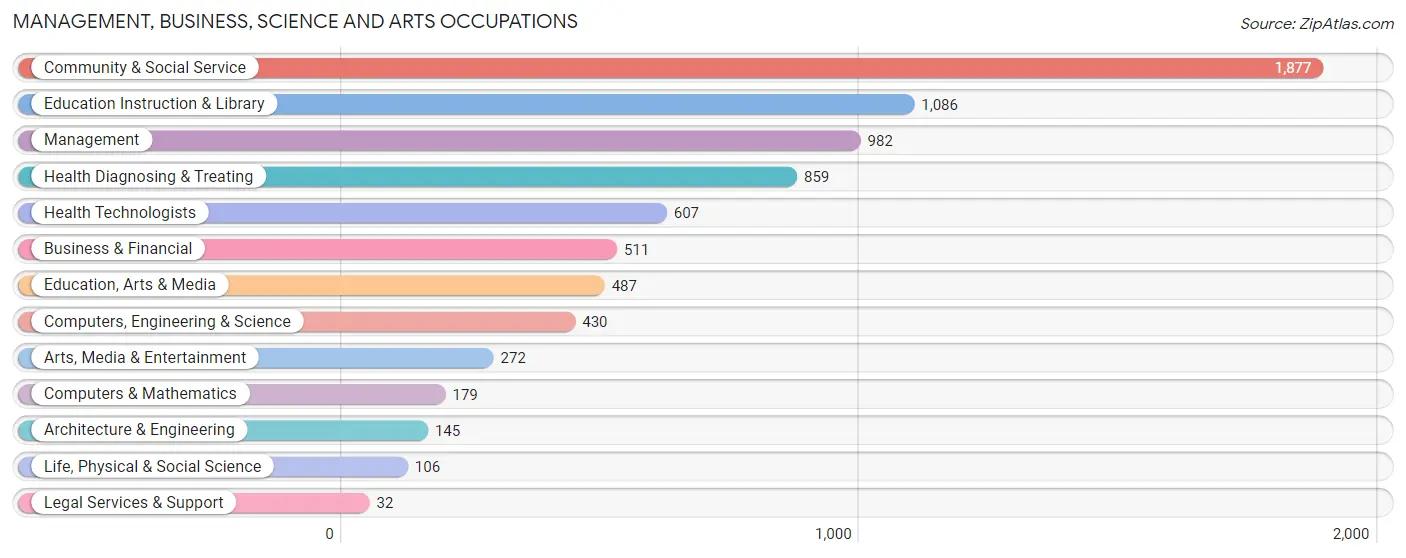
Management, Business, Science and Arts Occupations
The most common Management, Business, Science and Arts occupations in Franklin County are Community & Social Service (1,877 | 13.4%), Education Instruction & Library (1,086 | 7.8%), Management (982 | 7.0%), Health Diagnosing & Treating (859 | 6.1%), and Health Technologists (607 | 4.3%).
Management, Business, Science and Arts Occupations by Sex
Within the Management, Business, Science and Arts occupations in Franklin County, the most male-oriented occupations are Computers & Mathematics (89.9%), Architecture & Engineering (87.6%), and Computers, Engineering & Science (85.8%), while the most female-oriented occupations are Health Diagnosing & Treating (85.1%), Health Technologists (80.6%), and Education, Arts & Media (75.1%).
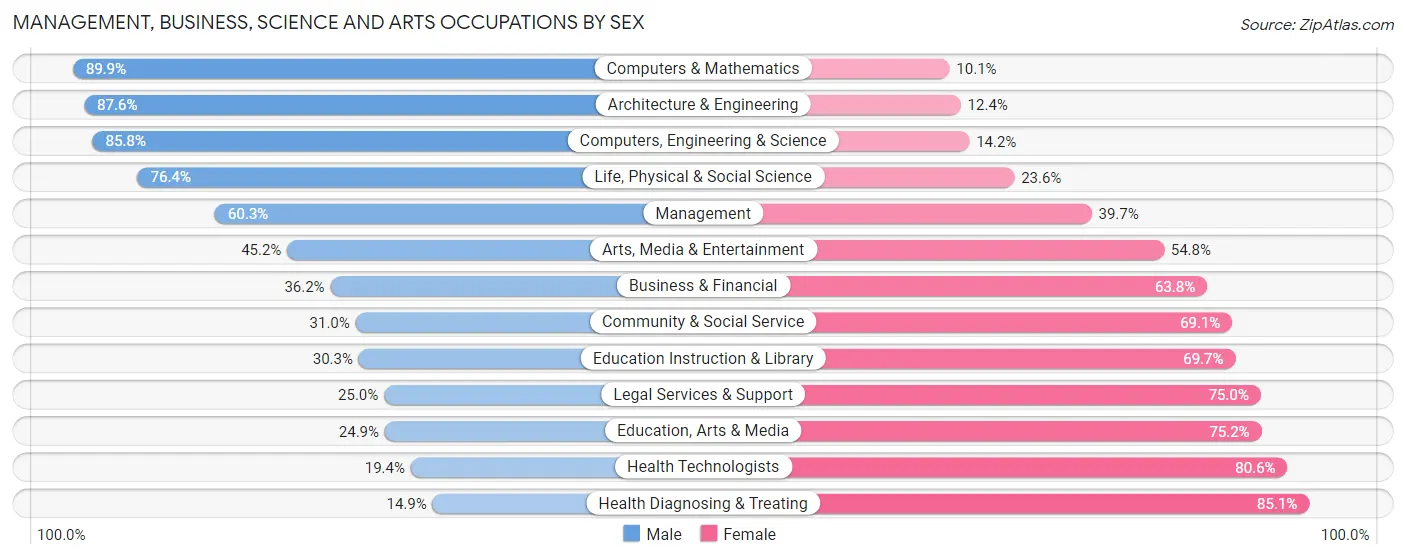
| Occupation | Male | Female |
| Management | 592 (60.3%) | 390 (39.7%) |
| Business & Financial | 185 (36.2%) | 326 (63.8%) |
| Computers, Engineering & Science | 369 (85.8%) | 61 (14.2%) |
| Computers & Mathematics | 161 (89.9%) | 18 (10.1%) |
| Architecture & Engineering | 127 (87.6%) | 18 (12.4%) |
| Life, Physical & Social Science | 81 (76.4%) | 25 (23.6%) |
| Community & Social Service | 581 (30.9%) | 1,296 (69.1%) |
| Education, Arts & Media | 121 (24.8%) | 366 (75.1%) |
| Legal Services & Support | 8 (25.0%) | 24 (75.0%) |
| Education Instruction & Library | 329 (30.3%) | 757 (69.7%) |
| Arts, Media & Entertainment | 123 (45.2%) | 149 (54.8%) |
| Health Diagnosing & Treating | 128 (14.9%) | 731 (85.1%) |
| Health Technologists | 118 (19.4%) | 489 (80.6%) |
| Total (Category) | 1,855 (39.8%) | 2,804 (60.2%) |
| Total (Overall) | 7,110 (50.8%) | 6,890 (49.2%) |
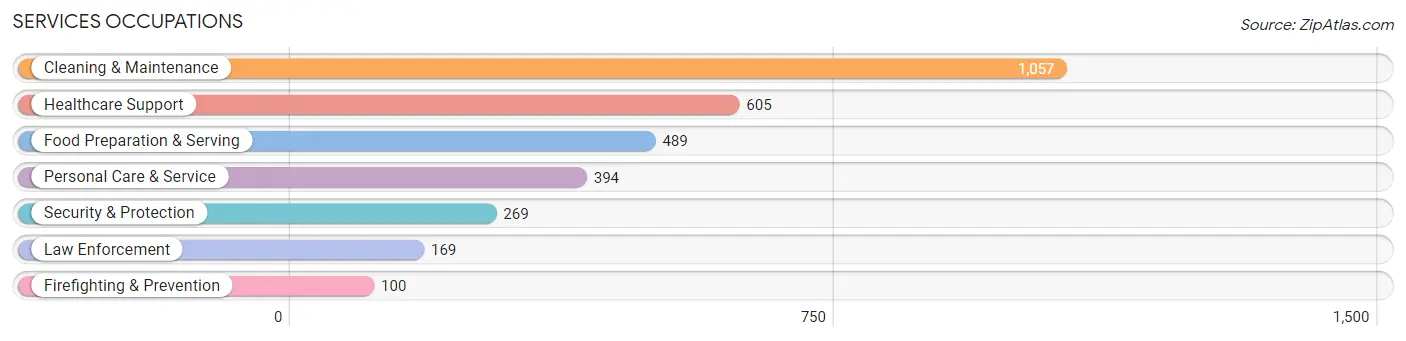
Services Occupations
The most common Services occupations in Franklin County are Cleaning & Maintenance (1,057 | 7.5%), Healthcare Support (605 | 4.3%), Food Preparation & Serving (489 | 3.5%), Personal Care & Service (394 | 2.8%), and Security & Protection (269 | 1.9%).
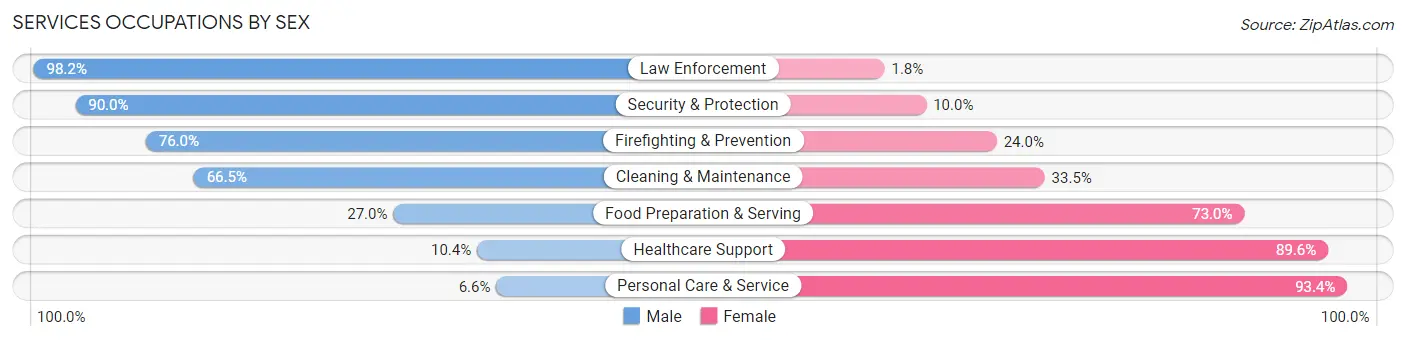
Services Occupations by Sex
Within the Services occupations in Franklin County, the most male-oriented occupations are Law Enforcement (98.2%), Security & Protection (90.0%), and Firefighting & Prevention (76.0%), while the most female-oriented occupations are Personal Care & Service (93.4%), Healthcare Support (89.6%), and Food Preparation & Serving (73.0%).
| Occupation | Male | Female |
| Healthcare Support | 63 (10.4%) | 542 (89.6%) |
| Security & Protection | 242 (90.0%) | 27 (10.0%) |
| Firefighting & Prevention | 76 (76.0%) | 24 (24.0%) |
| Law Enforcement | 166 (98.2%) | 3 (1.8%) |
| Food Preparation & Serving | 132 (27.0%) | 357 (73.0%) |
| Cleaning & Maintenance | 703 (66.5%) | 354 (33.5%) |
| Personal Care & Service | 26 (6.6%) | 368 (93.4%) |
| Total (Category) | 1,166 (41.4%) | 1,648 (58.6%) |
| Total (Overall) | 7,110 (50.8%) | 6,890 (49.2%) |
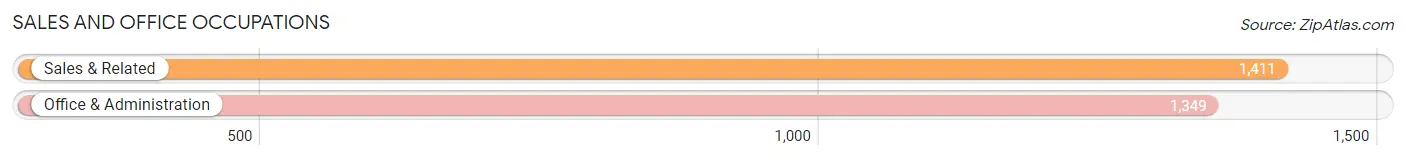
Sales and Office Occupations
The most common Sales and Office occupations in Franklin County are Sales & Related (1,411 | 10.1%), and Office & Administration (1,349 | 9.6%).
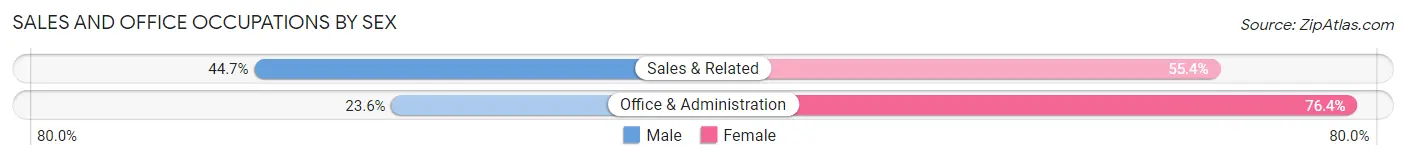
Sales and Office Occupations by Sex
| Occupation | Male | Female |
| Sales & Related | 630 (44.7%) | 781 (55.3%) |
| Office & Administration | 318 (23.6%) | 1,031 (76.4%) |
| Total (Category) | 948 (34.4%) | 1,812 (65.6%) |
| Total (Overall) | 7,110 (50.8%) | 6,890 (49.2%) |
Natural Resources, Construction and Maintenance Occupations
The most common Natural Resources, Construction and Maintenance occupations in Franklin County are Construction & Extraction (1,027 | 7.3%), Installation, Maintenance & Repair (518 | 3.7%), and Farming, Fishing & Forestry (218 | 1.6%).
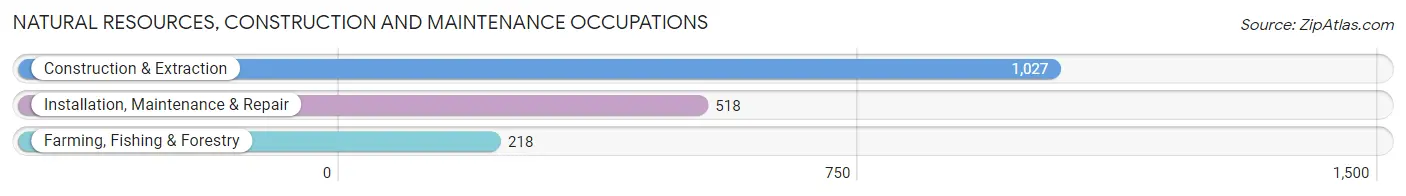
Natural Resources, Construction and Maintenance Occupations by Sex
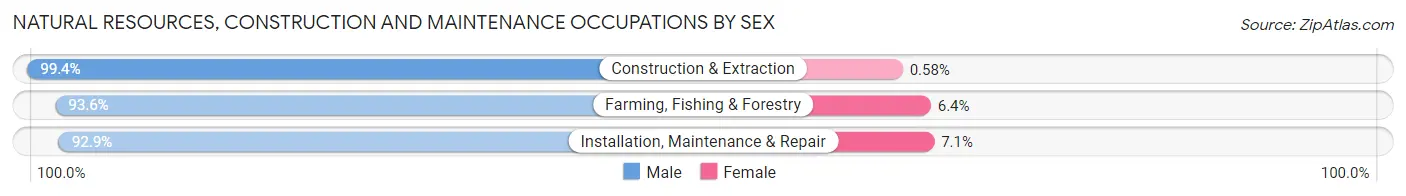
| Occupation | Male | Female |
| Farming, Fishing & Forestry | 204 (93.6%) | 14 (6.4%) |
| Construction & Extraction | 1,021 (99.4%) | 6 (0.6%) |
| Installation, Maintenance & Repair | 481 (92.9%) | 37 (7.1%) |
| Total (Category) | 1,706 (96.8%) | 57 (3.2%) |
| Total (Overall) | 7,110 (50.8%) | 6,890 (49.2%) |
Production, Transportation and Moving Occupations
The most common Production, Transportation and Moving occupations in Franklin County are Production (959 | 6.9%), Material Moving (537 | 3.8%), and Transportation (508 | 3.6%).
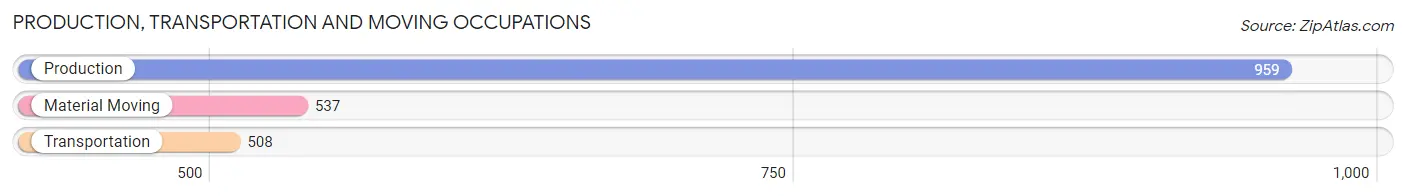
Production, Transportation and Moving Occupations by Sex

| Occupation | Male | Female |
| Production | 643 (67.0%) | 316 (33.0%) |
| Transportation | 440 (86.6%) | 68 (13.4%) |
| Material Moving | 352 (65.5%) | 185 (34.4%) |
| Total (Category) | 1,435 (71.6%) | 569 (28.4%) |
| Total (Overall) | 7,110 (50.8%) | 6,890 (49.2%) |
Employment Industries by Sex in Franklin County
Employment Industries in Franklin County
The major employment industries in Franklin County include Health Care & Social Assistance (2,345 | 16.8%), Educational Services (2,176 | 15.5%), Retail Trade (1,705 | 12.2%), Manufacturing (1,586 | 11.3%), and Construction (1,022 | 7.3%).
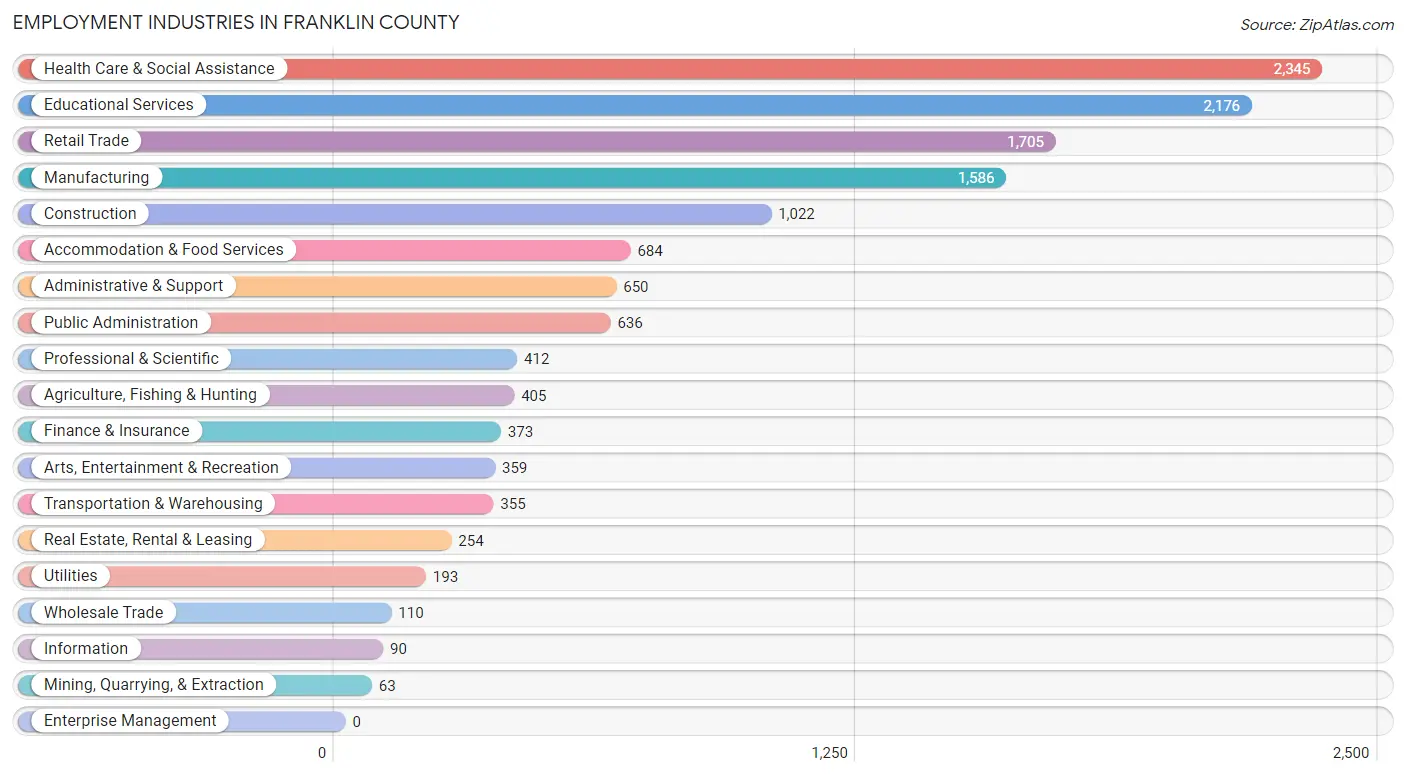
Employment Industries by Sex in Franklin County
The Franklin County industries that see more men than women are Mining, Quarrying, & Extraction (100.0%), Construction (93.9%), and Agriculture, Fishing & Hunting (89.9%), whereas the industries that tend to have a higher number of women are Health Care & Social Assistance (81.7%), Finance & Insurance (75.1%), and Accommodation & Food Services (72.1%).
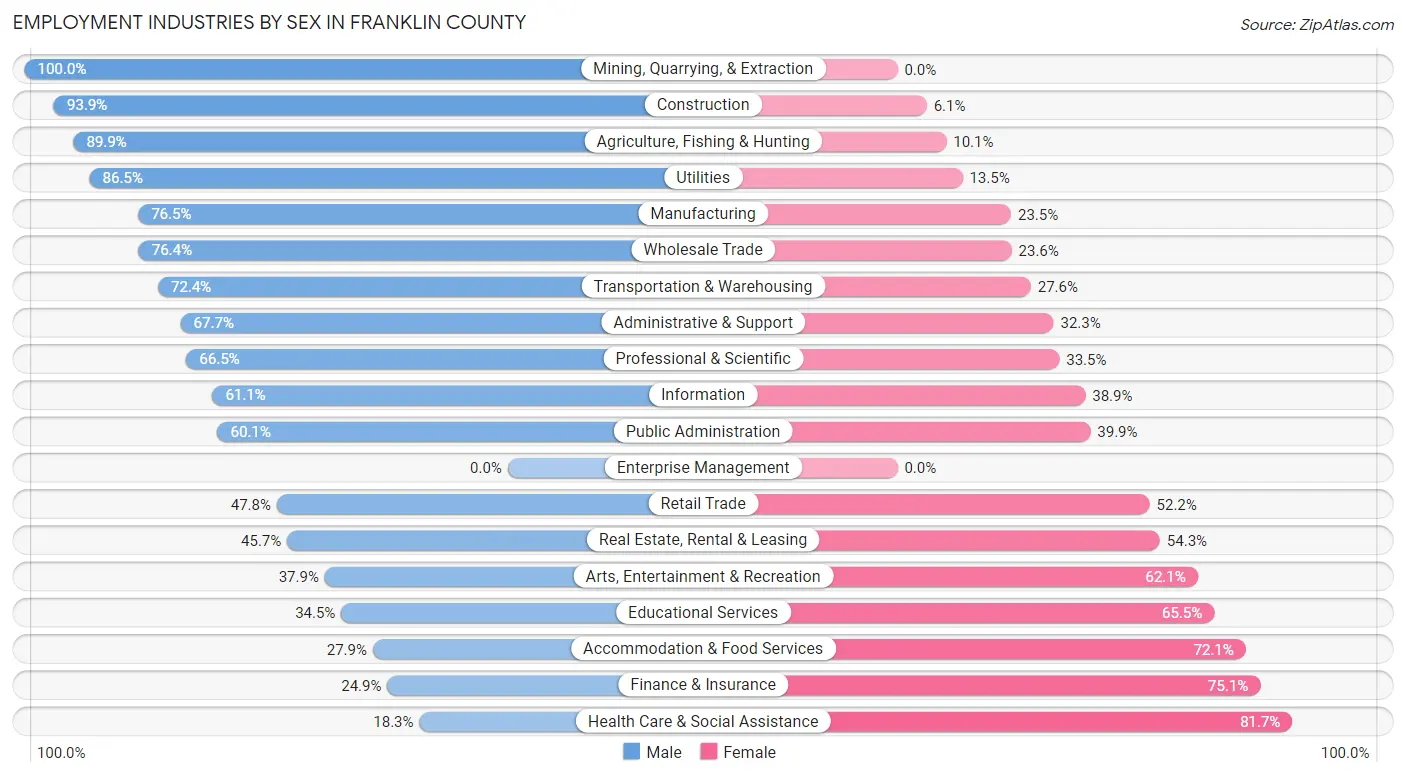
| Industry | Male | Female |
| Agriculture, Fishing & Hunting | 364 (89.9%) | 41 (10.1%) |
| Mining, Quarrying, & Extraction | 63 (100.0%) | 0 (0.0%) |
| Construction | 960 (93.9%) | 62 (6.1%) |
| Manufacturing | 1,213 (76.5%) | 373 (23.5%) |
| Wholesale Trade | 84 (76.4%) | 26 (23.6%) |
| Retail Trade | 815 (47.8%) | 890 (52.2%) |
| Transportation & Warehousing | 257 (72.4%) | 98 (27.6%) |
| Utilities | 167 (86.5%) | 26 (13.5%) |
| Information | 55 (61.1%) | 35 (38.9%) |
| Finance & Insurance | 93 (24.9%) | 280 (75.1%) |
| Real Estate, Rental & Leasing | 116 (45.7%) | 138 (54.3%) |
| Professional & Scientific | 274 (66.5%) | 138 (33.5%) |
| Enterprise Management | 0 (0.0%) | 0 (0.0%) |
| Administrative & Support | 440 (67.7%) | 210 (32.3%) |
| Educational Services | 750 (34.5%) | 1,426 (65.5%) |
| Health Care & Social Assistance | 429 (18.3%) | 1,916 (81.7%) |
| Arts, Entertainment & Recreation | 136 (37.9%) | 223 (62.1%) |
| Accommodation & Food Services | 191 (27.9%) | 493 (72.1%) |
| Public Administration | 382 (60.1%) | 254 (39.9%) |
| Total | 7,110 (50.8%) | 6,890 (49.2%) |
Education in Franklin County
School Enrollment in Franklin County
The most common levels of schooling among the 6,362 students in Franklin County are college / undergraduate (1,938 | 30.5%), high school (1,204 | 18.9%), and middle school (1,178 | 18.5%).
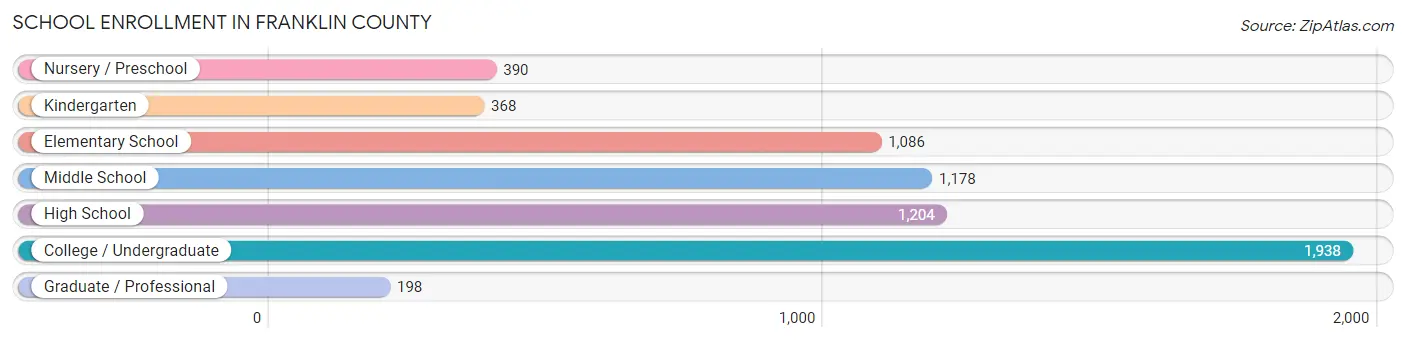
| School Level | # Students | % Students |
| Nursery / Preschool | 390 | 6.1% |
| Kindergarten | 368 | 5.8% |
| Elementary School | 1,086 | 17.1% |
| Middle School | 1,178 | 18.5% |
| High School | 1,204 | 18.9% |
| College / Undergraduate | 1,938 | 30.5% |
| Graduate / Professional | 198 | 3.1% |
| Total | 6,362 | 100.0% |
School Enrollment by Age by Funding Source in Franklin County
Out of a total of 6,362 students who are enrolled in schools in Franklin County, 903 (14.2%) attend a private institution, while the remaining 5,459 (85.8%) are enrolled in public schools. The age group of 3 to 4 year olds has the highest likelihood of being enrolled in private schools, with 115 (38.2% in the age bracket) enrolled. Conversely, the age group of 15 to 17 year olds has the lowest likelihood of being enrolled in a private school, with 823 (91.3% in the age bracket) attending a public institution.
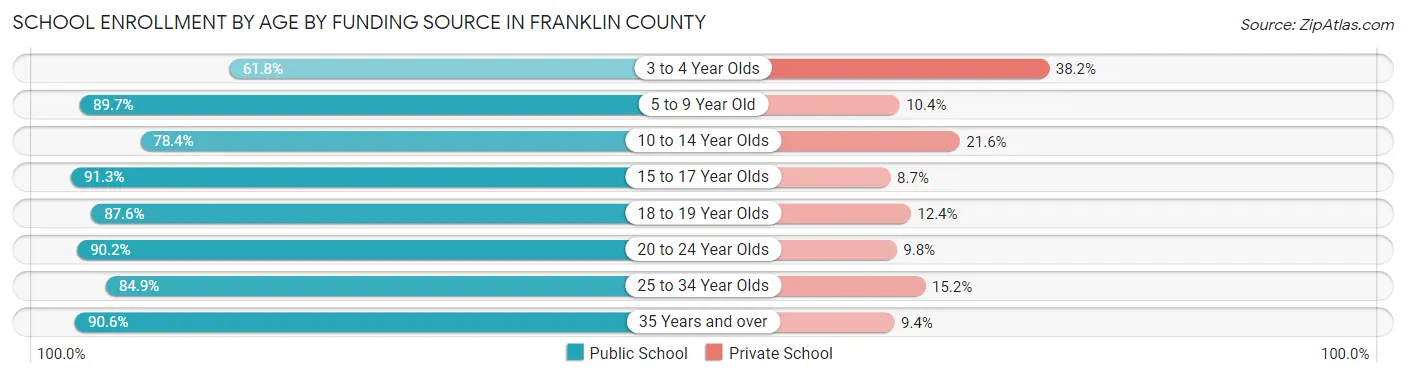
| Age Bracket | Public School | Private School |
| 3 to 4 Year Olds | 186 (61.8%) | 115 (38.2%) |
| 5 to 9 Year Old | 1,342 (89.6%) | 155 (10.3%) |
| 10 to 14 Year Olds | 1,073 (78.4%) | 295 (21.6%) |
| 15 to 17 Year Olds | 823 (91.3%) | 78 (8.7%) |
| 18 to 19 Year Olds | 670 (87.6%) | 95 (12.4%) |
| 20 to 24 Year Olds | 901 (90.2%) | 98 (9.8%) |
| 25 to 34 Year Olds | 252 (84.9%) | 45 (15.1%) |
| 35 Years and over | 212 (90.6%) | 22 (9.4%) |
| Total | 5,459 (85.8%) | 903 (14.2%) |
Educational Attainment by Field of Study in Franklin County
Education (1,432 | 20.2%), business (854 | 12.1%), science & technology (743 | 10.5%), bio, nature & agricultural (647 | 9.1%), and liberal arts & history (558 | 7.9%) are the most common fields of study among 7,076 individuals in Franklin County who have obtained a bachelor's degree or higher.
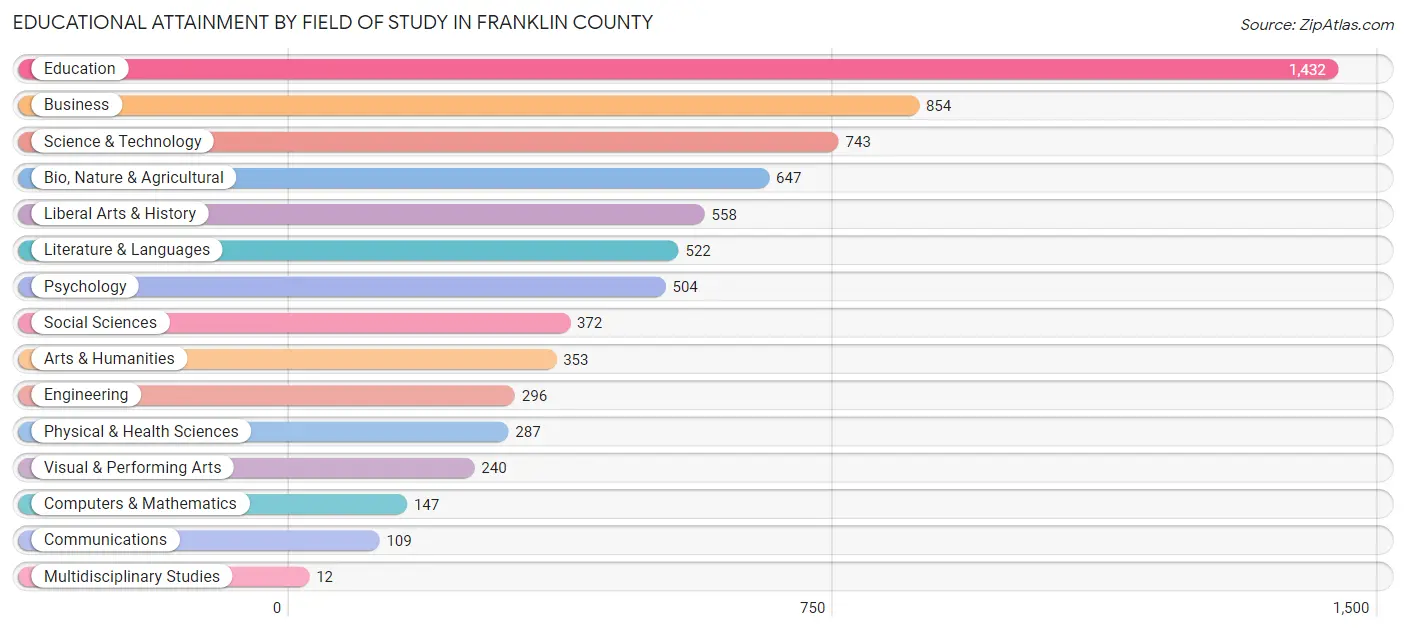
| Field of Study | # Graduates | % Graduates |
| Computers & Mathematics | 147 | 2.1% |
| Bio, Nature & Agricultural | 647 | 9.1% |
| Physical & Health Sciences | 287 | 4.1% |
| Psychology | 504 | 7.1% |
| Social Sciences | 372 | 5.3% |
| Engineering | 296 | 4.2% |
| Multidisciplinary Studies | 12 | 0.2% |
| Science & Technology | 743 | 10.5% |
| Business | 854 | 12.1% |
| Education | 1,432 | 20.2% |
| Literature & Languages | 522 | 7.4% |
| Liberal Arts & History | 558 | 7.9% |
| Visual & Performing Arts | 240 | 3.4% |
| Communications | 109 | 1.5% |
| Arts & Humanities | 353 | 5.0% |
| Total | 7,076 | 100.0% |
Transportation & Commute in Franklin County
Vehicle Availability by Sex in Franklin County
The most prevalent vehicle ownership categories in Franklin County are males with 2 vehicles (2,605, accounting for 37.3%) and females with 2 vehicles (2,258, making up 41.8%).
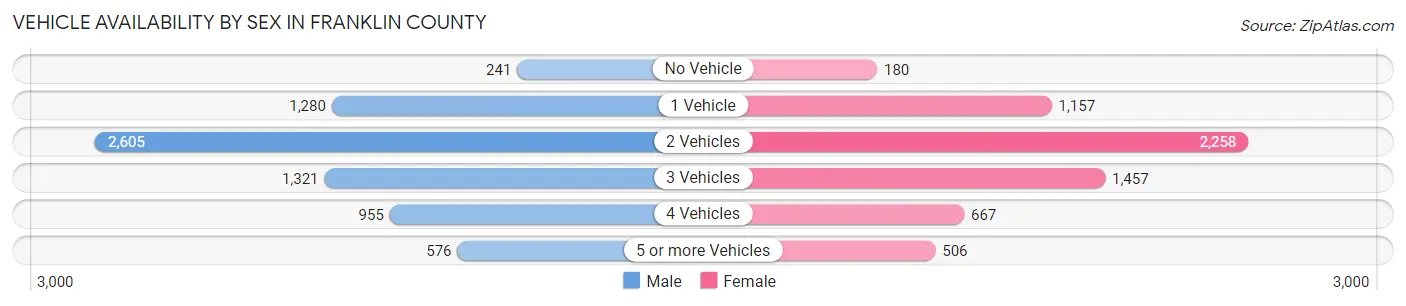
| Vehicles Available | Male | Female |
| No Vehicle | 241 (3.5%) | 180 (2.9%) |
| 1 Vehicle | 1,280 (18.3%) | 1,157 (18.6%) |
| 2 Vehicles | 2,605 (37.3%) | 2,258 (36.3%) |
| 3 Vehicles | 1,321 (18.9%) | 1,457 (23.4%) |
| 4 Vehicles | 955 (13.7%) | 667 (10.7%) |
| 5 or more Vehicles | 576 (8.3%) | 506 (8.1%) |
| Total | 6,978 (100.0%) | 6,225 (100.0%) |
Commute Time in Franklin County
The most frequently occuring commute durations in Franklin County are 10 to 14 minutes (1,988 commuters, 16.0%), 15 to 19 minutes (1,699 commuters, 13.7%), and 5 to 9 minutes (1,632 commuters, 13.2%).
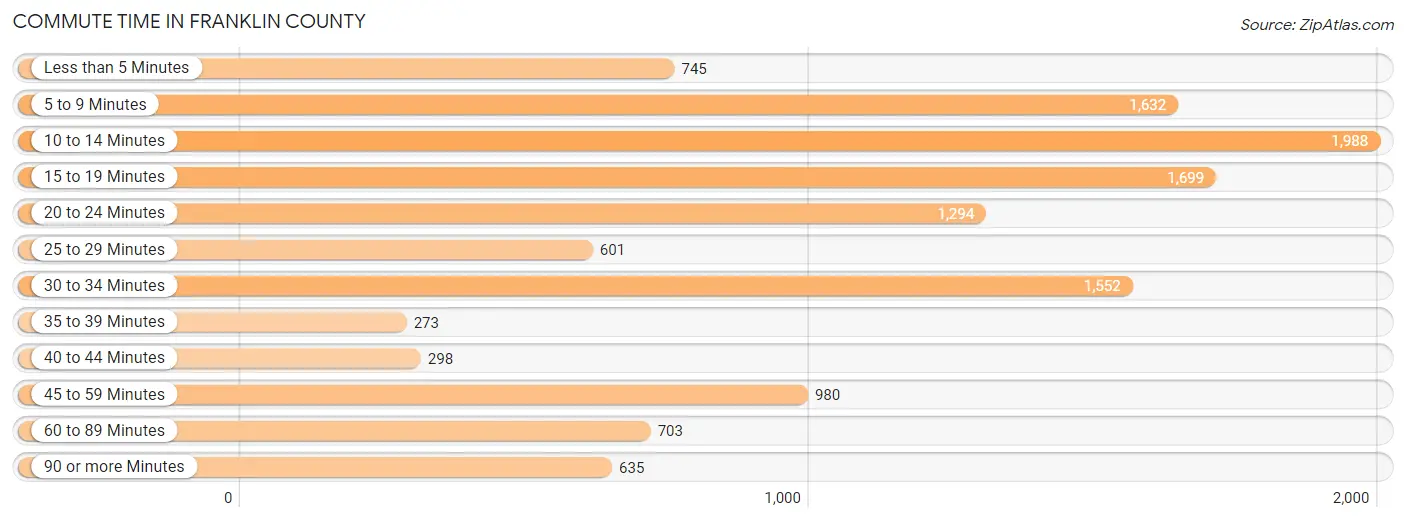
| Commute Time | # Commuters | % Commuters |
| Less than 5 Minutes | 745 | 6.0% |
| 5 to 9 Minutes | 1,632 | 13.2% |
| 10 to 14 Minutes | 1,988 | 16.0% |
| 15 to 19 Minutes | 1,699 | 13.7% |
| 20 to 24 Minutes | 1,294 | 10.4% |
| 25 to 29 Minutes | 601 | 4.9% |
| 30 to 34 Minutes | 1,552 | 12.5% |
| 35 to 39 Minutes | 273 | 2.2% |
| 40 to 44 Minutes | 298 | 2.4% |
| 45 to 59 Minutes | 980 | 7.9% |
| 60 to 89 Minutes | 703 | 5.7% |
| 90 or more Minutes | 635 | 5.1% |
Commute Time by Sex in Franklin County
The most common commute times in Franklin County are 10 to 14 minutes (1,028 commuters, 15.8%) for males and 10 to 14 minutes (960 commuters, 16.3%) for females.
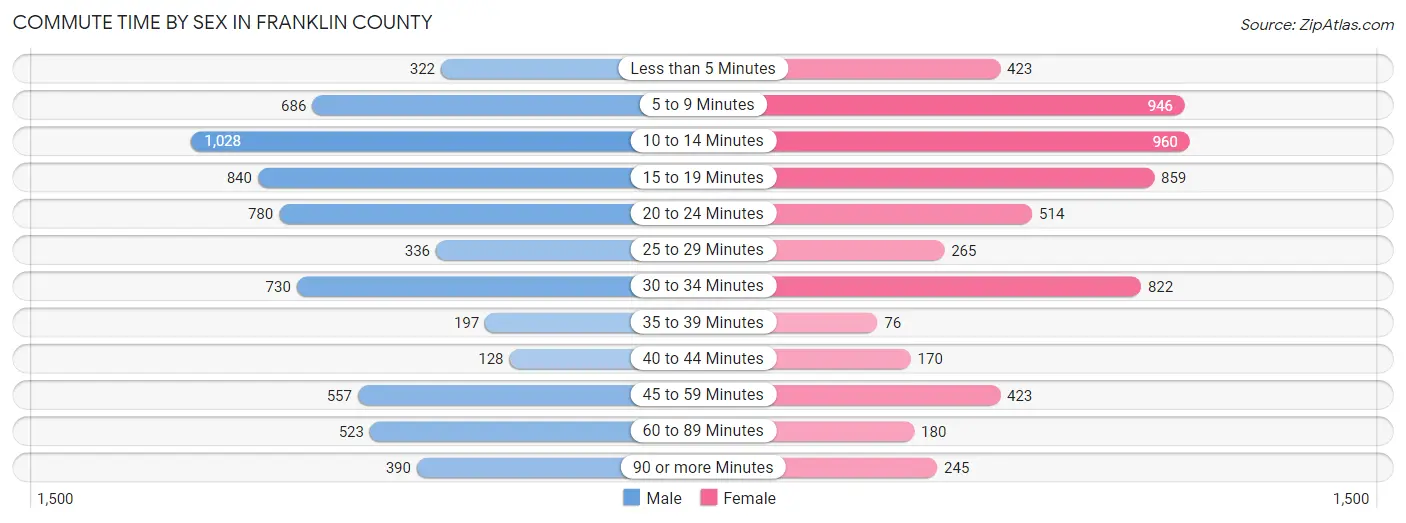
| Commute Time | Male | Female |
| Less than 5 Minutes | 322 (4.9%) | 423 (7.2%) |
| 5 to 9 Minutes | 686 (10.5%) | 946 (16.1%) |
| 10 to 14 Minutes | 1,028 (15.8%) | 960 (16.3%) |
| 15 to 19 Minutes | 840 (12.9%) | 859 (14.6%) |
| 20 to 24 Minutes | 780 (12.0%) | 514 (8.7%) |
| 25 to 29 Minutes | 336 (5.2%) | 265 (4.5%) |
| 30 to 34 Minutes | 730 (11.2%) | 822 (14.0%) |
| 35 to 39 Minutes | 197 (3.0%) | 76 (1.3%) |
| 40 to 44 Minutes | 128 (2.0%) | 170 (2.9%) |
| 45 to 59 Minutes | 557 (8.6%) | 423 (7.2%) |
| 60 to 89 Minutes | 523 (8.0%) | 180 (3.1%) |
| 90 or more Minutes | 390 (6.0%) | 245 (4.2%) |
Time of Departure to Work by Sex in Franklin County
The most frequent times of departure to work in Franklin County are 5:30 AM to 5:59 AM (986, 15.1%) for males and 7:30 AM to 7:59 AM (997, 17.0%) for females.
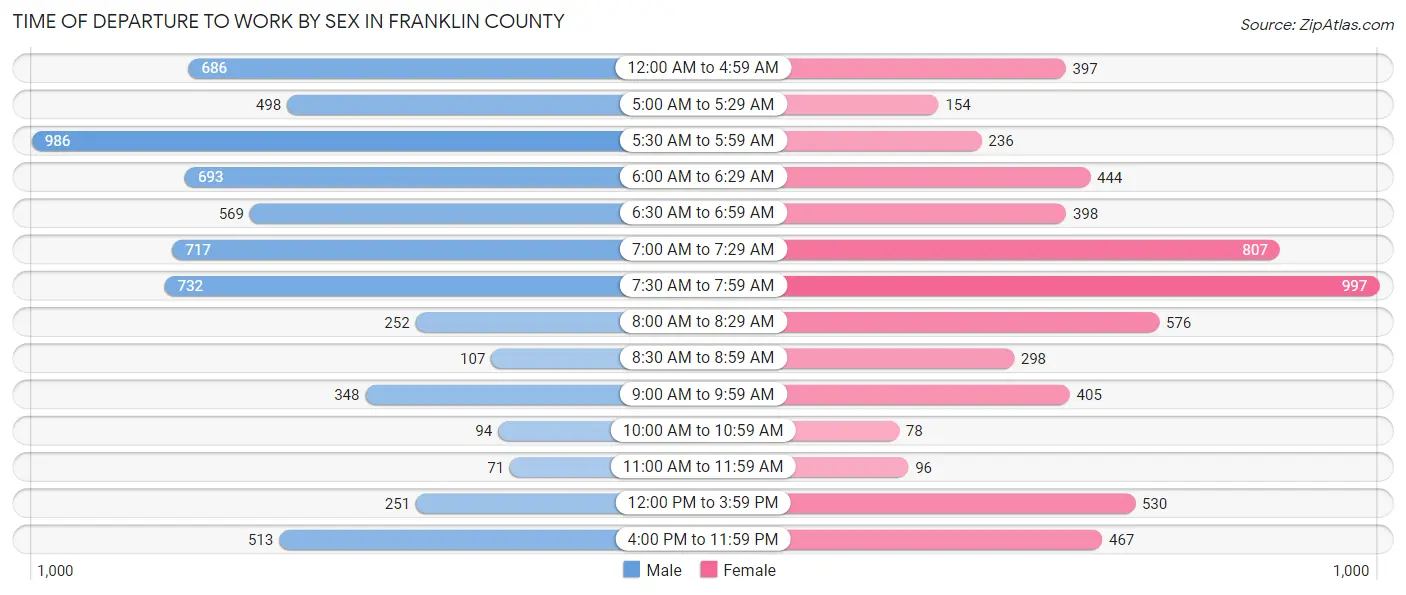
| Time of Departure | Male | Female |
| 12:00 AM to 4:59 AM | 686 (10.5%) | 397 (6.8%) |
| 5:00 AM to 5:29 AM | 498 (7.6%) | 154 (2.6%) |
| 5:30 AM to 5:59 AM | 986 (15.1%) | 236 (4.0%) |
| 6:00 AM to 6:29 AM | 693 (10.6%) | 444 (7.5%) |
| 6:30 AM to 6:59 AM | 569 (8.7%) | 398 (6.8%) |
| 7:00 AM to 7:29 AM | 717 (11.0%) | 807 (13.7%) |
| 7:30 AM to 7:59 AM | 732 (11.2%) | 997 (17.0%) |
| 8:00 AM to 8:29 AM | 252 (3.9%) | 576 (9.8%) |
| 8:30 AM to 8:59 AM | 107 (1.6%) | 298 (5.1%) |
| 9:00 AM to 9:59 AM | 348 (5.3%) | 405 (6.9%) |
| 10:00 AM to 10:59 AM | 94 (1.4%) | 78 (1.3%) |
| 11:00 AM to 11:59 AM | 71 (1.1%) | 96 (1.6%) |
| 12:00 PM to 3:59 PM | 251 (3.8%) | 530 (9.0%) |
| 4:00 PM to 11:59 PM | 513 (7.9%) | 467 (7.9%) |
| Total | 6,517 (100.0%) | 5,883 (100.0%) |
Housing Occupancy in Franklin County
Occupancy by Ownership in Franklin County
Of the total 12,276 dwellings in Franklin County, owner-occupied units account for 9,290 (75.7%), while renter-occupied units make up 2,986 (24.3%).
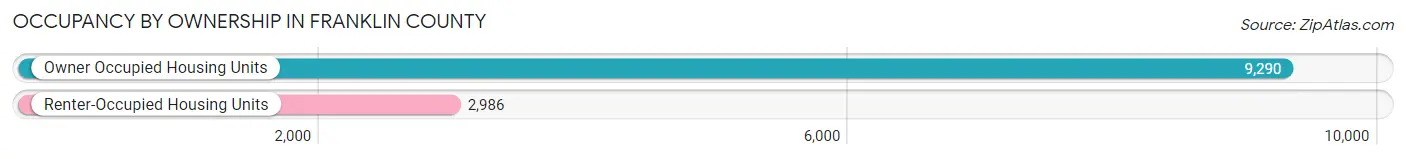
| Occupancy | # Housing Units | % Housing Units |
| Owner Occupied Housing Units | 9,290 | 75.7% |
| Renter-Occupied Housing Units | 2,986 | 24.3% |
| Total Occupied Housing Units | 12,276 | 100.0% |
Occupancy by Household Size in Franklin County
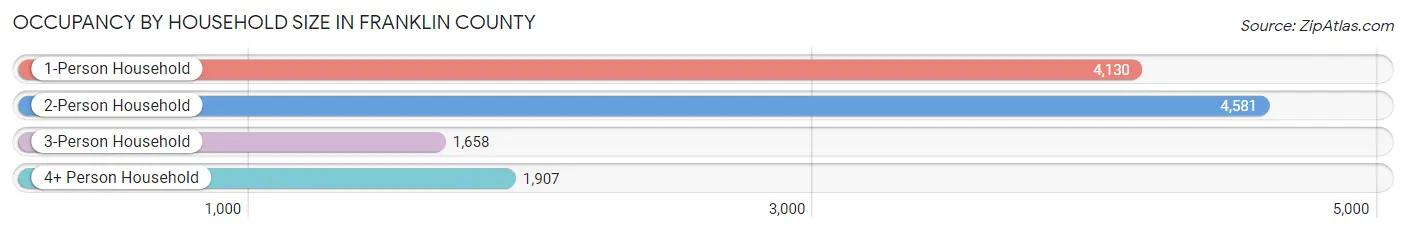
| Household Size | # Housing Units | % Housing Units |
| 1-Person Household | 4,130 | 33.6% |
| 2-Person Household | 4,581 | 37.3% |
| 3-Person Household | 1,658 | 13.5% |
| 4+ Person Household | 1,907 | 15.5% |
| Total Housing Units | 12,276 | 100.0% |
Occupancy by Ownership by Household Size in Franklin County
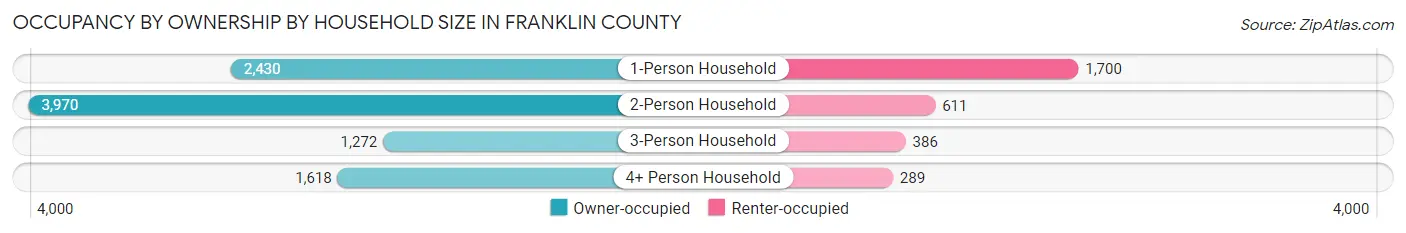
| Household Size | Owner-occupied | Renter-occupied |
| 1-Person Household | 2,430 (58.8%) | 1,700 (41.2%) |
| 2-Person Household | 3,970 (86.7%) | 611 (13.3%) |
| 3-Person Household | 1,272 (76.7%) | 386 (23.3%) |
| 4+ Person Household | 1,618 (84.9%) | 289 (15.1%) |
| Total Housing Units | 9,290 (75.7%) | 2,986 (24.3%) |
Occupancy by Educational Attainment in Franklin County
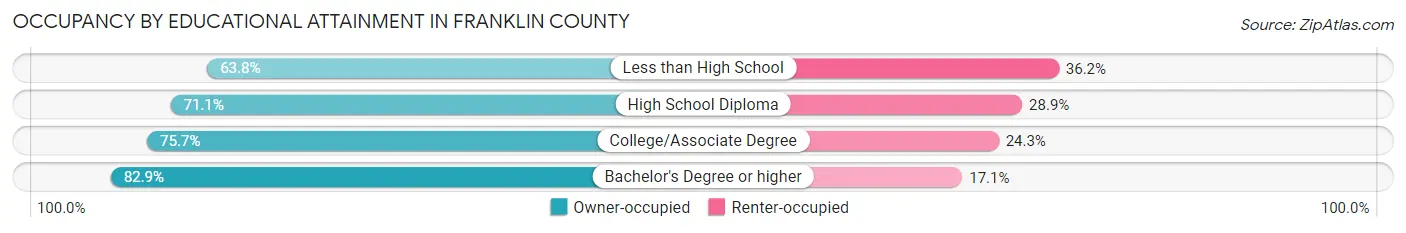
| Household Size | Owner-occupied | Renter-occupied |
| Less than High School | 405 (63.8%) | 230 (36.2%) |
| High School Diploma | 3,042 (71.1%) | 1,239 (28.9%) |
| College/Associate Degree | 2,727 (75.7%) | 875 (24.3%) |
| Bachelor's Degree or higher | 3,116 (82.9%) | 642 (17.1%) |
Occupancy by Age of Householder in Franklin County
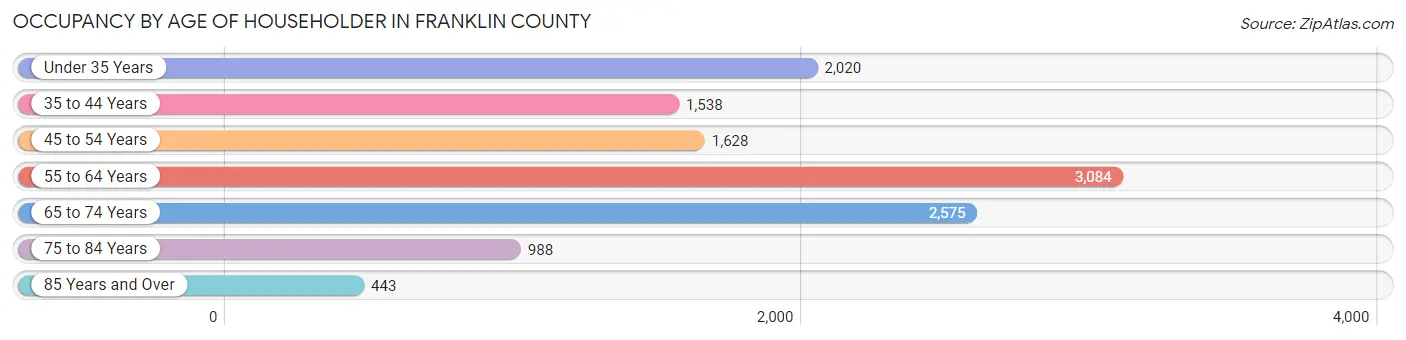
| Age Bracket | # Households | % Households |
| Under 35 Years | 2,020 | 16.5% |
| 35 to 44 Years | 1,538 | 12.5% |
| 45 to 54 Years | 1,628 | 13.3% |
| 55 to 64 Years | 3,084 | 25.1% |
| 65 to 74 Years | 2,575 | 21.0% |
| 75 to 84 Years | 988 | 8.1% |
| 85 Years and Over | 443 | 3.6% |
| Total | 12,276 | 100.0% |
Housing Finances in Franklin County
Median Income by Occupancy in Franklin County
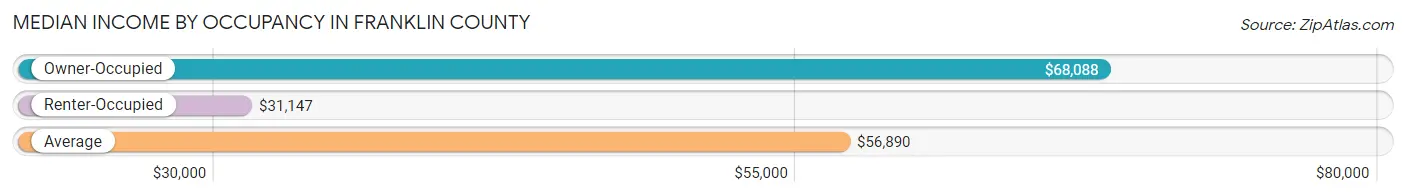
| Occupancy Type | # Households | Median Income |
| Owner-Occupied | 9,290 (75.7%) | $68,088 |
| Renter-Occupied | 2,986 (24.3%) | $31,147 |
| Average | 12,276 (100.0%) | $56,890 |
Occupancy by Householder Income Bracket in Franklin County
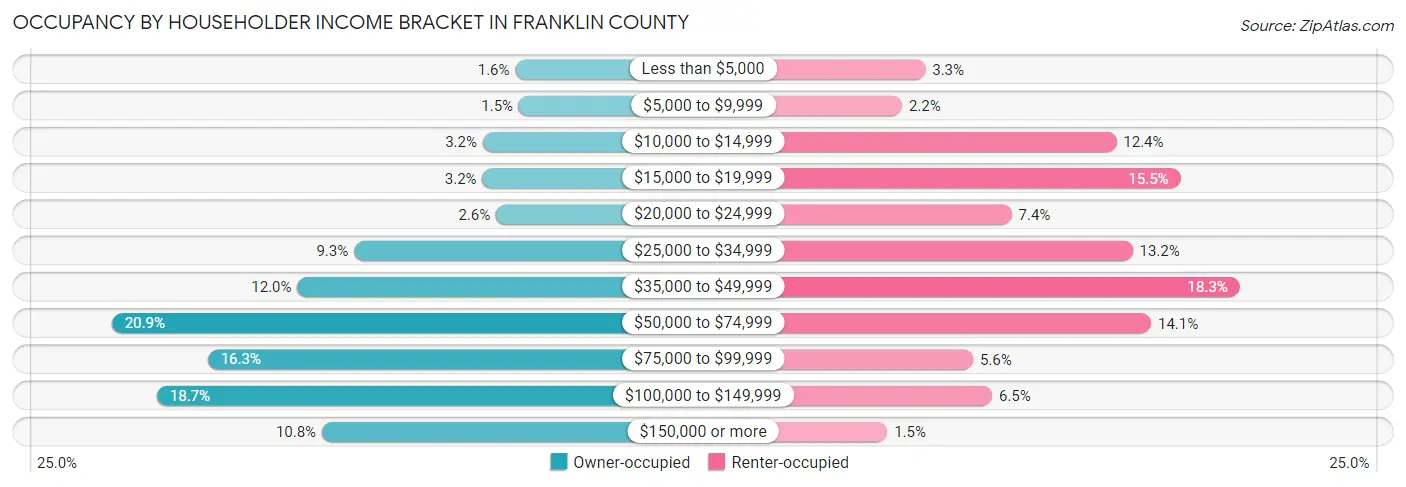
| Income Bracket | Owner-occupied | Renter-occupied |
| Less than $5,000 | 151 (1.6%) | 99 (3.3%) |
| $5,000 to $9,999 | 136 (1.5%) | 66 (2.2%) |
| $10,000 to $14,999 | 295 (3.2%) | 371 (12.4%) |
| $15,000 to $19,999 | 297 (3.2%) | 462 (15.5%) |
| $20,000 to $24,999 | 237 (2.5%) | 222 (7.4%) |
| $25,000 to $34,999 | 865 (9.3%) | 394 (13.2%) |
| $35,000 to $49,999 | 1,116 (12.0%) | 546 (18.3%) |
| $50,000 to $74,999 | 1,937 (20.8%) | 420 (14.1%) |
| $75,000 to $99,999 | 1,512 (16.3%) | 167 (5.6%) |
| $100,000 to $149,999 | 1,737 (18.7%) | 194 (6.5%) |
| $150,000 or more | 1,007 (10.8%) | 45 (1.5%) |
| Total | 9,290 (100.0%) | 2,986 (100.0%) |
Monthly Housing Cost Tiers in Franklin County

| Monthly Cost | Owner-occupied | Renter-occupied |
| Less than $300 | 915 (9.9%) | 282 (9.4%) |
| $300 to $499 | 1,546 (16.6%) | 323 (10.8%) |
| $500 to $799 | 2,042 (22.0%) | 730 (24.4%) |
| $800 to $999 | 979 (10.5%) | 563 (18.9%) |
| $1,000 to $1,499 | 2,245 (24.2%) | 466 (15.6%) |
| $1,500 to $1,999 | 1,055 (11.4%) | 158 (5.3%) |
| $2,000 to $2,499 | 268 (2.9%) | 0 (0.0%) |
| $2,500 to $2,999 | 171 (1.8%) | 13 (0.4%) |
| $3,000 or more | 69 (0.7%) | 11 (0.4%) |
| Total | 9,290 (100.0%) | 2,986 (100.0%) |
Physical Housing Characteristics in Franklin County
Housing Structures in Franklin County
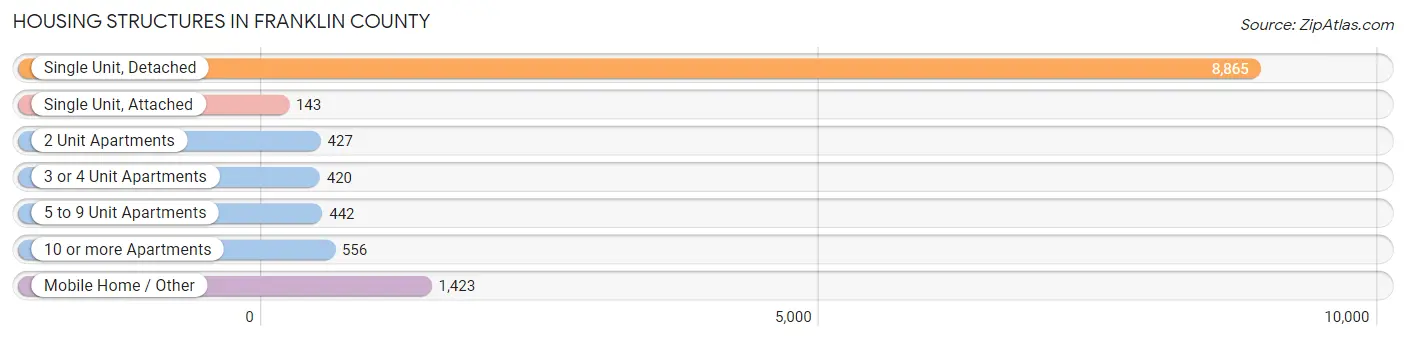
| Structure Type | # Housing Units | % Housing Units |
| Single Unit, Detached | 8,865 | 72.2% |
| Single Unit, Attached | 143 | 1.2% |
| 2 Unit Apartments | 427 | 3.5% |
| 3 or 4 Unit Apartments | 420 | 3.4% |
| 5 to 9 Unit Apartments | 442 | 3.6% |
| 10 or more Apartments | 556 | 4.5% |
| Mobile Home / Other | 1,423 | 11.6% |
| Total | 12,276 | 100.0% |
Housing Structures by Occupancy in Franklin County
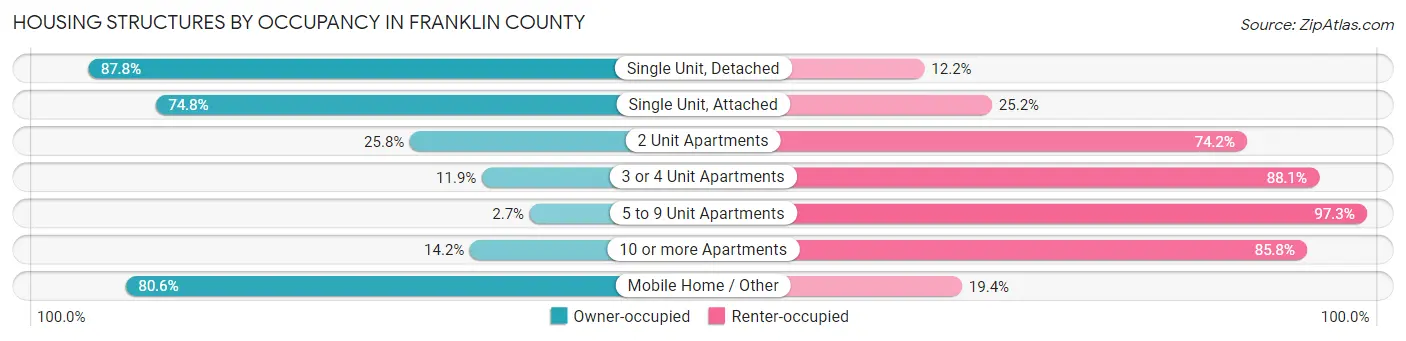
| Structure Type | Owner-occupied | Renter-occupied |
| Single Unit, Detached | 7,785 (87.8%) | 1,080 (12.2%) |
| Single Unit, Attached | 107 (74.8%) | 36 (25.2%) |
| 2 Unit Apartments | 110 (25.8%) | 317 (74.2%) |
| 3 or 4 Unit Apartments | 50 (11.9%) | 370 (88.1%) |
| 5 to 9 Unit Apartments | 12 (2.7%) | 430 (97.3%) |
| 10 or more Apartments | 79 (14.2%) | 477 (85.8%) |
| Mobile Home / Other | 1,147 (80.6%) | 276 (19.4%) |
| Total | 9,290 (75.7%) | 2,986 (24.3%) |
Housing Structures by Number of Rooms in Franklin County
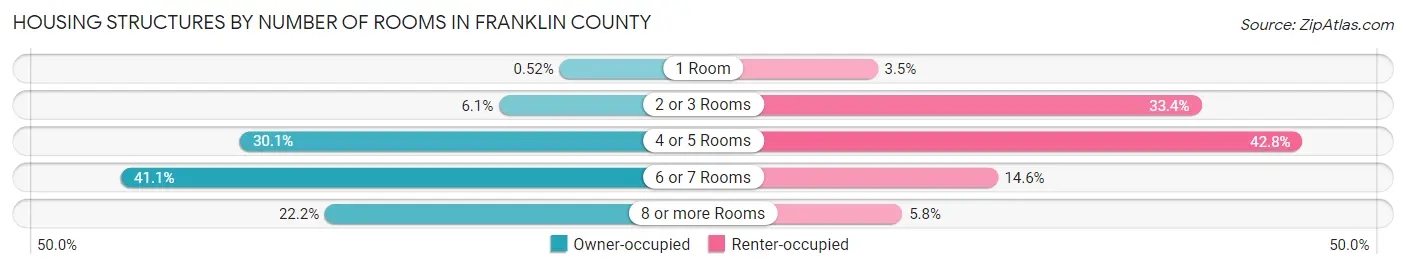
| Number of Rooms | Owner-occupied | Renter-occupied |
| 1 Room | 48 (0.5%) | 104 (3.5%) |
| 2 or 3 Rooms | 569 (6.1%) | 998 (33.4%) |
| 4 or 5 Rooms | 2,794 (30.1%) | 1,277 (42.8%) |
| 6 or 7 Rooms | 3,815 (41.1%) | 435 (14.6%) |
| 8 or more Rooms | 2,064 (22.2%) | 172 (5.8%) |
| Total | 9,290 (100.0%) | 2,986 (100.0%) |
Housing Structure by Heating Type in Franklin County

| Heating Type | Owner-occupied | Renter-occupied |
| Utility Gas | 94 (1.0%) | 46 (1.5%) |
| Bottled, Tank, or LP Gas | 1,114 (12.0%) | 320 (10.7%) |
| Electricity | 320 (3.4%) | 824 (27.6%) |
| Fuel Oil or Kerosene | 5,395 (58.1%) | 1,594 (53.4%) |
| Coal or Coke | 6 (0.1%) | 0 (0.0%) |
| All other Fuels | 2,361 (25.4%) | 184 (6.2%) |
| No Fuel Used | 0 (0.0%) | 18 (0.6%) |
| Total | 9,290 (100.0%) | 2,986 (100.0%) |
Household Vehicle Usage in Franklin County
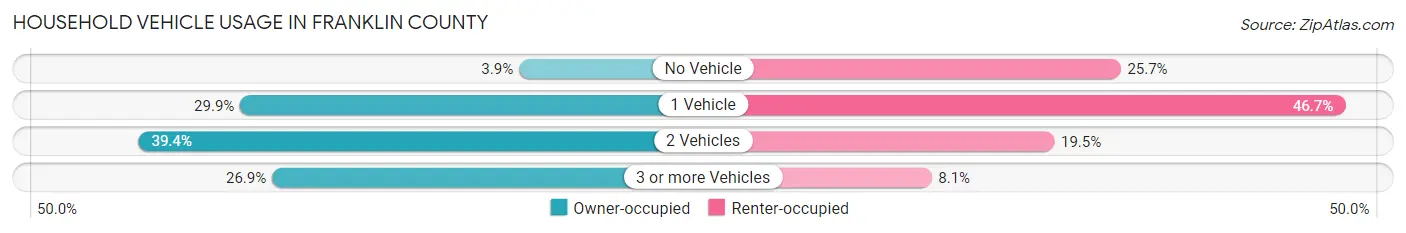
| Vehicles per Household | Owner-occupied | Renter-occupied |
| No Vehicle | 358 (3.8%) | 768 (25.7%) |
| 1 Vehicle | 2,776 (29.9%) | 1,394 (46.7%) |
| 2 Vehicles | 3,657 (39.4%) | 583 (19.5%) |
| 3 or more Vehicles | 2,499 (26.9%) | 241 (8.1%) |
| Total | 9,290 (100.0%) | 2,986 (100.0%) |
Real Estate & Mortgages in Franklin County
Real Estate and Mortgage Overview in Franklin County
| Characteristic | Without Mortgage | With Mortgage |
| Housing Units | 4,324 | 4,966 |
| Median Property Value | $156,600 | $179,000 |
| Median Household Income | $56,598 | $570 |
| Monthly Housing Costs | $472 | $50 |
| Real Estate Taxes | $1,707 | $40 |
Property Value by Mortgage Status in Franklin County
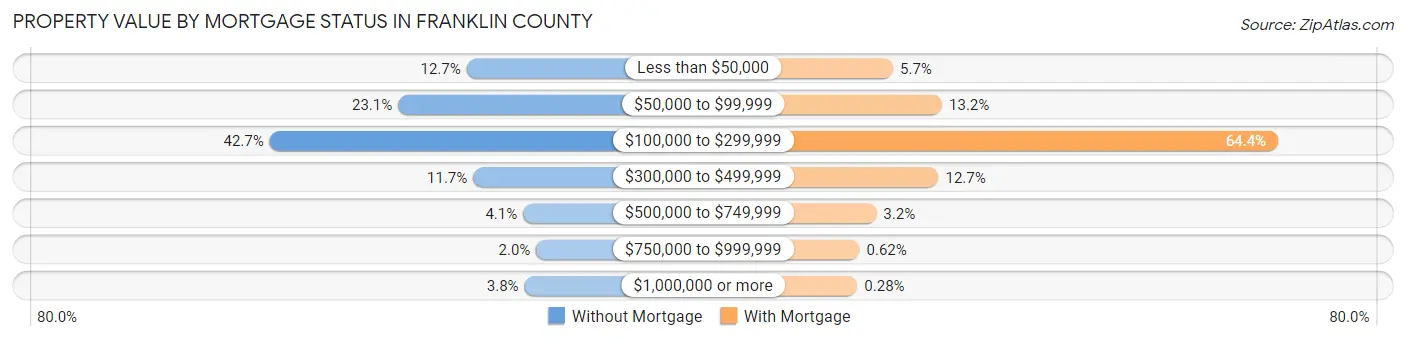
| Property Value | Without Mortgage | With Mortgage |
| Less than $50,000 | 547 (12.7%) | 284 (5.7%) |
| $50,000 to $99,999 | 999 (23.1%) | 655 (13.2%) |
| $100,000 to $299,999 | 1,845 (42.7%) | 3,196 (64.4%) |
| $300,000 to $499,999 | 504 (11.7%) | 628 (12.7%) |
| $500,000 to $749,999 | 175 (4.1%) | 158 (3.2%) |
| $750,000 to $999,999 | 88 (2.0%) | 31 (0.6%) |
| $1,000,000 or more | 166 (3.8%) | 14 (0.3%) |
| Total | 4,324 (100.0%) | 4,966 (100.0%) |
Household Income by Mortgage Status in Franklin County
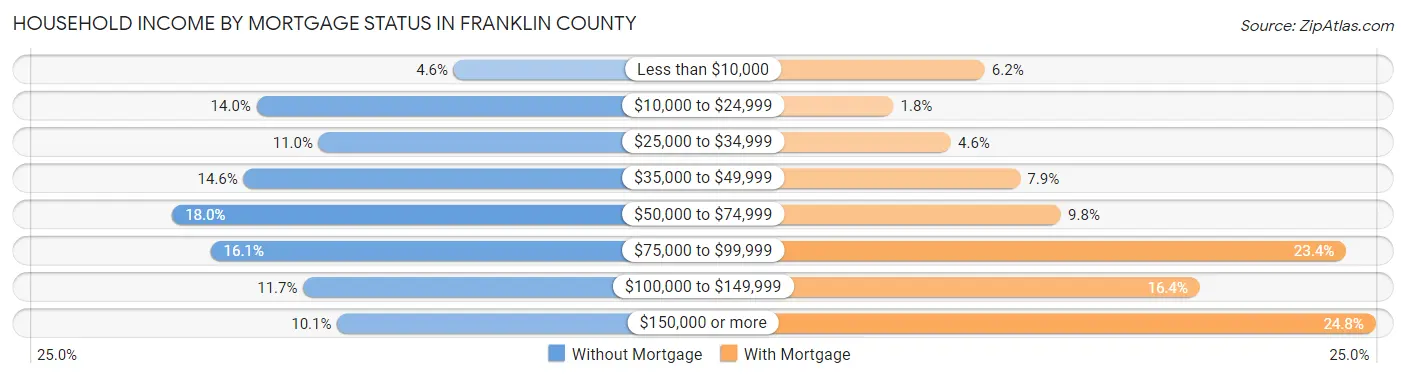
| Household Income | Without Mortgage | With Mortgage |
| Less than $10,000 | 197 (4.6%) | 306 (6.2%) |
| $10,000 to $24,999 | 603 (14.0%) | 90 (1.8%) |
| $25,000 to $34,999 | 475 (11.0%) | 226 (4.5%) |
| $35,000 to $49,999 | 630 (14.6%) | 390 (7.9%) |
| $50,000 to $74,999 | 777 (18.0%) | 486 (9.8%) |
| $75,000 to $99,999 | 698 (16.1%) | 1,160 (23.4%) |
| $100,000 to $149,999 | 507 (11.7%) | 814 (16.4%) |
| $150,000 or more | 437 (10.1%) | 1,230 (24.8%) |
| Total | 4,324 (100.0%) | 4,966 (100.0%) |
Property Value to Household Income Ratio in Franklin County
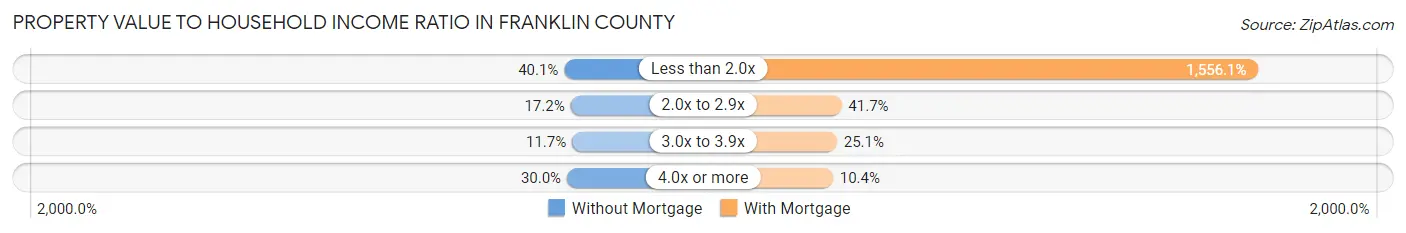
| Value-to-Income Ratio | Without Mortgage | With Mortgage |
| Less than 2.0x | 1,735 (40.1%) | 77,274 (1,556.1%) |
| 2.0x to 2.9x | 744 (17.2%) | 2,072 (41.7%) |
| 3.0x to 3.9x | 506 (11.7%) | 1,246 (25.1%) |
| 4.0x or more | 1,298 (30.0%) | 517 (10.4%) |
| Total | 4,324 (100.0%) | 4,966 (100.0%) |
Real Estate Taxes by Mortgage Status in Franklin County
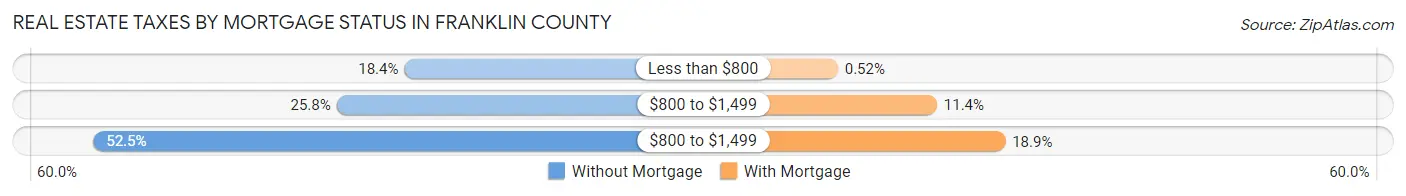
| Property Taxes | Without Mortgage | With Mortgage |
| Less than $800 | 795 (18.4%) | 26 (0.5%) |
| $800 to $1,499 | 1,116 (25.8%) | 565 (11.4%) |
| $800 to $1,499 | 2,269 (52.5%) | 937 (18.9%) |
| Total | 4,324 (100.0%) | 4,966 (100.0%) |
Health & Disability in Franklin County
Health Insurance Coverage by Age in Franklin County
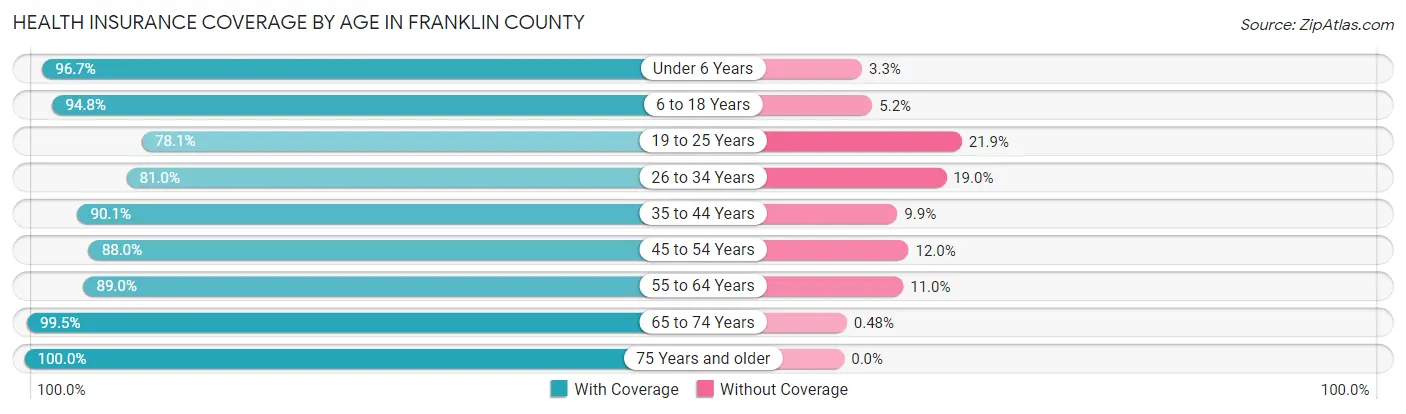
| Age Bracket | With Coverage | Without Coverage |
| Under 6 Years | 1,573 (96.7%) | 54 (3.3%) |
| 6 to 18 Years | 3,935 (94.8%) | 217 (5.2%) |
| 19 to 25 Years | 2,199 (78.1%) | 617 (21.9%) |
| 26 to 34 Years | 2,398 (81.0%) | 563 (19.0%) |
| 35 to 44 Years | 2,757 (90.1%) | 303 (9.9%) |
| 45 to 54 Years | 3,018 (88.0%) | 411 (12.0%) |
| 55 to 64 Years | 4,379 (89.0%) | 541 (11.0%) |
| 65 to 74 Years | 4,178 (99.5%) | 20 (0.5%) |
| 75 Years and older | 2,490 (100.0%) | 0 (0.0%) |
| Total | 26,927 (90.8%) | 2,726 (9.2%) |
Health Insurance Coverage by Citizenship Status in Franklin County
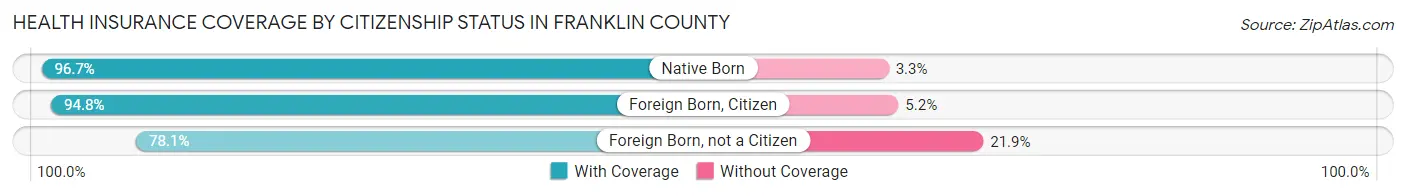
| Citizenship Status | With Coverage | Without Coverage |
| Native Born | 1,573 (96.7%) | 54 (3.3%) |
| Foreign Born, Citizen | 3,935 (94.8%) | 217 (5.2%) |
| Foreign Born, not a Citizen | 2,199 (78.1%) | 617 (21.9%) |
Health Insurance Coverage by Household Income in Franklin County
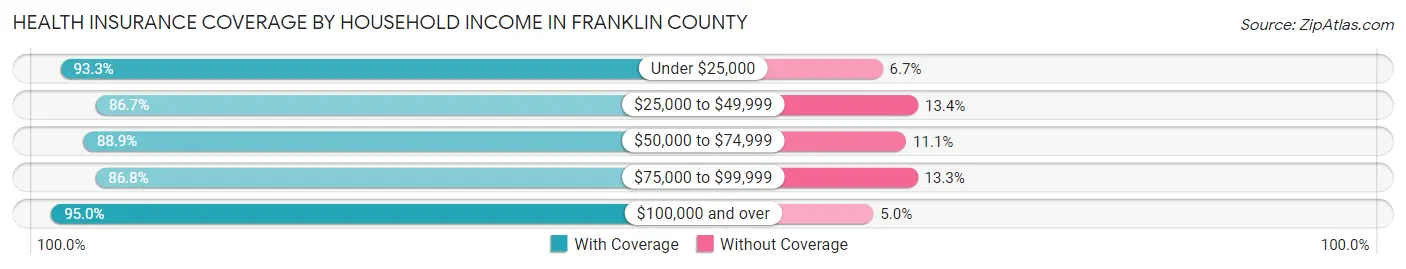
| Household Income | With Coverage | Without Coverage |
| Under $25,000 | 3,164 (93.3%) | 228 (6.7%) |
| $25,000 to $49,999 | 4,870 (86.7%) | 750 (13.4%) |
| $50,000 to $74,999 | 5,106 (88.9%) | 639 (11.1%) |
| $75,000 to $99,999 | 3,993 (86.8%) | 610 (13.3%) |
| $100,000 and over | 8,910 (95.0%) | 468 (5.0%) |
Public vs Private Health Insurance Coverage by Age in Franklin County
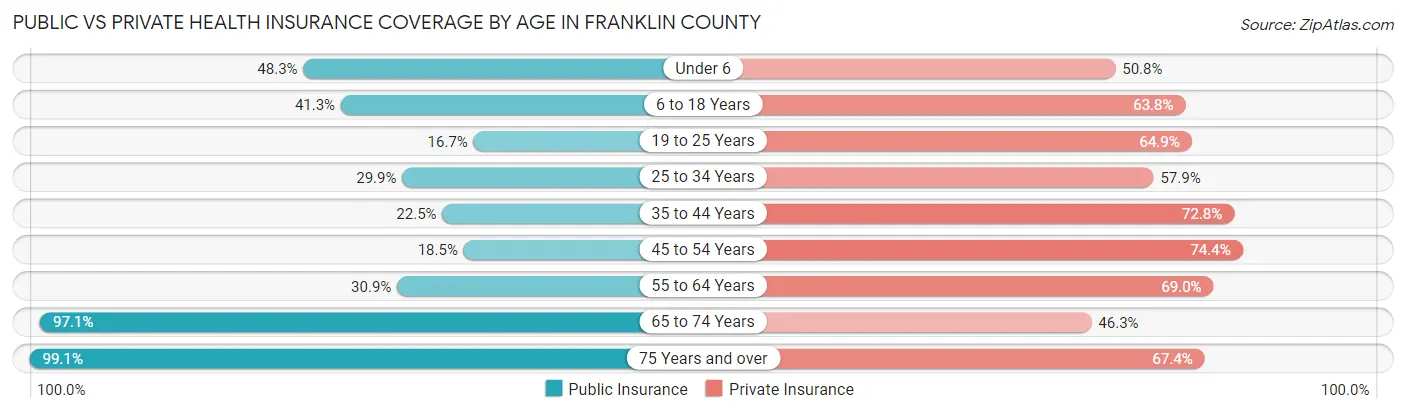
| Age Bracket | Public Insurance | Private Insurance |
| Under 6 | 785 (48.2%) | 826 (50.8%) |
| 6 to 18 Years | 1,714 (41.3%) | 2,647 (63.7%) |
| 19 to 25 Years | 469 (16.7%) | 1,828 (64.9%) |
| 25 to 34 Years | 885 (29.9%) | 1,713 (57.9%) |
| 35 to 44 Years | 687 (22.5%) | 2,228 (72.8%) |
| 45 to 54 Years | 634 (18.5%) | 2,550 (74.4%) |
| 55 to 64 Years | 1,518 (30.8%) | 3,394 (69.0%) |
| 65 to 74 Years | 4,077 (97.1%) | 1,945 (46.3%) |
| 75 Years and over | 2,467 (99.1%) | 1,677 (67.3%) |
| Total | 13,236 (44.6%) | 18,808 (63.4%) |
Disability Status by Sex by Age in Franklin County
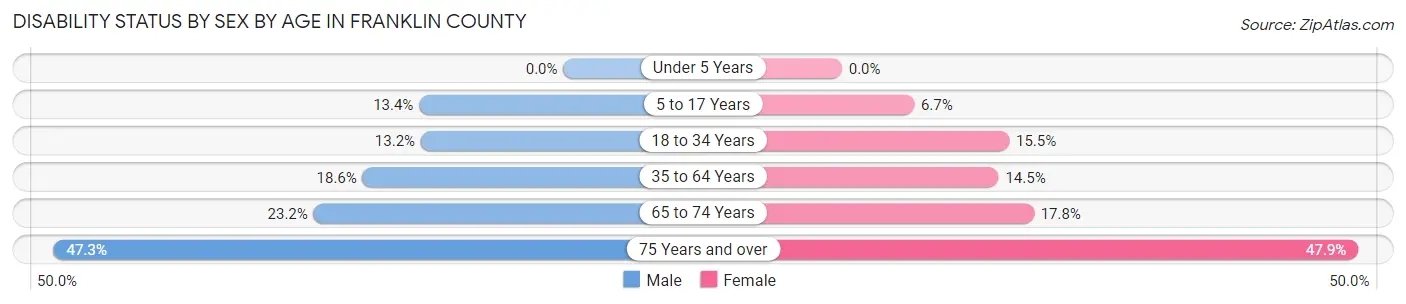
| Age Bracket | Male | Female |
| Under 5 Years | 0 (0.0%) | 0 (0.0%) |
| 5 to 17 Years | 261 (13.4%) | 128 (6.7%) |
| 18 to 34 Years | 402 (13.2%) | 515 (15.5%) |
| 35 to 64 Years | 1,053 (18.6%) | 837 (14.5%) |
| 65 to 74 Years | 485 (23.2%) | 375 (17.8%) |
| 75 Years and over | 553 (47.3%) | 633 (47.9%) |
Disability Class by Sex by Age in Franklin County
Disability Class: Hearing Difficulty
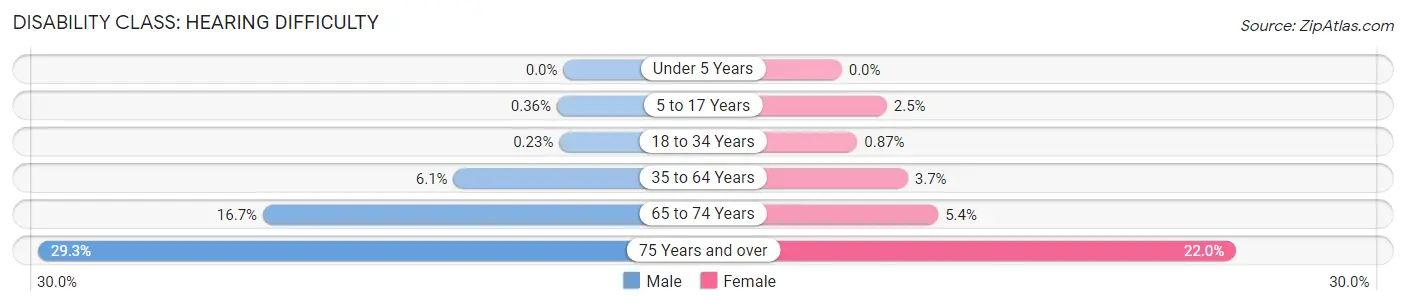
| Age Bracket | Male | Female |
| Under 5 Years | 0 (0.0%) | 0 (0.0%) |
| 5 to 17 Years | 7 (0.4%) | 48 (2.5%) |
| 18 to 34 Years | 7 (0.2%) | 29 (0.9%) |
| 35 to 64 Years | 346 (6.1%) | 212 (3.7%) |
| 65 to 74 Years | 350 (16.7%) | 113 (5.4%) |
| 75 Years and over | 342 (29.3%) | 290 (22.0%) |
Disability Class: Vision Difficulty

| Age Bracket | Male | Female |
| Under 5 Years | 0 (0.0%) | 0 (0.0%) |
| 5 to 17 Years | 0 (0.0%) | 0 (0.0%) |
| 18 to 34 Years | 6 (0.2%) | 12 (0.4%) |
| 35 to 64 Years | 129 (2.3%) | 136 (2.4%) |
| 65 to 74 Years | 16 (0.8%) | 38 (1.8%) |
| 75 Years and over | 85 (7.3%) | 105 (8.0%) |
Disability Class: Cognitive Difficulty
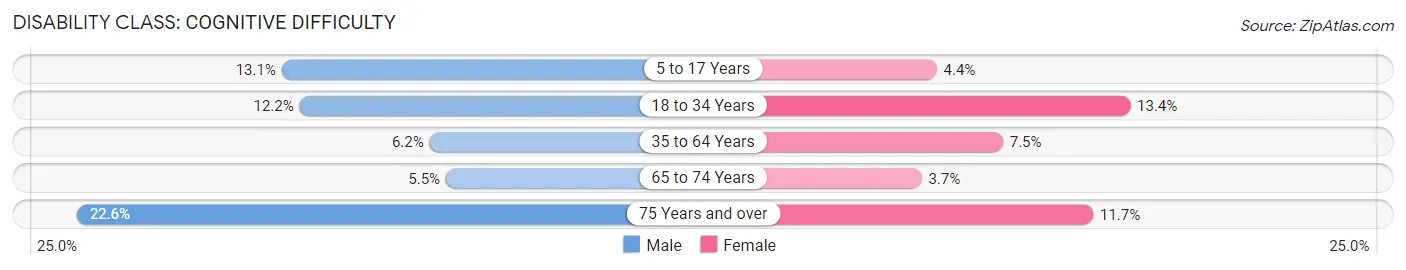
| Age Bracket | Male | Female |
| 5 to 17 Years | 255 (13.1%) | 84 (4.4%) |
| 18 to 34 Years | 372 (12.2%) | 444 (13.4%) |
| 35 to 64 Years | 351 (6.2%) | 430 (7.5%) |
| 65 to 74 Years | 114 (5.4%) | 78 (3.7%) |
| 75 Years and over | 264 (22.6%) | 154 (11.7%) |
Disability Class: Ambulatory Difficulty

| Age Bracket | Male | Female |
| 5 to 17 Years | 7 (0.4%) | 3 (0.2%) |
| 18 to 34 Years | 9 (0.3%) | 76 (2.3%) |
| 35 to 64 Years | 543 (9.6%) | 390 (6.8%) |
| 65 to 74 Years | 216 (10.3%) | 190 (9.0%) |
| 75 Years and over | 269 (23.0%) | 499 (37.8%) |
Disability Class: Self-Care Difficulty
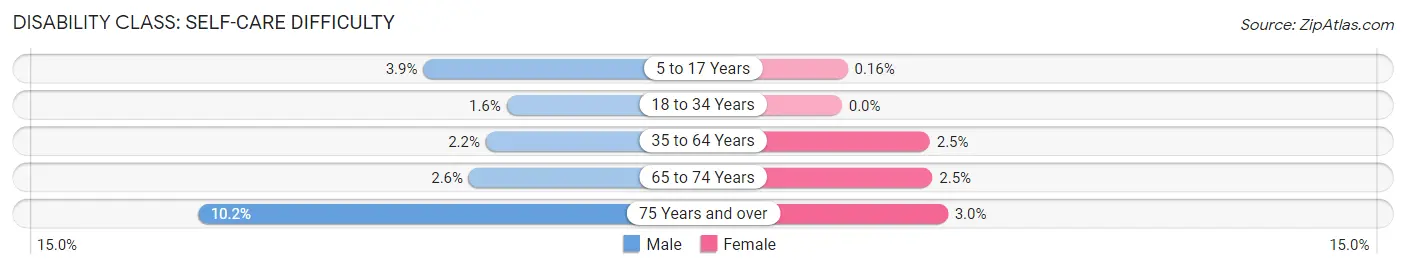
| Age Bracket | Male | Female |
| 5 to 17 Years | 76 (3.9%) | 3 (0.2%) |
| 18 to 34 Years | 48 (1.6%) | 0 (0.0%) |
| 35 to 64 Years | 122 (2.2%) | 141 (2.5%) |
| 65 to 74 Years | 55 (2.6%) | 53 (2.5%) |
| 75 Years and over | 119 (10.2%) | 39 (2.9%) |
Technology Access in Franklin County
Computing Device Access in Franklin County
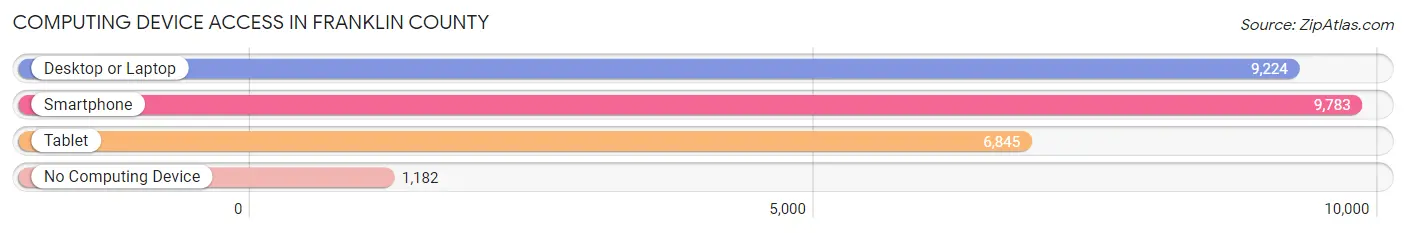
| Device Type | # Households | % Households |
| Desktop or Laptop | 9,224 | 75.1% |
| Smartphone | 9,783 | 79.7% |
| Tablet | 6,845 | 55.8% |
| No Computing Device | 1,182 | 9.6% |
| Total | 12,276 | 100.0% |
Internet Access in Franklin County
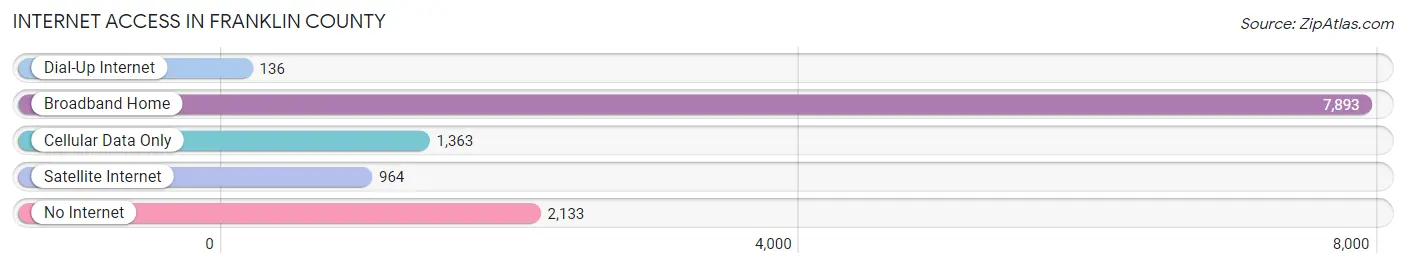
| Internet Type | # Households | % Households |
| Dial-Up Internet | 136 | 1.1% |
| Broadband Home | 7,893 | 64.3% |
| Cellular Data Only | 1,363 | 11.1% |
| Satellite Internet | 964 | 7.9% |
| No Internet | 2,133 | 17.4% |
| Total | 12,276 | 100.0% |
Franklin County Summary
Franklin County, Maine is located in the northern part of the state and is bordered by Oxford County to the west, Somerset County to the east, and Kennebec County to the south. The county seat is Farmington, and the county is home to a population of 30,768 people, according to the 2010 census.
History
Franklin County was established in 1838 from parts of Kennebec and Somerset counties. The county was named after Benjamin Franklin, one of the Founding Fathers of the United States. The county was originally home to the Abenaki Native American tribe, who lived in the area for thousands of years before the arrival of European settlers.
The first European settlers arrived in the area in the late 1700s, and the county was officially established in 1838. The county was primarily agricultural, with small towns and villages scattered throughout the area. The county was also home to several mills, which provided employment for many of the residents.
Geography
Franklin County is located in the northern part of Maine and is bordered by Oxford County to the west, Somerset County to the east, and Kennebec County to the south. The county covers an area of 1,717 square miles and is the fourth largest county in the state.
The county is mostly rural, with small towns and villages scattered throughout the area. The highest point in the county is Mount Blue, which has an elevation of 2,743 feet. The county is home to several rivers, including the Sandy River, the Androscoggin River, and the Kennebec River.
Economy
Franklin County is primarily rural, and the economy is largely based on agriculture and forestry. The county is home to several farms, which produce a variety of crops, including potatoes, corn, hay, and apples. The county is also home to several lumber mills, which produce lumber for the construction industry.
The county is also home to several manufacturing companies, which produce a variety of products, including paper products, furniture, and textiles. The county is also home to several tourist attractions, including the Franklin County Historical Society Museum, the Franklin County Fair, and the Franklin County Fairgrounds.
Demographics
According to the 2010 census, Franklin County had a population of 30,768 people. The population was spread out, with 24.3% under the age of 18, 8.2% from 18 to 24, 28.2% from 25 to 44, 24.7% from 45 to 64, and 14.6% who were 65 years of age or older. The median age was 38.7 years.
The median income for a household in the county was $41,945, and the median income for a family was $50,945. The per capita income for the county was $20,945. About 11.2% of the population was below the poverty line.
Conclusion
Franklin County, Maine is a rural county located in the northern part of the state. The county was established in 1838 and is home to a population of 30,768 people, according to the 2010 census. The economy of the county is largely based on agriculture and forestry, and the county is home to several tourist attractions. The median income for a household in the county was $41,945, and the median income for a family was $50,945.
Common Questions
What is the Total Population of Franklin County?
Total Population of Franklin County is 29,839.
What is the Total Male Population of Franklin County?
Total Male Population of Franklin County is 14,662.
What is the Total Female Population of Franklin County?
Total Female Population of Franklin County is 15,177.
What is the Ratio of Males per 100 Females in Franklin County?
There are 96.61 Males per 100 Females in Franklin County.
What is the Ratio of Females per 100 Males in Franklin County?
There are 103.51 Females per 100 Males in Franklin County.
What is the Median Population Age in Franklin County?
Median Population Age in Franklin County is 46.3 Years.
What is the Average Family Size in Franklin County
Average Family Size in Franklin County is 3.0 People.
What is the Average Household Size in Franklin County
Average Household Size in Franklin County is 2.3 People.
What is Per Capita Income in Franklin County?
Per Capita income in Franklin County is $33,161.
What is the Median Family Income in Franklin County?
Median Family Income in Franklin County is $75,776.
What is the Median Household income in Franklin County?
Median Household Income in Franklin County is $56,890.
What is Income or Wage Gap in Franklin County?
Income or Wage Gap in Franklin County is 36.5%.
Women in Franklin County earn 63.5 cents for every dollar earned by a man.
What is Family Income Deficit in Franklin County?
Family Income Deficit in Franklin County is $9,659.
Families that are below poverty line in Franklin County earn $9,659 less on average than the poverty threshold level.
What is Inequality or Gini Index in Franklin County?
Inequality or Gini Index in Franklin County is 0.45.
How Large is the Labor Force in Franklin County?
There are 14,653 People in the Labor Forcein in Franklin County.
What is the Percentage of People in the Labor Force in Franklin County?
57.8% of People are in the Labor Force in Franklin County.
What is the Unemployment Rate in Franklin County?
Unemployment Rate in Franklin County is 4.4%.