Androscoggin County, ME
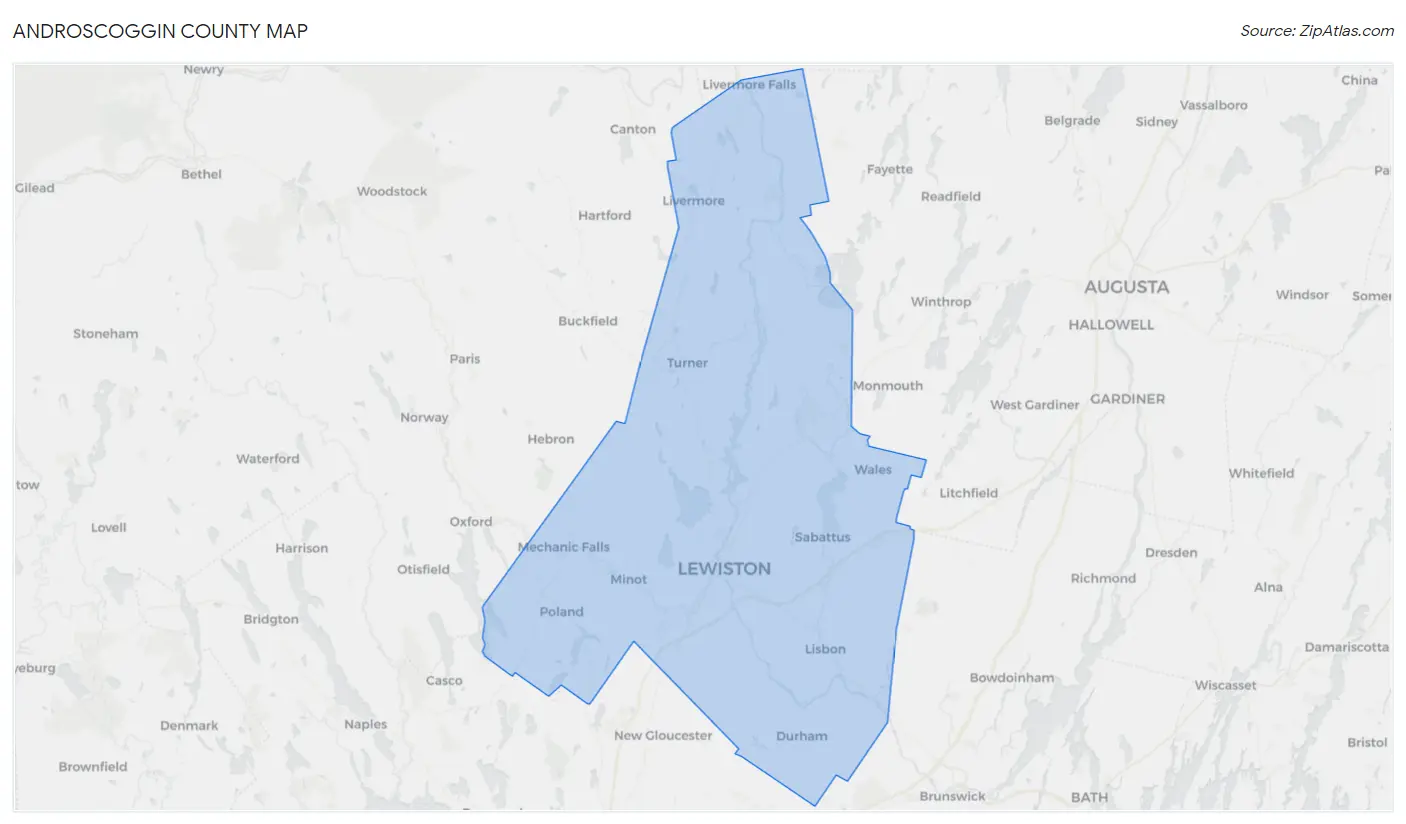
Androscoggin County Map
Androscoggin County Overview
111,532
TOTAL POPULATION
54,855
MALE POPULATION
56,677
FEMALE POPULATION
96.79
MALES / 100 FEMALES
103.32
FEMALES / 100 MALES
40.8
MEDIAN AGE
3.0
AVG FAMILY SIZE
2.4
AVG HOUSEHOLD SIZE
$34,273
PER CAPITA INCOME
$82,684
AVG FAMILY INCOME
$64,500
AVG HOUSEHOLD INCOME
18.9%
WAGE / INCOME GAP [ % ]
81.1¢/ $1
WAGE / INCOME GAP [ $ ]
$9,131
FAMILY INCOME DEFICIT
0.43
INEQUALITY / GINI INDEX
58,934
LABOR FORCE [ PEOPLE ]
65.0%
PERCENT IN LABOR FORCE
4.8%
UNEMPLOYMENT RATE
Androscoggin County Area Codes
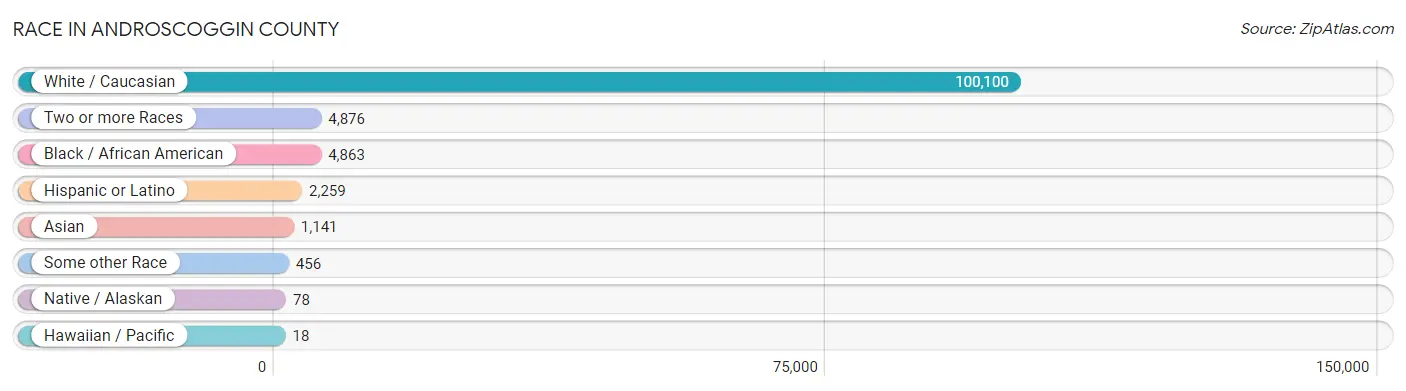
Race in Androscoggin County
The most populous races in Androscoggin County are White / Caucasian (100,100 | 89.7%), Two or more Races (4,876 | 4.4%), and Black / African American (4,863 | 4.4%).
| Race | # Population | % Population |
| Asian | 1,141 | 1.0% |
| Black / African American | 4,863 | 4.4% |
| Hawaiian / Pacific | 18 | 0.0% |
| Hispanic or Latino | 2,259 | 2.0% |
| Native / Alaskan | 78 | 0.1% |
| White / Caucasian | 100,100 | 89.7% |
| Two or more Races | 4,876 | 4.4% |
| Some other Race | 456 | 0.4% |
| Total | 111,532 | 100.0% |
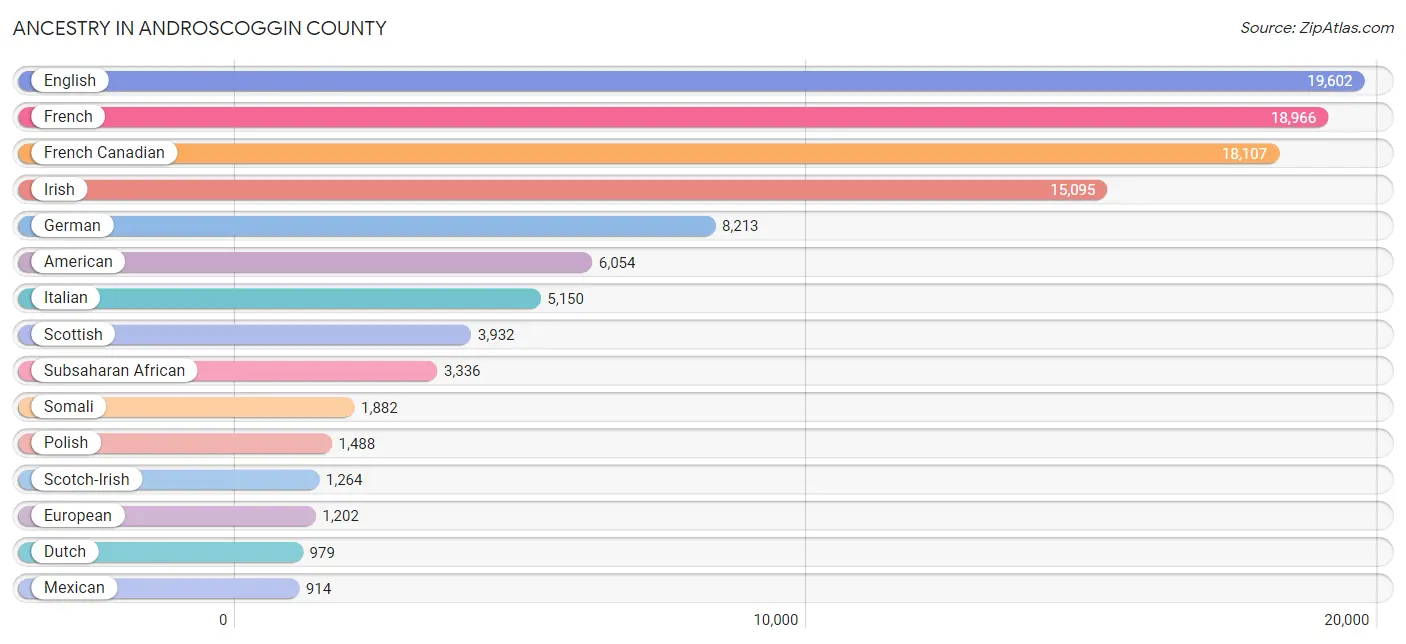
Ancestry in Androscoggin County
The most populous ancestries reported in Androscoggin County are English (19,602 | 17.6%), French (18,966 | 17.0%), French Canadian (18,107 | 16.2%), Irish (15,095 | 13.5%), and German (8,213 | 7.4%), together accounting for 71.7% of all Androscoggin County residents.
| Ancestry | # Population | % Population |
| Afghan | 5 | 0.0% |
| African | 293 | 0.3% |
| Albanian | 16 | 0.0% |
| American | 6,054 | 5.4% |
| Arab | 394 | 0.4% |
| Armenian | 72 | 0.1% |
| Australian | 64 | 0.1% |
| Austrian | 129 | 0.1% |
| Belgian | 135 | 0.1% |
| Bhutanese | 151 | 0.1% |
| Blackfeet | 11 | 0.0% |
| Bolivian | 85 | 0.1% |
| Brazilian | 103 | 0.1% |
| British | 460 | 0.4% |
| Burmese | 387 | 0.4% |
| Cajun | 8 | 0.0% |
| Canadian | 770 | 0.7% |
| Cape Verdean | 7 | 0.0% |
| Celtic | 4 | 0.0% |
| Central American | 161 | 0.1% |
| Central American Indian | 26 | 0.0% |
| Cherokee | 215 | 0.2% |
| Chickasaw | 7 | 0.0% |
| Chilean | 35 | 0.0% |
| Chippewa | 48 | 0.0% |
| Colombian | 58 | 0.1% |
| Costa Rican | 40 | 0.0% |
| Croatian | 28 | 0.0% |
| Cuban | 108 | 0.1% |
| Czech | 86 | 0.1% |
| Czechoslovakian | 80 | 0.1% |
| Danish | 274 | 0.3% |
| Dominican | 146 | 0.1% |
| Dutch | 979 | 0.9% |
| Eastern European | 199 | 0.2% |
| Ecuadorian | 123 | 0.1% |
| Egyptian | 2 | 0.0% |
| English | 19,602 | 17.6% |
| Ethiopian | 12 | 0.0% |
| European | 1,202 | 1.1% |
| Finnish | 477 | 0.4% |
| French | 18,966 | 17.0% |
| French American Indian | 24 | 0.0% |
| French Canadian | 18,107 | 16.2% |
| German | 8,213 | 7.4% |
| Greek | 334 | 0.3% |
| Guatemalan | 17 | 0.0% |
| Guyanese | 60 | 0.1% |
| Haitian | 12 | 0.0% |
| Honduran | 3 | 0.0% |
| Hungarian | 89 | 0.1% |
| Icelander | 5 | 0.0% |
| Indian (Asian) | 452 | 0.4% |
| Inupiat | 9 | 0.0% |
| Irish | 15,095 | 13.5% |
| Iroquois | 24 | 0.0% |
| Italian | 5,150 | 4.6% |
| Jamaican | 184 | 0.2% |
| Kenyan | 64 | 0.1% |
| Korean | 263 | 0.2% |
| Lebanese | 123 | 0.1% |
| Lithuanian | 256 | 0.2% |
| Mexican | 914 | 0.8% |
| Moroccan | 16 | 0.0% |
| Native Hawaiian | 9 | 0.0% |
| Nicaraguan | 22 | 0.0% |
| Nigerian | 278 | 0.3% |
| Northern European | 156 | 0.1% |
| Norwegian | 406 | 0.4% |
| Pakistani | 83 | 0.1% |
| Panamanian | 26 | 0.0% |
| Pennsylvania German | 4 | 0.0% |
| Peruvian | 44 | 0.0% |
| Polish | 1,488 | 1.3% |
| Portuguese | 437 | 0.4% |
| Puerto Rican | 516 | 0.5% |
| Romanian | 31 | 0.0% |
| Russian | 266 | 0.2% |
| Salvadoran | 53 | 0.1% |
| Scandinavian | 213 | 0.2% |
| Scotch-Irish | 1,264 | 1.1% |
| Scottish | 3,932 | 3.5% |
| Seminole | 5 | 0.0% |
| Serbian | 101 | 0.1% |
| Sioux | 8 | 0.0% |
| Slovak | 295 | 0.3% |
| Slovene | 4 | 0.0% |
| Somali | 1,882 | 1.7% |
| South American | 356 | 0.3% |
| South American Indian | 35 | 0.0% |
| Spaniard | 30 | 0.0% |
| Spanish | 18 | 0.0% |
| Sri Lankan | 176 | 0.2% |
| Subsaharan African | 3,336 | 3.0% |
| Sudanese | 1 | 0.0% |
| Swedish | 862 | 0.8% |
| Swiss | 27 | 0.0% |
| Syrian | 11 | 0.0% |
| Thai | 337 | 0.3% |
| Trinidadian and Tobagonian | 63 | 0.1% |
| Turkish | 48 | 0.0% |
| Ukrainian | 175 | 0.2% |
| Uruguayan | 10 | 0.0% |
| Venezuelan | 1 | 0.0% |
| Welsh | 521 | 0.5% |
| Zimbabwean | 27 | 0.0% | View All 106 Rows |
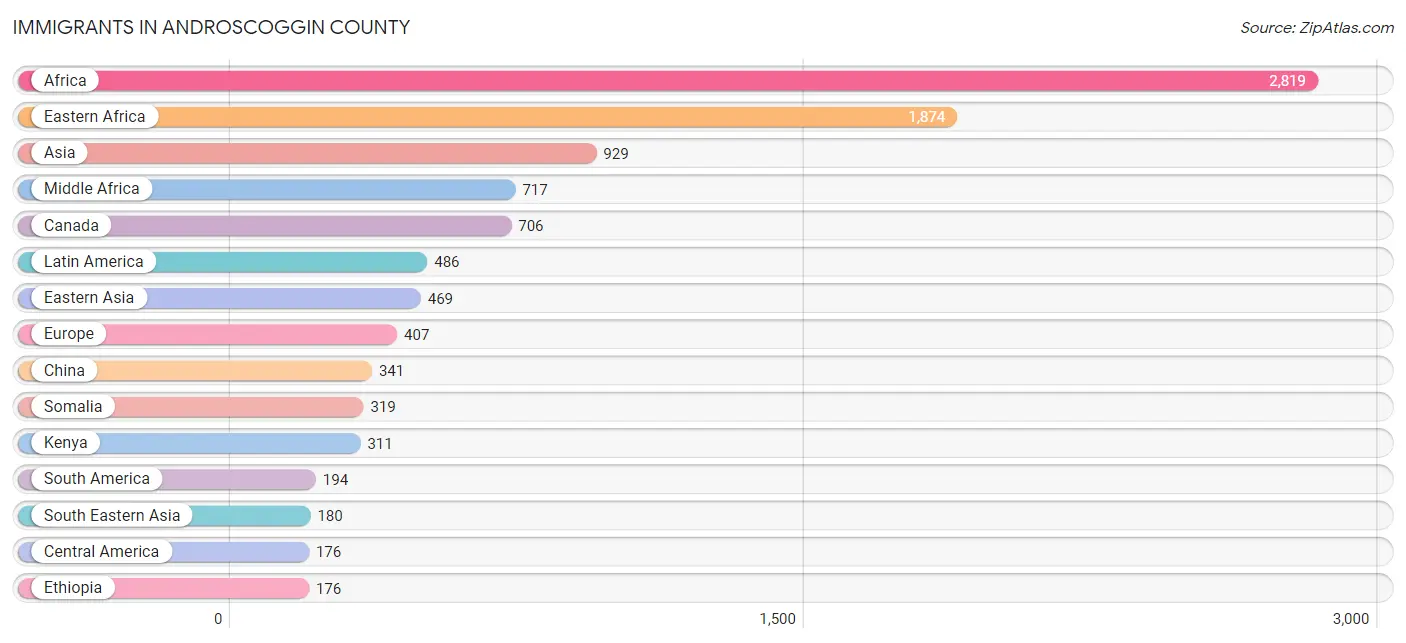
Immigrants in Androscoggin County
The most numerous immigrant groups reported in Androscoggin County came from Africa (2,819 | 2.5%), Eastern Africa (1,874 | 1.7%), Asia (929 | 0.8%), Middle Africa (717 | 0.6%), and Canada (706 | 0.6%), together accounting for 6.3% of all Androscoggin County residents.
| Immigration Origin | # Population | % Population |
| Afghanistan | 5 | 0.0% |
| Africa | 2,819 | 2.5% |
| Asia | 929 | 0.8% |
| Australia | 8 | 0.0% |
| Bangladesh | 108 | 0.1% |
| Bolivia | 24 | 0.0% |
| Brazil | 64 | 0.1% |
| Canada | 706 | 0.6% |
| Caribbean | 116 | 0.1% |
| Central America | 176 | 0.2% |
| China | 341 | 0.3% |
| Colombia | 15 | 0.0% |
| Congo | 61 | 0.1% |
| Costa Rica | 7 | 0.0% |
| Dominican Republic | 46 | 0.0% |
| Eastern Africa | 1,874 | 1.7% |
| Eastern Asia | 469 | 0.4% |
| Eastern Europe | 142 | 0.1% |
| Ecuador | 56 | 0.1% |
| El Salvador | 5 | 0.0% |
| England | 41 | 0.0% |
| Ethiopia | 176 | 0.2% |
| Europe | 407 | 0.4% |
| France | 26 | 0.0% |
| Germany | 124 | 0.1% |
| Ghana | 29 | 0.0% |
| Greece | 9 | 0.0% |
| Guatemala | 8 | 0.0% |
| India | 46 | 0.0% |
| Jamaica | 48 | 0.0% |
| Japan | 22 | 0.0% |
| Kenya | 311 | 0.3% |
| Korea | 106 | 0.1% |
| Latin America | 486 | 0.4% |
| Lithuania | 13 | 0.0% |
| Mexico | 156 | 0.1% |
| Middle Africa | 717 | 0.6% |
| Netherlands | 21 | 0.0% |
| Nigeria | 109 | 0.1% |
| Northern Europe | 85 | 0.1% |
| Norway | 29 | 0.0% |
| Oceania | 8 | 0.0% |
| Pakistan | 1 | 0.0% |
| Peru | 34 | 0.0% |
| Philippines | 58 | 0.1% |
| Poland | 37 | 0.0% |
| Russia | 8 | 0.0% |
| Saudi Arabia | 101 | 0.1% |
| Somalia | 319 | 0.3% |
| South Africa | 24 | 0.0% |
| South America | 194 | 0.2% |
| South Central Asia | 160 | 0.1% |
| South Eastern Asia | 180 | 0.2% |
| Southern Europe | 9 | 0.0% |
| St. Vincent and the Grenadines | 22 | 0.0% |
| Taiwan | 14 | 0.0% |
| Thailand | 43 | 0.0% |
| Turkey | 19 | 0.0% |
| Ukraine | 25 | 0.0% |
| Venezuela | 1 | 0.0% |
| Vietnam | 60 | 0.1% |
| Western Africa | 159 | 0.1% |
| Western Asia | 120 | 0.1% |
| Western Europe | 171 | 0.2% |
| Zaire | 75 | 0.1% |
| Zimbabwe | 22 | 0.0% | View All 66 Rows |
Sex and Age in Androscoggin County
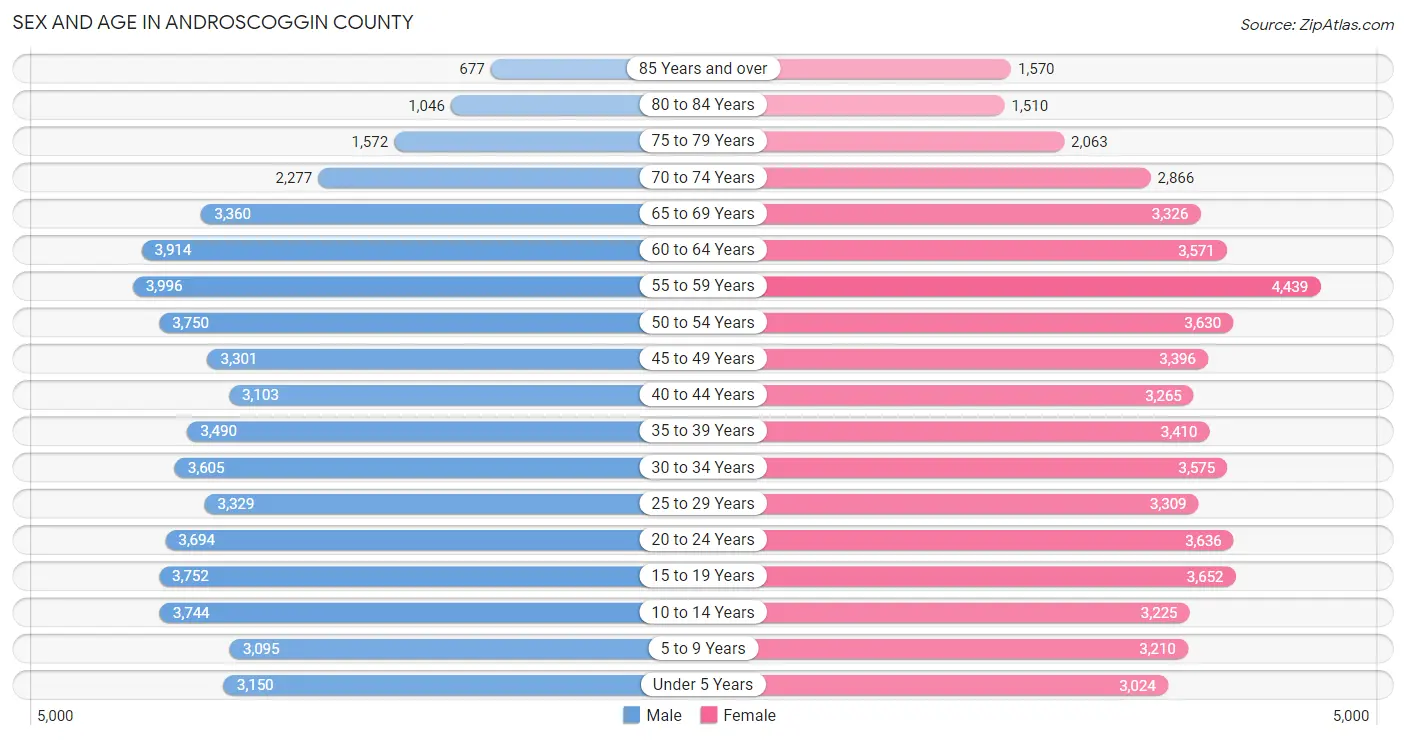
Sex and Age in Androscoggin County
The most populous age groups in Androscoggin County are 55 to 59 Years (3,996 | 7.3%) for men and 55 to 59 Years (4,439 | 7.8%) for women.
| Age Bracket | Male | Female |
| Under 5 Years | 3,150 (5.7%) | 3,024 (5.3%) |
| 5 to 9 Years | 3,095 (5.6%) | 3,210 (5.7%) |
| 10 to 14 Years | 3,744 (6.8%) | 3,225 (5.7%) |
| 15 to 19 Years | 3,752 (6.8%) | 3,652 (6.4%) |
| 20 to 24 Years | 3,694 (6.7%) | 3,636 (6.4%) |
| 25 to 29 Years | 3,329 (6.1%) | 3,309 (5.8%) |
| 30 to 34 Years | 3,605 (6.6%) | 3,575 (6.3%) |
| 35 to 39 Years | 3,490 (6.4%) | 3,410 (6.0%) |
| 40 to 44 Years | 3,103 (5.7%) | 3,265 (5.8%) |
| 45 to 49 Years | 3,301 (6.0%) | 3,396 (6.0%) |
| 50 to 54 Years | 3,750 (6.8%) | 3,630 (6.4%) |
| 55 to 59 Years | 3,996 (7.3%) | 4,439 (7.8%) |
| 60 to 64 Years | 3,914 (7.1%) | 3,571 (6.3%) |
| 65 to 69 Years | 3,360 (6.1%) | 3,326 (5.9%) |
| 70 to 74 Years | 2,277 (4.2%) | 2,866 (5.1%) |
| 75 to 79 Years | 1,572 (2.9%) | 2,063 (3.6%) |
| 80 to 84 Years | 1,046 (1.9%) | 1,510 (2.7%) |
| 85 Years and over | 677 (1.2%) | 1,570 (2.8%) |
| Total | 54,855 (100.0%) | 56,677 (100.0%) |
Families and Households in Androscoggin County
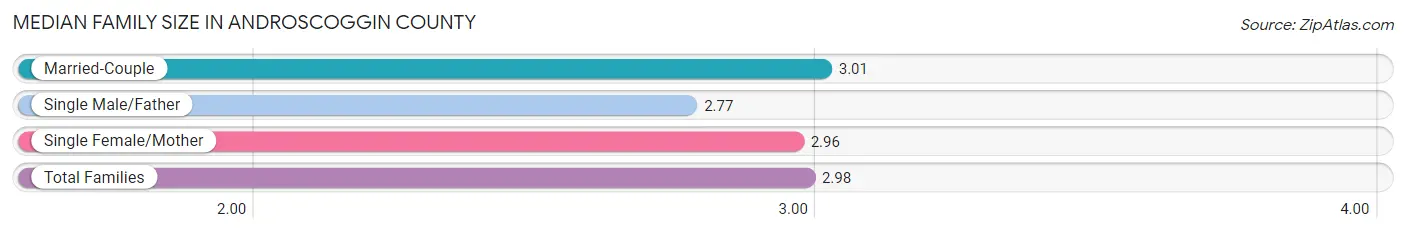
Median Family Size in Androscoggin County
The median family size in Androscoggin County is 2.98 persons per family, with married-couple families (20,761 | 75.3%) accounting for the largest median family size of 3.01 persons per family. On the other hand, single male/father families (2,061 | 7.5%) represent the smallest median family size with 2.77 persons per family.
| Family Type | # Families | Family Size |
| Married-Couple | 20,761 (75.3%) | 3.01 |
| Single Male/Father | 2,061 (7.5%) | 2.77 |
| Single Female/Mother | 4,731 (17.2%) | 2.96 |
| Total Families | 27,553 (100.0%) | 2.98 |
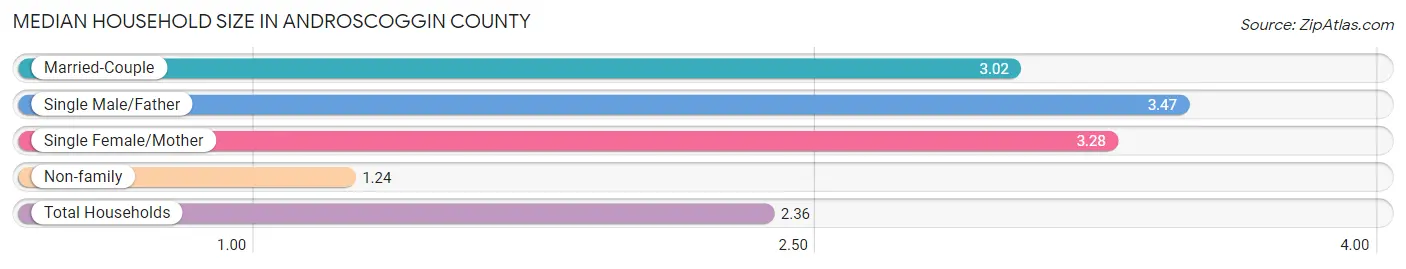
Median Household Size in Androscoggin County
The median household size in Androscoggin County is 2.36 persons per household, with single male/father households (2,061 | 4.5%) accounting for the largest median household size of 3.47 persons per household. non-family households (18,272 | 39.9%) represent the smallest median household size with 1.24 persons per household.
| Household Type | # Households | Household Size |
| Married-Couple | 20,761 (45.3%) | 3.02 |
| Single Male/Father | 2,061 (4.5%) | 3.47 |
| Single Female/Mother | 4,731 (10.3%) | 3.28 |
| Non-family | 18,272 (39.9%) | 1.24 |
| Total Households | 45,825 (100.0%) | 2.36 |
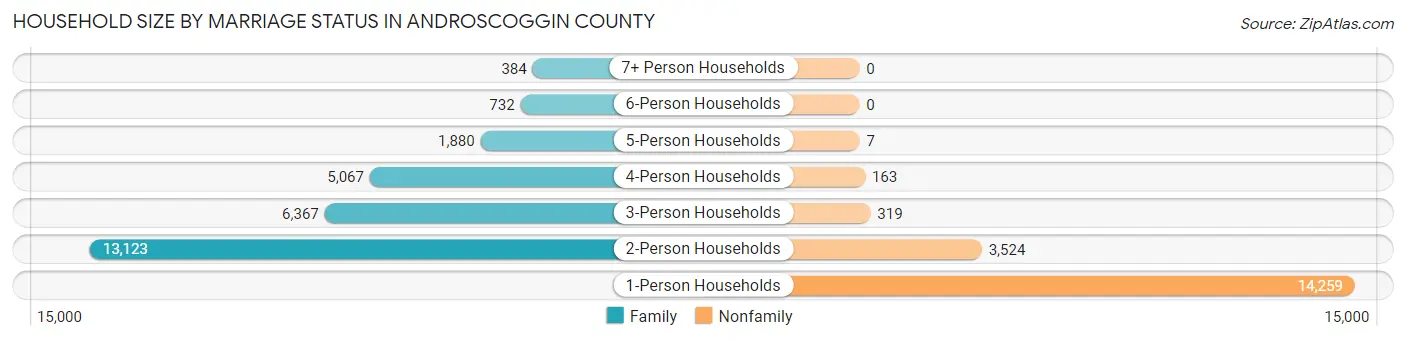
Household Size by Marriage Status in Androscoggin County
Out of a total of 45,825 households in Androscoggin County, 27,553 (60.1%) are family households, while 18,272 (39.9%) are nonfamily households. The most numerous type of family households are 2-person households, comprising 13,123, and the most common type of nonfamily households are 1-person households, comprising 14,259.
| Household Size | Family Households | Nonfamily Households |
| 1-Person Households | - | 14,259 (31.1%) |
| 2-Person Households | 13,123 (28.6%) | 3,524 (7.7%) |
| 3-Person Households | 6,367 (13.9%) | 319 (0.7%) |
| 4-Person Households | 5,067 (11.1%) | 163 (0.4%) |
| 5-Person Households | 1,880 (4.1%) | 7 (0.0%) |
| 6-Person Households | 732 (1.6%) | 0 (0.0%) |
| 7+ Person Households | 384 (0.8%) | 0 (0.0%) |
| Total | 27,553 (60.1%) | 18,272 (39.9%) |
Female Fertility in Androscoggin County
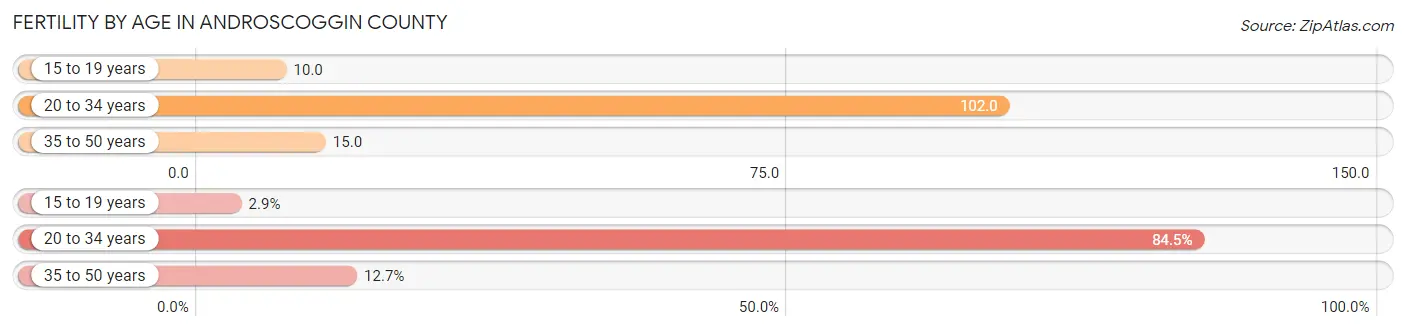
Fertility by Age in Androscoggin County
Average fertility rate in Androscoggin County is 51.0 births per 1,000 women. Women in the age bracket of 20 to 34 years have the highest fertility rate with 102.0 births per 1,000 women. Women in the age bracket of 20 to 34 years acount for 84.5% of all women with births.
| Age Bracket | Women with Births | Births / 1,000 Women |
| 15 to 19 years | 36 (2.9%) | 10.0 |
| 20 to 34 years | 1,069 (84.5%) | 102.0 |
| 35 to 50 years | 160 (12.7%) | 15.0 |
| Total | 1,265 (100.0%) | 51.0 |
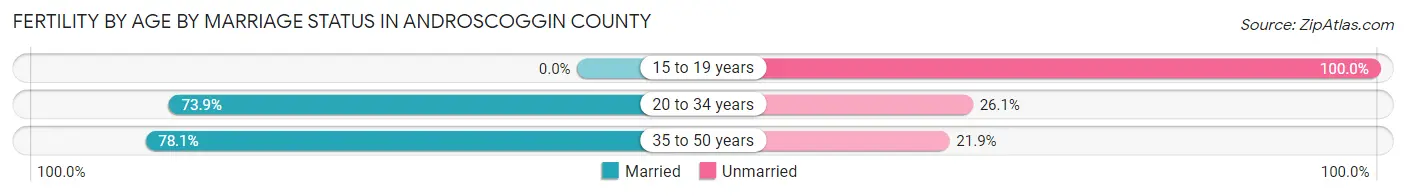
Fertility by Age by Marriage Status in Androscoggin County
72.3% of women with births (1,265) in Androscoggin County are married. The highest percentage of unmarried women with births falls into 15 to 19 years age bracket with 100.0% of them unmarried at the time of birth, while the lowest percentage of unmarried women with births belong to 35 to 50 years age bracket with 21.9% of them unmarried.
| Age Bracket | Married | Unmarried |
| 15 to 19 years | 0 (0.0%) | 36 (100.0%) |
| 20 to 34 years | 790 (73.9%) | 279 (26.1%) |
| 35 to 50 years | 125 (78.1%) | 35 (21.9%) |
| Total | 915 (72.3%) | 350 (27.7%) |
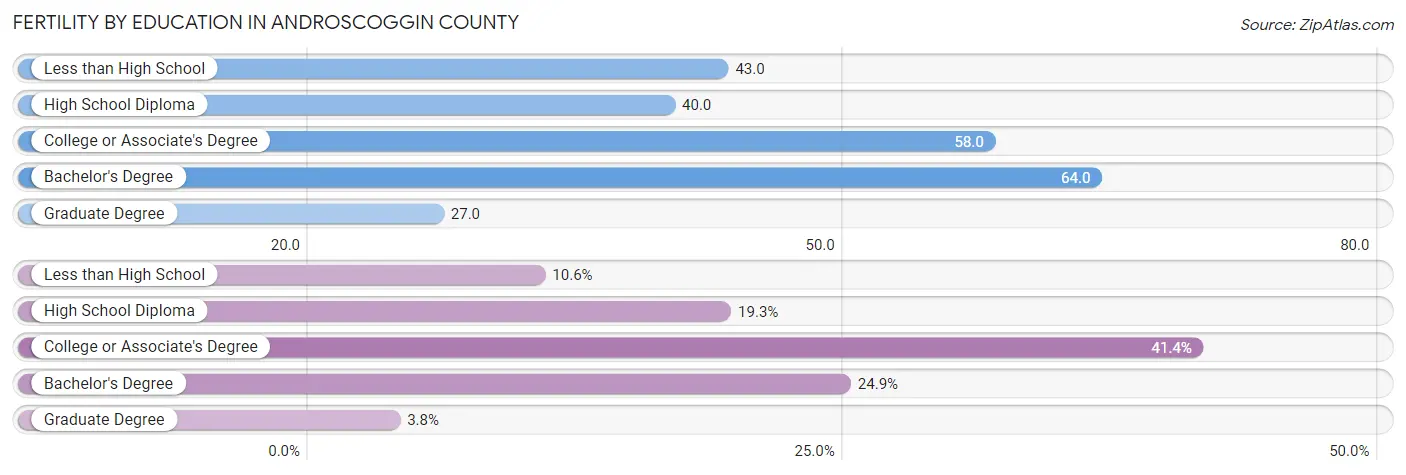
Fertility by Education in Androscoggin County
Average fertility rate in Androscoggin County is 51.0 births per 1,000 women. Women with the education attainment of bachelor's degree have the highest fertility rate of 64.0 births per 1,000 women, while women with the education attainment of graduate degree have the lowest fertility at 27.0 births per 1,000 women. Women with the education attainment of college or associate's degree represent 41.4% of all women with births.
| Educational Attainment | Women with Births | Births / 1,000 Women |
| Less than High School | 134 (10.6%) | 43.0 |
| High School Diploma | 244 (19.3%) | 40.0 |
| College or Associate's Degree | 524 (41.4%) | 58.0 |
| Bachelor's Degree | 315 (24.9%) | 64.0 |
| Graduate Degree | 48 (3.8%) | 27.0 |
| Total | 1,265 (100.0%) | 51.0 |
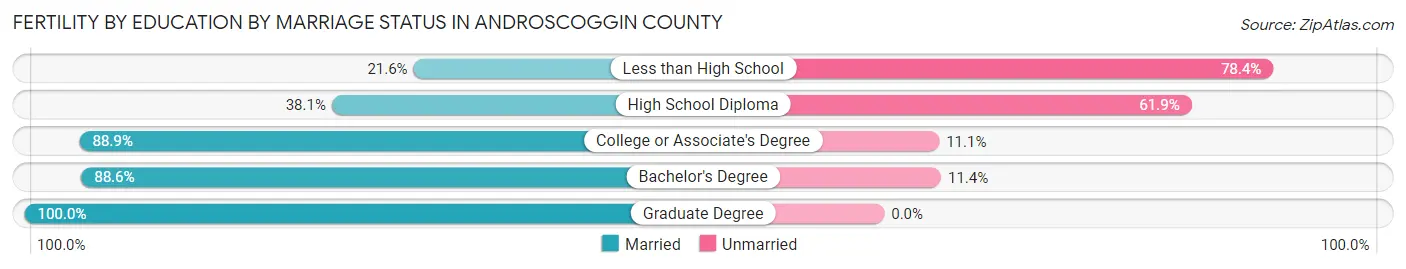
Fertility by Education by Marriage Status in Androscoggin County
27.7% of women with births in Androscoggin County are unmarried. Women with the educational attainment of graduate degree are most likely to be married with 100.0% of them married at childbirth, while women with the educational attainment of less than high school are least likely to be married with 78.4% of them unmarried at childbirth.
| Educational Attainment | Married | Unmarried |
| Less than High School | 29 (21.6%) | 105 (78.4%) |
| High School Diploma | 93 (38.1%) | 151 (61.9%) |
| College or Associate's Degree | 466 (88.9%) | 58 (11.1%) |
| Bachelor's Degree | 279 (88.6%) | 36 (11.4%) |
| Graduate Degree | 48 (100.0%) | 0 (0.0%) |
| Total | 915 (72.3%) | 350 (27.7%) |
Income in Androscoggin County
Income Overview in Androscoggin County
Per Capita Income in Androscoggin County is $34,273, while median incomes of families and households are $82,684 and $64,500 respectively.
| Characteristic | Number | Measure |
| Per Capita Income | 111,532 | $34,273 |
| Median Family Income | 27,553 | $82,684 |
| Mean Family Income | 27,553 | $100,113 |
| Median Household Income | 45,825 | $64,500 |
| Mean Household Income | 45,825 | $82,809 |
| Income Deficit | 27,553 | $9,131 |
| Wage / Income Gap (%) | 111,532 | 18.95% |
| Wage / Income Gap ($) | 111,532 | 81.05¢ per $1 |
| Gini / Inequality Index | 111,532 | 0.43 |
Earnings by Sex in Androscoggin County
Average Earnings in Androscoggin County are $39,659, $43,674 for men and $35,399 for women, a difference of 19.0%.
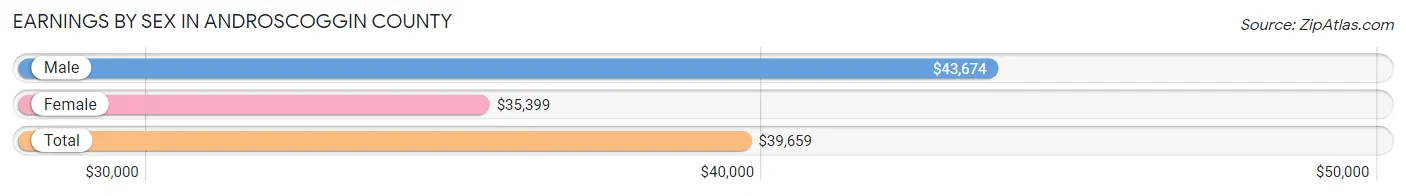
| Sex | Number | Average Earnings |
| Male | 31,946 (51.2%) | $43,674 |
| Female | 30,457 (48.8%) | $35,399 |
| Total | 62,403 (100.0%) | $39,659 |
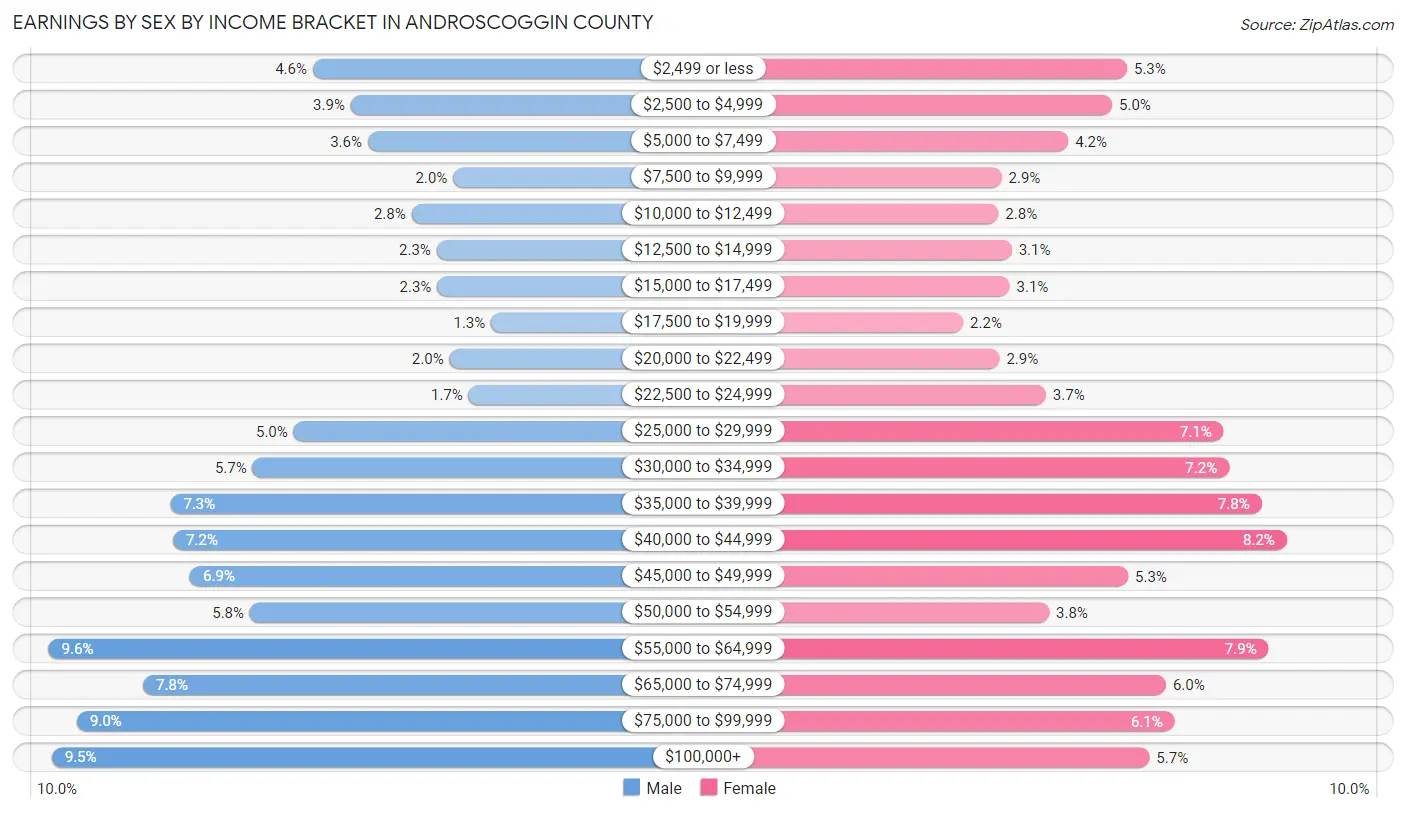
Earnings by Sex by Income Bracket in Androscoggin County
The most common earnings brackets in Androscoggin County are $55,000 to $64,999 for men (3,050 | 9.6%) and $40,000 to $44,999 for women (2,511 | 8.2%).
| Income | Male | Female |
| $2,499 or less | 1,469 (4.6%) | 1,599 (5.2%) |
| $2,500 to $4,999 | 1,243 (3.9%) | 1,513 (5.0%) |
| $5,000 to $7,499 | 1,139 (3.6%) | 1,263 (4.2%) |
| $7,500 to $9,999 | 628 (2.0%) | 883 (2.9%) |
| $10,000 to $12,499 | 877 (2.8%) | 865 (2.8%) |
| $12,500 to $14,999 | 729 (2.3%) | 940 (3.1%) |
| $15,000 to $17,499 | 726 (2.3%) | 930 (3.0%) |
| $17,500 to $19,999 | 403 (1.3%) | 665 (2.2%) |
| $20,000 to $22,499 | 651 (2.0%) | 871 (2.9%) |
| $22,500 to $24,999 | 537 (1.7%) | 1,135 (3.7%) |
| $25,000 to $29,999 | 1,585 (5.0%) | 2,151 (7.1%) |
| $30,000 to $34,999 | 1,832 (5.7%) | 2,180 (7.2%) |
| $35,000 to $39,999 | 2,321 (7.3%) | 2,367 (7.8%) |
| $40,000 to $44,999 | 2,306 (7.2%) | 2,511 (8.2%) |
| $45,000 to $49,999 | 2,204 (6.9%) | 1,606 (5.3%) |
| $50,000 to $54,999 | 1,847 (5.8%) | 1,154 (3.8%) |
| $55,000 to $64,999 | 3,050 (9.6%) | 2,406 (7.9%) |
| $65,000 to $74,999 | 2,485 (7.8%) | 1,820 (6.0%) |
| $75,000 to $99,999 | 2,881 (9.0%) | 1,871 (6.1%) |
| $100,000+ | 3,033 (9.5%) | 1,727 (5.7%) |
| Total | 31,946 (100.0%) | 30,457 (100.0%) |
Earnings by Sex by Educational Attainment in Androscoggin County
Average earnings in Androscoggin County are $48,690 for men and $40,169 for women, a difference of 17.5%. Men with an educational attainment of graduate degree enjoy the highest average annual earnings of $81,705, while those with less than high school education earn the least with $38,713. Women with an educational attainment of graduate degree earn the most with the average annual earnings of $71,705, while those with less than high school education have the smallest earnings of $24,831.
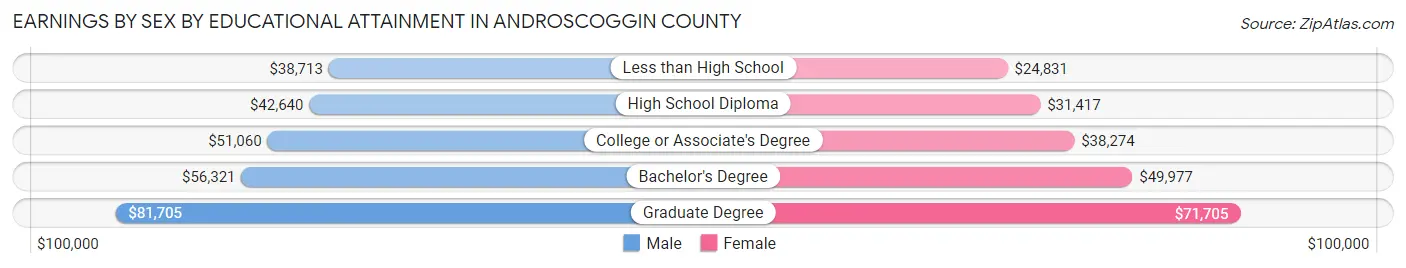
| Educational Attainment | Male Income | Female Income |
| Less than High School | $38,713 | $24,831 |
| High School Diploma | $42,640 | $31,417 |
| College or Associate's Degree | $51,060 | $38,274 |
| Bachelor's Degree | $56,321 | $49,977 |
| Graduate Degree | $81,705 | $71,705 |
| Total | $48,690 | $40,169 |
Family Income in Androscoggin County
Family Income Brackets in Androscoggin County
According to the Androscoggin County family income data, there are 5,924 families falling into the $100,000 to $149,999 income range, which is the most common income bracket and makes up 21.5% of all families. Conversely, the $10,000 to $14,999 income bracket is the least frequent group with only 441 families (1.6%) belonging to this category.
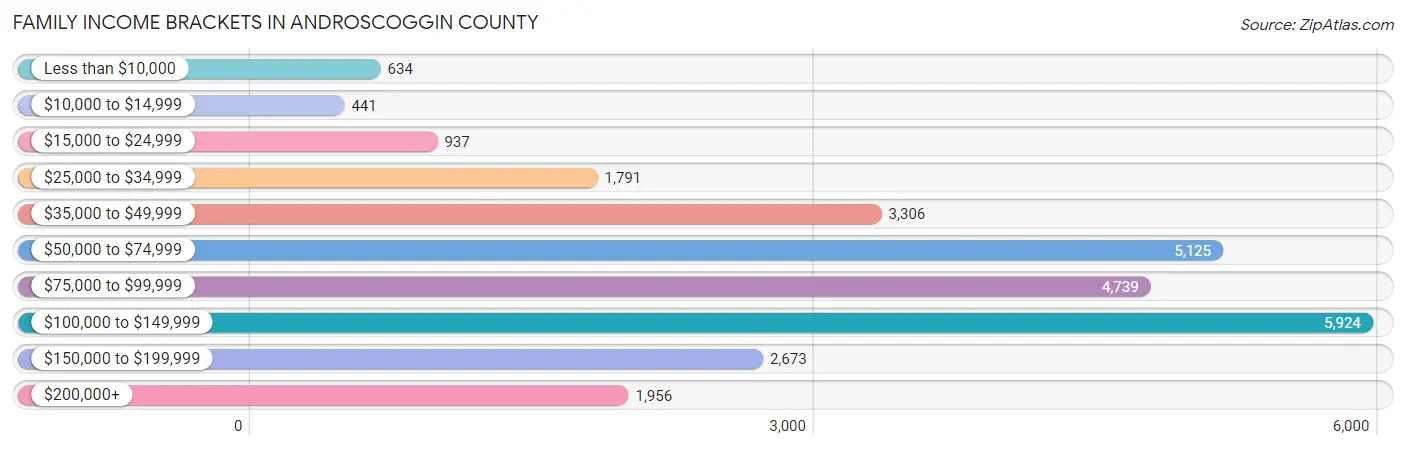
| Income Bracket | # Families | % Families |
| Less than $10,000 | 634 | 2.3% |
| $10,000 to $14,999 | 441 | 1.6% |
| $15,000 to $24,999 | 937 | 3.4% |
| $25,000 to $34,999 | 1,791 | 6.5% |
| $35,000 to $49,999 | 3,306 | 12.0% |
| $50,000 to $74,999 | 5,125 | 18.6% |
| $75,000 to $99,999 | 4,739 | 17.2% |
| $100,000 to $149,999 | 5,924 | 21.5% |
| $150,000 to $199,999 | 2,673 | 9.7% |
| $200,000+ | 1,956 | 7.1% |
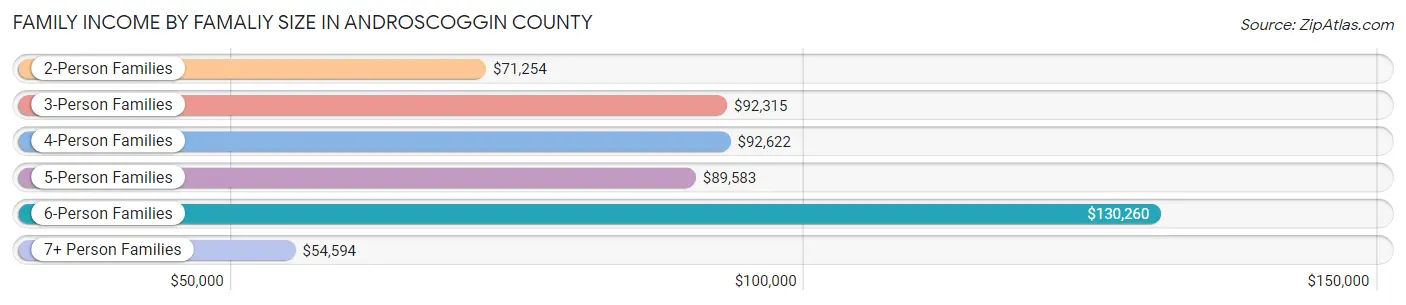
Family Income by Famaliy Size in Androscoggin County
6-person families (610 | 2.2%) account for the highest median family income in Androscoggin County with $130,260 per family, while 2-person families (14,281 | 51.8%) have the highest median income of $35,627 per family member.
| Income Bracket | # Families | Median Income |
| 2-Person Families | 14,281 (51.8%) | $71,254 |
| 3-Person Families | 6,108 (22.2%) | $92,315 |
| 4-Person Families | 4,948 (18.0%) | $92,622 |
| 5-Person Families | 1,293 (4.7%) | $89,583 |
| 6-Person Families | 610 (2.2%) | $130,260 |
| 7+ Person Families | 313 (1.1%) | $54,594 |
| Total | 27,553 (100.0%) | $82,684 |
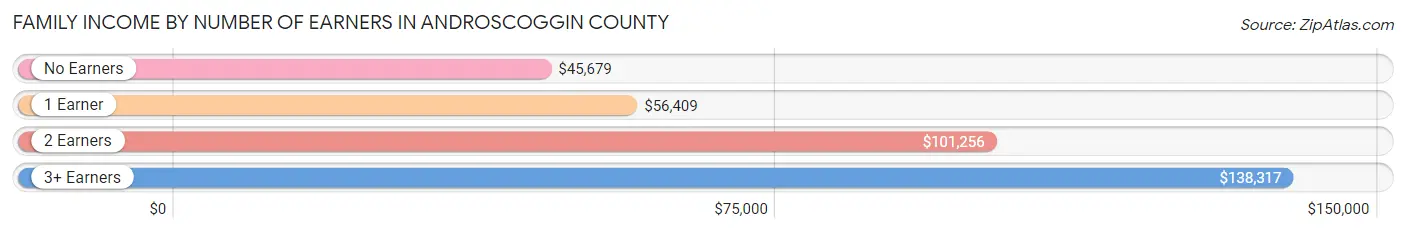
Family Income by Number of Earners in Androscoggin County
The median family income in Androscoggin County is $82,684, with families comprising 3+ earners (3,340) having the highest median family income of $138,317, while families with no earners (4,127) have the lowest median family income of $45,679, accounting for 12.1% and 15.0% of families, respectively.
| Number of Earners | # Families | Median Income |
| No Earners | 4,127 (15.0%) | $45,679 |
| 1 Earner | 7,438 (27.0%) | $56,409 |
| 2 Earners | 12,648 (45.9%) | $101,256 |
| 3+ Earners | 3,340 (12.1%) | $138,317 |
| Total | 27,553 (100.0%) | $82,684 |
Household Income in Androscoggin County
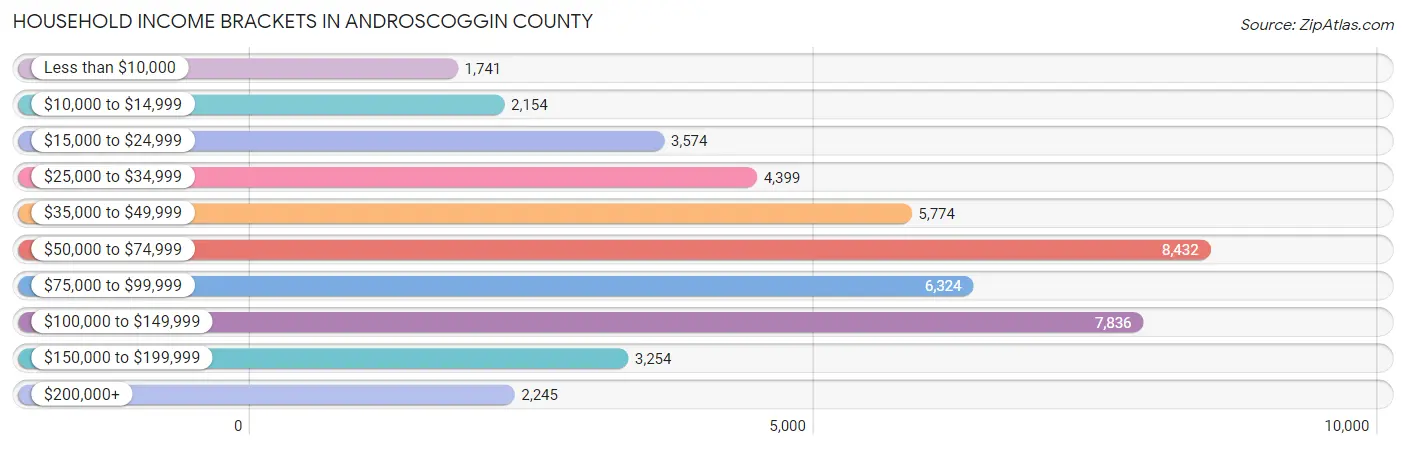
Household Income Brackets in Androscoggin County
With 8,432 households falling in the category, the $50,000 to $74,999 income range is the most frequent in Androscoggin County, accounting for 18.4% of all households. In contrast, only 1,741 households (3.8%) fall into the less than $10,000 income bracket, making it the least populous group.
| Income Bracket | # Households | % Households |
| Less than $10,000 | 1,741 | 3.8% |
| $10,000 to $14,999 | 2,154 | 4.7% |
| $15,000 to $24,999 | 3,574 | 7.8% |
| $25,000 to $34,999 | 4,399 | 9.6% |
| $35,000 to $49,999 | 5,774 | 12.6% |
| $50,000 to $74,999 | 8,432 | 18.4% |
| $75,000 to $99,999 | 6,324 | 13.8% |
| $100,000 to $149,999 | 7,836 | 17.1% |
| $150,000 to $199,999 | 3,254 | 7.1% |
| $200,000+ | 2,245 | 4.9% |
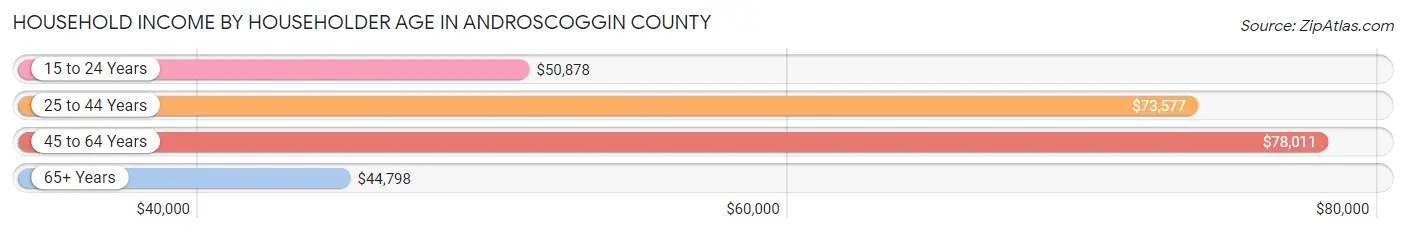
Household Income by Householder Age in Androscoggin County
The median household income in Androscoggin County is $64,500, with the highest median household income of $78,011 found in the 45 to 64 years age bracket for the primary householder. A total of 17,718 households (38.7%) fall into this category. Meanwhile, the 65+ years age bracket for the primary householder has the lowest median household income of $44,798, with 12,678 households (27.7%) in this group.
| Income Bracket | # Households | Median Income |
| 15 to 24 Years | 1,280 (2.8%) | $50,878 |
| 25 to 44 Years | 14,149 (30.9%) | $73,577 |
| 45 to 64 Years | 17,718 (38.7%) | $78,011 |
| 65+ Years | 12,678 (27.7%) | $44,798 |
| Total | 45,825 (100.0%) | $64,500 |
Poverty in Androscoggin County
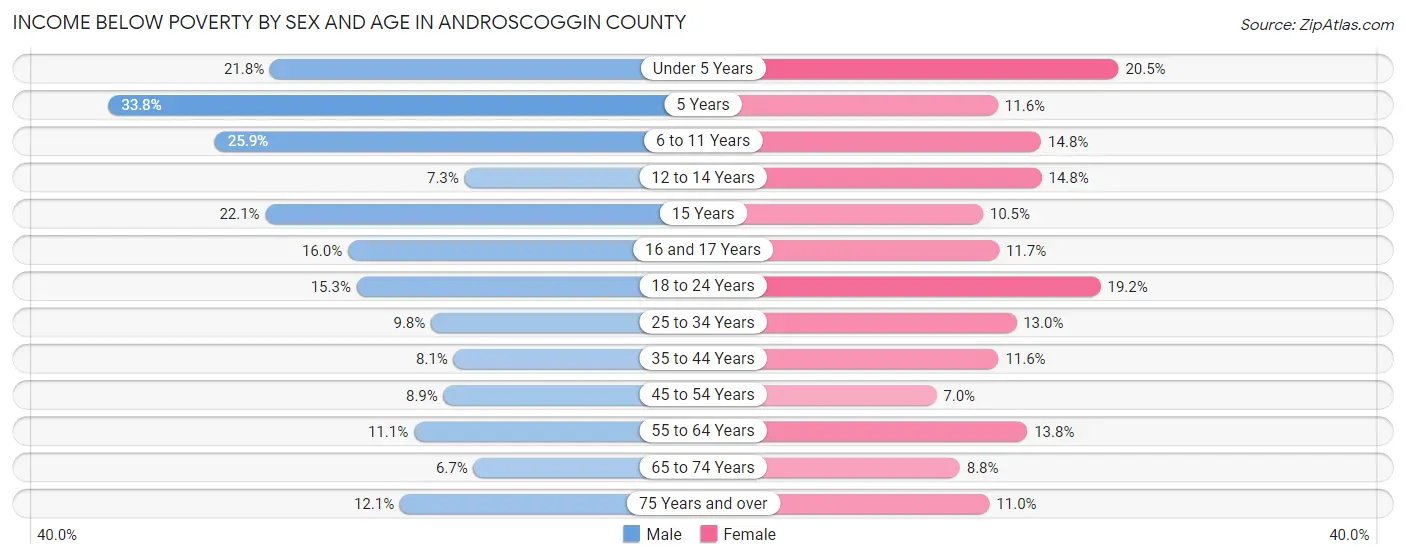
Income Below Poverty by Sex and Age in Androscoggin County
With 12.2% poverty level for males and 12.5% for females among the residents of Androscoggin County, 5 year old males and under 5 year old females are the most vulnerable to poverty, with 177 males (33.8%) and 610 females (20.5%) in their respective age groups living below the poverty level.
| Age Bracket | Male | Female |
| Under 5 Years | 684 (21.8%) | 610 (20.5%) |
| 5 Years | 177 (33.8%) | 75 (11.6%) |
| 6 to 11 Years | 932 (25.9%) | 527 (14.8%) |
| 12 to 14 Years | 175 (7.3%) | 305 (14.8%) |
| 15 Years | 161 (22.1%) | 69 (10.5%) |
| 16 and 17 Years | 208 (16.0%) | 167 (11.7%) |
| 18 to 24 Years | 674 (15.3%) | 851 (19.2%) |
| 25 to 34 Years | 676 (9.8%) | 891 (13.0%) |
| 35 to 44 Years | 532 (8.1%) | 776 (11.6%) |
| 45 to 54 Years | 626 (8.9%) | 493 (7.0%) |
| 55 to 64 Years | 876 (11.1%) | 1,087 (13.8%) |
| 65 to 74 Years | 371 (6.7%) | 537 (8.8%) |
| 75 Years and over | 363 (12.1%) | 491 (11.0%) |
| Total | 6,455 (12.2%) | 6,879 (12.5%) |
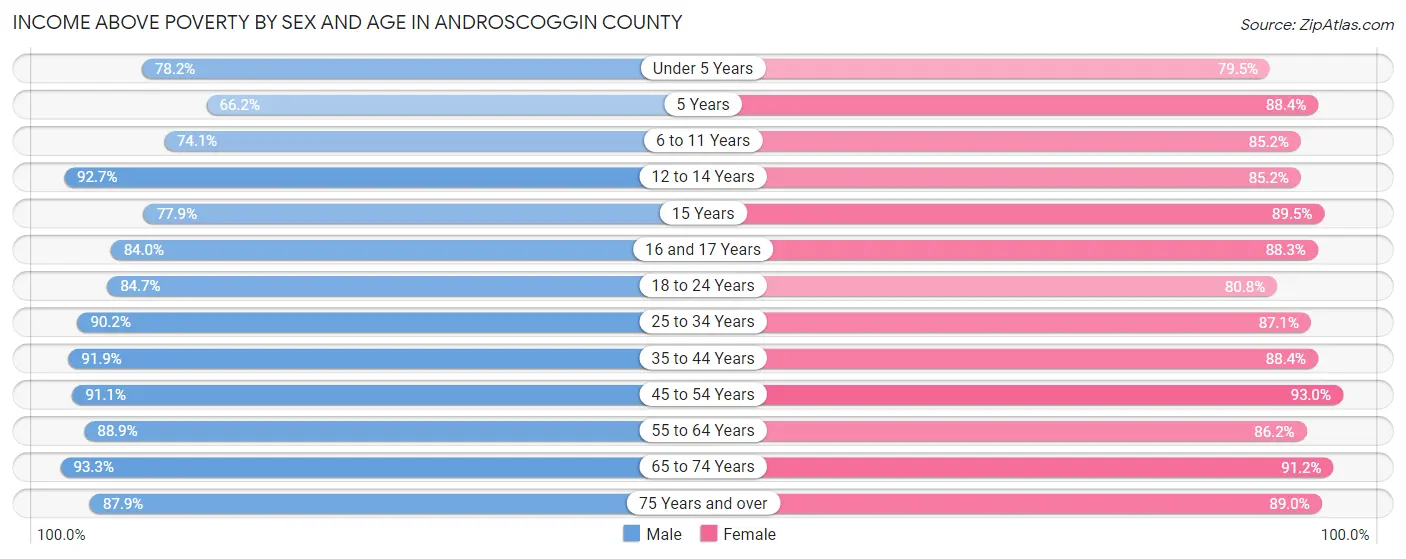
Income Above Poverty by Sex and Age in Androscoggin County
According to the poverty statistics in Androscoggin County, males aged 65 to 74 years and females aged 45 to 54 years are the age groups that are most secure financially, with 93.3% of males and 93.0% of females in these age groups living above the poverty line.
| Age Bracket | Male | Female |
| Under 5 Years | 2,457 (78.2%) | 2,360 (79.5%) |
| 5 Years | 347 (66.2%) | 572 (88.4%) |
| 6 to 11 Years | 2,670 (74.1%) | 3,034 (85.2%) |
| 12 to 14 Years | 2,211 (92.7%) | 1,752 (85.2%) |
| 15 Years | 567 (77.9%) | 590 (89.5%) |
| 16 and 17 Years | 1,093 (84.0%) | 1,264 (88.3%) |
| 18 to 24 Years | 3,719 (84.7%) | 3,578 (80.8%) |
| 25 to 34 Years | 6,210 (90.2%) | 5,989 (87.1%) |
| 35 to 44 Years | 6,003 (91.9%) | 5,899 (88.4%) |
| 45 to 54 Years | 6,416 (91.1%) | 6,533 (93.0%) |
| 55 to 64 Years | 7,020 (88.9%) | 6,805 (86.2%) |
| 65 to 74 Years | 5,188 (93.3%) | 5,593 (91.2%) |
| 75 Years and over | 2,630 (87.9%) | 3,988 (89.0%) |
| Total | 46,531 (87.8%) | 47,957 (87.5%) |
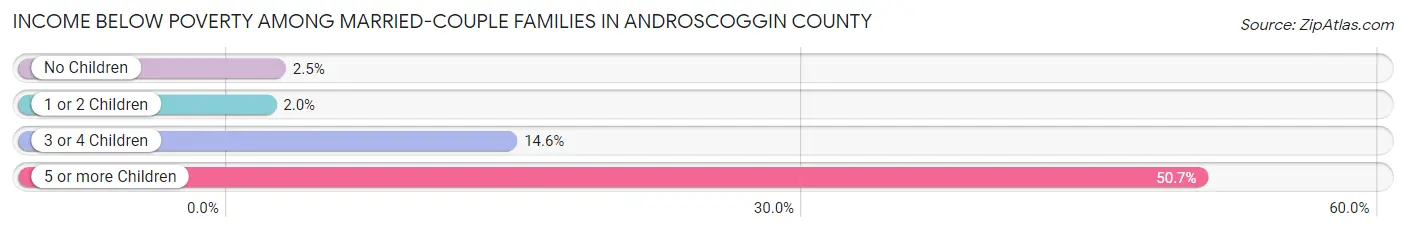
Income Below Poverty Among Married-Couple Families in Androscoggin County
The poverty statistics for married-couple families in Androscoggin County show that 3.3% or 677 of the total 20,761 families live below the poverty line. Families with 5 or more children have the highest poverty rate of 50.7%, comprising of 75 families. On the other hand, families with 1 or 2 children have the lowest poverty rate of 2.0%, which includes 127 families.
| Children | Above Poverty | Below Poverty |
| No Children | 12,965 (97.5%) | 332 (2.5%) |
| 1 or 2 Children | 6,208 (98.0%) | 127 (2.0%) |
| 3 or 4 Children | 838 (85.4%) | 143 (14.6%) |
| 5 or more Children | 73 (49.3%) | 75 (50.7%) |
| Total | 20,084 (96.7%) | 677 (3.3%) |
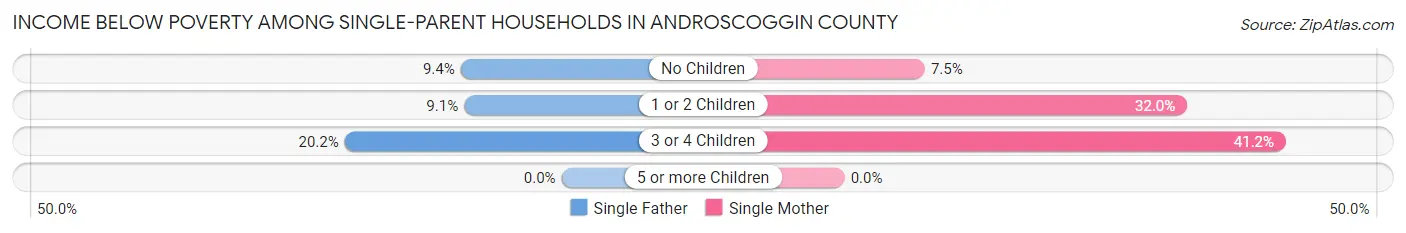
Income Below Poverty Among Single-Parent Households in Androscoggin County
According to the poverty data in Androscoggin County, 10.2% or 211 single-father households and 24.4% or 1,153 single-mother households are living below the poverty line. Among single-father households, those with 3 or 4 children have the highest poverty rate, with 41 households (20.2%) experiencing poverty. Likewise, among single-mother households, those with 3 or 4 children have the highest poverty rate, with 210 households (41.2%) falling below the poverty line.
| Children | Single Father | Single Mother |
| No Children | 75 (9.4%) | 123 (7.5%) |
| 1 or 2 Children | 95 (9.1%) | 820 (32.0%) |
| 3 or 4 Children | 41 (20.2%) | 210 (41.2%) |
| 5 or more Children | 0 (0.0%) | 0 (0.0%) |
| Total | 211 (10.2%) | 1,153 (24.4%) |
Income Below Poverty Among Married-Couple vs Single-Parent Households in Androscoggin County
The poverty data for Androscoggin County shows that 677 of the married-couple family households (3.3%) and 1,364 of the single-parent households (20.1%) are living below the poverty level. Within the married-couple family households, those with 5 or more children have the highest poverty rate, with 75 households (50.7%) falling below the poverty line. Among the single-parent households, those with 3 or 4 children have the highest poverty rate, with 251 household (35.2%) living below poverty.
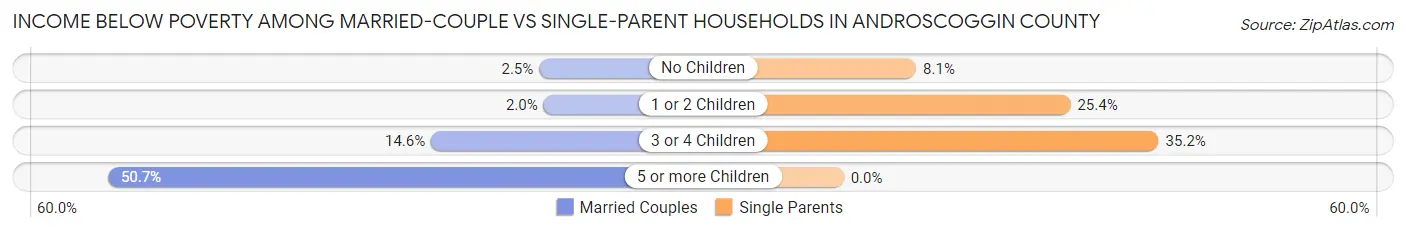
| Children | Married-Couple Families | Single-Parent Households |
| No Children | 332 (2.5%) | 198 (8.1%) |
| 1 or 2 Children | 127 (2.0%) | 915 (25.4%) |
| 3 or 4 Children | 143 (14.6%) | 251 (35.2%) |
| 5 or more Children | 75 (50.7%) | 0 (0.0%) |
| Total | 677 (3.3%) | 1,364 (20.1%) |
Employment Characteristics in Androscoggin County
Employment by Class of Employer in Androscoggin County
Among the 54,700 employed individuals in Androscoggin County, private company employees (36,225 | 66.2%), not-for-profit organizations (6,675 | 12.2%), and local government employees (3,706 | 6.8%) make up the most common classes of employment.
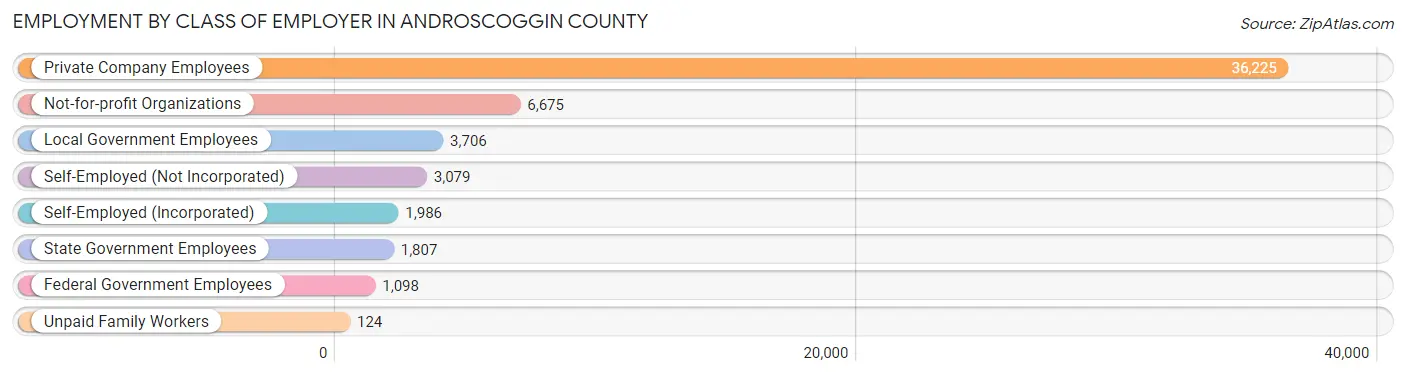
| Employer Class | # Employees | % Employees |
| Private Company Employees | 36,225 | 66.2% |
| Self-Employed (Incorporated) | 1,986 | 3.6% |
| Self-Employed (Not Incorporated) | 3,079 | 5.6% |
| Not-for-profit Organizations | 6,675 | 12.2% |
| Local Government Employees | 3,706 | 6.8% |
| State Government Employees | 1,807 | 3.3% |
| Federal Government Employees | 1,098 | 2.0% |
| Unpaid Family Workers | 124 | 0.2% |
| Total | 54,700 | 100.0% |
Employment Status by Age in Androscoggin County
According to the labor force statistics for Androscoggin County, out of the total population over 16 years of age (90,668), 65.0% or 58,934 individuals are in the labor force, with 4.8% or 2,829 of them unemployed. The age group with the highest labor force participation rate is 35 to 44 years, with 86.7% or 11,503 individuals in the labor force. Within the labor force, the 16 to 19 years age range has the highest percentage of unemployed individuals, with 16.7% or 560 of them being unemployed.
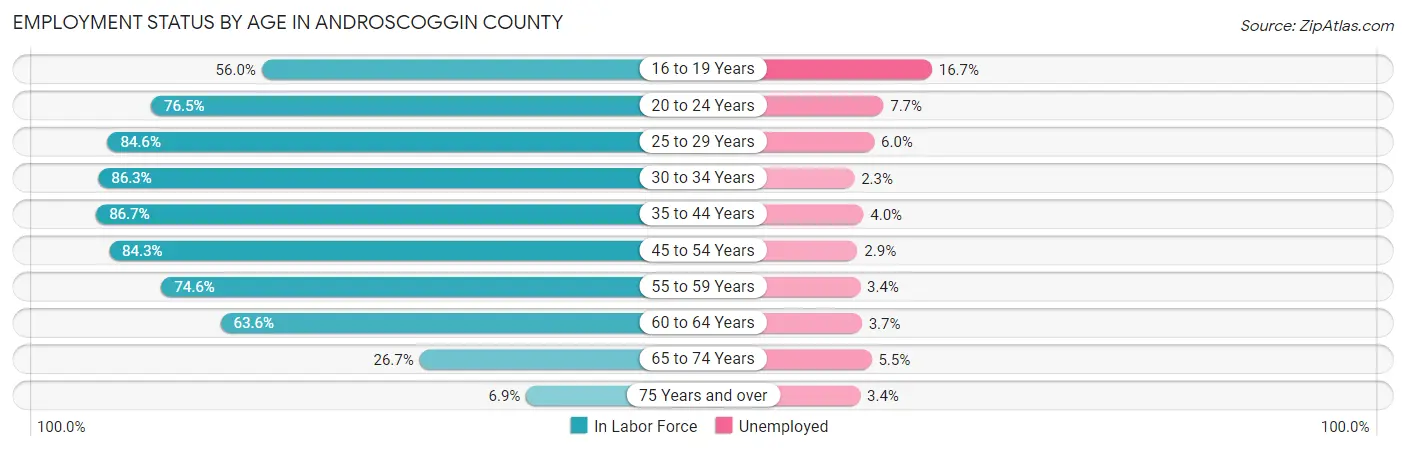
| Age Bracket | In Labor Force | Unemployed |
| 16 to 19 Years | 3,353 (56.0%) | 560 (16.7%) |
| 20 to 24 Years | 5,607 (76.5%) | 432 (7.7%) |
| 25 to 29 Years | 5,616 (84.6%) | 337 (6.0%) |
| 30 to 34 Years | 6,196 (86.3%) | 143 (2.3%) |
| 35 to 44 Years | 11,503 (86.7%) | 460 (4.0%) |
| 45 to 54 Years | 11,867 (84.3%) | 344 (2.9%) |
| 55 to 59 Years | 6,293 (74.6%) | 214 (3.4%) |
| 60 to 64 Years | 4,760 (63.6%) | 176 (3.7%) |
| 65 to 74 Years | 3,158 (26.7%) | 174 (5.5%) |
| 75 Years and over | 582 (6.9%) | 20 (3.4%) |
| Total | 58,934 (65.0%) | 2,829 (4.8%) |
Employment Status by Educational Attainment in Androscoggin County
According to labor force statistics for Androscoggin County, 81.0% of individuals (46,237) out of the total population between 25 and 64 years of age (57,083) are in the labor force, with 3.6% or 1,665 of them being unemployed. The group with the highest labor force participation rate are those with the educational attainment of bachelor's degree or higher, with 89.3% or 12,423 individuals in the labor force. Within the labor force, individuals with less than high school education have the highest percentage of unemployment, with 7.8% or 170 of them being unemployed.
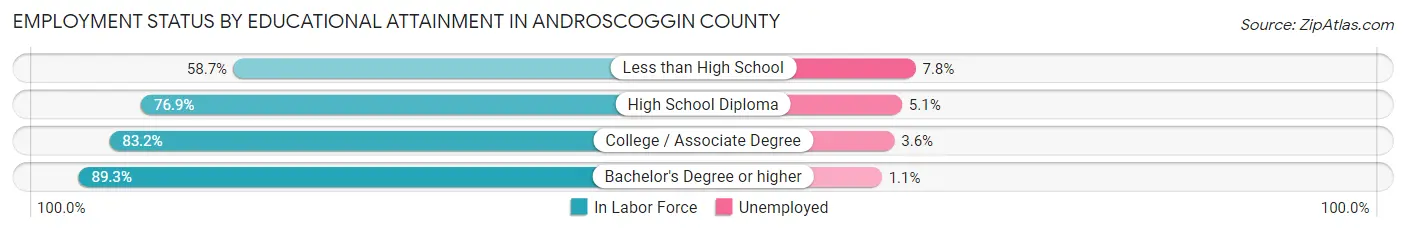
| Educational Attainment | In Labor Force | Unemployed |
| Less than High School | 2,185 (58.7%) | 290 (7.8%) |
| High School Diploma | 14,715 (76.9%) | 976 (5.1%) |
| College / Associate Degree | 16,901 (83.2%) | 731 (3.6%) |
| Bachelor's Degree or higher | 12,423 (89.3%) | 153 (1.1%) |
| Total | 46,237 (81.0%) | 2,055 (3.6%) |
Employment Occupations by Sex in Androscoggin County
Management, Business, Science and Arts Occupations
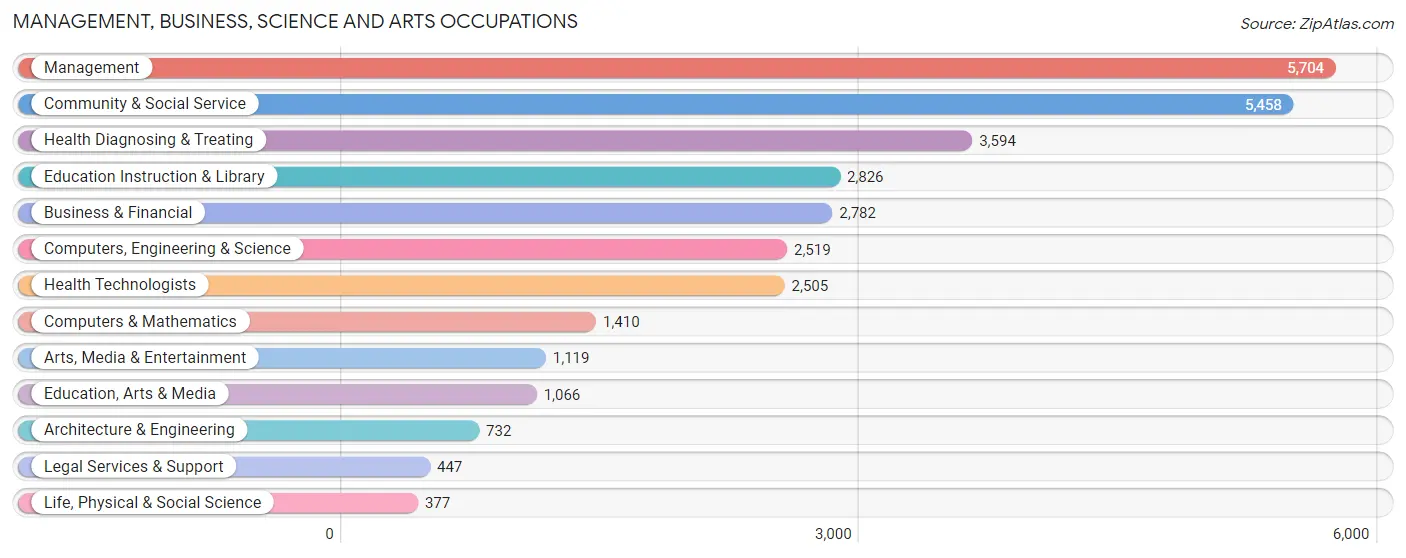
The most common Management, Business, Science and Arts occupations in Androscoggin County are Management (5,704 | 10.2%), Community & Social Service (5,458 | 9.7%), Health Diagnosing & Treating (3,594 | 6.4%), Education Instruction & Library (2,826 | 5.1%), and Business & Financial (2,782 | 5.0%).
Management, Business, Science and Arts Occupations by Sex
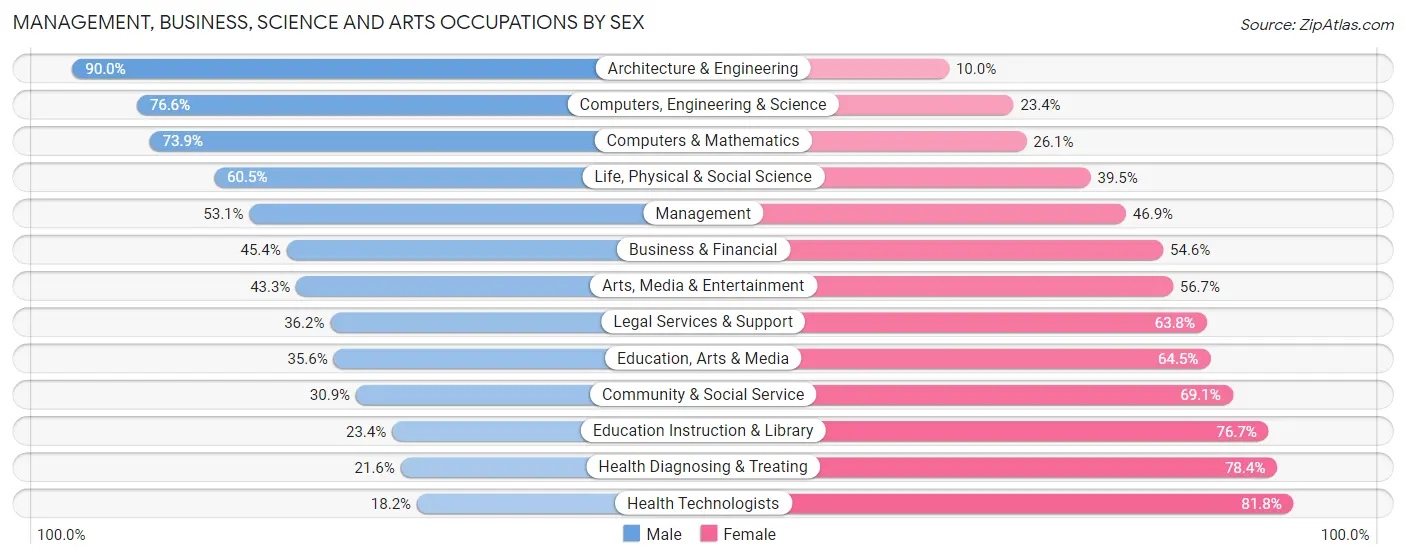
Within the Management, Business, Science and Arts occupations in Androscoggin County, the most male-oriented occupations are Architecture & Engineering (90.0%), Computers, Engineering & Science (76.6%), and Computers & Mathematics (73.9%), while the most female-oriented occupations are Health Technologists (81.8%), Health Diagnosing & Treating (78.4%), and Education Instruction & Library (76.6%).
| Occupation | Male | Female |
| Management | 3,030 (53.1%) | 2,674 (46.9%) |
| Business & Financial | 1,262 (45.4%) | 1,520 (54.6%) |
| Computers, Engineering & Science | 1,929 (76.6%) | 590 (23.4%) |
| Computers & Mathematics | 1,042 (73.9%) | 368 (26.1%) |
| Architecture & Engineering | 659 (90.0%) | 73 (10.0%) |
| Life, Physical & Social Science | 228 (60.5%) | 149 (39.5%) |
| Community & Social Service | 1,686 (30.9%) | 3,772 (69.1%) |
| Education, Arts & Media | 379 (35.5%) | 687 (64.4%) |
| Legal Services & Support | 162 (36.2%) | 285 (63.8%) |
| Education Instruction & Library | 660 (23.4%) | 2,166 (76.6%) |
| Arts, Media & Entertainment | 485 (43.3%) | 634 (56.7%) |
| Health Diagnosing & Treating | 775 (21.6%) | 2,819 (78.4%) |
| Health Technologists | 455 (18.2%) | 2,050 (81.8%) |
| Total (Category) | 8,682 (43.3%) | 11,375 (56.7%) |
| Total (Overall) | 29,124 (52.0%) | 26,887 (48.0%) |
Services Occupations
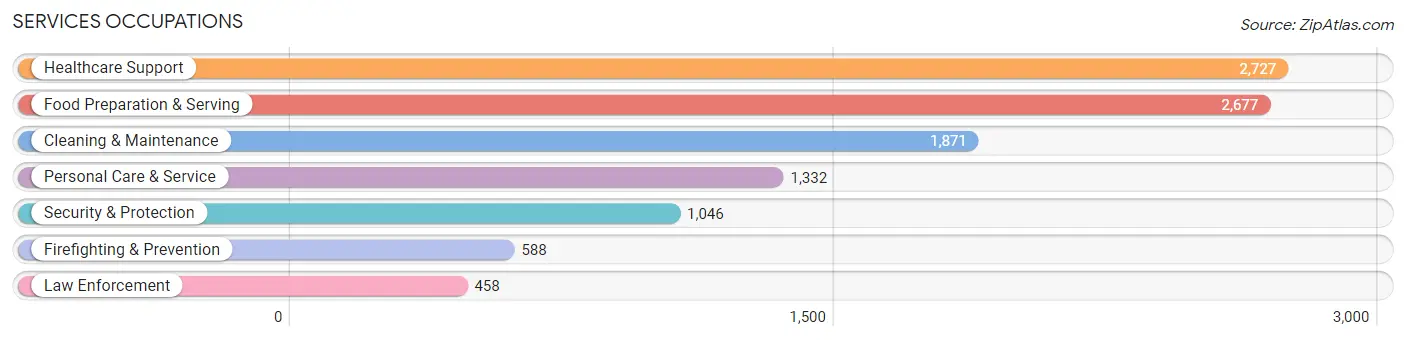
The most common Services occupations in Androscoggin County are Healthcare Support (2,727 | 4.9%), Food Preparation & Serving (2,677 | 4.8%), Cleaning & Maintenance (1,871 | 3.3%), Personal Care & Service (1,332 | 2.4%), and Security & Protection (1,046 | 1.9%).
Services Occupations by Sex
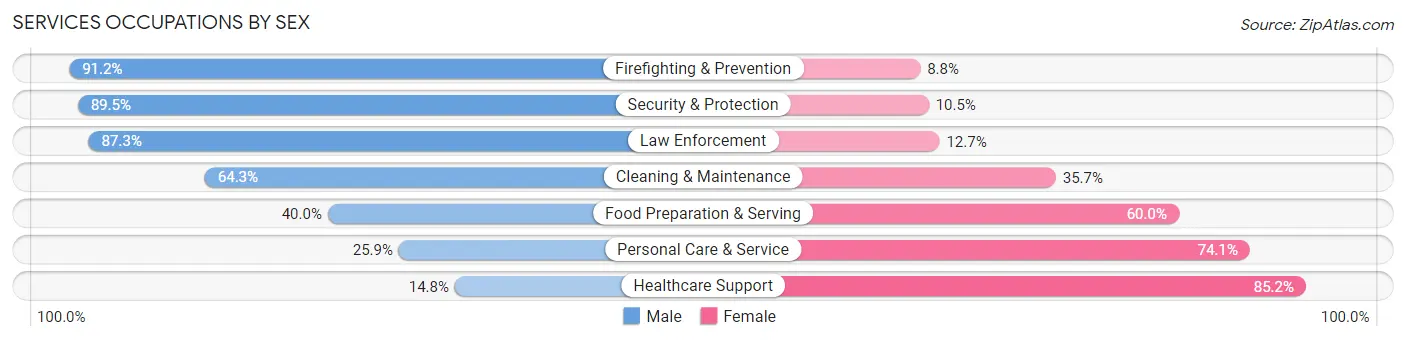
Within the Services occupations in Androscoggin County, the most male-oriented occupations are Firefighting & Prevention (91.2%), Security & Protection (89.5%), and Law Enforcement (87.3%), while the most female-oriented occupations are Healthcare Support (85.2%), Personal Care & Service (74.1%), and Food Preparation & Serving (60.0%).
| Occupation | Male | Female |
| Healthcare Support | 404 (14.8%) | 2,323 (85.2%) |
| Security & Protection | 936 (89.5%) | 110 (10.5%) |
| Firefighting & Prevention | 536 (91.2%) | 52 (8.8%) |
| Law Enforcement | 400 (87.3%) | 58 (12.7%) |
| Food Preparation & Serving | 1,070 (40.0%) | 1,607 (60.0%) |
| Cleaning & Maintenance | 1,203 (64.3%) | 668 (35.7%) |
| Personal Care & Service | 345 (25.9%) | 987 (74.1%) |
| Total (Category) | 3,958 (41.0%) | 5,695 (59.0%) |
| Total (Overall) | 29,124 (52.0%) | 26,887 (48.0%) |
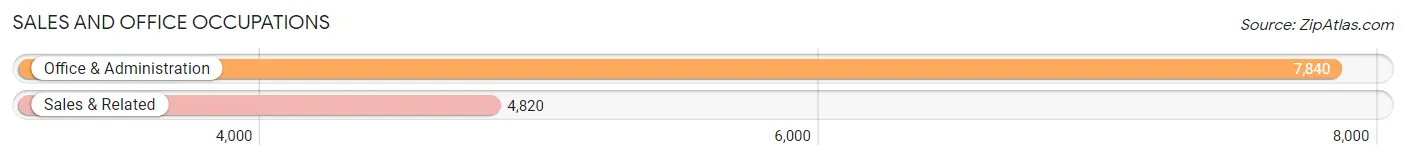
Sales and Office Occupations
The most common Sales and Office occupations in Androscoggin County are Office & Administration (7,840 | 14.0%), and Sales & Related (4,820 | 8.6%).
Sales and Office Occupations by Sex
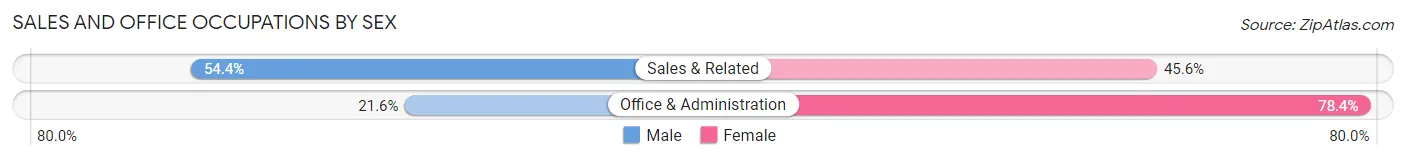
| Occupation | Male | Female |
| Sales & Related | 2,622 (54.4%) | 2,198 (45.6%) |
| Office & Administration | 1,692 (21.6%) | 6,148 (78.4%) |
| Total (Category) | 4,314 (34.1%) | 8,346 (65.9%) |
| Total (Overall) | 29,124 (52.0%) | 26,887 (48.0%) |
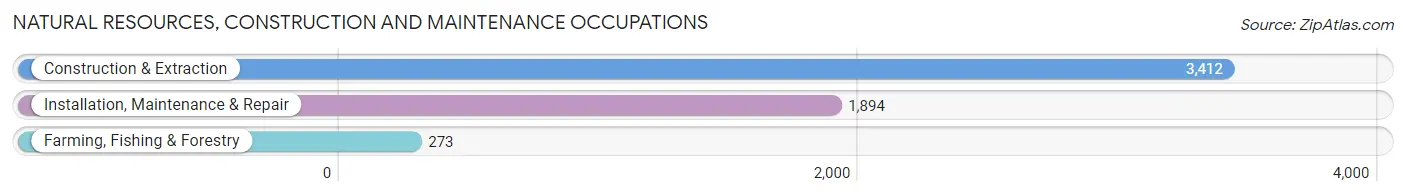
Natural Resources, Construction and Maintenance Occupations
The most common Natural Resources, Construction and Maintenance occupations in Androscoggin County are Construction & Extraction (3,412 | 6.1%), Installation, Maintenance & Repair (1,894 | 3.4%), and Farming, Fishing & Forestry (273 | 0.5%).
Natural Resources, Construction and Maintenance Occupations by Sex
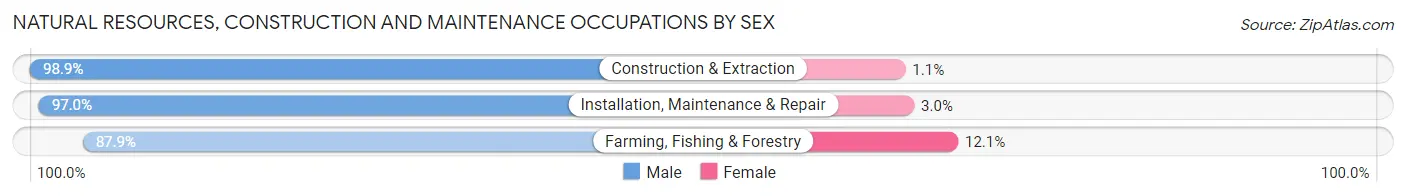
| Occupation | Male | Female |
| Farming, Fishing & Forestry | 240 (87.9%) | 33 (12.1%) |
| Construction & Extraction | 3,373 (98.9%) | 39 (1.1%) |
| Installation, Maintenance & Repair | 1,838 (97.0%) | 56 (3.0%) |
| Total (Category) | 5,451 (97.7%) | 128 (2.3%) |
| Total (Overall) | 29,124 (52.0%) | 26,887 (48.0%) |
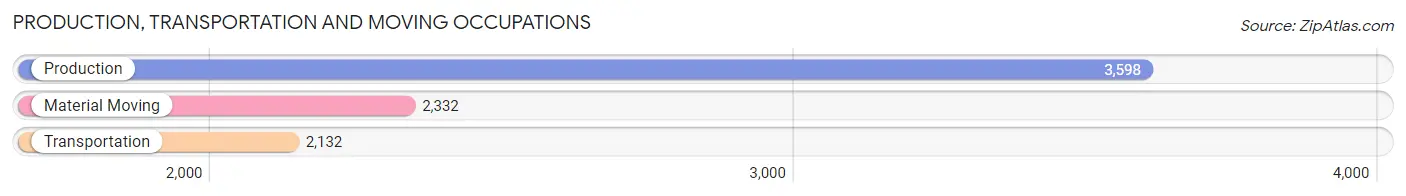
Production, Transportation and Moving Occupations
The most common Production, Transportation and Moving occupations in Androscoggin County are Production (3,598 | 6.4%), Material Moving (2,332 | 4.2%), and Transportation (2,132 | 3.8%).
Production, Transportation and Moving Occupations by Sex
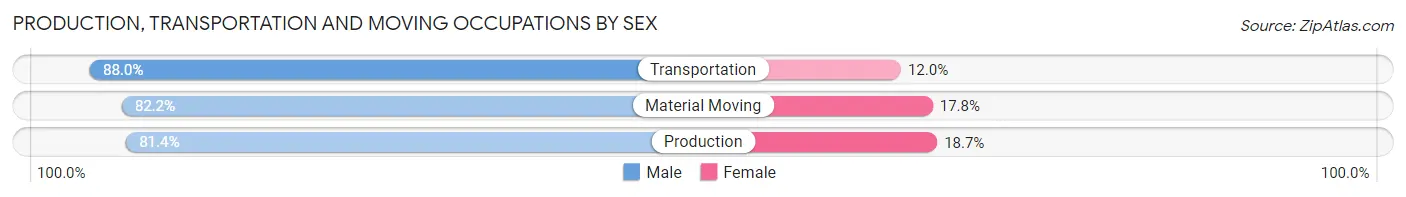
| Occupation | Male | Female |
| Production | 2,927 (81.4%) | 671 (18.6%) |
| Transportation | 1,876 (88.0%) | 256 (12.0%) |
| Material Moving | 1,916 (82.2%) | 416 (17.8%) |
| Total (Category) | 6,719 (83.3%) | 1,343 (16.7%) |
| Total (Overall) | 29,124 (52.0%) | 26,887 (48.0%) |
Employment Industries by Sex in Androscoggin County
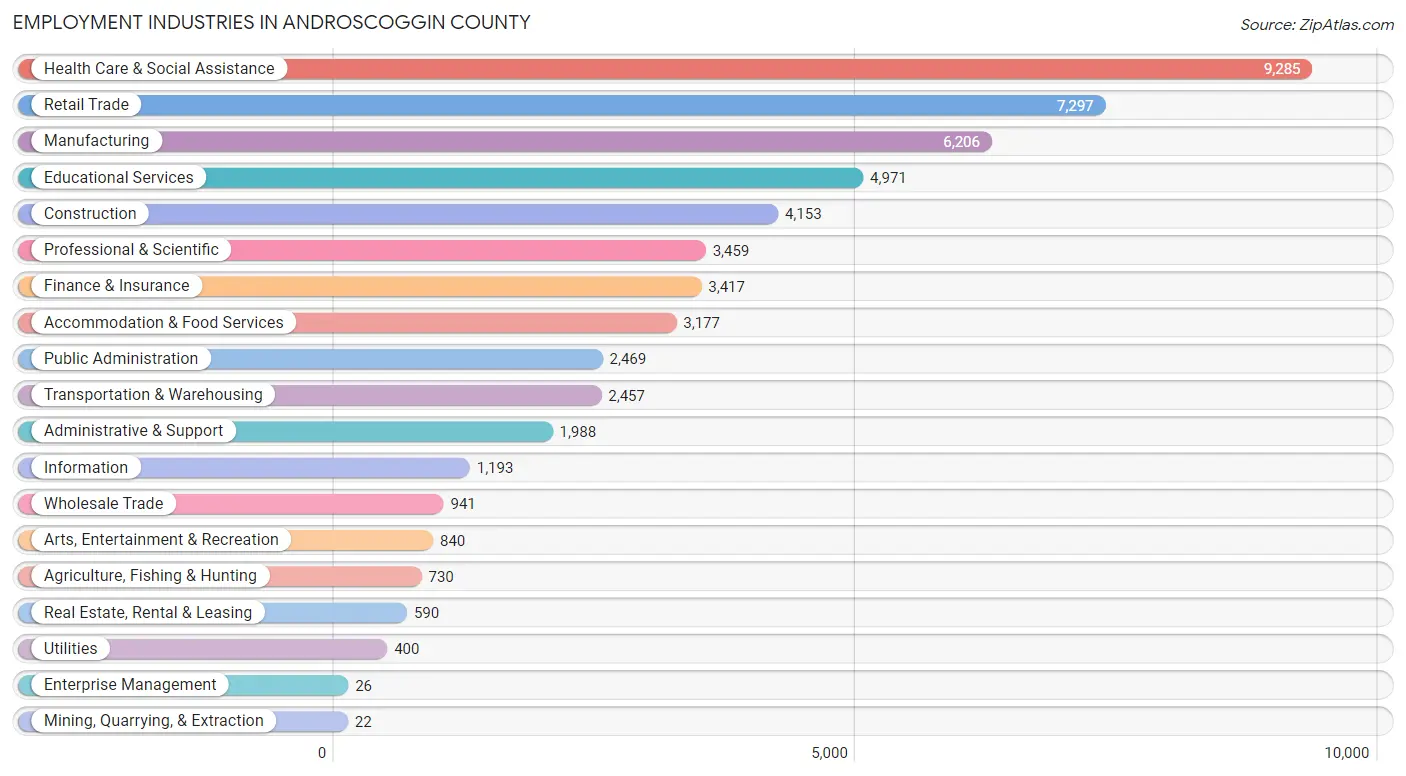
Employment Industries in Androscoggin County
The major employment industries in Androscoggin County include Health Care & Social Assistance (9,285 | 16.6%), Retail Trade (7,297 | 13.0%), Manufacturing (6,206 | 11.1%), Educational Services (4,971 | 8.9%), and Construction (4,153 | 7.4%).
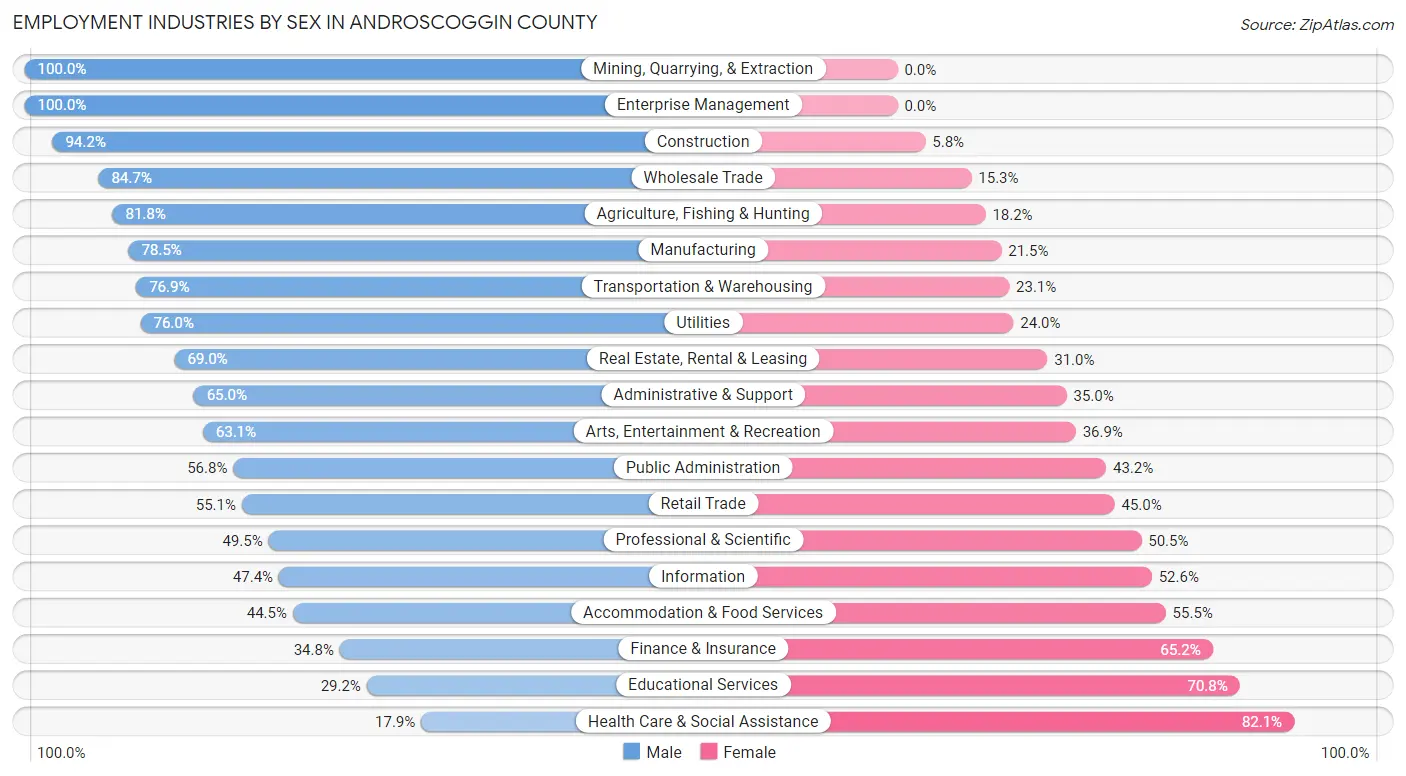
Employment Industries by Sex in Androscoggin County
The Androscoggin County industries that see more men than women are Mining, Quarrying, & Extraction (100.0%), Enterprise Management (100.0%), and Construction (94.2%), whereas the industries that tend to have a higher number of women are Health Care & Social Assistance (82.1%), Educational Services (70.8%), and Finance & Insurance (65.2%).
| Industry | Male | Female |
| Agriculture, Fishing & Hunting | 597 (81.8%) | 133 (18.2%) |
| Mining, Quarrying, & Extraction | 22 (100.0%) | 0 (0.0%) |
| Construction | 3,913 (94.2%) | 240 (5.8%) |
| Manufacturing | 4,872 (78.5%) | 1,334 (21.5%) |
| Wholesale Trade | 797 (84.7%) | 144 (15.3%) |
| Retail Trade | 4,017 (55.0%) | 3,280 (45.0%) |
| Transportation & Warehousing | 1,889 (76.9%) | 568 (23.1%) |
| Utilities | 304 (76.0%) | 96 (24.0%) |
| Information | 565 (47.4%) | 628 (52.6%) |
| Finance & Insurance | 1,188 (34.8%) | 2,229 (65.2%) |
| Real Estate, Rental & Leasing | 407 (69.0%) | 183 (31.0%) |
| Professional & Scientific | 1,713 (49.5%) | 1,746 (50.5%) |
| Enterprise Management | 26 (100.0%) | 0 (0.0%) |
| Administrative & Support | 1,292 (65.0%) | 696 (35.0%) |
| Educational Services | 1,451 (29.2%) | 3,520 (70.8%) |
| Health Care & Social Assistance | 1,665 (17.9%) | 7,620 (82.1%) |
| Arts, Entertainment & Recreation | 530 (63.1%) | 310 (36.9%) |
| Accommodation & Food Services | 1,413 (44.5%) | 1,764 (55.5%) |
| Public Administration | 1,403 (56.8%) | 1,066 (43.2%) |
| Total | 29,124 (52.0%) | 26,887 (48.0%) |
Education in Androscoggin County
School Enrollment in Androscoggin County
The most common levels of schooling among the 25,353 students in Androscoggin County are college / undergraduate (6,017 | 23.7%), middle school (5,606 | 22.1%), and high school (5,579 | 22.0%).
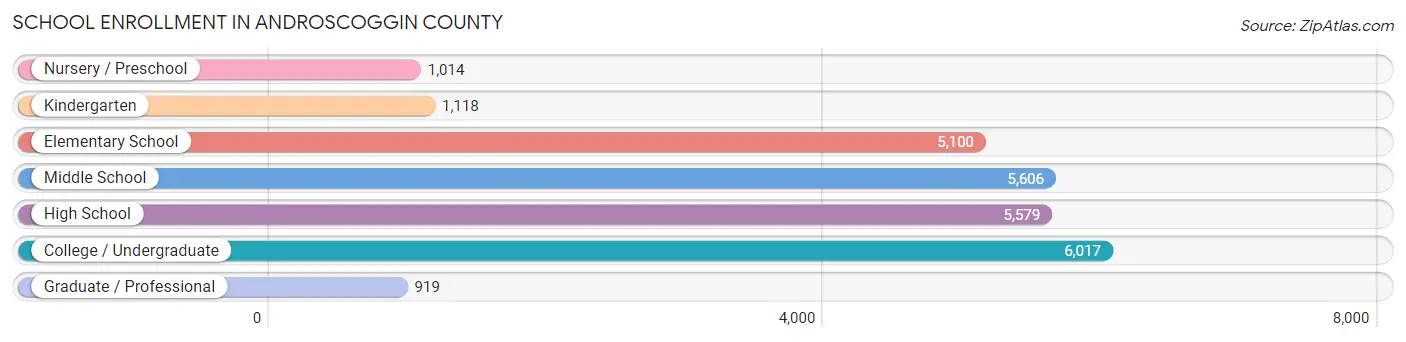
| School Level | # Students | % Students |
| Nursery / Preschool | 1,014 | 4.0% |
| Kindergarten | 1,118 | 4.4% |
| Elementary School | 5,100 | 20.1% |
| Middle School | 5,606 | 22.1% |
| High School | 5,579 | 22.0% |
| College / Undergraduate | 6,017 | 23.7% |
| Graduate / Professional | 919 | 3.6% |
| Total | 25,353 | 100.0% |
School Enrollment by Age by Funding Source in Androscoggin County
Out of a total of 25,353 students who are enrolled in schools in Androscoggin County, 5,197 (20.5%) attend a private institution, while the remaining 20,156 (79.5%) are enrolled in public schools. The age group of 20 to 24 year olds has the highest likelihood of being enrolled in private schools, with 1,547 (53.4% in the age bracket) enrolled. Conversely, the age group of 15 to 17 year olds has the lowest likelihood of being enrolled in a private school, with 3,545 (91.4% in the age bracket) attending a public institution.
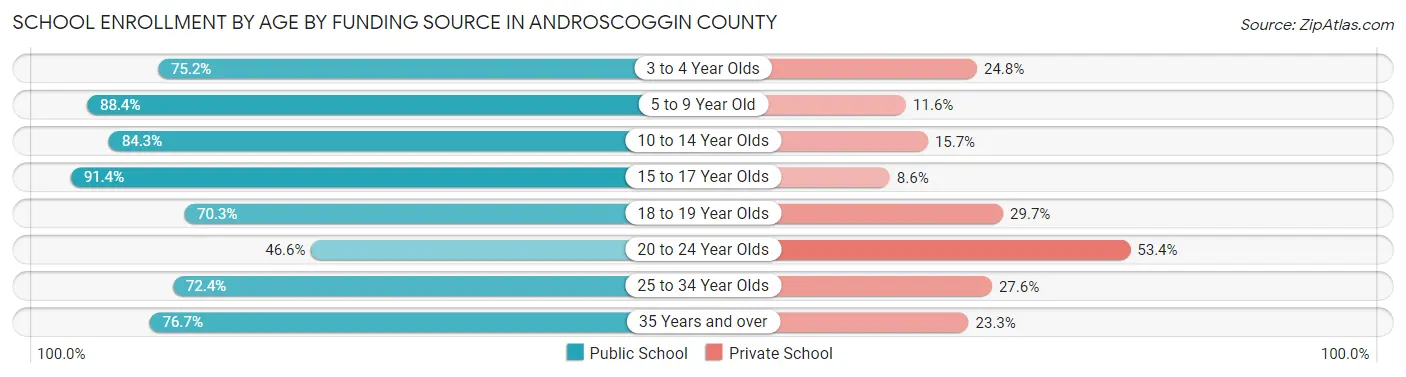
| Age Bracket | Public School | Private School |
| 3 to 4 Year Olds | 466 (75.2%) | 154 (24.8%) |
| 5 to 9 Year Old | 5,380 (88.4%) | 709 (11.6%) |
| 10 to 14 Year Olds | 5,738 (84.3%) | 1,069 (15.7%) |
| 15 to 17 Year Olds | 3,545 (91.4%) | 334 (8.6%) |
| 18 to 19 Year Olds | 1,699 (70.3%) | 718 (29.7%) |
| 20 to 24 Year Olds | 1,350 (46.6%) | 1,547 (53.4%) |
| 25 to 34 Year Olds | 1,027 (72.4%) | 392 (27.6%) |
| 35 Years and over | 940 (76.7%) | 285 (23.3%) |
| Total | 20,156 (79.5%) | 5,197 (20.5%) |
Educational Attainment by Field of Study in Androscoggin County
Business (3,010 | 15.4%), education (2,640 | 13.5%), science & technology (2,354 | 12.1%), social sciences (1,498 | 7.7%), and bio, nature & agricultural (1,453 | 7.4%) are the most common fields of study among 19,514 individuals in Androscoggin County who have obtained a bachelor's degree or higher.
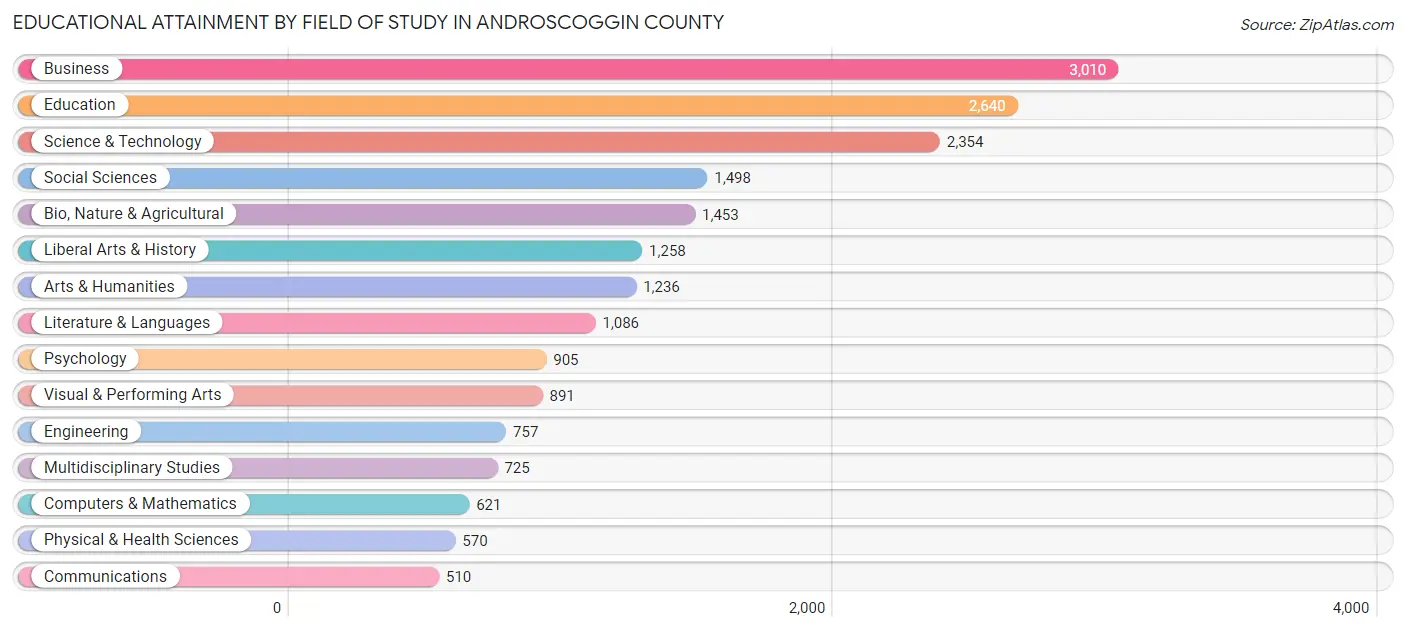
| Field of Study | # Graduates | % Graduates |
| Computers & Mathematics | 621 | 3.2% |
| Bio, Nature & Agricultural | 1,453 | 7.4% |
| Physical & Health Sciences | 570 | 2.9% |
| Psychology | 905 | 4.6% |
| Social Sciences | 1,498 | 7.7% |
| Engineering | 757 | 3.9% |
| Multidisciplinary Studies | 725 | 3.7% |
| Science & Technology | 2,354 | 12.1% |
| Business | 3,010 | 15.4% |
| Education | 2,640 | 13.5% |
| Literature & Languages | 1,086 | 5.6% |
| Liberal Arts & History | 1,258 | 6.5% |
| Visual & Performing Arts | 891 | 4.6% |
| Communications | 510 | 2.6% |
| Arts & Humanities | 1,236 | 6.3% |
| Total | 19,514 | 100.0% |
Transportation & Commute in Androscoggin County
Vehicle Availability by Sex in Androscoggin County
The most prevalent vehicle ownership categories in Androscoggin County are males with 2 vehicles (12,864, accounting for 45.8%) and females with 2 vehicles (11,661, making up 49.8%).
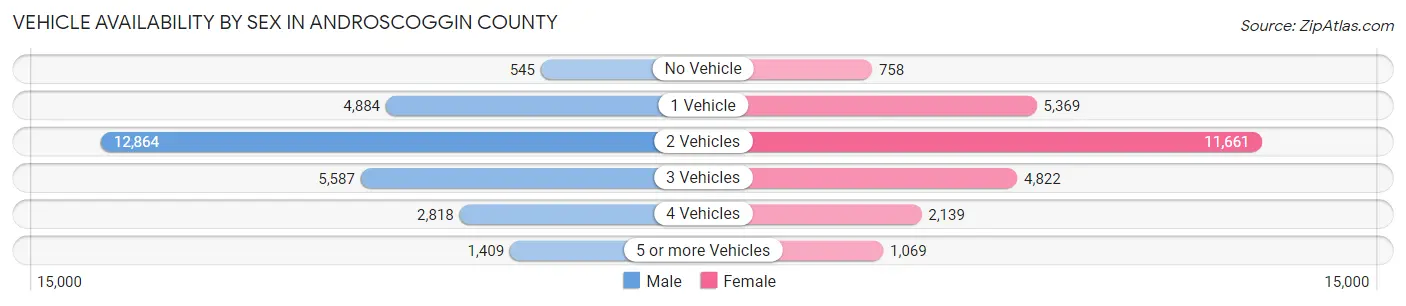
| Vehicles Available | Male | Female |
| No Vehicle | 545 (1.9%) | 758 (2.9%) |
| 1 Vehicle | 4,884 (17.4%) | 5,369 (20.8%) |
| 2 Vehicles | 12,864 (45.8%) | 11,661 (45.2%) |
| 3 Vehicles | 5,587 (19.9%) | 4,822 (18.7%) |
| 4 Vehicles | 2,818 (10.0%) | 2,139 (8.3%) |
| 5 or more Vehicles | 1,409 (5.0%) | 1,069 (4.1%) |
| Total | 28,107 (100.0%) | 25,818 (100.0%) |
Commute Time in Androscoggin County
The most frequently occuring commute durations in Androscoggin County are 10 to 14 minutes (8,322 commuters, 17.1%), 15 to 19 minutes (6,825 commuters, 14.0%), and 5 to 9 minutes (6,709 commuters, 13.8%).
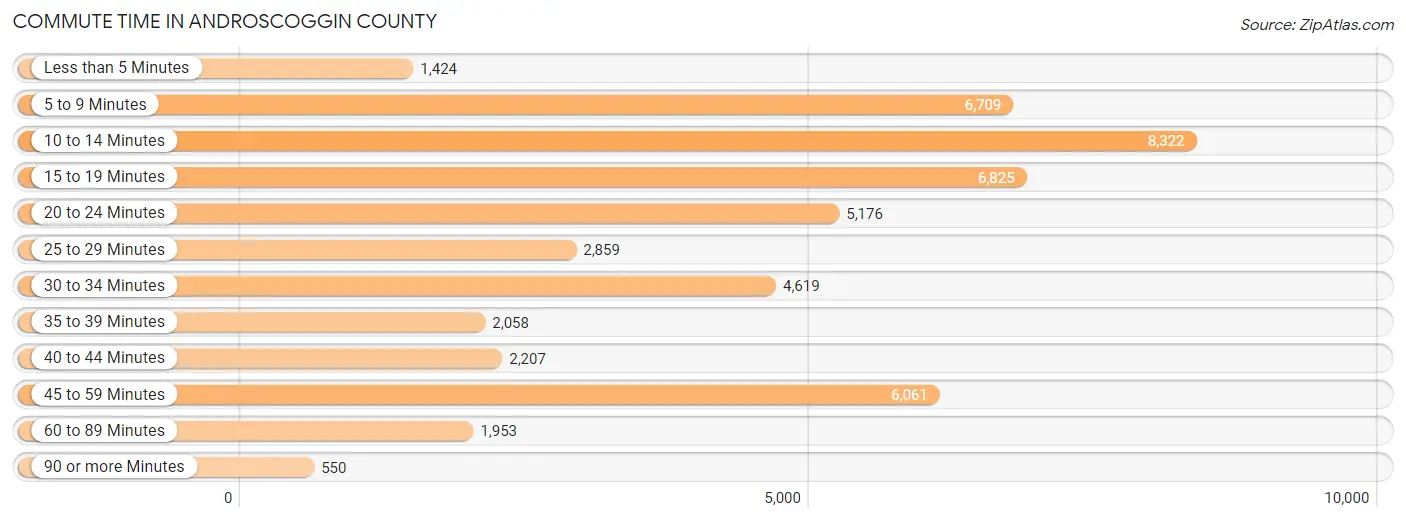
| Commute Time | # Commuters | % Commuters |
| Less than 5 Minutes | 1,424 | 2.9% |
| 5 to 9 Minutes | 6,709 | 13.8% |
| 10 to 14 Minutes | 8,322 | 17.1% |
| 15 to 19 Minutes | 6,825 | 14.0% |
| 20 to 24 Minutes | 5,176 | 10.6% |
| 25 to 29 Minutes | 2,859 | 5.9% |
| 30 to 34 Minutes | 4,619 | 9.5% |
| 35 to 39 Minutes | 2,058 | 4.2% |
| 40 to 44 Minutes | 2,207 | 4.5% |
| 45 to 59 Minutes | 6,061 | 12.4% |
| 60 to 89 Minutes | 1,953 | 4.0% |
| 90 or more Minutes | 550 | 1.1% |
Commute Time by Sex in Androscoggin County
The most common commute times in Androscoggin County are 10 to 14 minutes (3,889 commuters, 14.9%) for males and 10 to 14 minutes (4,433 commuters, 19.5%) for females.
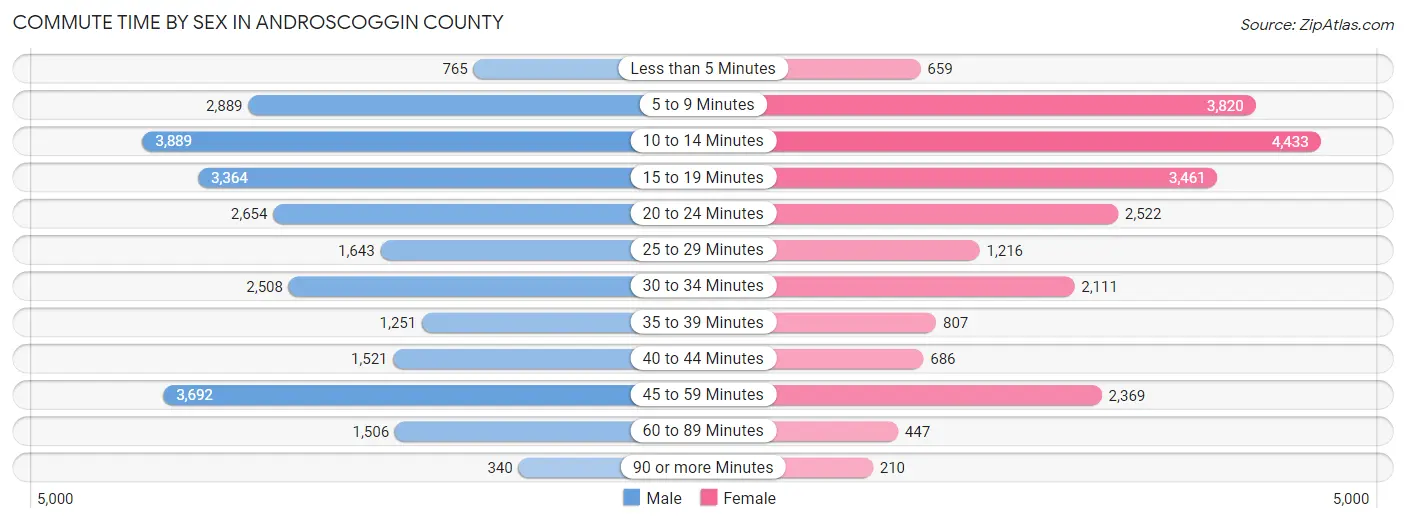
| Commute Time | Male | Female |
| Less than 5 Minutes | 765 (2.9%) | 659 (2.9%) |
| 5 to 9 Minutes | 2,889 (11.1%) | 3,820 (16.8%) |
| 10 to 14 Minutes | 3,889 (14.9%) | 4,433 (19.5%) |
| 15 to 19 Minutes | 3,364 (12.9%) | 3,461 (15.2%) |
| 20 to 24 Minutes | 2,654 (10.2%) | 2,522 (11.1%) |
| 25 to 29 Minutes | 1,643 (6.3%) | 1,216 (5.3%) |
| 30 to 34 Minutes | 2,508 (9.6%) | 2,111 (9.3%) |
| 35 to 39 Minutes | 1,251 (4.8%) | 807 (3.5%) |
| 40 to 44 Minutes | 1,521 (5.9%) | 686 (3.0%) |
| 45 to 59 Minutes | 3,692 (14.2%) | 2,369 (10.4%) |
| 60 to 89 Minutes | 1,506 (5.8%) | 447 (2.0%) |
| 90 or more Minutes | 340 (1.3%) | 210 (0.9%) |
Time of Departure to Work by Sex in Androscoggin County
The most frequent times of departure to work in Androscoggin County are 7:00 AM to 7:29 AM (3,640, 14.0%) for males and 7:30 AM to 7:59 AM (3,499, 15.4%) for females.
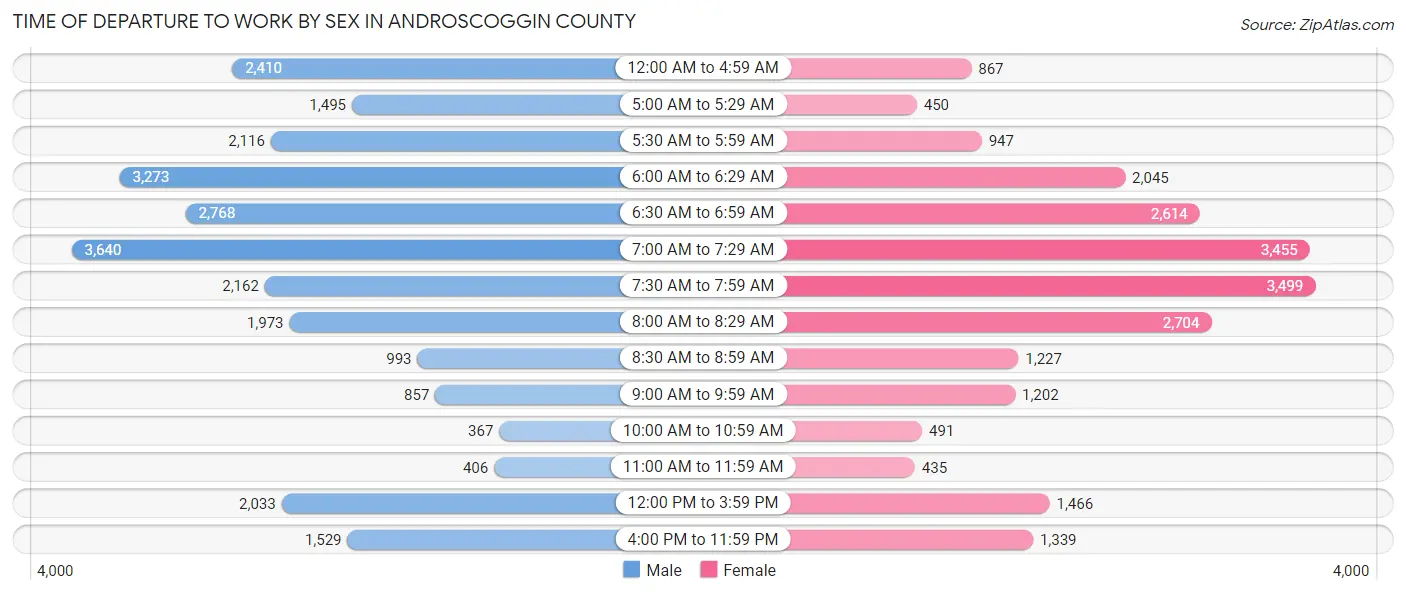
| Time of Departure | Male | Female |
| 12:00 AM to 4:59 AM | 2,410 (9.3%) | 867 (3.8%) |
| 5:00 AM to 5:29 AM | 1,495 (5.8%) | 450 (2.0%) |
| 5:30 AM to 5:59 AM | 2,116 (8.1%) | 947 (4.2%) |
| 6:00 AM to 6:29 AM | 3,273 (12.6%) | 2,045 (9.0%) |
| 6:30 AM to 6:59 AM | 2,768 (10.6%) | 2,614 (11.5%) |
| 7:00 AM to 7:29 AM | 3,640 (14.0%) | 3,455 (15.2%) |
| 7:30 AM to 7:59 AM | 2,162 (8.3%) | 3,499 (15.4%) |
| 8:00 AM to 8:29 AM | 1,973 (7.6%) | 2,704 (11.9%) |
| 8:30 AM to 8:59 AM | 993 (3.8%) | 1,227 (5.4%) |
| 9:00 AM to 9:59 AM | 857 (3.3%) | 1,202 (5.3%) |
| 10:00 AM to 10:59 AM | 367 (1.4%) | 491 (2.2%) |
| 11:00 AM to 11:59 AM | 406 (1.6%) | 435 (1.9%) |
| 12:00 PM to 3:59 PM | 2,033 (7.8%) | 1,466 (6.5%) |
| 4:00 PM to 11:59 PM | 1,529 (5.9%) | 1,339 (5.9%) |
| Total | 26,022 (100.0%) | 22,741 (100.0%) |
Housing Occupancy in Androscoggin County
Occupancy by Ownership in Androscoggin County
Of the total 45,825 dwellings in Androscoggin County, owner-occupied units account for 30,450 (66.4%), while renter-occupied units make up 15,375 (33.6%).
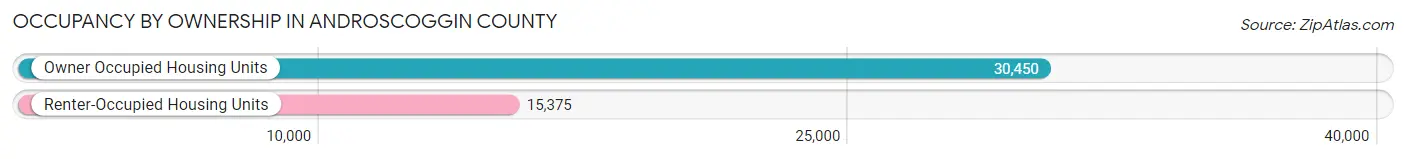
| Occupancy | # Housing Units | % Housing Units |
| Owner Occupied Housing Units | 30,450 | 66.4% |
| Renter-Occupied Housing Units | 15,375 | 33.6% |
| Total Occupied Housing Units | 45,825 | 100.0% |
Occupancy by Household Size in Androscoggin County
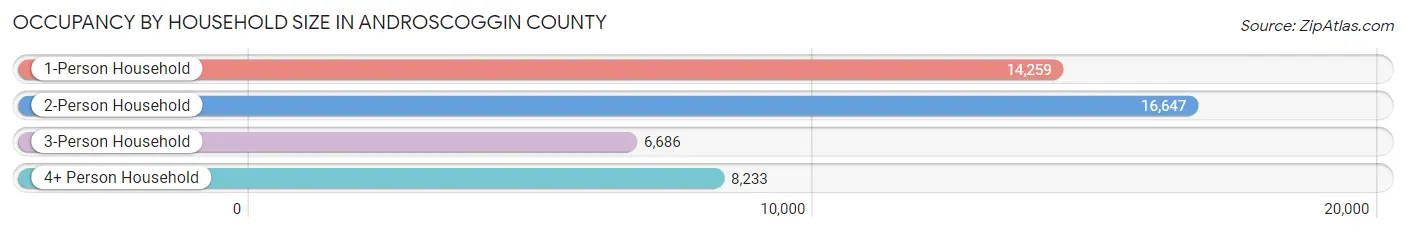
| Household Size | # Housing Units | % Housing Units |
| 1-Person Household | 14,259 | 31.1% |
| 2-Person Household | 16,647 | 36.3% |
| 3-Person Household | 6,686 | 14.6% |
| 4+ Person Household | 8,233 | 18.0% |
| Total Housing Units | 45,825 | 100.0% |
Occupancy by Ownership by Household Size in Androscoggin County
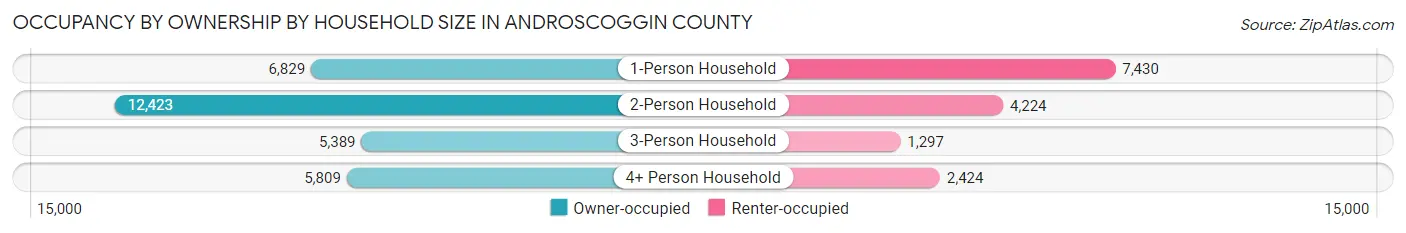
| Household Size | Owner-occupied | Renter-occupied |
| 1-Person Household | 6,829 (47.9%) | 7,430 (52.1%) |
| 2-Person Household | 12,423 (74.6%) | 4,224 (25.4%) |
| 3-Person Household | 5,389 (80.6%) | 1,297 (19.4%) |
| 4+ Person Household | 5,809 (70.6%) | 2,424 (29.4%) |
| Total Housing Units | 30,450 (66.4%) | 15,375 (33.6%) |
Occupancy by Educational Attainment in Androscoggin County
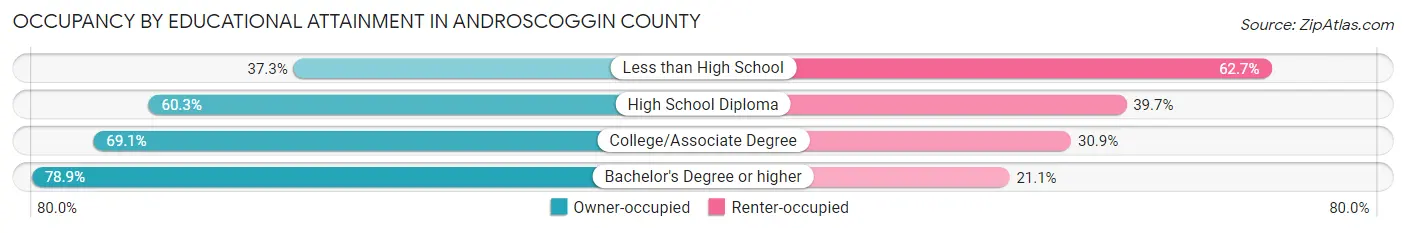
| Household Size | Owner-occupied | Renter-occupied |
| Less than High School | 1,165 (37.3%) | 1,955 (62.7%) |
| High School Diploma | 9,334 (60.3%) | 6,134 (39.7%) |
| College/Associate Degree | 10,814 (69.1%) | 4,837 (30.9%) |
| Bachelor's Degree or higher | 9,137 (78.9%) | 2,449 (21.1%) |
Occupancy by Age of Householder in Androscoggin County

| Age Bracket | # Households | % Households |
| Under 35 Years | 8,183 | 17.9% |
| 35 to 44 Years | 7,246 | 15.8% |
| 45 to 54 Years | 8,186 | 17.9% |
| 55 to 64 Years | 9,532 | 20.8% |
| 65 to 74 Years | 7,535 | 16.4% |
| 75 to 84 Years | 3,833 | 8.4% |
| 85 Years and Over | 1,310 | 2.9% |
| Total | 45,825 | 100.0% |
Housing Finances in Androscoggin County
Median Income by Occupancy in Androscoggin County

| Occupancy Type | # Households | Median Income |
| Owner-Occupied | 30,450 (66.4%) | $84,483 |
| Renter-Occupied | 15,375 (33.6%) | $36,513 |
| Average | 45,825 (100.0%) | $64,500 |
Occupancy by Householder Income Bracket in Androscoggin County
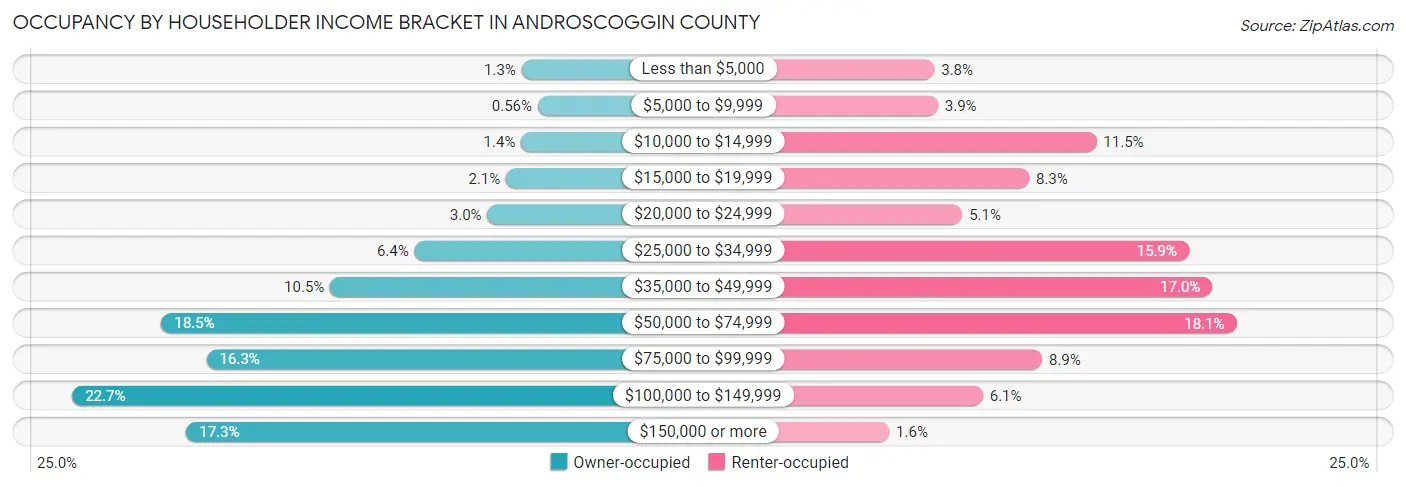
| Income Bracket | Owner-occupied | Renter-occupied |
| Less than $5,000 | 406 (1.3%) | 576 (3.7%) |
| $5,000 to $9,999 | 169 (0.6%) | 603 (3.9%) |
| $10,000 to $14,999 | 410 (1.3%) | 1,764 (11.5%) |
| $15,000 to $19,999 | 631 (2.1%) | 1,270 (8.3%) |
| $20,000 to $24,999 | 900 (3.0%) | 781 (5.1%) |
| $25,000 to $34,999 | 1,959 (6.4%) | 2,440 (15.9%) |
| $35,000 to $49,999 | 3,182 (10.4%) | 2,610 (17.0%) |
| $50,000 to $74,999 | 5,631 (18.5%) | 2,788 (18.1%) |
| $75,000 to $99,999 | 4,975 (16.3%) | 1,366 (8.9%) |
| $100,000 to $149,999 | 6,920 (22.7%) | 931 (6.1%) |
| $150,000 or more | 5,267 (17.3%) | 246 (1.6%) |
| Total | 30,450 (100.0%) | 15,375 (100.0%) |
Monthly Housing Cost Tiers in Androscoggin County
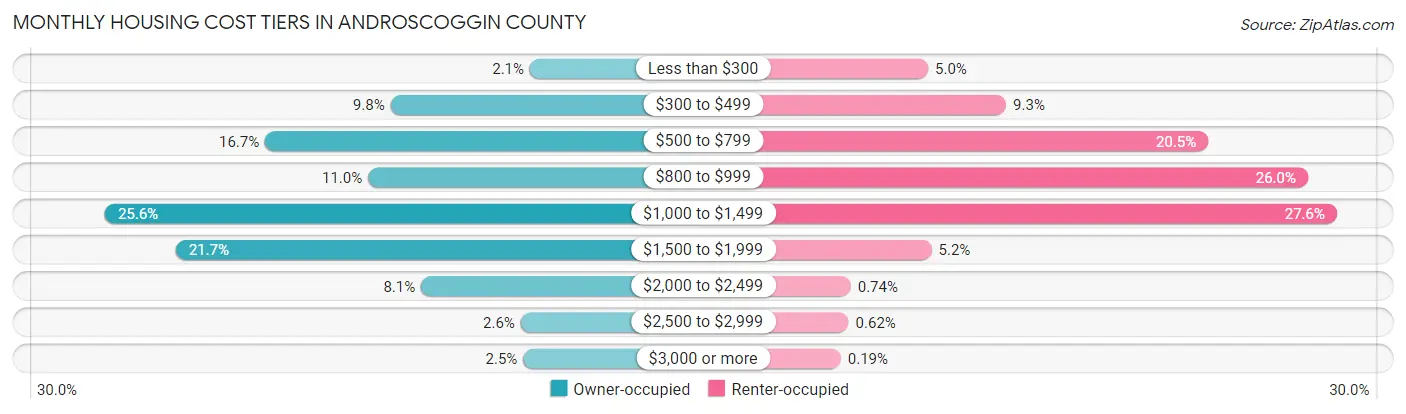
| Monthly Cost | Owner-occupied | Renter-occupied |
| Less than $300 | 636 (2.1%) | 770 (5.0%) |
| $300 to $499 | 2,981 (9.8%) | 1,433 (9.3%) |
| $500 to $799 | 5,092 (16.7%) | 3,148 (20.5%) |
| $800 to $999 | 3,358 (11.0%) | 3,995 (26.0%) |
| $1,000 to $1,499 | 7,783 (25.6%) | 4,240 (27.6%) |
| $1,500 to $1,999 | 6,593 (21.6%) | 800 (5.2%) |
| $2,000 to $2,499 | 2,467 (8.1%) | 114 (0.7%) |
| $2,500 to $2,999 | 792 (2.6%) | 96 (0.6%) |
| $3,000 or more | 748 (2.5%) | 29 (0.2%) |
| Total | 30,450 (100.0%) | 15,375 (100.0%) |
Physical Housing Characteristics in Androscoggin County
Housing Structures in Androscoggin County
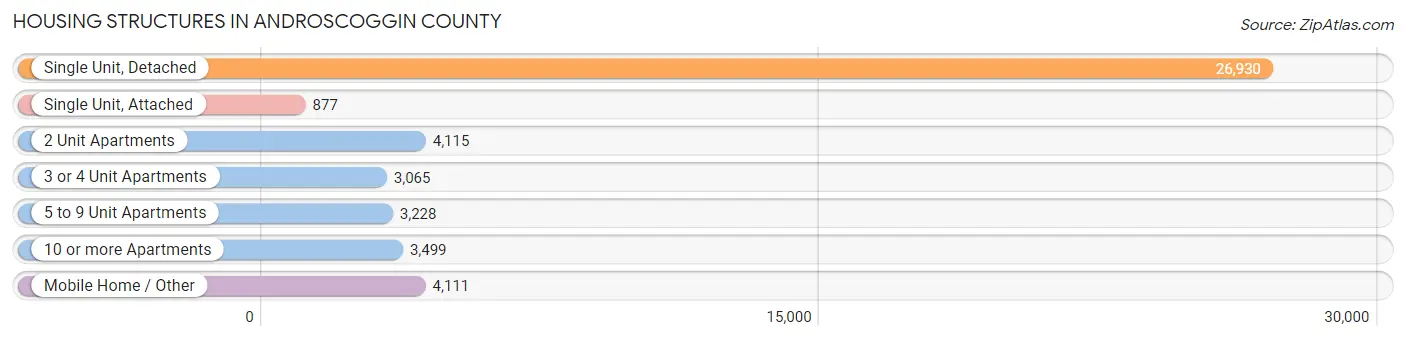
| Structure Type | # Housing Units | % Housing Units |
| Single Unit, Detached | 26,930 | 58.8% |
| Single Unit, Attached | 877 | 1.9% |
| 2 Unit Apartments | 4,115 | 9.0% |
| 3 or 4 Unit Apartments | 3,065 | 6.7% |
| 5 to 9 Unit Apartments | 3,228 | 7.0% |
| 10 or more Apartments | 3,499 | 7.6% |
| Mobile Home / Other | 4,111 | 9.0% |
| Total | 45,825 | 100.0% |
Housing Structures by Occupancy in Androscoggin County

| Structure Type | Owner-occupied | Renter-occupied |
| Single Unit, Detached | 24,988 (92.8%) | 1,942 (7.2%) |
| Single Unit, Attached | 422 (48.1%) | 455 (51.9%) |
| 2 Unit Apartments | 1,178 (28.6%) | 2,937 (71.4%) |
| 3 or 4 Unit Apartments | 428 (14.0%) | 2,637 (86.0%) |
| 5 to 9 Unit Apartments | 204 (6.3%) | 3,024 (93.7%) |
| 10 or more Apartments | 24 (0.7%) | 3,475 (99.3%) |
| Mobile Home / Other | 3,206 (78.0%) | 905 (22.0%) |
| Total | 30,450 (66.4%) | 15,375 (33.6%) |
Housing Structures by Number of Rooms in Androscoggin County
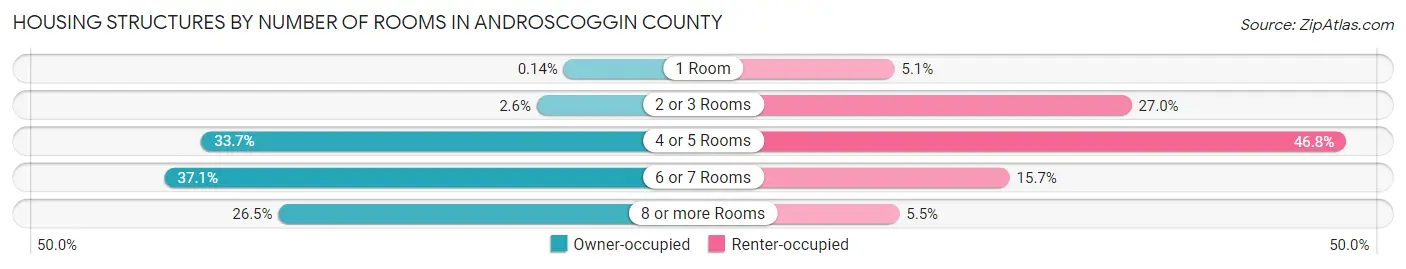
| Number of Rooms | Owner-occupied | Renter-occupied |
| 1 Room | 44 (0.1%) | 776 (5.1%) |
| 2 or 3 Rooms | 801 (2.6%) | 4,145 (27.0%) |
| 4 or 5 Rooms | 10,245 (33.7%) | 7,195 (46.8%) |
| 6 or 7 Rooms | 11,281 (37.0%) | 2,414 (15.7%) |
| 8 or more Rooms | 8,079 (26.5%) | 845 (5.5%) |
| Total | 30,450 (100.0%) | 15,375 (100.0%) |
Housing Structure by Heating Type in Androscoggin County
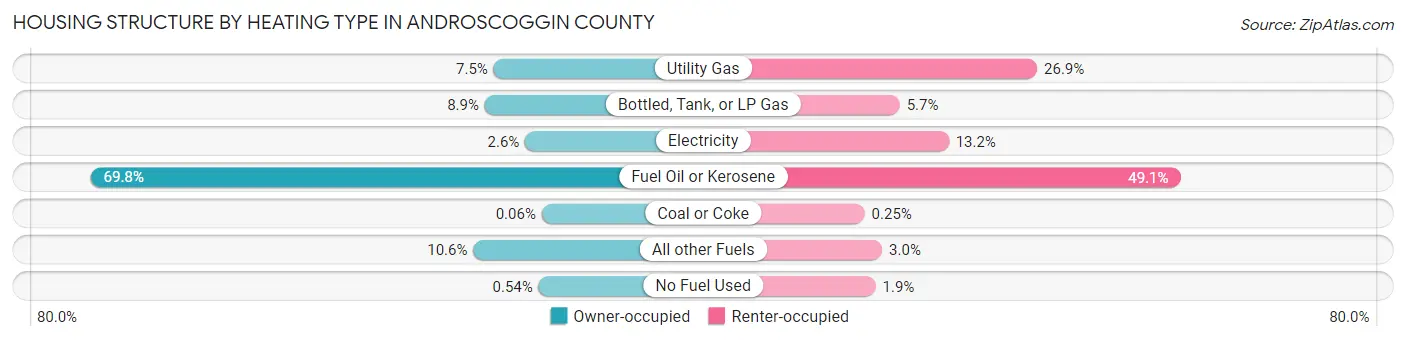
| Heating Type | Owner-occupied | Renter-occupied |
| Utility Gas | 2,278 (7.5%) | 4,137 (26.9%) |
| Bottled, Tank, or LP Gas | 2,698 (8.9%) | 872 (5.7%) |
| Electricity | 799 (2.6%) | 2,035 (13.2%) |
| Fuel Oil or Kerosene | 21,251 (69.8%) | 7,542 (49.0%) |
| Coal or Coke | 18 (0.1%) | 38 (0.3%) |
| All other Fuels | 3,241 (10.6%) | 453 (2.9%) |
| No Fuel Used | 165 (0.5%) | 298 (1.9%) |
| Total | 30,450 (100.0%) | 15,375 (100.0%) |
Household Vehicle Usage in Androscoggin County
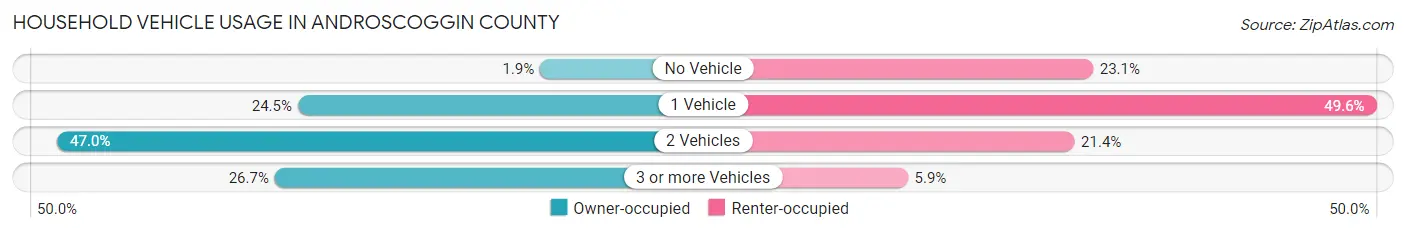
| Vehicles per Household | Owner-occupied | Renter-occupied |
| No Vehicle | 572 (1.9%) | 3,558 (23.1%) |
| 1 Vehicle | 7,461 (24.5%) | 7,627 (49.6%) |
| 2 Vehicles | 14,301 (47.0%) | 3,290 (21.4%) |
| 3 or more Vehicles | 8,116 (26.7%) | 900 (5.9%) |
| Total | 30,450 (100.0%) | 15,375 (100.0%) |
Real Estate & Mortgages in Androscoggin County
Real Estate and Mortgage Overview in Androscoggin County
| Characteristic | Without Mortgage | With Mortgage |
| Housing Units | 10,327 | 20,123 |
| Median Property Value | $196,200 | $219,100 |
| Median Household Income | $61,437 | $3,888 |
| Monthly Housing Costs | $602 | $737 |
| Real Estate Taxes | $2,759 | $234 |
Property Value by Mortgage Status in Androscoggin County
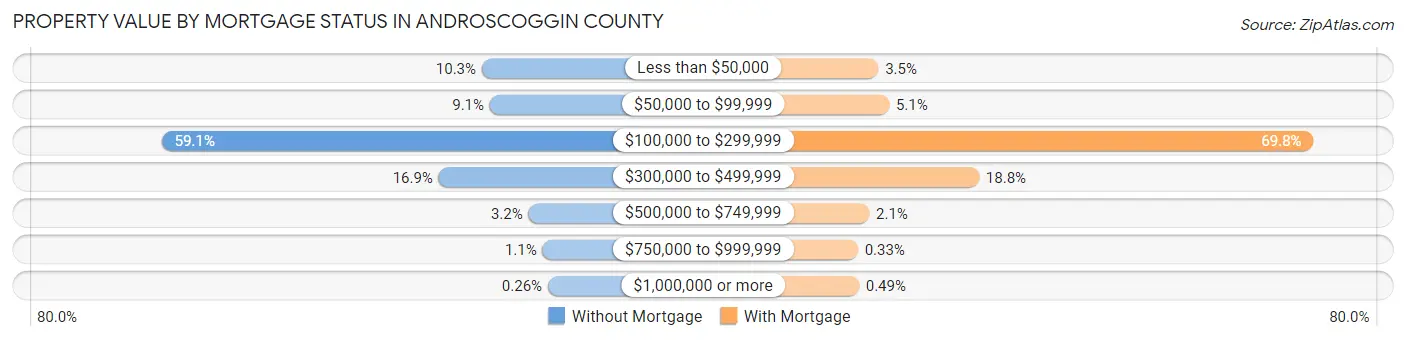
| Property Value | Without Mortgage | With Mortgage |
| Less than $50,000 | 1,066 (10.3%) | 695 (3.5%) |
| $50,000 to $99,999 | 940 (9.1%) | 1,025 (5.1%) |
| $100,000 to $299,999 | 6,106 (59.1%) | 14,039 (69.8%) |
| $300,000 to $499,999 | 1,745 (16.9%) | 3,783 (18.8%) |
| $500,000 to $749,999 | 331 (3.2%) | 417 (2.1%) |
| $750,000 to $999,999 | 112 (1.1%) | 66 (0.3%) |
| $1,000,000 or more | 27 (0.3%) | 98 (0.5%) |
| Total | 10,327 (100.0%) | 20,123 (100.0%) |
Household Income by Mortgage Status in Androscoggin County

| Household Income | Without Mortgage | With Mortgage |
| Less than $10,000 | 265 (2.6%) | 661 (3.3%) |
| $10,000 to $24,999 | 1,160 (11.2%) | 310 (1.5%) |
| $25,000 to $34,999 | 1,008 (9.8%) | 781 (3.9%) |
| $35,000 to $49,999 | 1,668 (16.2%) | 951 (4.7%) |
| $50,000 to $74,999 | 2,196 (21.3%) | 1,514 (7.5%) |
| $75,000 to $99,999 | 1,361 (13.2%) | 3,435 (17.1%) |
| $100,000 to $149,999 | 1,290 (12.5%) | 3,614 (18.0%) |
| $150,000 or more | 1,379 (13.4%) | 5,630 (28.0%) |
| Total | 10,327 (100.0%) | 20,123 (100.0%) |
Property Value to Household Income Ratio in Androscoggin County
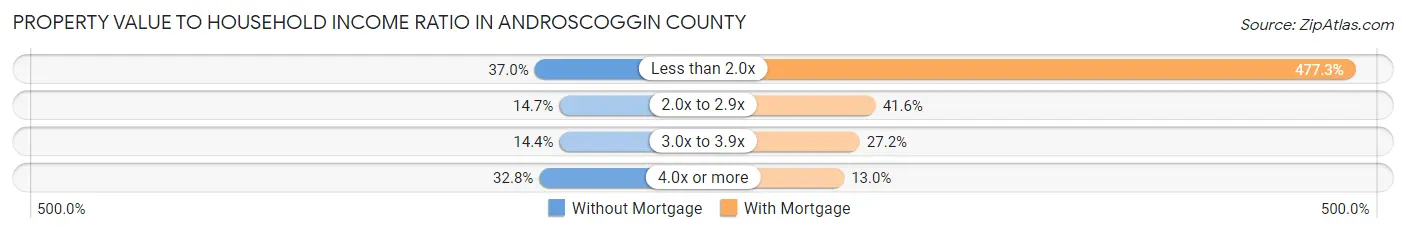
| Value-to-Income Ratio | Without Mortgage | With Mortgage |
| Less than 2.0x | 3,821 (37.0%) | 96,055 (477.3%) |
| 2.0x to 2.9x | 1,514 (14.7%) | 8,366 (41.6%) |
| 3.0x to 3.9x | 1,490 (14.4%) | 5,477 (27.2%) |
| 4.0x or more | 3,383 (32.8%) | 2,605 (13.0%) |
| Total | 10,327 (100.0%) | 20,123 (100.0%) |
Real Estate Taxes by Mortgage Status in Androscoggin County
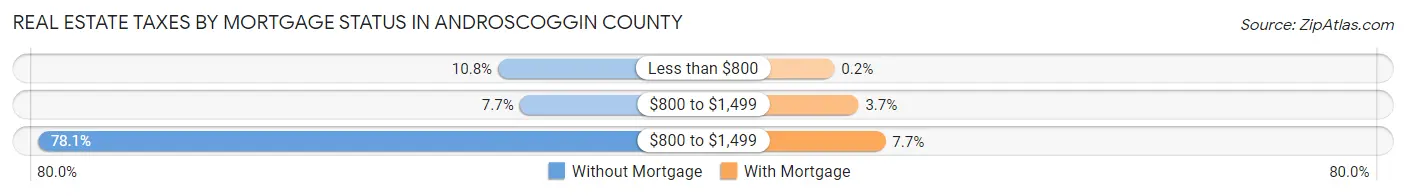
| Property Taxes | Without Mortgage | With Mortgage |
| Less than $800 | 1,119 (10.8%) | 41 (0.2%) |
| $800 to $1,499 | 794 (7.7%) | 749 (3.7%) |
| $800 to $1,499 | 8,063 (78.1%) | 1,540 (7.6%) |
| Total | 10,327 (100.0%) | 20,123 (100.0%) |
Health & Disability in Androscoggin County
Health Insurance Coverage by Age in Androscoggin County
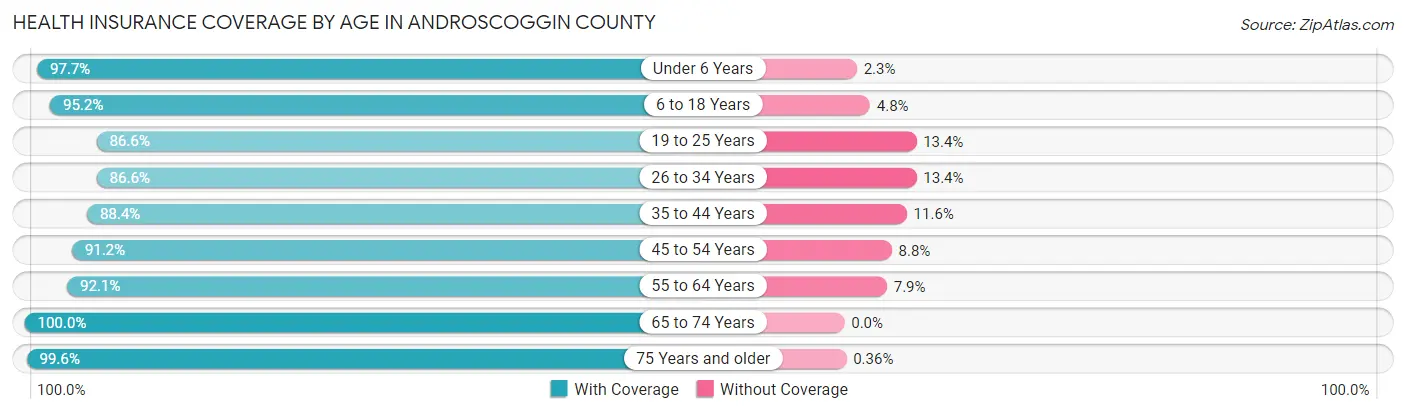
| Age Bracket | With Coverage | Without Coverage |
| Under 6 Years | 7,189 (97.7%) | 170 (2.3%) |
| 6 to 18 Years | 16,974 (95.2%) | 849 (4.8%) |
| 19 to 25 Years | 8,728 (86.6%) | 1,352 (13.4%) |
| 26 to 34 Years | 10,837 (86.6%) | 1,683 (13.4%) |
| 35 to 44 Years | 11,662 (88.4%) | 1,535 (11.6%) |
| 45 to 54 Years | 12,827 (91.2%) | 1,241 (8.8%) |
| 55 to 64 Years | 14,538 (92.1%) | 1,250 (7.9%) |
| 65 to 74 Years | 11,689 (100.0%) | 0 (0.0%) |
| 75 Years and older | 7,445 (99.6%) | 27 (0.4%) |
| Total | 101,889 (92.6%) | 8,107 (7.4%) |
Health Insurance Coverage by Citizenship Status in Androscoggin County
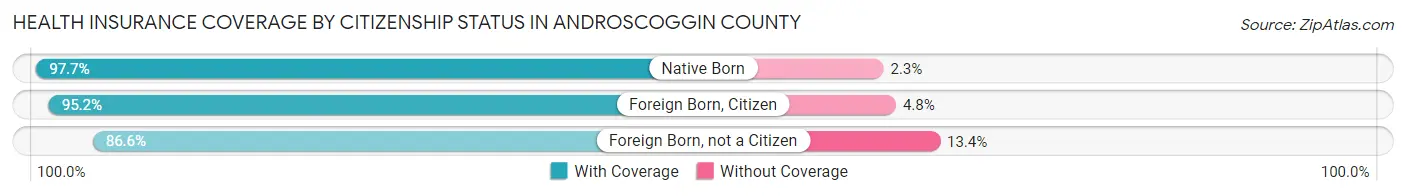
| Citizenship Status | With Coverage | Without Coverage |
| Native Born | 7,189 (97.7%) | 170 (2.3%) |
| Foreign Born, Citizen | 16,974 (95.2%) | 849 (4.8%) |
| Foreign Born, not a Citizen | 8,728 (86.6%) | 1,352 (13.4%) |
Health Insurance Coverage by Household Income in Androscoggin County
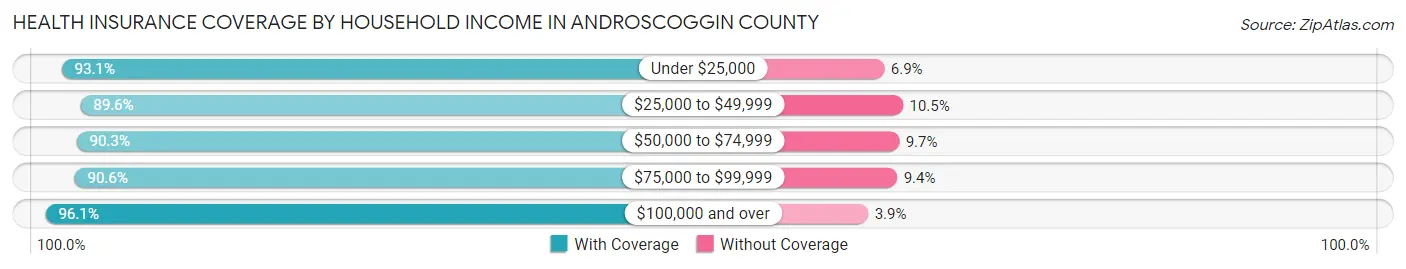
| Household Income | With Coverage | Without Coverage |
| Under $25,000 | 9,884 (93.1%) | 737 (6.9%) |
| $25,000 to $49,999 | 18,211 (89.5%) | 2,124 (10.4%) |
| $50,000 to $74,999 | 17,580 (90.3%) | 1,894 (9.7%) |
| $75,000 to $99,999 | 16,197 (90.6%) | 1,672 (9.4%) |
| $100,000 and over | 38,091 (96.1%) | 1,554 (3.9%) |
Public vs Private Health Insurance Coverage by Age in Androscoggin County
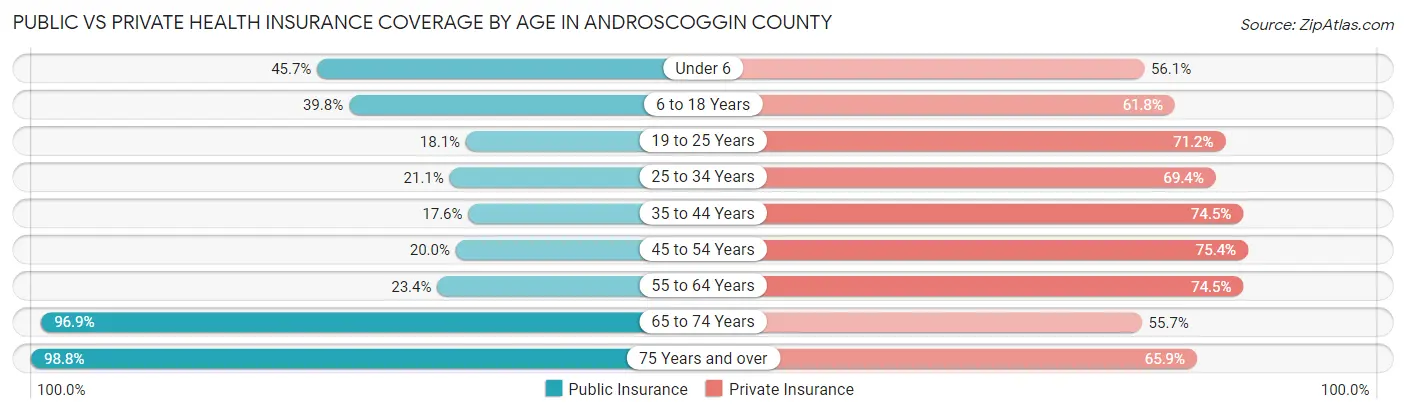
| Age Bracket | Public Insurance | Private Insurance |
| Under 6 | 3,362 (45.7%) | 4,128 (56.1%) |
| 6 to 18 Years | 7,092 (39.8%) | 11,015 (61.8%) |
| 19 to 25 Years | 1,823 (18.1%) | 7,176 (71.2%) |
| 25 to 34 Years | 2,643 (21.1%) | 8,686 (69.4%) |
| 35 to 44 Years | 2,326 (17.6%) | 9,830 (74.5%) |
| 45 to 54 Years | 2,810 (20.0%) | 10,603 (75.4%) |
| 55 to 64 Years | 3,694 (23.4%) | 11,765 (74.5%) |
| 65 to 74 Years | 11,328 (96.9%) | 6,506 (55.7%) |
| 75 Years and over | 7,382 (98.8%) | 4,924 (65.9%) |
| Total | 42,460 (38.6%) | 74,633 (67.8%) |
Disability Status by Sex by Age in Androscoggin County
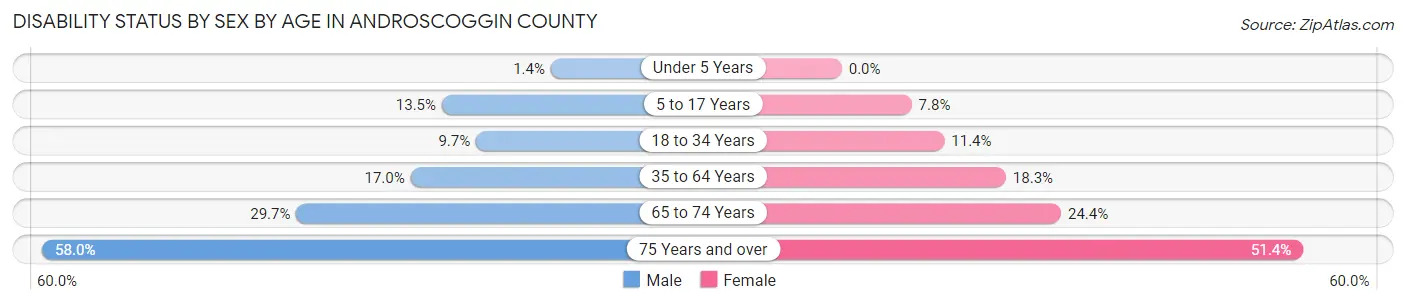
| Age Bracket | Male | Female |
| Under 5 Years | 44 (1.4%) | 0 (0.0%) |
| 5 to 17 Years | 1,199 (13.5%) | 662 (7.8%) |
| 18 to 34 Years | 1,183 (9.7%) | 1,377 (11.4%) |
| 35 to 64 Years | 3,652 (17.0%) | 3,947 (18.3%) |
| 65 to 74 Years | 1,653 (29.7%) | 1,497 (24.4%) |
| 75 Years and over | 1,737 (58.0%) | 2,301 (51.4%) |
Disability Class by Sex by Age in Androscoggin County
Disability Class: Hearing Difficulty
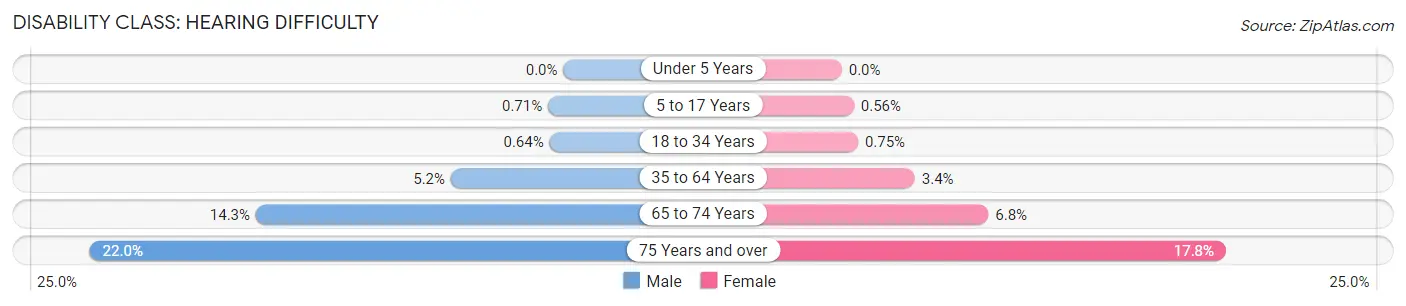
| Age Bracket | Male | Female |
| Under 5 Years | 0 (0.0%) | 0 (0.0%) |
| 5 to 17 Years | 63 (0.7%) | 48 (0.6%) |
| 18 to 34 Years | 78 (0.6%) | 90 (0.7%) |
| 35 to 64 Years | 1,120 (5.2%) | 732 (3.4%) |
| 65 to 74 Years | 793 (14.3%) | 417 (6.8%) |
| 75 Years and over | 658 (22.0%) | 798 (17.8%) |
Disability Class: Vision Difficulty
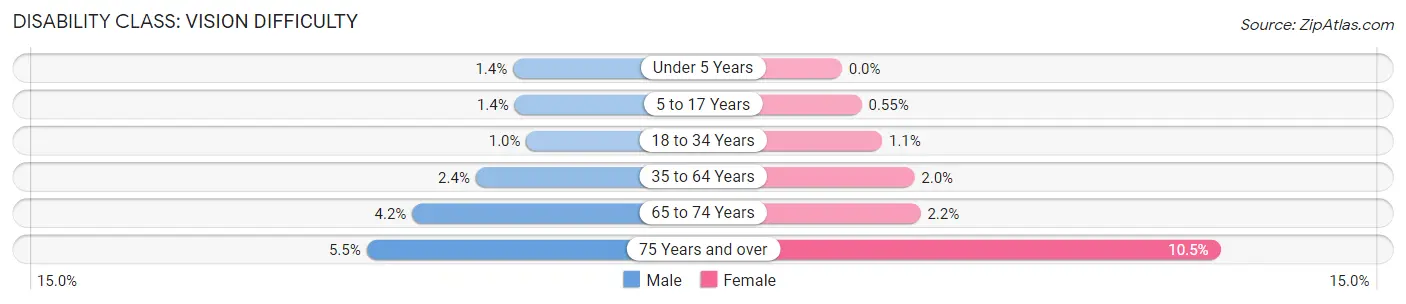
| Age Bracket | Male | Female |
| Under 5 Years | 44 (1.4%) | 0 (0.0%) |
| 5 to 17 Years | 121 (1.4%) | 47 (0.5%) |
| 18 to 34 Years | 125 (1.0%) | 135 (1.1%) |
| 35 to 64 Years | 524 (2.4%) | 436 (2.0%) |
| 65 to 74 Years | 234 (4.2%) | 134 (2.2%) |
| 75 Years and over | 164 (5.5%) | 472 (10.5%) |
Disability Class: Cognitive Difficulty
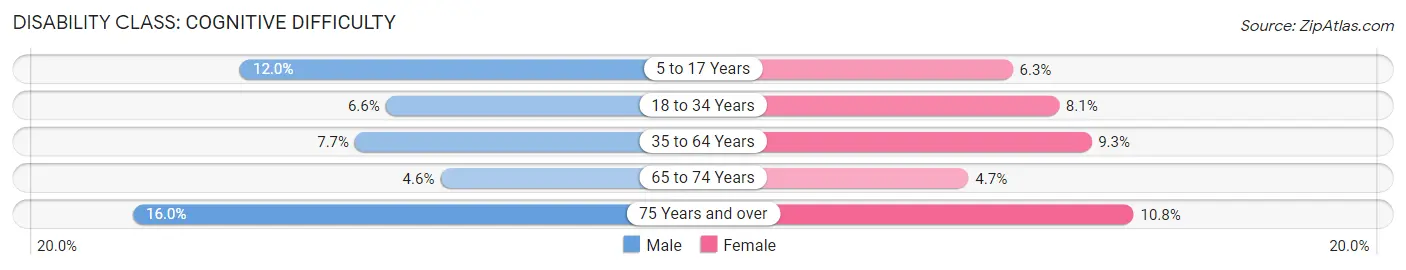
| Age Bracket | Male | Female |
| 5 to 17 Years | 1,064 (12.0%) | 540 (6.3%) |
| 18 to 34 Years | 803 (6.6%) | 972 (8.1%) |
| 35 to 64 Years | 1,660 (7.7%) | 2,000 (9.3%) |
| 65 to 74 Years | 254 (4.6%) | 288 (4.7%) |
| 75 Years and over | 478 (16.0%) | 485 (10.8%) |
Disability Class: Ambulatory Difficulty
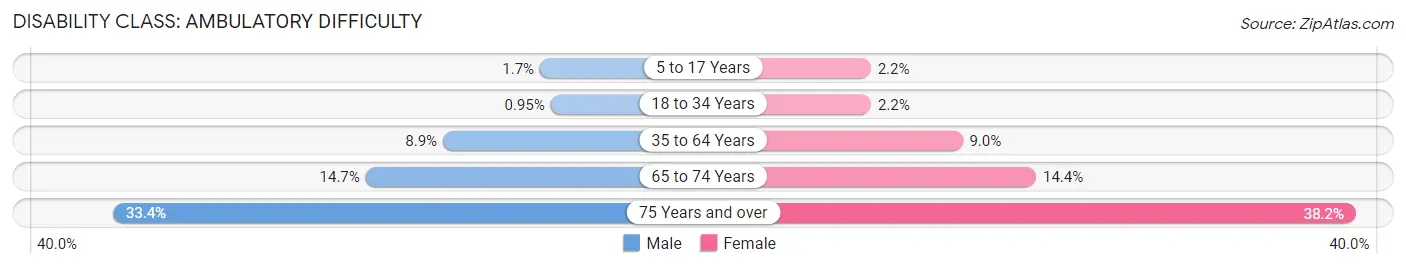
| Age Bracket | Male | Female |
| 5 to 17 Years | 154 (1.7%) | 183 (2.1%) |
| 18 to 34 Years | 116 (0.9%) | 262 (2.2%) |
| 35 to 64 Years | 1,919 (8.9%) | 1,935 (9.0%) |
| 65 to 74 Years | 816 (14.7%) | 884 (14.4%) |
| 75 Years and over | 1,001 (33.4%) | 1,709 (38.2%) |
Disability Class: Self-Care Difficulty
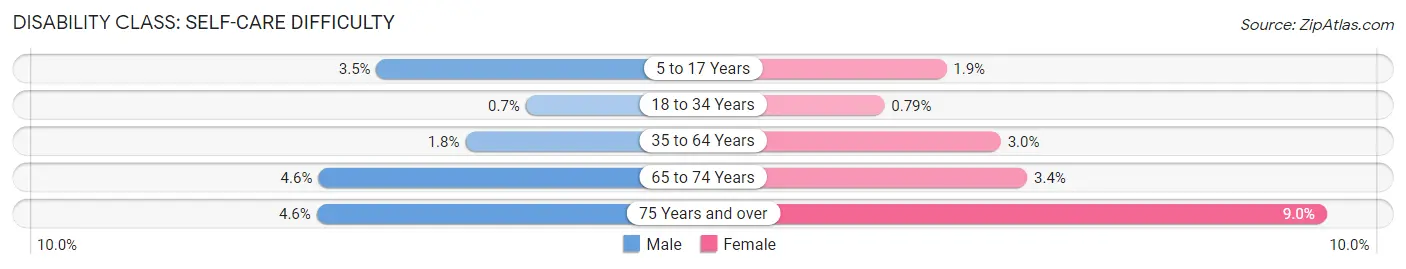
| Age Bracket | Male | Female |
| 5 to 17 Years | 308 (3.5%) | 165 (1.9%) |
| 18 to 34 Years | 85 (0.7%) | 95 (0.8%) |
| 35 to 64 Years | 391 (1.8%) | 638 (2.9%) |
| 65 to 74 Years | 253 (4.5%) | 211 (3.4%) |
| 75 Years and over | 137 (4.6%) | 403 (9.0%) |
Technology Access in Androscoggin County
Computing Device Access in Androscoggin County

| Device Type | # Households | % Households |
| Desktop or Laptop | 35,453 | 77.4% |
| Smartphone | 38,334 | 83.7% |
| Tablet | 28,142 | 61.4% |
| No Computing Device | 3,370 | 7.3% |
| Total | 45,825 | 100.0% |
Internet Access in Androscoggin County
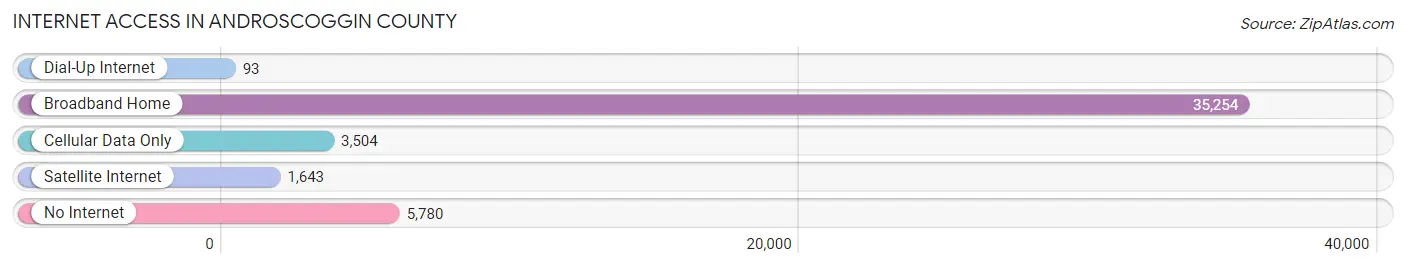
| Internet Type | # Households | % Households |
| Dial-Up Internet | 93 | 0.2% |
| Broadband Home | 35,254 | 76.9% |
| Cellular Data Only | 3,504 | 7.6% |
| Satellite Internet | 1,643 | 3.6% |
| No Internet | 5,780 | 12.6% |
| Total | 45,825 | 100.0% |
Androscoggin County Summary
Androscoggin County is located in the state of Maine, in the United States of America. It is the most populous county in the state, with a population of 107,702 as of the 2020 census. The county seat is Auburn, and the largest city is Lewiston. The county was established in 1854 and is named after the Androscoggin River, which runs through it.
Geography
Androscoggin County is located in the south-central part of Maine, and is bordered by Oxford County to the north, Franklin County to the east, Kennebec County to the south, and Cumberland County to the west. The county covers an area of 1,072 square miles, making it the second-largest county in the state. The terrain is mostly rolling hills, with the highest point being the summit of Mount Apatite, at 1,890 feet. The Androscoggin River runs through the county, and is the main waterway. Other major rivers include the Little Androscoggin, the Nezinscot, and the Sabattus.
The climate of Androscoggin County is classified as humid continental, with cold winters and warm summers. The average annual temperature is around 40°F, and the average annual precipitation is around 40 inches.
Economy
The economy of Androscoggin County is largely based on manufacturing and services. The largest employers in the county are the Central Maine Medical Center, the Lewiston-Auburn Metropolitan Area, and the University of Maine at Augusta. Other major employers include the Androscoggin Valley Hospital, the Maine Department of Corrections, and the Maine Department of Transportation.
The county is also home to several large companies, including the Androscoggin Mill, the Auburn Manufacturing Company, and the Lewiston-Auburn Water District. Agriculture is also an important part of the economy, with dairy farming and apple orchards being the main crops.
Demographics
As of the 2020 census, the population of Androscoggin County was 107,702, making it the most populous county in the state. The population is spread out, with the largest cities being Lewiston (36,592), Auburn (23,945), and Lisbon (9,845). The racial makeup of the county is 94.3% White, 1.7% Black or African American, 0.7% Native American, 1.2% Asian, 0.1% Pacific Islander, 0.7% from other races, and 1.4% from two or more races. The median household income is $45,945, and the median family income is $54,945.
Conclusion
Androscoggin County is a large and diverse county in the state of Maine. It is home to a variety of industries, including manufacturing, services, and agriculture. The population is largely white, with a small percentage of other races. The median household income is slightly above the state average, and the median family income is slightly higher. The county is home to several large cities, and is a great place to live and work.
Common Questions
What is the Total Population of Androscoggin County?
Total Population of Androscoggin County is 111,532.
What is the Total Male Population of Androscoggin County?
Total Male Population of Androscoggin County is 54,855.
What is the Total Female Population of Androscoggin County?
Total Female Population of Androscoggin County is 56,677.
What is the Ratio of Males per 100 Females in Androscoggin County?
There are 96.79 Males per 100 Females in Androscoggin County.
What is the Ratio of Females per 100 Males in Androscoggin County?
There are 103.32 Females per 100 Males in Androscoggin County.
What is the Median Population Age in Androscoggin County?
Median Population Age in Androscoggin County is 40.8 Years.
What is the Average Family Size in Androscoggin County
Average Family Size in Androscoggin County is 3.0 People.
What is the Average Household Size in Androscoggin County
Average Household Size in Androscoggin County is 2.4 People.
What is Per Capita Income in Androscoggin County?
Per Capita income in Androscoggin County is $34,273.
What is the Median Family Income in Androscoggin County?
Median Family Income in Androscoggin County is $82,684.
What is the Median Household income in Androscoggin County?
Median Household Income in Androscoggin County is $64,500.
What is Income or Wage Gap in Androscoggin County?
Income or Wage Gap in Androscoggin County is 18.9%.
Women in Androscoggin County earn 81.1 cents for every dollar earned by a man.
What is Family Income Deficit in Androscoggin County?
Family Income Deficit in Androscoggin County is $9,131.
Families that are below poverty line in Androscoggin County earn $9,131 less on average than the poverty threshold level.
What is Inequality or Gini Index in Androscoggin County?
Inequality or Gini Index in Androscoggin County is 0.43.
How Large is the Labor Force in Androscoggin County?
There are 58,934 People in the Labor Forcein in Androscoggin County.
What is the Percentage of People in the Labor Force in Androscoggin County?
65.0% of People are in the Labor Force in Androscoggin County.
What is the Unemployment Rate in Androscoggin County?
Unemployment Rate in Androscoggin County is 4.8%.