Zip Codes with the Highest Percentage of Population Employed in Arts, Entertainment & Recreation in Saint Charles, IL
RELATED REPORTS & OPTIONS
Arts, Entertainment & Recreation
Saint Charles
Compare Zip Codes
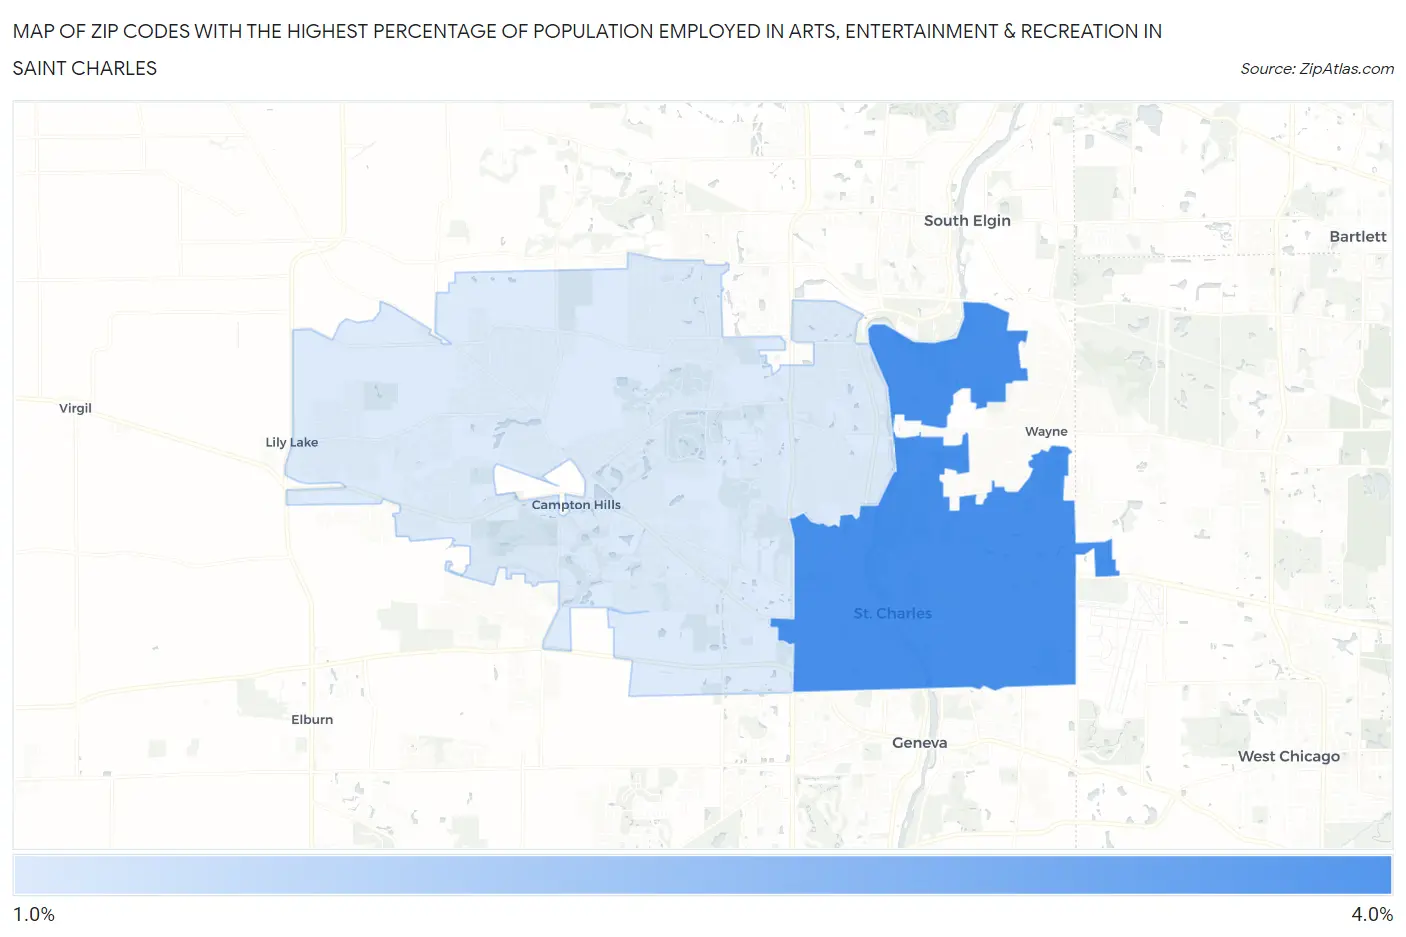
Map of Zip Codes with the Highest Percentage of Population Employed in Arts, Entertainment & Recreation in Saint Charles
0.0%
4.0%
Zip Codes with the Highest Percentage of Population Employed in Arts, Entertainment & Recreation in Saint Charles, IL
| Zip Code | % Employed | vs State | vs National | |
| 1. | 60174 | 3.8% | 1.9%(+1.83)#75 | 2.1%(+1.69)#3,677 |
| 2. | 60175 | 1.5% | 1.9%(-0.419)#485 | 2.1%(-0.567)#13,137 |
1
Common Questions
What are the Top Zip Codes with the Highest Percentage of Population Employed in Arts, Entertainment & Recreation in Saint Charles, IL?
Top Zip Codes with the Highest Percentage of Population Employed in Arts, Entertainment & Recreation in Saint Charles, IL are:
What zip code has the Highest Percentage of Population Employed in Arts, Entertainment & Recreation in Saint Charles, IL?
60174 has the Highest Percentage of Population Employed in Arts, Entertainment & Recreation in Saint Charles, IL with 3.8%.
What is the Percentage of Population Employed in Arts, Entertainment & Recreation in Illinois?
Percentage of Population Employed in Arts, Entertainment & Recreation in Illinois is 1.9%.
What is the Percentage of Population Employed in Arts, Entertainment & Recreation in the United States?
Percentage of Population Employed in Arts, Entertainment & Recreation in the United States is 2.1%.