Zip Codes with the Highest Percentage of Population Employed in Office & Administration in Nampa, ID
RELATED REPORTS & OPTIONS
Office & Administration
Nampa
Compare Zip Codes
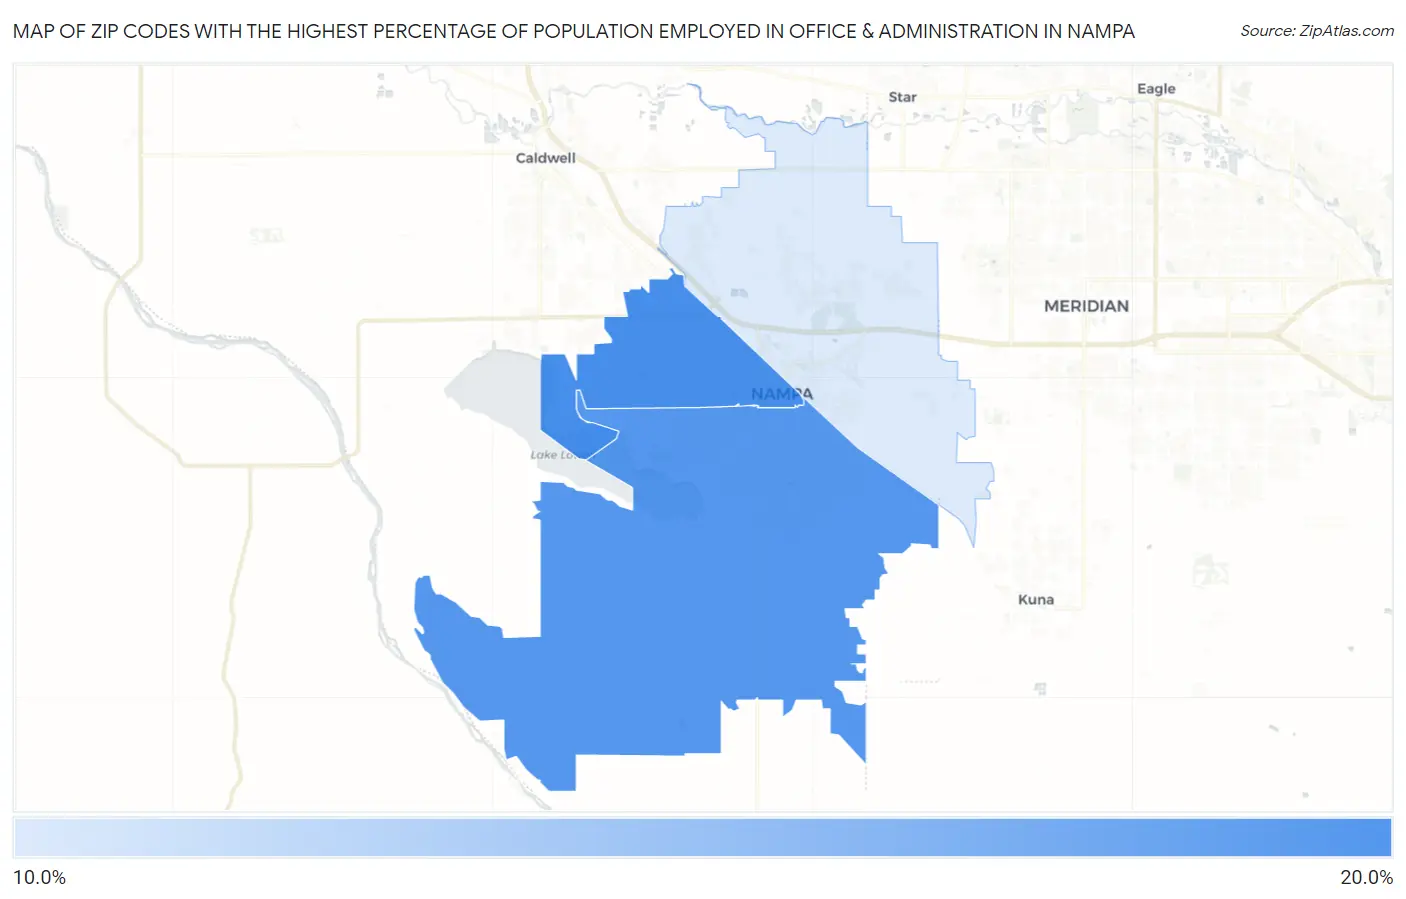
Map of Zip Codes with the Highest Percentage of Population Employed in Office & Administration in Nampa
0.0%
20.0%
Zip Codes with the Highest Percentage of Population Employed in Office & Administration in Nampa, ID
| Zip Code | % Employed | vs State | vs National | |
| 1. | 83651 | 15.0% | 11.2%(+3.87)#39 | 10.9%(+4.17)#4,529 |
| 2. | 83686 | 14.9% | 11.2%(+3.71)#42 | 10.9%(+4.01)#4,745 |
| 3. | 83687 | 13.4% | 11.2%(+2.23)#65 | 10.9%(+2.53)#7,171 |
1
Common Questions
What are the Top Zip Codes with the Highest Percentage of Population Employed in Office & Administration in Nampa, ID?
Top Zip Codes with the Highest Percentage of Population Employed in Office & Administration in Nampa, ID are:
What zip code has the Highest Percentage of Population Employed in Office & Administration in Nampa, ID?
83651 has the Highest Percentage of Population Employed in Office & Administration in Nampa, ID with 15.0%.
What is the Percentage of Population Employed in Office & Administration in Nampa, ID?
Percentage of Population Employed in Office & Administration in Nampa is 15.6%.
What is the Percentage of Population Employed in Office & Administration in Idaho?
Percentage of Population Employed in Office & Administration in Idaho is 11.2%.
What is the Percentage of Population Employed in Office & Administration in the United States?
Percentage of Population Employed in Office & Administration in the United States is 10.9%.