Zip Codes with the Highest Percentage of Population Employed in Office & Administration in Urbandale, IA
RELATED REPORTS & OPTIONS
Office & Administration
Urbandale
Compare Zip Codes
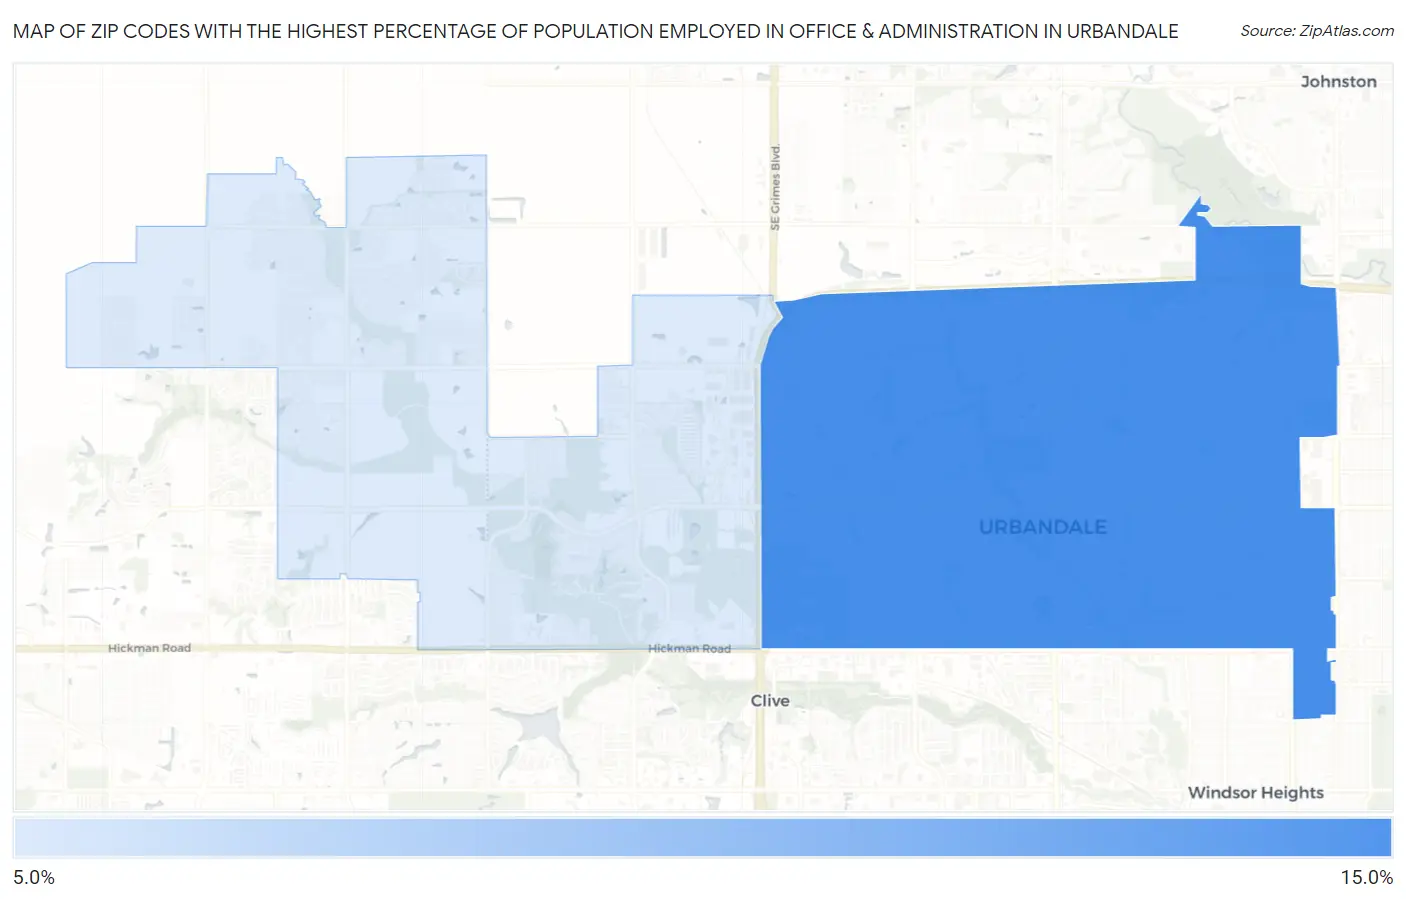
Map of Zip Codes with the Highest Percentage of Population Employed in Office & Administration in Urbandale
0.0%
15.0%
Zip Codes with the Highest Percentage of Population Employed in Office & Administration in Urbandale, IA
| Zip Code | % Employed | vs State | vs National | |
| 1. | 50322 | 12.2% | 10.6%(+1.61)#296 | 10.9%(+1.39)#10,014 |
| 2. | 50323 | 9.8% | 10.6%(-0.803)#489 | 10.9%(-1.02)#17,661 |
1
Common Questions
What are the Top Zip Codes with the Highest Percentage of Population Employed in Office & Administration in Urbandale, IA?
Top Zip Codes with the Highest Percentage of Population Employed in Office & Administration in Urbandale, IA are:
What zip code has the Highest Percentage of Population Employed in Office & Administration in Urbandale, IA?
50322 has the Highest Percentage of Population Employed in Office & Administration in Urbandale, IA with 12.2%.
What is the Percentage of Population Employed in Office & Administration in Urbandale, IA?
Percentage of Population Employed in Office & Administration in Urbandale is 11.6%.
What is the Percentage of Population Employed in Office & Administration in Iowa?
Percentage of Population Employed in Office & Administration in Iowa is 10.6%.
What is the Percentage of Population Employed in Office & Administration in the United States?
Percentage of Population Employed in Office & Administration in the United States is 10.9%.