Zip Codes with the Highest Percentage of Population Employed in Accommodation & Food Services in Melcher Dallas, IA
RELATED REPORTS & OPTIONS
Accommodation & Food Services
Melcher Dallas
Compare Zip Codes
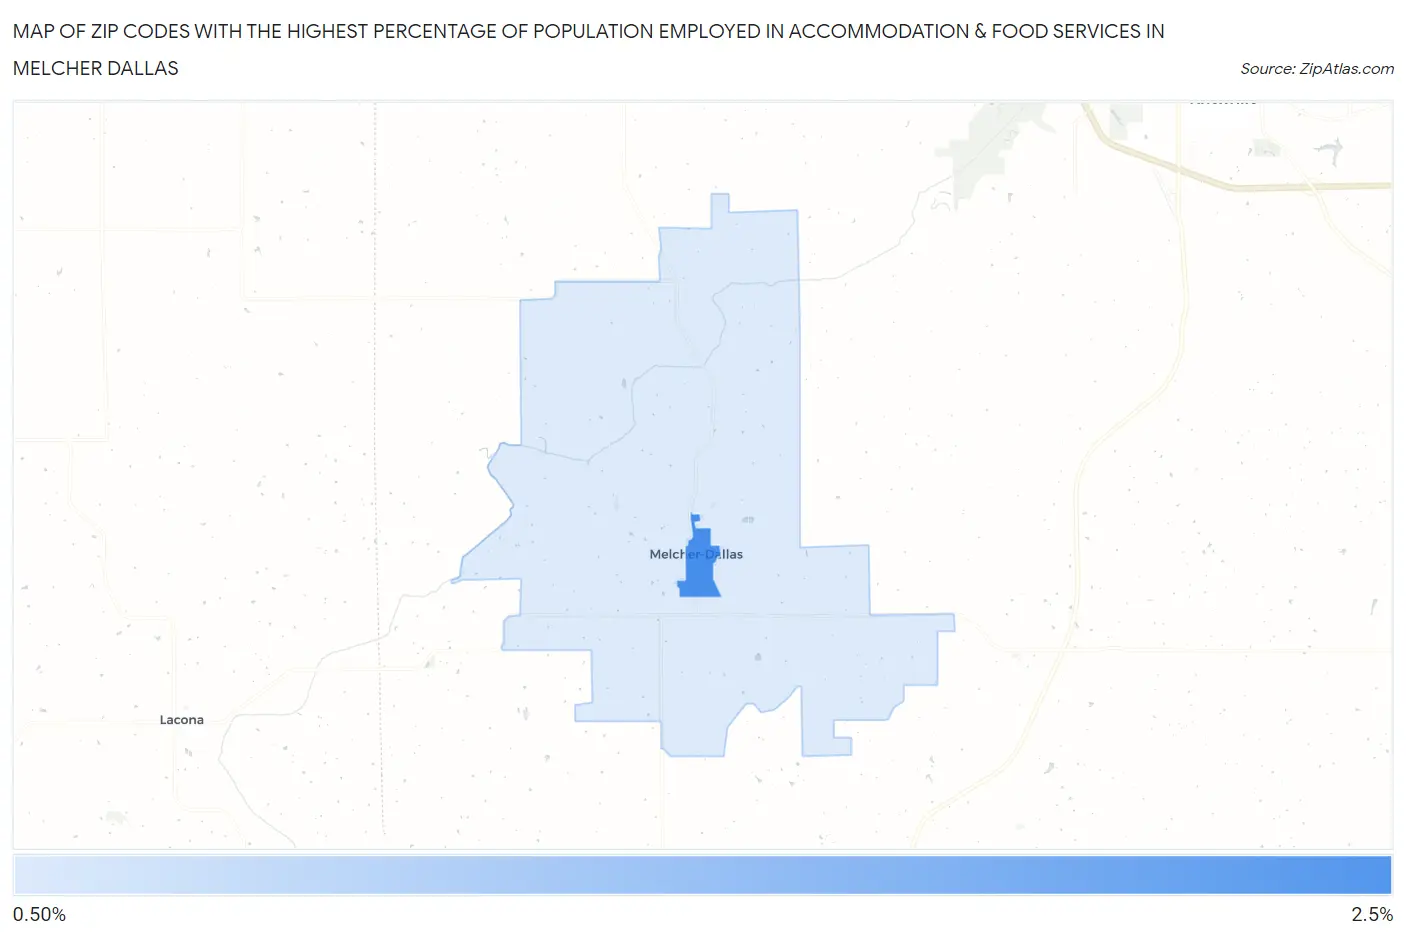
Map of Zip Codes with the Highest Percentage of Population Employed in Accommodation & Food Services in Melcher Dallas
0.0%
2.5%
Zip Codes with the Highest Percentage of Population Employed in Accommodation & Food Services in Melcher Dallas, IA
| Zip Code | % Employed | vs State | vs National | |
| 1. | 50163 | 2.2% | 5.5%(-3.31)#565 | 6.9%(-4.70)#25,193 |
| 2. | 50062 | 1.4% | 5.5%(-4.06)#677 | 6.9%(-5.44)#26,584 |
1
Common Questions
What are the Top Zip Codes with the Highest Percentage of Population Employed in Accommodation & Food Services in Melcher Dallas, IA?
Top Zip Codes with the Highest Percentage of Population Employed in Accommodation & Food Services in Melcher Dallas, IA are:
What zip code has the Highest Percentage of Population Employed in Accommodation & Food Services in Melcher Dallas, IA?
50163 has the Highest Percentage of Population Employed in Accommodation & Food Services in Melcher Dallas, IA with 2.2%.
What is the Percentage of Population Employed in Accommodation & Food Services in Melcher Dallas, IA?
Percentage of Population Employed in Accommodation & Food Services in Melcher Dallas is 2.2%.
What is the Percentage of Population Employed in Accommodation & Food Services in Iowa?
Percentage of Population Employed in Accommodation & Food Services in Iowa is 5.5%.
What is the Percentage of Population Employed in Accommodation & Food Services in the United States?
Percentage of Population Employed in Accommodation & Food Services in the United States is 6.9%.