Zip Codes with the Highest Percentage of Population Taking Taxi / Cab to Work in Des Moines, IA
RELATED REPORTS & OPTIONS
Taxi / Cab
Des Moines
Compare Zip Codes
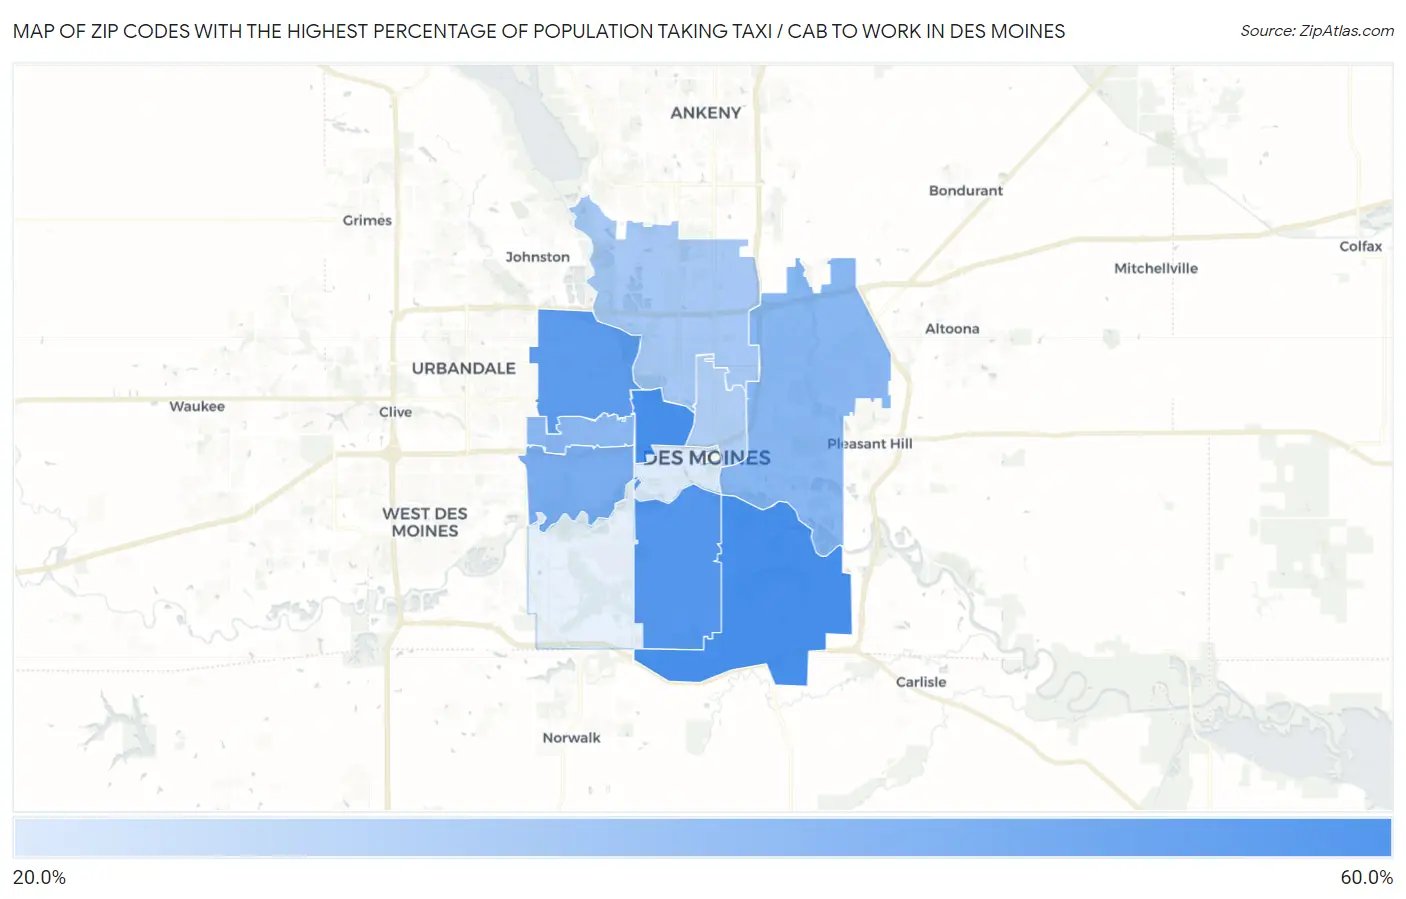
Map of Zip Codes with the Highest Percentage of Population Taking Taxi / Cab to Work in Des Moines
0.0%
60.0%
Zip Codes with the Highest Percentage of Population Taking Taxi / Cab to Work in Des Moines, IA
| Zip Code | % Take Taxi / Cab | vs State | vs National | |
| 1. | 50320 | 50.4% | 38.9%(+11.5)#42 | 38.2%(+12.2)#2,821 |
| 2. | 50314 | 50.3% | 38.9%(+11.4)#43 | 38.2%(+12.1)#2,874 |
| 3. | 50315 | 47.8% | 38.9%(+8.90)#59 | 38.2%(+9.60)#3,674 |
| 4. | 50310 | 46.3% | 38.9%(+7.40)#65 | 38.2%(+8.10)#4,200 |
| 5. | 50312 | 41.1% | 38.9%(+2.20)#96 | 38.2%(+2.90)#6,126 |
| 6. | 50317 | 38.7% | 38.9%(-0.200)#109 | 38.2%(+0.500)#7,173 |
| 7. | 50311 | 38.3% | 38.9%(-0.600)#111 | 38.2%(+0.100)#7,371 |
| 8. | 50313 | 33.7% | 38.9%(-5.20)#137 | 38.2%(-4.50)#9,486 |
| 9. | 50316 | 32.1% | 38.9%(-6.80)#142 | 38.2%(-6.10)#10,141 |
| 10. | 50309 | 24.6% | 38.9%(-14.3)#184 | 38.2%(-13.6)#12,350 |
1
Common Questions
What are the Top 10 Zip Codes with the Highest Percentage of Population Taking Taxi / Cab to Work in Des Moines, IA?
Top 10 Zip Codes with the Highest Percentage of Population Taking Taxi / Cab to Work in Des Moines, IA are:
What zip code has the Highest Percentage of Population Taking Taxi / Cab to Work in Des Moines, IA?
50320 has the Highest Percentage of Population Taking Taxi / Cab to Work in Des Moines, IA with 50.4%.
What is the Percentage of Population Taking Taxi / Cab to Work in Des Moines, IA?
Percentage of Population Taking Taxi / Cab to Work in Des Moines is 37.9%.
What is the Percentage of Population Taking Taxi / Cab to Work in Iowa?
Percentage of Population Taking Taxi / Cab to Work in Iowa is 38.9%.
What is the Percentage of Population Taking Taxi / Cab to Work in the United States?
Percentage of Population Taking Taxi / Cab to Work in the United States is 38.2%.