Zip Codes with the Highest Percentage of Population Employed in Farming, Fishing & Forestry in Naples, FL

RELATED REPORTS & OPTIONS

Farming, Fishing & Forestry
Population
Families and Households
Female Fertility
Female Fertility (Unmarried)
Race (Community Size)
Race (Percentage)
Ancestry (Community Size)
AfricanAlbanianAmericanApacheArabArgentineanArmenianAustralianAustrianBahamianBelgianBelizeanBhutaneseBlackfeetBolivianBrazilianBritishBritish West IndianBulgarianBurmeseCajunCanadianCelticCentral AmericanCentral American IndianCherokeeChickasawChileanColombianCosta RicanCreekCroatianCubanCzechCzechoslovakianDanishDominicanDutchEastern EuropeanEcuadorianEgyptianEnglishEstonianEuropeanFinnishFrenchFrench American IndianFrench CanadianGermanGreekGuatemalanGuyaneseHaitianHonduranHungarianIcelanderIndian (Asian)IndonesianIranianIraqiIrishIsraeliItalianJamaicanJapaneseKoreanLaotianLatvianLebaneseLithuanianLuxembourgerMacedonianMalteseMexicanMexican American IndianMoroccanNative HawaiianNavajoNicaraguanNorthern EuropeanNorwegianPakistaniPalestinianPanamanianParaguayanPennsylvania GermanPeruvianPolishPortuguesePuerto RicanRomanianRussianSalvadoranSamoanScandinavianScotch-IrishScottishSeminoleSerbianSlavicSlovakSloveneSouth AfricanSouth AmericanSpaniardSpanishSri LankanSubsaharan AfricanSwedishSwissSyrianThaiTrinidadian and TobagonianTurkishU.S. Virgin IslanderUkrainianUruguayanVenezuelanWelshWest IndianYugoslavian
Ancestry (Percentage)
AfricanAlbanianAmericanApacheArabArgentineanArmenianAustralianAustrianBahamianBelgianBelizeanBhutaneseBlackfeetBolivianBrazilianBritishBritish West IndianBulgarianBurmeseCajunCanadianCelticCentral AmericanCentral American IndianCherokeeChickasawChileanColombianCosta RicanCreekCroatianCubanCzechCzechoslovakianDanishDominicanDutchEastern EuropeanEcuadorianEgyptianEnglishEstonianEuropeanFinnishFrenchFrench American IndianFrench CanadianGermanGreekGuatemalanGuyaneseHaitianHonduranHungarianIcelanderIndian (Asian)IndonesianIranianIraqiIrishIsraeliItalianJamaicanJapaneseKoreanLaotianLatvianLebaneseLithuanianLuxembourgerMacedonianMalteseMexicanMexican American IndianMoroccanNative HawaiianNavajoNicaraguanNorthern EuropeanNorwegianPakistaniPalestinianPanamanianParaguayanPennsylvania GermanPeruvianPolishPortuguesePuerto RicanRomanianRussianSalvadoranSamoanScandinavianScotch-IrishScottishSeminoleSerbianSlavicSlovakSloveneSouth AfricanSouth AmericanSpaniardSpanishSri LankanSubsaharan AfricanSwedishSwissSyrianThaiTrinidadian and TobagonianTurkishU.S. Virgin IslanderUkrainianUruguayanVenezuelanWelshWest IndianYugoslavian
Immigrant Origin (Total)
AfricaAlbaniaArgentinaAsiaAustraliaAustriaBahamasBarbadosBelarusBelgiumBelizeBoliviaBosnia and HerzegovinaBrazilBulgariaCambodiaCanadaCaribbeanCentral AmericaChileChinaColombiaCosta RicaCroatiaCubaCzechoslovakiaDenmarkDominican RepublicEastern AfricaEastern AsiaEastern EuropeEcuadorEgyptEl SalvadorEnglandEuropeFranceGermanyGreeceGuatemalaGuyanaHaitiHondurasHong KongHungaryIndiaIranIrelandIsraelItalyJamaicaJapanJordanKoreaLatin AmericaLebanonLithuaniaMalaysiaMexicoMiddle AfricaMoldovaNetherlandsNicaraguaNorth MacedoniaNorthern AfricaNorthern EuropeNorwayOceaniaPakistanPanamaPeruPhilippinesPolandPortugalRomaniaRussiaScotlandSerbiaSouth AfricaSouth AmericaSouth Central AsiaSouth Eastern AsiaSouthern EuropeSpainSri LankaSwedenSwitzerlandSyriaTaiwanThailandTrinidad and TobagoTurkeyUkraineUruguayUzbekistanVenezuelaVietnamWestern AsiaWestern Europe
Immigrant Origin (Percentage)
AfricaAlbaniaArgentinaAsiaAustraliaAustriaBahamasBarbadosBelarusBelgiumBelizeBoliviaBosnia and HerzegovinaBrazilBulgariaCambodiaCanadaCaribbeanCentral AmericaChileChinaColombiaCosta RicaCroatiaCubaCzechoslovakiaDenmarkDominican RepublicEastern AfricaEastern AsiaEastern EuropeEcuadorEgyptEl SalvadorEnglandEuropeFranceGermanyGreeceGuatemalaGuyanaHaitiHondurasHong KongHungaryIndiaIranIrelandIsraelItalyJamaicaJapanJordanKoreaLatin AmericaLebanonLithuaniaMalaysiaMexicoMiddle AfricaMoldovaNetherlandsNicaraguaNorth MacedoniaNorthern AfricaNorthern EuropeNorwayOceaniaPakistanPanamaPeruPhilippinesPolandPortugalRomaniaRussiaScotlandSerbiaSouth AfricaSouth AmericaSouth Central AsiaSouth Eastern AsiaSouthern EuropeSpainSri LankaSwedenSwitzerlandSyriaTaiwanThailandTrinidad and TobagoTurkeyUkraineUruguayUzbekistanVenezuelaVietnamWestern AsiaWestern Europe
Income
Income (Families)
Income (Households)
Poverty
Poverty (Families)
Unemployment
Employment Occupations
Employment Industries
Employer Class
Commute Time
Commute Means
School Enrollment
Education by Degree Field
Occupancy
Finances
Physical Characteristics
Naples
Compare Zip Codes
Comparison Subject

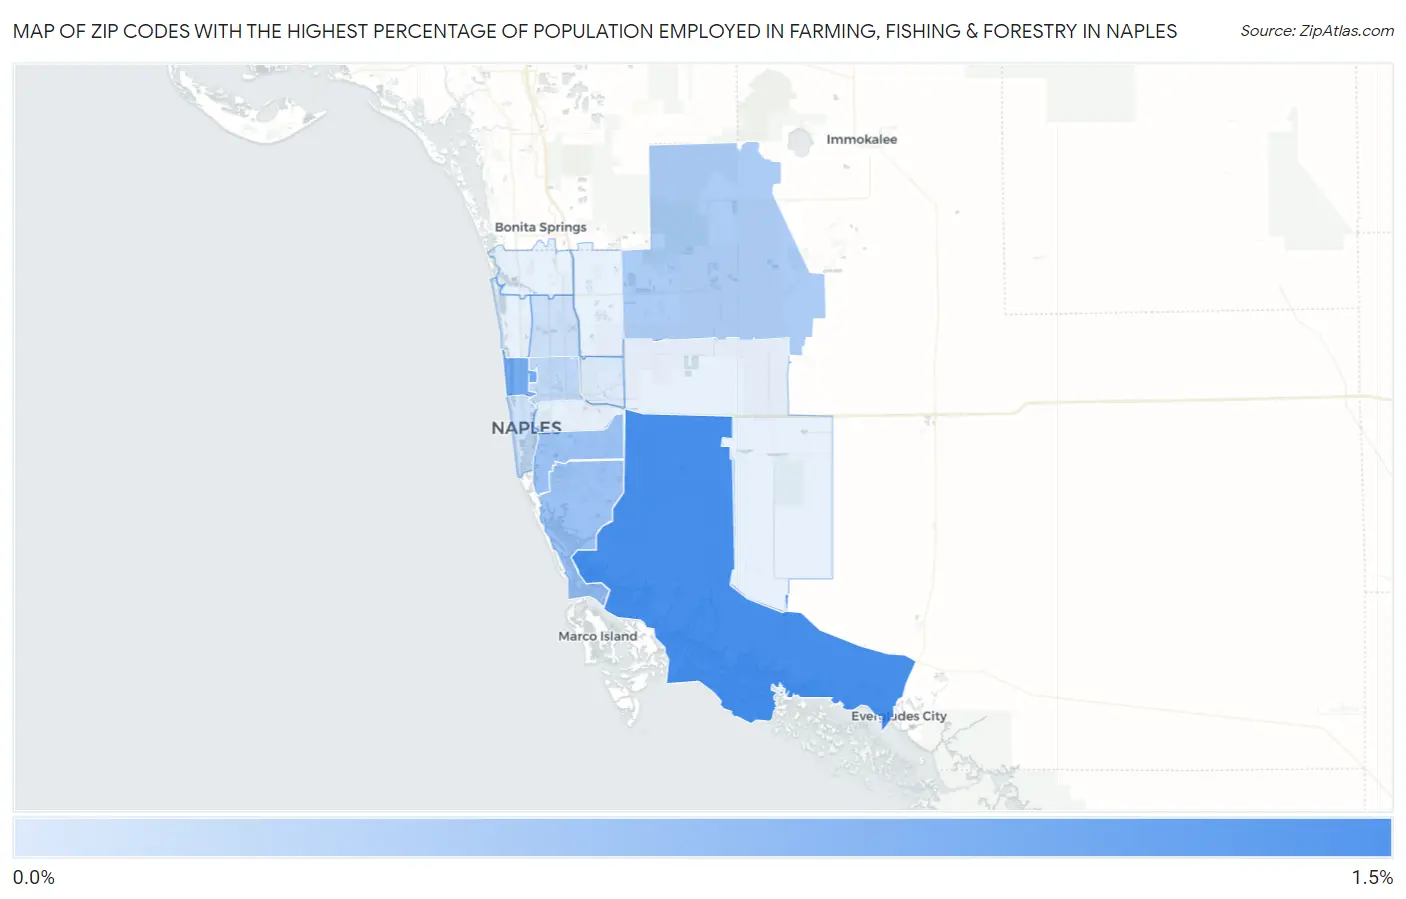
Map of Zip Codes with the Highest Percentage of Population Employed in Farming, Fishing & Forestry in Naples

0.0%
1.5%
Zip Codes with the Highest Percentage of Population Employed in Farming, Fishing & Forestry in Naples Map

Zip Codes with the Highest Percentage of Population Employed in Farming, Fishing & Forestry in Naples, FL

Zip Code % Employed vs State vs National
1.341141.1%0.47%(+0.622)#1690.61%(+0.485)#9,365
2.341030.77%0.47%(+0.303)#2150.61%(+0.166)#10,960
3.341120.50%0.47%(+0.027)#2960.61%(-0.110)#12,882
4.341130.49%0.47%(+0.018)#2970.61%(-0.118)#12,959
5.341200.36%0.47%(-0.105)#3530.61%(-0.241)#14,111
6.341050.24%0.47%(-0.225)#4160.61%(-0.362)#15,505
7.341090.14%0.47%(-0.329)#5050.61%(-0.466)#17,108
8.341020.13%0.47%(-0.340)#5120.61%(-0.476)#17,280
9.341160.031%0.47%(-0.438)#6220.61%(-0.575)#18,953

Common Questions

What are the Top 10 Zip Codes with the Highest Percentage of Population Employed in Farming, Fishing & Forestry in Naples, FL?
Top 10 Zip Codes with the Highest Percentage of Population Employed in Farming, Fishing & Forestry in Naples, FL are:
#1
1.1%
#2
0.77%
#3
0.50%
#4
0.49%
#5
0.36%
#6
0.24%
#7
0.14%
#8
0.13%
#9
0.031%
#10
0.0%
What zip code has the Highest Percentage of Population Employed in Farming, Fishing & Forestry in Naples, FL?
34114 has the Highest Percentage of Population Employed in Farming, Fishing & Forestry in Naples, FL with 1.1%.
What is the Percentage of Population Employed in Farming, Fishing & Forestry in Naples, FL?
Percentage of Population Employed in Farming, Fishing & Forestry in Naples is 0.65%.
What is the Percentage of Population Employed in Farming, Fishing & Forestry in Florida?
Percentage of Population Employed in Farming, Fishing & Forestry in Florida is 0.47%.
What is the Percentage of Population Employed in Farming, Fishing & Forestry in the United States?
Percentage of Population Employed in Farming, Fishing & Forestry in the United States is 0.61%.