Zip Codes with the Highest Percentage of Population Employed in Professional & Scientific Services in Newark, DE
RELATED REPORTS & OPTIONS
Professional & Scientific Services
Newark
Compare Zip Codes
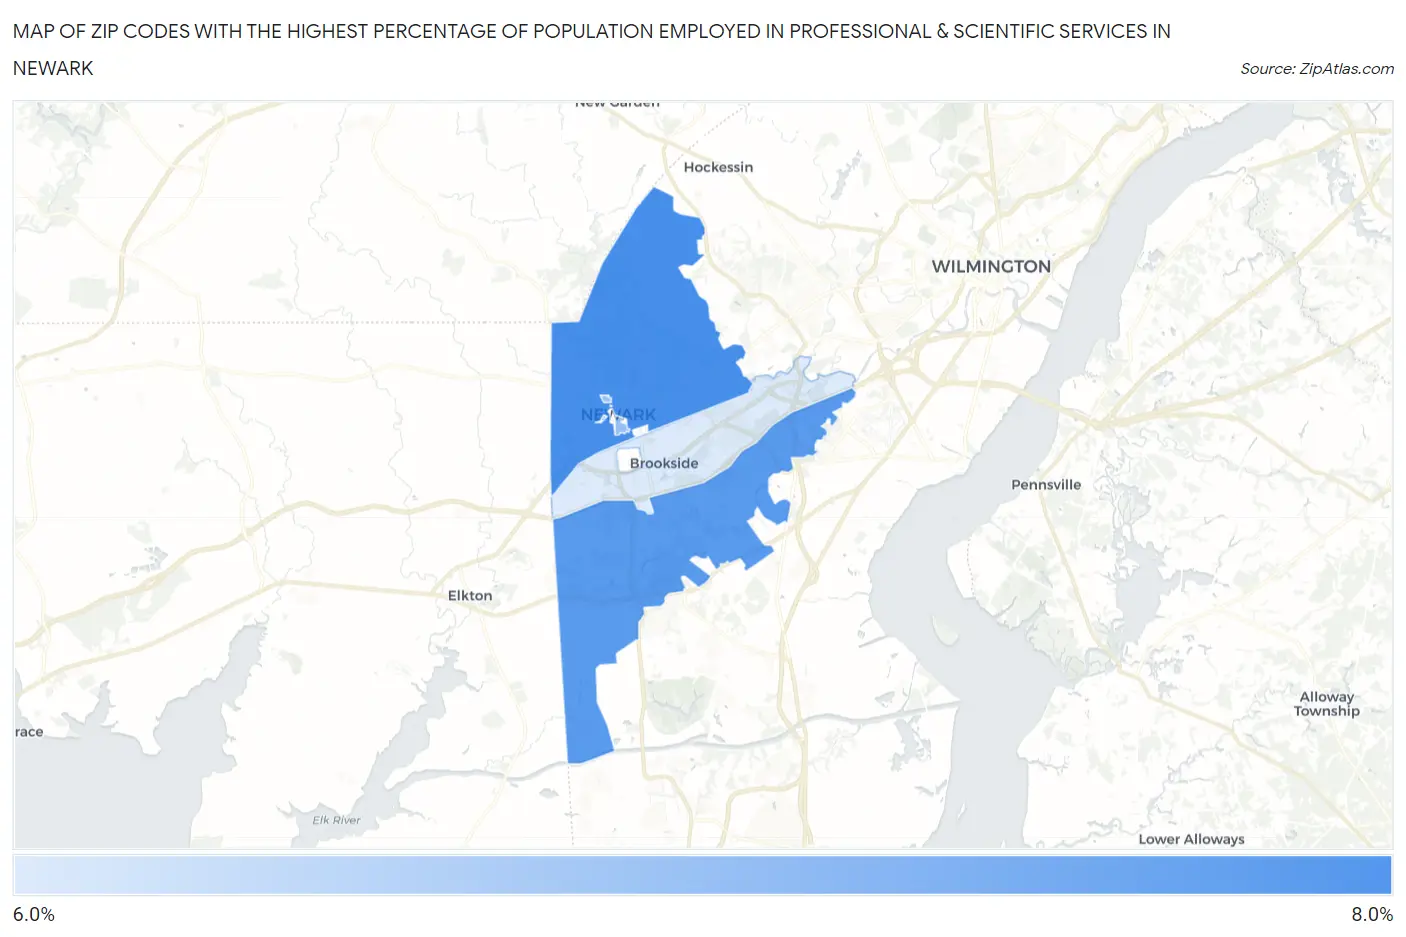
Map of Zip Codes with the Highest Percentage of Population Employed in Professional & Scientific Services in Newark
0.0%
8.0%
Zip Codes with the Highest Percentage of Population Employed in Professional & Scientific Services in Newark, DE
| Zip Code | % Employed | vs State | vs National | |
| 1. | 19711 | 7.9% | 6.6%(+1.32)#16 | 7.8%(+0.064)#6,778 |
| 2. | 19702 | 7.8% | 6.6%(+1.19)#18 | 7.8%(-0.057)#6,940 |
| 3. | 19717 | 7.3% | 6.6%(+0.703)#20 | 7.8%(-0.549)#7,666 |
| 4. | 19713 | 6.8% | 6.6%(+0.190)#21 | 7.8%(-1.06)#8,511 |
1
Common Questions
What are the Top 3 Zip Codes with the Highest Percentage of Population Employed in Professional & Scientific Services in Newark, DE?
Top 3 Zip Codes with the Highest Percentage of Population Employed in Professional & Scientific Services in Newark, DE are:
What zip code has the Highest Percentage of Population Employed in Professional & Scientific Services in Newark, DE?
19711 has the Highest Percentage of Population Employed in Professional & Scientific Services in Newark, DE with 7.9%.
What is the Percentage of Population Employed in Professional & Scientific Services in Newark, DE?
Percentage of Population Employed in Professional & Scientific Services in Newark is 7.4%.
What is the Percentage of Population Employed in Professional & Scientific Services in Delaware?
Percentage of Population Employed in Professional & Scientific Services in Delaware is 6.6%.
What is the Percentage of Population Employed in Professional & Scientific Services in the United States?
Percentage of Population Employed in Professional & Scientific Services in the United States is 7.8%.