Woodcrest, CA
Woodcrest Map
Woodcrest Overview
17,378
TOTAL POPULATION
9,047
MALE POPULATION
8,331
FEMALE POPULATION
108.59
MALES / 100 FEMALES
92.09
FEMALES / 100 MALES
38.3
MEDIAN AGE
3.9
AVG FAMILY SIZE
3.7
AVG HOUSEHOLD SIZE
$45,911
PER CAPITA INCOME
$141,259
AVG FAMILY INCOME
$139,115
AVG HOUSEHOLD INCOME
41.9%
WAGE / INCOME GAP [ % ]
58.1¢/ $1
WAGE / INCOME GAP [ $ ]
0.39
INEQUALITY / GINI INDEX
8,593
LABOR FORCE [ PEOPLE ]
62.1%
PERCENT IN LABOR FORCE
4.1%
UNEMPLOYMENT RATE
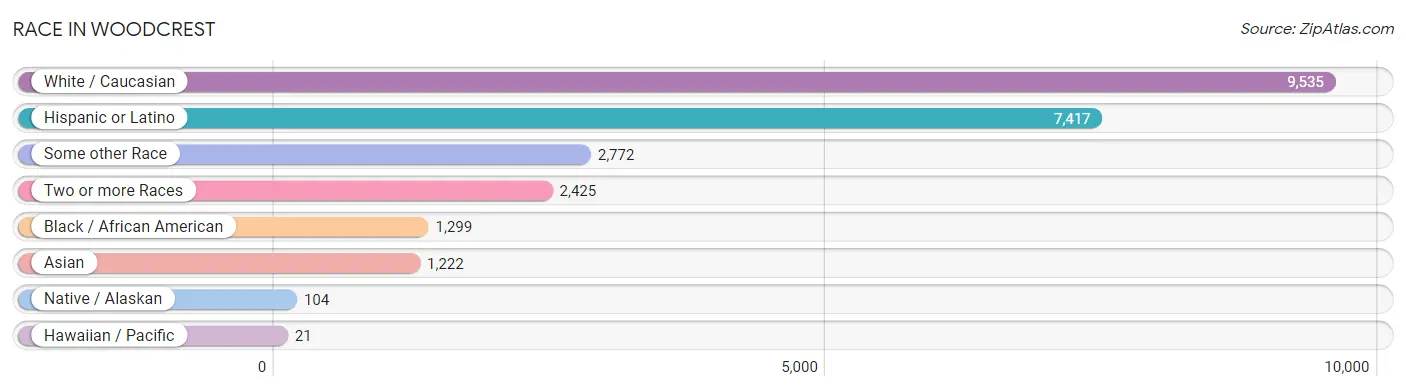
Race in Woodcrest
The most populous races in Woodcrest are White / Caucasian (9,535 | 54.9%), Hispanic or Latino (7,417 | 42.7%), and Some other Race (2,772 | 16.0%).
| Race | # Population | % Population |
| Asian | 1,222 | 7.0% |
| Black / African American | 1,299 | 7.5% |
| Hawaiian / Pacific | 21 | 0.1% |
| Hispanic or Latino | 7,417 | 42.7% |
| Native / Alaskan | 104 | 0.6% |
| White / Caucasian | 9,535 | 54.9% |
| Two or more Races | 2,425 | 14.0% |
| Some other Race | 2,772 | 16.0% |
| Total | 17,378 | 100.0% |
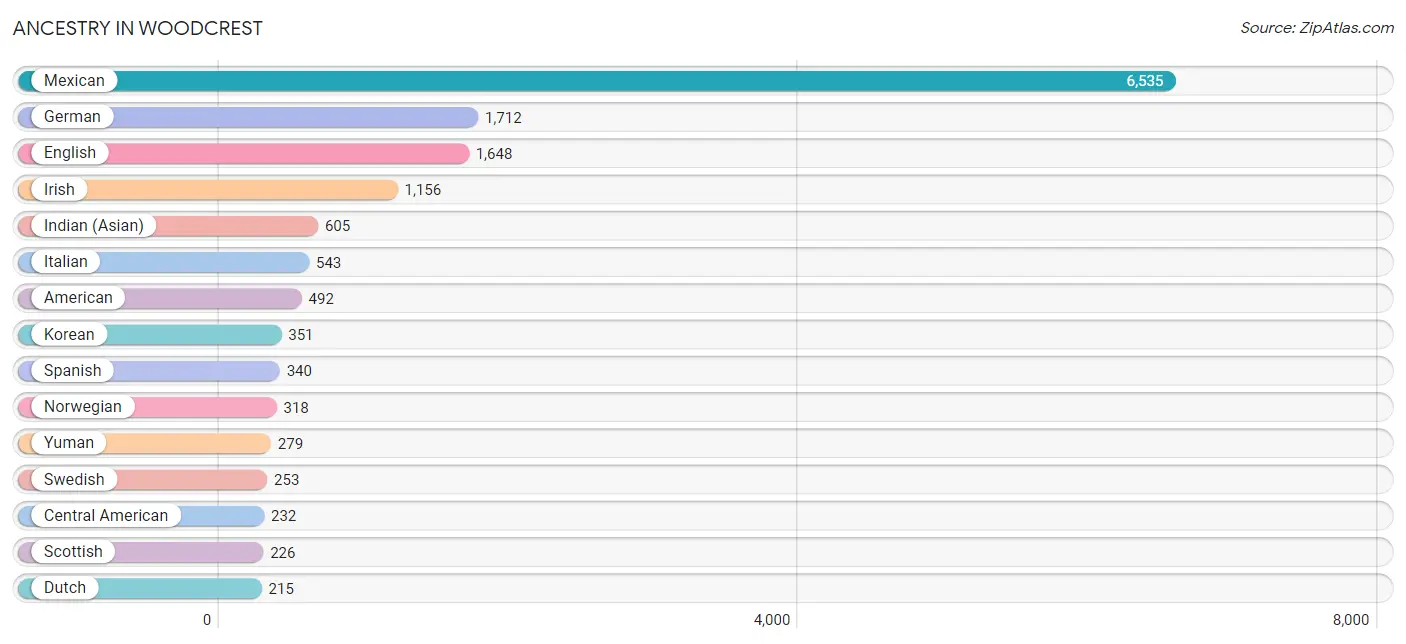
Ancestry in Woodcrest
The most populous ancestries reported in Woodcrest are Mexican (6,535 | 37.6%), German (1,712 | 9.9%), English (1,648 | 9.5%), Irish (1,156 | 6.7%), and Indian (Asian) (605 | 3.5%), together accounting for 67.1% of all Woodcrest residents.
| Ancestry | # Population | % Population |
| African | 15 | 0.1% |
| American | 492 | 2.8% |
| Apache | 32 | 0.2% |
| Arab | 136 | 0.8% |
| Armenian | 26 | 0.2% |
| Australian | 1 | 0.0% |
| Basque | 12 | 0.1% |
| Bhutanese | 97 | 0.6% |
| British | 51 | 0.3% |
| Burmese | 190 | 1.1% |
| Canadian | 25 | 0.1% |
| Central American | 232 | 1.3% |
| Cherokee | 44 | 0.3% |
| Colombian | 95 | 0.5% |
| Costa Rican | 6 | 0.0% |
| Cuban | 79 | 0.4% |
| Czech | 4 | 0.0% |
| Czechoslovakian | 12 | 0.1% |
| Danish | 95 | 0.5% |
| Dutch | 215 | 1.2% |
| Eastern European | 43 | 0.3% |
| Ecuadorian | 8 | 0.1% |
| Egyptian | 48 | 0.3% |
| English | 1,648 | 9.5% |
| European | 110 | 0.6% |
| Filipino | 18 | 0.1% |
| Finnish | 32 | 0.2% |
| French | 147 | 0.9% |
| French Canadian | 33 | 0.2% |
| German | 1,712 | 9.9% |
| Greek | 5 | 0.0% |
| Guatemalan | 74 | 0.4% |
| Indian (Asian) | 605 | 3.5% |
| Indonesian | 14 | 0.1% |
| Iranian | 8 | 0.1% |
| Irish | 1,156 | 6.7% |
| Italian | 543 | 3.1% |
| Japanese | 42 | 0.2% |
| Korean | 351 | 2.0% |
| Laotian | 98 | 0.6% |
| Lebanese | 84 | 0.5% |
| Lumbee | 6 | 0.0% |
| Mexican | 6,535 | 37.6% |
| Mexican American Indian | 11 | 0.1% |
| Northern European | 123 | 0.7% |
| Norwegian | 318 | 1.8% |
| Polish | 155 | 0.9% |
| Potawatomi | 18 | 0.1% |
| Puerto Rican | 20 | 0.1% |
| Russian | 4 | 0.0% |
| Salvadoran | 152 | 0.9% |
| Scandinavian | 60 | 0.4% |
| Scotch-Irish | 134 | 0.8% |
| Scottish | 226 | 1.3% |
| Slovak | 9 | 0.1% |
| Slovene | 11 | 0.1% |
| South American | 118 | 0.7% |
| Spaniard | 44 | 0.3% |
| Spanish | 340 | 2.0% |
| Subsaharan African | 15 | 0.1% |
| Swedish | 253 | 1.5% |
| Swiss | 11 | 0.1% |
| Thai | 180 | 1.0% |
| Ukrainian | 14 | 0.1% |
| Uruguayan | 15 | 0.1% |
| Welsh | 59 | 0.3% |
| Yuman | 279 | 1.6% | View All 67 Rows |
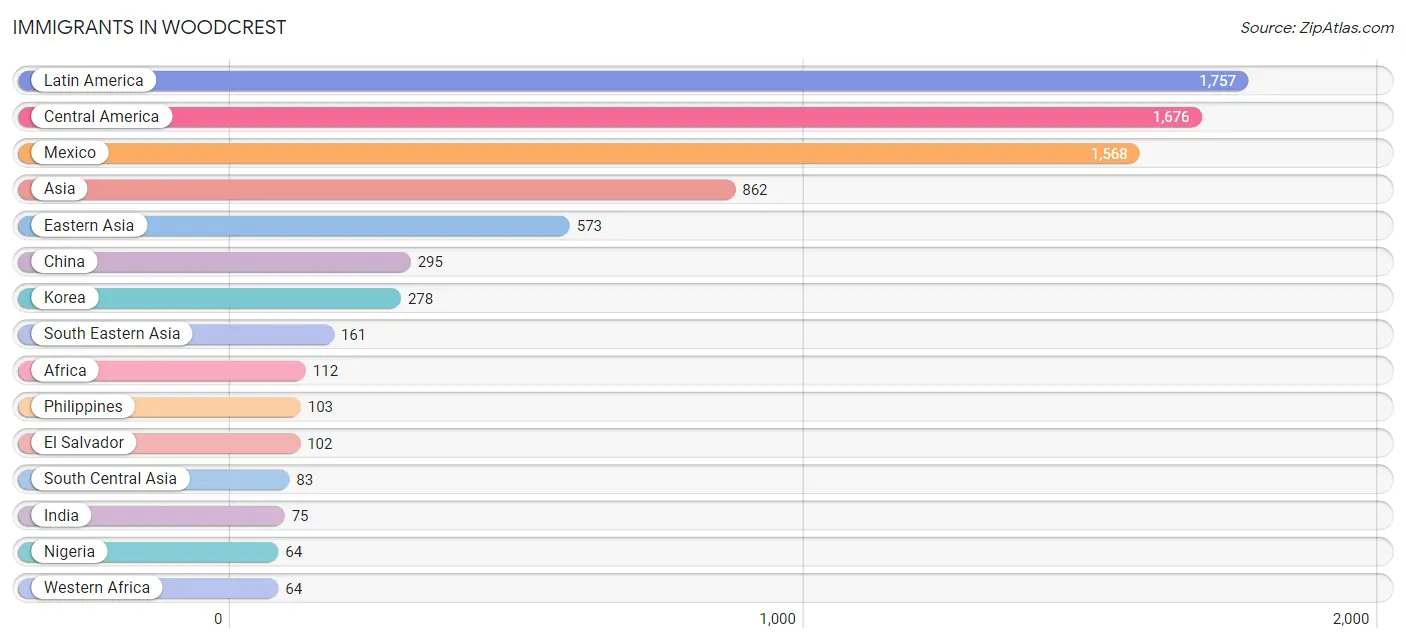
Immigrants in Woodcrest
The most numerous immigrant groups reported in Woodcrest came from Latin America (1,757 | 10.1%), Central America (1,676 | 9.6%), Mexico (1,568 | 9.0%), Asia (862 | 5.0%), and Eastern Asia (573 | 3.3%), together accounting for 37.0% of all Woodcrest residents.
| Immigration Origin | # Population | % Population |
| Africa | 112 | 0.6% |
| Asia | 862 | 5.0% |
| Cambodia | 42 | 0.2% |
| Canada | 9 | 0.1% |
| Caribbean | 26 | 0.2% |
| Central America | 1,676 | 9.6% |
| China | 295 | 1.7% |
| Colombia | 32 | 0.2% |
| Costa Rica | 6 | 0.0% |
| Cuba | 26 | 0.2% |
| Eastern Asia | 573 | 3.3% |
| Eastern Europe | 18 | 0.1% |
| Ecuador | 8 | 0.1% |
| Egypt | 38 | 0.2% |
| El Salvador | 102 | 0.6% |
| England | 1 | 0.0% |
| Europe | 39 | 0.2% |
| Germany | 11 | 0.1% |
| India | 75 | 0.4% |
| Indonesia | 9 | 0.1% |
| Iran | 8 | 0.1% |
| Korea | 278 | 1.6% |
| Latin America | 1,757 | 10.1% |
| Lebanon | 45 | 0.3% |
| Mexico | 1,568 | 9.0% |
| Netherlands | 9 | 0.1% |
| Nigeria | 64 | 0.4% |
| Northern Africa | 48 | 0.3% |
| Northern Europe | 1 | 0.0% |
| Oceania | 21 | 0.1% |
| Philippines | 103 | 0.6% |
| Serbia | 18 | 0.1% |
| South America | 55 | 0.3% |
| South Central Asia | 83 | 0.5% |
| South Eastern Asia | 161 | 0.9% |
| Sudan | 10 | 0.1% |
| Taiwan | 55 | 0.3% |
| Uruguay | 15 | 0.1% |
| Western Africa | 64 | 0.4% |
| Western Asia | 45 | 0.3% |
| Western Europe | 20 | 0.1% | View All 41 Rows |
Sex and Age in Woodcrest
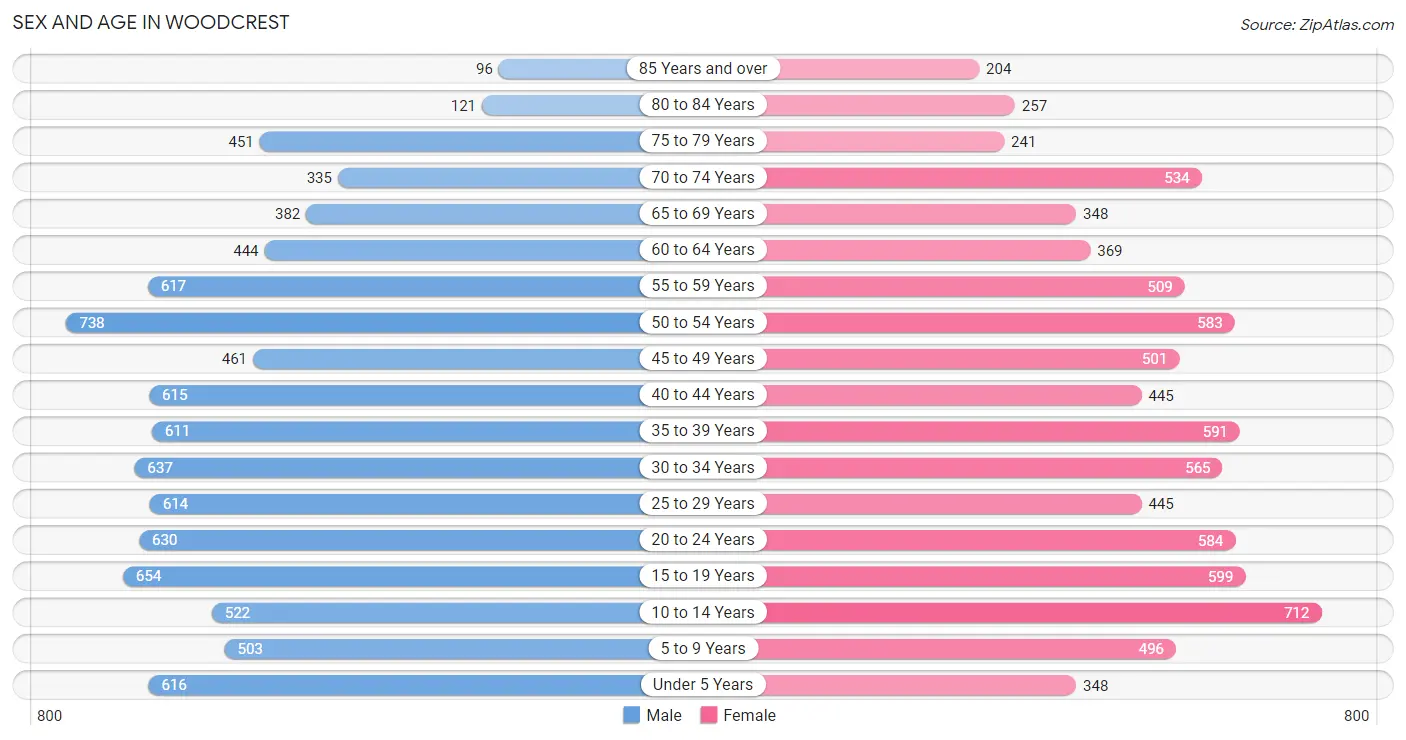
Sex and Age in Woodcrest
The most populous age groups in Woodcrest are 50 to 54 Years (738 | 8.2%) for men and 10 to 14 Years (712 | 8.6%) for women.
| Age Bracket | Male | Female |
| Under 5 Years | 616 (6.8%) | 348 (4.2%) |
| 5 to 9 Years | 503 (5.6%) | 496 (5.9%) |
| 10 to 14 Years | 522 (5.8%) | 712 (8.6%) |
| 15 to 19 Years | 654 (7.2%) | 599 (7.2%) |
| 20 to 24 Years | 630 (7.0%) | 584 (7.0%) |
| 25 to 29 Years | 614 (6.8%) | 445 (5.3%) |
| 30 to 34 Years | 637 (7.0%) | 565 (6.8%) |
| 35 to 39 Years | 611 (6.8%) | 591 (7.1%) |
| 40 to 44 Years | 615 (6.8%) | 445 (5.3%) |
| 45 to 49 Years | 461 (5.1%) | 501 (6.0%) |
| 50 to 54 Years | 738 (8.2%) | 583 (7.0%) |
| 55 to 59 Years | 617 (6.8%) | 509 (6.1%) |
| 60 to 64 Years | 444 (4.9%) | 369 (4.4%) |
| 65 to 69 Years | 382 (4.2%) | 348 (4.2%) |
| 70 to 74 Years | 335 (3.7%) | 534 (6.4%) |
| 75 to 79 Years | 451 (5.0%) | 241 (2.9%) |
| 80 to 84 Years | 121 (1.3%) | 257 (3.1%) |
| 85 Years and over | 96 (1.1%) | 204 (2.5%) |
| Total | 9,047 (100.0%) | 8,331 (100.0%) |
Families and Households in Woodcrest
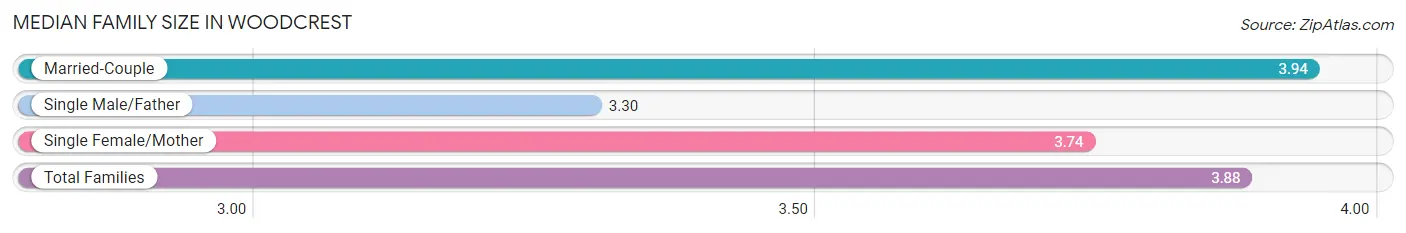
Median Family Size in Woodcrest
The median family size in Woodcrest is 3.88 persons per family, with married-couple families (3,411 | 84.4%) accounting for the largest median family size of 3.94 persons per family. On the other hand, single male/father families (267 | 6.6%) represent the smallest median family size with 3.30 persons per family.
| Family Type | # Families | Family Size |
| Married-Couple | 3,411 (84.4%) | 3.94 |
| Single Male/Father | 267 (6.6%) | 3.30 |
| Single Female/Mother | 362 (9.0%) | 3.74 |
| Total Families | 4,040 (100.0%) | 3.88 |
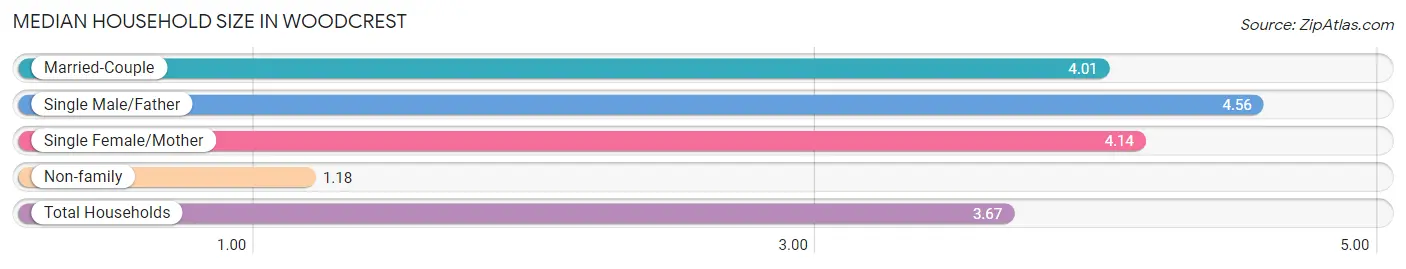
Median Household Size in Woodcrest
The median household size in Woodcrest is 3.67 persons per household, with single male/father households (267 | 5.7%) accounting for the largest median household size of 4.56 persons per household. non-family households (629 | 13.5%) represent the smallest median household size with 1.18 persons per household.
| Household Type | # Households | Household Size |
| Married-Couple | 3,411 (73.1%) | 4.01 |
| Single Male/Father | 267 (5.7%) | 4.56 |
| Single Female/Mother | 362 (7.7%) | 4.14 |
| Non-family | 629 (13.5%) | 1.18 |
| Total Households | 4,669 (100.0%) | 3.67 |
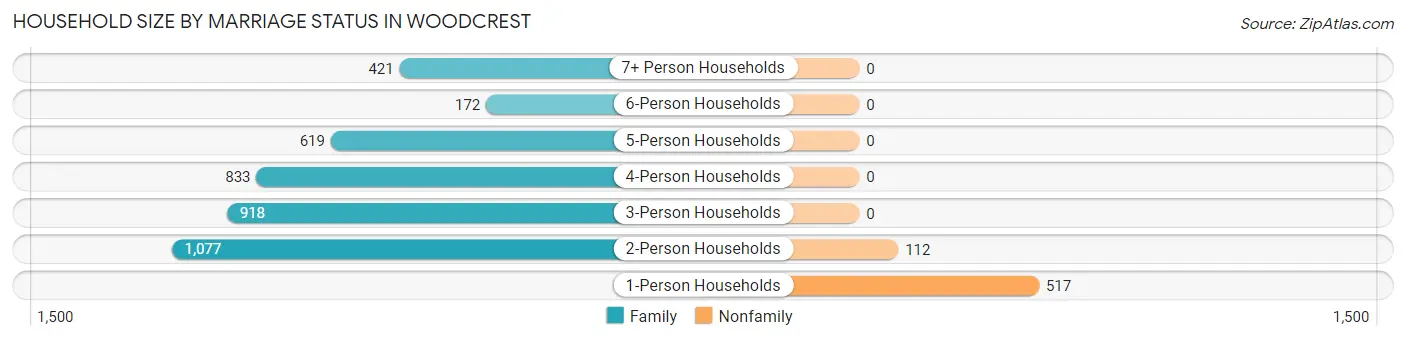
Household Size by Marriage Status in Woodcrest
Out of a total of 4,669 households in Woodcrest, 4,040 (86.5%) are family households, while 629 (13.5%) are nonfamily households. The most numerous type of family households are 2-person households, comprising 1,077, and the most common type of nonfamily households are 1-person households, comprising 517.
| Household Size | Family Households | Nonfamily Households |
| 1-Person Households | - | 517 (11.1%) |
| 2-Person Households | 1,077 (23.1%) | 112 (2.4%) |
| 3-Person Households | 918 (19.7%) | 0 (0.0%) |
| 4-Person Households | 833 (17.8%) | 0 (0.0%) |
| 5-Person Households | 619 (13.3%) | 0 (0.0%) |
| 6-Person Households | 172 (3.7%) | 0 (0.0%) |
| 7+ Person Households | 421 (9.0%) | 0 (0.0%) |
| Total | 4,040 (86.5%) | 629 (13.5%) |
Female Fertility in Woodcrest
Fertility by Age in Woodcrest
Average fertility rate in Woodcrest is 46.0 births per 1,000 women. Women in the age bracket of 35 to 50 years have the highest fertility rate with 61.0 births per 1,000 women. Women in the age bracket of 35 to 50 years acount for 59.0% of all women with births.
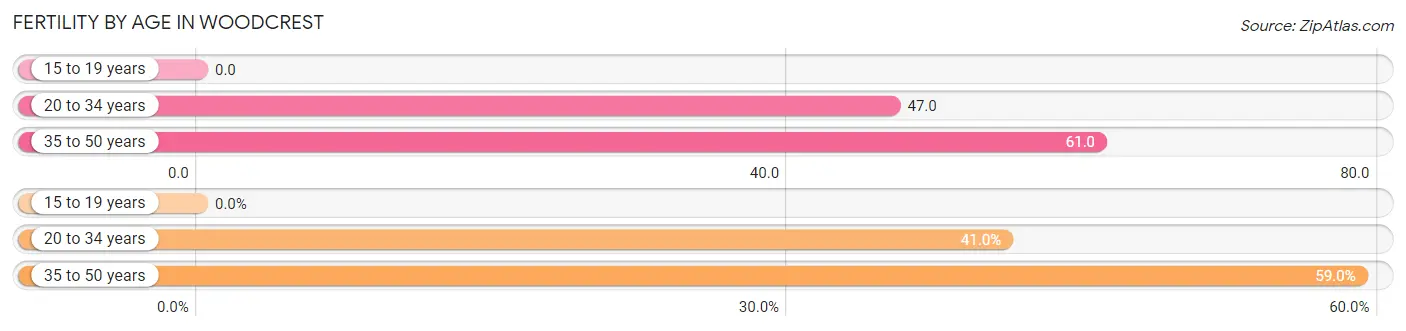
| Age Bracket | Women with Births | Births / 1,000 Women |
| 15 to 19 years | 0 (0.0%) | 0.0 |
| 20 to 34 years | 75 (41.0%) | 47.0 |
| 35 to 50 years | 108 (59.0%) | 61.0 |
| Total | 183 (100.0%) | 46.0 |
Fertility by Age by Marriage Status in Woodcrest
80.3% of women with births (183) in Woodcrest are married. The highest percentage of unmarried women with births falls into 20 to 34 years age bracket with 48.0% of them unmarried at the time of birth, while the lowest percentage of unmarried women with births belong to 35 to 50 years age bracket with 0.0% of them unmarried.
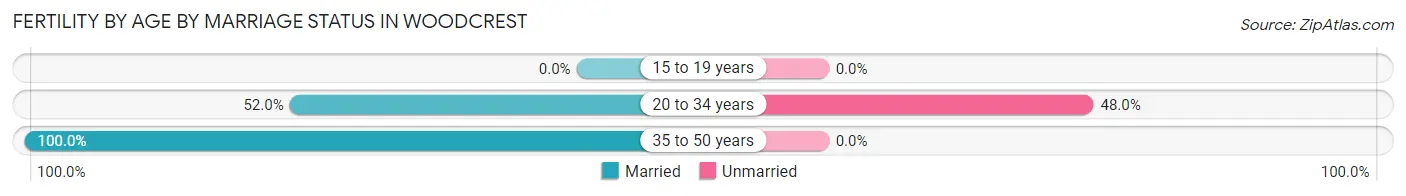
| Age Bracket | Married | Unmarried |
| 15 to 19 years | 0 (0.0%) | 0 (0.0%) |
| 20 to 34 years | 39 (52.0%) | 36 (48.0%) |
| 35 to 50 years | 108 (100.0%) | 0 (0.0%) |
| Total | 147 (80.3%) | 36 (19.7%) |
Fertility by Education in Woodcrest
Average fertility rate in Woodcrest is 46.0 births per 1,000 women. Women with the education attainment of graduate degree have the highest fertility rate of 94.0 births per 1,000 women, while women with the education attainment of college or associate's degree have the lowest fertility at 25.0 births per 1,000 women. Women with the education attainment of high school diploma represent 27.9% of all women with births.
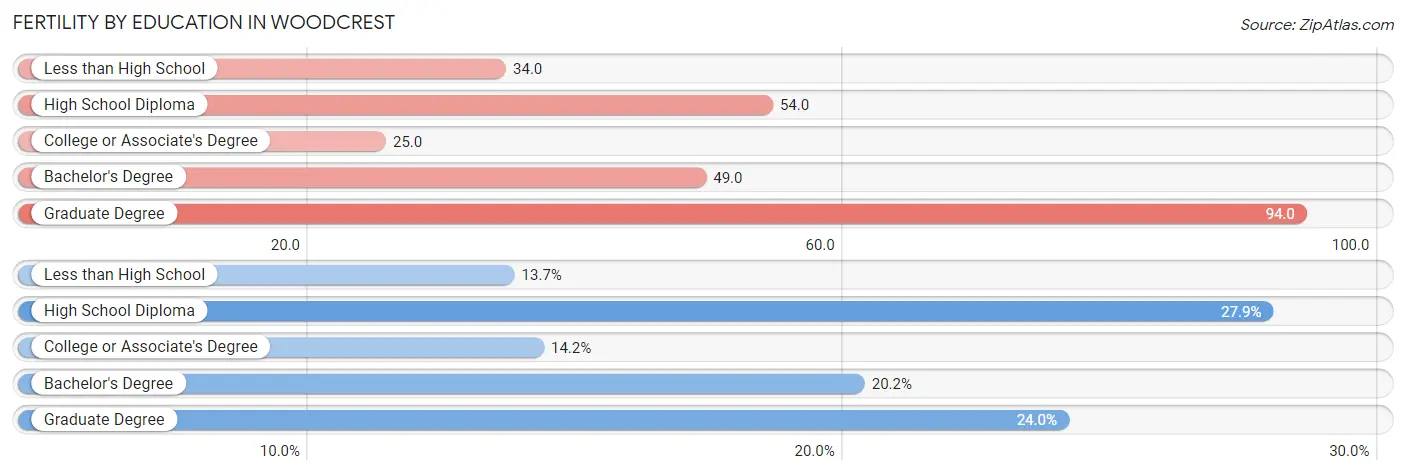
| Educational Attainment | Women with Births | Births / 1,000 Women |
| Less than High School | 25 (13.7%) | 34.0 |
| High School Diploma | 51 (27.9%) | 54.0 |
| College or Associate's Degree | 26 (14.2%) | 25.0 |
| Bachelor's Degree | 37 (20.2%) | 49.0 |
| Graduate Degree | 44 (24.0%) | 94.0 |
| Total | 183 (100.0%) | 46.0 |
Fertility by Education by Marriage Status in Woodcrest
19.7% of women with births in Woodcrest are unmarried. Women with the educational attainment of college or associate's degree are most likely to be married with 100.0% of them married at childbirth, while women with the educational attainment of less than high school are least likely to be married with 100.0% of them unmarried at childbirth.
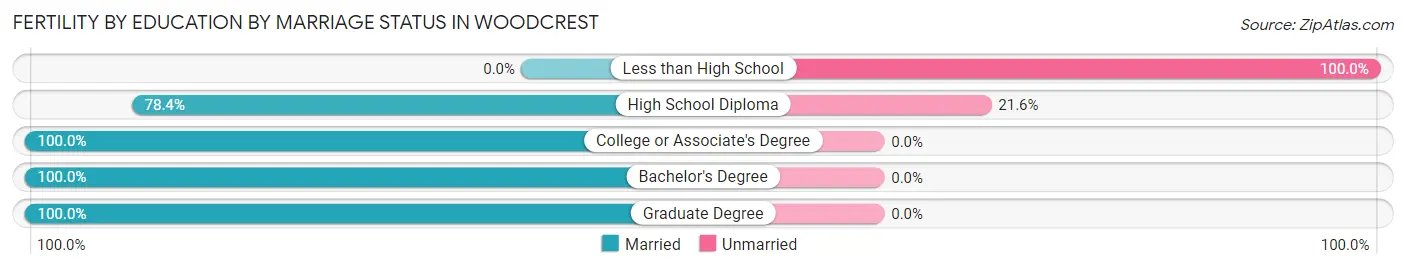
| Educational Attainment | Married | Unmarried |
| Less than High School | 0 (0.0%) | 25 (100.0%) |
| High School Diploma | 40 (78.4%) | 11 (21.6%) |
| College or Associate's Degree | 26 (100.0%) | 0 (0.0%) |
| Bachelor's Degree | 37 (100.0%) | 0 (0.0%) |
| Graduate Degree | 44 (100.0%) | 0 (0.0%) |
| Total | 147 (80.3%) | 36 (19.7%) |
Income in Woodcrest
Income Overview in Woodcrest
Per Capita Income in Woodcrest is $45,911, while median incomes of families and households are $141,259 and $139,115 respectively.
| Characteristic | Number | Measure |
| Per Capita Income | 17,378 | $45,911 |
| Median Family Income | 4,040 | $141,259 |
| Mean Family Income | 4,040 | $164,358 |
| Median Household Income | 4,669 | $139,115 |
| Mean Household Income | 4,669 | $163,985 |
| Income Deficit | 4,040 | $0 |
| Wage / Income Gap (%) | 17,378 | 41.85% |
| Wage / Income Gap ($) | 17,378 | 58.15¢ per $1 |
| Gini / Inequality Index | 17,378 | 0.39 |
Earnings by Sex in Woodcrest
Average Earnings in Woodcrest are $50,943, $58,931 for men and $34,266 for women, a difference of 41.8%.
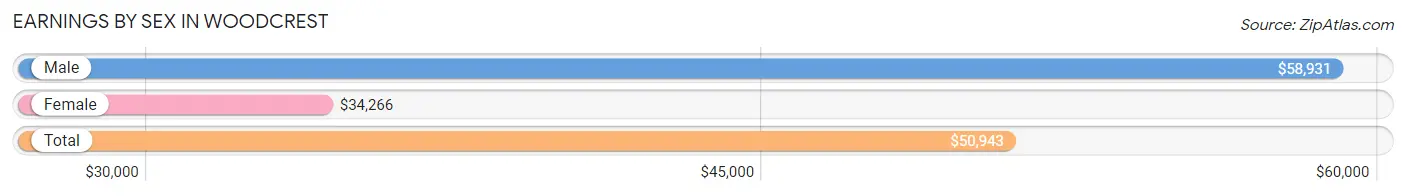
| Sex | Number | Average Earnings |
| Male | 5,163 (57.8%) | $58,931 |
| Female | 3,772 (42.2%) | $34,266 |
| Total | 8,935 (100.0%) | $50,943 |
Earnings by Sex by Income Bracket in Woodcrest
The most common earnings brackets in Woodcrest are $100,000+ for men (1,480 | 28.7%) and $100,000+ for women (766 | 20.3%).
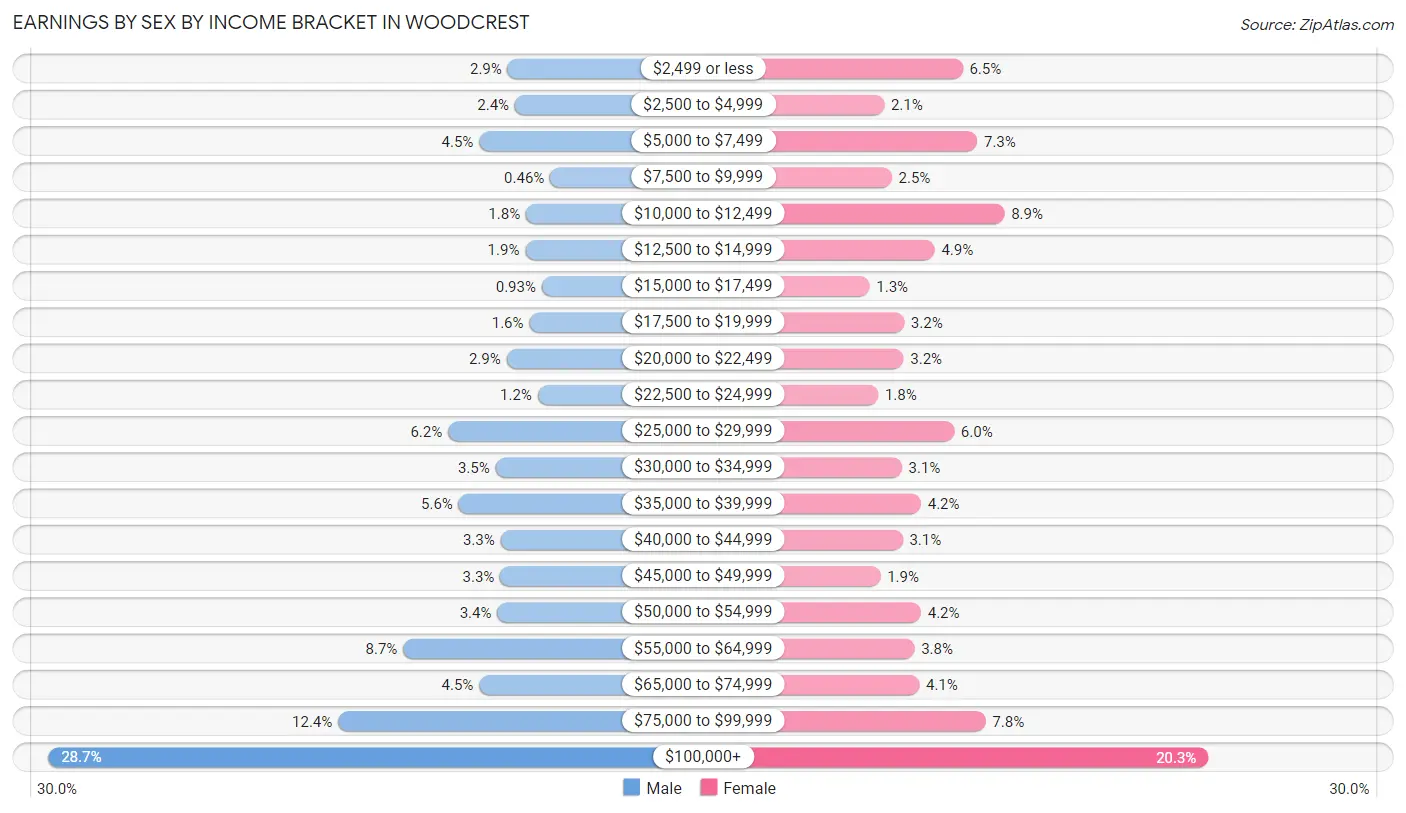
| Income | Male | Female |
| $2,499 or less | 147 (2.9%) | 245 (6.5%) |
| $2,500 to $4,999 | 126 (2.4%) | 79 (2.1%) |
| $5,000 to $7,499 | 230 (4.4%) | 276 (7.3%) |
| $7,500 to $9,999 | 24 (0.5%) | 95 (2.5%) |
| $10,000 to $12,499 | 94 (1.8%) | 334 (8.8%) |
| $12,500 to $14,999 | 96 (1.9%) | 186 (4.9%) |
| $15,000 to $17,499 | 48 (0.9%) | 48 (1.3%) |
| $17,500 to $19,999 | 84 (1.6%) | 121 (3.2%) |
| $20,000 to $22,499 | 150 (2.9%) | 120 (3.2%) |
| $22,500 to $24,999 | 60 (1.2%) | 66 (1.8%) |
| $25,000 to $29,999 | 320 (6.2%) | 227 (6.0%) |
| $30,000 to $34,999 | 182 (3.5%) | 116 (3.1%) |
| $35,000 to $39,999 | 289 (5.6%) | 157 (4.2%) |
| $40,000 to $44,999 | 168 (3.3%) | 118 (3.1%) |
| $45,000 to $49,999 | 169 (3.3%) | 71 (1.9%) |
| $50,000 to $54,999 | 177 (3.4%) | 157 (4.2%) |
| $55,000 to $64,999 | 450 (8.7%) | 143 (3.8%) |
| $65,000 to $74,999 | 230 (4.4%) | 153 (4.1%) |
| $75,000 to $99,999 | 639 (12.4%) | 294 (7.8%) |
| $100,000+ | 1,480 (28.7%) | 766 (20.3%) |
| Total | 5,163 (100.0%) | 3,772 (100.0%) |
Earnings by Sex by Educational Attainment in Woodcrest
Average earnings in Woodcrest are $68,613 for men and $43,894 for women, a difference of 36.0%. Men with an educational attainment of graduate degree enjoy the highest average annual earnings of $171,250, while those with college or associate's degree education earn the least with $59,046. Women with an educational attainment of graduate degree earn the most with the average annual earnings of $81,250, while those with less than high school education have the smallest earnings of $28,958.
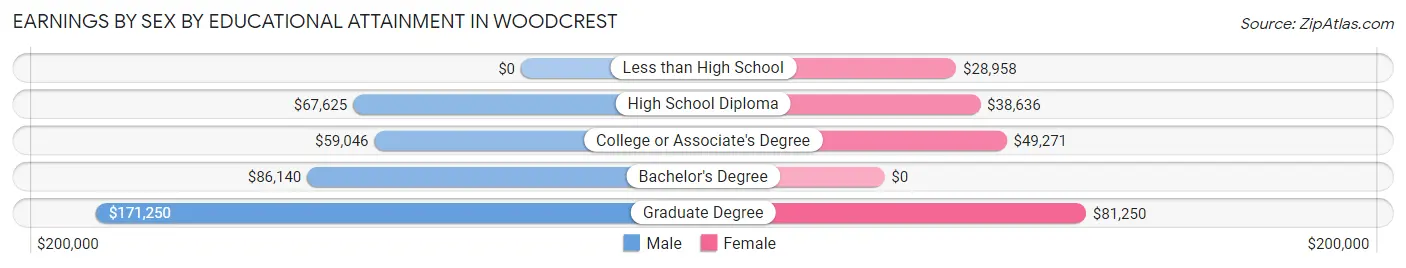
| Educational Attainment | Male Income | Female Income |
| Less than High School | - | - |
| High School Diploma | $67,625 | $38,636 |
| College or Associate's Degree | $59,046 | $49,271 |
| Bachelor's Degree | $86,140 | $0 |
| Graduate Degree | $171,250 | $81,250 |
| Total | $68,613 | $43,894 |
Family Income in Woodcrest
Family Income Brackets in Woodcrest
According to the Woodcrest family income data, there are 1,196 families falling into the $200,000+ income range, which is the most common income bracket and makes up 29.6% of all families. Conversely, the less than $10,000 income bracket is the least frequent group with only 8 families (0.2%) belonging to this category.
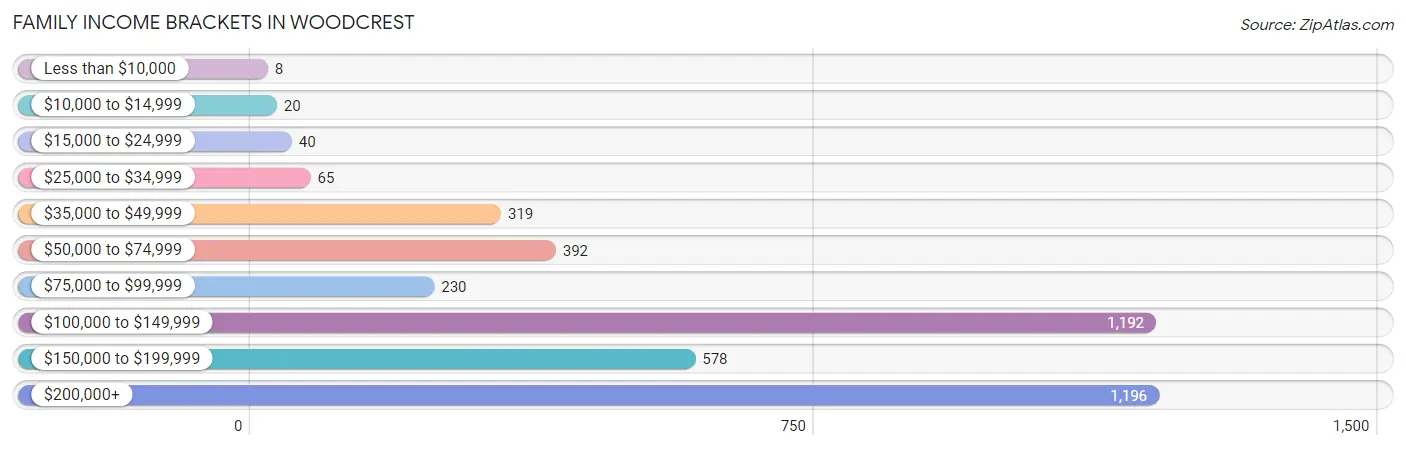
| Income Bracket | # Families | % Families |
| Less than $10,000 | 8 | 0.2% |
| $10,000 to $14,999 | 20 | 0.5% |
| $15,000 to $24,999 | 40 | 1.0% |
| $25,000 to $34,999 | 65 | 1.6% |
| $35,000 to $49,999 | 319 | 7.9% |
| $50,000 to $74,999 | 392 | 9.7% |
| $75,000 to $99,999 | 230 | 5.7% |
| $100,000 to $149,999 | 1,192 | 29.5% |
| $150,000 to $199,999 | 578 | 14.3% |
| $200,000+ | 1,196 | 29.6% |
Family Income by Famaliy Size in Woodcrest
6-person families (172 | 4.3%) account for the highest median family income in Woodcrest with $162,672 per family, while 2-person families (1,322 | 32.7%) have the highest median income of $56,875 per family member.
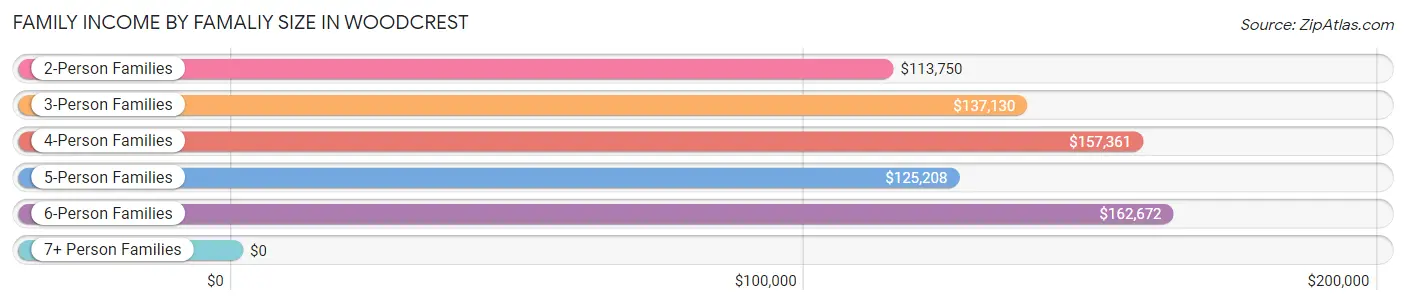
| Income Bracket | # Families | Median Income |
| 2-Person Families | 1,322 (32.7%) | $113,750 |
| 3-Person Families | 790 (19.6%) | $137,130 |
| 4-Person Families | 810 (20.1%) | $157,361 |
| 5-Person Families | 566 (14.0%) | $125,208 |
| 6-Person Families | 172 (4.3%) | $162,672 |
| 7+ Person Families | 380 (9.4%) | $0 |
| Total | 4,040 (100.0%) | $141,259 |
Family Income by Number of Earners in Woodcrest
The median family income in Woodcrest is $141,259, with families comprising 3+ earners (1,081) having the highest median family income of $203,750, while families with no earners (482) have the lowest median family income of $104,375, accounting for 26.8% and 11.9% of families, respectively.
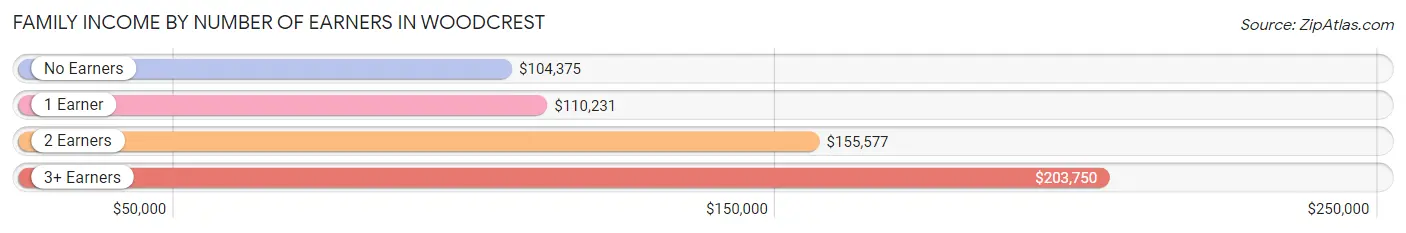
| Number of Earners | # Families | Median Income |
| No Earners | 482 (11.9%) | $104,375 |
| 1 Earner | 1,105 (27.4%) | $110,231 |
| 2 Earners | 1,372 (34.0%) | $155,577 |
| 3+ Earners | 1,081 (26.8%) | $203,750 |
| Total | 4,040 (100.0%) | $141,259 |
Household Income in Woodcrest
Household Income Brackets in Woodcrest
With 1,303 households falling in the category, the $100,000 to $149,999 income range is the most frequent in Woodcrest, accounting for 27.9% of all households. In contrast, only 37 households (0.8%) fall into the $15,000 to $24,999 income bracket, making it the least populous group.
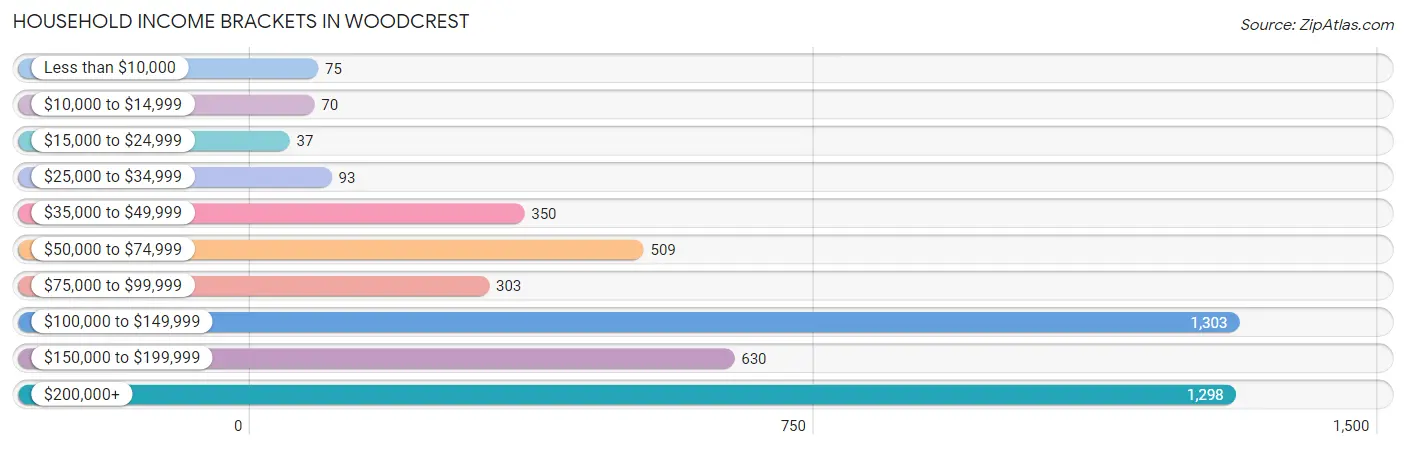
| Income Bracket | # Households | % Households |
| Less than $10,000 | 75 | 1.6% |
| $10,000 to $14,999 | 70 | 1.5% |
| $15,000 to $24,999 | 37 | 0.8% |
| $25,000 to $34,999 | 93 | 2.0% |
| $35,000 to $49,999 | 350 | 7.5% |
| $50,000 to $74,999 | 509 | 10.9% |
| $75,000 to $99,999 | 303 | 6.5% |
| $100,000 to $149,999 | 1,303 | 27.9% |
| $150,000 to $199,999 | 630 | 13.5% |
| $200,000+ | 1,298 | 27.8% |
Household Income by Householder Age in Woodcrest
The median household income in Woodcrest is $139,115, with the highest median household income of $167,885 found in the 45 to 64 years age bracket for the primary householder. A total of 1,832 households (39.2%) fall into this category.
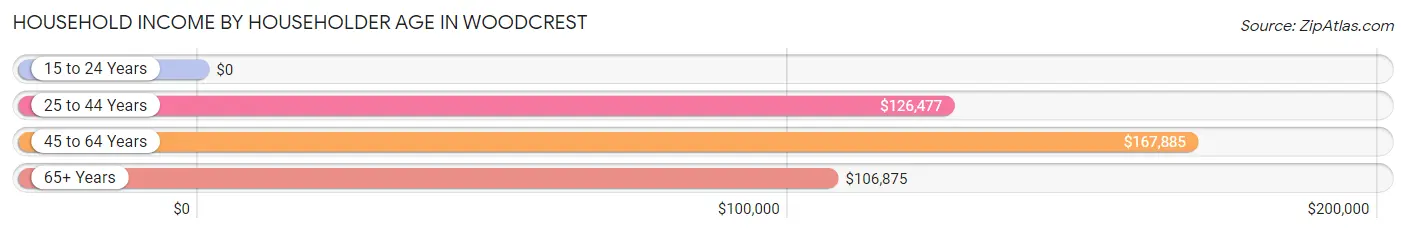
| Income Bracket | # Households | Median Income |
| 15 to 24 Years | 0 (0.0%) | $0 |
| 25 to 44 Years | 1,285 (27.5%) | $126,477 |
| 45 to 64 Years | 1,832 (39.2%) | $167,885 |
| 65+ Years | 1,552 (33.2%) | $106,875 |
| Total | 4,669 (100.0%) | $139,115 |
Poverty in Woodcrest
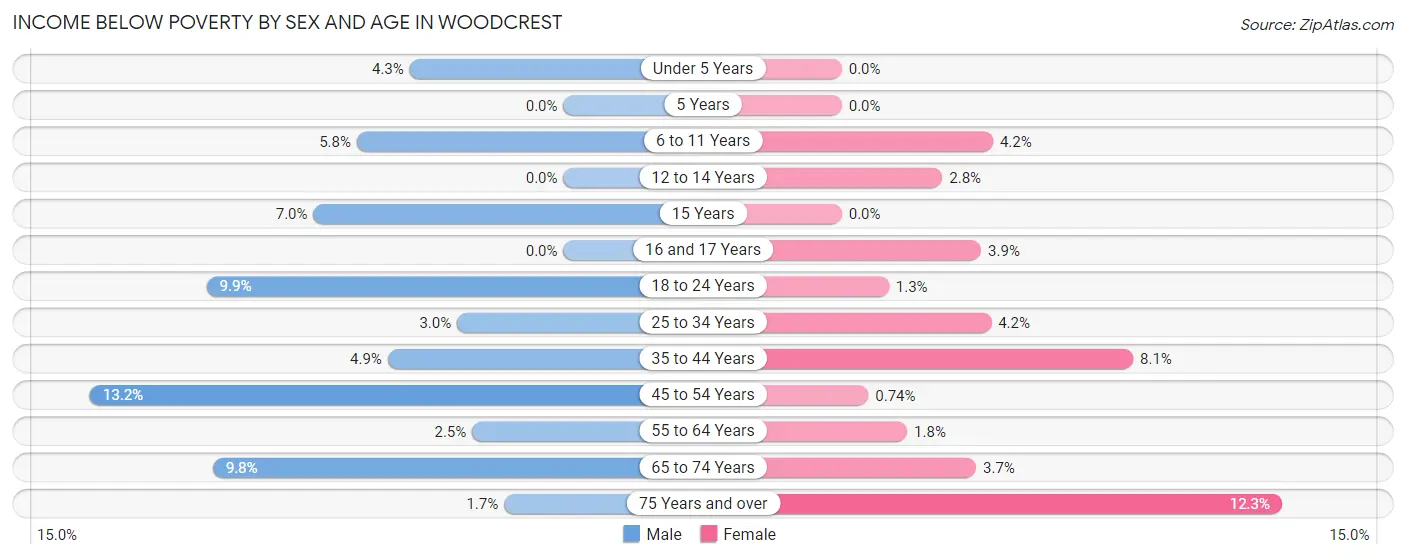
Income Below Poverty by Sex and Age in Woodcrest
With 5.7% poverty level for males and 3.9% for females among the residents of Woodcrest, 45 to 54 year old males and 75 year old and over females are the most vulnerable to poverty, with 158 males (13.2%) and 86 females (12.2%) in their respective age groups living below the poverty level.
| Age Bracket | Male | Female |
| Under 5 Years | 25 (4.3%) | 0 (0.0%) |
| 5 Years | 0 (0.0%) | 0 (0.0%) |
| 6 to 11 Years | 35 (5.8%) | 24 (4.2%) |
| 12 to 14 Years | 0 (0.0%) | 13 (2.8%) |
| 15 Years | 11 (7.0%) | 0 (0.0%) |
| 16 and 17 Years | 0 (0.0%) | 9 (3.9%) |
| 18 to 24 Years | 76 (9.9%) | 10 (1.3%) |
| 25 to 34 Years | 37 (3.0%) | 42 (4.2%) |
| 35 to 44 Years | 60 (4.9%) | 84 (8.1%) |
| 45 to 54 Years | 158 (13.2%) | 8 (0.7%) |
| 55 to 64 Years | 27 (2.5%) | 16 (1.8%) |
| 65 to 74 Years | 70 (9.8%) | 33 (3.7%) |
| 75 Years and over | 11 (1.7%) | 86 (12.2%) |
| Total | 510 (5.7%) | 325 (3.9%) |
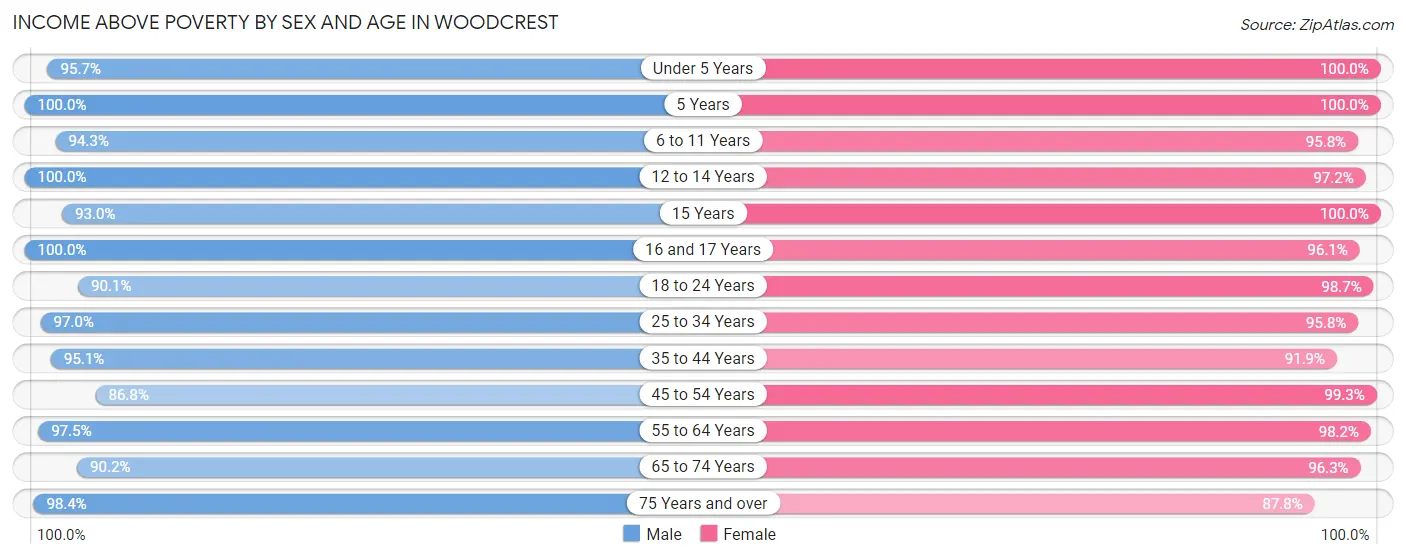
Income Above Poverty by Sex and Age in Woodcrest
According to the poverty statistics in Woodcrest, males aged 5 years and females aged under 5 years are the age groups that are most secure financially, with 100.0% of males and 100.0% of females in these age groups living above the poverty line.
| Age Bracket | Male | Female |
| Under 5 Years | 559 (95.7%) | 304 (100.0%) |
| 5 Years | 122 (100.0%) | 131 (100.0%) |
| 6 to 11 Years | 574 (94.3%) | 546 (95.8%) |
| 12 to 14 Years | 235 (100.0%) | 451 (97.2%) |
| 15 Years | 147 (93.0%) | 184 (100.0%) |
| 16 and 17 Years | 353 (100.0%) | 223 (96.1%) |
| 18 to 24 Years | 689 (90.1%) | 755 (98.7%) |
| 25 to 34 Years | 1,214 (97.0%) | 968 (95.8%) |
| 35 to 44 Years | 1,166 (95.1%) | 952 (91.9%) |
| 45 to 54 Years | 1,041 (86.8%) | 1,076 (99.3%) |
| 55 to 64 Years | 1,034 (97.5%) | 862 (98.2%) |
| 65 to 74 Years | 647 (90.2%) | 849 (96.3%) |
| 75 Years and over | 657 (98.4%) | 616 (87.7%) |
| Total | 8,438 (94.3%) | 7,917 (96.1%) |
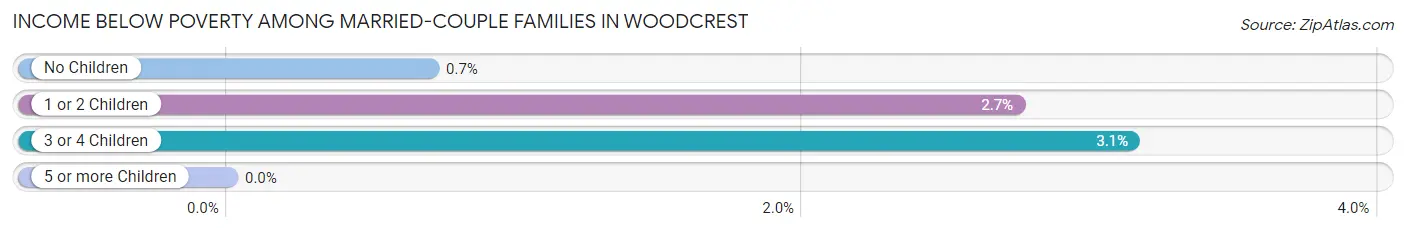
Income Below Poverty Among Married-Couple Families in Woodcrest
The poverty statistics for married-couple families in Woodcrest show that 1.7% or 58 of the total 3,411 families live below the poverty line. Families with 3 or 4 children have the highest poverty rate of 3.1%, comprising of 22 families. On the other hand, families with 5 or more children have the lowest poverty rate of 0.0%, which includes 0 families.
| Children | Above Poverty | Below Poverty |
| No Children | 1,851 (99.3%) | 13 (0.7%) |
| 1 or 2 Children | 815 (97.3%) | 23 (2.7%) |
| 3 or 4 Children | 678 (96.9%) | 22 (3.1%) |
| 5 or more Children | 9 (100.0%) | 0 (0.0%) |
| Total | 3,353 (98.3%) | 58 (1.7%) |
Income Below Poverty Among Single-Parent Households in Woodcrest
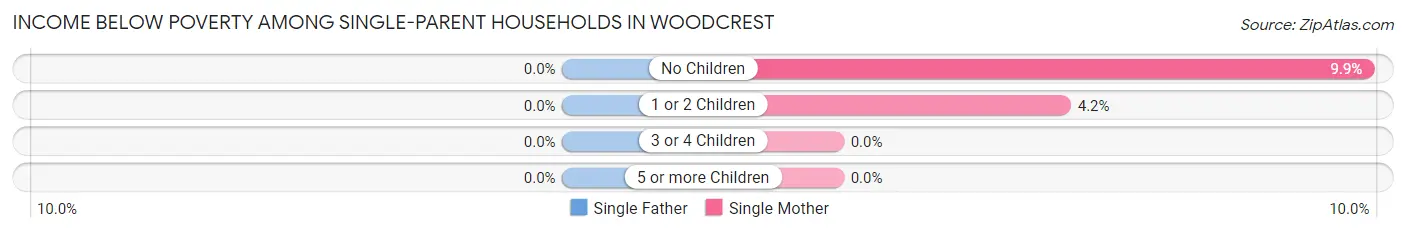
| Children | Single Father | Single Mother |
| No Children | 0 (0.0%) | 16 (9.9%) |
| 1 or 2 Children | 0 (0.0%) | 8 (4.2%) |
| 3 or 4 Children | 0 (0.0%) | 0 (0.0%) |
| 5 or more Children | 0 (0.0%) | 0 (0.0%) |
| Total | 0 (0.0%) | 24 (6.6%) |
Income Below Poverty Among Married-Couple vs Single-Parent Households in Woodcrest
The poverty data for Woodcrest shows that 58 of the married-couple family households (1.7%) and 24 of the single-parent households (3.8%) are living below the poverty level. Within the married-couple family households, those with 3 or 4 children have the highest poverty rate, with 22 households (3.1%) falling below the poverty line. Among the single-parent households, those with no children have the highest poverty rate, with 16 household (5.0%) living below poverty.
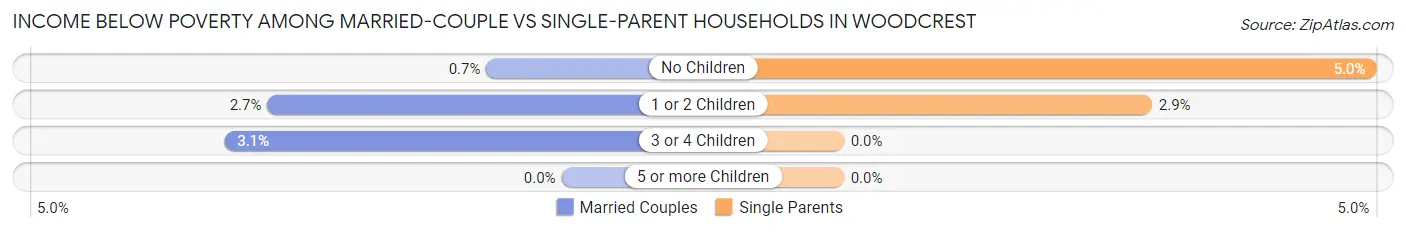
| Children | Married-Couple Families | Single-Parent Households |
| No Children | 13 (0.7%) | 16 (5.0%) |
| 1 or 2 Children | 23 (2.7%) | 8 (2.9%) |
| 3 or 4 Children | 22 (3.1%) | 0 (0.0%) |
| 5 or more Children | 0 (0.0%) | 0 (0.0%) |
| Total | 58 (1.7%) | 24 (3.8%) |
Employment Characteristics in Woodcrest
Employment by Class of Employer in Woodcrest
Among the 7,964 employed individuals in Woodcrest, private company employees (4,907 | 61.6%), local government employees (739 | 9.3%), and self-employed (not incorporated) (651 | 8.2%) make up the most common classes of employment.
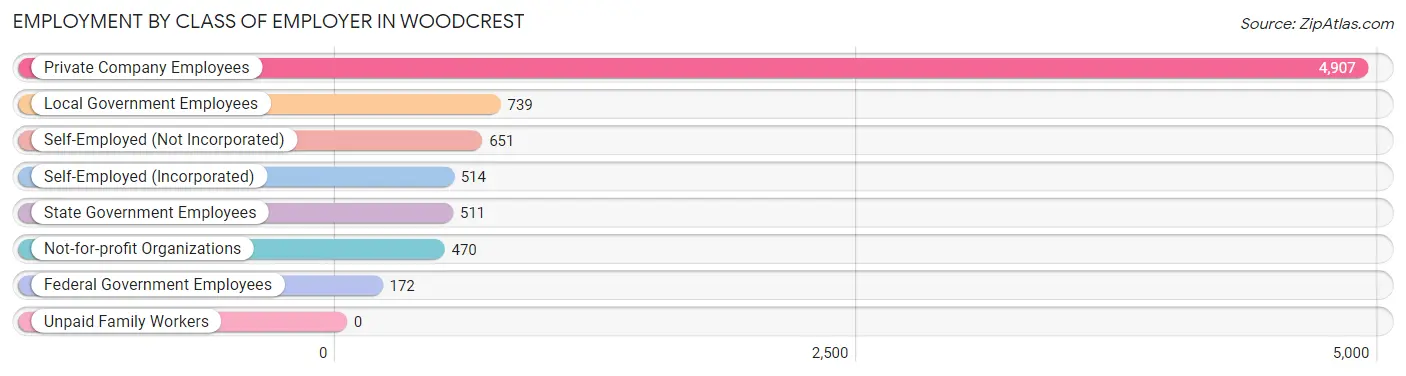
| Employer Class | # Employees | % Employees |
| Private Company Employees | 4,907 | 61.6% |
| Self-Employed (Incorporated) | 514 | 6.5% |
| Self-Employed (Not Incorporated) | 651 | 8.2% |
| Not-for-profit Organizations | 470 | 5.9% |
| Local Government Employees | 739 | 9.3% |
| State Government Employees | 511 | 6.4% |
| Federal Government Employees | 172 | 2.2% |
| Unpaid Family Workers | 0 | 0.0% |
| Total | 7,964 | 100.0% |
Employment Status by Age in Woodcrest
According to the labor force statistics for Woodcrest, out of the total population over 16 years of age (13,838), 62.1% or 8,593 individuals are in the labor force, with 4.1% or 352 of them unemployed. The age group with the highest labor force participation rate is 20 to 24 years, with 89.4% or 1,085 individuals in the labor force. Within the labor force, the 25 to 29 years age range has the highest percentage of unemployed individuals, with 10.2% or 88 of them being unemployed.
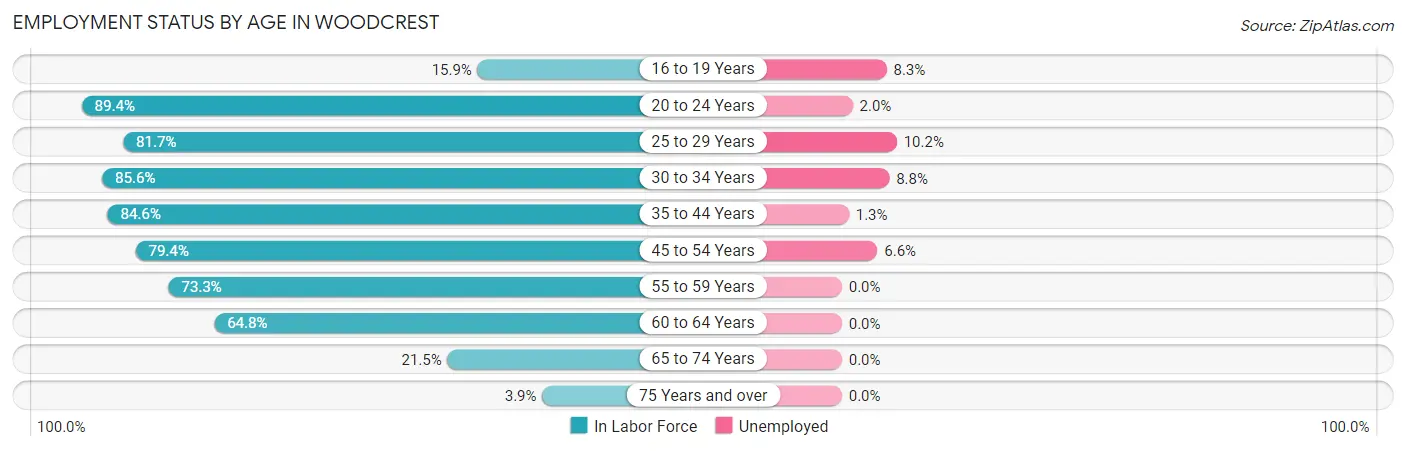
| Age Bracket | In Labor Force | Unemployed |
| 16 to 19 Years | 145 (15.9%) | 12 (8.3%) |
| 20 to 24 Years | 1,085 (89.4%) | 22 (2.0%) |
| 25 to 29 Years | 865 (81.7%) | 88 (10.2%) |
| 30 to 34 Years | 1,029 (85.6%) | 91 (8.8%) |
| 35 to 44 Years | 1,914 (84.6%) | 25 (1.3%) |
| 45 to 54 Years | 1,813 (79.4%) | 120 (6.6%) |
| 55 to 59 Years | 825 (73.3%) | 0 (0.0%) |
| 60 to 64 Years | 527 (64.8%) | 0 (0.0%) |
| 65 to 74 Years | 344 (21.5%) | 0 (0.0%) |
| 75 Years and over | 53 (3.9%) | 0 (0.0%) |
| Total | 8,593 (62.1%) | 352 (4.1%) |
Employment Status by Educational Attainment in Woodcrest
According to labor force statistics for Woodcrest, 79.7% of individuals (6,970) out of the total population between 25 and 64 years of age (8,745) are in the labor force, with 4.6% or 321 of them being unemployed. The group with the highest labor force participation rate are those with the educational attainment of bachelor's degree or higher, with 87.2% or 2,281 individuals in the labor force. Within the labor force, individuals with high school diploma education have the highest percentage of unemployment, with 10.8% or 199 of them being unemployed.
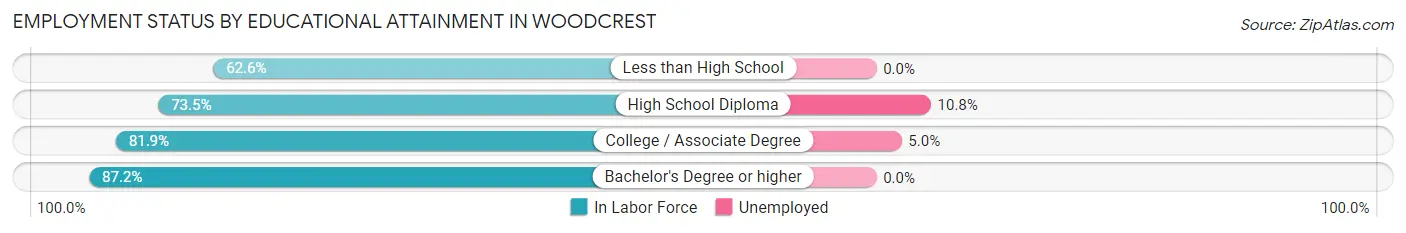
| Educational Attainment | In Labor Force | Unemployed |
| Less than High School | 390 (62.6%) | 0 (0.0%) |
| High School Diploma | 1,839 (73.5%) | 270 (10.8%) |
| College / Associate Degree | 2,460 (81.9%) | 150 (5.0%) |
| Bachelor's Degree or higher | 2,281 (87.2%) | 0 (0.0%) |
| Total | 6,970 (79.7%) | 402 (4.6%) |
Employment Occupations by Sex in Woodcrest
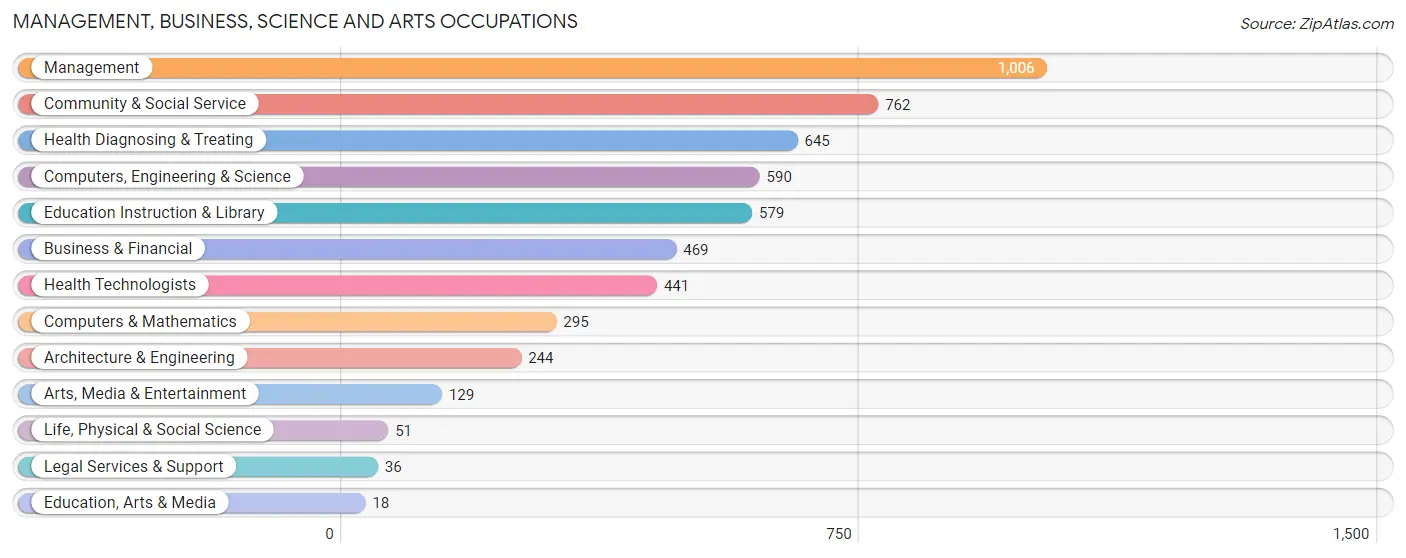
Management, Business, Science and Arts Occupations
The most common Management, Business, Science and Arts occupations in Woodcrest are Management (1,006 | 12.3%), Community & Social Service (762 | 9.3%), Health Diagnosing & Treating (645 | 7.9%), Computers, Engineering & Science (590 | 7.2%), and Education Instruction & Library (579 | 7.1%).
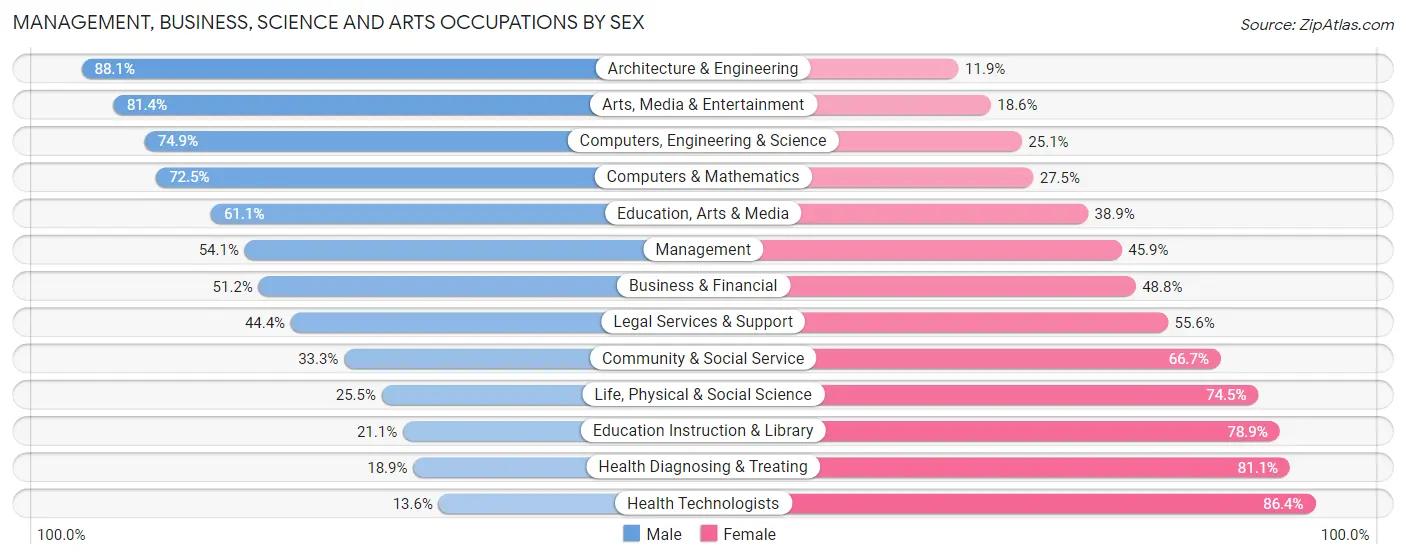
Management, Business, Science and Arts Occupations by Sex
Within the Management, Business, Science and Arts occupations in Woodcrest, the most male-oriented occupations are Architecture & Engineering (88.1%), Arts, Media & Entertainment (81.4%), and Computers, Engineering & Science (74.9%), while the most female-oriented occupations are Health Technologists (86.4%), Health Diagnosing & Treating (81.1%), and Education Instruction & Library (78.9%).
| Occupation | Male | Female |
| Management | 544 (54.1%) | 462 (45.9%) |
| Business & Financial | 240 (51.2%) | 229 (48.8%) |
| Computers, Engineering & Science | 442 (74.9%) | 148 (25.1%) |
| Computers & Mathematics | 214 (72.5%) | 81 (27.5%) |
| Architecture & Engineering | 215 (88.1%) | 29 (11.9%) |
| Life, Physical & Social Science | 13 (25.5%) | 38 (74.5%) |
| Community & Social Service | 254 (33.3%) | 508 (66.7%) |
| Education, Arts & Media | 11 (61.1%) | 7 (38.9%) |
| Legal Services & Support | 16 (44.4%) | 20 (55.6%) |
| Education Instruction & Library | 122 (21.1%) | 457 (78.9%) |
| Arts, Media & Entertainment | 105 (81.4%) | 24 (18.6%) |
| Health Diagnosing & Treating | 122 (18.9%) | 523 (81.1%) |
| Health Technologists | 60 (13.6%) | 381 (86.4%) |
| Total (Category) | 1,602 (46.1%) | 1,870 (53.9%) |
| Total (Overall) | 4,728 (57.9%) | 3,441 (42.1%) |
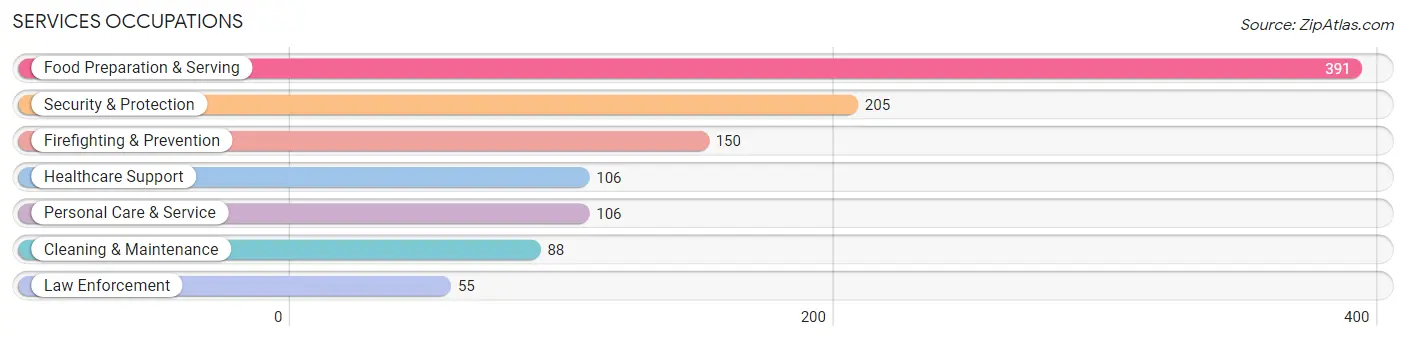
Services Occupations
The most common Services occupations in Woodcrest are Food Preparation & Serving (391 | 4.8%), Security & Protection (205 | 2.5%), Firefighting & Prevention (150 | 1.8%), Healthcare Support (106 | 1.3%), and Personal Care & Service (106 | 1.3%).
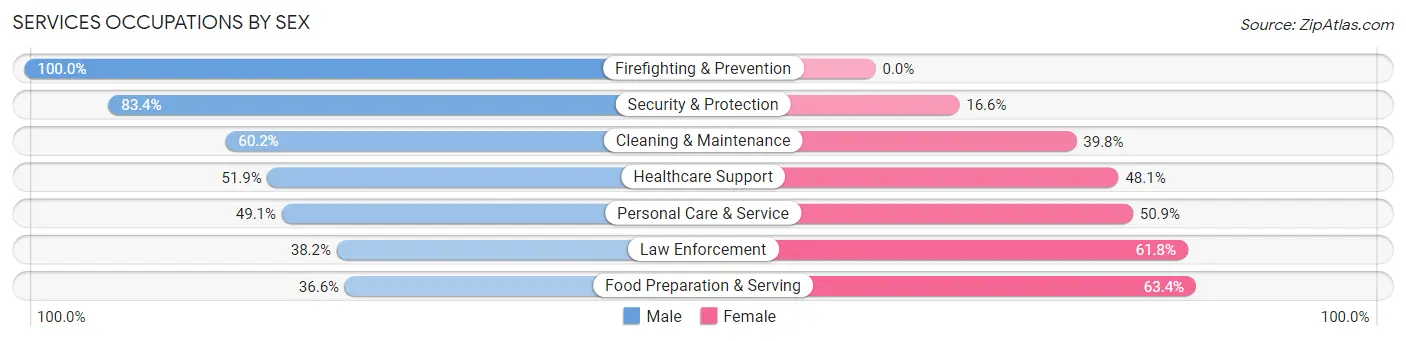
Services Occupations by Sex
Within the Services occupations in Woodcrest, the most male-oriented occupations are Firefighting & Prevention (100.0%), Security & Protection (83.4%), and Cleaning & Maintenance (60.2%), while the most female-oriented occupations are Food Preparation & Serving (63.4%), Law Enforcement (61.8%), and Personal Care & Service (50.9%).
| Occupation | Male | Female |
| Healthcare Support | 55 (51.9%) | 51 (48.1%) |
| Security & Protection | 171 (83.4%) | 34 (16.6%) |
| Firefighting & Prevention | 150 (100.0%) | 0 (0.0%) |
| Law Enforcement | 21 (38.2%) | 34 (61.8%) |
| Food Preparation & Serving | 143 (36.6%) | 248 (63.4%) |
| Cleaning & Maintenance | 53 (60.2%) | 35 (39.8%) |
| Personal Care & Service | 52 (49.1%) | 54 (50.9%) |
| Total (Category) | 474 (52.9%) | 422 (47.1%) |
| Total (Overall) | 4,728 (57.9%) | 3,441 (42.1%) |
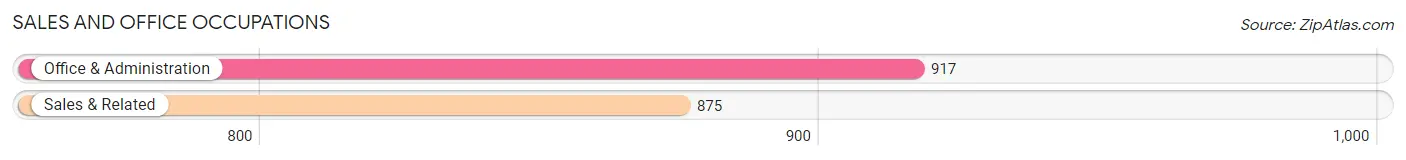
Sales and Office Occupations
The most common Sales and Office occupations in Woodcrest are Office & Administration (917 | 11.2%), and Sales & Related (875 | 10.7%).
Sales and Office Occupations by Sex
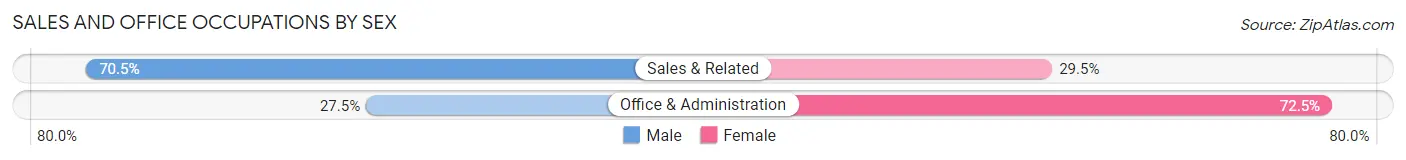
| Occupation | Male | Female |
| Sales & Related | 617 (70.5%) | 258 (29.5%) |
| Office & Administration | 252 (27.5%) | 665 (72.5%) |
| Total (Category) | 869 (48.5%) | 923 (51.5%) |
| Total (Overall) | 4,728 (57.9%) | 3,441 (42.1%) |
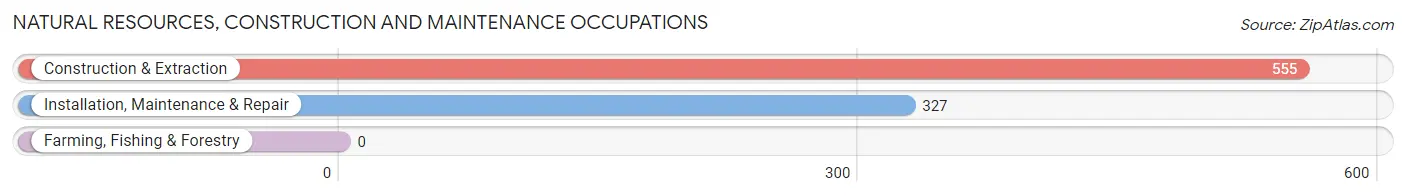
Natural Resources, Construction and Maintenance Occupations
The most common Natural Resources, Construction and Maintenance occupations in Woodcrest are Construction & Extraction (555 | 6.8%), and Installation, Maintenance & Repair (327 | 4.0%).
Natural Resources, Construction and Maintenance Occupations by Sex
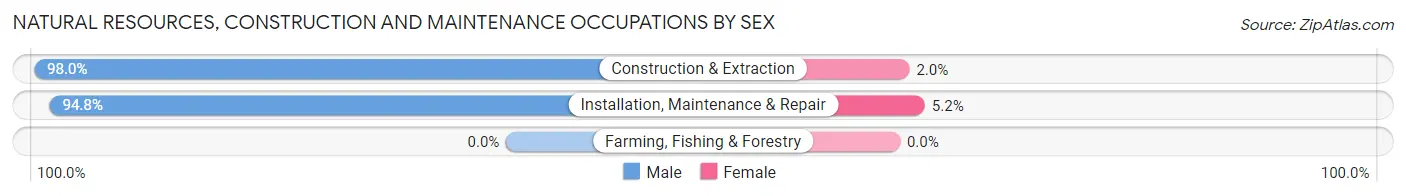
| Occupation | Male | Female |
| Farming, Fishing & Forestry | 0 (0.0%) | 0 (0.0%) |
| Construction & Extraction | 544 (98.0%) | 11 (2.0%) |
| Installation, Maintenance & Repair | 310 (94.8%) | 17 (5.2%) |
| Total (Category) | 854 (96.8%) | 28 (3.2%) |
| Total (Overall) | 4,728 (57.9%) | 3,441 (42.1%) |
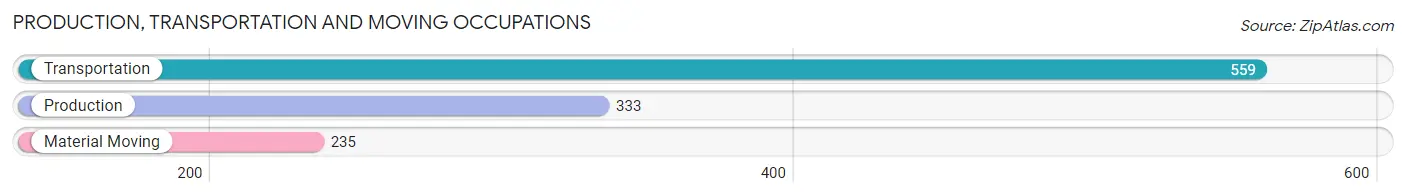
Production, Transportation and Moving Occupations
The most common Production, Transportation and Moving occupations in Woodcrest are Transportation (559 | 6.8%), Production (333 | 4.1%), and Material Moving (235 | 2.9%).
Production, Transportation and Moving Occupations by Sex
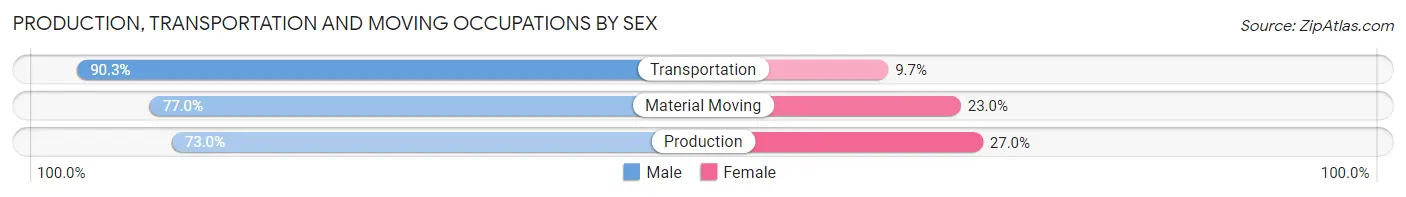
| Occupation | Male | Female |
| Production | 243 (73.0%) | 90 (27.0%) |
| Transportation | 505 (90.3%) | 54 (9.7%) |
| Material Moving | 181 (77.0%) | 54 (23.0%) |
| Total (Category) | 929 (82.4%) | 198 (17.6%) |
| Total (Overall) | 4,728 (57.9%) | 3,441 (42.1%) |
Employment Industries by Sex in Woodcrest
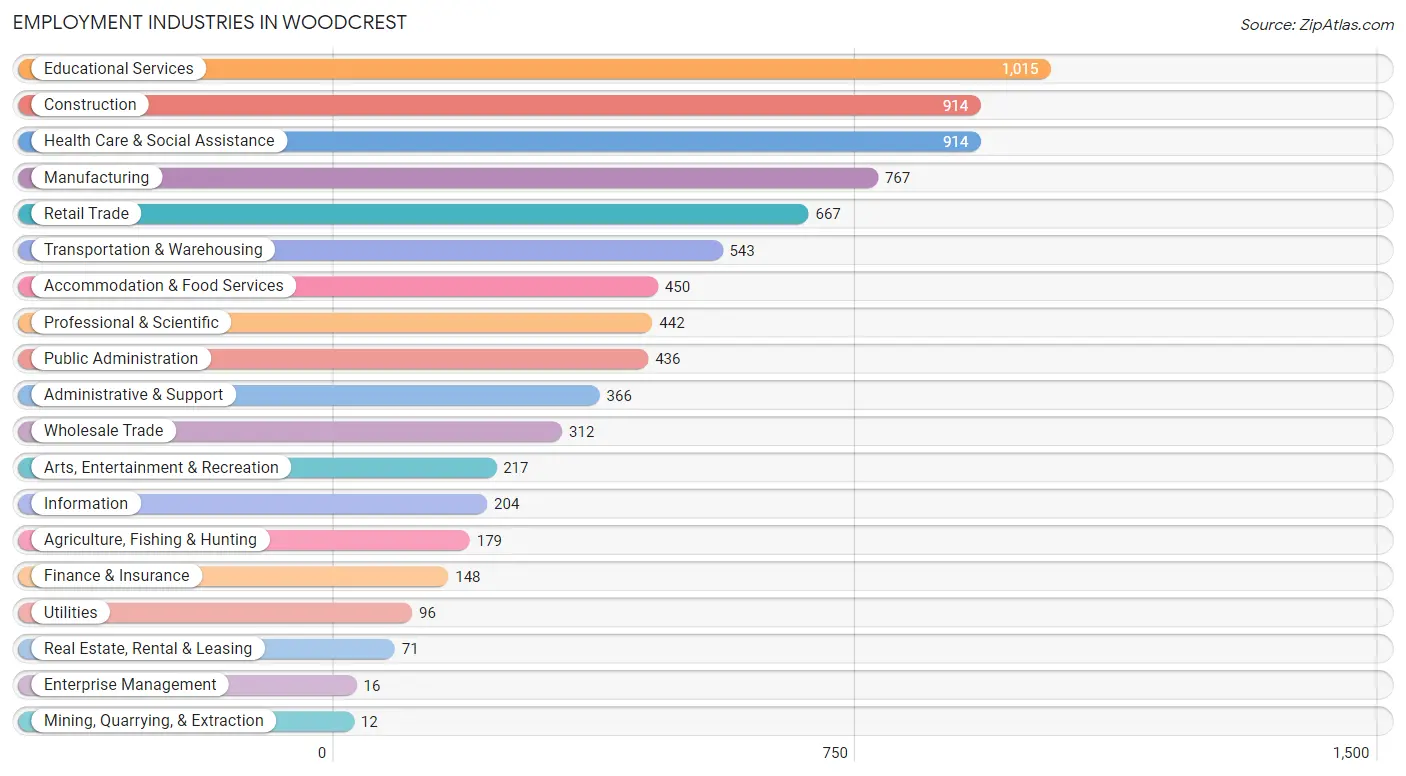
Employment Industries in Woodcrest
The major employment industries in Woodcrest include Educational Services (1,015 | 12.4%), Construction (914 | 11.2%), Health Care & Social Assistance (914 | 11.2%), Manufacturing (767 | 9.4%), and Retail Trade (667 | 8.2%).
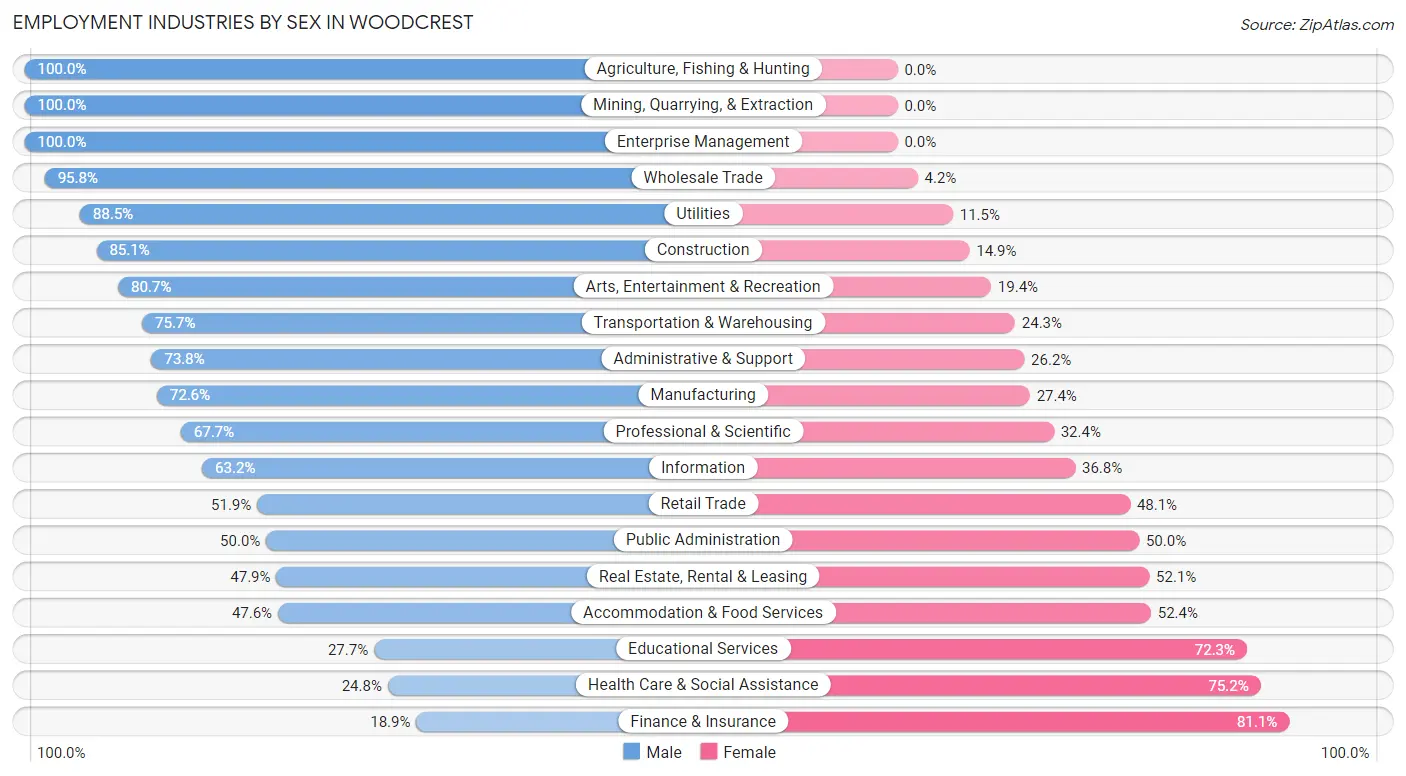
Employment Industries by Sex in Woodcrest
The Woodcrest industries that see more men than women are Agriculture, Fishing & Hunting (100.0%), Mining, Quarrying, & Extraction (100.0%), and Enterprise Management (100.0%), whereas the industries that tend to have a higher number of women are Finance & Insurance (81.1%), Health Care & Social Assistance (75.2%), and Educational Services (72.3%).
| Industry | Male | Female |
| Agriculture, Fishing & Hunting | 179 (100.0%) | 0 (0.0%) |
| Mining, Quarrying, & Extraction | 12 (100.0%) | 0 (0.0%) |
| Construction | 778 (85.1%) | 136 (14.9%) |
| Manufacturing | 557 (72.6%) | 210 (27.4%) |
| Wholesale Trade | 299 (95.8%) | 13 (4.2%) |
| Retail Trade | 346 (51.9%) | 321 (48.1%) |
| Transportation & Warehousing | 411 (75.7%) | 132 (24.3%) |
| Utilities | 85 (88.5%) | 11 (11.5%) |
| Information | 129 (63.2%) | 75 (36.8%) |
| Finance & Insurance | 28 (18.9%) | 120 (81.1%) |
| Real Estate, Rental & Leasing | 34 (47.9%) | 37 (52.1%) |
| Professional & Scientific | 299 (67.6%) | 143 (32.4%) |
| Enterprise Management | 16 (100.0%) | 0 (0.0%) |
| Administrative & Support | 270 (73.8%) | 96 (26.2%) |
| Educational Services | 281 (27.7%) | 734 (72.3%) |
| Health Care & Social Assistance | 227 (24.8%) | 687 (75.2%) |
| Arts, Entertainment & Recreation | 175 (80.6%) | 42 (19.4%) |
| Accommodation & Food Services | 214 (47.6%) | 236 (52.4%) |
| Public Administration | 218 (50.0%) | 218 (50.0%) |
| Total | 4,728 (57.9%) | 3,441 (42.1%) |
Education in Woodcrest
School Enrollment in Woodcrest
The most common levels of schooling among the 5,551 students in Woodcrest are college / undergraduate (1,659 | 29.9%), high school (1,378 | 24.8%), and middle school (940 | 16.9%).
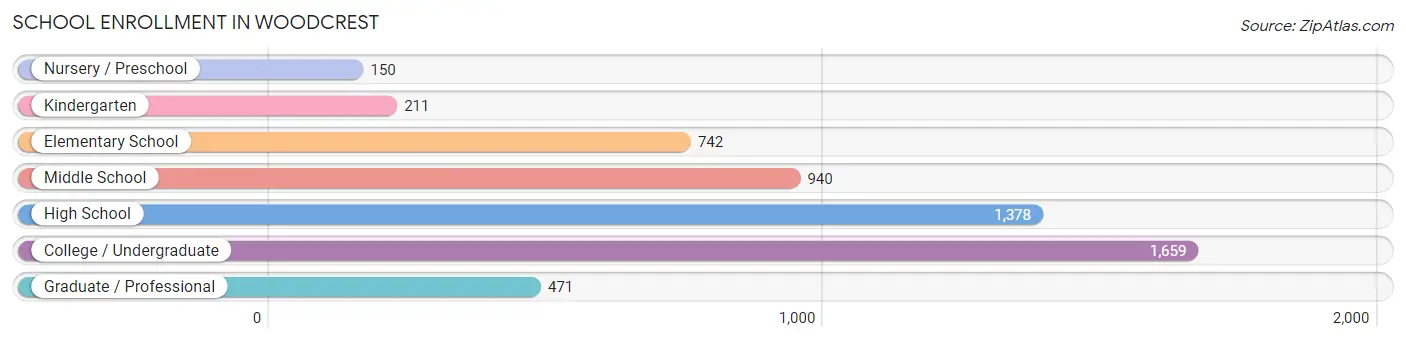
| School Level | # Students | % Students |
| Nursery / Preschool | 150 | 2.7% |
| Kindergarten | 211 | 3.8% |
| Elementary School | 742 | 13.4% |
| Middle School | 940 | 16.9% |
| High School | 1,378 | 24.8% |
| College / Undergraduate | 1,659 | 29.9% |
| Graduate / Professional | 471 | 8.5% |
| Total | 5,551 | 100.0% |
School Enrollment by Age by Funding Source in Woodcrest
Out of a total of 5,551 students who are enrolled in schools in Woodcrest, 994 (17.9%) attend a private institution, while the remaining 4,557 (82.1%) are enrolled in public schools. The age group of 25 to 34 year olds has the highest likelihood of being enrolled in private schools, with 283 (47.6% in the age bracket) enrolled. Conversely, the age group of 20 to 24 year olds has the lowest likelihood of being enrolled in a private school, with 742 (95.3% in the age bracket) attending a public institution.
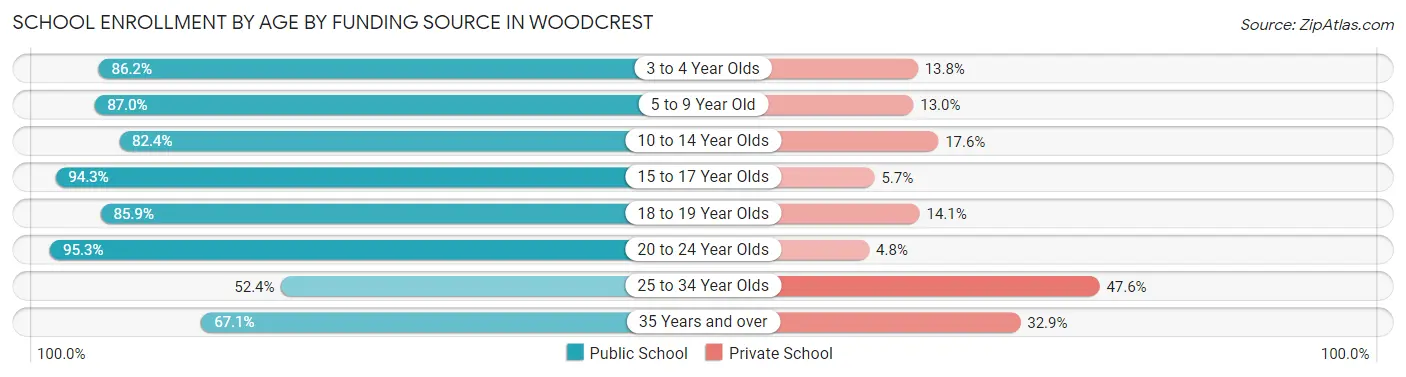
| Age Bracket | Public School | Private School |
| 3 to 4 Year Olds | 75 (86.2%) | 12 (13.8%) |
| 5 to 9 Year Old | 832 (87.0%) | 124 (13.0%) |
| 10 to 14 Year Olds | 1,015 (82.4%) | 217 (17.6%) |
| 15 to 17 Year Olds | 870 (94.3%) | 53 (5.7%) |
| 18 to 19 Year Olds | 249 (85.9%) | 41 (14.1%) |
| 20 to 24 Year Olds | 742 (95.3%) | 37 (4.8%) |
| 25 to 34 Year Olds | 311 (52.4%) | 283 (47.6%) |
| 35 Years and over | 463 (67.1%) | 227 (32.9%) |
| Total | 4,557 (82.1%) | 994 (17.9%) |
Educational Attainment by Field of Study in Woodcrest
Business (707 | 19.7%), education (421 | 11.7%), engineering (396 | 11.0%), social sciences (350 | 9.7%), and science & technology (344 | 9.6%) are the most common fields of study among 3,592 individuals in Woodcrest who have obtained a bachelor's degree or higher.
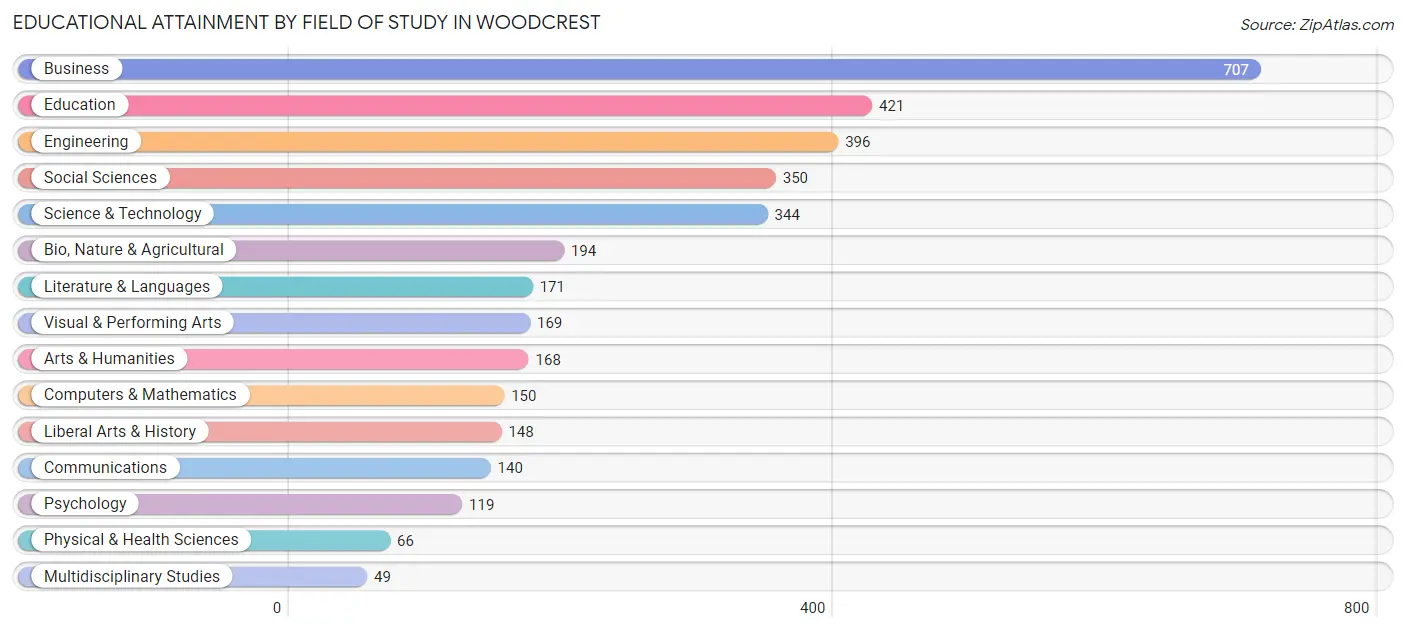
| Field of Study | # Graduates | % Graduates |
| Computers & Mathematics | 150 | 4.2% |
| Bio, Nature & Agricultural | 194 | 5.4% |
| Physical & Health Sciences | 66 | 1.8% |
| Psychology | 119 | 3.3% |
| Social Sciences | 350 | 9.7% |
| Engineering | 396 | 11.0% |
| Multidisciplinary Studies | 49 | 1.4% |
| Science & Technology | 344 | 9.6% |
| Business | 707 | 19.7% |
| Education | 421 | 11.7% |
| Literature & Languages | 171 | 4.8% |
| Liberal Arts & History | 148 | 4.1% |
| Visual & Performing Arts | 169 | 4.7% |
| Communications | 140 | 3.9% |
| Arts & Humanities | 168 | 4.7% |
| Total | 3,592 | 100.0% |
Transportation & Commute in Woodcrest
Vehicle Availability by Sex in Woodcrest
The most prevalent vehicle ownership categories in Woodcrest are males with 5 or more vehicles (1,343, accounting for 29.2%) and females with 5 or more vehicles (727, making up 40.1%).
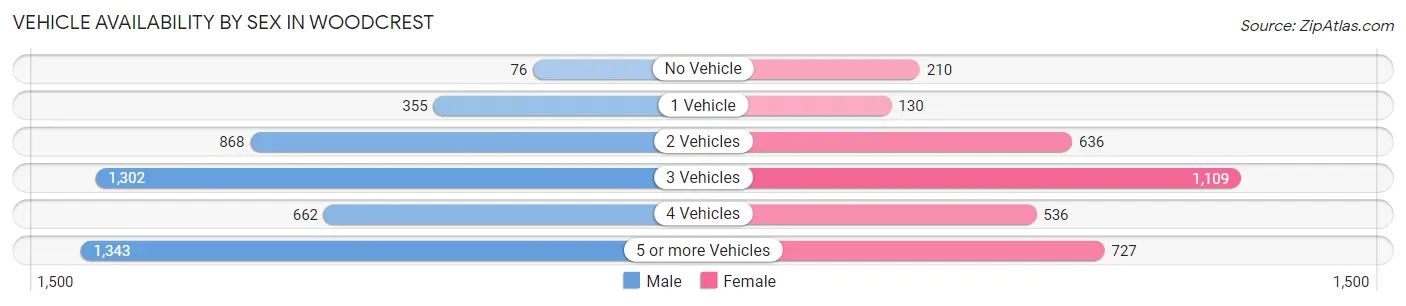
| Vehicles Available | Male | Female |
| No Vehicle | 76 (1.7%) | 210 (6.3%) |
| 1 Vehicle | 355 (7.7%) | 130 (3.9%) |
| 2 Vehicles | 868 (18.8%) | 636 (19.0%) |
| 3 Vehicles | 1,302 (28.3%) | 1,109 (33.1%) |
| 4 Vehicles | 662 (14.4%) | 536 (16.0%) |
| 5 or more Vehicles | 1,343 (29.2%) | 727 (21.7%) |
| Total | 4,606 (100.0%) | 3,348 (100.0%) |
Commute Time in Woodcrest
The most frequently occuring commute durations in Woodcrest are 20 to 24 minutes (1,230 commuters, 17.2%), 60 to 89 minutes (1,117 commuters, 15.6%), and 15 to 19 minutes (1,086 commuters, 15.2%).
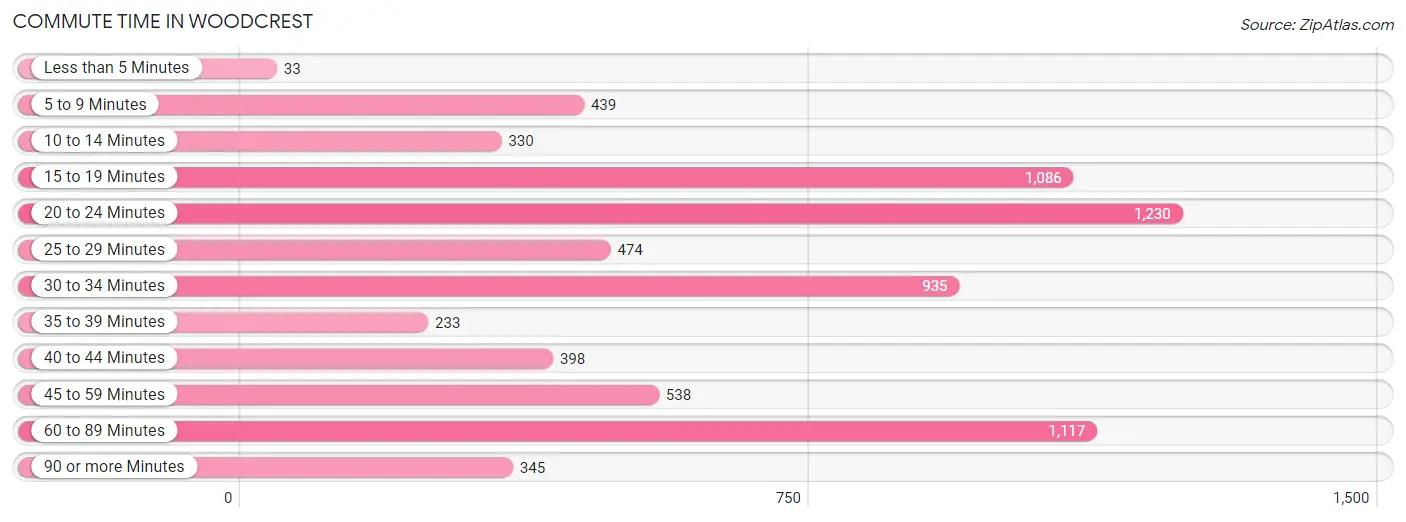
| Commute Time | # Commuters | % Commuters |
| Less than 5 Minutes | 33 | 0.5% |
| 5 to 9 Minutes | 439 | 6.1% |
| 10 to 14 Minutes | 330 | 4.6% |
| 15 to 19 Minutes | 1,086 | 15.2% |
| 20 to 24 Minutes | 1,230 | 17.2% |
| 25 to 29 Minutes | 474 | 6.6% |
| 30 to 34 Minutes | 935 | 13.1% |
| 35 to 39 Minutes | 233 | 3.3% |
| 40 to 44 Minutes | 398 | 5.6% |
| 45 to 59 Minutes | 538 | 7.5% |
| 60 to 89 Minutes | 1,117 | 15.6% |
| 90 or more Minutes | 345 | 4.8% |
Commute Time by Sex in Woodcrest
The most common commute times in Woodcrest are 60 to 89 minutes (647 commuters, 15.3%) for males and 20 to 24 minutes (706 commuters, 24.0%) for females.
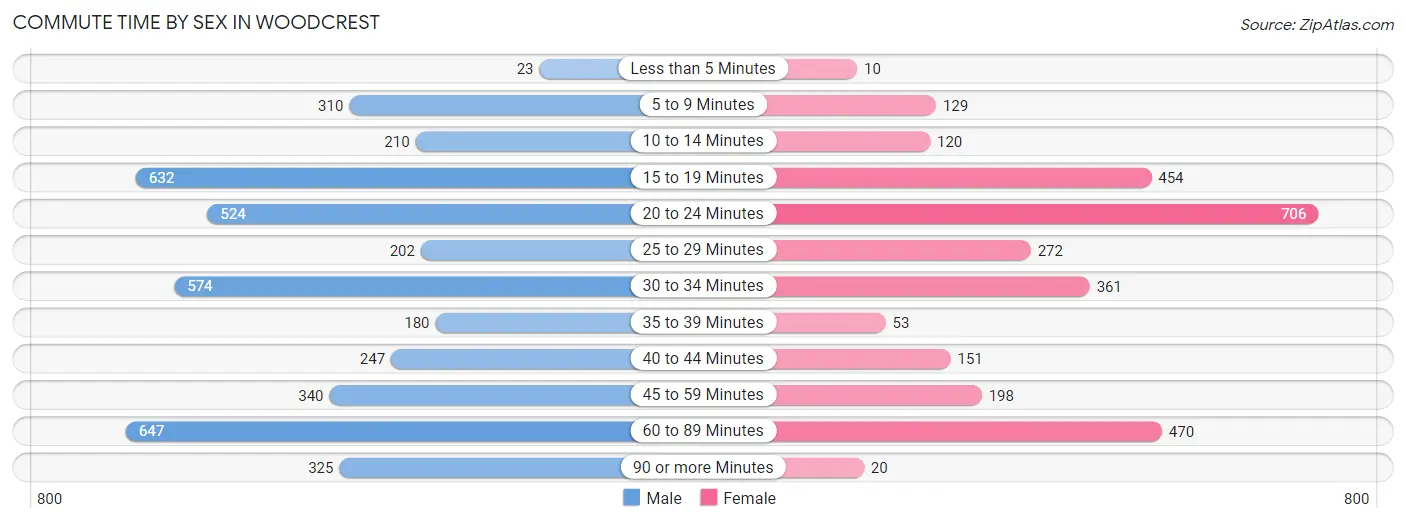
| Commute Time | Male | Female |
| Less than 5 Minutes | 23 (0.5%) | 10 (0.3%) |
| 5 to 9 Minutes | 310 (7.4%) | 129 (4.4%) |
| 10 to 14 Minutes | 210 (5.0%) | 120 (4.1%) |
| 15 to 19 Minutes | 632 (15.0%) | 454 (15.4%) |
| 20 to 24 Minutes | 524 (12.4%) | 706 (24.0%) |
| 25 to 29 Minutes | 202 (4.8%) | 272 (9.2%) |
| 30 to 34 Minutes | 574 (13.6%) | 361 (12.3%) |
| 35 to 39 Minutes | 180 (4.3%) | 53 (1.8%) |
| 40 to 44 Minutes | 247 (5.9%) | 151 (5.1%) |
| 45 to 59 Minutes | 340 (8.1%) | 198 (6.7%) |
| 60 to 89 Minutes | 647 (15.3%) | 470 (16.0%) |
| 90 or more Minutes | 325 (7.7%) | 20 (0.7%) |
Time of Departure to Work by Sex in Woodcrest
The most frequent times of departure to work in Woodcrest are 7:00 AM to 7:29 AM (751, 17.8%) for males and 7:00 AM to 7:29 AM (518, 17.6%) for females.
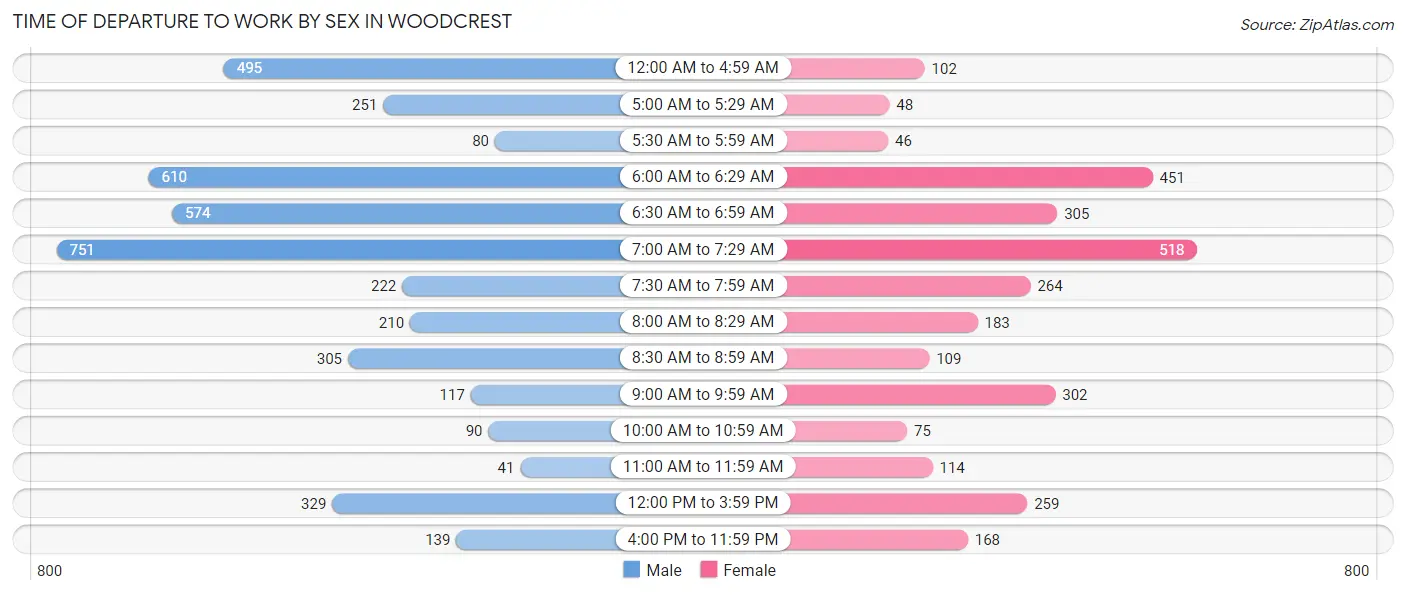
| Time of Departure | Male | Female |
| 12:00 AM to 4:59 AM | 495 (11.7%) | 102 (3.5%) |
| 5:00 AM to 5:29 AM | 251 (6.0%) | 48 (1.6%) |
| 5:30 AM to 5:59 AM | 80 (1.9%) | 46 (1.6%) |
| 6:00 AM to 6:29 AM | 610 (14.5%) | 451 (15.3%) |
| 6:30 AM to 6:59 AM | 574 (13.6%) | 305 (10.4%) |
| 7:00 AM to 7:29 AM | 751 (17.8%) | 518 (17.6%) |
| 7:30 AM to 7:59 AM | 222 (5.3%) | 264 (9.0%) |
| 8:00 AM to 8:29 AM | 210 (5.0%) | 183 (6.2%) |
| 8:30 AM to 8:59 AM | 305 (7.2%) | 109 (3.7%) |
| 9:00 AM to 9:59 AM | 117 (2.8%) | 302 (10.3%) |
| 10:00 AM to 10:59 AM | 90 (2.1%) | 75 (2.5%) |
| 11:00 AM to 11:59 AM | 41 (1.0%) | 114 (3.9%) |
| 12:00 PM to 3:59 PM | 329 (7.8%) | 259 (8.8%) |
| 4:00 PM to 11:59 PM | 139 (3.3%) | 168 (5.7%) |
| Total | 4,214 (100.0%) | 2,944 (100.0%) |
Housing Occupancy in Woodcrest
Occupancy by Ownership in Woodcrest
Of the total 4,669 dwellings in Woodcrest, owner-occupied units account for 4,218 (90.3%), while renter-occupied units make up 451 (9.7%).
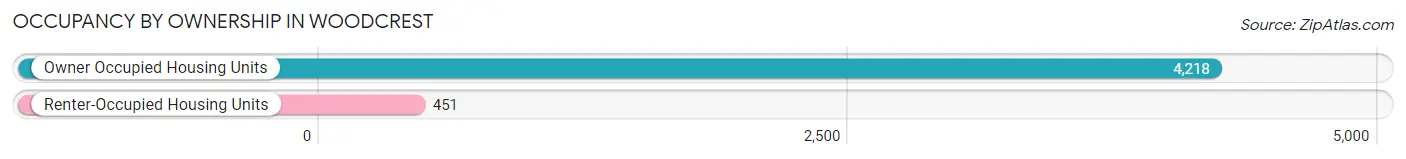
| Occupancy | # Housing Units | % Housing Units |
| Owner Occupied Housing Units | 4,218 | 90.3% |
| Renter-Occupied Housing Units | 451 | 9.7% |
| Total Occupied Housing Units | 4,669 | 100.0% |
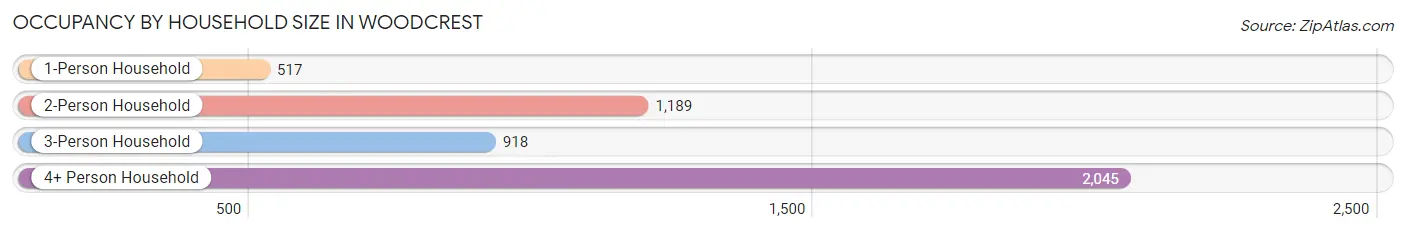
Occupancy by Household Size in Woodcrest
| Household Size | # Housing Units | % Housing Units |
| 1-Person Household | 517 | 11.1% |
| 2-Person Household | 1,189 | 25.5% |
| 3-Person Household | 918 | 19.7% |
| 4+ Person Household | 2,045 | 43.8% |
| Total Housing Units | 4,669 | 100.0% |
Occupancy by Ownership by Household Size in Woodcrest
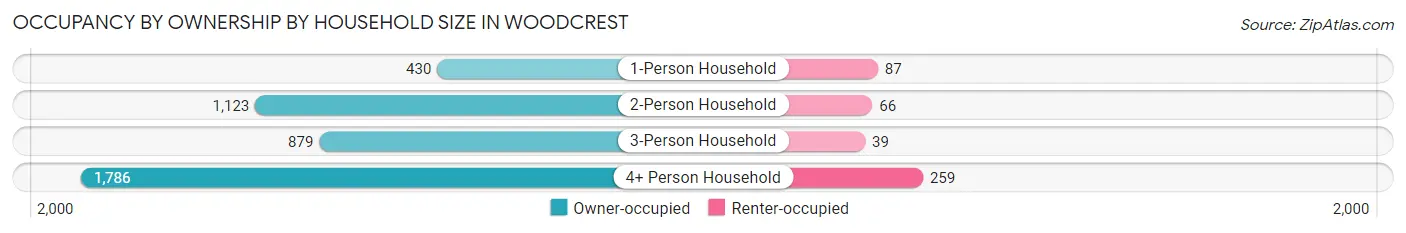
| Household Size | Owner-occupied | Renter-occupied |
| 1-Person Household | 430 (83.2%) | 87 (16.8%) |
| 2-Person Household | 1,123 (94.5%) | 66 (5.6%) |
| 3-Person Household | 879 (95.8%) | 39 (4.3%) |
| 4+ Person Household | 1,786 (87.3%) | 259 (12.7%) |
| Total Housing Units | 4,218 (90.3%) | 451 (9.7%) |
Occupancy by Educational Attainment in Woodcrest
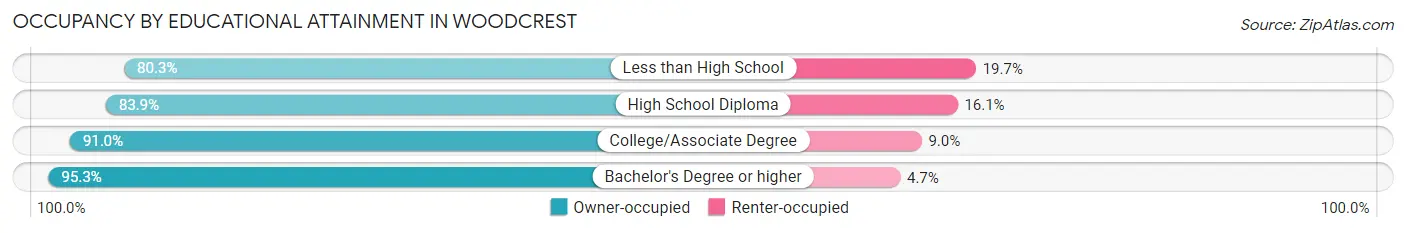
| Household Size | Owner-occupied | Renter-occupied |
| Less than High School | 244 (80.3%) | 60 (19.7%) |
| High School Diploma | 750 (83.9%) | 144 (16.1%) |
| College/Associate Degree | 1,773 (91.0%) | 175 (9.0%) |
| Bachelor's Degree or higher | 1,451 (95.3%) | 72 (4.7%) |
Occupancy by Age of Householder in Woodcrest
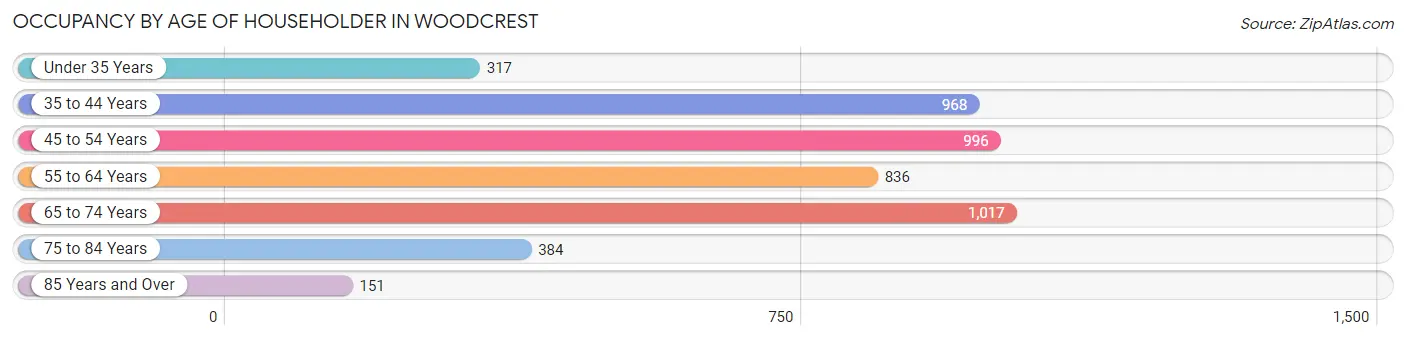
| Age Bracket | # Households | % Households |
| Under 35 Years | 317 | 6.8% |
| 35 to 44 Years | 968 | 20.7% |
| 45 to 54 Years | 996 | 21.3% |
| 55 to 64 Years | 836 | 17.9% |
| 65 to 74 Years | 1,017 | 21.8% |
| 75 to 84 Years | 384 | 8.2% |
| 85 Years and Over | 151 | 3.2% |
| Total | 4,669 | 100.0% |
Housing Finances in Woodcrest
Median Income by Occupancy in Woodcrest
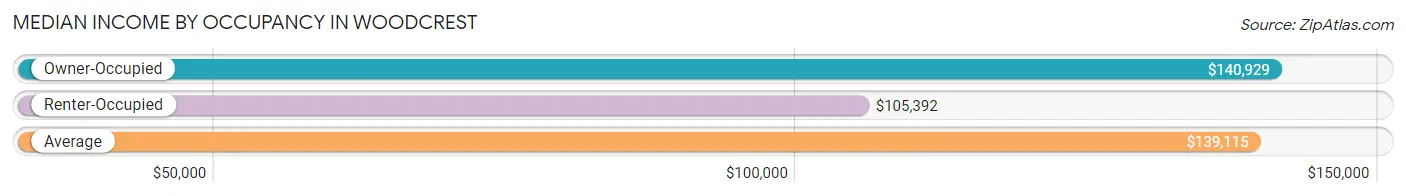
| Occupancy Type | # Households | Median Income |
| Owner-Occupied | 4,218 (90.3%) | $140,929 |
| Renter-Occupied | 451 (9.7%) | $105,392 |
| Average | 4,669 (100.0%) | $139,115 |
Occupancy by Householder Income Bracket in Woodcrest
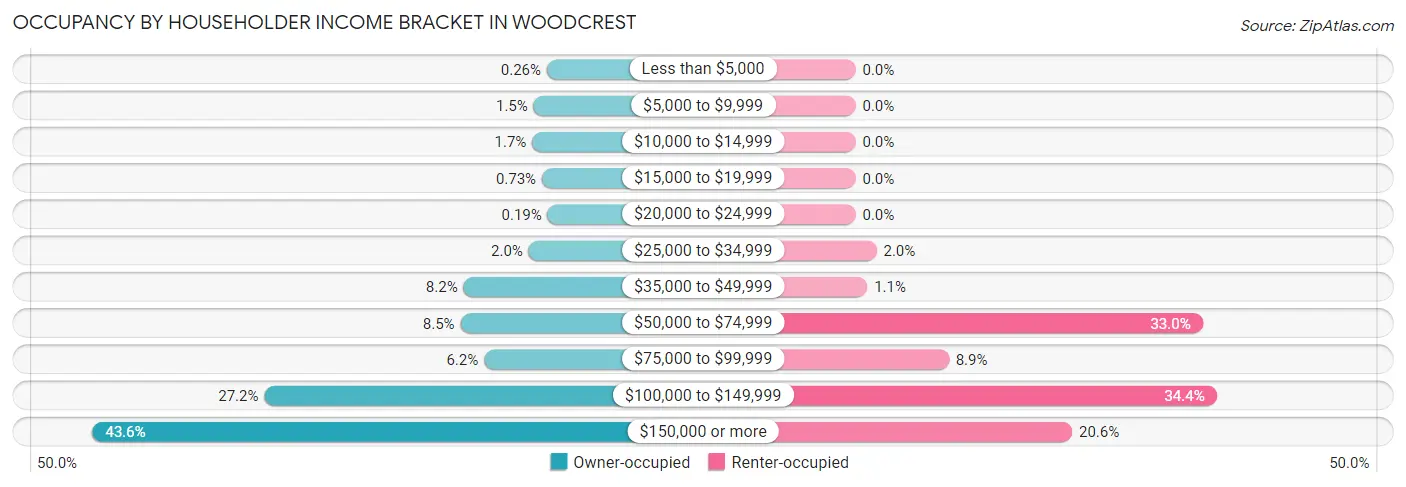
| Income Bracket | Owner-occupied | Renter-occupied |
| Less than $5,000 | 11 (0.3%) | 0 (0.0%) |
| $5,000 to $9,999 | 64 (1.5%) | 0 (0.0%) |
| $10,000 to $14,999 | 70 (1.7%) | 0 (0.0%) |
| $15,000 to $19,999 | 31 (0.7%) | 0 (0.0%) |
| $20,000 to $24,999 | 8 (0.2%) | 0 (0.0%) |
| $25,000 to $34,999 | 84 (2.0%) | 9 (2.0%) |
| $35,000 to $49,999 | 346 (8.2%) | 5 (1.1%) |
| $50,000 to $74,999 | 358 (8.5%) | 149 (33.0%) |
| $75,000 to $99,999 | 263 (6.2%) | 40 (8.9%) |
| $100,000 to $149,999 | 1,146 (27.2%) | 155 (34.4%) |
| $150,000 or more | 1,837 (43.5%) | 93 (20.6%) |
| Total | 4,218 (100.0%) | 451 (100.0%) |
Monthly Housing Cost Tiers in Woodcrest
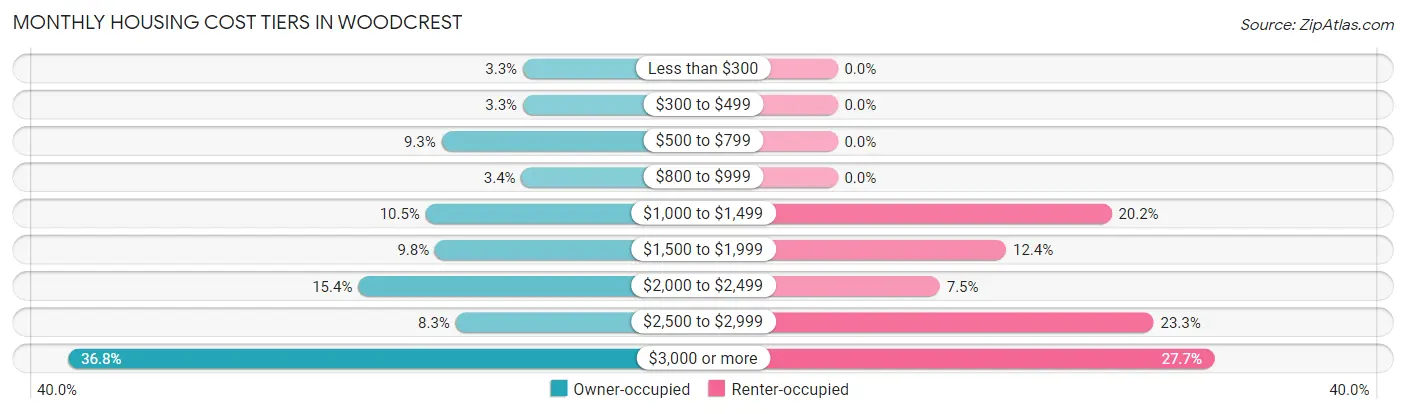
| Monthly Cost | Owner-occupied | Renter-occupied |
| Less than $300 | 139 (3.3%) | 0 (0.0%) |
| $300 to $499 | 139 (3.3%) | 0 (0.0%) |
| $500 to $799 | 392 (9.3%) | 0 (0.0%) |
| $800 to $999 | 144 (3.4%) | 0 (0.0%) |
| $1,000 to $1,499 | 441 (10.5%) | 91 (20.2%) |
| $1,500 to $1,999 | 412 (9.8%) | 56 (12.4%) |
| $2,000 to $2,499 | 651 (15.4%) | 34 (7.5%) |
| $2,500 to $2,999 | 348 (8.3%) | 105 (23.3%) |
| $3,000 or more | 1,552 (36.8%) | 125 (27.7%) |
| Total | 4,218 (100.0%) | 451 (100.0%) |
Physical Housing Characteristics in Woodcrest
Housing Structures in Woodcrest
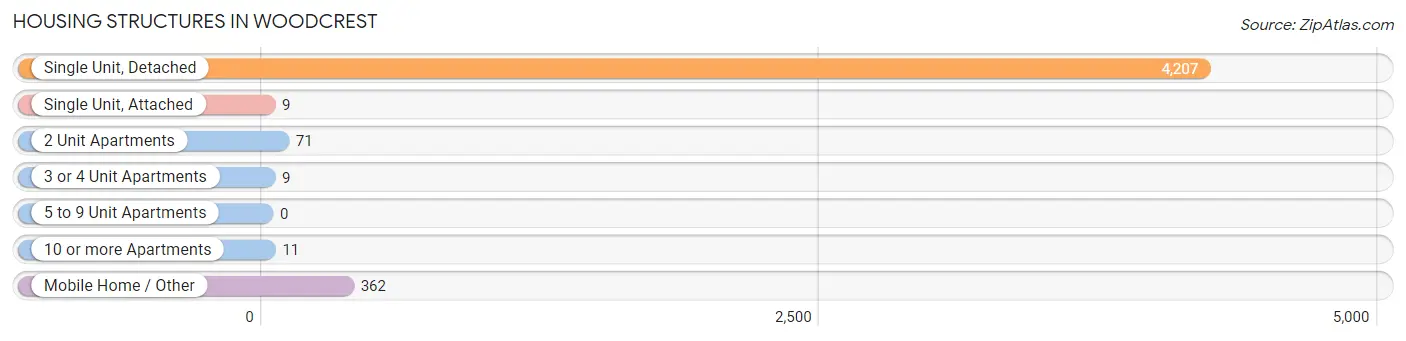
| Structure Type | # Housing Units | % Housing Units |
| Single Unit, Detached | 4,207 | 90.1% |
| Single Unit, Attached | 9 | 0.2% |
| 2 Unit Apartments | 71 | 1.5% |
| 3 or 4 Unit Apartments | 9 | 0.2% |
| 5 to 9 Unit Apartments | 0 | 0.0% |
| 10 or more Apartments | 11 | 0.2% |
| Mobile Home / Other | 362 | 7.7% |
| Total | 4,669 | 100.0% |
Housing Structures by Occupancy in Woodcrest
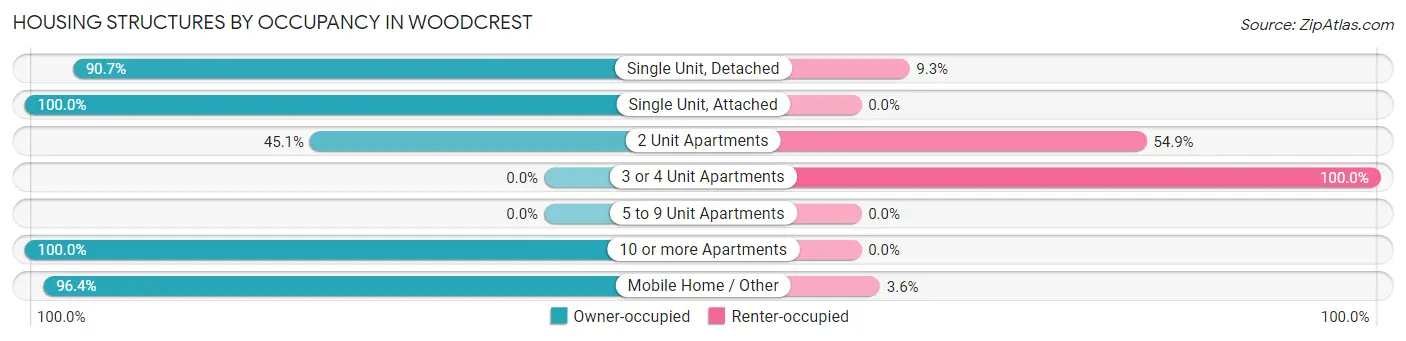
| Structure Type | Owner-occupied | Renter-occupied |
| Single Unit, Detached | 3,817 (90.7%) | 390 (9.3%) |
| Single Unit, Attached | 9 (100.0%) | 0 (0.0%) |
| 2 Unit Apartments | 32 (45.1%) | 39 (54.9%) |
| 3 or 4 Unit Apartments | 0 (0.0%) | 9 (100.0%) |
| 5 to 9 Unit Apartments | 0 (0.0%) | 0 (0.0%) |
| 10 or more Apartments | 11 (100.0%) | 0 (0.0%) |
| Mobile Home / Other | 349 (96.4%) | 13 (3.6%) |
| Total | 4,218 (90.3%) | 451 (9.7%) |
Housing Structures by Number of Rooms in Woodcrest
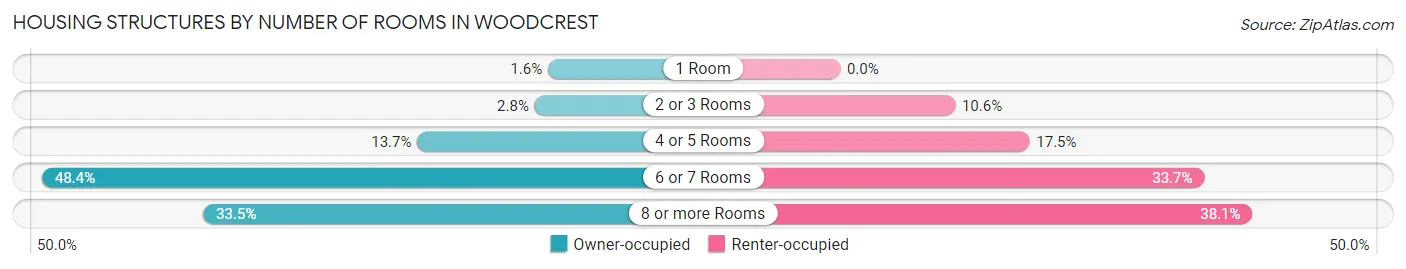
| Number of Rooms | Owner-occupied | Renter-occupied |
| 1 Room | 67 (1.6%) | 0 (0.0%) |
| 2 or 3 Rooms | 119 (2.8%) | 48 (10.6%) |
| 4 or 5 Rooms | 577 (13.7%) | 79 (17.5%) |
| 6 or 7 Rooms | 2,042 (48.4%) | 152 (33.7%) |
| 8 or more Rooms | 1,413 (33.5%) | 172 (38.1%) |
| Total | 4,218 (100.0%) | 451 (100.0%) |
Housing Structure by Heating Type in Woodcrest
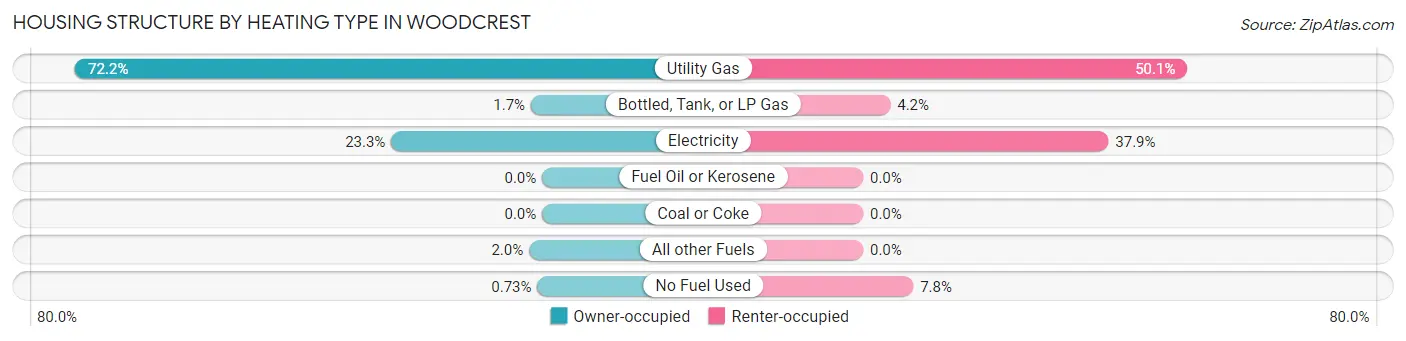
| Heating Type | Owner-occupied | Renter-occupied |
| Utility Gas | 3,045 (72.2%) | 226 (50.1%) |
| Bottled, Tank, or LP Gas | 73 (1.7%) | 19 (4.2%) |
| Electricity | 984 (23.3%) | 171 (37.9%) |
| Fuel Oil or Kerosene | 0 (0.0%) | 0 (0.0%) |
| Coal or Coke | 0 (0.0%) | 0 (0.0%) |
| All other Fuels | 85 (2.0%) | 0 (0.0%) |
| No Fuel Used | 31 (0.7%) | 35 (7.8%) |
| Total | 4,218 (100.0%) | 451 (100.0%) |
Household Vehicle Usage in Woodcrest
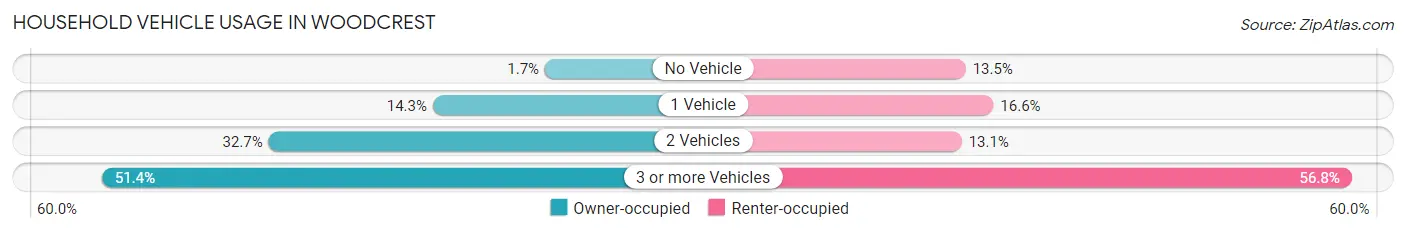
| Vehicles per Household | Owner-occupied | Renter-occupied |
| No Vehicle | 72 (1.7%) | 61 (13.5%) |
| 1 Vehicle | 602 (14.3%) | 75 (16.6%) |
| 2 Vehicles | 1,378 (32.7%) | 59 (13.1%) |
| 3 or more Vehicles | 2,166 (51.3%) | 256 (56.8%) |
| Total | 4,218 (100.0%) | 451 (100.0%) |
Real Estate & Mortgages in Woodcrest
Real Estate and Mortgage Overview in Woodcrest
| Characteristic | Without Mortgage | With Mortgage |
| Housing Units | 1,079 | 3,139 |
| Median Property Value | $525,200 | $663,900 |
| Median Household Income | $108,897 | $1,537 |
| Monthly Housing Costs | $763 | $1,542 |
| Real Estate Taxes | $3,265 | $78 |
Property Value by Mortgage Status in Woodcrest
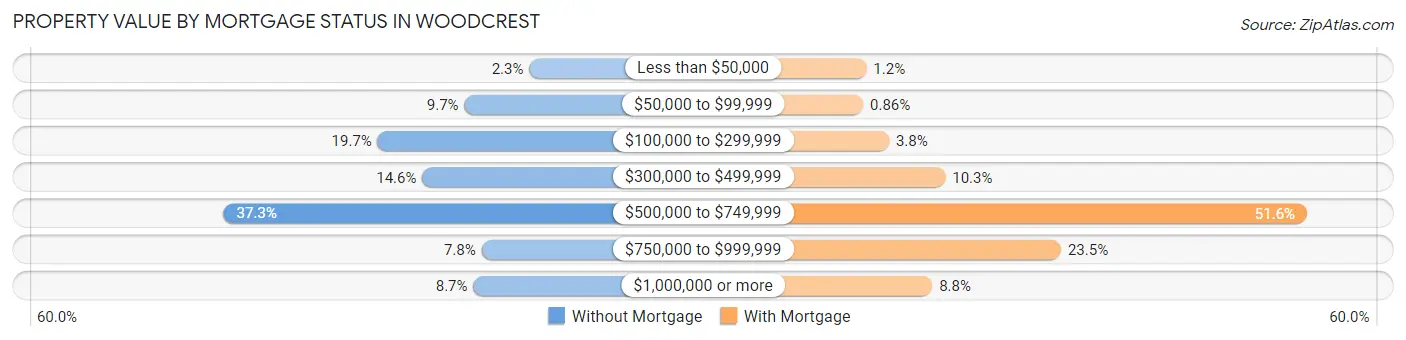
| Property Value | Without Mortgage | With Mortgage |
| Less than $50,000 | 25 (2.3%) | 39 (1.2%) |
| $50,000 to $99,999 | 105 (9.7%) | 27 (0.9%) |
| $100,000 to $299,999 | 212 (19.7%) | 120 (3.8%) |
| $300,000 to $499,999 | 157 (14.5%) | 322 (10.3%) |
| $500,000 to $749,999 | 402 (37.3%) | 1,619 (51.6%) |
| $750,000 to $999,999 | 84 (7.8%) | 737 (23.5%) |
| $1,000,000 or more | 94 (8.7%) | 275 (8.8%) |
| Total | 1,079 (100.0%) | 3,139 (100.0%) |
Household Income by Mortgage Status in Woodcrest
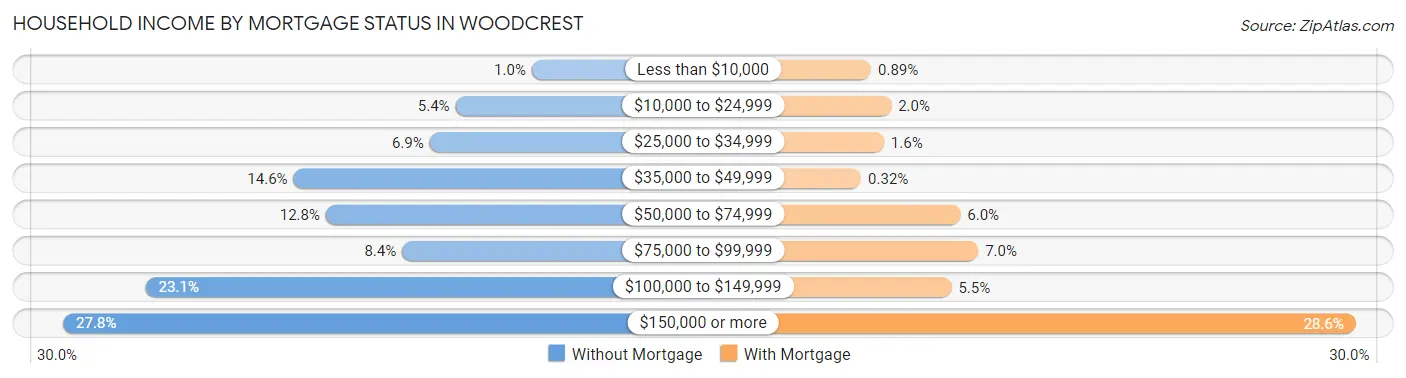
| Household Income | Without Mortgage | With Mortgage |
| Less than $10,000 | 11 (1.0%) | 28 (0.9%) |
| $10,000 to $24,999 | 58 (5.4%) | 64 (2.0%) |
| $25,000 to $34,999 | 74 (6.9%) | 51 (1.6%) |
| $35,000 to $49,999 | 158 (14.6%) | 10 (0.3%) |
| $50,000 to $74,999 | 138 (12.8%) | 188 (6.0%) |
| $75,000 to $99,999 | 91 (8.4%) | 220 (7.0%) |
| $100,000 to $149,999 | 249 (23.1%) | 172 (5.5%) |
| $150,000 or more | 300 (27.8%) | 897 (28.6%) |
| Total | 1,079 (100.0%) | 3,139 (100.0%) |
Property Value to Household Income Ratio in Woodcrest
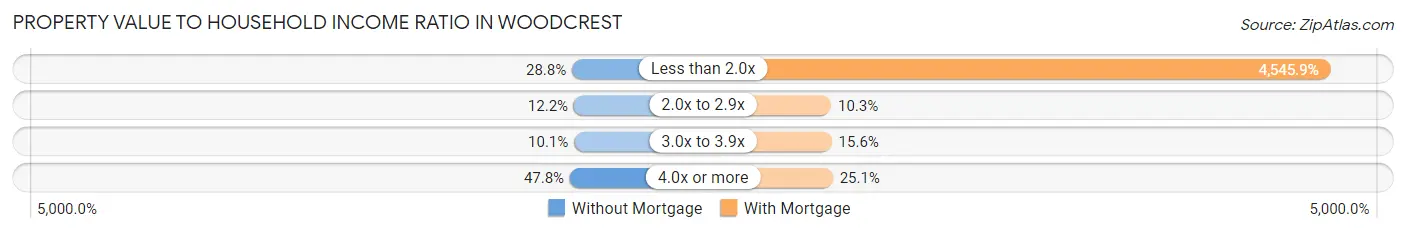
| Value-to-Income Ratio | Without Mortgage | With Mortgage |
| Less than 2.0x | 311 (28.8%) | 142,697 (4,545.9%) |
| 2.0x to 2.9x | 132 (12.2%) | 324 (10.3%) |
| 3.0x to 3.9x | 109 (10.1%) | 490 (15.6%) |
| 4.0x or more | 516 (47.8%) | 788 (25.1%) |
| Total | 1,079 (100.0%) | 3,139 (100.0%) |
Real Estate Taxes by Mortgage Status in Woodcrest
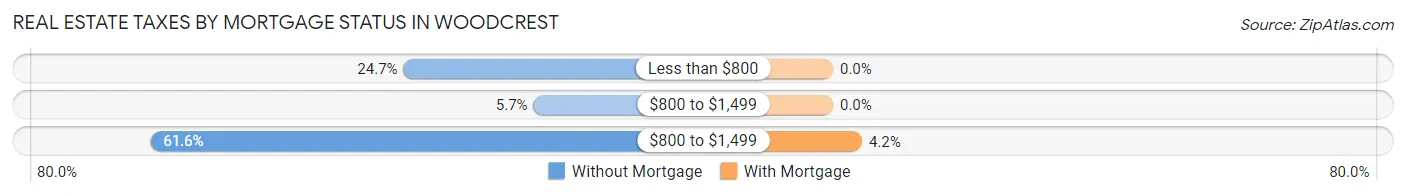
| Property Taxes | Without Mortgage | With Mortgage |
| Less than $800 | 266 (24.6%) | 0 (0.0%) |
| $800 to $1,499 | 61 (5.7%) | 0 (0.0%) |
| $800 to $1,499 | 665 (61.6%) | 133 (4.2%) |
| Total | 1,079 (100.0%) | 3,139 (100.0%) |
Health & Disability in Woodcrest
Health Insurance Coverage by Age in Woodcrest
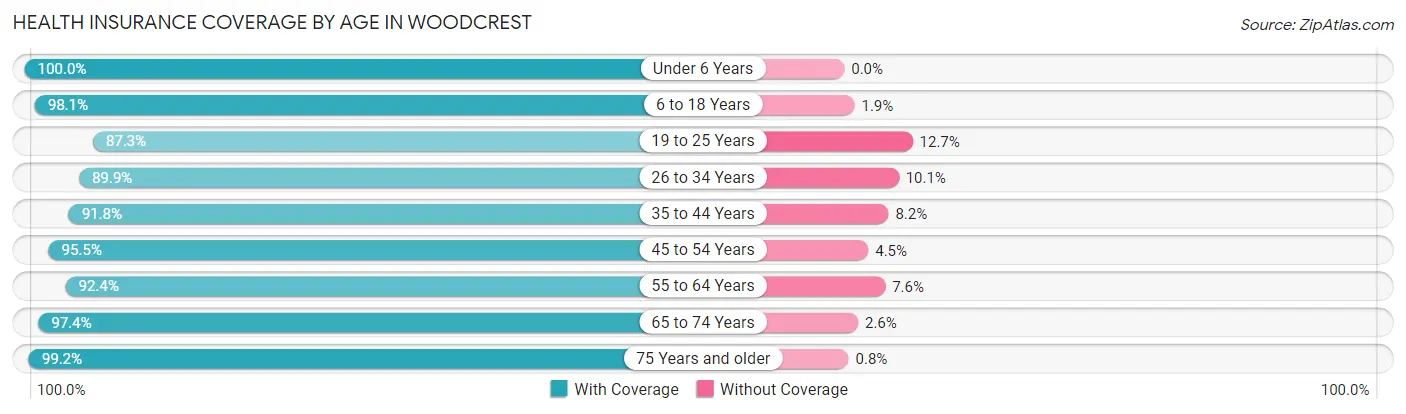
| Age Bracket | With Coverage | Without Coverage |
| Under 6 Years | 1,244 (100.0%) | 0 (0.0%) |
| 6 to 18 Years | 3,022 (98.1%) | 59 (1.9%) |
| 19 to 25 Years | 1,555 (87.3%) | 227 (12.7%) |
| 26 to 34 Years | 1,568 (89.9%) | 177 (10.1%) |
| 35 to 44 Years | 2,059 (91.8%) | 185 (8.2%) |
| 45 to 54 Years | 2,181 (95.5%) | 102 (4.5%) |
| 55 to 64 Years | 1,791 (92.4%) | 148 (7.6%) |
| 65 to 74 Years | 1,558 (97.4%) | 41 (2.6%) |
| 75 Years and older | 1,359 (99.2%) | 11 (0.8%) |
| Total | 16,337 (94.5%) | 950 (5.5%) |
Health Insurance Coverage by Citizenship Status in Woodcrest

| Citizenship Status | With Coverage | Without Coverage |
| Native Born | 1,244 (100.0%) | 0 (0.0%) |
| Foreign Born, Citizen | 3,022 (98.1%) | 59 (1.9%) |
| Foreign Born, not a Citizen | 1,555 (87.3%) | 227 (12.7%) |
Health Insurance Coverage by Household Income in Woodcrest
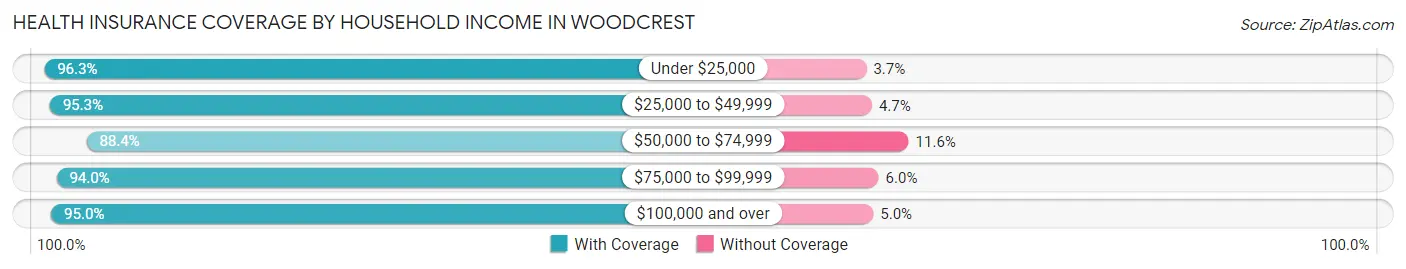
| Household Income | With Coverage | Without Coverage |
| Under $25,000 | 288 (96.3%) | 11 (3.7%) |
| $25,000 to $49,999 | 1,211 (95.3%) | 60 (4.7%) |
| $50,000 to $74,999 | 1,312 (88.4%) | 172 (11.6%) |
| $75,000 to $99,999 | 898 (94.0%) | 57 (6.0%) |
| $100,000 and over | 12,407 (95.0%) | 650 (5.0%) |
Public vs Private Health Insurance Coverage by Age in Woodcrest
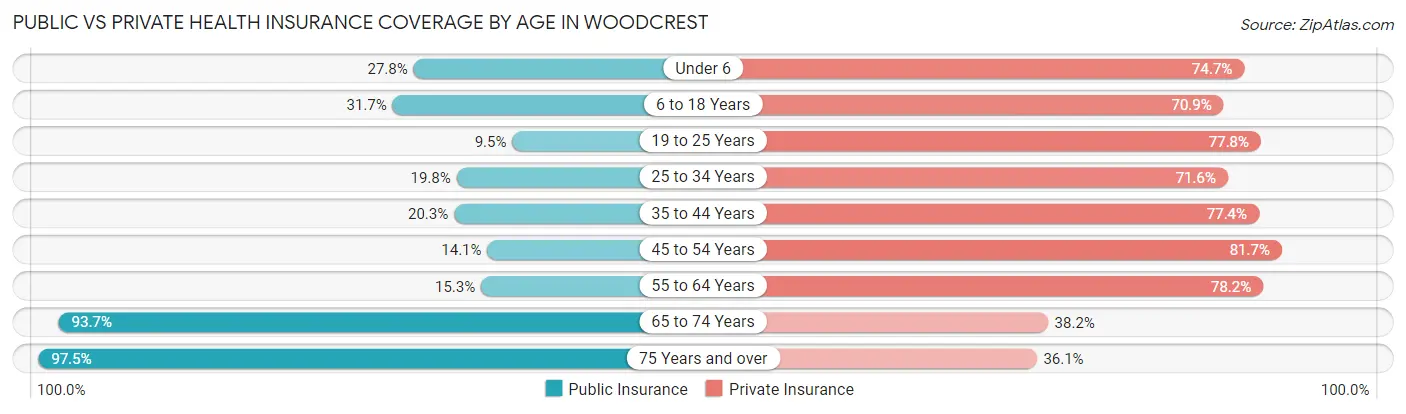
| Age Bracket | Public Insurance | Private Insurance |
| Under 6 | 346 (27.8%) | 929 (74.7%) |
| 6 to 18 Years | 977 (31.7%) | 2,183 (70.9%) |
| 19 to 25 Years | 169 (9.5%) | 1,386 (77.8%) |
| 25 to 34 Years | 346 (19.8%) | 1,250 (71.6%) |
| 35 to 44 Years | 455 (20.3%) | 1,737 (77.4%) |
| 45 to 54 Years | 322 (14.1%) | 1,864 (81.7%) |
| 55 to 64 Years | 296 (15.3%) | 1,516 (78.2%) |
| 65 to 74 Years | 1,498 (93.7%) | 611 (38.2%) |
| 75 Years and over | 1,335 (97.5%) | 495 (36.1%) |
| Total | 5,744 (33.2%) | 11,971 (69.3%) |
Disability Status by Sex by Age in Woodcrest
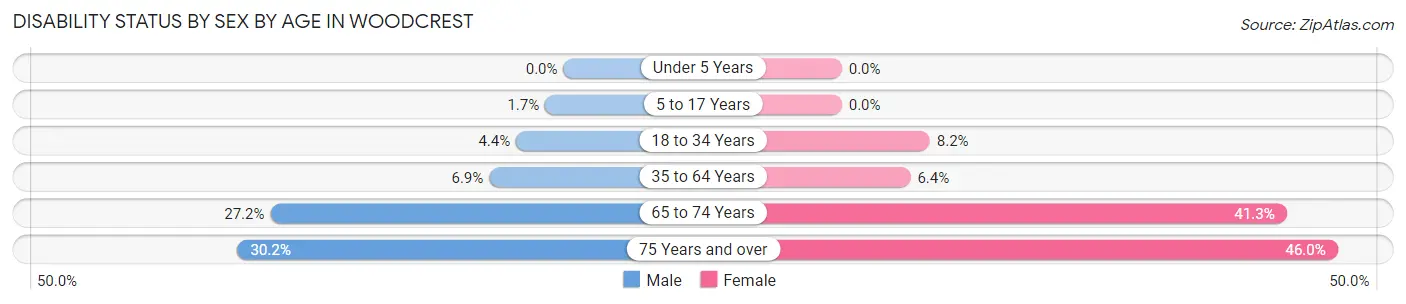
| Age Bracket | Male | Female |
| Under 5 Years | 0 (0.0%) | 0 (0.0%) |
| 5 to 17 Years | 26 (1.7%) | 0 (0.0%) |
| 18 to 34 Years | 86 (4.4%) | 145 (8.2%) |
| 35 to 64 Years | 239 (6.9%) | 191 (6.4%) |
| 65 to 74 Years | 195 (27.2%) | 364 (41.3%) |
| 75 Years and over | 202 (30.2%) | 323 (46.0%) |
Disability Class by Sex by Age in Woodcrest
Disability Class: Hearing Difficulty
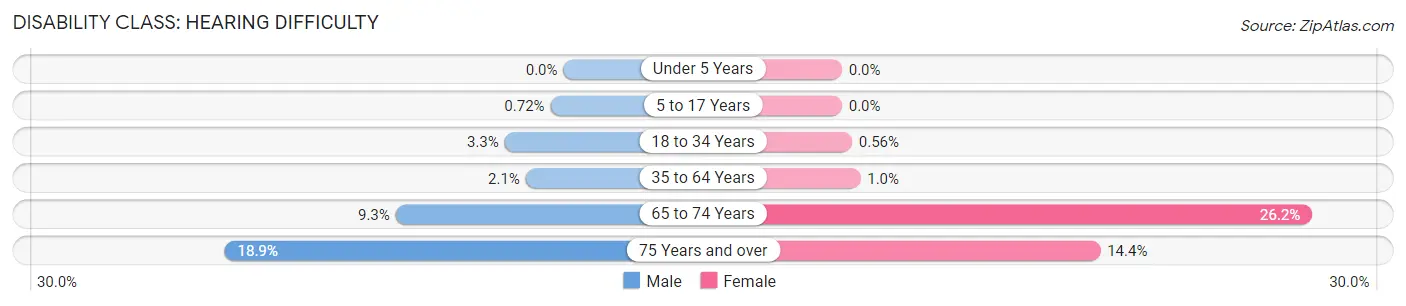
| Age Bracket | Male | Female |
| Under 5 Years | 0 (0.0%) | 0 (0.0%) |
| 5 to 17 Years | 11 (0.7%) | 0 (0.0%) |
| 18 to 34 Years | 64 (3.3%) | 10 (0.6%) |
| 35 to 64 Years | 73 (2.1%) | 31 (1.0%) |
| 65 to 74 Years | 67 (9.3%) | 231 (26.2%) |
| 75 Years and over | 126 (18.9%) | 101 (14.4%) |
Disability Class: Vision Difficulty
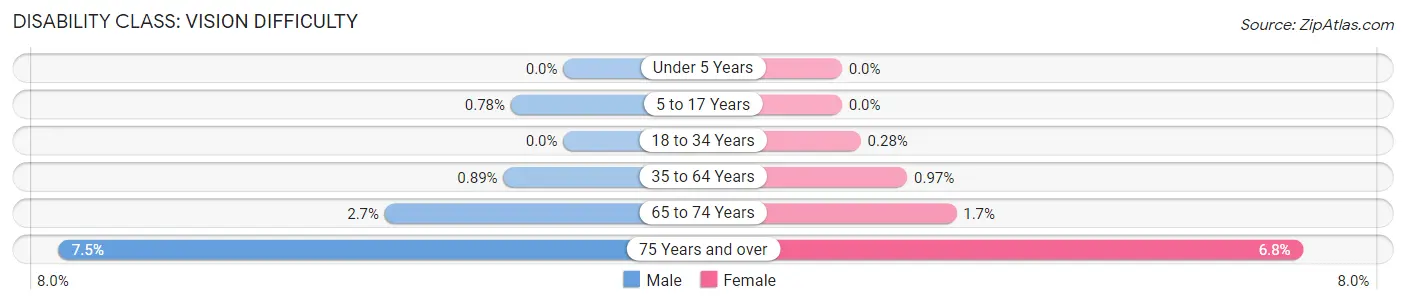
| Age Bracket | Male | Female |
| Under 5 Years | 0 (0.0%) | 0 (0.0%) |
| 5 to 17 Years | 12 (0.8%) | 0 (0.0%) |
| 18 to 34 Years | 0 (0.0%) | 5 (0.3%) |
| 35 to 64 Years | 31 (0.9%) | 29 (1.0%) |
| 65 to 74 Years | 19 (2.6%) | 15 (1.7%) |
| 75 Years and over | 50 (7.5%) | 48 (6.8%) |
Disability Class: Cognitive Difficulty
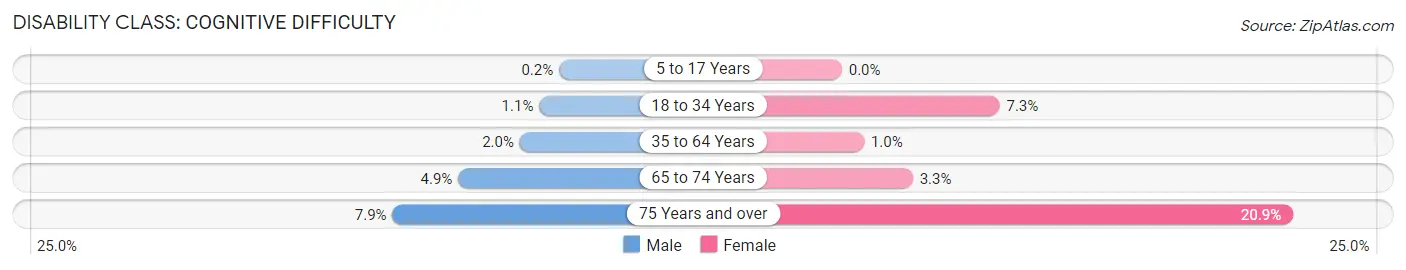
| Age Bracket | Male | Female |
| 5 to 17 Years | 3 (0.2%) | 0 (0.0%) |
| 18 to 34 Years | 22 (1.1%) | 130 (7.3%) |
| 35 to 64 Years | 70 (2.0%) | 31 (1.0%) |
| 65 to 74 Years | 35 (4.9%) | 29 (3.3%) |
| 75 Years and over | 53 (7.9%) | 147 (20.9%) |
Disability Class: Ambulatory Difficulty
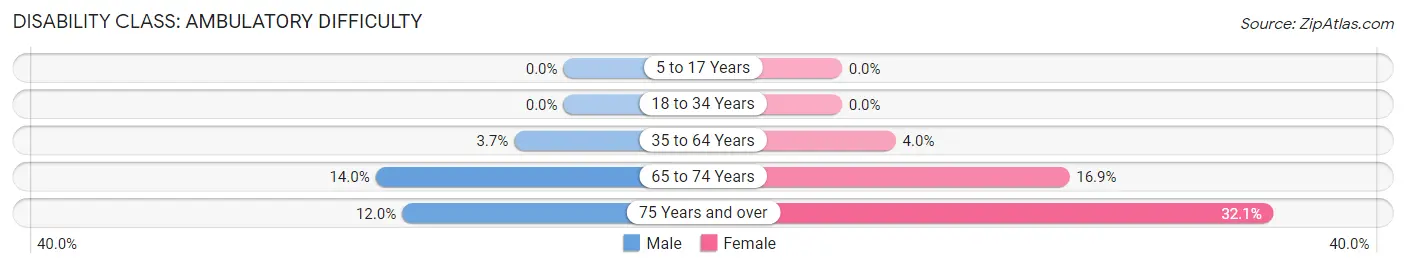
| Age Bracket | Male | Female |
| 5 to 17 Years | 0 (0.0%) | 0 (0.0%) |
| 18 to 34 Years | 0 (0.0%) | 0 (0.0%) |
| 35 to 64 Years | 127 (3.7%) | 120 (4.0%) |
| 65 to 74 Years | 100 (14.0%) | 149 (16.9%) |
| 75 Years and over | 80 (12.0%) | 225 (32.1%) |
Disability Class: Self-Care Difficulty
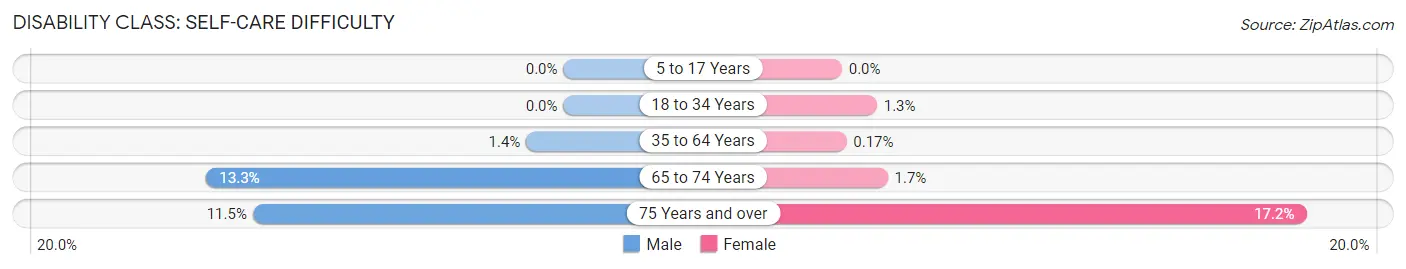
| Age Bracket | Male | Female |
| 5 to 17 Years | 0 (0.0%) | 0 (0.0%) |
| 18 to 34 Years | 0 (0.0%) | 23 (1.3%) |
| 35 to 64 Years | 48 (1.4%) | 5 (0.2%) |
| 65 to 74 Years | 95 (13.3%) | 15 (1.7%) |
| 75 Years and over | 77 (11.5%) | 121 (17.2%) |
Technology Access in Woodcrest
Computing Device Access in Woodcrest
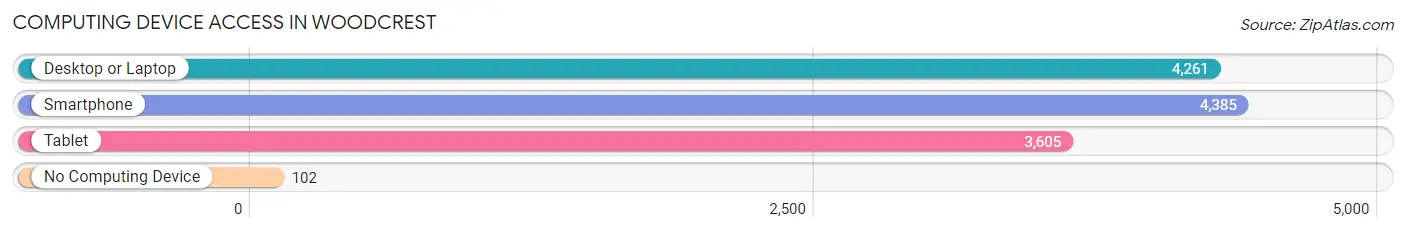
| Device Type | # Households | % Households |
| Desktop or Laptop | 4,261 | 91.3% |
| Smartphone | 4,385 | 93.9% |
| Tablet | 3,605 | 77.2% |
| No Computing Device | 102 | 2.2% |
| Total | 4,669 | 100.0% |
Internet Access in Woodcrest
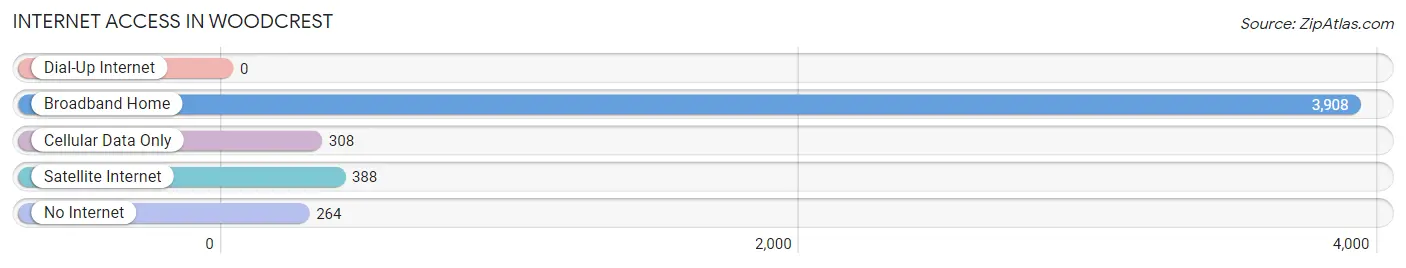
| Internet Type | # Households | % Households |
| Dial-Up Internet | 0 | 0.0% |
| Broadband Home | 3,908 | 83.7% |
| Cellular Data Only | 308 | 6.6% |
| Satellite Internet | 388 | 8.3% |
| No Internet | 264 | 5.7% |
| Total | 4,669 | 100.0% |
Woodcrest Summary
Woodcrest is a census-designated place located in Riverside County, California. It is situated in the foothills of the San Bernardino Mountains, approximately 8 miles east of Riverside. The population was estimated to be 24,813 in 2019.
History
Woodcrest was originally part of the Rancho Jurupa land grant, which was granted to Juan Bandini in 1838. The area was later developed by the Woodcrest Land Company in the late 1800s. The company was founded by William and Mary Wood, who purchased the land from the Bandini family. The Wood family built a large ranch house and planted a variety of fruit trees, including oranges, lemons, and walnuts. The area was known as Woodcrest Ranch until the early 1900s, when the Wood family sold the land to developers.
The area was then subdivided into small farms and residential lots. The first homes were built in the 1920s, and the area was officially incorporated as the City of Woodcrest in 1956. The city was named after the Wood family, who had been the original settlers of the area.
Geography
Woodcrest is located in the foothills of the San Bernardino Mountains, approximately 8 miles east of Riverside. The area is characterized by rolling hills and valleys, with an average elevation of 1,000 feet. The climate is mild, with temperatures ranging from the mid-50s to the mid-90s in the summer.
The area is home to several parks, including the Woodcrest Park, which features a playground, picnic areas, and a walking trail. The area is also home to the Woodcrest Golf Course, which is a popular destination for golfers.
Economy
Woodcrest is home to a variety of businesses, including retail stores, restaurants, and professional services. The area is also home to several industrial parks, which are home to a variety of manufacturing and distribution companies.
The area is also home to several educational institutions, including the University of California, Riverside, Riverside Community College, and California Baptist University.
Demographics
As of the 2019 census, the population of Woodcrest was estimated to be 24,813. The racial makeup of the area was 57.3% White, 22.2% Hispanic or Latino, 11.2% Asian, 8.2% African American, and 1.3% other. The median household income was $77,845, and the median home value was $521,000.
Woodcrest is a diverse community, with a variety of cultures and backgrounds represented. The area is home to a variety of religious institutions, including churches, mosques, and temples. The area is also home to a variety of recreational activities, including hiking, biking, and golfing.
Common Questions
What is the Total Population of Woodcrest?
Total Population of Woodcrest is 17,378.
What is the Total Male Population of Woodcrest?
Total Male Population of Woodcrest is 9,047.
What is the Total Female Population of Woodcrest?
Total Female Population of Woodcrest is 8,331.
What is the Ratio of Males per 100 Females in Woodcrest?
There are 108.59 Males per 100 Females in Woodcrest.
What is the Ratio of Females per 100 Males in Woodcrest?
There are 92.09 Females per 100 Males in Woodcrest.
What is the Median Population Age in Woodcrest?
Median Population Age in Woodcrest is 38.3 Years.
What is the Average Family Size in Woodcrest
Average Family Size in Woodcrest is 3.9 People.
What is the Average Household Size in Woodcrest
Average Household Size in Woodcrest is 3.7 People.
What is Per Capita Income in Woodcrest?
Per Capita income in Woodcrest is $45,911.
What is the Median Family Income in Woodcrest?
Median Family Income in Woodcrest is $141,259.
What is the Median Household income in Woodcrest?
Median Household Income in Woodcrest is $139,115.
What is Income or Wage Gap in Woodcrest?
Income or Wage Gap in Woodcrest is 41.9%.
Women in Woodcrest earn 58.1 cents for every dollar earned by a man.
What is Inequality or Gini Index in Woodcrest?
Inequality or Gini Index in Woodcrest is 0.39.
How Large is the Labor Force in Woodcrest?
There are 8,593 People in the Labor Forcein in Woodcrest.
What is the Percentage of People in the Labor Force in Woodcrest?
62.1% of People are in the Labor Force in Woodcrest.
What is the Unemployment Rate in Woodcrest?
Unemployment Rate in Woodcrest is 4.1%.