Vandenberg AFB, CA
Vandenberg AFB Map
Vandenberg AFB Overview
3,681
TOTAL POPULATION
1,915
MALE POPULATION
1,766
FEMALE POPULATION
108.44
MALES / 100 FEMALES
92.22
FEMALES / 100 MALES
24.4
MEDIAN AGE
3.0
AVG FAMILY SIZE
2.8
AVG HOUSEHOLD SIZE
$28,326
PER CAPITA INCOME
$69,847
AVG FAMILY INCOME
$69,031
AVG HOUSEHOLD INCOME
48.7%
WAGE / INCOME GAP [ % ]
51.3¢/ $1
WAGE / INCOME GAP [ $ ]
$11,113
FAMILY INCOME DEFICIT
0.30
INEQUALITY / GINI INDEX
2,096
LABOR FORCE [ PEOPLE ]
80.0%
PERCENT IN LABOR FORCE
11.4%
UNEMPLOYMENT RATE
Vandenberg AFB Area Codes
Race in Vandenberg AFB
The most populous races in Vandenberg AFB are White / Caucasian (2,339 | 63.5%), Black / African American (558 | 15.2%), and Hispanic or Latino (539 | 14.6%).
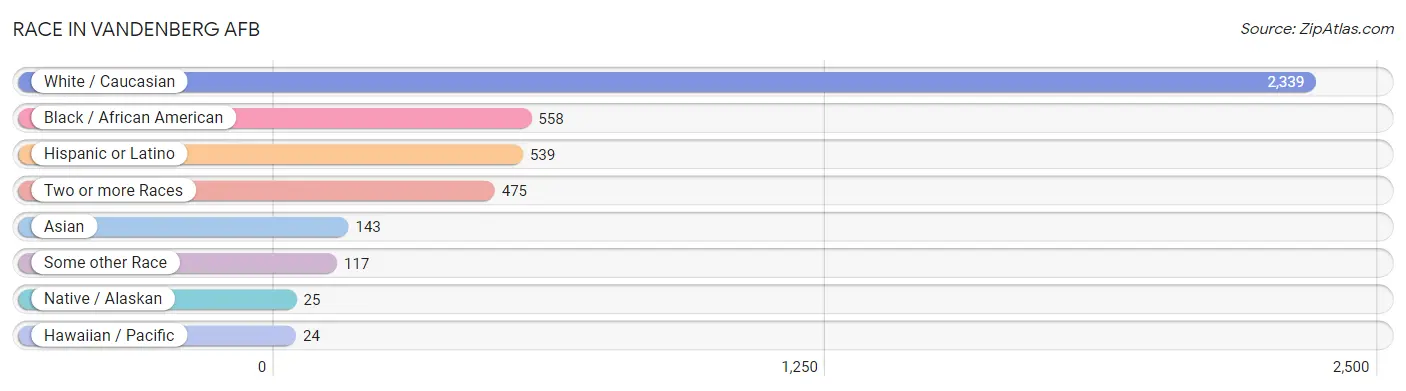
| Race | # Population | % Population |
| Asian | 143 | 3.9% |
| Black / African American | 558 | 15.2% |
| Hawaiian / Pacific | 24 | 0.6% |
| Hispanic or Latino | 539 | 14.6% |
| Native / Alaskan | 25 | 0.7% |
| White / Caucasian | 2,339 | 63.5% |
| Two or more Races | 475 | 12.9% |
| Some other Race | 117 | 3.2% |
| Total | 3,681 | 100.0% |
Ancestry in Vandenberg AFB
The most populous ancestries reported in Vandenberg AFB are Mexican (429 | 11.7%), German (303 | 8.2%), Irish (266 | 7.2%), English (239 | 6.5%), and European (208 | 5.7%), together accounting for 39.3% of all Vandenberg AFB residents.
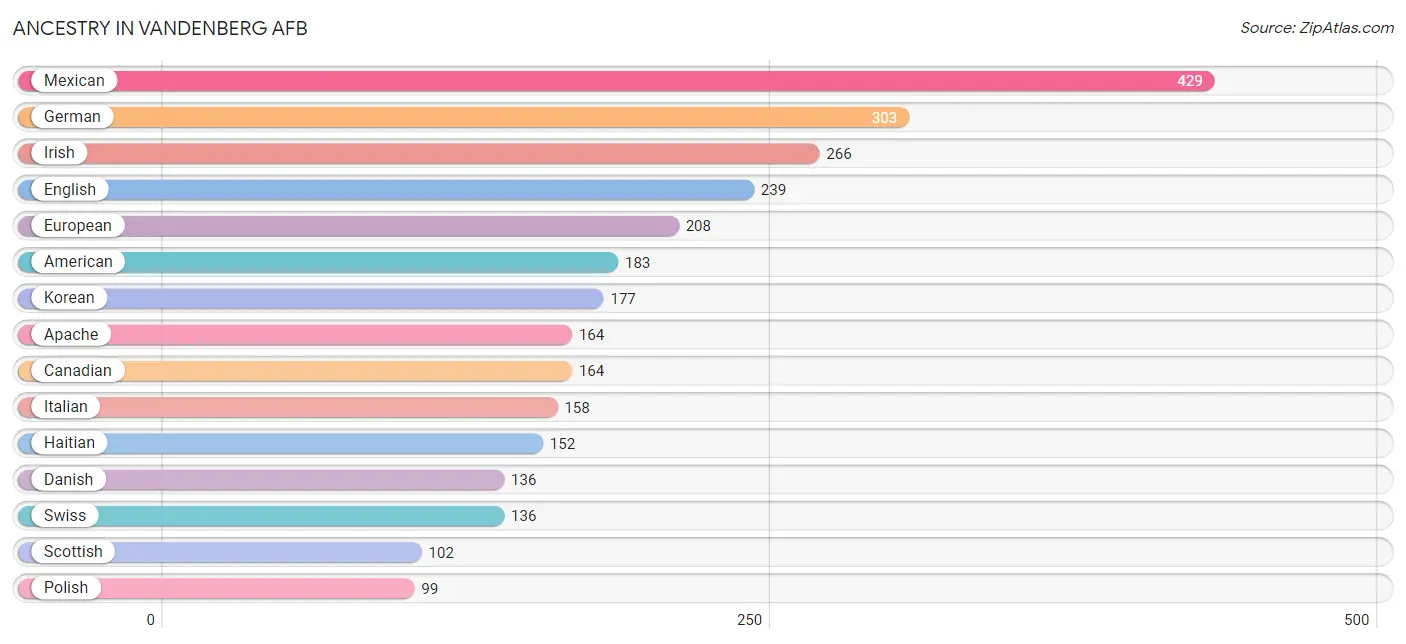
| Ancestry | # Population | % Population |
| African | 46 | 1.3% |
| American | 183 | 5.0% |
| Apache | 164 | 4.5% |
| Arapaho | 15 | 0.4% |
| Austrian | 25 | 0.7% |
| Bhutanese | 35 | 0.9% |
| British | 35 | 0.9% |
| Burmese | 35 | 0.9% |
| Canadian | 164 | 4.5% |
| Central American | 39 | 1.1% |
| Crow | 10 | 0.3% |
| Cuban | 5 | 0.1% |
| Czech | 11 | 0.3% |
| Danish | 136 | 3.7% |
| Dominican | 4 | 0.1% |
| Dutch | 15 | 0.4% |
| English | 239 | 6.5% |
| Ethiopian | 1 | 0.0% |
| European | 208 | 5.7% |
| Finnish | 14 | 0.4% |
| French | 81 | 2.2% |
| French Canadian | 5 | 0.1% |
| German | 303 | 8.2% |
| Guamanian / Chamorro | 9 | 0.2% |
| Haitian | 152 | 4.1% |
| Indian (Asian) | 5 | 0.1% |
| Irish | 266 | 7.2% |
| Italian | 158 | 4.3% |
| Jamaican | 5 | 0.1% |
| Korean | 177 | 4.8% |
| Mexican | 429 | 11.7% |
| Native Hawaiian | 16 | 0.4% |
| Nicaraguan | 7 | 0.2% |
| Norwegian | 22 | 0.6% |
| Panamanian | 9 | 0.2% |
| Polish | 99 | 2.7% |
| Puerto Rican | 35 | 0.9% |
| Russian | 27 | 0.7% |
| Salvadoran | 23 | 0.6% |
| Scandinavian | 71 | 1.9% |
| Scotch-Irish | 16 | 0.4% |
| Scottish | 102 | 2.8% |
| Slovene | 7 | 0.2% |
| South American | 20 | 0.5% |
| Spaniard | 7 | 0.2% |
| Subsaharan African | 47 | 1.3% |
| Swedish | 96 | 2.6% |
| Swiss | 136 | 3.7% |
| Thai | 34 | 0.9% |
| Ukrainian | 47 | 1.3% |
| Venezuelan | 20 | 0.5% |
| Welsh | 4 | 0.1% | View All 52 Rows |
Immigrants in Vandenberg AFB
The most numerous immigrant groups reported in Vandenberg AFB came from Asia (64 | 1.7%), Eastern Asia (35 | 0.9%), Korea (33 | 0.9%), Latin America (29 | 0.8%), and Philippines (29 | 0.8%), together accounting for 5.2% of all Vandenberg AFB residents.
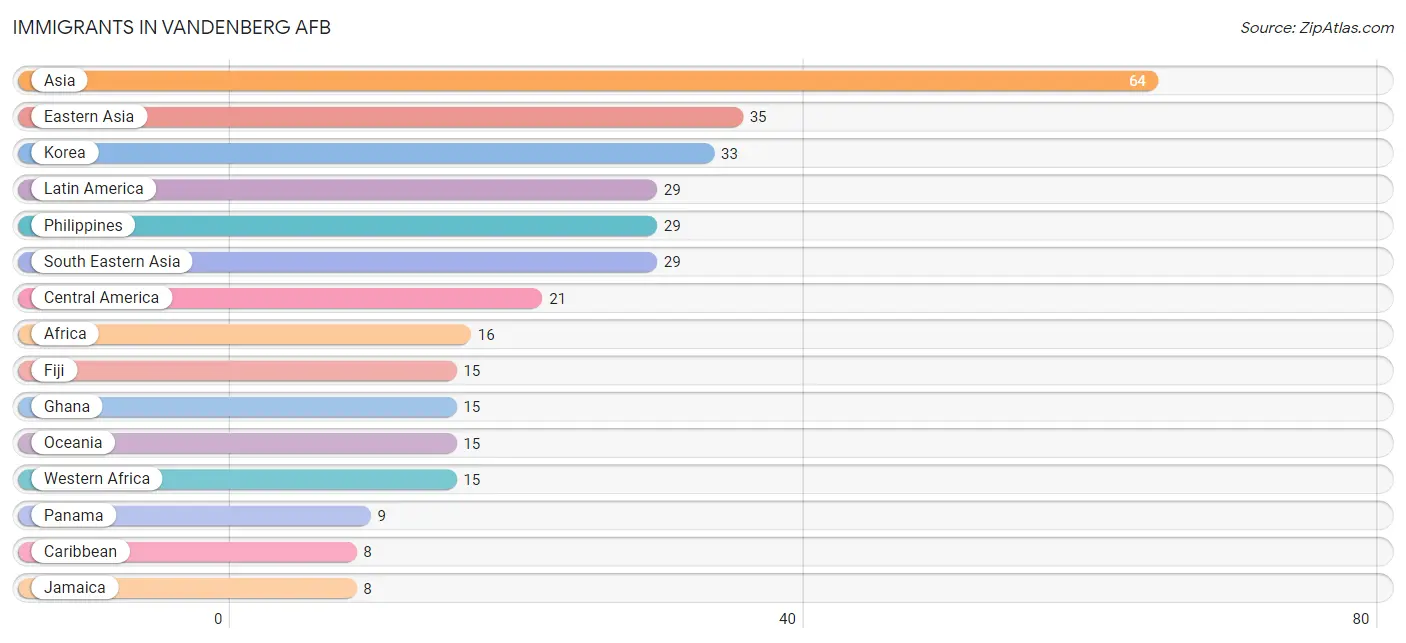
| Immigration Origin | # Population | % Population |
| Africa | 16 | 0.4% |
| Asia | 64 | 1.7% |
| Caribbean | 8 | 0.2% |
| Central America | 21 | 0.6% |
| Eastern Africa | 1 | 0.0% |
| Eastern Asia | 35 | 0.9% |
| Eastern Europe | 5 | 0.1% |
| El Salvador | 5 | 0.1% |
| Ethiopia | 1 | 0.0% |
| Europe | 5 | 0.1% |
| Fiji | 15 | 0.4% |
| Ghana | 15 | 0.4% |
| Jamaica | 8 | 0.2% |
| Japan | 2 | 0.1% |
| Korea | 33 | 0.9% |
| Latin America | 29 | 0.8% |
| Nicaragua | 7 | 0.2% |
| Oceania | 15 | 0.4% |
| Panama | 9 | 0.2% |
| Philippines | 29 | 0.8% |
| South Eastern Asia | 29 | 0.8% |
| Ukraine | 5 | 0.1% |
| Western Africa | 15 | 0.4% | View All 23 Rows |
Sex and Age in Vandenberg AFB
Sex and Age in Vandenberg AFB
The most populous age groups in Vandenberg AFB are 20 to 24 Years (417 | 21.8%) for men and 25 to 29 Years (375 | 21.2%) for women.
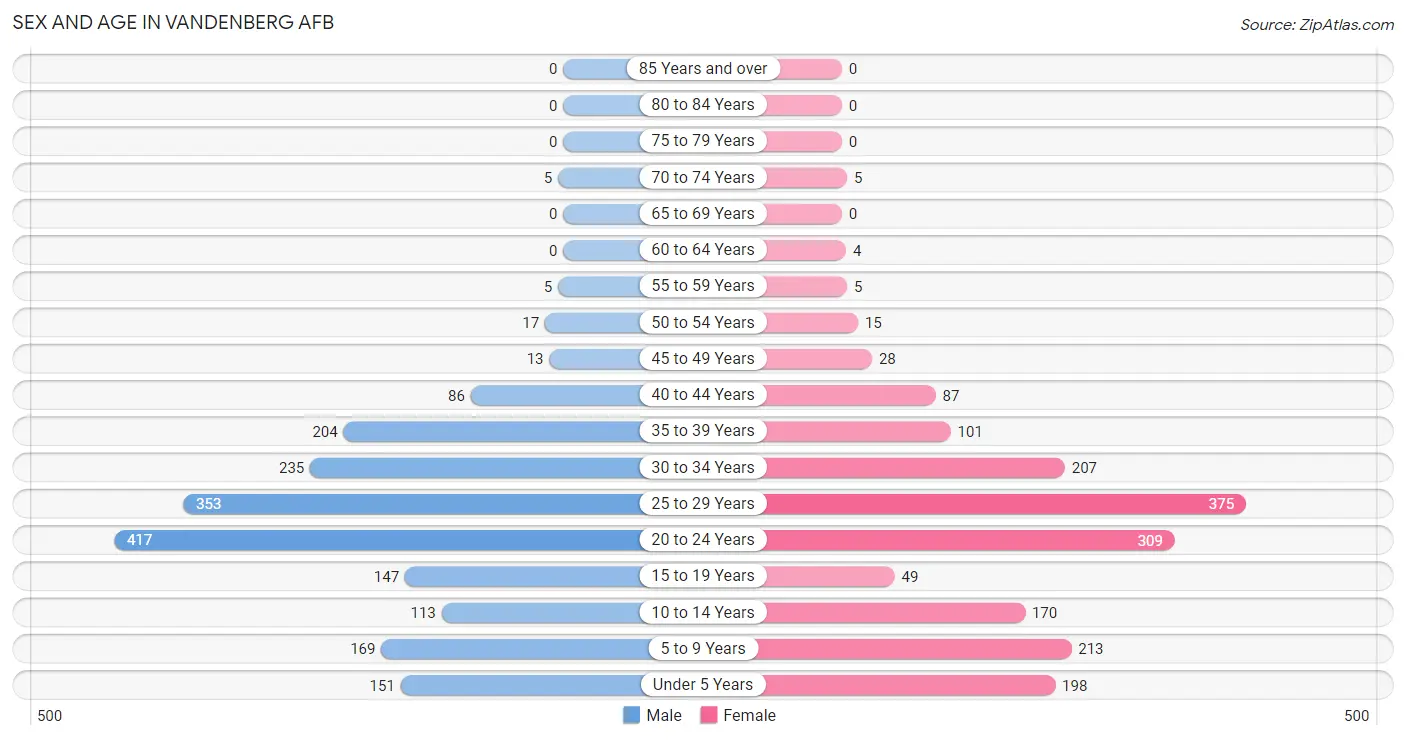
| Age Bracket | Male | Female |
| Under 5 Years | 151 (7.9%) | 198 (11.2%) |
| 5 to 9 Years | 169 (8.8%) | 213 (12.1%) |
| 10 to 14 Years | 113 (5.9%) | 170 (9.6%) |
| 15 to 19 Years | 147 (7.7%) | 49 (2.8%) |
| 20 to 24 Years | 417 (21.8%) | 309 (17.5%) |
| 25 to 29 Years | 353 (18.4%) | 375 (21.2%) |
| 30 to 34 Years | 235 (12.3%) | 207 (11.7%) |
| 35 to 39 Years | 204 (10.6%) | 101 (5.7%) |
| 40 to 44 Years | 86 (4.5%) | 87 (4.9%) |
| 45 to 49 Years | 13 (0.7%) | 28 (1.6%) |
| 50 to 54 Years | 17 (0.9%) | 15 (0.9%) |
| 55 to 59 Years | 5 (0.3%) | 5 (0.3%) |
| 60 to 64 Years | 0 (0.0%) | 4 (0.2%) |
| 65 to 69 Years | 0 (0.0%) | 0 (0.0%) |
| 70 to 74 Years | 5 (0.3%) | 5 (0.3%) |
| 75 to 79 Years | 0 (0.0%) | 0 (0.0%) |
| 80 to 84 Years | 0 (0.0%) | 0 (0.0%) |
| 85 Years and over | 0 (0.0%) | 0 (0.0%) |
| Total | 1,915 (100.0%) | 1,766 (100.0%) |
Families and Households in Vandenberg AFB
Median Family Size in Vandenberg AFB
The median family size in Vandenberg AFB is 3.04 persons per family, with married-couple families (916 | 91.4%) accounting for the largest median family size of 3.07 persons per family. On the other hand, single male/father families (43 | 4.3%) represent the smallest median family size with 2.58 persons per family.
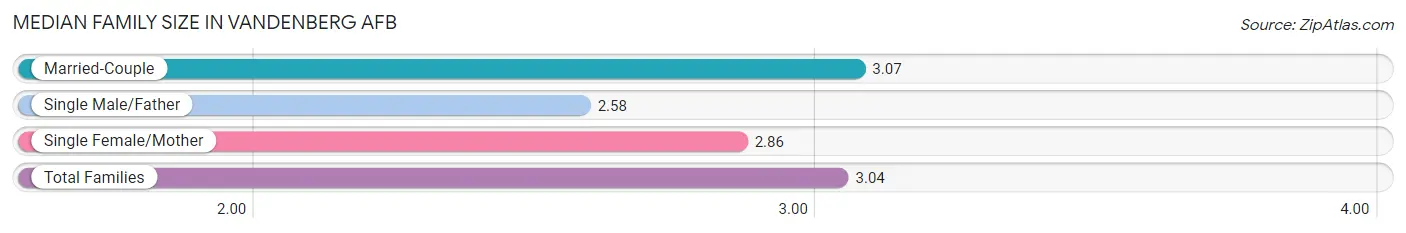
| Family Type | # Families | Family Size |
| Married-Couple | 916 (91.4%) | 3.07 |
| Single Male/Father | 43 (4.3%) | 2.58 |
| Single Female/Mother | 43 (4.3%) | 2.86 |
| Total Families | 1,002 (100.0%) | 3.04 |
Median Household Size in Vandenberg AFB
The median household size in Vandenberg AFB is 2.77 persons per household, with single female/mother households (43 | 3.6%) accounting for the largest median household size of 3.12 persons per household. non-family households (188 | 15.8%) represent the smallest median household size with 1.29 persons per household.
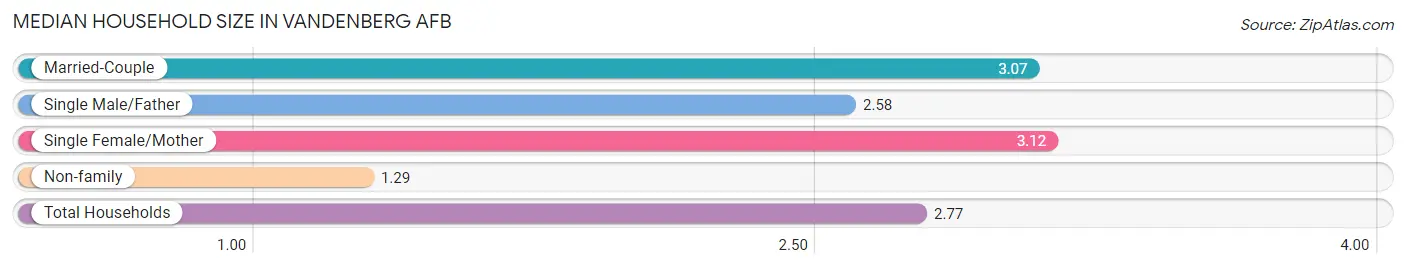
| Household Type | # Households | Household Size |
| Married-Couple | 916 (77.0%) | 3.07 |
| Single Male/Father | 43 (3.6%) | 2.58 |
| Single Female/Mother | 43 (3.6%) | 3.12 |
| Non-family | 188 (15.8%) | 1.29 |
| Total Households | 1,190 (100.0%) | 2.77 |
Household Size by Marriage Status in Vandenberg AFB
Out of a total of 1,190 households in Vandenberg AFB, 1,002 (84.2%) are family households, while 188 (15.8%) are nonfamily households. The most numerous type of family households are 2-person households, comprising 354, and the most common type of nonfamily households are 1-person households, comprising 152.
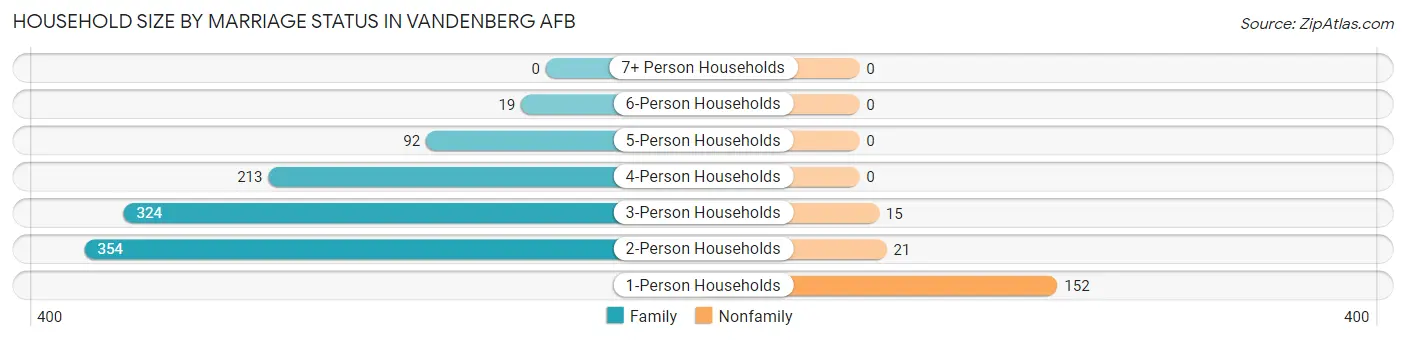
| Household Size | Family Households | Nonfamily Households |
| 1-Person Households | - | 152 (12.8%) |
| 2-Person Households | 354 (29.7%) | 21 (1.8%) |
| 3-Person Households | 324 (27.2%) | 15 (1.3%) |
| 4-Person Households | 213 (17.9%) | 0 (0.0%) |
| 5-Person Households | 92 (7.7%) | 0 (0.0%) |
| 6-Person Households | 19 (1.6%) | 0 (0.0%) |
| 7+ Person Households | 0 (0.0%) | 0 (0.0%) |
| Total | 1,002 (84.2%) | 188 (15.8%) |
Female Fertility in Vandenberg AFB
Fertility by Age in Vandenberg AFB
Average fertility rate in Vandenberg AFB is 52.0 births per 1,000 women. Women in the age bracket of 20 to 34 years have the highest fertility rate with 67.0 births per 1,000 women. Women in the age bracket of 20 to 34 years acount for 100.0% of all women with births.
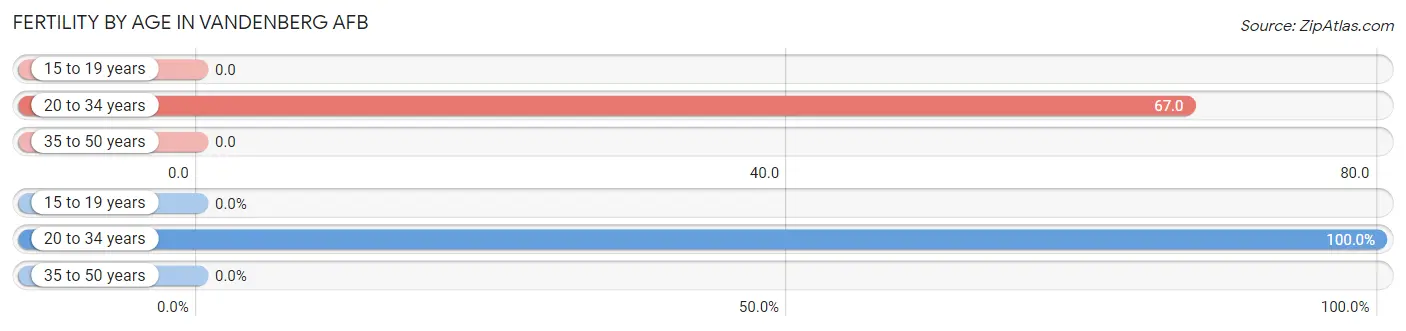
| Age Bracket | Women with Births | Births / 1,000 Women |
| 15 to 19 years | 0 (0.0%) | 0.0 |
| 20 to 34 years | 60 (100.0%) | 67.0 |
| 35 to 50 years | 0 (0.0%) | 0.0 |
| Total | 60 (100.0%) | 52.0 |
Fertility by Age by Marriage Status in Vandenberg AFB
83.3% of women with births (60) in Vandenberg AFB are married. The highest percentage of unmarried women with births falls into 20 to 34 years age bracket with 16.7% of them unmarried at the time of birth, while the lowest percentage of unmarried women with births belong to 20 to 34 years age bracket with 16.7% of them unmarried.
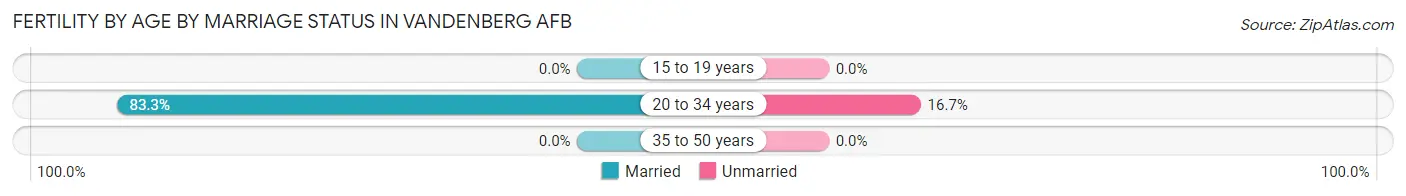
| Age Bracket | Married | Unmarried |
| 15 to 19 years | 0 (0.0%) | 0 (0.0%) |
| 20 to 34 years | 50 (83.3%) | 10 (16.7%) |
| 35 to 50 years | 0 (0.0%) | 0 (0.0%) |
| Total | 50 (83.3%) | 10 (16.7%) |
Fertility by Education in Vandenberg AFB
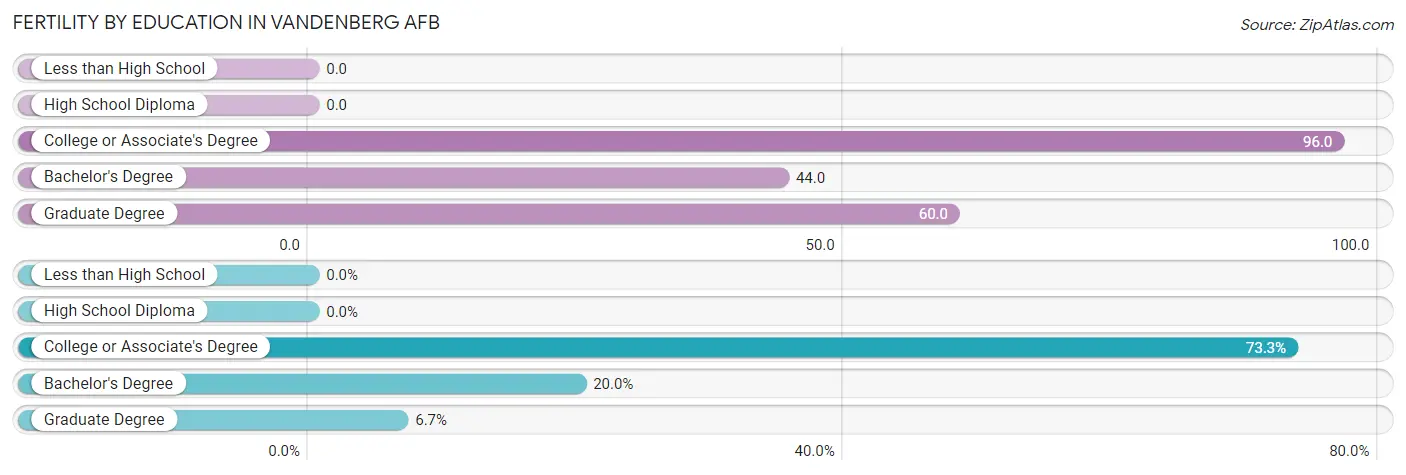
| Educational Attainment | Women with Births | Births / 1,000 Women |
| Less than High School | 0 (0.0%) | 0.0 |
| High School Diploma | 0 (0.0%) | 0.0 |
| College or Associate's Degree | 44 (73.3%) | 96.0 |
| Bachelor's Degree | 12 (20.0%) | 44.0 |
| Graduate Degree | 4 (6.7%) | 60.0 |
| Total | 60 (100.0%) | 52.0 |
Fertility by Education by Marriage Status in Vandenberg AFB
16.7% of women with births in Vandenberg AFB are unmarried. Women with the educational attainment of bachelor's degree are most likely to be married with 100.0% of them married at childbirth, while women with the educational attainment of college or associate's degree are least likely to be married with 22.7% of them unmarried at childbirth.
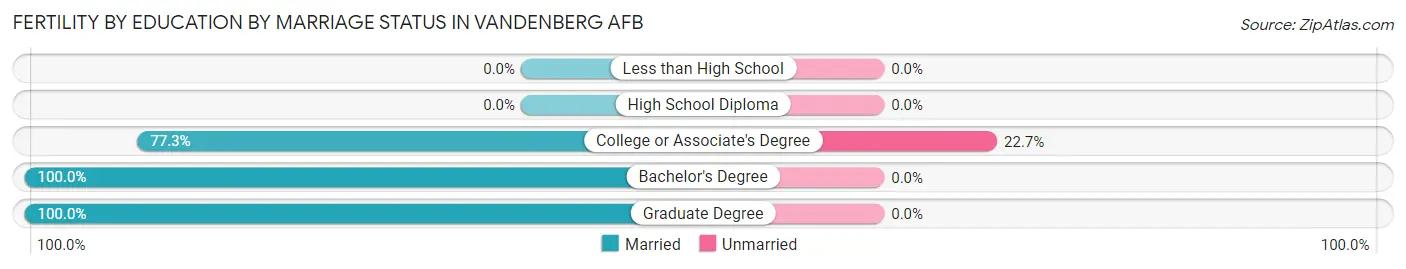
| Educational Attainment | Married | Unmarried |
| Less than High School | 0 (0.0%) | 0 (0.0%) |
| High School Diploma | 0 (0.0%) | 0 (0.0%) |
| College or Associate's Degree | 34 (77.3%) | 10 (22.7%) |
| Bachelor's Degree | 12 (100.0%) | 0 (0.0%) |
| Graduate Degree | 4 (100.0%) | 0 (0.0%) |
| Total | 50 (83.3%) | 10 (16.7%) |
Income in Vandenberg AFB
Income Overview in Vandenberg AFB
Per Capita Income in Vandenberg AFB is $28,326, while median incomes of families and households are $69,847 and $69,031 respectively.
| Characteristic | Number | Measure |
| Per Capita Income | 3,681 | $28,326 |
| Median Family Income | 1,002 | $69,847 |
| Mean Family Income | 1,002 | $80,885 |
| Median Household Income | 1,190 | $69,031 |
| Mean Household Income | 1,190 | $79,028 |
| Income Deficit | 1,002 | $11,113 |
| Wage / Income Gap (%) | 3,681 | 48.66% |
| Wage / Income Gap ($) | 3,681 | 51.34¢ per $1 |
| Gini / Inequality Index | 3,681 | 0.30 |
Earnings by Sex in Vandenberg AFB
Average Earnings in Vandenberg AFB are $41,985, $46,208 for men and $23,723 for women, a difference of 48.7%.
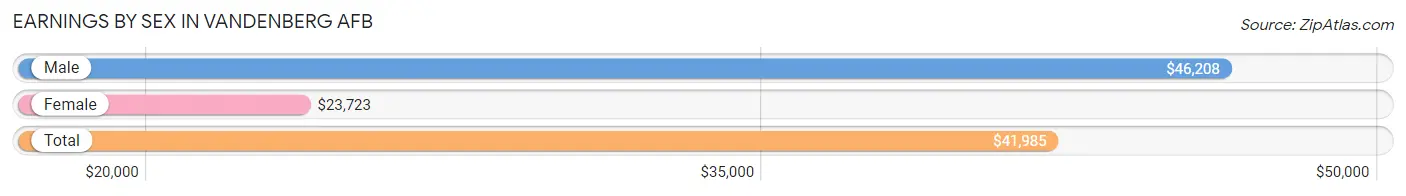
| Sex | Number | Average Earnings |
| Male | 1,436 (67.6%) | $46,208 |
| Female | 687 (32.4%) | $23,723 |
| Total | 2,123 (100.0%) | $41,985 |
Earnings by Sex by Income Bracket in Vandenberg AFB
The most common earnings brackets in Vandenberg AFB are $25,000 to $29,999 for men (224 | 15.6%) and $20,000 to $22,499 for women (73 | 10.6%).
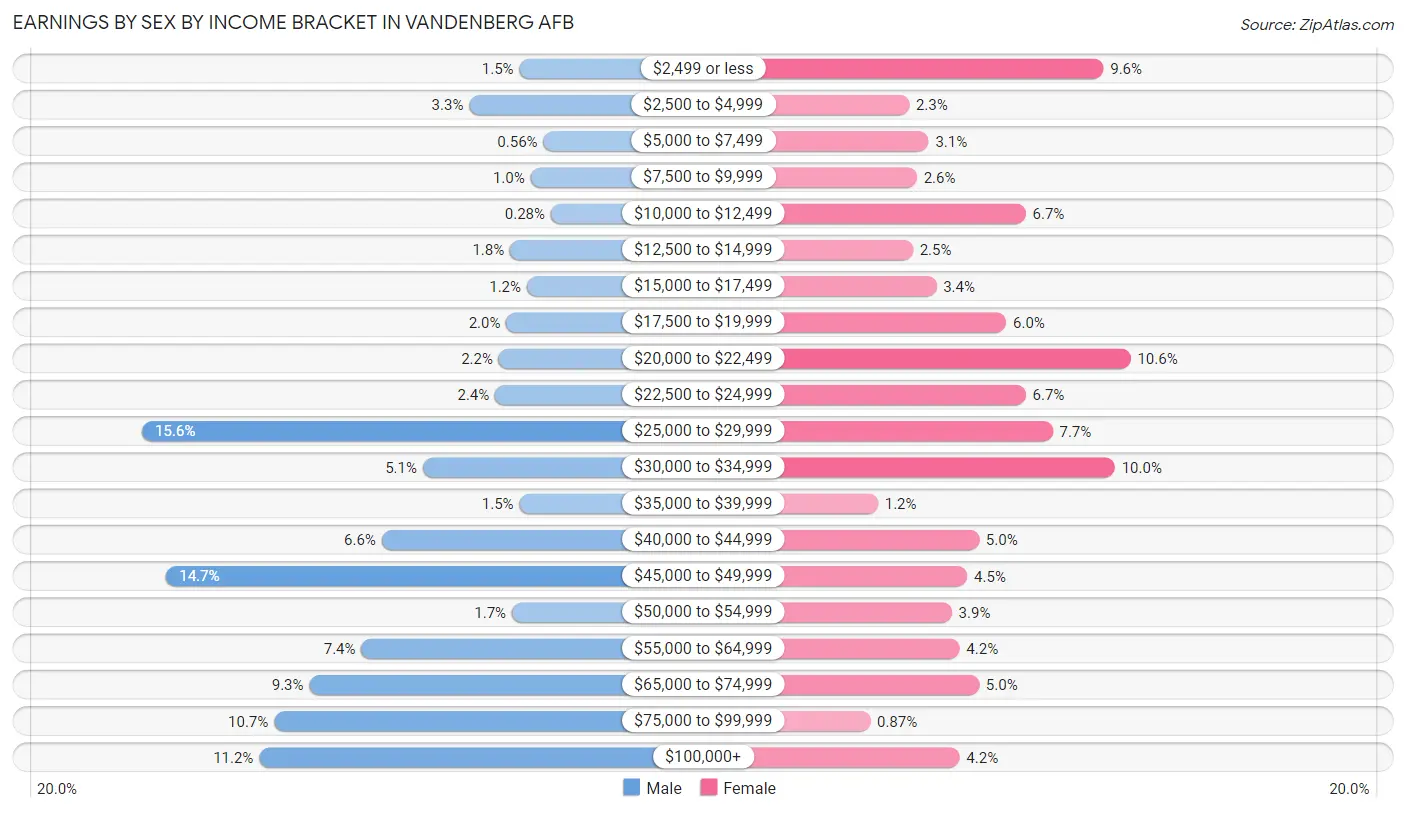
| Income | Male | Female |
| $2,499 or less | 21 (1.5%) | 66 (9.6%) |
| $2,500 to $4,999 | 48 (3.3%) | 16 (2.3%) |
| $5,000 to $7,499 | 8 (0.6%) | 21 (3.1%) |
| $7,500 to $9,999 | 15 (1.0%) | 18 (2.6%) |
| $10,000 to $12,499 | 4 (0.3%) | 46 (6.7%) |
| $12,500 to $14,999 | 26 (1.8%) | 17 (2.5%) |
| $15,000 to $17,499 | 17 (1.2%) | 23 (3.4%) |
| $17,500 to $19,999 | 28 (1.9%) | 41 (6.0%) |
| $20,000 to $22,499 | 32 (2.2%) | 73 (10.6%) |
| $22,500 to $24,999 | 34 (2.4%) | 46 (6.7%) |
| $25,000 to $29,999 | 224 (15.6%) | 53 (7.7%) |
| $30,000 to $34,999 | 73 (5.1%) | 69 (10.0%) |
| $35,000 to $39,999 | 21 (1.5%) | 8 (1.2%) |
| $40,000 to $44,999 | 95 (6.6%) | 34 (5.0%) |
| $45,000 to $49,999 | 211 (14.7%) | 31 (4.5%) |
| $50,000 to $54,999 | 25 (1.7%) | 27 (3.9%) |
| $55,000 to $64,999 | 106 (7.4%) | 29 (4.2%) |
| $65,000 to $74,999 | 134 (9.3%) | 34 (5.0%) |
| $75,000 to $99,999 | 153 (10.6%) | 6 (0.9%) |
| $100,000+ | 161 (11.2%) | 29 (4.2%) |
| Total | 1,436 (100.0%) | 687 (100.0%) |
Earnings by Sex by Educational Attainment in Vandenberg AFB
Average earnings in Vandenberg AFB are $59,068 for men and $32,148 for women, a difference of 45.6%. Men with an educational attainment of graduate degree enjoy the highest average annual earnings of $86,842, while those with college or associate's degree education earn the least with $49,611. Women with an educational attainment of college or associate's degree earn the most with the average annual earnings of $41,827, while those with graduate degree education have the smallest earnings of $28,250.
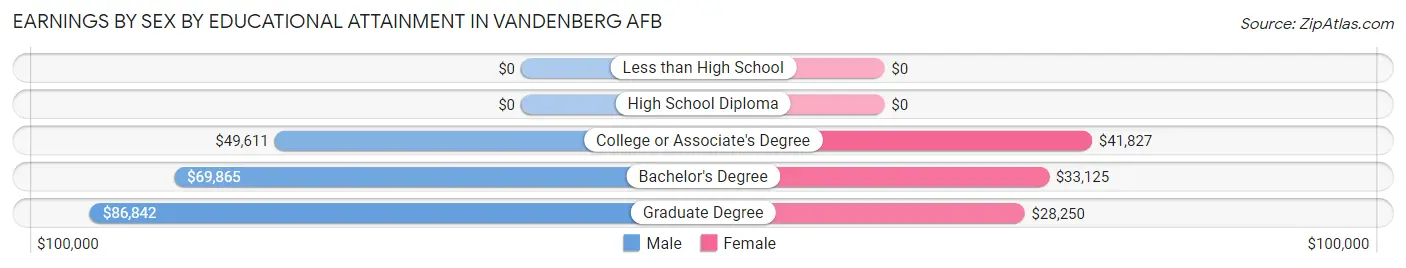
| Educational Attainment | Male Income | Female Income |
| Less than High School | - | - |
| High School Diploma | - | - |
| College or Associate's Degree | $49,611 | $41,827 |
| Bachelor's Degree | $69,865 | $33,125 |
| Graduate Degree | $86,842 | $28,250 |
| Total | $59,068 | $32,148 |
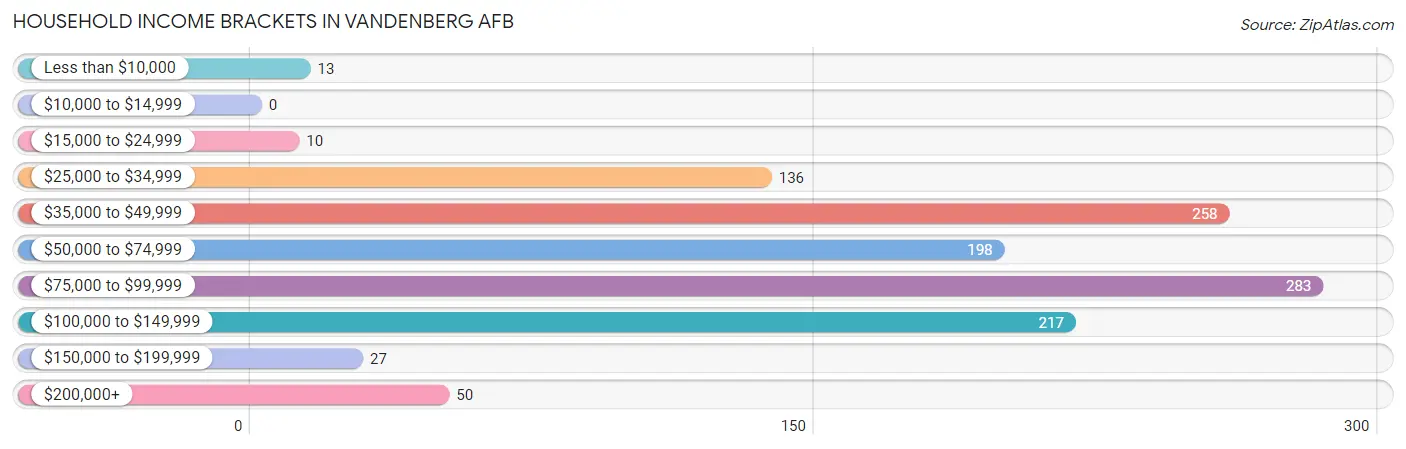
Family Income in Vandenberg AFB
Family Income Brackets in Vandenberg AFB
According to the Vandenberg AFB family income data, there are 235 families falling into the $75,000 to $99,999 income range, which is the most common income bracket and makes up 23.4% of all families.
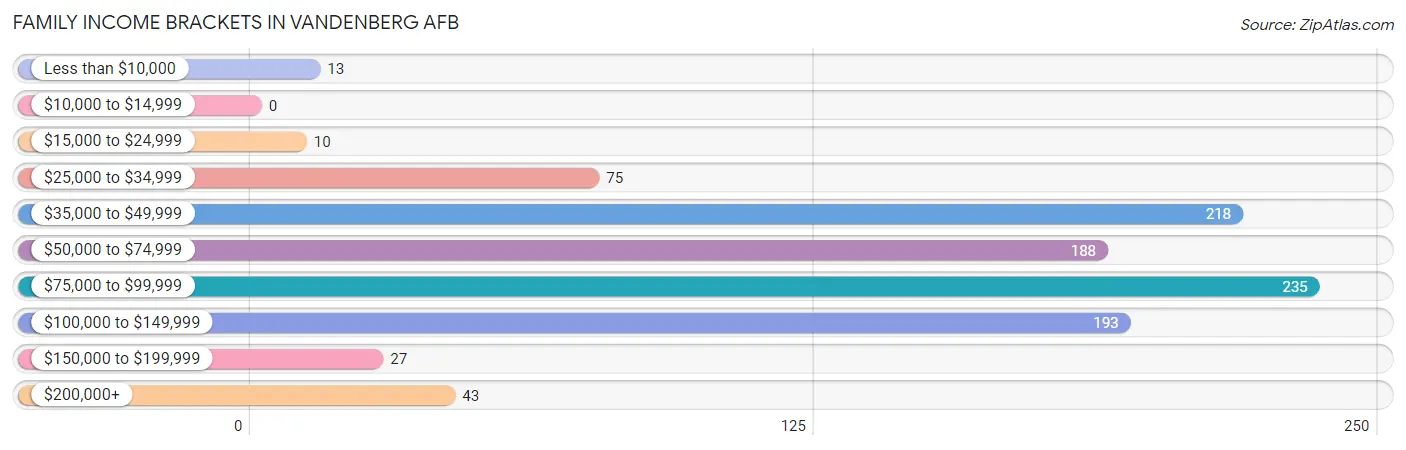
| Income Bracket | # Families | % Families |
| Less than $10,000 | 13 | 1.3% |
| $10,000 to $14,999 | 0 | 0.0% |
| $15,000 to $24,999 | 10 | 1.0% |
| $25,000 to $34,999 | 75 | 7.5% |
| $35,000 to $49,999 | 218 | 21.8% |
| $50,000 to $74,999 | 188 | 18.8% |
| $75,000 to $99,999 | 235 | 23.5% |
| $100,000 to $149,999 | 193 | 19.3% |
| $150,000 to $199,999 | 27 | 2.7% |
| $200,000+ | 43 | 4.3% |
Family Income by Famaliy Size in Vandenberg AFB
6-person families (19 | 1.9%) account for the highest median family income in Vandenberg AFB with $105,673 per family, while 2-person families (364 | 36.3%) have the highest median income of $32,154 per family member.
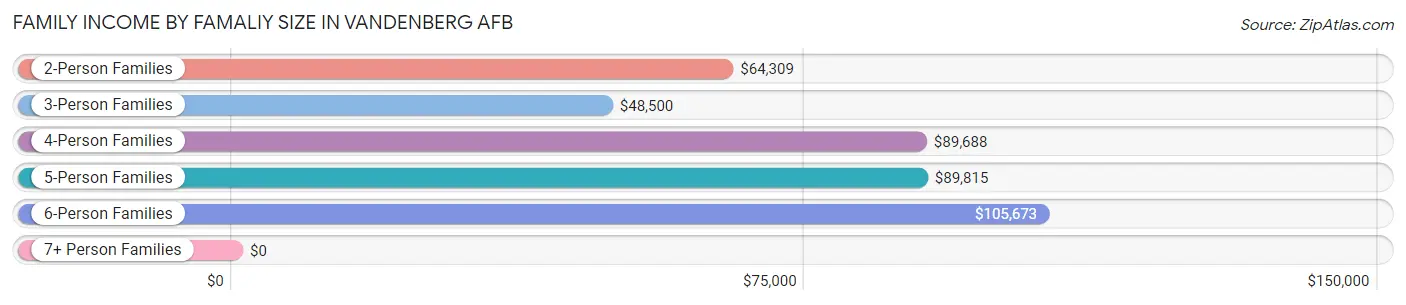
| Income Bracket | # Families | Median Income |
| 2-Person Families | 364 (36.3%) | $64,309 |
| 3-Person Families | 314 (31.3%) | $48,500 |
| 4-Person Families | 213 (21.3%) | $89,688 |
| 5-Person Families | 92 (9.2%) | $89,815 |
| 6-Person Families | 19 (1.9%) | $105,673 |
| 7+ Person Families | 0 (0.0%) | $0 |
| Total | 1,002 (100.0%) | $69,847 |
Family Income by Number of Earners in Vandenberg AFB
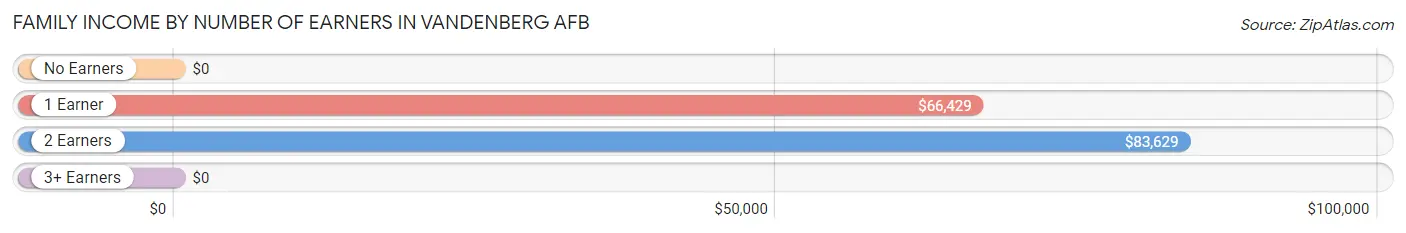
| Number of Earners | # Families | Median Income |
| No Earners | 8 (0.8%) | $0 |
| 1 Earner | 486 (48.5%) | $66,429 |
| 2 Earners | 494 (49.3%) | $83,629 |
| 3+ Earners | 14 (1.4%) | $0 |
| Total | 1,002 (100.0%) | $69,847 |
Household Income in Vandenberg AFB
Household Income Brackets in Vandenberg AFB
With 283 households falling in the category, the $75,000 to $99,999 income range is the most frequent in Vandenberg AFB, accounting for 23.8% of all households.
| Income Bracket | # Households | % Households |
| Less than $10,000 | 13 | 1.1% |
| $10,000 to $14,999 | 0 | 0.0% |
| $15,000 to $24,999 | 10 | 0.8% |
| $25,000 to $34,999 | 136 | 11.4% |
| $35,000 to $49,999 | 258 | 21.7% |
| $50,000 to $74,999 | 198 | 16.6% |
| $75,000 to $99,999 | 283 | 23.8% |
| $100,000 to $149,999 | 217 | 18.2% |
| $150,000 to $199,999 | 27 | 2.3% |
| $200,000+ | 50 | 4.2% |
Household Income by Householder Age in Vandenberg AFB
The median household income in Vandenberg AFB is $69,031, with the highest median household income of $185,000 found in the 45 to 64 years age bracket for the primary householder. A total of 34 households (2.9%) fall into this category.
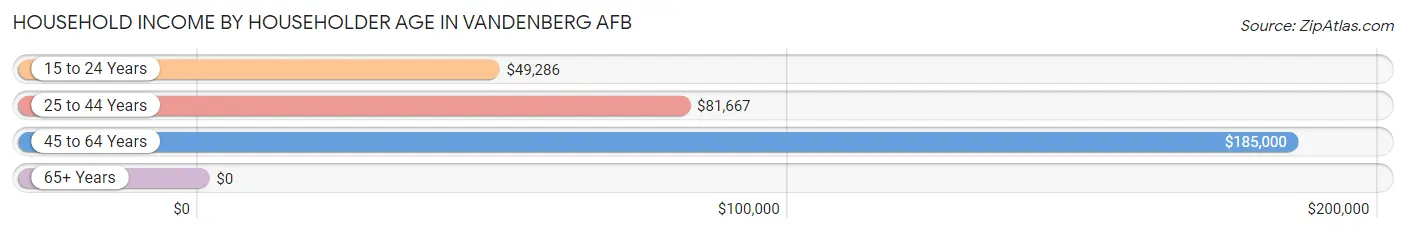
| Income Bracket | # Households | Median Income |
| 15 to 24 Years | 288 (24.2%) | $49,286 |
| 25 to 44 Years | 868 (72.9%) | $81,667 |
| 45 to 64 Years | 34 (2.9%) | $185,000 |
| 65+ Years | 0 (0.0%) | $0 |
| Total | 1,190 (100.0%) | $69,031 |
Poverty in Vandenberg AFB
Income Below Poverty by Sex and Age in Vandenberg AFB
With 1.0% poverty level for males and 2.5% for females among the residents of Vandenberg AFB, 15 year old males and 15 year old females are the most vulnerable to poverty, with 9 males (28.1%) and 5 females (33.3%) in their respective age groups living below the poverty level.
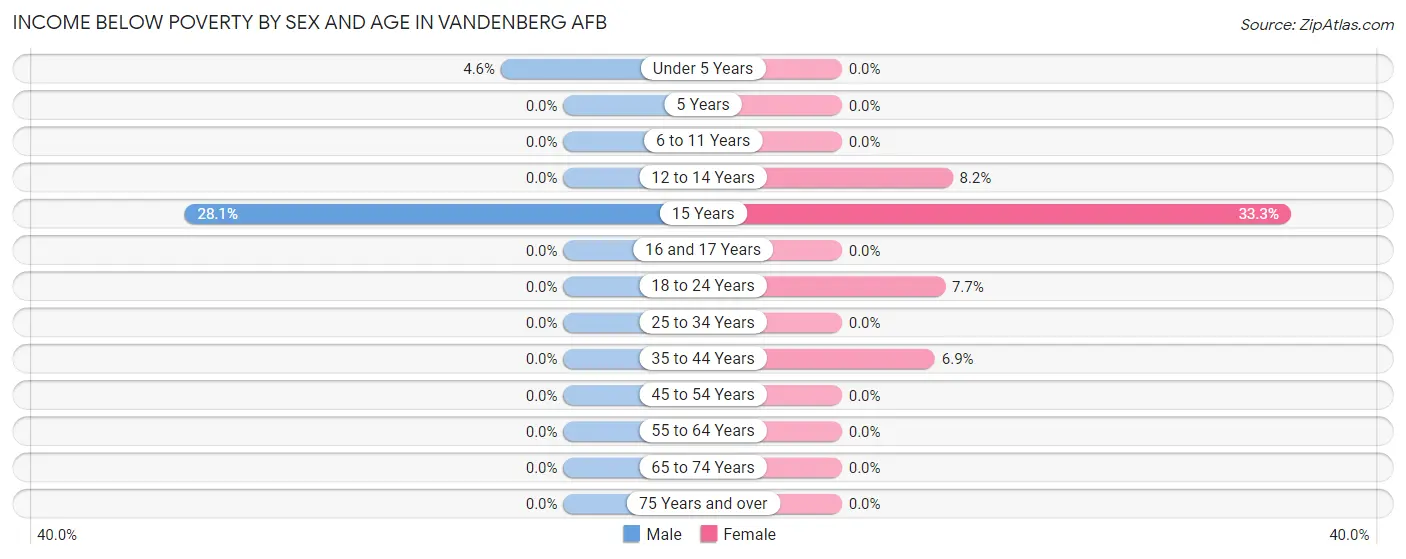
| Age Bracket | Male | Female |
| Under 5 Years | 7 (4.6%) | 0 (0.0%) |
| 5 Years | 0 (0.0%) | 0 (0.0%) |
| 6 to 11 Years | 0 (0.0%) | 0 (0.0%) |
| 12 to 14 Years | 0 (0.0%) | 6 (8.2%) |
| 15 Years | 9 (28.1%) | 5 (33.3%) |
| 16 and 17 Years | 0 (0.0%) | 0 (0.0%) |
| 18 to 24 Years | 0 (0.0%) | 18 (7.7%) |
| 25 to 34 Years | 0 (0.0%) | 0 (0.0%) |
| 35 to 44 Years | 0 (0.0%) | 13 (6.9%) |
| 45 to 54 Years | 0 (0.0%) | 0 (0.0%) |
| 55 to 64 Years | 0 (0.0%) | 0 (0.0%) |
| 65 to 74 Years | 0 (0.0%) | 0 (0.0%) |
| 75 Years and over | 0 (0.0%) | 0 (0.0%) |
| Total | 16 (1.0%) | 42 (2.5%) |
Income Above Poverty by Sex and Age in Vandenberg AFB
According to the poverty statistics in Vandenberg AFB, males aged 5 years and females aged under 5 years are the age groups that are most secure financially, with 100.0% of males and 100.0% of females in these age groups living above the poverty line.
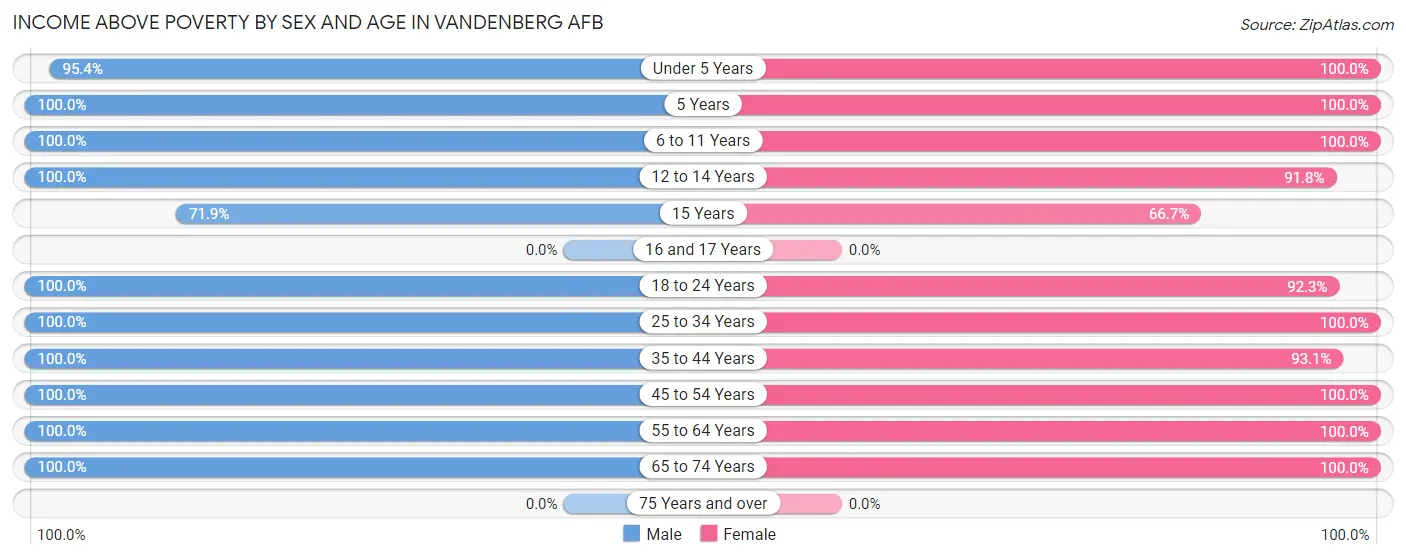
| Age Bracket | Male | Female |
| Under 5 Years | 144 (95.4%) | 198 (100.0%) |
| 5 Years | 46 (100.0%) | 92 (100.0%) |
| 6 to 11 Years | 188 (100.0%) | 218 (100.0%) |
| 12 to 14 Years | 48 (100.0%) | 67 (91.8%) |
| 15 Years | 23 (71.9%) | 10 (66.7%) |
| 16 and 17 Years | 0 (0.0%) | 0 (0.0%) |
| 18 to 24 Years | 300 (100.0%) | 217 (92.3%) |
| 25 to 34 Years | 558 (100.0%) | 572 (100.0%) |
| 35 to 44 Years | 290 (100.0%) | 175 (93.1%) |
| 45 to 54 Years | 30 (100.0%) | 43 (100.0%) |
| 55 to 64 Years | 5 (100.0%) | 9 (100.0%) |
| 65 to 74 Years | 5 (100.0%) | 5 (100.0%) |
| 75 Years and over | 0 (0.0%) | 0 (0.0%) |
| Total | 1,637 (99.0%) | 1,606 (97.5%) |
Income Below Poverty Among Married-Couple Families in Vandenberg AFB
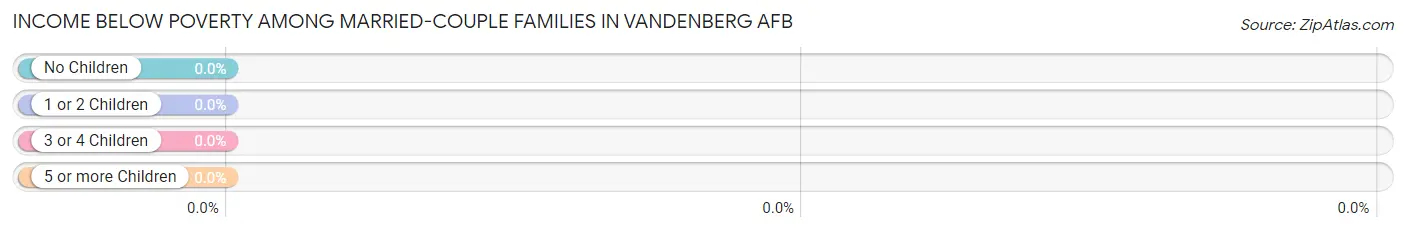
| Children | Above Poverty | Below Poverty |
| No Children | 331 (100.0%) | 0 (0.0%) |
| 1 or 2 Children | 497 (100.0%) | 0 (0.0%) |
| 3 or 4 Children | 88 (100.0%) | 0 (0.0%) |
| 5 or more Children | 0 (0.0%) | 0 (0.0%) |
| Total | 916 (100.0%) | 0 (0.0%) |
Income Below Poverty Among Single-Parent Households in Vandenberg AFB
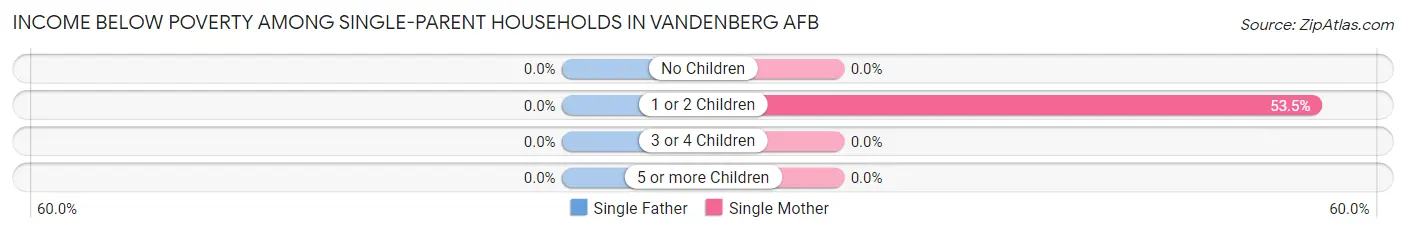
| Children | Single Father | Single Mother |
| No Children | 0 (0.0%) | 0 (0.0%) |
| 1 or 2 Children | 0 (0.0%) | 23 (53.5%) |
| 3 or 4 Children | 0 (0.0%) | 0 (0.0%) |
| 5 or more Children | 0 (0.0%) | 0 (0.0%) |
| Total | 0 (0.0%) | 23 (53.5%) |
Income Below Poverty Among Married-Couple vs Single-Parent Households in Vandenberg AFB
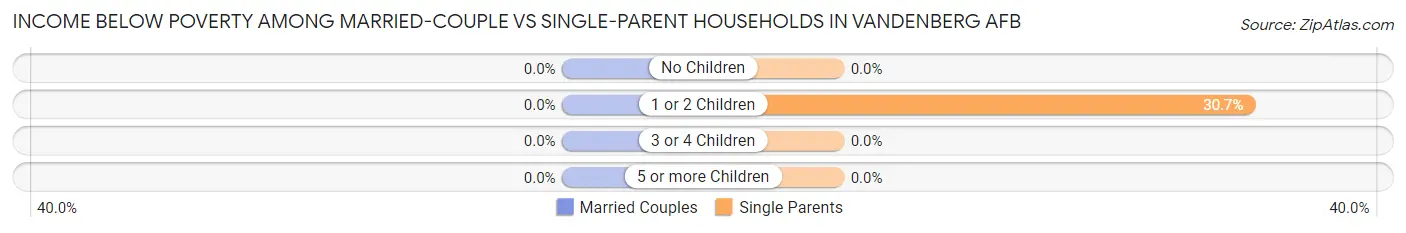
| Children | Married-Couple Families | Single-Parent Households |
| No Children | 0 (0.0%) | 0 (0.0%) |
| 1 or 2 Children | 0 (0.0%) | 23 (30.7%) |
| 3 or 4 Children | 0 (0.0%) | 0 (0.0%) |
| 5 or more Children | 0 (0.0%) | 0 (0.0%) |
| Total | 0 (0.0%) | 23 (26.7%) |
Employment Characteristics in Vandenberg AFB
Employment by Class of Employer in Vandenberg AFB
Among the 1,992 employed individuals in Vandenberg AFB, federal government employees (1,527 | 76.7%), private company employees (350 | 17.6%), and not-for-profit organizations (43 | 2.2%) make up the most common classes of employment.
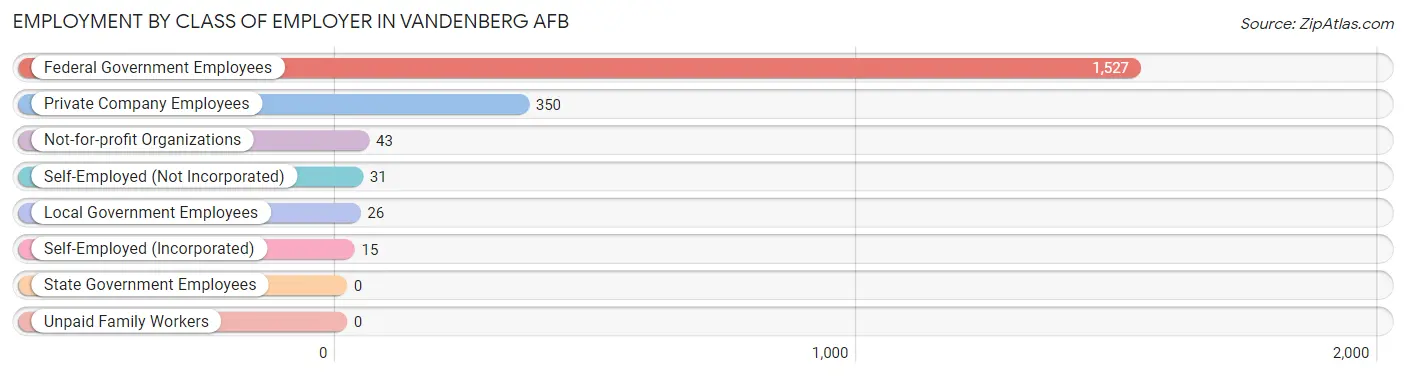
| Employer Class | # Employees | % Employees |
| Private Company Employees | 350 | 17.6% |
| Self-Employed (Incorporated) | 15 | 0.7% |
| Self-Employed (Not Incorporated) | 31 | 1.6% |
| Not-for-profit Organizations | 43 | 2.2% |
| Local Government Employees | 26 | 1.3% |
| State Government Employees | 0 | 0.0% |
| Federal Government Employees | 1,527 | 76.7% |
| Unpaid Family Workers | 0 | 0.0% |
| Total | 1,992 | 100.0% |
Employment Status by Age in Vandenberg AFB
According to the labor force statistics for Vandenberg AFB, out of the total population over 16 years of age (2,620), 80.0% or 2,096 individuals are in the labor force, with 11.4% or 239 of them unemployed. The age group with the highest labor force participation rate is 16 to 19 years, with 100.0% or 149 individuals in the labor force. Within the labor force, the 45 to 54 years age range has the highest percentage of unemployed individuals, with 50.0% or 15 of them being unemployed.
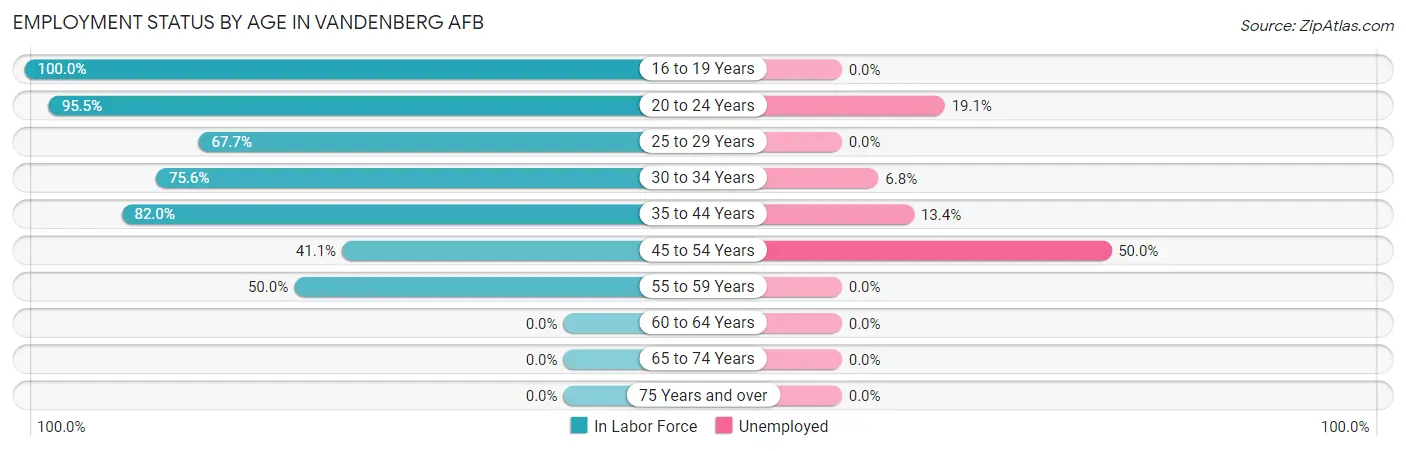
| Age Bracket | In Labor Force | Unemployed |
| 16 to 19 Years | 149 (100.0%) | 0 (0.0%) |
| 20 to 24 Years | 693 (95.5%) | 132 (19.1%) |
| 25 to 29 Years | 493 (67.7%) | 0 (0.0%) |
| 30 to 34 Years | 334 (75.6%) | 23 (6.8%) |
| 35 to 44 Years | 392 (82.0%) | 53 (13.4%) |
| 45 to 54 Years | 30 (41.1%) | 15 (50.0%) |
| 55 to 59 Years | 5 (50.0%) | 0 (0.0%) |
| 60 to 64 Years | 0 (0.0%) | 0 (0.0%) |
| 65 to 74 Years | 0 (0.0%) | 0 (0.0%) |
| 75 Years and over | 0 (0.0%) | 0 (0.0%) |
| Total | 2,096 (80.0%) | 239 (11.4%) |
Employment Status by Educational Attainment in Vandenberg AFB
According to labor force statistics for Vandenberg AFB, 72.3% of individuals (1,254) out of the total population between 25 and 64 years of age (1,735) are in the labor force, with 7.0% or 88 of them being unemployed. The group with the highest labor force participation rate are those with the educational attainment of college / associate degree, with 82.8% or 631 individuals in the labor force. Within the labor force, individuals with bachelor's degree or higher education have the highest percentage of unemployment, with 13.2% or 70 of them being unemployed.
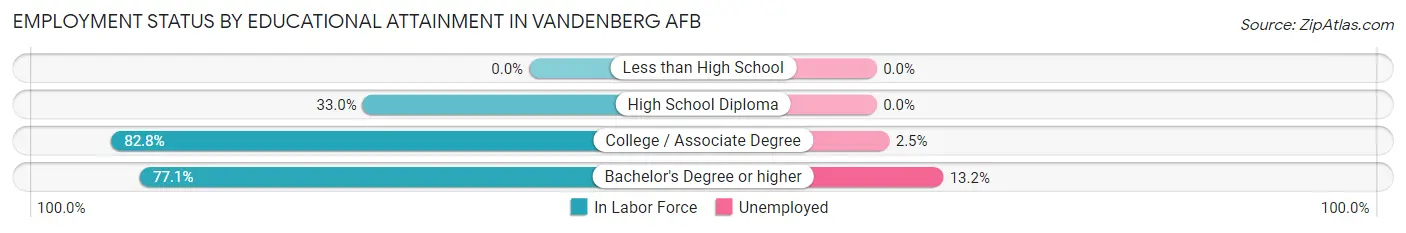
| Educational Attainment | In Labor Force | Unemployed |
| Less than High School | 0 (0.0%) | 0 (0.0%) |
| High School Diploma | 95 (33.0%) | 0 (0.0%) |
| College / Associate Degree | 631 (82.8%) | 19 (2.5%) |
| Bachelor's Degree or higher | 528 (77.1%) | 90 (13.2%) |
| Total | 1,254 (72.3%) | 121 (7.0%) |
Employment Occupations by Sex in Vandenberg AFB
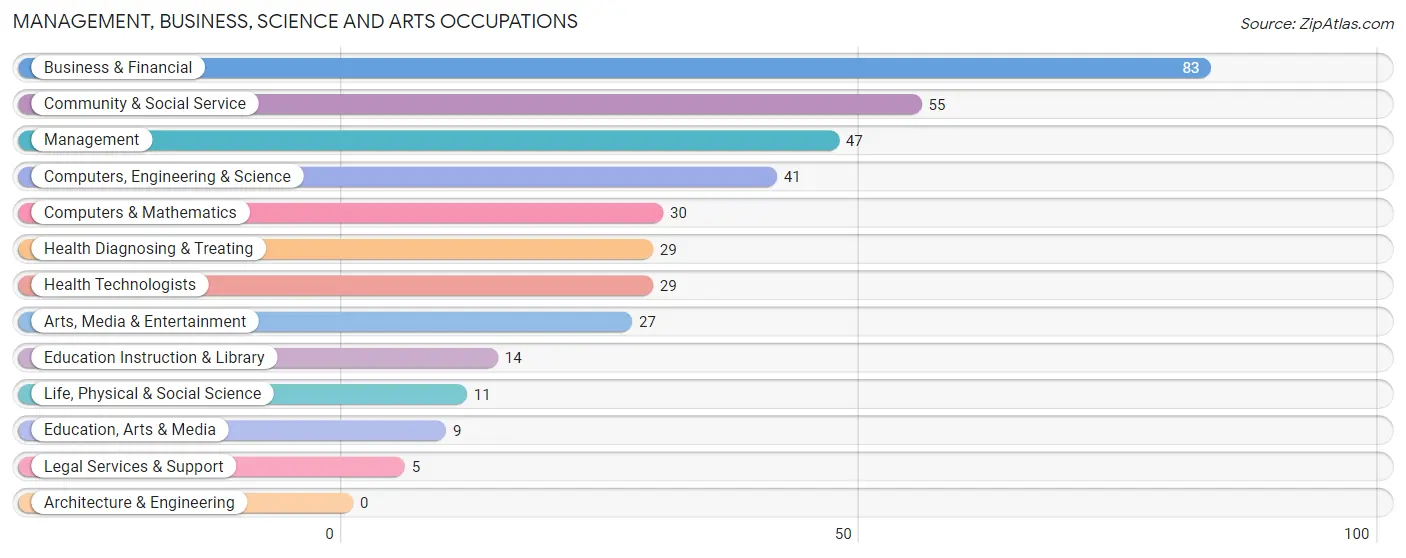
Management, Business, Science and Arts Occupations
The most common Management, Business, Science and Arts occupations in Vandenberg AFB are Business & Financial (83 | 12.5%), Community & Social Service (55 | 8.3%), Management (47 | 7.1%), Computers, Engineering & Science (41 | 6.2%), and Computers & Mathematics (30 | 4.5%).
Management, Business, Science and Arts Occupations by Sex
Within the Management, Business, Science and Arts occupations in Vandenberg AFB, the most male-oriented occupations are Computers & Mathematics (100.0%), Legal Services & Support (100.0%), and Computers, Engineering & Science (73.2%), while the most female-oriented occupations are Life, Physical & Social Science (100.0%), Education, Arts & Media (100.0%), and Education Instruction & Library (100.0%).
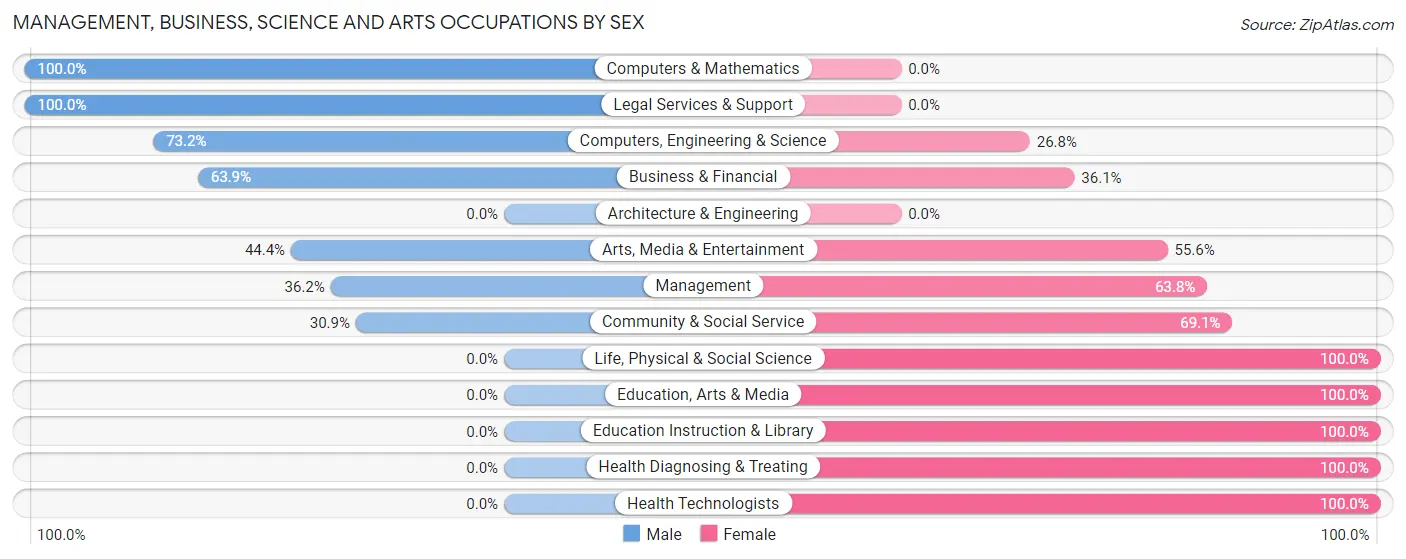
| Occupation | Male | Female |
| Management | 17 (36.2%) | 30 (63.8%) |
| Business & Financial | 53 (63.9%) | 30 (36.1%) |
| Computers, Engineering & Science | 30 (73.2%) | 11 (26.8%) |
| Computers & Mathematics | 30 (100.0%) | 0 (0.0%) |
| Architecture & Engineering | 0 (0.0%) | 0 (0.0%) |
| Life, Physical & Social Science | 0 (0.0%) | 11 (100.0%) |
| Community & Social Service | 17 (30.9%) | 38 (69.1%) |
| Education, Arts & Media | 0 (0.0%) | 9 (100.0%) |
| Legal Services & Support | 5 (100.0%) | 0 (0.0%) |
| Education Instruction & Library | 0 (0.0%) | 14 (100.0%) |
| Arts, Media & Entertainment | 12 (44.4%) | 15 (55.6%) |
| Health Diagnosing & Treating | 0 (0.0%) | 29 (100.0%) |
| Health Technologists | 0 (0.0%) | 29 (100.0%) |
| Total (Category) | 117 (45.9%) | 138 (54.1%) |
| Total (Overall) | 285 (43.0%) | 378 (57.0%) |
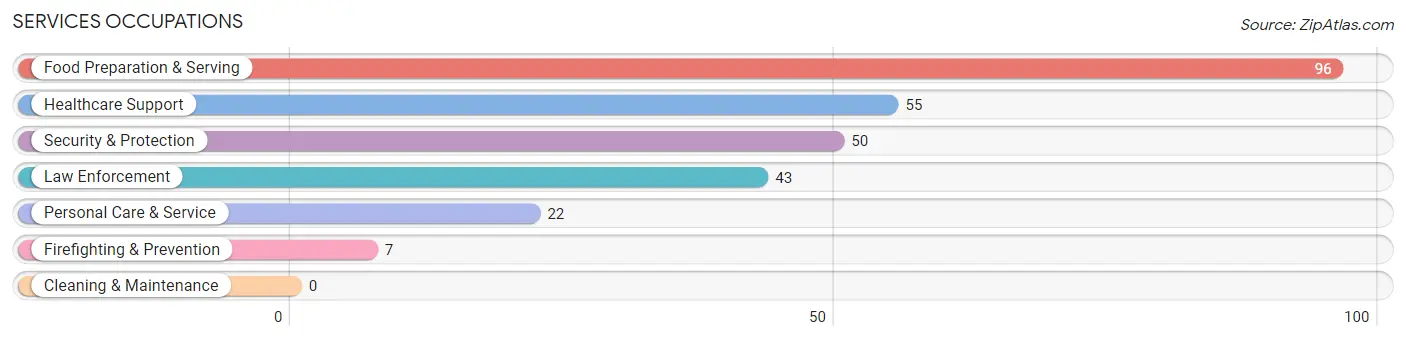
Services Occupations
The most common Services occupations in Vandenberg AFB are Food Preparation & Serving (96 | 14.5%), Healthcare Support (55 | 8.3%), Security & Protection (50 | 7.5%), Law Enforcement (43 | 6.5%), and Personal Care & Service (22 | 3.3%).
Services Occupations by Sex
Within the Services occupations in Vandenberg AFB, the most male-oriented occupations are Law Enforcement (83.7%), Security & Protection (72.0%), and Food Preparation & Serving (41.7%), while the most female-oriented occupations are Healthcare Support (100.0%), Firefighting & Prevention (100.0%), and Personal Care & Service (100.0%).
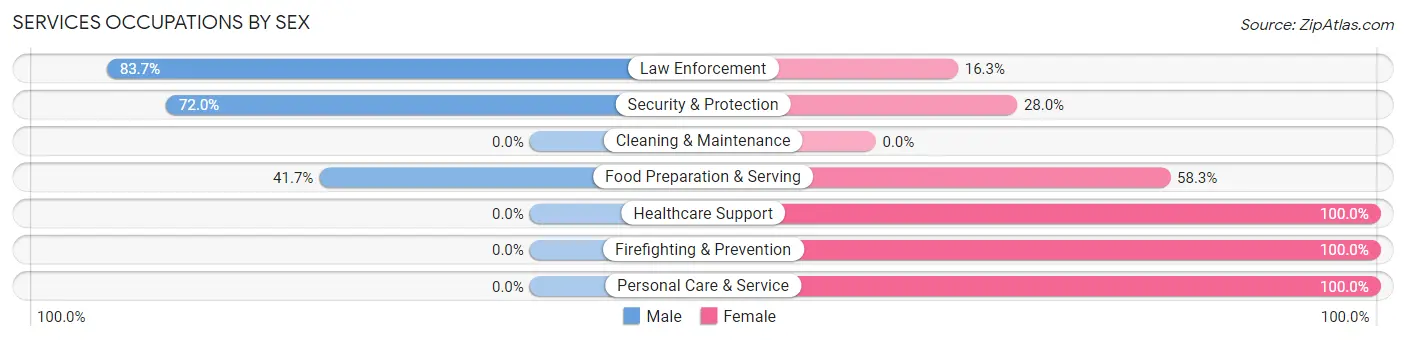
| Occupation | Male | Female |
| Healthcare Support | 0 (0.0%) | 55 (100.0%) |
| Security & Protection | 36 (72.0%) | 14 (28.0%) |
| Firefighting & Prevention | 0 (0.0%) | 7 (100.0%) |
| Law Enforcement | 36 (83.7%) | 7 (16.3%) |
| Food Preparation & Serving | 40 (41.7%) | 56 (58.3%) |
| Cleaning & Maintenance | 0 (0.0%) | 0 (0.0%) |
| Personal Care & Service | 0 (0.0%) | 22 (100.0%) |
| Total (Category) | 76 (34.1%) | 147 (65.9%) |
| Total (Overall) | 285 (43.0%) | 378 (57.0%) |
Sales and Office Occupations
The most common Sales and Office occupations in Vandenberg AFB are Sales & Related (71 | 10.7%), and Office & Administration (58 | 8.7%).
Sales and Office Occupations by Sex
| Occupation | Male | Female |
| Sales & Related | 31 (43.7%) | 40 (56.3%) |
| Office & Administration | 12 (20.7%) | 46 (79.3%) |
| Total (Category) | 43 (33.3%) | 86 (66.7%) |
| Total (Overall) | 285 (43.0%) | 378 (57.0%) |
Natural Resources, Construction and Maintenance Occupations
The most common Natural Resources, Construction and Maintenance occupations in Vandenberg AFB are Construction & Extraction (49 | 7.4%), and Installation, Maintenance & Repair (7 | 1.1%).
Natural Resources, Construction and Maintenance Occupations by Sex
| Occupation | Male | Female |
| Farming, Fishing & Forestry | 0 (0.0%) | 0 (0.0%) |
| Construction & Extraction | 49 (100.0%) | 0 (0.0%) |
| Installation, Maintenance & Repair | 0 (0.0%) | 7 (100.0%) |
| Total (Category) | 49 (87.5%) | 7 (12.5%) |
| Total (Overall) | 285 (43.0%) | 378 (57.0%) |
Production, Transportation and Moving Occupations
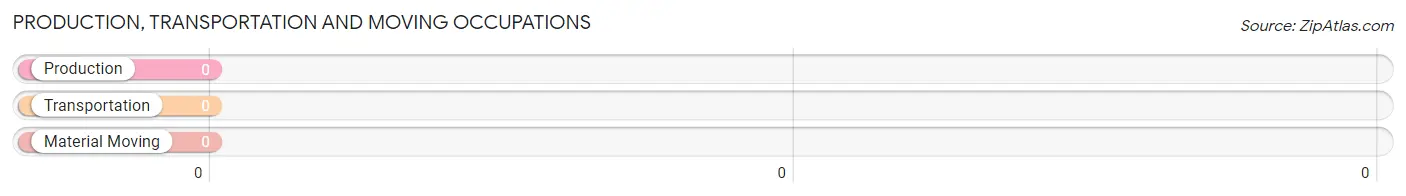
Production, Transportation and Moving Occupations by Sex
| Occupation | Male | Female |
| Production | 0 (0.0%) | 0 (0.0%) |
| Transportation | 0 (0.0%) | 0 (0.0%) |
| Material Moving | 0 (0.0%) | 0 (0.0%) |
| Total (Category) | 0 (0.0%) | 0 (0.0%) |
| Total (Overall) | 285 (43.0%) | 378 (57.0%) |
Employment Industries by Sex in Vandenberg AFB
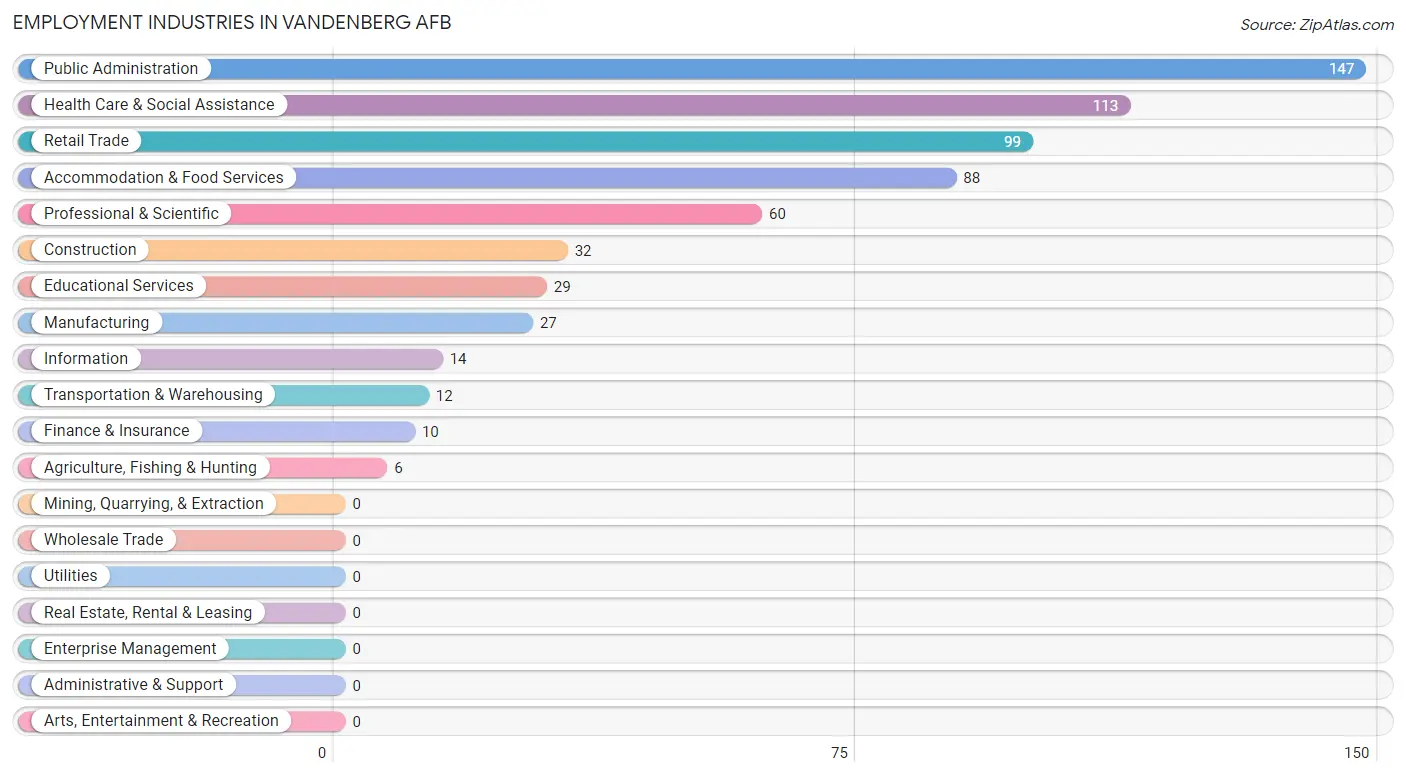
Employment Industries in Vandenberg AFB
The major employment industries in Vandenberg AFB include Public Administration (147 | 22.2%), Health Care & Social Assistance (113 | 17.0%), Retail Trade (99 | 14.9%), Accommodation & Food Services (88 | 13.3%), and Professional & Scientific (60 | 9.0%).
Employment Industries by Sex in Vandenberg AFB
The Vandenberg AFB industries that see more men than women are Agriculture, Fishing & Hunting (100.0%), Finance & Insurance (100.0%), and Construction (78.1%), whereas the industries that tend to have a higher number of women are Educational Services (100.0%), Health Care & Social Assistance (100.0%), and Accommodation & Food Services (70.5%).
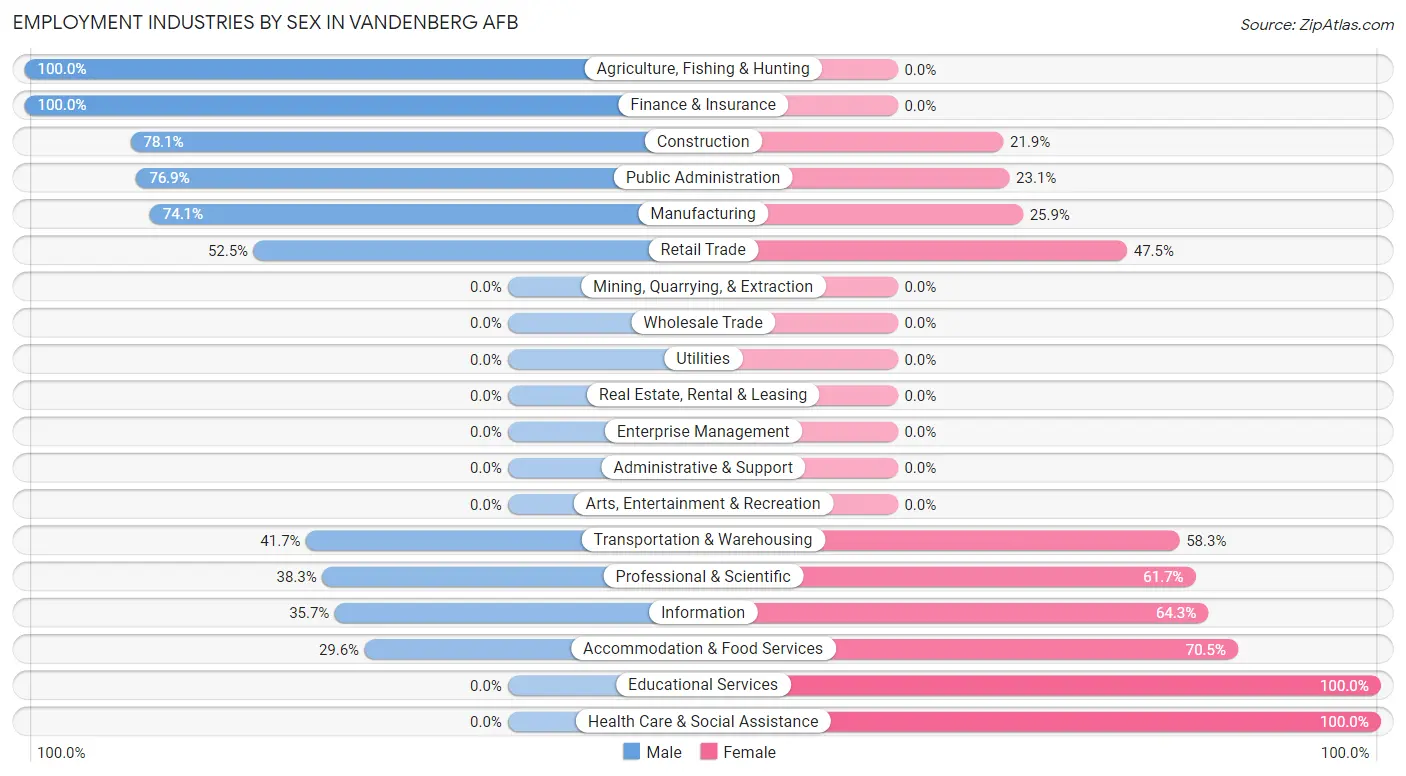
| Industry | Male | Female |
| Agriculture, Fishing & Hunting | 6 (100.0%) | 0 (0.0%) |
| Mining, Quarrying, & Extraction | 0 (0.0%) | 0 (0.0%) |
| Construction | 25 (78.1%) | 7 (21.9%) |
| Manufacturing | 20 (74.1%) | 7 (25.9%) |
| Wholesale Trade | 0 (0.0%) | 0 (0.0%) |
| Retail Trade | 52 (52.5%) | 47 (47.5%) |
| Transportation & Warehousing | 5 (41.7%) | 7 (58.3%) |
| Utilities | 0 (0.0%) | 0 (0.0%) |
| Information | 5 (35.7%) | 9 (64.3%) |
| Finance & Insurance | 10 (100.0%) | 0 (0.0%) |
| Real Estate, Rental & Leasing | 0 (0.0%) | 0 (0.0%) |
| Professional & Scientific | 23 (38.3%) | 37 (61.7%) |
| Enterprise Management | 0 (0.0%) | 0 (0.0%) |
| Administrative & Support | 0 (0.0%) | 0 (0.0%) |
| Educational Services | 0 (0.0%) | 29 (100.0%) |
| Health Care & Social Assistance | 0 (0.0%) | 113 (100.0%) |
| Arts, Entertainment & Recreation | 0 (0.0%) | 0 (0.0%) |
| Accommodation & Food Services | 26 (29.5%) | 62 (70.5%) |
| Public Administration | 113 (76.9%) | 34 (23.1%) |
| Total | 285 (43.0%) | 378 (57.0%) |
Education in Vandenberg AFB
School Enrollment in Vandenberg AFB
The most common levels of schooling among the 1,344 students in Vandenberg AFB are college / undergraduate (400 | 29.8%), elementary school (308 | 22.9%), and middle school (197 | 14.7%).
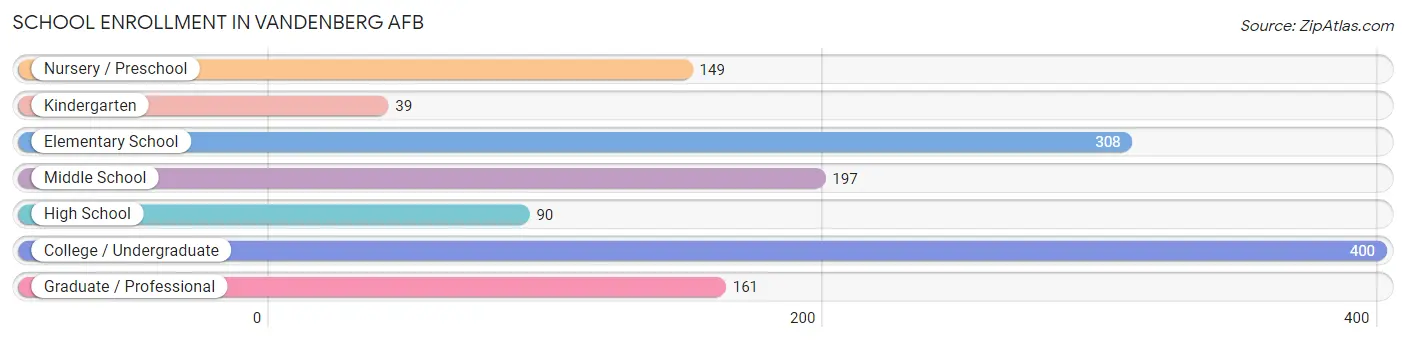
| School Level | # Students | % Students |
| Nursery / Preschool | 149 | 11.1% |
| Kindergarten | 39 | 2.9% |
| Elementary School | 308 | 22.9% |
| Middle School | 197 | 14.7% |
| High School | 90 | 6.7% |
| College / Undergraduate | 400 | 29.8% |
| Graduate / Professional | 161 | 12.0% |
| Total | 1,344 | 100.0% |
School Enrollment by Age by Funding Source in Vandenberg AFB
Out of a total of 1,344 students who are enrolled in schools in Vandenberg AFB, 388 (28.9%) attend a private institution, while the remaining 956 (71.1%) are enrolled in public schools. The age group of 3 to 4 year olds has the highest likelihood of being enrolled in private schools, with 28 (56.0% in the age bracket) enrolled. Conversely, the age group of 20 to 24 year olds has the lowest likelihood of being enrolled in a private school, with 138 (93.9% in the age bracket) attending a public institution.
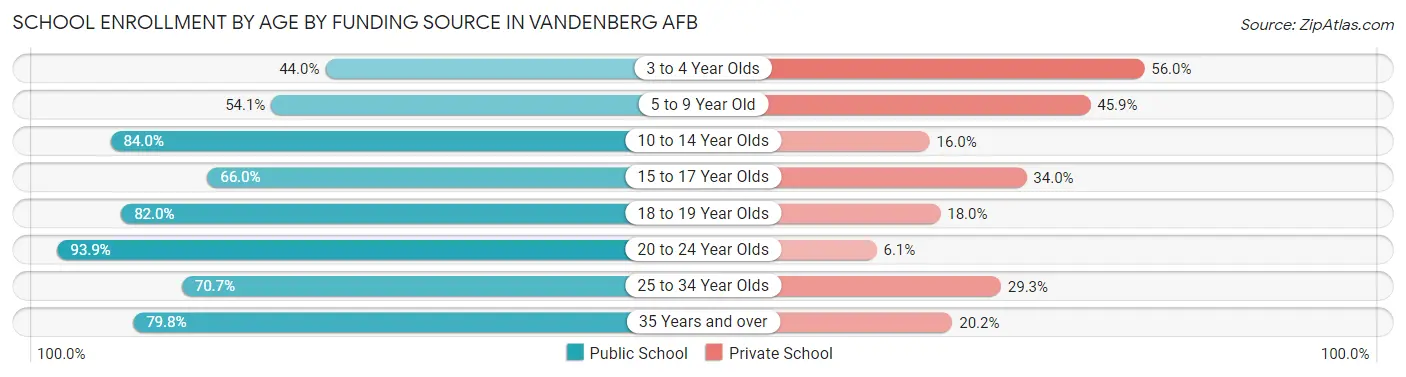
| Age Bracket | Public School | Private School |
| 3 to 4 Year Olds | 22 (44.0%) | 28 (56.0%) |
| 5 to 9 Year Old | 206 (54.1%) | 175 (45.9%) |
| 10 to 14 Year Olds | 236 (84.0%) | 45 (16.0%) |
| 15 to 17 Year Olds | 31 (66.0%) | 16 (34.0%) |
| 18 to 19 Year Olds | 41 (82.0%) | 9 (18.0%) |
| 20 to 24 Year Olds | 138 (93.9%) | 9 (6.1%) |
| 25 to 34 Year Olds | 215 (70.7%) | 89 (29.3%) |
| 35 Years and over | 67 (79.8%) | 17 (20.2%) |
| Total | 956 (71.1%) | 388 (28.9%) |
Educational Attainment by Field of Study in Vandenberg AFB
Business (106 | 14.5%), psychology (85 | 11.6%), arts & humanities (74 | 10.1%), science & technology (64 | 8.7%), and engineering (63 | 8.6%) are the most common fields of study among 732 individuals in Vandenberg AFB who have obtained a bachelor's degree or higher.
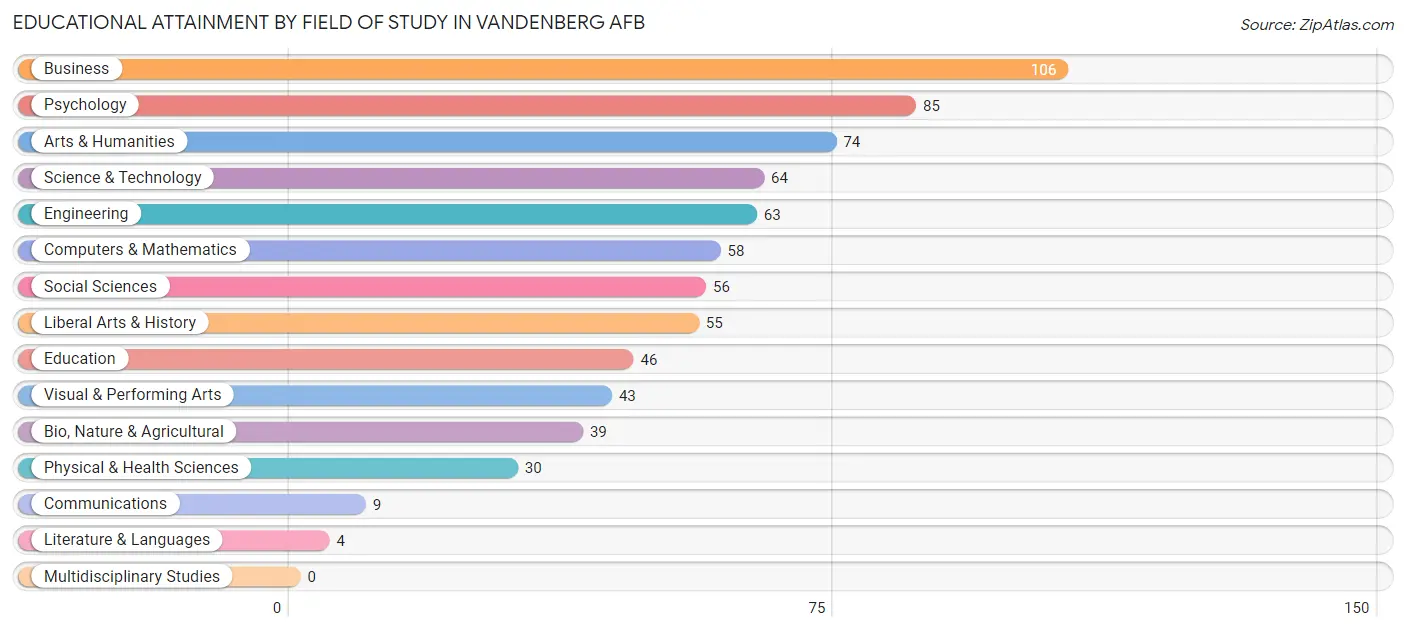
| Field of Study | # Graduates | % Graduates |
| Computers & Mathematics | 58 | 7.9% |
| Bio, Nature & Agricultural | 39 | 5.3% |
| Physical & Health Sciences | 30 | 4.1% |
| Psychology | 85 | 11.6% |
| Social Sciences | 56 | 7.6% |
| Engineering | 63 | 8.6% |
| Multidisciplinary Studies | 0 | 0.0% |
| Science & Technology | 64 | 8.7% |
| Business | 106 | 14.5% |
| Education | 46 | 6.3% |
| Literature & Languages | 4 | 0.5% |
| Liberal Arts & History | 55 | 7.5% |
| Visual & Performing Arts | 43 | 5.9% |
| Communications | 9 | 1.2% |
| Arts & Humanities | 74 | 10.1% |
| Total | 732 | 100.0% |
Transportation & Commute in Vandenberg AFB
Vehicle Availability by Sex in Vandenberg AFB
The most prevalent vehicle ownership categories in Vandenberg AFB are males with 2 vehicles (625, accounting for 54.0%) and females with 2 vehicles (326, making up 127.3%).
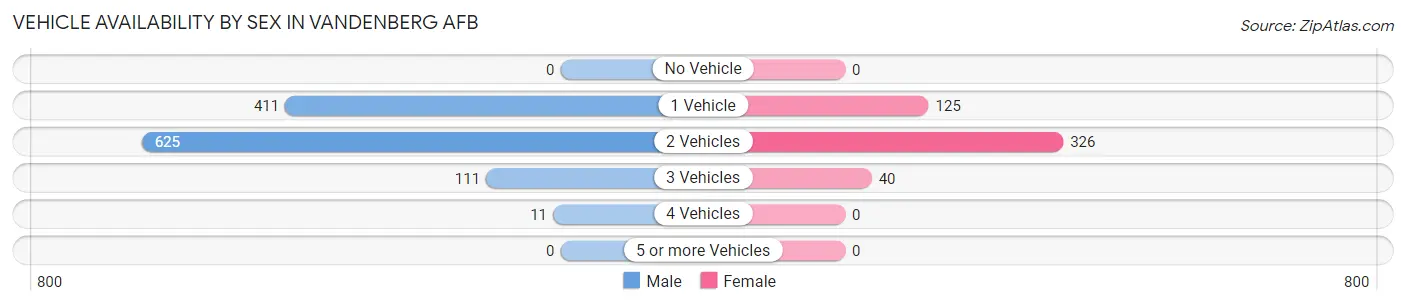
| Vehicles Available | Male | Female |
| No Vehicle | 0 (0.0%) | 0 (0.0%) |
| 1 Vehicle | 411 (35.5%) | 125 (25.5%) |
| 2 Vehicles | 625 (54.0%) | 326 (66.4%) |
| 3 Vehicles | 111 (9.6%) | 40 (8.2%) |
| 4 Vehicles | 11 (0.9%) | 0 (0.0%) |
| 5 or more Vehicles | 0 (0.0%) | 0 (0.0%) |
| Total | 1,158 (100.0%) | 491 (100.0%) |
Commute Time in Vandenberg AFB
The most frequently occuring commute durations in Vandenberg AFB are 5 to 9 minutes (791 commuters, 41.6%), 10 to 14 minutes (568 commuters, 29.9%), and less than 5 minutes (153 commuters, 8.0%).
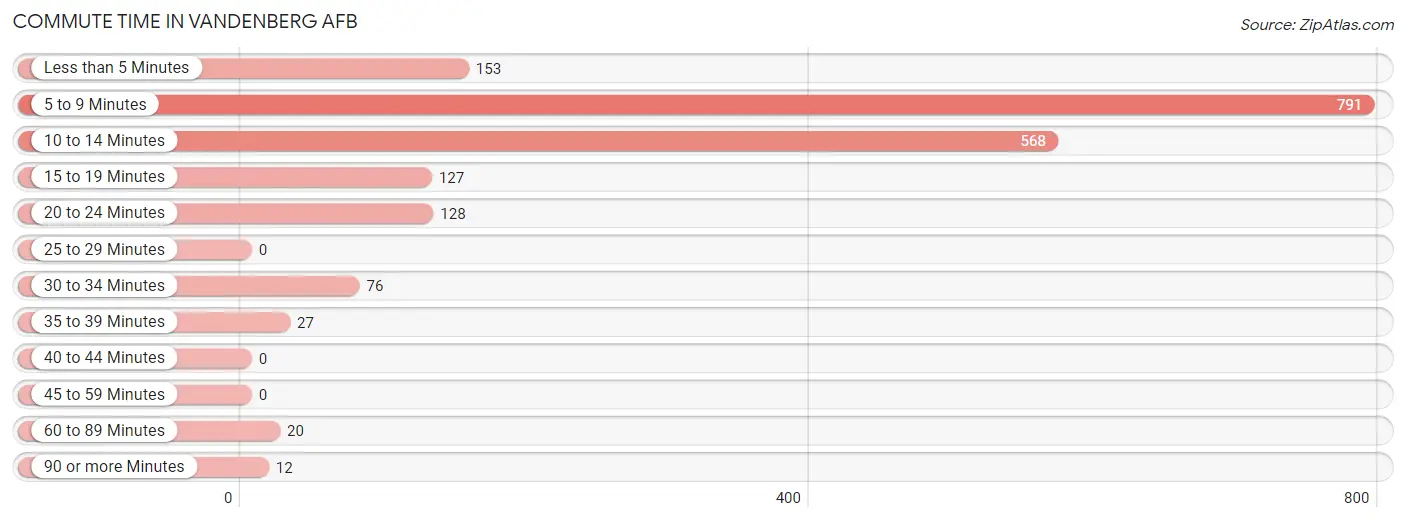
| Commute Time | # Commuters | % Commuters |
| Less than 5 Minutes | 153 | 8.0% |
| 5 to 9 Minutes | 791 | 41.6% |
| 10 to 14 Minutes | 568 | 29.9% |
| 15 to 19 Minutes | 127 | 6.7% |
| 20 to 24 Minutes | 128 | 6.7% |
| 25 to 29 Minutes | 0 | 0.0% |
| 30 to 34 Minutes | 76 | 4.0% |
| 35 to 39 Minutes | 27 | 1.4% |
| 40 to 44 Minutes | 0 | 0.0% |
| 45 to 59 Minutes | 0 | 0.0% |
| 60 to 89 Minutes | 20 | 1.1% |
| 90 or more Minutes | 12 | 0.6% |
Commute Time by Sex in Vandenberg AFB
The most common commute times in Vandenberg AFB are 5 to 9 minutes (560 commuters, 41.1%) for males and 5 to 9 minutes (231 commuters, 42.9%) for females.
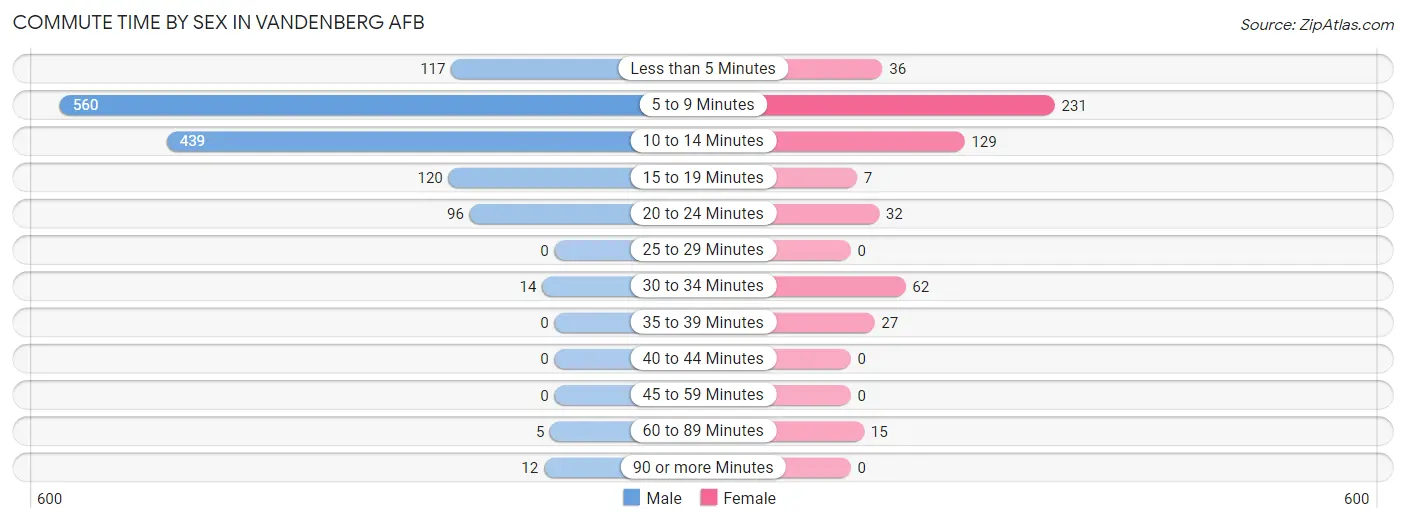
| Commute Time | Male | Female |
| Less than 5 Minutes | 117 (8.6%) | 36 (6.7%) |
| 5 to 9 Minutes | 560 (41.1%) | 231 (42.9%) |
| 10 to 14 Minutes | 439 (32.2%) | 129 (23.9%) |
| 15 to 19 Minutes | 120 (8.8%) | 7 (1.3%) |
| 20 to 24 Minutes | 96 (7.0%) | 32 (5.9%) |
| 25 to 29 Minutes | 0 (0.0%) | 0 (0.0%) |
| 30 to 34 Minutes | 14 (1.0%) | 62 (11.5%) |
| 35 to 39 Minutes | 0 (0.0%) | 27 (5.0%) |
| 40 to 44 Minutes | 0 (0.0%) | 0 (0.0%) |
| 45 to 59 Minutes | 0 (0.0%) | 0 (0.0%) |
| 60 to 89 Minutes | 5 (0.4%) | 15 (2.8%) |
| 90 or more Minutes | 12 (0.9%) | 0 (0.0%) |
Time of Departure to Work by Sex in Vandenberg AFB
The most frequent times of departure to work in Vandenberg AFB are 7:00 AM to 7:29 AM (330, 24.2%) for males and 7:00 AM to 7:29 AM (133, 24.7%) for females.
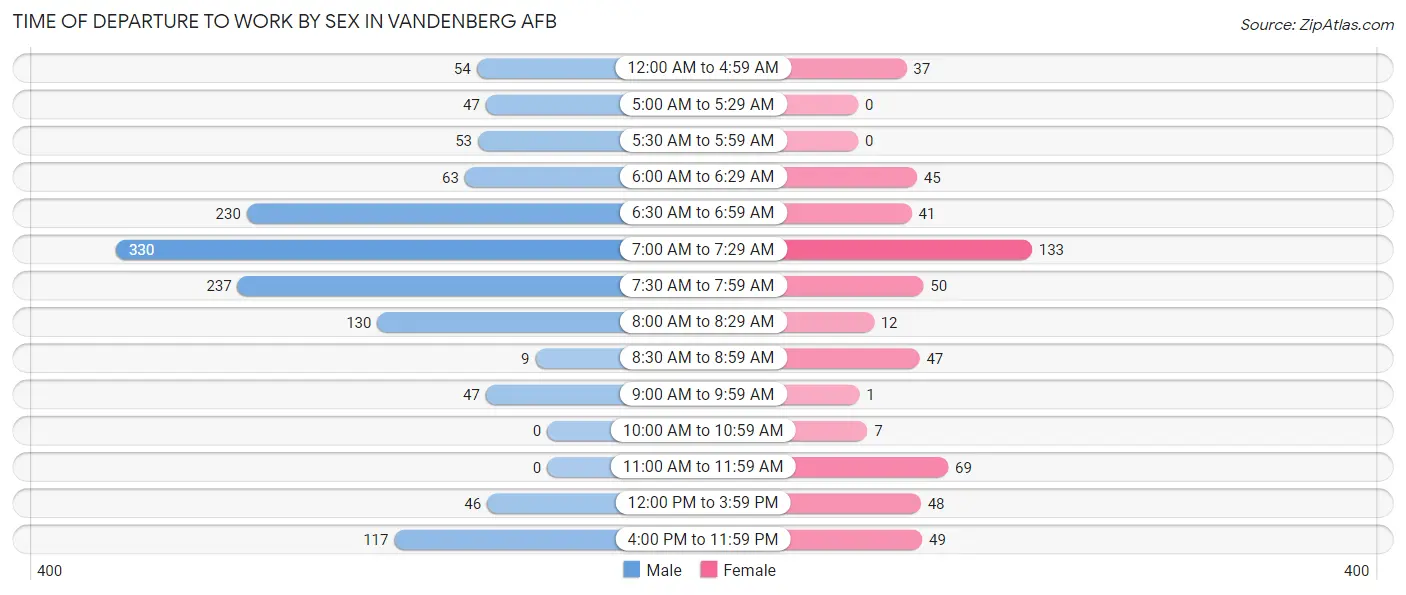
| Time of Departure | Male | Female |
| 12:00 AM to 4:59 AM | 54 (4.0%) | 37 (6.9%) |
| 5:00 AM to 5:29 AM | 47 (3.5%) | 0 (0.0%) |
| 5:30 AM to 5:59 AM | 53 (3.9%) | 0 (0.0%) |
| 6:00 AM to 6:29 AM | 63 (4.6%) | 45 (8.4%) |
| 6:30 AM to 6:59 AM | 230 (16.9%) | 41 (7.6%) |
| 7:00 AM to 7:29 AM | 330 (24.2%) | 133 (24.7%) |
| 7:30 AM to 7:59 AM | 237 (17.4%) | 50 (9.3%) |
| 8:00 AM to 8:29 AM | 130 (9.5%) | 12 (2.2%) |
| 8:30 AM to 8:59 AM | 9 (0.7%) | 47 (8.7%) |
| 9:00 AM to 9:59 AM | 47 (3.5%) | 1 (0.2%) |
| 10:00 AM to 10:59 AM | 0 (0.0%) | 7 (1.3%) |
| 11:00 AM to 11:59 AM | 0 (0.0%) | 69 (12.8%) |
| 12:00 PM to 3:59 PM | 46 (3.4%) | 48 (8.9%) |
| 4:00 PM to 11:59 PM | 117 (8.6%) | 49 (9.1%) |
| Total | 1,363 (100.0%) | 539 (100.0%) |
Housing Occupancy in Vandenberg AFB
Occupancy by Ownership in Vandenberg AFB
Of the total 1,190 dwellings in Vandenberg AFB, owner-occupied units account for 0 (0.0%), while renter-occupied units make up 1,190 (100.0%).
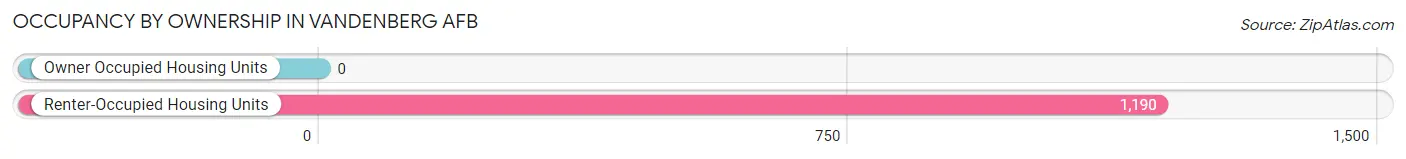
| Occupancy | # Housing Units | % Housing Units |
| Owner Occupied Housing Units | 0 | 0.0% |
| Renter-Occupied Housing Units | 1,190 | 100.0% |
| Total Occupied Housing Units | 1,190 | 100.0% |
Occupancy by Household Size in Vandenberg AFB
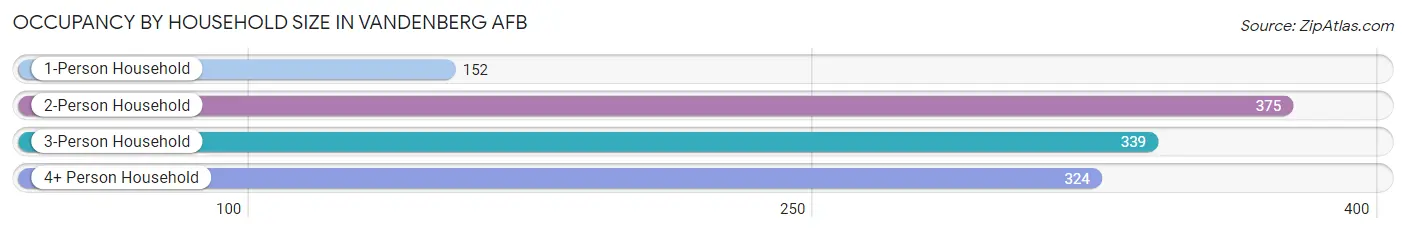
| Household Size | # Housing Units | % Housing Units |
| 1-Person Household | 152 | 12.8% |
| 2-Person Household | 375 | 31.5% |
| 3-Person Household | 339 | 28.5% |
| 4+ Person Household | 324 | 27.2% |
| Total Housing Units | 1,190 | 100.0% |
Occupancy by Ownership by Household Size in Vandenberg AFB
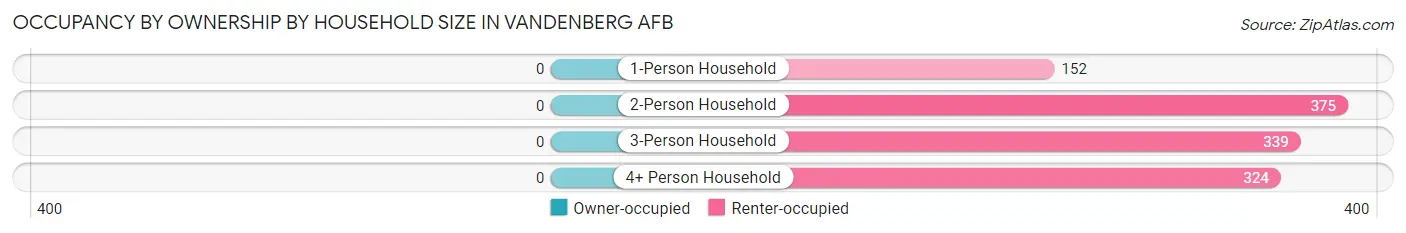
| Household Size | Owner-occupied | Renter-occupied |
| 1-Person Household | 0 (0.0%) | 152 (100.0%) |
| 2-Person Household | 0 (0.0%) | 375 (100.0%) |
| 3-Person Household | 0 (0.0%) | 339 (100.0%) |
| 4+ Person Household | 0 (0.0%) | 324 (100.0%) |
| Total Housing Units | 0 (0.0%) | 1,190 (100.0%) |
Occupancy by Educational Attainment in Vandenberg AFB
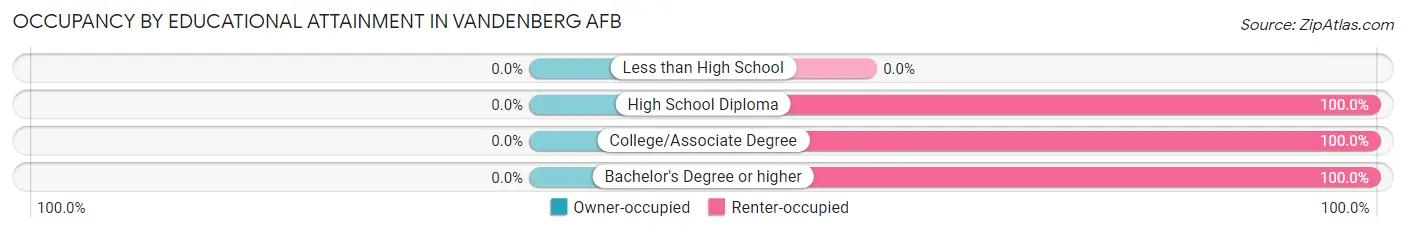
| Household Size | Owner-occupied | Renter-occupied |
| Less than High School | 0 (0.0%) | 0 (0.0%) |
| High School Diploma | 0 (0.0%) | 112 (100.0%) |
| College/Associate Degree | 0 (0.0%) | 721 (100.0%) |
| Bachelor's Degree or higher | 0 (0.0%) | 357 (100.0%) |
Occupancy by Age of Householder in Vandenberg AFB
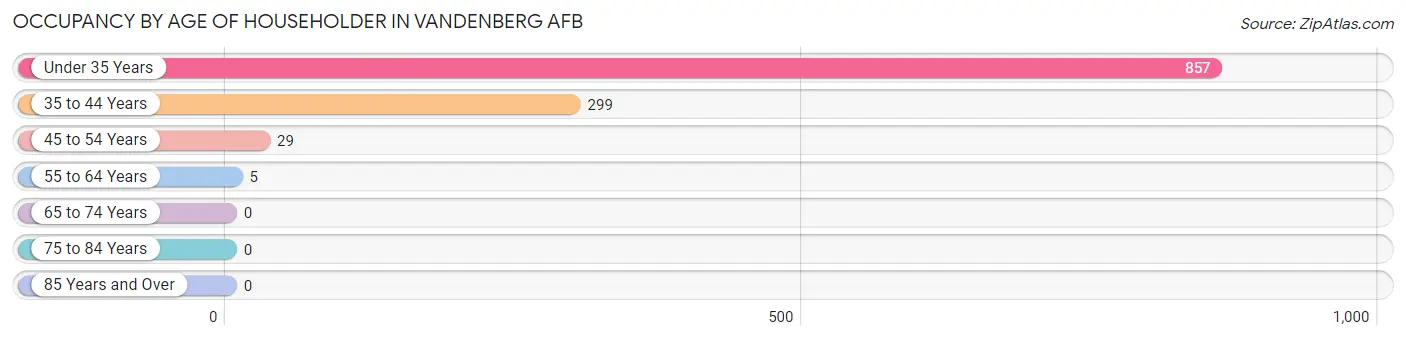
| Age Bracket | # Households | % Households |
| Under 35 Years | 857 | 72.0% |
| 35 to 44 Years | 299 | 25.1% |
| 45 to 54 Years | 29 | 2.4% |
| 55 to 64 Years | 5 | 0.4% |
| 65 to 74 Years | 0 | 0.0% |
| 75 to 84 Years | 0 | 0.0% |
| 85 Years and Over | 0 | 0.0% |
| Total | 1,190 | 100.0% |
Housing Finances in Vandenberg AFB
Median Income by Occupancy in Vandenberg AFB
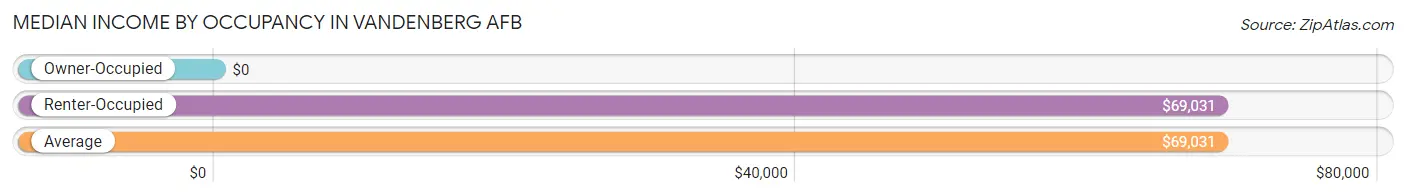
| Occupancy Type | # Households | Median Income |
| Owner-Occupied | 0 (0.0%) | $0 |
| Renter-Occupied | 1,190 (100.0%) | $69,031 |
| Average | 1,190 (100.0%) | $69,031 |
Occupancy by Householder Income Bracket in Vandenberg AFB
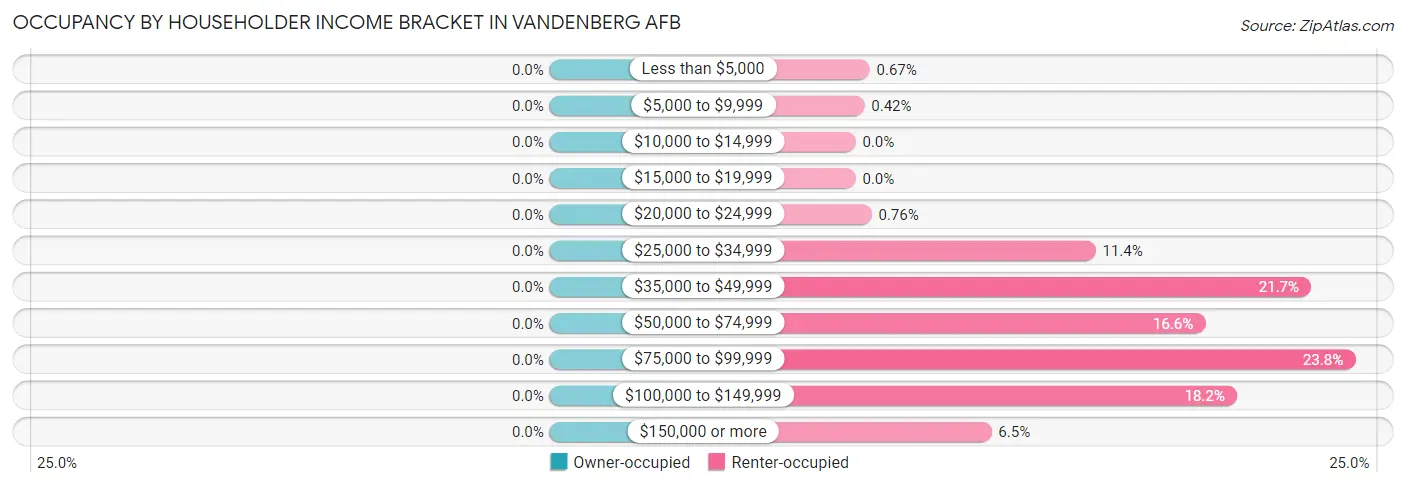
| Income Bracket | Owner-occupied | Renter-occupied |
| Less than $5,000 | 0 (0.0%) | 8 (0.7%) |
| $5,000 to $9,999 | 0 (0.0%) | 5 (0.4%) |
| $10,000 to $14,999 | 0 (0.0%) | 0 (0.0%) |
| $15,000 to $19,999 | 0 (0.0%) | 0 (0.0%) |
| $20,000 to $24,999 | 0 (0.0%) | 9 (0.8%) |
| $25,000 to $34,999 | 0 (0.0%) | 136 (11.4%) |
| $35,000 to $49,999 | 0 (0.0%) | 258 (21.7%) |
| $50,000 to $74,999 | 0 (0.0%) | 198 (16.6%) |
| $75,000 to $99,999 | 0 (0.0%) | 283 (23.8%) |
| $100,000 to $149,999 | 0 (0.0%) | 216 (18.1%) |
| $150,000 or more | 0 (0.0%) | 77 (6.5%) |
| Total | 0 (0.0%) | 1,190 (100.0%) |
Monthly Housing Cost Tiers in Vandenberg AFB
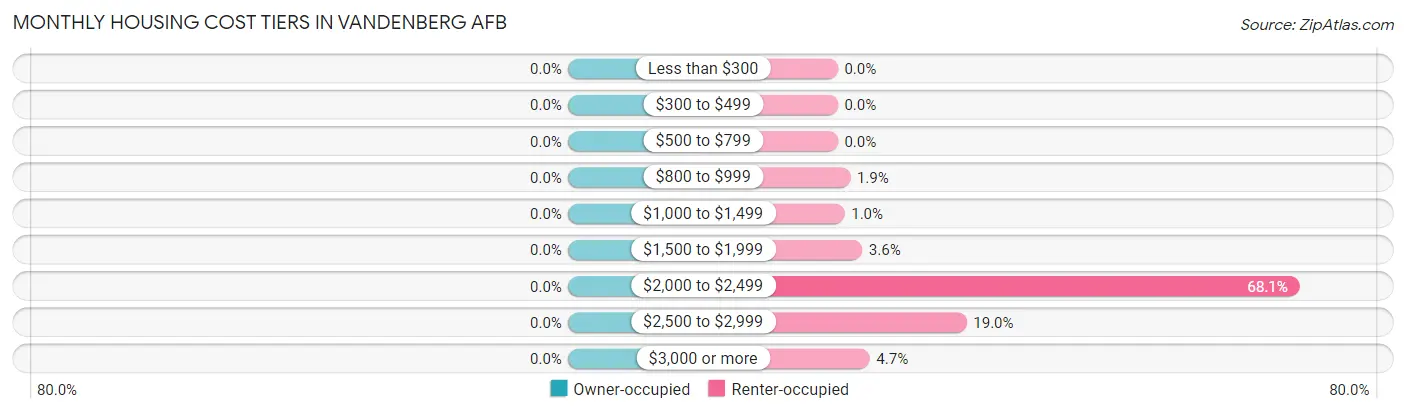
| Monthly Cost | Owner-occupied | Renter-occupied |
| Less than $300 | 0 (0.0%) | 0 (0.0%) |
| $300 to $499 | 0 (0.0%) | 0 (0.0%) |
| $500 to $799 | 0 (0.0%) | 0 (0.0%) |
| $800 to $999 | 0 (0.0%) | 22 (1.8%) |
| $1,000 to $1,499 | 0 (0.0%) | 12 (1.0%) |
| $1,500 to $1,999 | 0 (0.0%) | 43 (3.6%) |
| $2,000 to $2,499 | 0 (0.0%) | 810 (68.1%) |
| $2,500 to $2,999 | 0 (0.0%) | 226 (19.0%) |
| $3,000 or more | 0 (0.0%) | 56 (4.7%) |
| Total | 0 (0.0%) | 1,190 (100.0%) |
Physical Housing Characteristics in Vandenberg AFB
Housing Structures in Vandenberg AFB
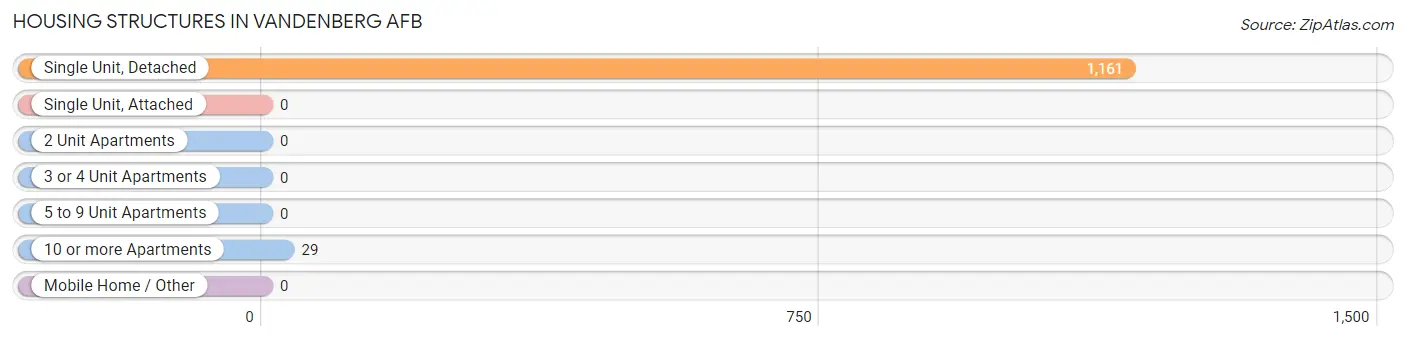
| Structure Type | # Housing Units | % Housing Units |
| Single Unit, Detached | 1,161 | 97.6% |
| Single Unit, Attached | 0 | 0.0% |
| 2 Unit Apartments | 0 | 0.0% |
| 3 or 4 Unit Apartments | 0 | 0.0% |
| 5 to 9 Unit Apartments | 0 | 0.0% |
| 10 or more Apartments | 29 | 2.4% |
| Mobile Home / Other | 0 | 0.0% |
| Total | 1,190 | 100.0% |
Housing Structures by Occupancy in Vandenberg AFB
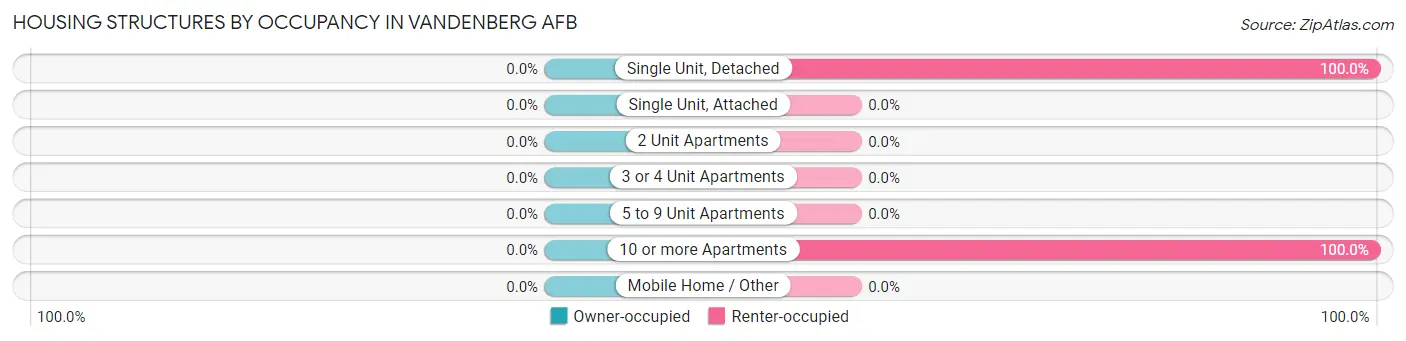
| Structure Type | Owner-occupied | Renter-occupied |
| Single Unit, Detached | 0 (0.0%) | 1,161 (100.0%) |
| Single Unit, Attached | 0 (0.0%) | 0 (0.0%) |
| 2 Unit Apartments | 0 (0.0%) | 0 (0.0%) |
| 3 or 4 Unit Apartments | 0 (0.0%) | 0 (0.0%) |
| 5 to 9 Unit Apartments | 0 (0.0%) | 0 (0.0%) |
| 10 or more Apartments | 0 (0.0%) | 29 (100.0%) |
| Mobile Home / Other | 0 (0.0%) | 0 (0.0%) |
| Total | 0 (0.0%) | 1,190 (100.0%) |
Housing Structures by Number of Rooms in Vandenberg AFB
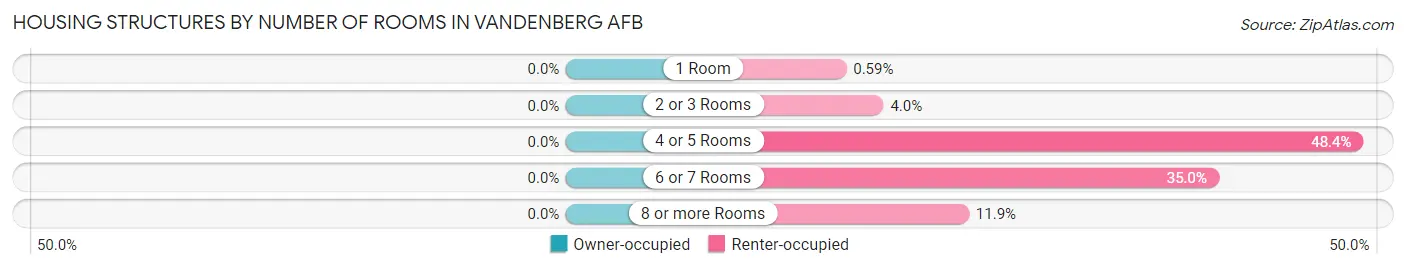
| Number of Rooms | Owner-occupied | Renter-occupied |
| 1 Room | 0 (0.0%) | 7 (0.6%) |
| 2 or 3 Rooms | 0 (0.0%) | 48 (4.0%) |
| 4 or 5 Rooms | 0 (0.0%) | 576 (48.4%) |
| 6 or 7 Rooms | 0 (0.0%) | 417 (35.0%) |
| 8 or more Rooms | 0 (0.0%) | 142 (11.9%) |
| Total | 0 (0.0%) | 1,190 (100.0%) |
Housing Structure by Heating Type in Vandenberg AFB
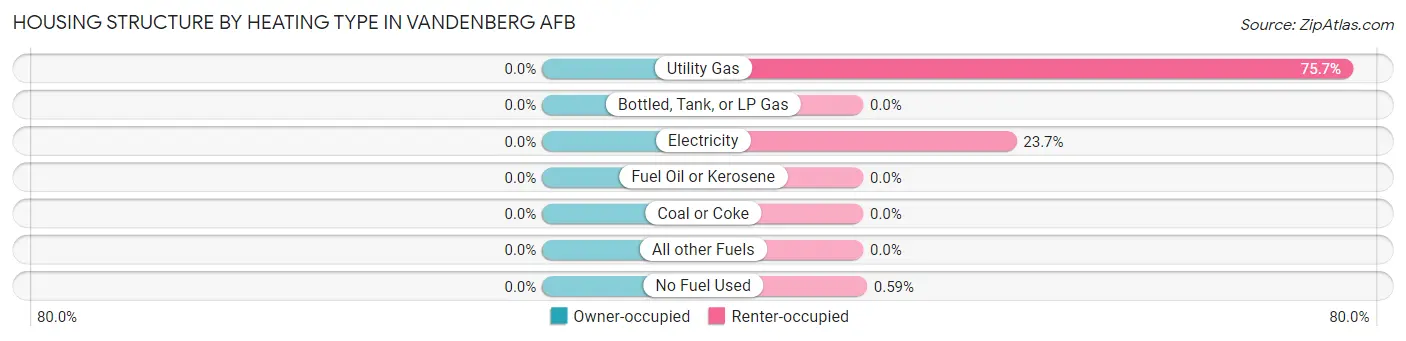
| Heating Type | Owner-occupied | Renter-occupied |
| Utility Gas | 0 (0.0%) | 901 (75.7%) |
| Bottled, Tank, or LP Gas | 0 (0.0%) | 0 (0.0%) |
| Electricity | 0 (0.0%) | 282 (23.7%) |
| Fuel Oil or Kerosene | 0 (0.0%) | 0 (0.0%) |
| Coal or Coke | 0 (0.0%) | 0 (0.0%) |
| All other Fuels | 0 (0.0%) | 0 (0.0%) |
| No Fuel Used | 0 (0.0%) | 7 (0.6%) |
| Total | 0 (0.0%) | 1,190 (100.0%) |
Household Vehicle Usage in Vandenberg AFB
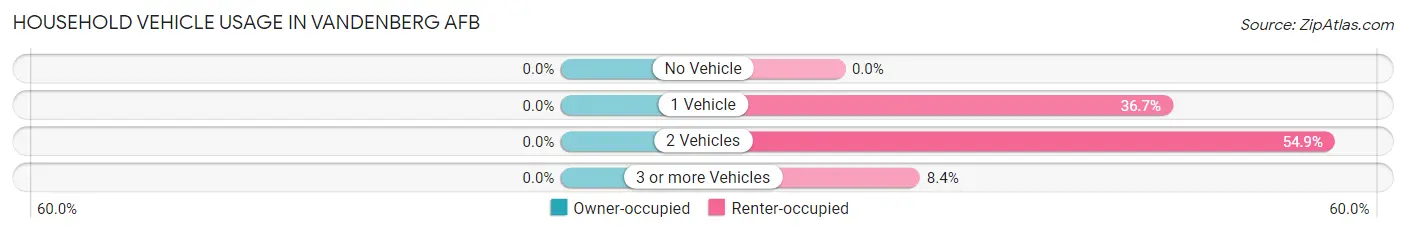
| Vehicles per Household | Owner-occupied | Renter-occupied |
| No Vehicle | 0 (0.0%) | 0 (0.0%) |
| 1 Vehicle | 0 (0.0%) | 437 (36.7%) |
| 2 Vehicles | 0 (0.0%) | 653 (54.9%) |
| 3 or more Vehicles | 0 (0.0%) | 100 (8.4%) |
| Total | 0 (0.0%) | 1,190 (100.0%) |
Real Estate & Mortgages in Vandenberg AFB
Real Estate and Mortgage Overview in Vandenberg AFB
| Characteristic | Without Mortgage | With Mortgage |
| Housing Units | 0 | 0 |
| Median Property Value | - | - |
| Median Household Income | - | - |
| Monthly Housing Costs | - | - |
| Real Estate Taxes | - | - |
Property Value by Mortgage Status in Vandenberg AFB
| Property Value | Without Mortgage | With Mortgage |
| Less than $50,000 | 0 (0.0%) | 0 (0.0%) |
| $50,000 to $99,999 | 0 (0.0%) | 0 (0.0%) |
| $100,000 to $299,999 | 0 (0.0%) | 0 (0.0%) |
| $300,000 to $499,999 | 0 (0.0%) | 0 (0.0%) |
| $500,000 to $749,999 | 0 (0.0%) | 0 (0.0%) |
| $750,000 to $999,999 | 0 (0.0%) | 0 (0.0%) |
| $1,000,000 or more | 0 (0.0%) | 0 (0.0%) |
| Total | 0 (0.0%) | 0 (0.0%) |
Household Income by Mortgage Status in Vandenberg AFB
| Household Income | Without Mortgage | With Mortgage |
| Less than $10,000 | 0 (0.0%) | 0 (0.0%) |
| $10,000 to $24,999 | 0 (0.0%) | 0 (0.0%) |
| $25,000 to $34,999 | 0 (0.0%) | 0 (0.0%) |
| $35,000 to $49,999 | 0 (0.0%) | 0 (0.0%) |
| $50,000 to $74,999 | 0 (0.0%) | 0 (0.0%) |
| $75,000 to $99,999 | 0 (0.0%) | 0 (0.0%) |
| $100,000 to $149,999 | 0 (0.0%) | 0 (0.0%) |
| $150,000 or more | 0 (0.0%) | 0 (0.0%) |
| Total | 0 (0.0%) | 0 (0.0%) |
Property Value to Household Income Ratio in Vandenberg AFB
| Value-to-Income Ratio | Without Mortgage | With Mortgage |
| Less than 2.0x | 0 (0.0%) | 0 (0.0%) |
| 2.0x to 2.9x | 0 (0.0%) | 0 (0.0%) |
| 3.0x to 3.9x | 0 (0.0%) | 0 (0.0%) |
| 4.0x or more | 0 (0.0%) | 0 (0.0%) |
| Total | 0 (0.0%) | 0 (0.0%) |
Real Estate Taxes by Mortgage Status in Vandenberg AFB
| Property Taxes | Without Mortgage | With Mortgage |
| Less than $800 | 0 (0.0%) | 0 (0.0%) |
| $800 to $1,499 | 0 (0.0%) | 0 (0.0%) |
| $800 to $1,499 | 0 (0.0%) | 0 (0.0%) |
| Total | 0 (0.0%) | 0 (0.0%) |
Health & Disability in Vandenberg AFB
Health Insurance Coverage by Age in Vandenberg AFB
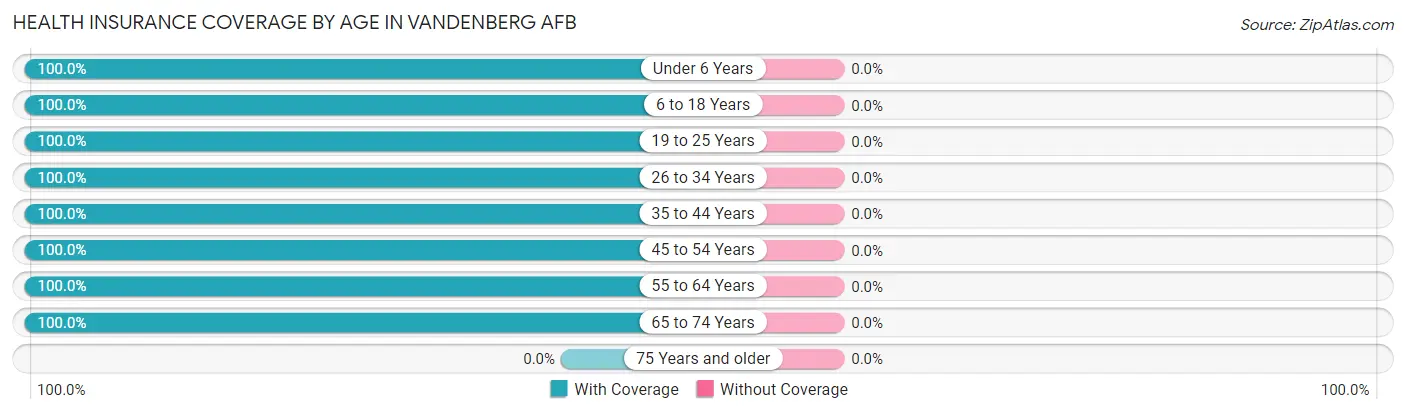
| Age Bracket | With Coverage | Without Coverage |
| Under 6 Years | 487 (100.0%) | 0 (0.0%) |
| 6 to 18 Years | 595 (100.0%) | 0 (0.0%) |
| 19 to 25 Years | 330 (100.0%) | 0 (0.0%) |
| 26 to 34 Years | 577 (100.0%) | 0 (0.0%) |
| 35 to 44 Years | 220 (100.0%) | 0 (0.0%) |
| 45 to 54 Years | 47 (100.0%) | 0 (0.0%) |
| 55 to 64 Years | 14 (100.0%) | 0 (0.0%) |
| 65 to 74 Years | 10 (100.0%) | 0 (0.0%) |
| 75 Years and older | 0 (0.0%) | 0 (0.0%) |
| Total | 2,280 (100.0%) | 0 (0.0%) |
Health Insurance Coverage by Citizenship Status in Vandenberg AFB
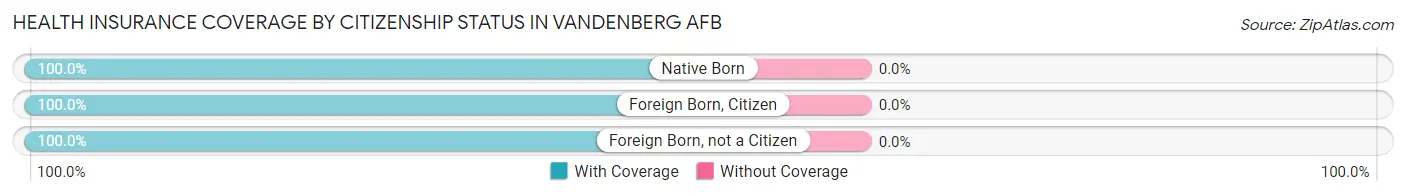
| Citizenship Status | With Coverage | Without Coverage |
| Native Born | 487 (100.0%) | 0 (0.0%) |
| Foreign Born, Citizen | 595 (100.0%) | 0 (0.0%) |
| Foreign Born, not a Citizen | 330 (100.0%) | 0 (0.0%) |
Health Insurance Coverage by Household Income in Vandenberg AFB
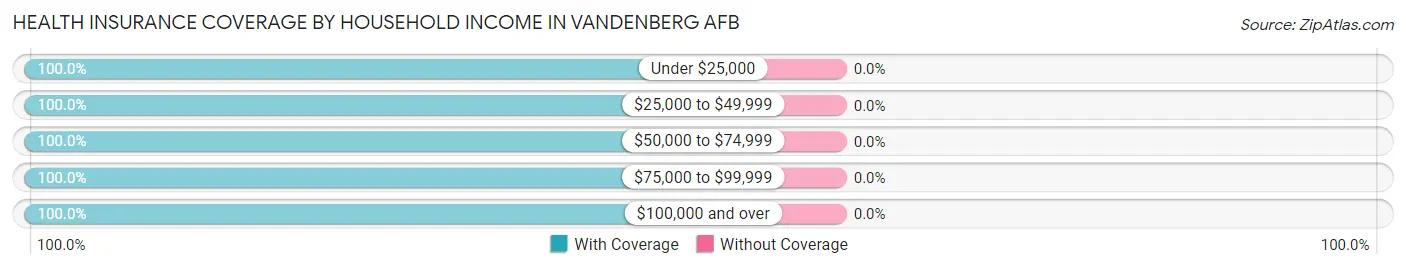
| Household Income | With Coverage | Without Coverage |
| Under $25,000 | 28 (100.0%) | 0 (0.0%) |
| $25,000 to $49,999 | 580 (100.0%) | 0 (0.0%) |
| $50,000 to $74,999 | 312 (100.0%) | 0 (0.0%) |
| $75,000 to $99,999 | 637 (100.0%) | 0 (0.0%) |
| $100,000 and over | 723 (100.0%) | 0 (0.0%) |
Public vs Private Health Insurance Coverage by Age in Vandenberg AFB
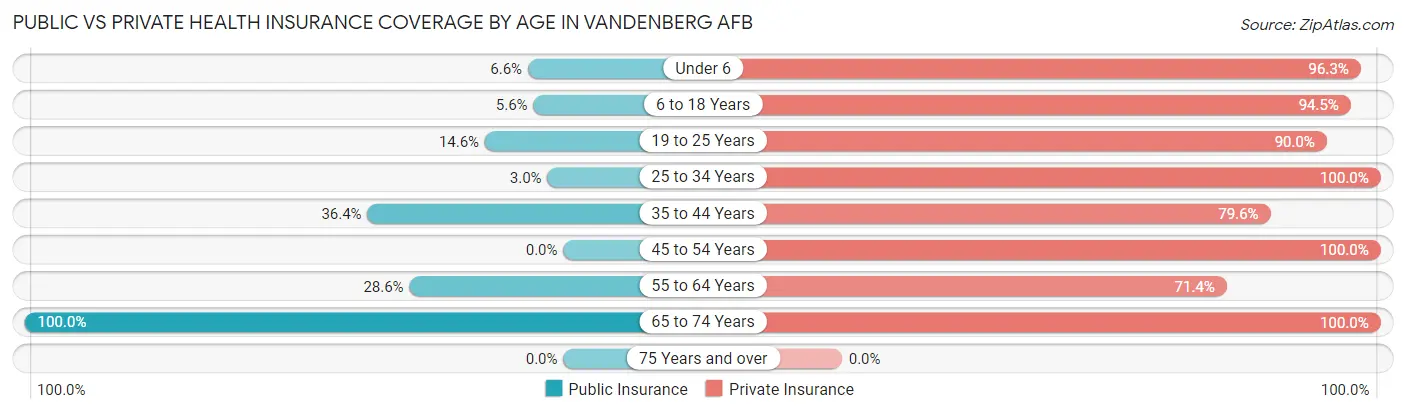
| Age Bracket | Public Insurance | Private Insurance |
| Under 6 | 32 (6.6%) | 469 (96.3%) |
| 6 to 18 Years | 33 (5.6%) | 562 (94.5%) |
| 19 to 25 Years | 48 (14.5%) | 297 (90.0%) |
| 25 to 34 Years | 17 (2.9%) | 577 (100.0%) |
| 35 to 44 Years | 80 (36.4%) | 175 (79.5%) |
| 45 to 54 Years | 0 (0.0%) | 47 (100.0%) |
| 55 to 64 Years | 4 (28.6%) | 10 (71.4%) |
| 65 to 74 Years | 10 (100.0%) | 10 (100.0%) |
| 75 Years and over | 0 (0.0%) | 0 (0.0%) |
| Total | 224 (9.8%) | 2,147 (94.2%) |
Disability Status by Sex by Age in Vandenberg AFB
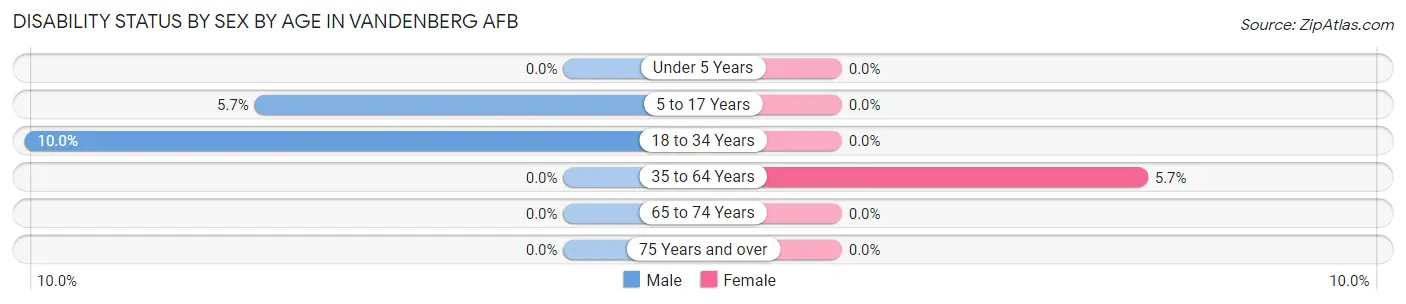
| Age Bracket | Male | Female |
| Under 5 Years | 0 (0.0%) | 0 (0.0%) |
| 5 to 17 Years | 18 (5.7%) | 0 (0.0%) |
| 18 to 34 Years | 23 (10.0%) | 0 (0.0%) |
| 35 to 64 Years | 0 (0.0%) | 13 (5.7%) |
| 65 to 74 Years | 0 (0.0%) | 0 (0.0%) |
| 75 Years and over | 0 (0.0%) | 0 (0.0%) |
Disability Class by Sex by Age in Vandenberg AFB
Disability Class: Hearing Difficulty
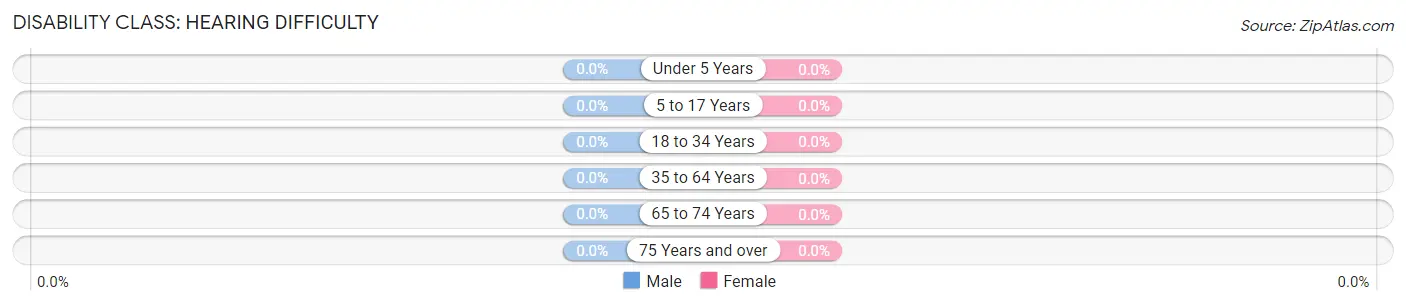
| Age Bracket | Male | Female |
| Under 5 Years | 0 (0.0%) | 0 (0.0%) |
| 5 to 17 Years | 0 (0.0%) | 0 (0.0%) |
| 18 to 34 Years | 0 (0.0%) | 0 (0.0%) |
| 35 to 64 Years | 0 (0.0%) | 0 (0.0%) |
| 65 to 74 Years | 0 (0.0%) | 0 (0.0%) |
| 75 Years and over | 0 (0.0%) | 0 (0.0%) |
Disability Class: Vision Difficulty
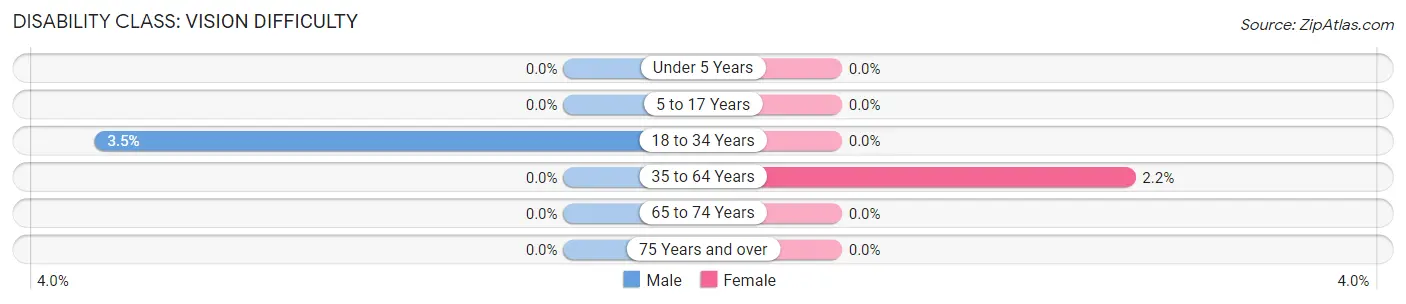
| Age Bracket | Male | Female |
| Under 5 Years | 0 (0.0%) | 0 (0.0%) |
| 5 to 17 Years | 0 (0.0%) | 0 (0.0%) |
| 18 to 34 Years | 8 (3.5%) | 0 (0.0%) |
| 35 to 64 Years | 0 (0.0%) | 5 (2.2%) |
| 65 to 74 Years | 0 (0.0%) | 0 (0.0%) |
| 75 Years and over | 0 (0.0%) | 0 (0.0%) |
Disability Class: Cognitive Difficulty
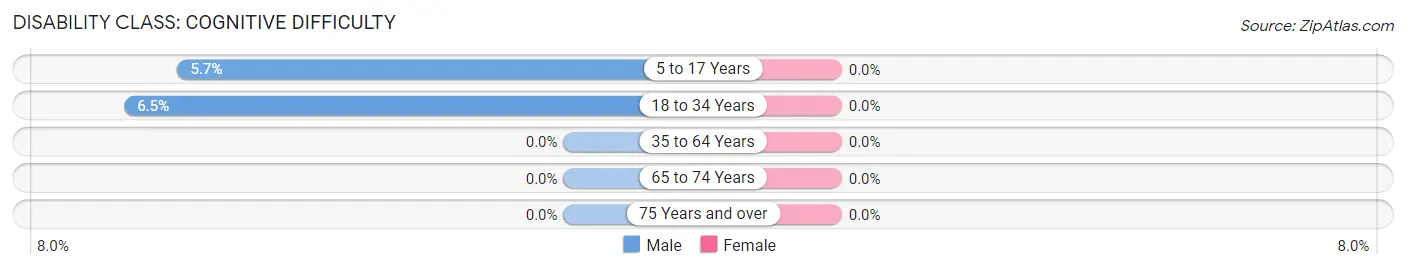
| Age Bracket | Male | Female |
| 5 to 17 Years | 18 (5.7%) | 0 (0.0%) |
| 18 to 34 Years | 15 (6.5%) | 0 (0.0%) |
| 35 to 64 Years | 0 (0.0%) | 0 (0.0%) |
| 65 to 74 Years | 0 (0.0%) | 0 (0.0%) |
| 75 Years and over | 0 (0.0%) | 0 (0.0%) |
Disability Class: Ambulatory Difficulty
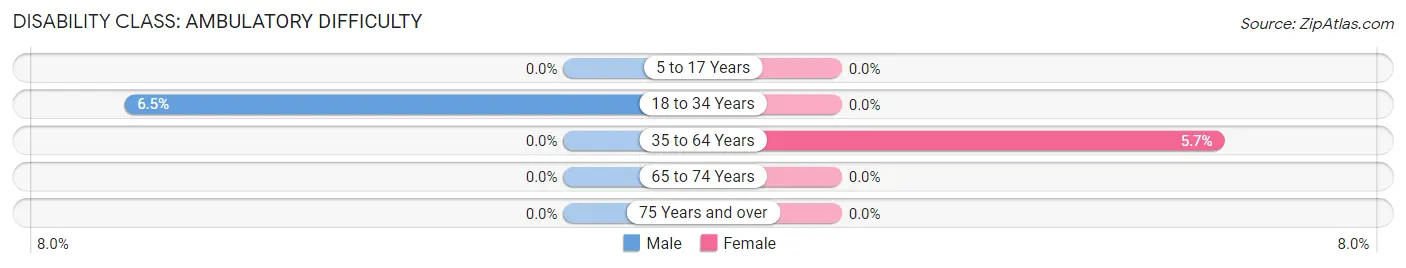
| Age Bracket | Male | Female |
| 5 to 17 Years | 0 (0.0%) | 0 (0.0%) |
| 18 to 34 Years | 15 (6.5%) | 0 (0.0%) |
| 35 to 64 Years | 0 (0.0%) | 13 (5.7%) |
| 65 to 74 Years | 0 (0.0%) | 0 (0.0%) |
| 75 Years and over | 0 (0.0%) | 0 (0.0%) |
Disability Class: Self-Care Difficulty
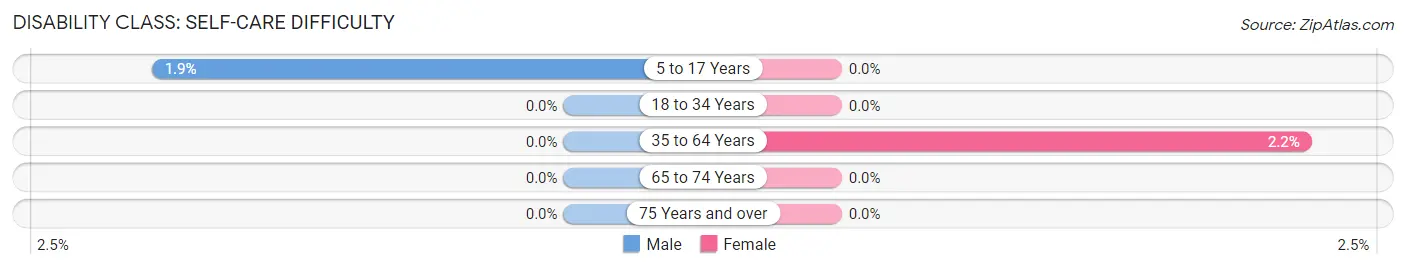
| Age Bracket | Male | Female |
| 5 to 17 Years | 6 (1.9%) | 0 (0.0%) |
| 18 to 34 Years | 0 (0.0%) | 0 (0.0%) |
| 35 to 64 Years | 0 (0.0%) | 5 (2.2%) |
| 65 to 74 Years | 0 (0.0%) | 0 (0.0%) |
| 75 Years and over | 0 (0.0%) | 0 (0.0%) |
Technology Access in Vandenberg AFB
Computing Device Access in Vandenberg AFB
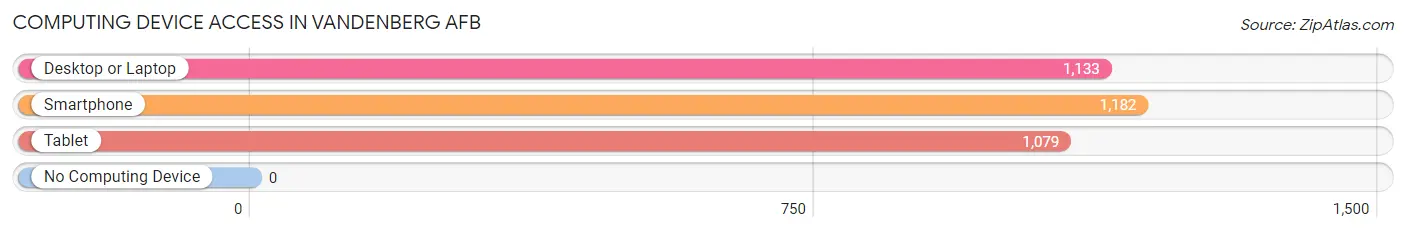
| Device Type | # Households | % Households |
| Desktop or Laptop | 1,133 | 95.2% |
| Smartphone | 1,182 | 99.3% |
| Tablet | 1,079 | 90.7% |
| No Computing Device | 0 | 0.0% |
| Total | 1,190 | 100.0% |
Internet Access in Vandenberg AFB
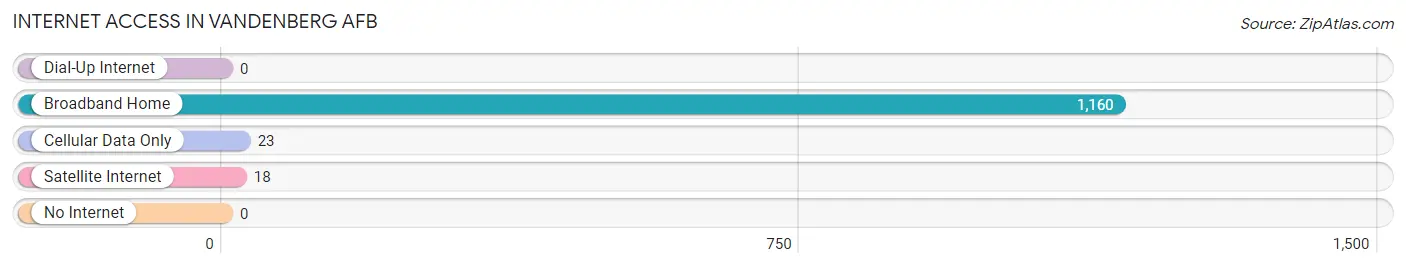
| Internet Type | # Households | % Households |
| Dial-Up Internet | 0 | 0.0% |
| Broadband Home | 1,160 | 97.5% |
| Cellular Data Only | 23 | 1.9% |
| Satellite Internet | 18 | 1.5% |
| No Internet | 0 | 0.0% |
| Total | 1,190 | 100.0% |
Vandenberg AFB Summary
Vandenberg Air Force Base (VAFB) is a United States Air Force Base located in Santa Barbara County, California. It is the only military installation in the United States specifically dedicated to launching intercontinental ballistic missiles (ICBMs) and space launch vehicles. The base is home to the 30th Space Wing, the 14th Air Force, and the Western Range.
History
Vandenberg Air Force Base was originally established in 1941 as Camp Cooke, a training facility for the United States Army. In 1948, the base was renamed Vandenberg Air Force Base in honor of General Hoyt S. Vandenberg, the second Chief of Staff of the United States Air Force. During the Cold War, the base was used to launch ICBMs and other military satellites. In the late 1990s, the base was converted to a space launch facility, and has since been used to launch numerous satellites and space probes.
Geography
Vandenberg Air Force Base is located in Santa Barbara County, California, approximately 130 miles northwest of Los Angeles. The base covers an area of approximately 98,000 acres, and is bordered by the Pacific Ocean to the west, the Santa Ynez Mountains to the east, and the Los Padres National Forest to the north. The base is located in a semi-arid climate, with temperatures ranging from the mid-50s to the mid-90s in the summer months.
Economy
Vandenberg Air Force Base is a major economic driver for the region, providing jobs and economic activity to the surrounding communities. The base is home to more than 6,000 military personnel and civilian employees, and is the largest employer in Santa Barbara County. The base also supports a number of businesses and contractors, providing goods and services to the base and its personnel.
Demographics
As of the 2010 census, the population of Vandenberg Air Force Base was 8,945. The racial makeup of the base was 79.3% White, 8.2% African American, 4.2% Asian, 0.7% Native American, 0.2% Pacific Islander, and 6.4% from other races. The median household income was $50,945, and the median family income was $60,945.
Conclusion
Vandenberg Air Force Base is a major military installation in Santa Barbara County, California. The base is home to the 30th Space Wing, the 14th Air Force, and the Western Range, and is used to launch ICBMs and space launch vehicles. The base is a major economic driver for the region, providing jobs and economic activity to the surrounding communities. As of the 2010 census, the population of Vandenberg Air Force Base was 8,945, with a median household income of $50,945.
Common Questions
What is the Total Population of Vandenberg AFB?
Total Population of Vandenberg AFB is 3,681.
What is the Total Male Population of Vandenberg AFB?
Total Male Population of Vandenberg AFB is 1,915.
What is the Total Female Population of Vandenberg AFB?
Total Female Population of Vandenberg AFB is 1,766.
What is the Ratio of Males per 100 Females in Vandenberg AFB?
There are 108.44 Males per 100 Females in Vandenberg AFB.
What is the Ratio of Females per 100 Males in Vandenberg AFB?
There are 92.22 Females per 100 Males in Vandenberg AFB.
What is the Median Population Age in Vandenberg AFB?
Median Population Age in Vandenberg AFB is 24.4 Years.
What is the Average Family Size in Vandenberg AFB
Average Family Size in Vandenberg AFB is 3.0 People.
What is the Average Household Size in Vandenberg AFB
Average Household Size in Vandenberg AFB is 2.8 People.
What is Per Capita Income in Vandenberg AFB?
Per Capita income in Vandenberg AFB is $28,326.
What is the Median Family Income in Vandenberg AFB?
Median Family Income in Vandenberg AFB is $69,847.
What is the Median Household income in Vandenberg AFB?
Median Household Income in Vandenberg AFB is $69,031.
What is Income or Wage Gap in Vandenberg AFB?
Income or Wage Gap in Vandenberg AFB is 48.7%.
Women in Vandenberg AFB earn 51.3 cents for every dollar earned by a man.
What is Family Income Deficit in Vandenberg AFB?
Family Income Deficit in Vandenberg AFB is $11,113.
Families that are below poverty line in Vandenberg AFB earn $11,113 less on average than the poverty threshold level.
What is Inequality or Gini Index in Vandenberg AFB?
Inequality or Gini Index in Vandenberg AFB is 0.30.
How Large is the Labor Force in Vandenberg AFB?
There are 2,096 People in the Labor Forcein in Vandenberg AFB.
What is the Percentage of People in the Labor Force in Vandenberg AFB?
80.0% of People are in the Labor Force in Vandenberg AFB.
What is the Unemployment Rate in Vandenberg AFB?
Unemployment Rate in Vandenberg AFB is 11.4%.