Shafter, CA
Shafter Map
Shafter Overview
20,162
TOTAL POPULATION
9,985
MALE POPULATION
10,177
FEMALE POPULATION
98.11
MALES / 100 FEMALES
101.92
FEMALES / 100 MALES
27.4
MEDIAN AGE
4.1
AVG FAMILY SIZE
3.8
AVG HOUSEHOLD SIZE
$20,708
PER CAPITA INCOME
$64,891
AVG FAMILY INCOME
$66,418
AVG HOUSEHOLD INCOME
28.1%
WAGE / INCOME GAP [ % ]
71.9¢/ $1
WAGE / INCOME GAP [ $ ]
$10,343
FAMILY INCOME DEFICIT
0.40
INEQUALITY / GINI INDEX
8,703
LABOR FORCE [ PEOPLE ]
61.0%
PERCENT IN LABOR FORCE
7.1%
UNEMPLOYMENT RATE
Shafter Zip Codes
Shafter Area Codes
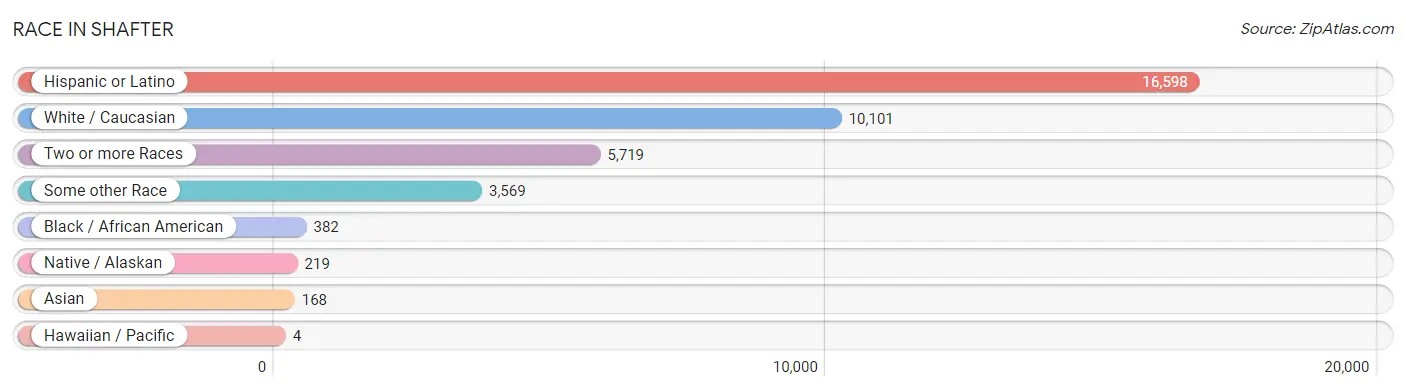
Race in Shafter
The most populous races in Shafter are Hispanic or Latino (16,598 | 82.3%), White / Caucasian (10,101 | 50.1%), and Two or more Races (5,719 | 28.4%).
| Race | # Population | % Population |
| Asian | 168 | 0.8% |
| Black / African American | 382 | 1.9% |
| Hawaiian / Pacific | 4 | 0.0% |
| Hispanic or Latino | 16,598 | 82.3% |
| Native / Alaskan | 219 | 1.1% |
| White / Caucasian | 10,101 | 50.1% |
| Two or more Races | 5,719 | 28.4% |
| Some other Race | 3,569 | 17.7% |
| Total | 20,162 | 100.0% |
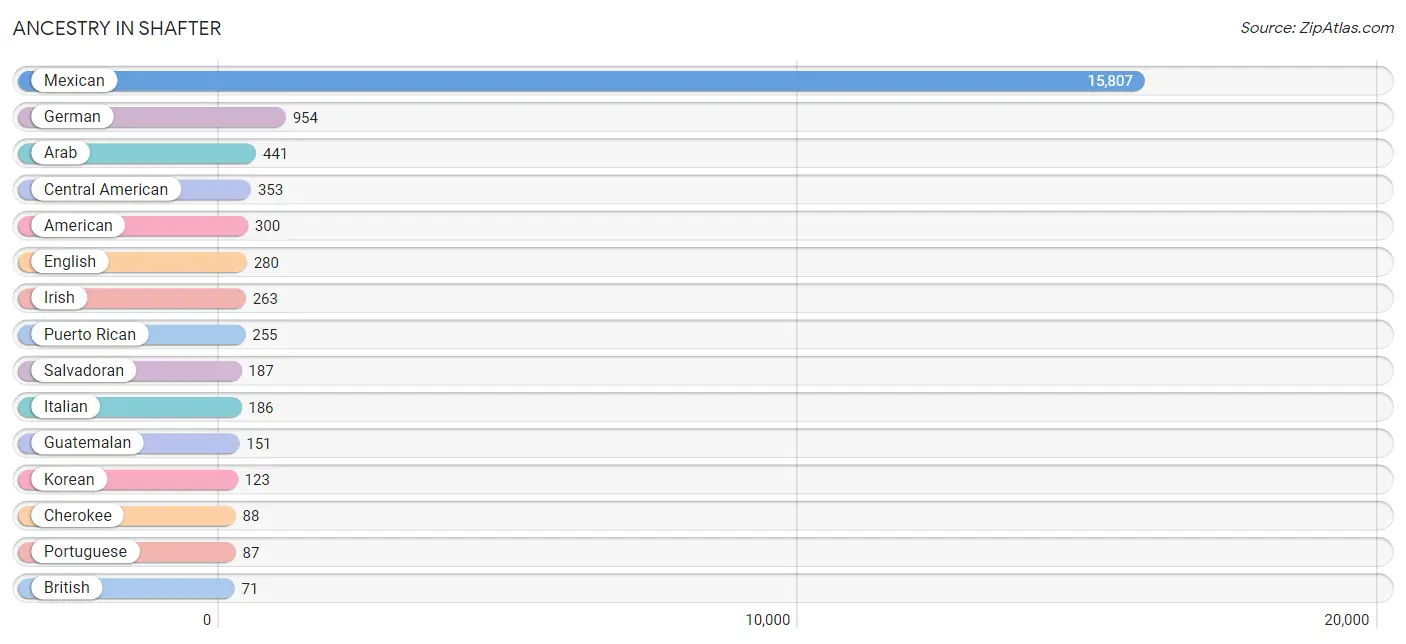
Ancestry in Shafter
The most populous ancestries reported in Shafter are Mexican (15,807 | 78.4%), German (954 | 4.7%), Arab (441 | 2.2%), Central American (353 | 1.8%), and American (300 | 1.5%), together accounting for 88.6% of all Shafter residents.
| Ancestry | # Population | % Population |
| American | 300 | 1.5% |
| Apache | 5 | 0.0% |
| Arab | 441 | 2.2% |
| Bhutanese | 17 | 0.1% |
| British | 71 | 0.4% |
| Burmese | 7 | 0.0% |
| Central American | 353 | 1.8% |
| Central American Indian | 65 | 0.3% |
| Cherokee | 88 | 0.4% |
| Chickasaw | 25 | 0.1% |
| Choctaw | 27 | 0.1% |
| Comanche | 6 | 0.0% |
| Costa Rican | 15 | 0.1% |
| Croatian | 6 | 0.0% |
| Danish | 19 | 0.1% |
| Dutch | 68 | 0.3% |
| English | 280 | 1.4% |
| European | 68 | 0.3% |
| French | 56 | 0.3% |
| German | 954 | 4.7% |
| Guatemalan | 151 | 0.7% |
| Iranian | 12 | 0.1% |
| Irish | 263 | 1.3% |
| Italian | 186 | 0.9% |
| Japanese | 13 | 0.1% |
| Korean | 123 | 0.6% |
| Mexican | 15,807 | 78.4% |
| Native Hawaiian | 4 | 0.0% |
| New Zealander | 20 | 0.1% |
| Northern European | 12 | 0.1% |
| Norwegian | 21 | 0.1% |
| Polish | 12 | 0.1% |
| Portuguese | 87 | 0.4% |
| Pueblo | 59 | 0.3% |
| Puerto Rican | 255 | 1.3% |
| Salvadoran | 187 | 0.9% |
| Scandinavian | 6 | 0.0% |
| Scotch-Irish | 11 | 0.1% |
| Scottish | 37 | 0.2% |
| Sioux | 6 | 0.0% |
| Spaniard | 23 | 0.1% |
| Spanish | 22 | 0.1% |
| Spanish American Indian | 36 | 0.2% |
| Sri Lankan | 8 | 0.0% |
| Swedish | 26 | 0.1% |
| Swiss | 5 | 0.0% |
| Welsh | 15 | 0.1% |
| Yaqui | 5 | 0.0% | View All 48 Rows |
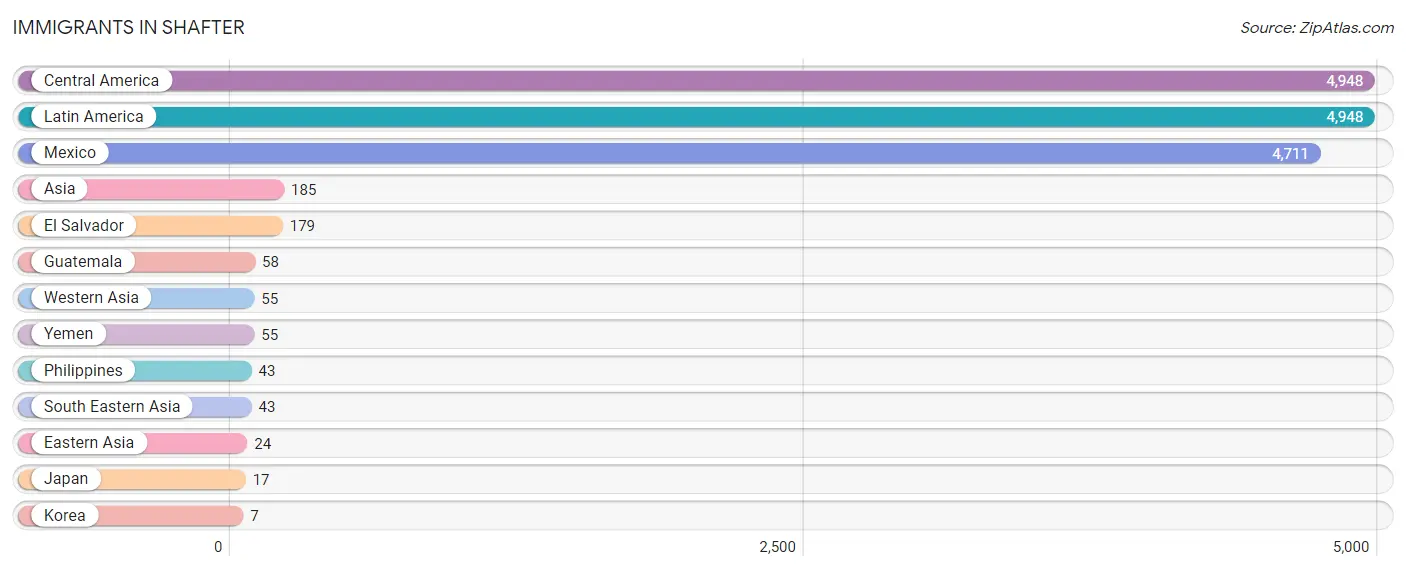
Immigrants in Shafter
The most numerous immigrant groups reported in Shafter came from Central America (4,948 | 24.5%), Latin America (4,948 | 24.5%), Mexico (4,711 | 23.4%), Asia (185 | 0.9%), and El Salvador (179 | 0.9%), together accounting for 74.3% of all Shafter residents.
| Immigration Origin | # Population | % Population |
| Asia | 185 | 0.9% |
| Central America | 4,948 | 24.5% |
| Eastern Asia | 24 | 0.1% |
| El Salvador | 179 | 0.9% |
| Guatemala | 58 | 0.3% |
| Japan | 17 | 0.1% |
| Korea | 7 | 0.0% |
| Latin America | 4,948 | 24.5% |
| Mexico | 4,711 | 23.4% |
| Philippines | 43 | 0.2% |
| South Eastern Asia | 43 | 0.2% |
| Western Asia | 55 | 0.3% |
| Yemen | 55 | 0.3% | View All 13 Rows |
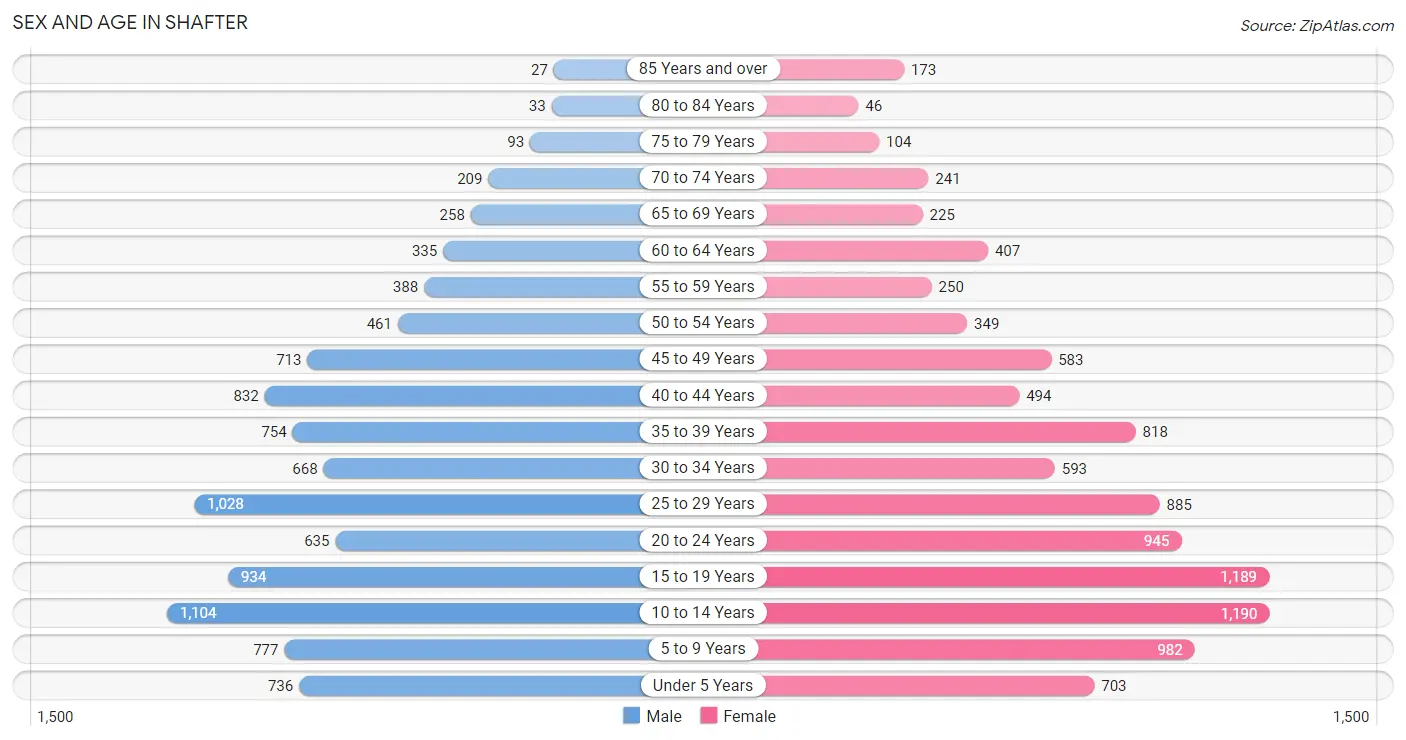
Sex and Age in Shafter
Sex and Age in Shafter
The most populous age groups in Shafter are 10 to 14 Years (1,104 | 11.1%) for men and 10 to 14 Years (1,190 | 11.7%) for women.
| Age Bracket | Male | Female |
| Under 5 Years | 736 (7.4%) | 703 (6.9%) |
| 5 to 9 Years | 777 (7.8%) | 982 (9.7%) |
| 10 to 14 Years | 1,104 (11.1%) | 1,190 (11.7%) |
| 15 to 19 Years | 934 (9.3%) | 1,189 (11.7%) |
| 20 to 24 Years | 635 (6.4%) | 945 (9.3%) |
| 25 to 29 Years | 1,028 (10.3%) | 885 (8.7%) |
| 30 to 34 Years | 668 (6.7%) | 593 (5.8%) |
| 35 to 39 Years | 754 (7.5%) | 818 (8.0%) |
| 40 to 44 Years | 832 (8.3%) | 494 (4.9%) |
| 45 to 49 Years | 713 (7.1%) | 583 (5.7%) |
| 50 to 54 Years | 461 (4.6%) | 349 (3.4%) |
| 55 to 59 Years | 388 (3.9%) | 250 (2.5%) |
| 60 to 64 Years | 335 (3.4%) | 407 (4.0%) |
| 65 to 69 Years | 258 (2.6%) | 225 (2.2%) |
| 70 to 74 Years | 209 (2.1%) | 241 (2.4%) |
| 75 to 79 Years | 93 (0.9%) | 104 (1.0%) |
| 80 to 84 Years | 33 (0.3%) | 46 (0.4%) |
| 85 Years and over | 27 (0.3%) | 173 (1.7%) |
| Total | 9,985 (100.0%) | 10,177 (100.0%) |
Families and Households in Shafter
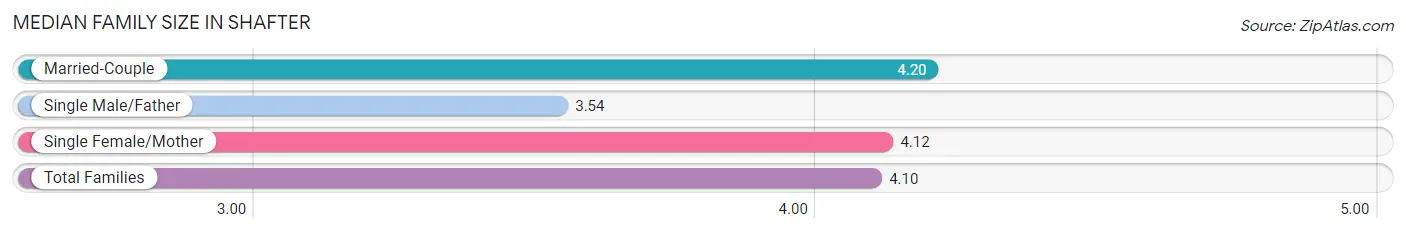
Median Family Size in Shafter
The median family size in Shafter is 4.10 persons per family, with married-couple families (2,954 | 68.7%) accounting for the largest median family size of 4.2 persons per family. On the other hand, single male/father families (550 | 12.8%) represent the smallest median family size with 3.54 persons per family.
| Family Type | # Families | Family Size |
| Married-Couple | 2,954 (68.7%) | 4.20 |
| Single Male/Father | 550 (12.8%) | 3.54 |
| Single Female/Mother | 796 (18.5%) | 4.12 |
| Total Families | 4,300 (100.0%) | 4.10 |
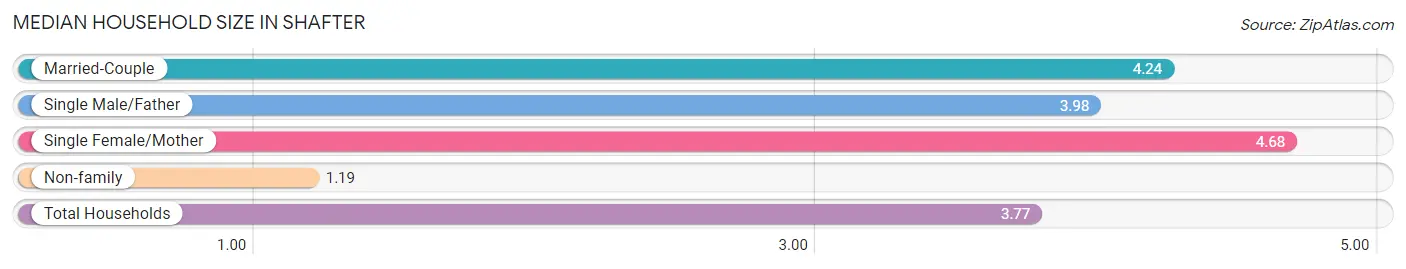
Median Household Size in Shafter
The median household size in Shafter is 3.77 persons per household, with single female/mother households (796 | 15.4%) accounting for the largest median household size of 4.68 persons per household. non-family households (858 | 16.6%) represent the smallest median household size with 1.19 persons per household.
| Household Type | # Households | Household Size |
| Married-Couple | 2,954 (57.3%) | 4.24 |
| Single Male/Father | 550 (10.7%) | 3.98 |
| Single Female/Mother | 796 (15.4%) | 4.68 |
| Non-family | 858 (16.6%) | 1.19 |
| Total Households | 5,158 (100.0%) | 3.77 |
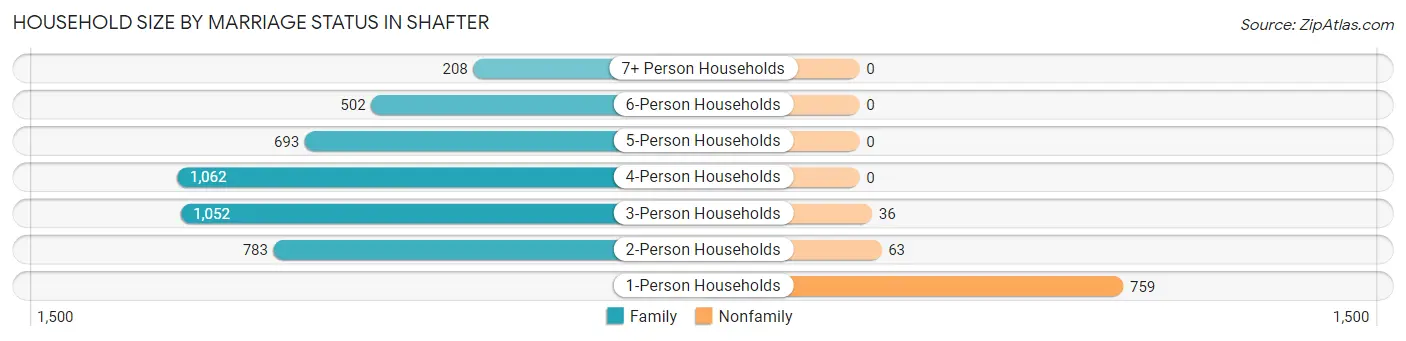
Household Size by Marriage Status in Shafter
Out of a total of 5,158 households in Shafter, 4,300 (83.4%) are family households, while 858 (16.6%) are nonfamily households. The most numerous type of family households are 4-person households, comprising 1,062, and the most common type of nonfamily households are 1-person households, comprising 759.
| Household Size | Family Households | Nonfamily Households |
| 1-Person Households | - | 759 (14.7%) |
| 2-Person Households | 783 (15.2%) | 63 (1.2%) |
| 3-Person Households | 1,052 (20.4%) | 36 (0.7%) |
| 4-Person Households | 1,062 (20.6%) | 0 (0.0%) |
| 5-Person Households | 693 (13.4%) | 0 (0.0%) |
| 6-Person Households | 502 (9.7%) | 0 (0.0%) |
| 7+ Person Households | 208 (4.0%) | 0 (0.0%) |
| Total | 4,300 (83.4%) | 858 (16.6%) |
Female Fertility in Shafter
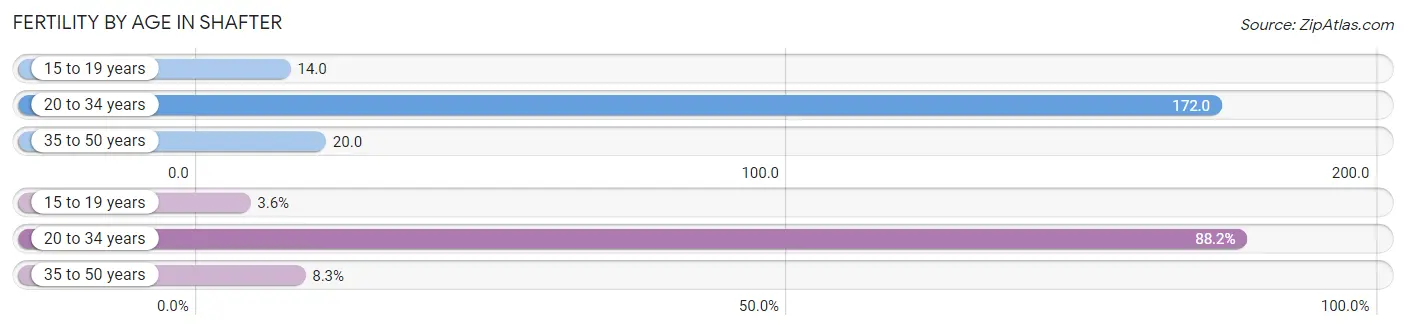
Fertility by Age in Shafter
Average fertility rate in Shafter is 85.0 births per 1,000 women. Women in the age bracket of 20 to 34 years have the highest fertility rate with 172.0 births per 1,000 women. Women in the age bracket of 20 to 34 years acount for 88.2% of all women with births.
| Age Bracket | Women with Births | Births / 1,000 Women |
| 15 to 19 years | 17 (3.6%) | 14.0 |
| 20 to 34 years | 417 (88.2%) | 172.0 |
| 35 to 50 years | 39 (8.3%) | 20.0 |
| Total | 473 (100.0%) | 85.0 |
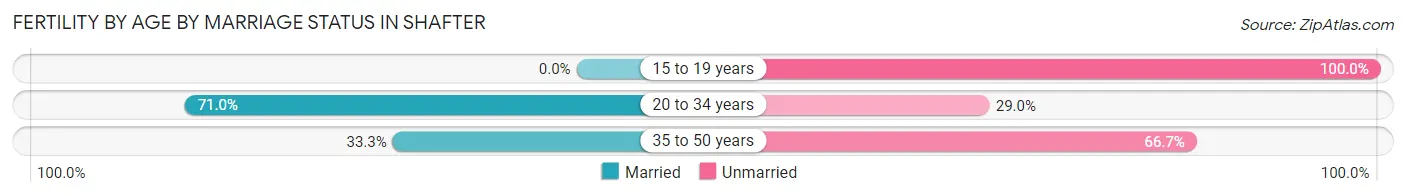
Fertility by Age by Marriage Status in Shafter
65.3% of women with births (473) in Shafter are married. The highest percentage of unmarried women with births falls into 15 to 19 years age bracket with 100.0% of them unmarried at the time of birth, while the lowest percentage of unmarried women with births belong to 20 to 34 years age bracket with 29.0% of them unmarried.
| Age Bracket | Married | Unmarried |
| 15 to 19 years | 0 (0.0%) | 17 (100.0%) |
| 20 to 34 years | 296 (71.0%) | 121 (29.0%) |
| 35 to 50 years | 13 (33.3%) | 26 (66.7%) |
| Total | 309 (65.3%) | 164 (34.7%) |
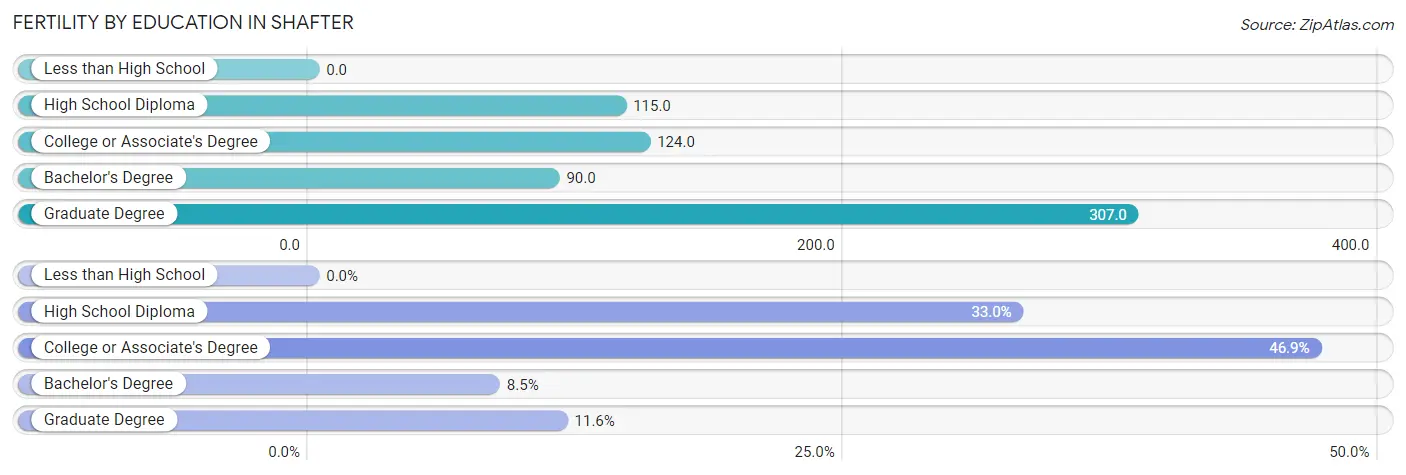
Fertility by Education in Shafter
| Educational Attainment | Women with Births | Births / 1,000 Women |
| Less than High School | 0 (0.0%) | 0.0 |
| High School Diploma | 156 (33.0%) | 115.0 |
| College or Associate's Degree | 222 (46.9%) | 124.0 |
| Bachelor's Degree | 40 (8.5%) | 90.0 |
| Graduate Degree | 55 (11.6%) | 307.0 |
| Total | 473 (100.0%) | 85.0 |
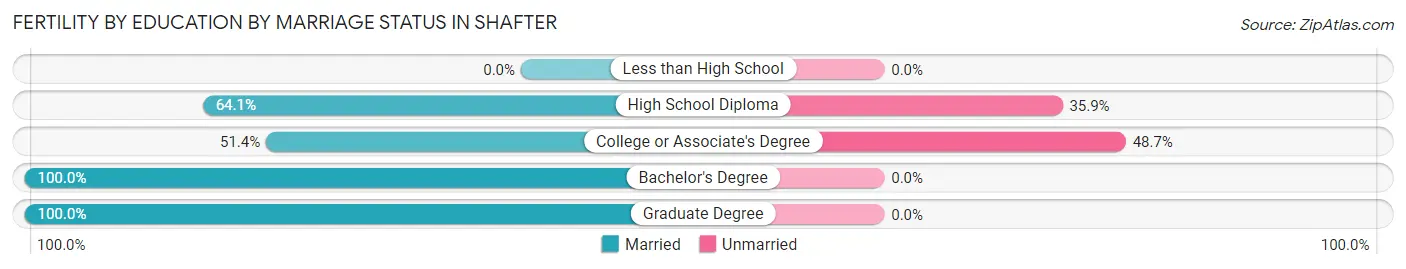
Fertility by Education by Marriage Status in Shafter
34.7% of women with births in Shafter are unmarried. Women with the educational attainment of bachelor's degree are most likely to be married with 100.0% of them married at childbirth, while women with the educational attainment of college or associate's degree are least likely to be married with 48.6% of them unmarried at childbirth.
| Educational Attainment | Married | Unmarried |
| Less than High School | 0 (0.0%) | 0 (0.0%) |
| High School Diploma | 100 (64.1%) | 56 (35.9%) |
| College or Associate's Degree | 114 (51.3%) | 108 (48.6%) |
| Bachelor's Degree | 40 (100.0%) | 0 (0.0%) |
| Graduate Degree | 55 (100.0%) | 0 (0.0%) |
| Total | 309 (65.3%) | 164 (34.7%) |
Income in Shafter
Income Overview in Shafter
Per Capita Income in Shafter is $20,708, while median incomes of families and households are $64,891 and $66,418 respectively.
| Characteristic | Number | Measure |
| Per Capita Income | 20,162 | $20,708 |
| Median Family Income | 4,300 | $64,891 |
| Mean Family Income | 4,300 | $79,508 |
| Median Household Income | 5,158 | $66,418 |
| Mean Household Income | 5,158 | $77,072 |
| Income Deficit | 4,300 | $10,343 |
| Wage / Income Gap (%) | 20,162 | 28.13% |
| Wage / Income Gap ($) | 20,162 | 71.87¢ per $1 |
| Gini / Inequality Index | 20,162 | 0.40 |
Earnings by Sex in Shafter
Average Earnings in Shafter are $31,631, $37,462 for men and $26,924 for women, a difference of 28.1%.
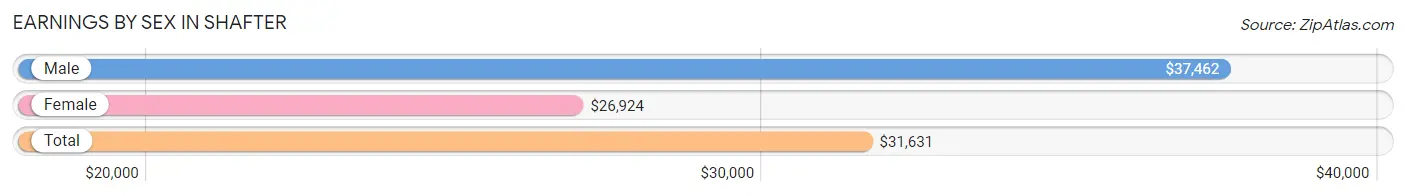
| Sex | Number | Average Earnings |
| Male | 5,066 (57.7%) | $37,462 |
| Female | 3,719 (42.3%) | $26,924 |
| Total | 8,785 (100.0%) | $31,631 |
Earnings by Sex by Income Bracket in Shafter
The most common earnings brackets in Shafter are $65,000 to $74,999 for men (570 | 11.3%) and $25,000 to $29,999 for women (460 | 12.4%).
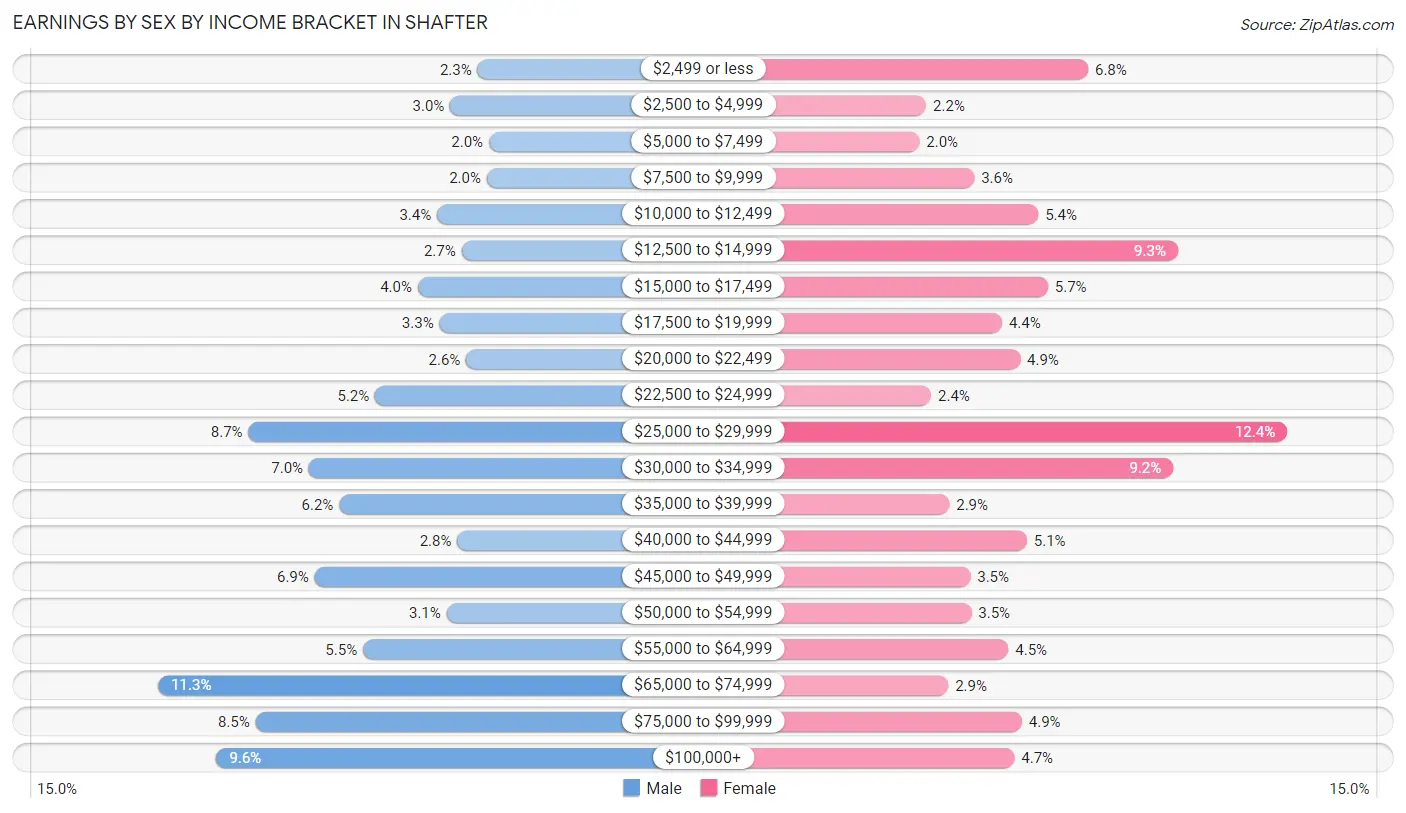
| Income | Male | Female |
| $2,499 or less | 115 (2.3%) | 252 (6.8%) |
| $2,500 to $4,999 | 154 (3.0%) | 83 (2.2%) |
| $5,000 to $7,499 | 99 (1.9%) | 76 (2.0%) |
| $7,500 to $9,999 | 102 (2.0%) | 133 (3.6%) |
| $10,000 to $12,499 | 173 (3.4%) | 200 (5.4%) |
| $12,500 to $14,999 | 138 (2.7%) | 346 (9.3%) |
| $15,000 to $17,499 | 200 (4.0%) | 210 (5.7%) |
| $17,500 to $19,999 | 169 (3.3%) | 162 (4.4%) |
| $20,000 to $22,499 | 131 (2.6%) | 181 (4.9%) |
| $22,500 to $24,999 | 261 (5.1%) | 88 (2.4%) |
| $25,000 to $29,999 | 441 (8.7%) | 460 (12.4%) |
| $30,000 to $34,999 | 355 (7.0%) | 341 (9.2%) |
| $35,000 to $39,999 | 312 (6.2%) | 107 (2.9%) |
| $40,000 to $44,999 | 144 (2.8%) | 188 (5.1%) |
| $45,000 to $49,999 | 347 (6.9%) | 129 (3.5%) |
| $50,000 to $54,999 | 159 (3.1%) | 130 (3.5%) |
| $55,000 to $64,999 | 278 (5.5%) | 169 (4.5%) |
| $65,000 to $74,999 | 570 (11.3%) | 106 (2.9%) |
| $75,000 to $99,999 | 431 (8.5%) | 183 (4.9%) |
| $100,000+ | 487 (9.6%) | 175 (4.7%) |
| Total | 5,066 (100.0%) | 3,719 (100.0%) |
Earnings by Sex by Educational Attainment in Shafter
Average earnings in Shafter are $46,004 for men and $29,661 for women, a difference of 35.5%. Men with an educational attainment of graduate degree enjoy the highest average annual earnings of $101,477, while those with less than high school education earn the least with $33,125. Women with an educational attainment of graduate degree earn the most with the average annual earnings of $66,667, while those with high school diploma education have the smallest earnings of $26,368.
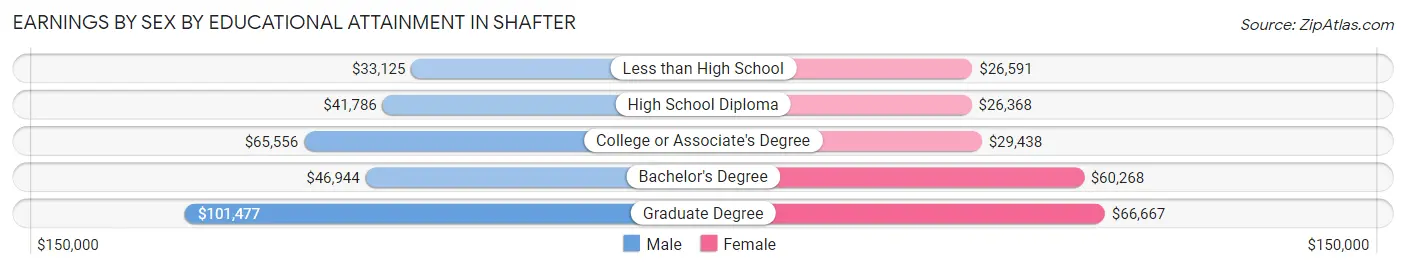
| Educational Attainment | Male Income | Female Income |
| Less than High School | $33,125 | $26,591 |
| High School Diploma | $41,786 | $26,368 |
| College or Associate's Degree | $65,556 | $29,438 |
| Bachelor's Degree | $46,944 | $60,268 |
| Graduate Degree | $101,477 | $66,667 |
| Total | $46,004 | $29,661 |
Family Income in Shafter
Family Income Brackets in Shafter
According to the Shafter family income data, there are 697 families falling into the $50,000 to $74,999 income range, which is the most common income bracket and makes up 16.2% of all families. Conversely, the $10,000 to $14,999 income bracket is the least frequent group with only 146 families (3.4%) belonging to this category.
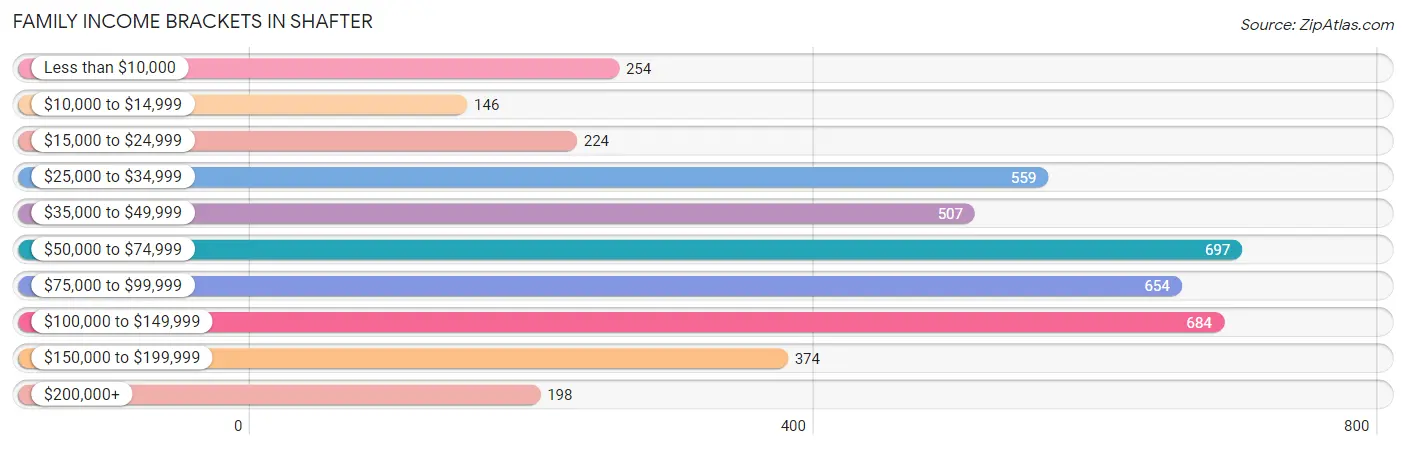
| Income Bracket | # Families | % Families |
| Less than $10,000 | 254 | 5.9% |
| $10,000 to $14,999 | 146 | 3.4% |
| $15,000 to $24,999 | 224 | 5.2% |
| $25,000 to $34,999 | 559 | 13.0% |
| $35,000 to $49,999 | 507 | 11.8% |
| $50,000 to $74,999 | 697 | 16.2% |
| $75,000 to $99,999 | 654 | 15.2% |
| $100,000 to $149,999 | 684 | 15.9% |
| $150,000 to $199,999 | 374 | 8.7% |
| $200,000+ | 198 | 4.6% |
Family Income by Famaliy Size in Shafter
4-person families (884 | 20.6%) account for the highest median family income in Shafter with $90,772 per family, while 2-person families (973 | 22.6%) have the highest median income of $22,786 per family member.
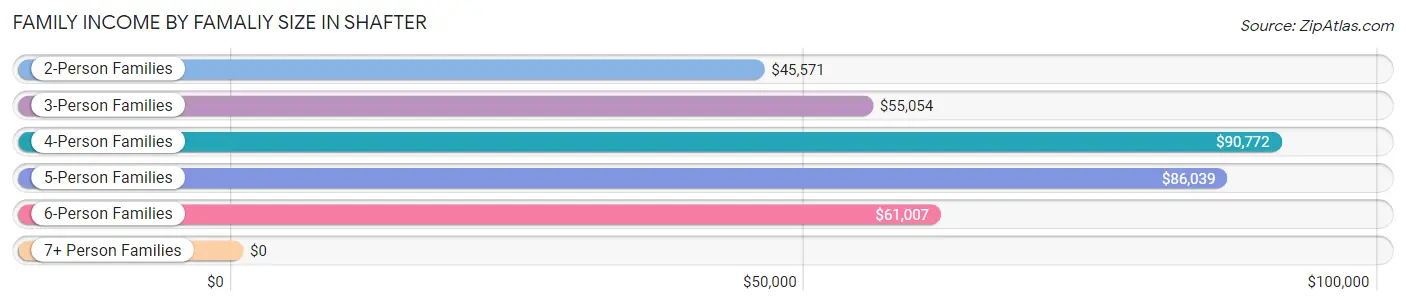
| Income Bracket | # Families | Median Income |
| 2-Person Families | 973 (22.6%) | $45,571 |
| 3-Person Families | 1,070 (24.9%) | $55,054 |
| 4-Person Families | 884 (20.6%) | $90,772 |
| 5-Person Families | 814 (18.9%) | $86,039 |
| 6-Person Families | 399 (9.3%) | $61,007 |
| 7+ Person Families | 160 (3.7%) | $0 |
| Total | 4,300 (100.0%) | $64,891 |
Family Income by Number of Earners in Shafter
The median family income in Shafter is $64,891, with families comprising 3+ earners (810) having the highest median family income of $100,956, while families with no earners (503) have the lowest median family income of $14,375, accounting for 18.8% and 11.7% of families, respectively.
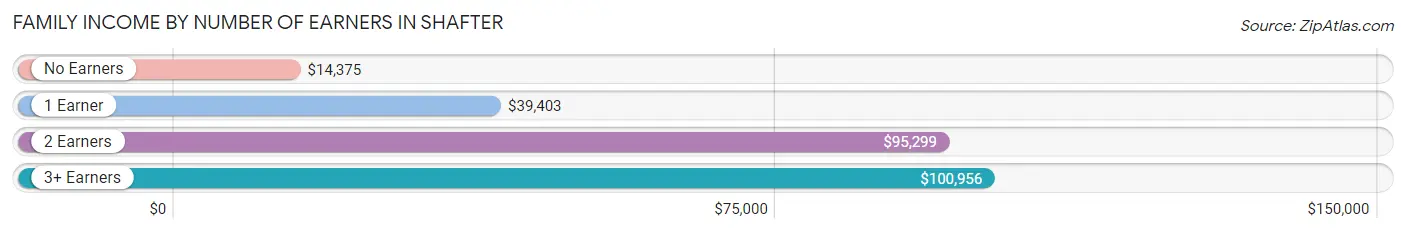
| Number of Earners | # Families | Median Income |
| No Earners | 503 (11.7%) | $14,375 |
| 1 Earner | 1,426 (33.2%) | $39,403 |
| 2 Earners | 1,561 (36.3%) | $95,299 |
| 3+ Earners | 810 (18.8%) | $100,956 |
| Total | 4,300 (100.0%) | $64,891 |
Household Income in Shafter
Household Income Brackets in Shafter
With 959 households falling in the category, the $50,000 to $74,999 income range is the most frequent in Shafter, accounting for 18.6% of all households. In contrast, only 211 households (4.1%) fall into the $200,000+ income bracket, making it the least populous group.
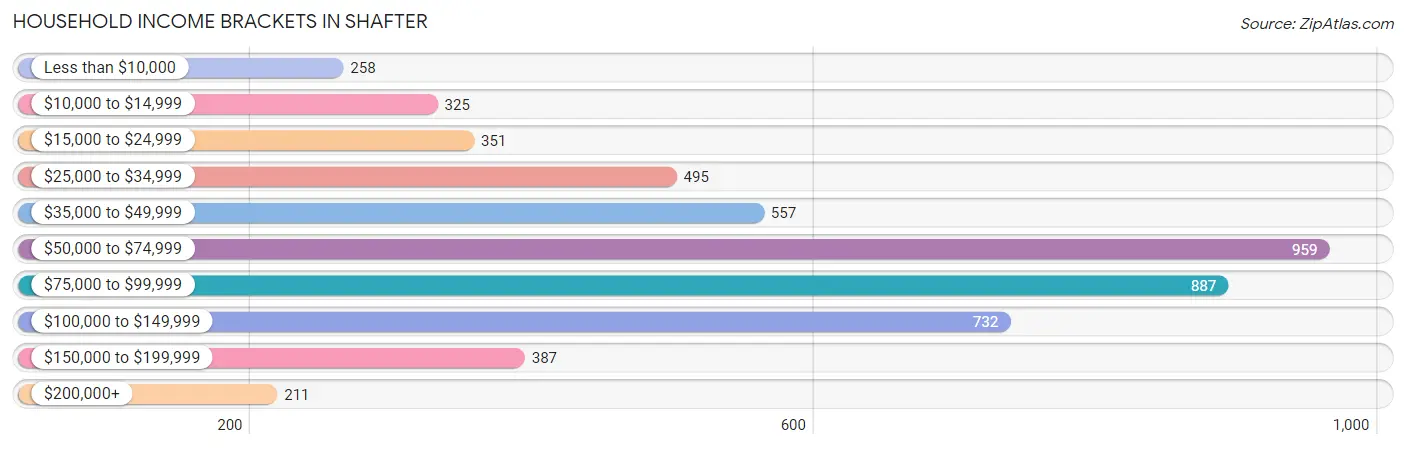
| Income Bracket | # Households | % Households |
| Less than $10,000 | 258 | 5.0% |
| $10,000 to $14,999 | 325 | 6.3% |
| $15,000 to $24,999 | 351 | 6.8% |
| $25,000 to $34,999 | 495 | 9.6% |
| $35,000 to $49,999 | 557 | 10.8% |
| $50,000 to $74,999 | 959 | 18.6% |
| $75,000 to $99,999 | 887 | 17.2% |
| $100,000 to $149,999 | 732 | 14.2% |
| $150,000 to $199,999 | 387 | 7.5% |
| $200,000+ | 211 | 4.1% |
Household Income by Householder Age in Shafter
The median household income in Shafter is $66,418, with the highest median household income of $80,833 found in the 25 to 44 years age bracket for the primary householder. A total of 2,412 households (46.8%) fall into this category. Meanwhile, the 15 to 24 years age bracket for the primary householder has the lowest median household income of $0, with 100 households (1.9%) in this group.
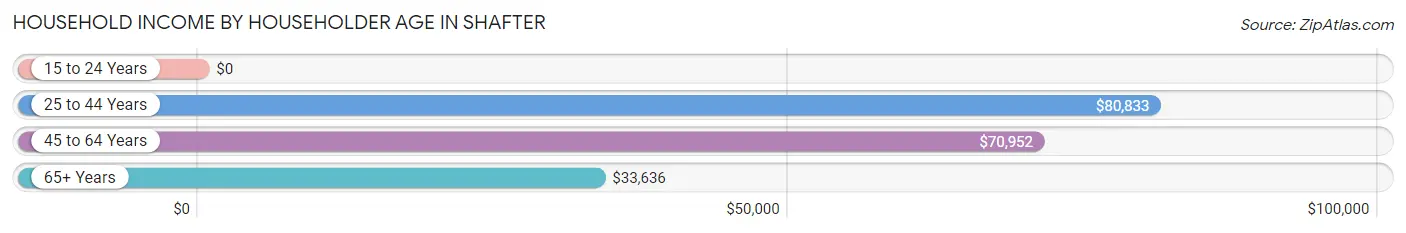
| Income Bracket | # Households | Median Income |
| 15 to 24 Years | 100 (1.9%) | $0 |
| 25 to 44 Years | 2,412 (46.8%) | $80,833 |
| 45 to 64 Years | 1,728 (33.5%) | $70,952 |
| 65+ Years | 918 (17.8%) | $33,636 |
| Total | 5,158 (100.0%) | $66,418 |
Poverty in Shafter
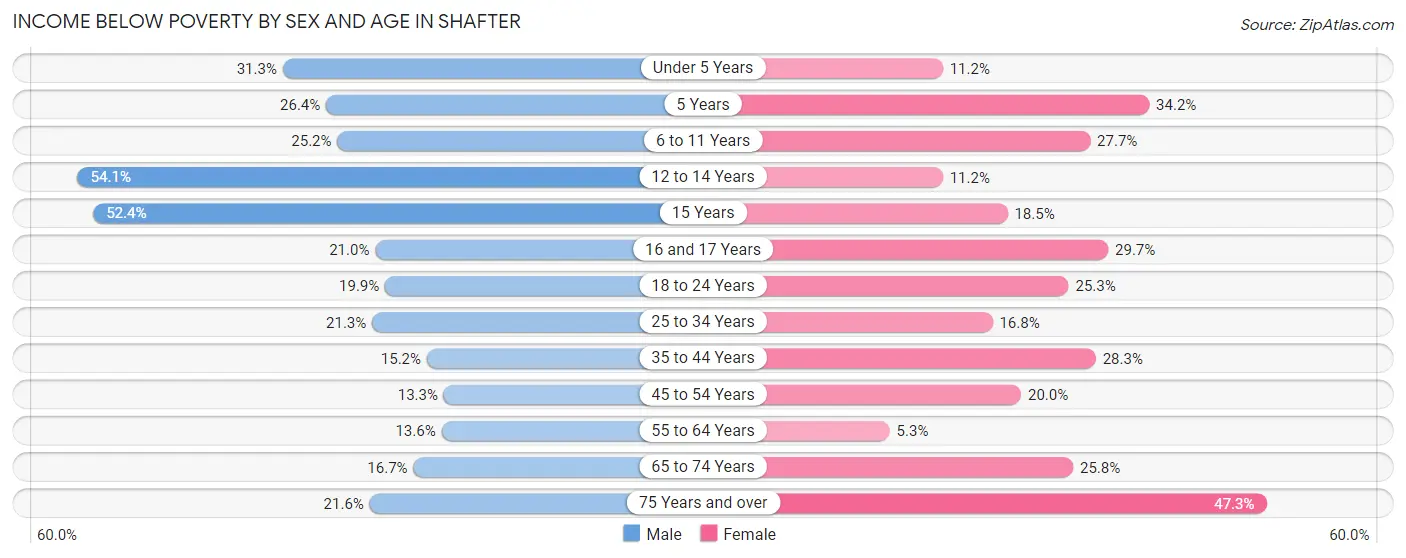
Income Below Poverty by Sex and Age in Shafter
With 23.2% poverty level for males and 22.2% for females among the residents of Shafter, 12 to 14 year old males and 75 year old and over females are the most vulnerable to poverty, with 463 males (54.1%) and 147 females (47.3%) in their respective age groups living below the poverty level.
| Age Bracket | Male | Female |
| Under 5 Years | 230 (31.2%) | 79 (11.2%) |
| 5 Years | 42 (26.4%) | 51 (34.2%) |
| 6 to 11 Years | 218 (25.2%) | 387 (27.7%) |
| 12 to 14 Years | 463 (54.1%) | 59 (11.2%) |
| 15 Years | 89 (52.3%) | 43 (18.4%) |
| 16 and 17 Years | 66 (20.9%) | 175 (29.7%) |
| 18 to 24 Years | 207 (19.9%) | 331 (25.3%) |
| 25 to 34 Years | 325 (21.3%) | 248 (16.8%) |
| 35 to 44 Years | 214 (15.2%) | 371 (28.3%) |
| 45 to 54 Years | 146 (13.3%) | 186 (20.0%) |
| 55 to 64 Years | 97 (13.6%) | 35 (5.3%) |
| 65 to 74 Years | 78 (16.7%) | 120 (25.8%) |
| 75 Years and over | 33 (21.6%) | 147 (47.3%) |
| Total | 2,208 (23.2%) | 2,232 (22.2%) |
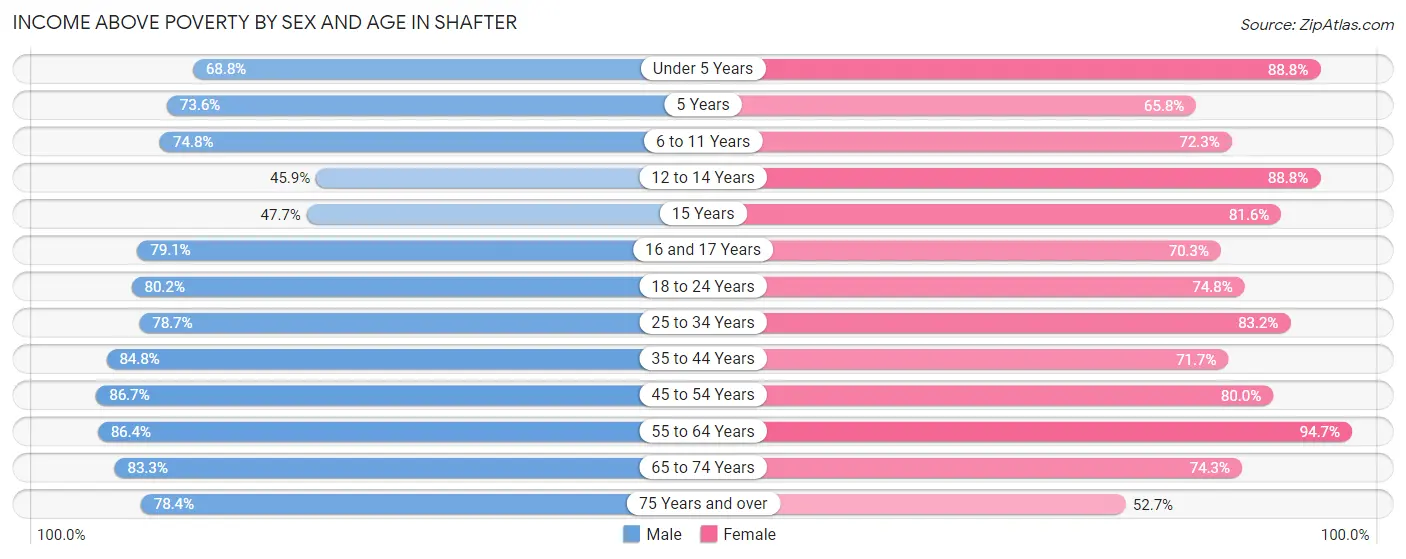
Income Above Poverty by Sex and Age in Shafter
According to the poverty statistics in Shafter, males aged 45 to 54 years and females aged 55 to 64 years are the age groups that are most secure financially, with 86.7% of males and 94.7% of females in these age groups living above the poverty line.
| Age Bracket | Male | Female |
| Under 5 Years | 506 (68.8%) | 624 (88.8%) |
| 5 Years | 117 (73.6%) | 98 (65.8%) |
| 6 to 11 Years | 648 (74.8%) | 1,012 (72.3%) |
| 12 to 14 Years | 393 (45.9%) | 466 (88.8%) |
| 15 Years | 81 (47.6%) | 190 (81.6%) |
| 16 and 17 Years | 249 (79.0%) | 415 (70.3%) |
| 18 to 24 Years | 836 (80.1%) | 980 (74.8%) |
| 25 to 34 Years | 1,201 (78.7%) | 1,230 (83.2%) |
| 35 to 44 Years | 1,194 (84.8%) | 941 (71.7%) |
| 45 to 54 Years | 951 (86.7%) | 746 (80.0%) |
| 55 to 64 Years | 618 (86.4%) | 622 (94.7%) |
| 65 to 74 Years | 389 (83.3%) | 346 (74.3%) |
| 75 Years and over | 120 (78.4%) | 164 (52.7%) |
| Total | 7,303 (76.8%) | 7,834 (77.8%) |
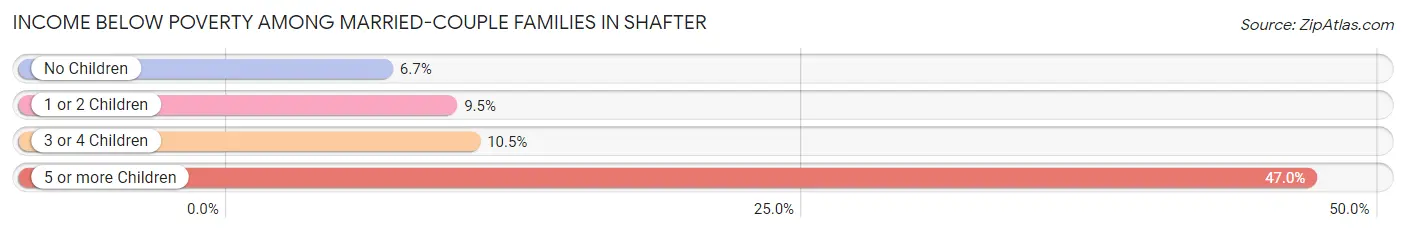
Income Below Poverty Among Married-Couple Families in Shafter
The poverty statistics for married-couple families in Shafter show that 9.6% or 283 of the total 2,954 families live below the poverty line. Families with 5 or more children have the highest poverty rate of 47.0%, comprising of 31 families. On the other hand, families with no children have the lowest poverty rate of 6.7%, which includes 67 families.
| Children | Above Poverty | Below Poverty |
| No Children | 927 (93.3%) | 67 (6.7%) |
| 1 or 2 Children | 1,327 (90.5%) | 140 (9.5%) |
| 3 or 4 Children | 382 (89.5%) | 45 (10.5%) |
| 5 or more Children | 35 (53.0%) | 31 (47.0%) |
| Total | 2,671 (90.4%) | 283 (9.6%) |
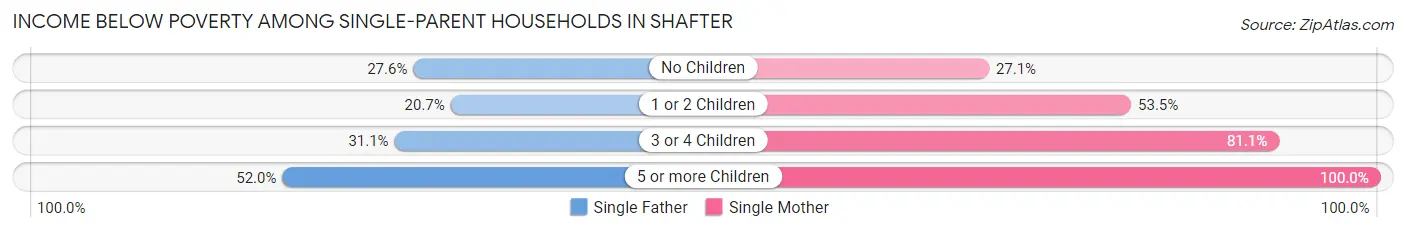
Income Below Poverty Among Single-Parent Households in Shafter
According to the poverty data in Shafter, 27.3% or 150 single-father households and 53.4% or 425 single-mother households are living below the poverty line. Among single-father households, those with 5 or more children have the highest poverty rate, with 26 households (52.0%) experiencing poverty. Likewise, among single-mother households, those with 5 or more children have the highest poverty rate, with 19 households (100.0%) falling below the poverty line.
| Children | Single Father | Single Mother |
| No Children | 45 (27.6%) | 46 (27.1%) |
| 1 or 2 Children | 51 (20.6%) | 257 (53.5%) |
| 3 or 4 Children | 28 (31.1%) | 103 (81.1%) |
| 5 or more Children | 26 (52.0%) | 19 (100.0%) |
| Total | 150 (27.3%) | 425 (53.4%) |
Income Below Poverty Among Married-Couple vs Single-Parent Households in Shafter
The poverty data for Shafter shows that 283 of the married-couple family households (9.6%) and 575 of the single-parent households (42.7%) are living below the poverty level. Within the married-couple family households, those with 5 or more children have the highest poverty rate, with 31 households (47.0%) falling below the poverty line. Among the single-parent households, those with 5 or more children have the highest poverty rate, with 45 household (65.2%) living below poverty.
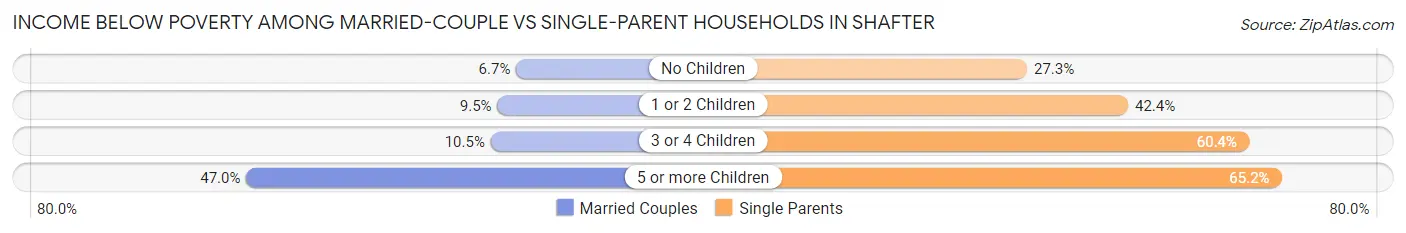
| Children | Married-Couple Families | Single-Parent Households |
| No Children | 67 (6.7%) | 91 (27.3%) |
| 1 or 2 Children | 140 (9.5%) | 308 (42.4%) |
| 3 or 4 Children | 45 (10.5%) | 131 (60.4%) |
| 5 or more Children | 31 (47.0%) | 45 (65.2%) |
| Total | 283 (9.6%) | 575 (42.7%) |
Employment Characteristics in Shafter
Employment by Class of Employer in Shafter
Among the 7,834 employed individuals in Shafter, private company employees (5,631 | 71.9%), local government employees (695 | 8.9%), and self-employed (not incorporated) (534 | 6.8%) make up the most common classes of employment.
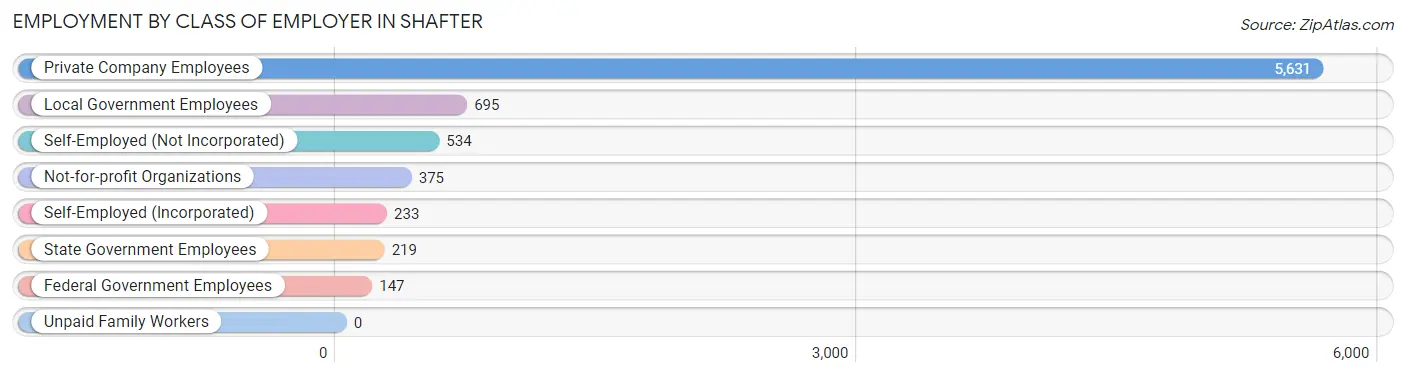
| Employer Class | # Employees | % Employees |
| Private Company Employees | 5,631 | 71.9% |
| Self-Employed (Incorporated) | 233 | 3.0% |
| Self-Employed (Not Incorporated) | 534 | 6.8% |
| Not-for-profit Organizations | 375 | 4.8% |
| Local Government Employees | 695 | 8.9% |
| State Government Employees | 219 | 2.8% |
| Federal Government Employees | 147 | 1.9% |
| Unpaid Family Workers | 0 | 0.0% |
| Total | 7,834 | 100.0% |
Employment Status by Age in Shafter
According to the labor force statistics for Shafter, out of the total population over 16 years of age (14,267), 61.0% or 8,703 individuals are in the labor force, with 7.1% or 618 of them unemployed. The age group with the highest labor force participation rate is 55 to 59 years, with 80.4% or 513 individuals in the labor force. Within the labor force, the 16 to 19 years age range has the highest percentage of unemployed individuals, with 29.3% or 153 of them being unemployed.
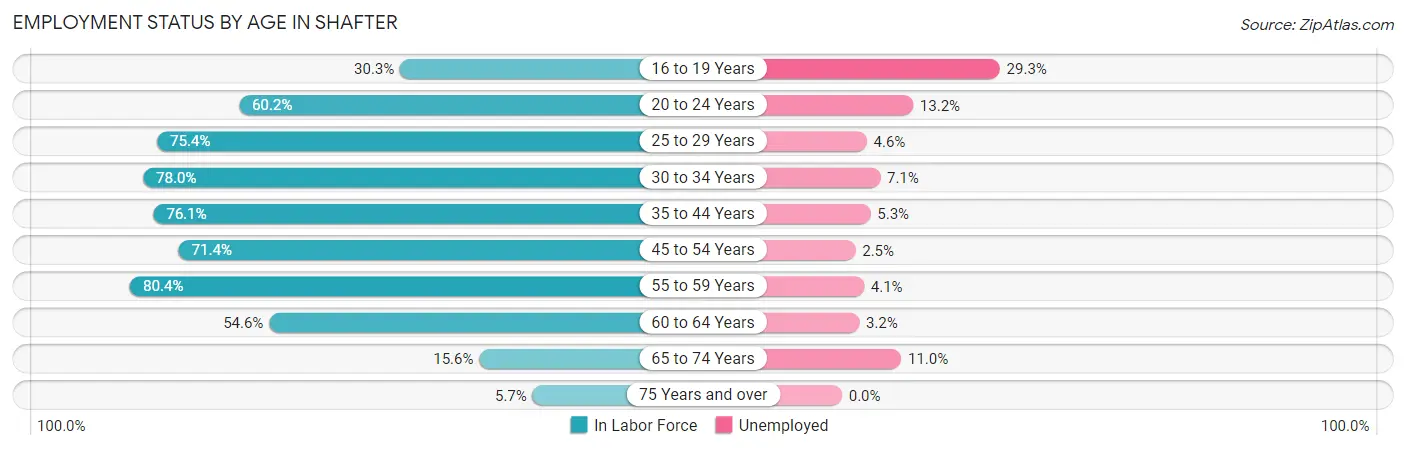
| Age Bracket | In Labor Force | Unemployed |
| 16 to 19 Years | 521 (30.3%) | 153 (29.3%) |
| 20 to 24 Years | 951 (60.2%) | 126 (13.2%) |
| 25 to 29 Years | 1,442 (75.4%) | 66 (4.6%) |
| 30 to 34 Years | 984 (78.0%) | 70 (7.1%) |
| 35 to 44 Years | 2,205 (76.1%) | 117 (5.3%) |
| 45 to 54 Years | 1,504 (71.4%) | 38 (2.5%) |
| 55 to 59 Years | 513 (80.4%) | 21 (4.1%) |
| 60 to 64 Years | 405 (54.6%) | 13 (3.2%) |
| 65 to 74 Years | 146 (15.6%) | 16 (11.0%) |
| 75 Years and over | 27 (5.7%) | 0 (0.0%) |
| Total | 8,703 (61.0%) | 618 (7.1%) |
Employment Status by Educational Attainment in Shafter
According to labor force statistics for Shafter, 73.8% of individuals (7,054) out of the total population between 25 and 64 years of age (9,558) are in the labor force, with 4.6% or 324 of them being unemployed. The group with the highest labor force participation rate are those with the educational attainment of bachelor's degree or higher, with 90.5% or 943 individuals in the labor force. Within the labor force, individuals with less than high school education have the highest percentage of unemployment, with 6.0% or 120 of them being unemployed.
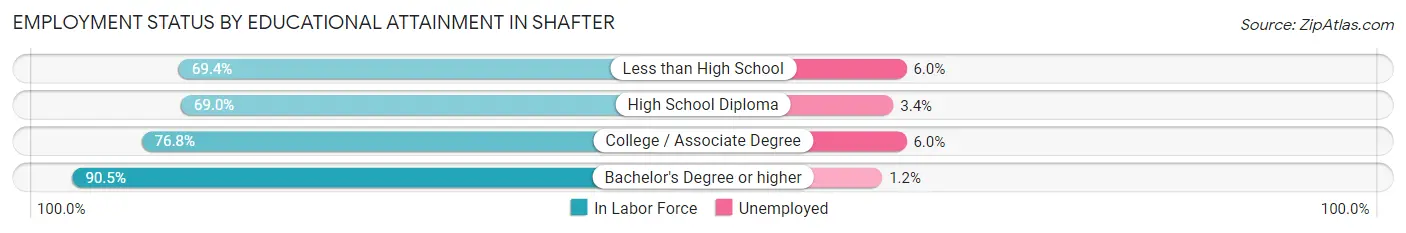
| Educational Attainment | In Labor Force | Unemployed |
| Less than High School | 1,992 (69.4%) | 172 (6.0%) |
| High School Diploma | 1,955 (69.0%) | 96 (3.4%) |
| College / Associate Degree | 2,159 (76.8%) | 169 (6.0%) |
| Bachelor's Degree or higher | 943 (90.5%) | 13 (1.2%) |
| Total | 7,054 (73.8%) | 440 (4.6%) |
Employment Occupations by Sex in Shafter
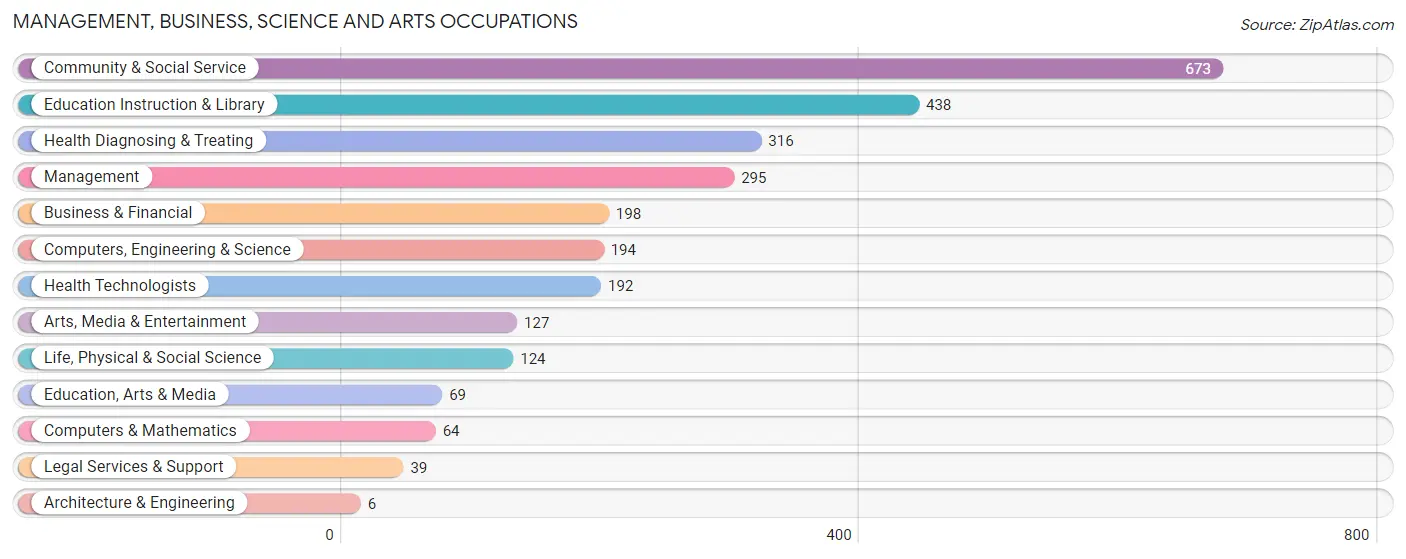
Management, Business, Science and Arts Occupations
The most common Management, Business, Science and Arts occupations in Shafter are Community & Social Service (673 | 8.3%), Education Instruction & Library (438 | 5.4%), Health Diagnosing & Treating (316 | 3.9%), Management (295 | 3.6%), and Business & Financial (198 | 2.5%).
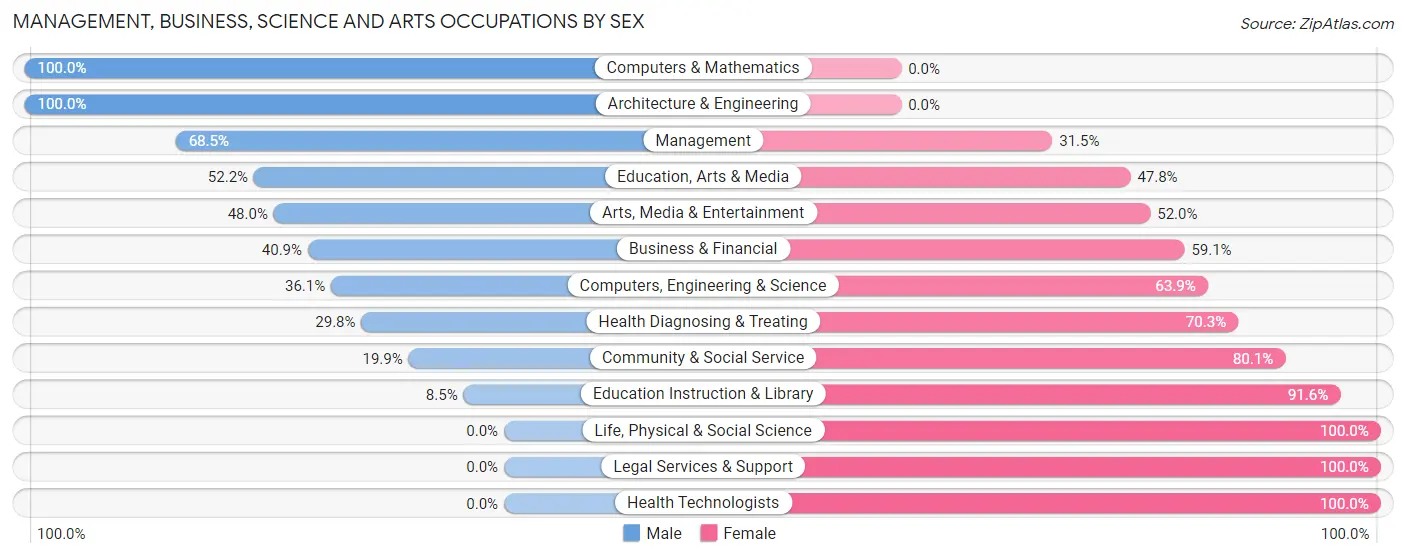
Management, Business, Science and Arts Occupations by Sex
Within the Management, Business, Science and Arts occupations in Shafter, the most male-oriented occupations are Computers & Mathematics (100.0%), Architecture & Engineering (100.0%), and Management (68.5%), while the most female-oriented occupations are Life, Physical & Social Science (100.0%), Legal Services & Support (100.0%), and Health Technologists (100.0%).
| Occupation | Male | Female |
| Management | 202 (68.5%) | 93 (31.5%) |
| Business & Financial | 81 (40.9%) | 117 (59.1%) |
| Computers, Engineering & Science | 70 (36.1%) | 124 (63.9%) |
| Computers & Mathematics | 64 (100.0%) | 0 (0.0%) |
| Architecture & Engineering | 6 (100.0%) | 0 (0.0%) |
| Life, Physical & Social Science | 0 (0.0%) | 124 (100.0%) |
| Community & Social Service | 134 (19.9%) | 539 (80.1%) |
| Education, Arts & Media | 36 (52.2%) | 33 (47.8%) |
| Legal Services & Support | 0 (0.0%) | 39 (100.0%) |
| Education Instruction & Library | 37 (8.5%) | 401 (91.5%) |
| Arts, Media & Entertainment | 61 (48.0%) | 66 (52.0%) |
| Health Diagnosing & Treating | 94 (29.7%) | 222 (70.3%) |
| Health Technologists | 0 (0.0%) | 192 (100.0%) |
| Total (Category) | 581 (34.7%) | 1,095 (65.3%) |
| Total (Overall) | 4,672 (57.9%) | 3,404 (42.1%) |
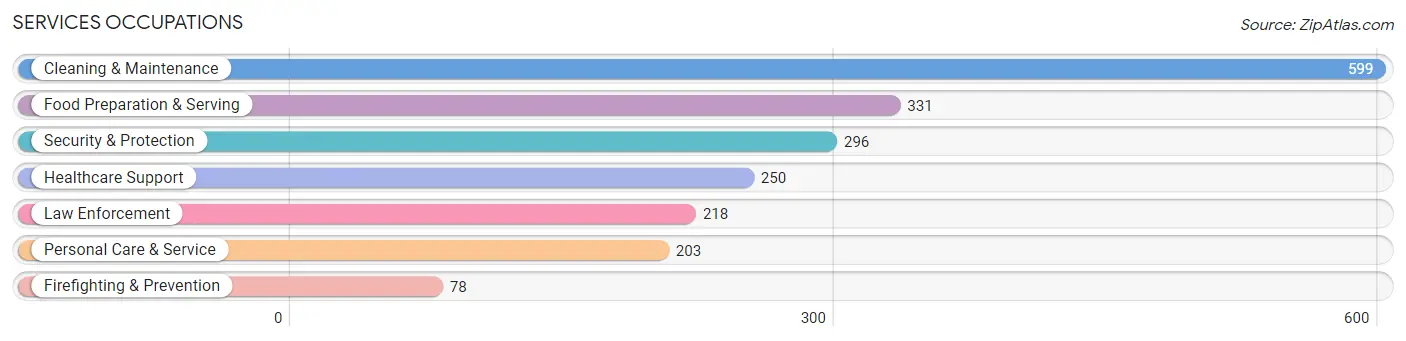
Services Occupations
The most common Services occupations in Shafter are Cleaning & Maintenance (599 | 7.4%), Food Preparation & Serving (331 | 4.1%), Security & Protection (296 | 3.7%), Healthcare Support (250 | 3.1%), and Law Enforcement (218 | 2.7%).
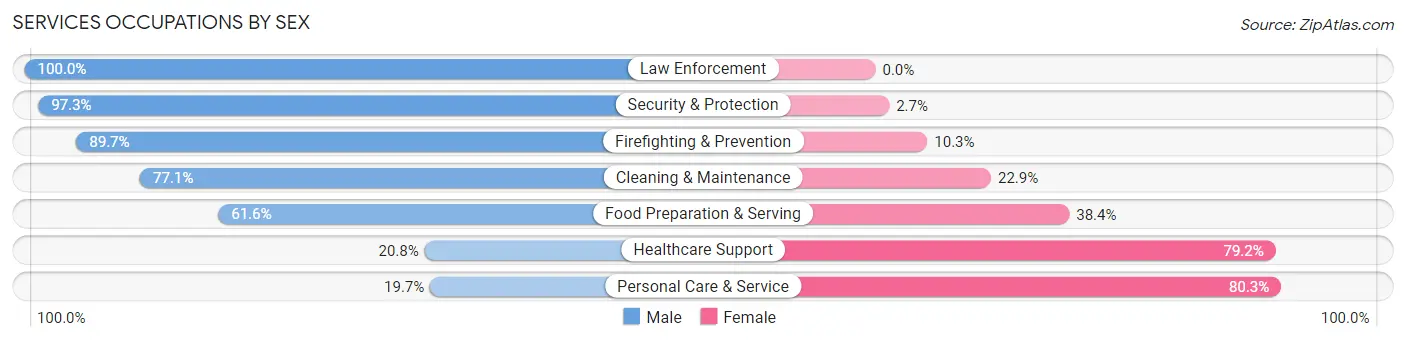
Services Occupations by Sex
Within the Services occupations in Shafter, the most male-oriented occupations are Law Enforcement (100.0%), Security & Protection (97.3%), and Firefighting & Prevention (89.7%), while the most female-oriented occupations are Personal Care & Service (80.3%), Healthcare Support (79.2%), and Food Preparation & Serving (38.4%).
| Occupation | Male | Female |
| Healthcare Support | 52 (20.8%) | 198 (79.2%) |
| Security & Protection | 288 (97.3%) | 8 (2.7%) |
| Firefighting & Prevention | 70 (89.7%) | 8 (10.3%) |
| Law Enforcement | 218 (100.0%) | 0 (0.0%) |
| Food Preparation & Serving | 204 (61.6%) | 127 (38.4%) |
| Cleaning & Maintenance | 462 (77.1%) | 137 (22.9%) |
| Personal Care & Service | 40 (19.7%) | 163 (80.3%) |
| Total (Category) | 1,046 (62.3%) | 633 (37.7%) |
| Total (Overall) | 4,672 (57.9%) | 3,404 (42.1%) |
Sales and Office Occupations
The most common Sales and Office occupations in Shafter are Sales & Related (860 | 10.6%), and Office & Administration (454 | 5.6%).
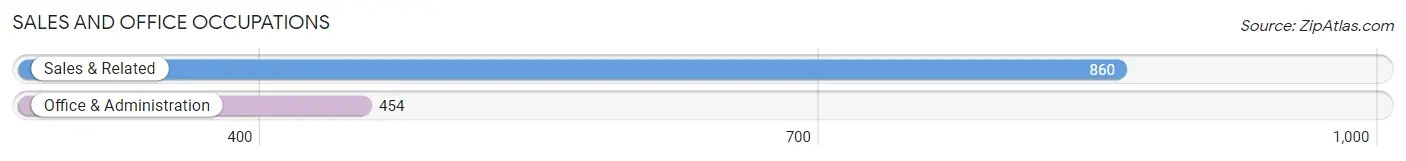
Sales and Office Occupations by Sex
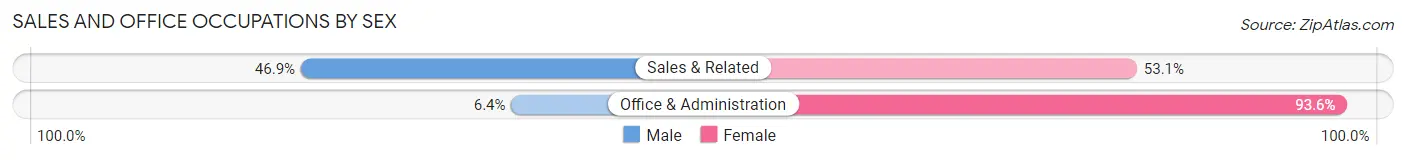
| Occupation | Male | Female |
| Sales & Related | 403 (46.9%) | 457 (53.1%) |
| Office & Administration | 29 (6.4%) | 425 (93.6%) |
| Total (Category) | 432 (32.9%) | 882 (67.1%) |
| Total (Overall) | 4,672 (57.9%) | 3,404 (42.1%) |
Natural Resources, Construction and Maintenance Occupations
The most common Natural Resources, Construction and Maintenance occupations in Shafter are Farming, Fishing & Forestry (1,141 | 14.1%), Construction & Extraction (491 | 6.1%), and Installation, Maintenance & Repair (213 | 2.6%).
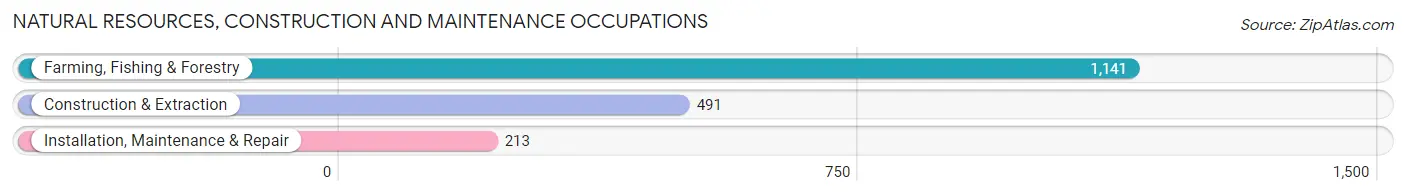
Natural Resources, Construction and Maintenance Occupations by Sex
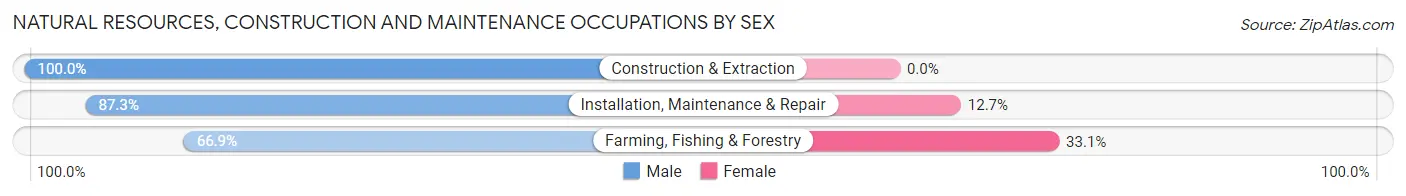
| Occupation | Male | Female |
| Farming, Fishing & Forestry | 763 (66.9%) | 378 (33.1%) |
| Construction & Extraction | 491 (100.0%) | 0 (0.0%) |
| Installation, Maintenance & Repair | 186 (87.3%) | 27 (12.7%) |
| Total (Category) | 1,440 (78.0%) | 405 (22.0%) |
| Total (Overall) | 4,672 (57.9%) | 3,404 (42.1%) |
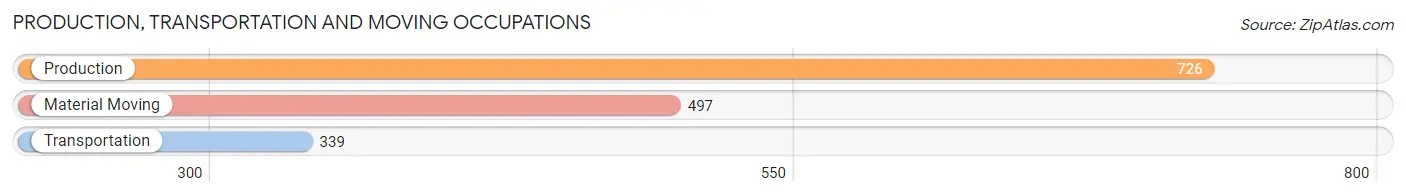
Production, Transportation and Moving Occupations
The most common Production, Transportation and Moving occupations in Shafter are Production (726 | 9.0%), Material Moving (497 | 6.1%), and Transportation (339 | 4.2%).
Production, Transportation and Moving Occupations by Sex
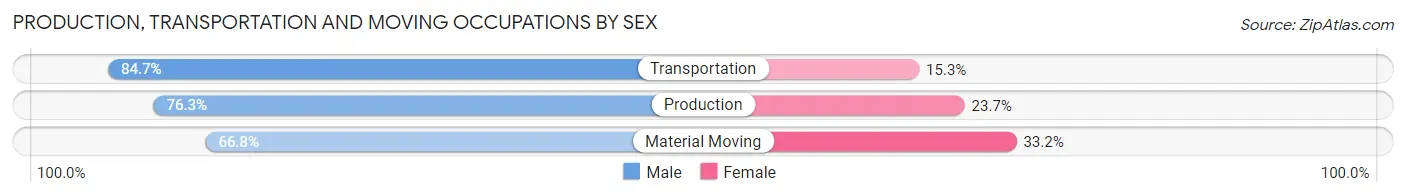
| Occupation | Male | Female |
| Production | 554 (76.3%) | 172 (23.7%) |
| Transportation | 287 (84.7%) | 52 (15.3%) |
| Material Moving | 332 (66.8%) | 165 (33.2%) |
| Total (Category) | 1,173 (75.1%) | 389 (24.9%) |
| Total (Overall) | 4,672 (57.9%) | 3,404 (42.1%) |
Employment Industries by Sex in Shafter
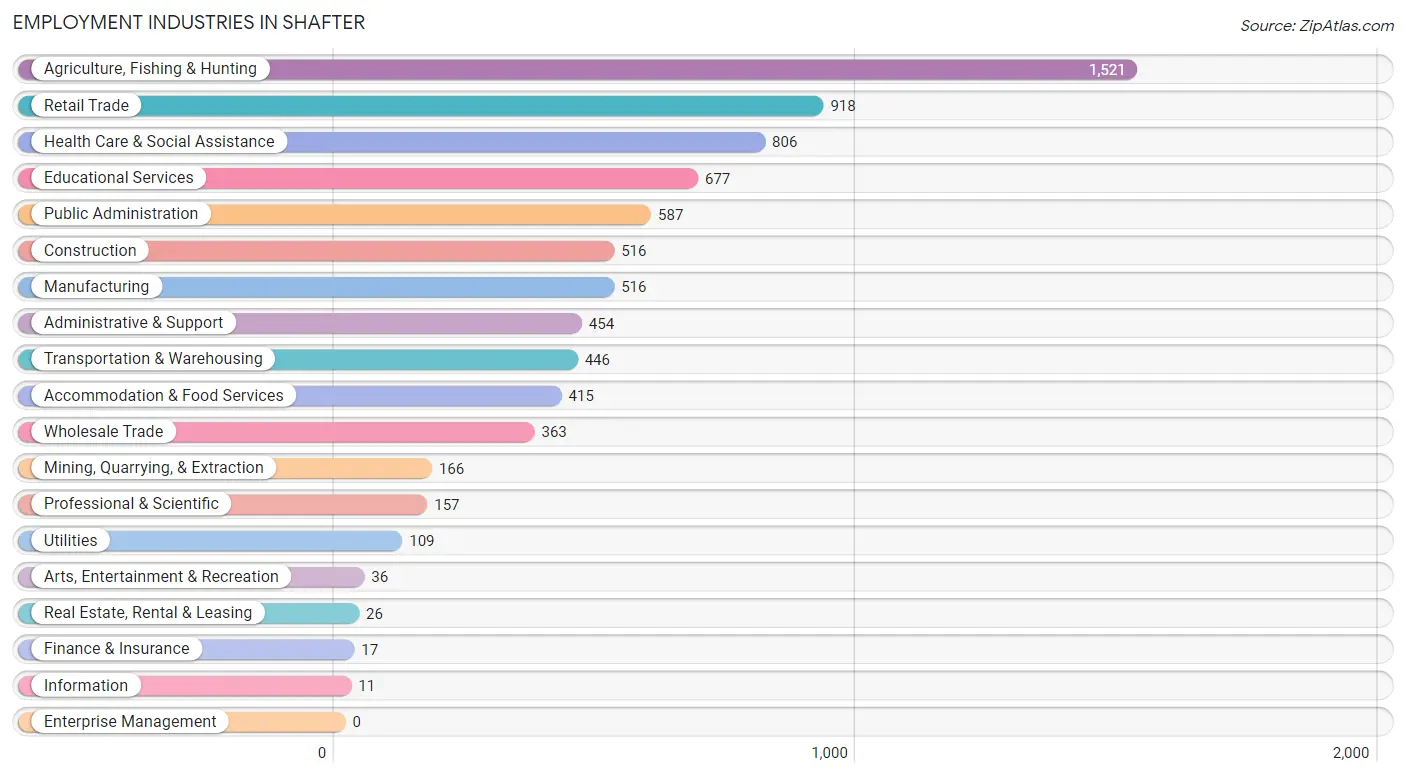
Employment Industries in Shafter
The major employment industries in Shafter include Agriculture, Fishing & Hunting (1,521 | 18.8%), Retail Trade (918 | 11.4%), Health Care & Social Assistance (806 | 10.0%), Educational Services (677 | 8.4%), and Public Administration (587 | 7.3%).
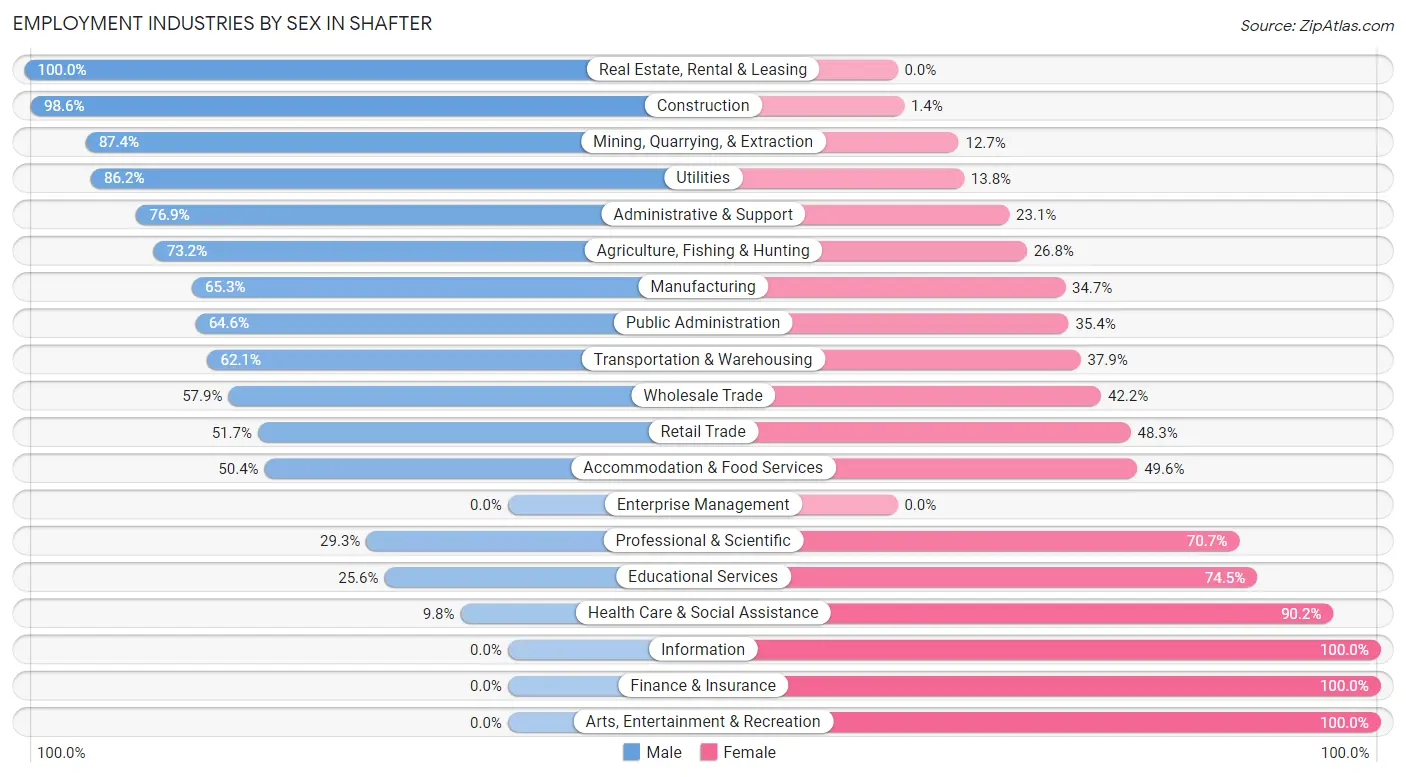
Employment Industries by Sex in Shafter
The Shafter industries that see more men than women are Real Estate, Rental & Leasing (100.0%), Construction (98.6%), and Mining, Quarrying, & Extraction (87.4%), whereas the industries that tend to have a higher number of women are Information (100.0%), Finance & Insurance (100.0%), and Arts, Entertainment & Recreation (100.0%).
| Industry | Male | Female |
| Agriculture, Fishing & Hunting | 1,114 (73.2%) | 407 (26.8%) |
| Mining, Quarrying, & Extraction | 145 (87.4%) | 21 (12.7%) |
| Construction | 509 (98.6%) | 7 (1.4%) |
| Manufacturing | 337 (65.3%) | 179 (34.7%) |
| Wholesale Trade | 210 (57.9%) | 153 (42.1%) |
| Retail Trade | 475 (51.7%) | 443 (48.3%) |
| Transportation & Warehousing | 277 (62.1%) | 169 (37.9%) |
| Utilities | 94 (86.2%) | 15 (13.8%) |
| Information | 0 (0.0%) | 11 (100.0%) |
| Finance & Insurance | 0 (0.0%) | 17 (100.0%) |
| Real Estate, Rental & Leasing | 26 (100.0%) | 0 (0.0%) |
| Professional & Scientific | 46 (29.3%) | 111 (70.7%) |
| Enterprise Management | 0 (0.0%) | 0 (0.0%) |
| Administrative & Support | 349 (76.9%) | 105 (23.1%) |
| Educational Services | 173 (25.6%) | 504 (74.5%) |
| Health Care & Social Assistance | 79 (9.8%) | 727 (90.2%) |
| Arts, Entertainment & Recreation | 0 (0.0%) | 36 (100.0%) |
| Accommodation & Food Services | 209 (50.4%) | 206 (49.6%) |
| Public Administration | 379 (64.6%) | 208 (35.4%) |
| Total | 4,672 (57.9%) | 3,404 (42.1%) |
Education in Shafter
School Enrollment in Shafter
The most common levels of schooling among the 7,301 students in Shafter are high school (2,054 | 28.1%), middle school (1,834 | 25.1%), and elementary school (1,512 | 20.7%).
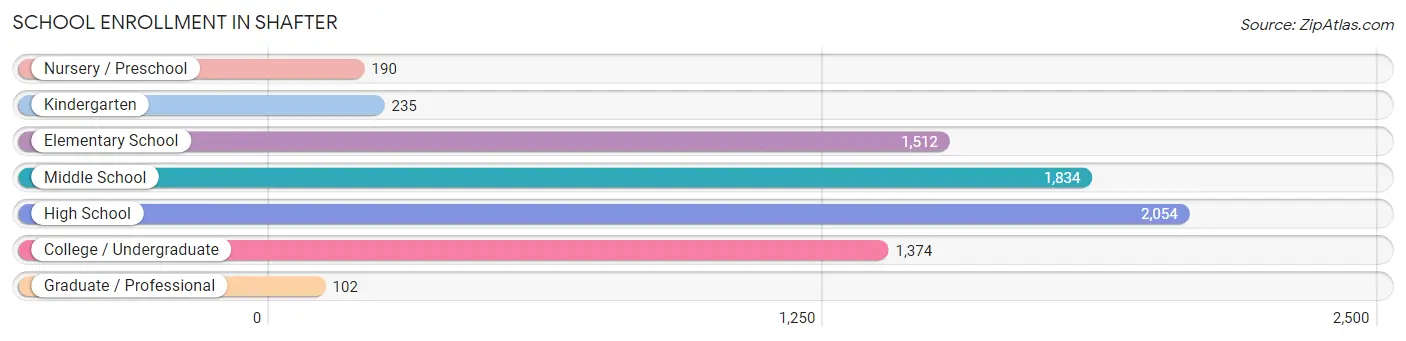
| School Level | # Students | % Students |
| Nursery / Preschool | 190 | 2.6% |
| Kindergarten | 235 | 3.2% |
| Elementary School | 1,512 | 20.7% |
| Middle School | 1,834 | 25.1% |
| High School | 2,054 | 28.1% |
| College / Undergraduate | 1,374 | 18.8% |
| Graduate / Professional | 102 | 1.4% |
| Total | 7,301 | 100.0% |
School Enrollment by Age by Funding Source in Shafter
Out of a total of 7,301 students who are enrolled in schools in Shafter, 628 (8.6%) attend a private institution, while the remaining 6,673 (91.4%) are enrolled in public schools. The age group of 35 years and over has the highest likelihood of being enrolled in private schools, with 153 (44.4% in the age bracket) enrolled. Conversely, the age group of 15 to 17 year olds has the lowest likelihood of being enrolled in a private school, with 1,301 (99.5% in the age bracket) attending a public institution.
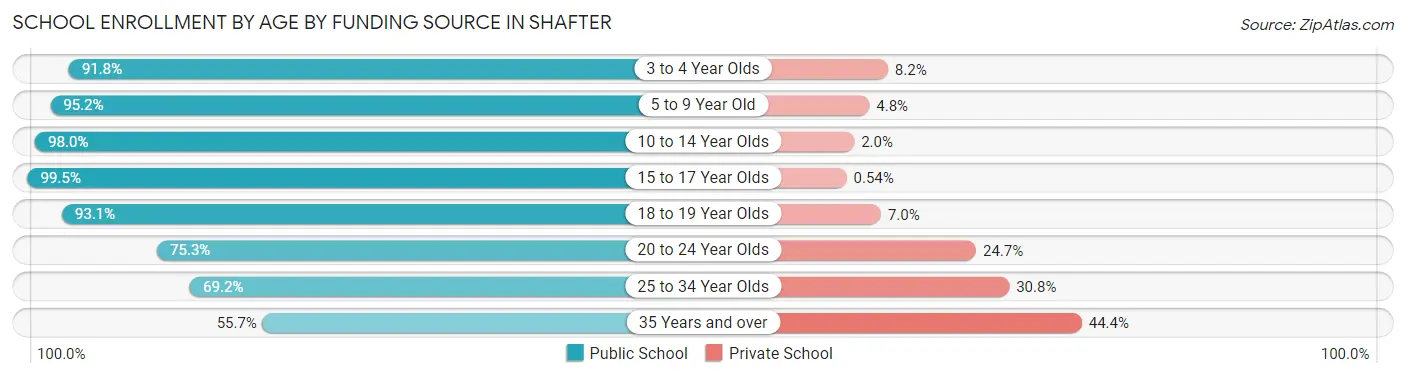
| Age Bracket | Public School | Private School |
| 3 to 4 Year Olds | 156 (91.8%) | 14 (8.2%) |
| 5 to 9 Year Old | 1,573 (95.2%) | 79 (4.8%) |
| 10 to 14 Year Olds | 2,249 (98.0%) | 45 (2.0%) |
| 15 to 17 Year Olds | 1,301 (99.5%) | 7 (0.5%) |
| 18 to 19 Year Olds | 388 (93.0%) | 29 (7.0%) |
| 20 to 24 Year Olds | 498 (75.3%) | 163 (24.7%) |
| 25 to 34 Year Olds | 314 (69.2%) | 140 (30.8%) |
| 35 Years and over | 192 (55.6%) | 153 (44.4%) |
| Total | 6,673 (91.4%) | 628 (8.6%) |
Educational Attainment by Field of Study in Shafter
Business (224 | 17.7%), arts & humanities (213 | 16.8%), liberal arts & history (151 | 11.9%), bio, nature & agricultural (94 | 7.4%), and science & technology (89 | 7.0%) are the most common fields of study among 1,267 individuals in Shafter who have obtained a bachelor's degree or higher.
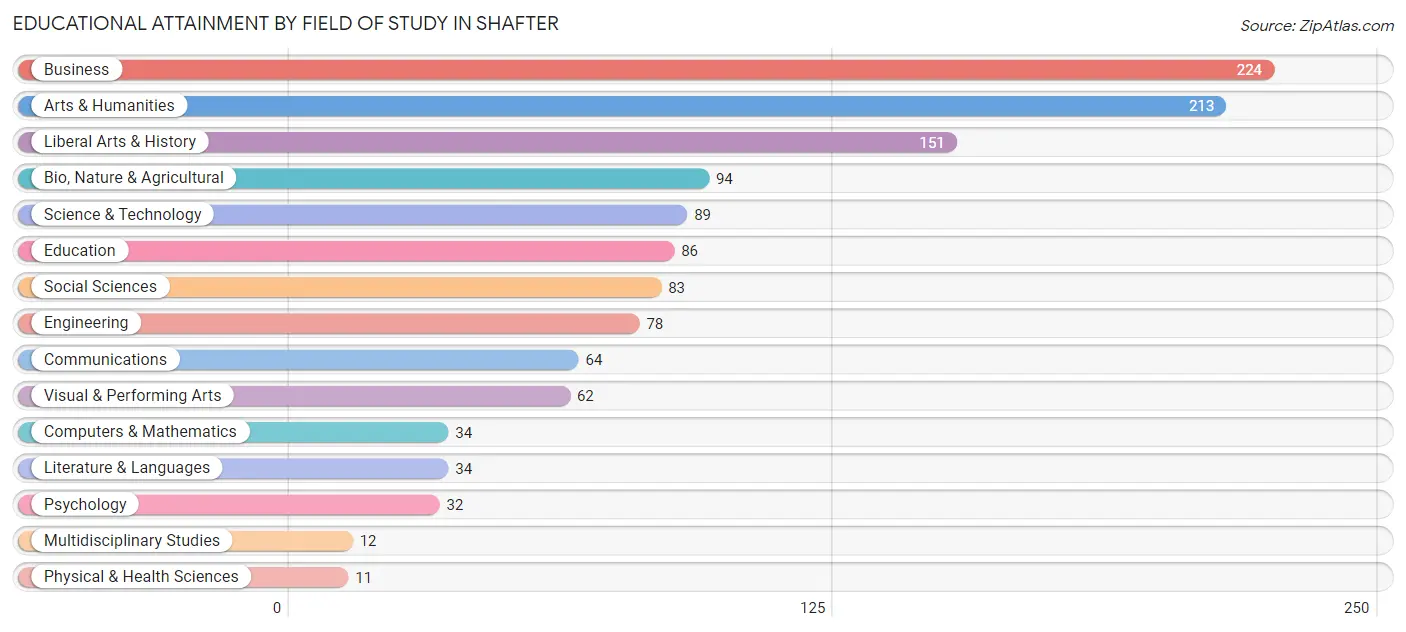
| Field of Study | # Graduates | % Graduates |
| Computers & Mathematics | 34 | 2.7% |
| Bio, Nature & Agricultural | 94 | 7.4% |
| Physical & Health Sciences | 11 | 0.9% |
| Psychology | 32 | 2.5% |
| Social Sciences | 83 | 6.6% |
| Engineering | 78 | 6.2% |
| Multidisciplinary Studies | 12 | 0.9% |
| Science & Technology | 89 | 7.0% |
| Business | 224 | 17.7% |
| Education | 86 | 6.8% |
| Literature & Languages | 34 | 2.7% |
| Liberal Arts & History | 151 | 11.9% |
| Visual & Performing Arts | 62 | 4.9% |
| Communications | 64 | 5.1% |
| Arts & Humanities | 213 | 16.8% |
| Total | 1,267 | 100.0% |
Transportation & Commute in Shafter
Vehicle Availability by Sex in Shafter
The most prevalent vehicle ownership categories in Shafter are males with 2 vehicles (2,170, accounting for 47.3%) and females with 2 vehicles (1,306, making up 67.4%).
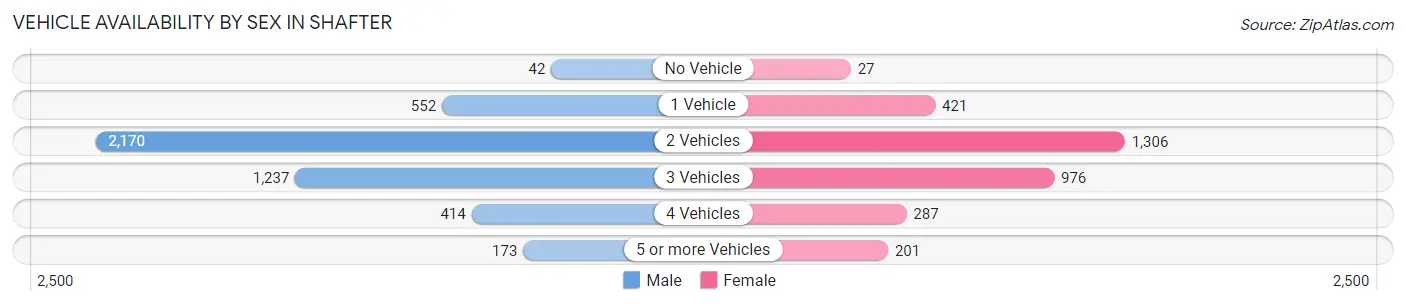
| Vehicles Available | Male | Female |
| No Vehicle | 42 (0.9%) | 27 (0.8%) |
| 1 Vehicle | 552 (12.0%) | 421 (13.1%) |
| 2 Vehicles | 2,170 (47.3%) | 1,306 (40.6%) |
| 3 Vehicles | 1,237 (27.0%) | 976 (30.3%) |
| 4 Vehicles | 414 (9.0%) | 287 (8.9%) |
| 5 or more Vehicles | 173 (3.8%) | 201 (6.2%) |
| Total | 4,588 (100.0%) | 3,218 (100.0%) |
Commute Time in Shafter
The most frequently occuring commute durations in Shafter are 15 to 19 minutes (1,600 commuters, 21.0%), 20 to 24 minutes (1,548 commuters, 20.4%), and 10 to 14 minutes (1,122 commuters, 14.8%).
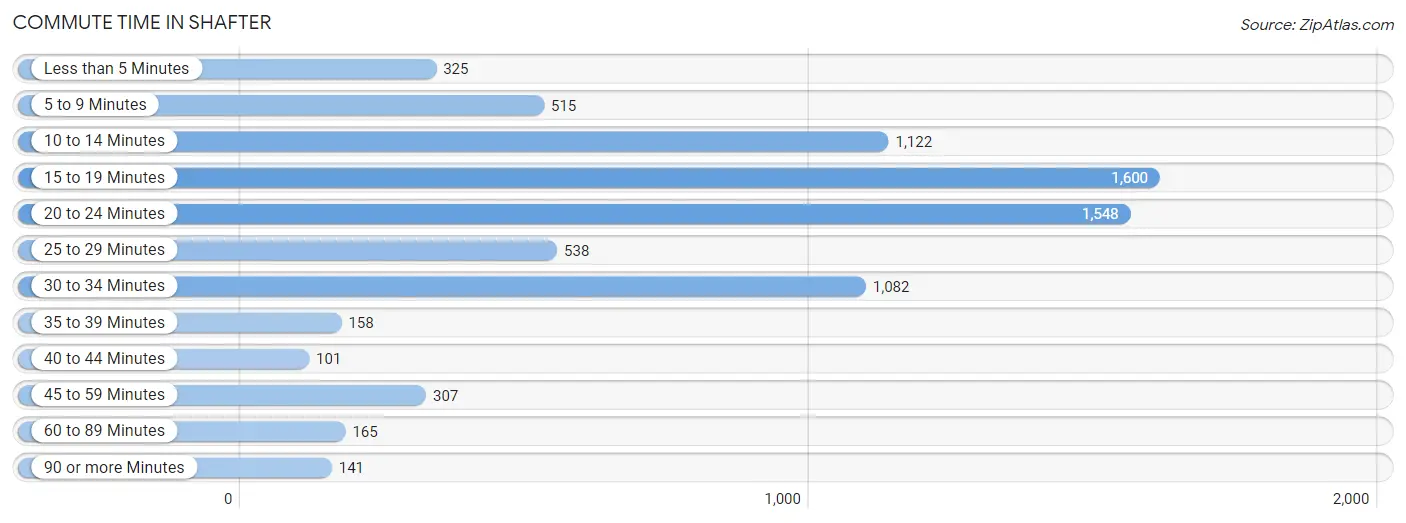
| Commute Time | # Commuters | % Commuters |
| Less than 5 Minutes | 325 | 4.3% |
| 5 to 9 Minutes | 515 | 6.8% |
| 10 to 14 Minutes | 1,122 | 14.8% |
| 15 to 19 Minutes | 1,600 | 21.0% |
| 20 to 24 Minutes | 1,548 | 20.4% |
| 25 to 29 Minutes | 538 | 7.1% |
| 30 to 34 Minutes | 1,082 | 14.2% |
| 35 to 39 Minutes | 158 | 2.1% |
| 40 to 44 Minutes | 101 | 1.3% |
| 45 to 59 Minutes | 307 | 4.0% |
| 60 to 89 Minutes | 165 | 2.2% |
| 90 or more Minutes | 141 | 1.8% |
Commute Time by Sex in Shafter
The most common commute times in Shafter are 20 to 24 minutes (1,230 commuters, 27.1%) for males and 15 to 19 minutes (695 commuters, 22.7%) for females.
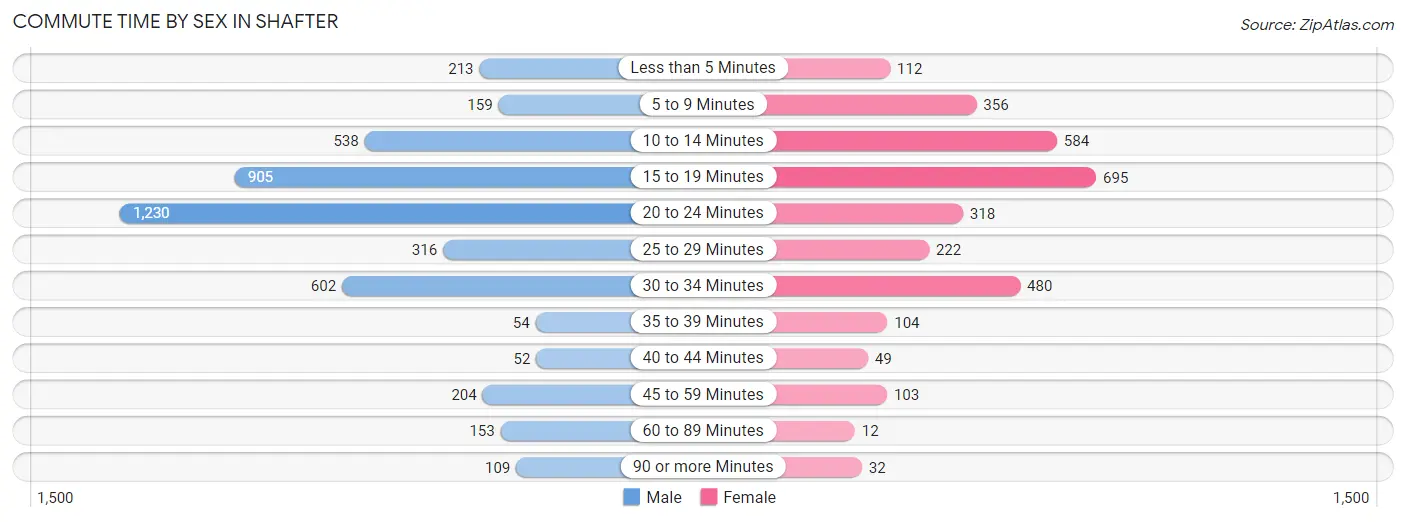
| Commute Time | Male | Female |
| Less than 5 Minutes | 213 (4.7%) | 112 (3.6%) |
| 5 to 9 Minutes | 159 (3.5%) | 356 (11.6%) |
| 10 to 14 Minutes | 538 (11.9%) | 584 (19.0%) |
| 15 to 19 Minutes | 905 (20.0%) | 695 (22.7%) |
| 20 to 24 Minutes | 1,230 (27.1%) | 318 (10.4%) |
| 25 to 29 Minutes | 316 (7.0%) | 222 (7.2%) |
| 30 to 34 Minutes | 602 (13.3%) | 480 (15.7%) |
| 35 to 39 Minutes | 54 (1.2%) | 104 (3.4%) |
| 40 to 44 Minutes | 52 (1.1%) | 49 (1.6%) |
| 45 to 59 Minutes | 204 (4.5%) | 103 (3.4%) |
| 60 to 89 Minutes | 153 (3.4%) | 12 (0.4%) |
| 90 or more Minutes | 109 (2.4%) | 32 (1.0%) |
Time of Departure to Work by Sex in Shafter
The most frequent times of departure to work in Shafter are 6:00 AM to 6:29 AM (1,338, 29.5%) for males and 7:30 AM to 7:59 AM (558, 18.2%) for females.
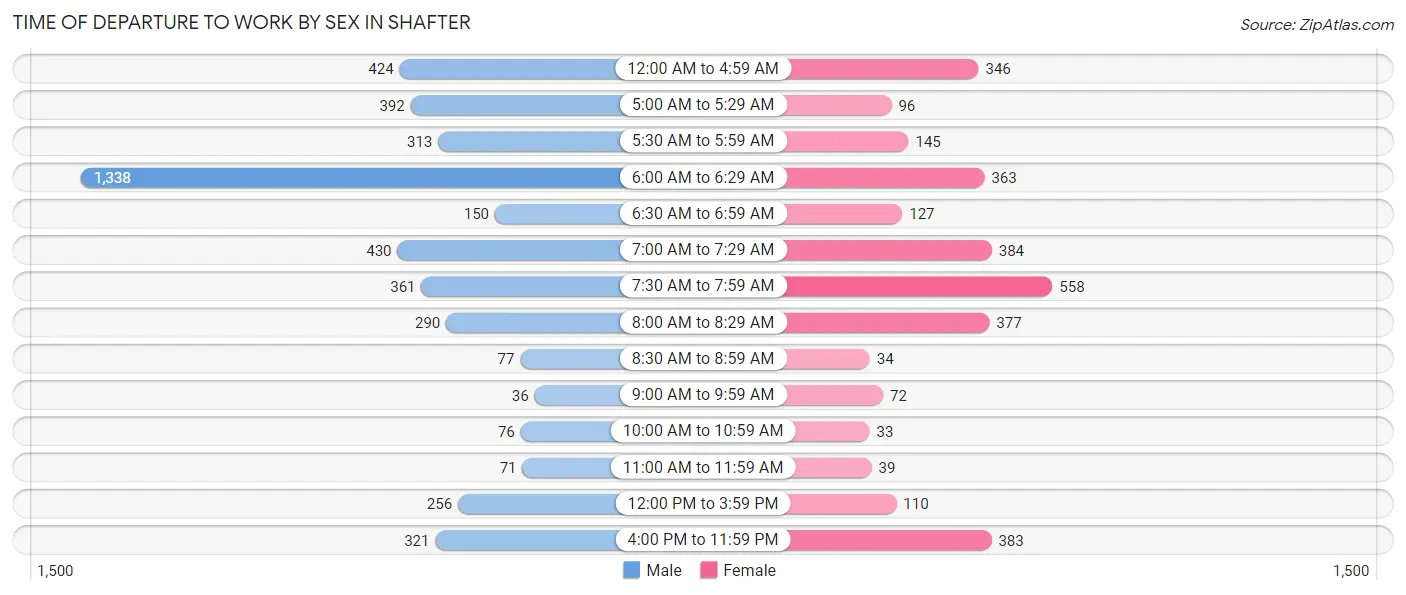
| Time of Departure | Male | Female |
| 12:00 AM to 4:59 AM | 424 (9.3%) | 346 (11.3%) |
| 5:00 AM to 5:29 AM | 392 (8.6%) | 96 (3.1%) |
| 5:30 AM to 5:59 AM | 313 (6.9%) | 145 (4.7%) |
| 6:00 AM to 6:29 AM | 1,338 (29.5%) | 363 (11.8%) |
| 6:30 AM to 6:59 AM | 150 (3.3%) | 127 (4.1%) |
| 7:00 AM to 7:29 AM | 430 (9.5%) | 384 (12.5%) |
| 7:30 AM to 7:59 AM | 361 (8.0%) | 558 (18.2%) |
| 8:00 AM to 8:29 AM | 290 (6.4%) | 377 (12.3%) |
| 8:30 AM to 8:59 AM | 77 (1.7%) | 34 (1.1%) |
| 9:00 AM to 9:59 AM | 36 (0.8%) | 72 (2.4%) |
| 10:00 AM to 10:59 AM | 76 (1.7%) | 33 (1.1%) |
| 11:00 AM to 11:59 AM | 71 (1.6%) | 39 (1.3%) |
| 12:00 PM to 3:59 PM | 256 (5.6%) | 110 (3.6%) |
| 4:00 PM to 11:59 PM | 321 (7.1%) | 383 (12.5%) |
| Total | 4,535 (100.0%) | 3,067 (100.0%) |
Housing Occupancy in Shafter
Occupancy by Ownership in Shafter
Of the total 5,158 dwellings in Shafter, owner-occupied units account for 3,279 (63.6%), while renter-occupied units make up 1,879 (36.4%).
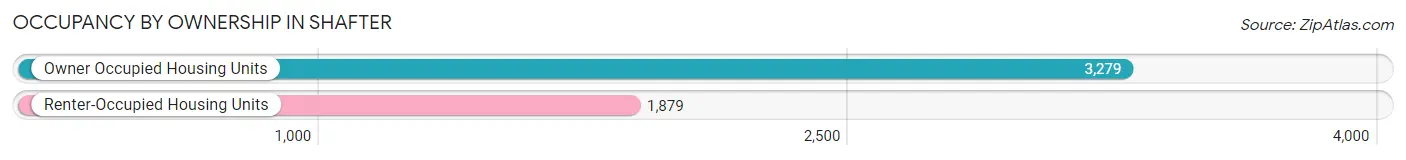
| Occupancy | # Housing Units | % Housing Units |
| Owner Occupied Housing Units | 3,279 | 63.6% |
| Renter-Occupied Housing Units | 1,879 | 36.4% |
| Total Occupied Housing Units | 5,158 | 100.0% |
Occupancy by Household Size in Shafter
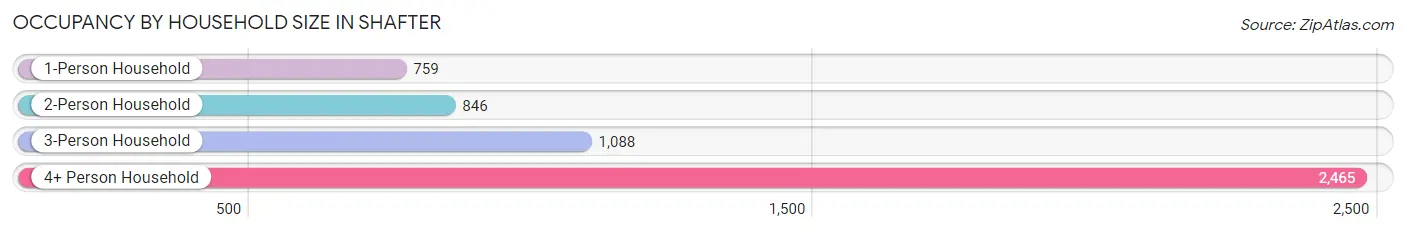
| Household Size | # Housing Units | % Housing Units |
| 1-Person Household | 759 | 14.7% |
| 2-Person Household | 846 | 16.4% |
| 3-Person Household | 1,088 | 21.1% |
| 4+ Person Household | 2,465 | 47.8% |
| Total Housing Units | 5,158 | 100.0% |
Occupancy by Ownership by Household Size in Shafter
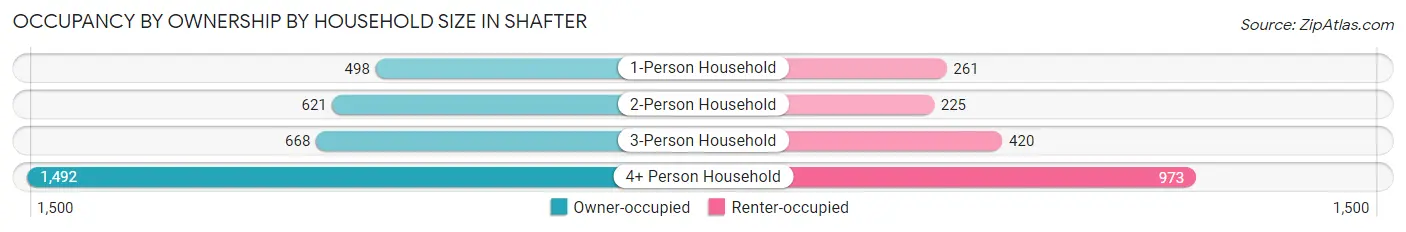
| Household Size | Owner-occupied | Renter-occupied |
| 1-Person Household | 498 (65.6%) | 261 (34.4%) |
| 2-Person Household | 621 (73.4%) | 225 (26.6%) |
| 3-Person Household | 668 (61.4%) | 420 (38.6%) |
| 4+ Person Household | 1,492 (60.5%) | 973 (39.5%) |
| Total Housing Units | 3,279 (63.6%) | 1,879 (36.4%) |
Occupancy by Educational Attainment in Shafter
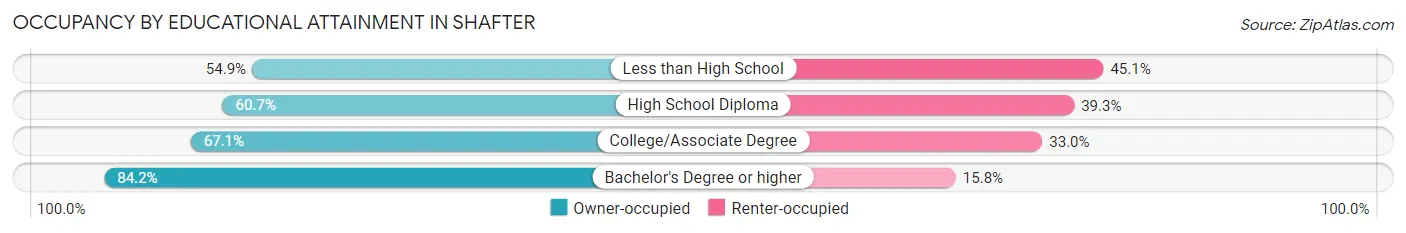
| Household Size | Owner-occupied | Renter-occupied |
| Less than High School | 997 (54.9%) | 818 (45.1%) |
| High School Diploma | 767 (60.7%) | 496 (39.3%) |
| College/Associate Degree | 924 (67.0%) | 454 (33.0%) |
| Bachelor's Degree or higher | 591 (84.2%) | 111 (15.8%) |
Occupancy by Age of Householder in Shafter
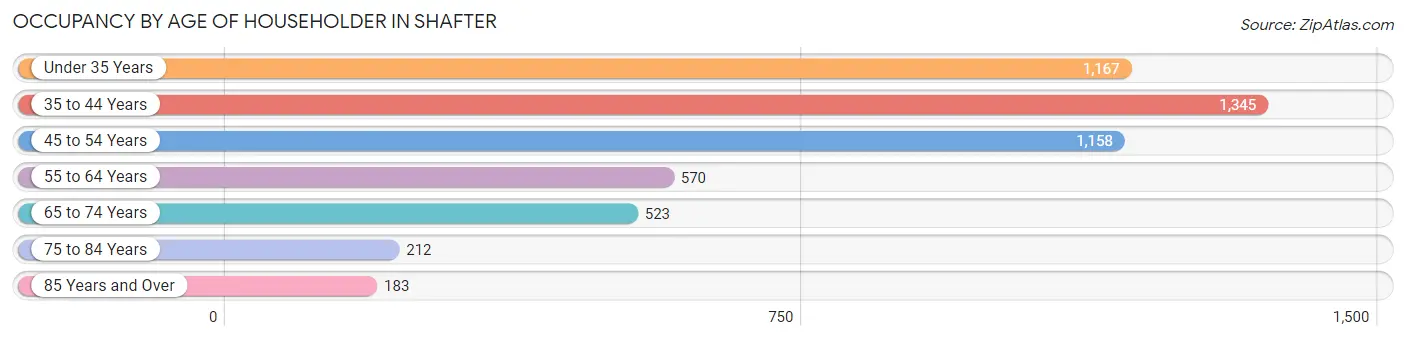
| Age Bracket | # Households | % Households |
| Under 35 Years | 1,167 | 22.6% |
| 35 to 44 Years | 1,345 | 26.1% |
| 45 to 54 Years | 1,158 | 22.5% |
| 55 to 64 Years | 570 | 11.1% |
| 65 to 74 Years | 523 | 10.1% |
| 75 to 84 Years | 212 | 4.1% |
| 85 Years and Over | 183 | 3.5% |
| Total | 5,158 | 100.0% |
Housing Finances in Shafter
Median Income by Occupancy in Shafter
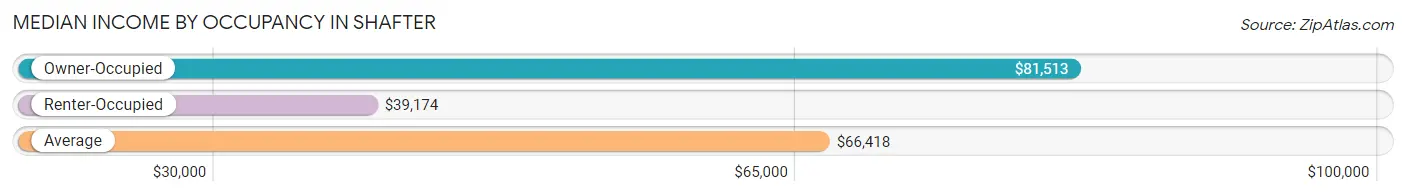
| Occupancy Type | # Households | Median Income |
| Owner-Occupied | 3,279 (63.6%) | $81,513 |
| Renter-Occupied | 1,879 (36.4%) | $39,174 |
| Average | 5,158 (100.0%) | $66,418 |
Occupancy by Householder Income Bracket in Shafter
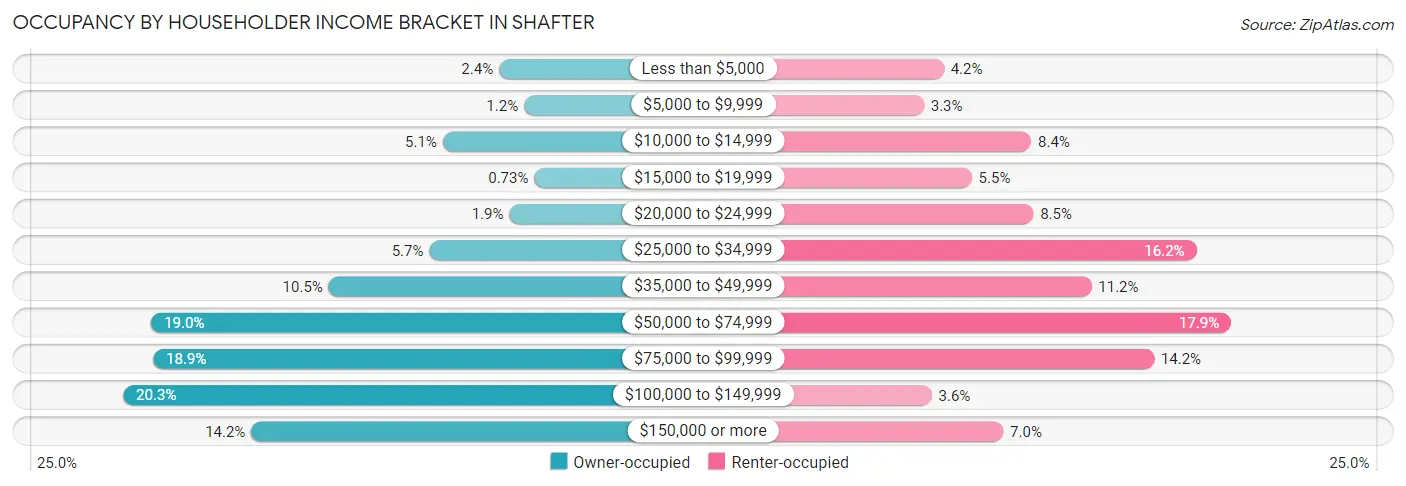
| Income Bracket | Owner-occupied | Renter-occupied |
| Less than $5,000 | 79 (2.4%) | 79 (4.2%) |
| $5,000 to $9,999 | 40 (1.2%) | 61 (3.3%) |
| $10,000 to $14,999 | 167 (5.1%) | 157 (8.4%) |
| $15,000 to $19,999 | 24 (0.7%) | 104 (5.5%) |
| $20,000 to $24,999 | 63 (1.9%) | 159 (8.5%) |
| $25,000 to $34,999 | 188 (5.7%) | 305 (16.2%) |
| $35,000 to $49,999 | 345 (10.5%) | 211 (11.2%) |
| $50,000 to $74,999 | 622 (19.0%) | 336 (17.9%) |
| $75,000 to $99,999 | 619 (18.9%) | 267 (14.2%) |
| $100,000 to $149,999 | 666 (20.3%) | 68 (3.6%) |
| $150,000 or more | 466 (14.2%) | 132 (7.0%) |
| Total | 3,279 (100.0%) | 1,879 (100.0%) |
Monthly Housing Cost Tiers in Shafter
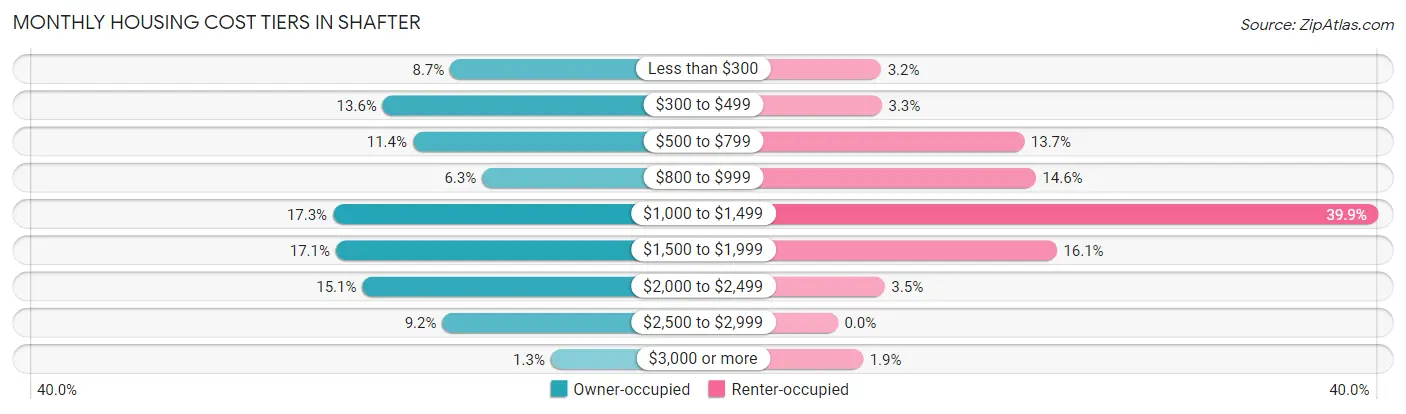
| Monthly Cost | Owner-occupied | Renter-occupied |
| Less than $300 | 284 (8.7%) | 60 (3.2%) |
| $300 to $499 | 447 (13.6%) | 61 (3.3%) |
| $500 to $799 | 374 (11.4%) | 258 (13.7%) |
| $800 to $999 | 207 (6.3%) | 274 (14.6%) |
| $1,000 to $1,499 | 567 (17.3%) | 749 (39.9%) |
| $1,500 to $1,999 | 560 (17.1%) | 303 (16.1%) |
| $2,000 to $2,499 | 496 (15.1%) | 65 (3.5%) |
| $2,500 to $2,999 | 303 (9.2%) | 0 (0.0%) |
| $3,000 or more | 41 (1.3%) | 35 (1.9%) |
| Total | 3,279 (100.0%) | 1,879 (100.0%) |
Physical Housing Characteristics in Shafter
Housing Structures in Shafter
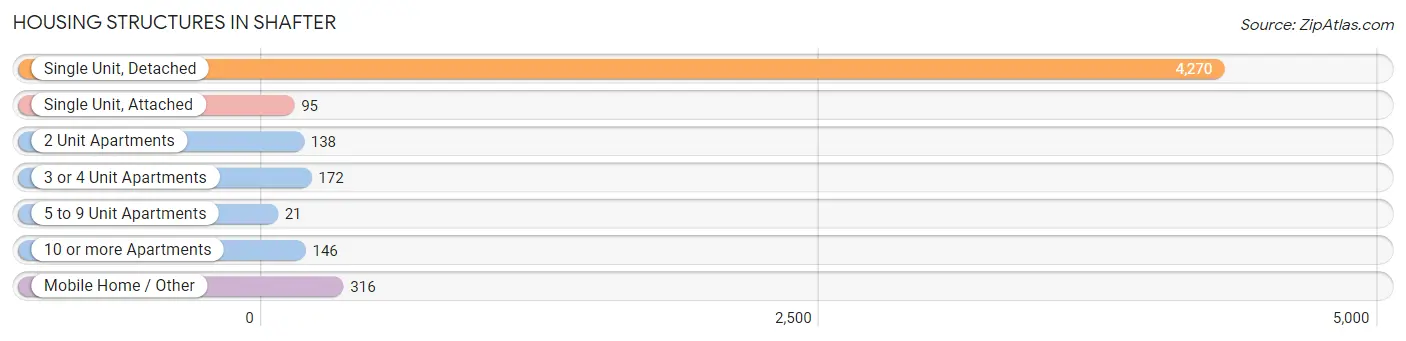
| Structure Type | # Housing Units | % Housing Units |
| Single Unit, Detached | 4,270 | 82.8% |
| Single Unit, Attached | 95 | 1.8% |
| 2 Unit Apartments | 138 | 2.7% |
| 3 or 4 Unit Apartments | 172 | 3.3% |
| 5 to 9 Unit Apartments | 21 | 0.4% |
| 10 or more Apartments | 146 | 2.8% |
| Mobile Home / Other | 316 | 6.1% |
| Total | 5,158 | 100.0% |
Housing Structures by Occupancy in Shafter
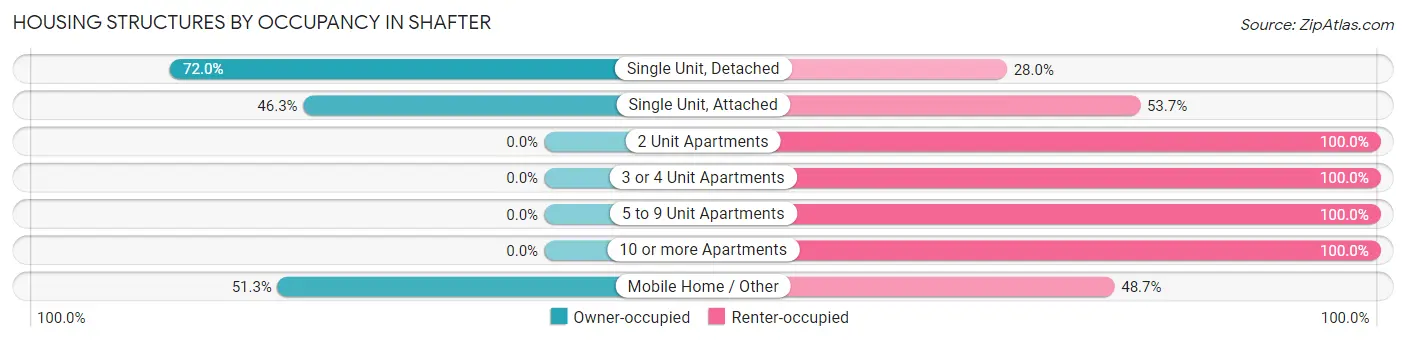
| Structure Type | Owner-occupied | Renter-occupied |
| Single Unit, Detached | 3,073 (72.0%) | 1,197 (28.0%) |
| Single Unit, Attached | 44 (46.3%) | 51 (53.7%) |
| 2 Unit Apartments | 0 (0.0%) | 138 (100.0%) |
| 3 or 4 Unit Apartments | 0 (0.0%) | 172 (100.0%) |
| 5 to 9 Unit Apartments | 0 (0.0%) | 21 (100.0%) |
| 10 or more Apartments | 0 (0.0%) | 146 (100.0%) |
| Mobile Home / Other | 162 (51.3%) | 154 (48.7%) |
| Total | 3,279 (63.6%) | 1,879 (36.4%) |
Housing Structures by Number of Rooms in Shafter
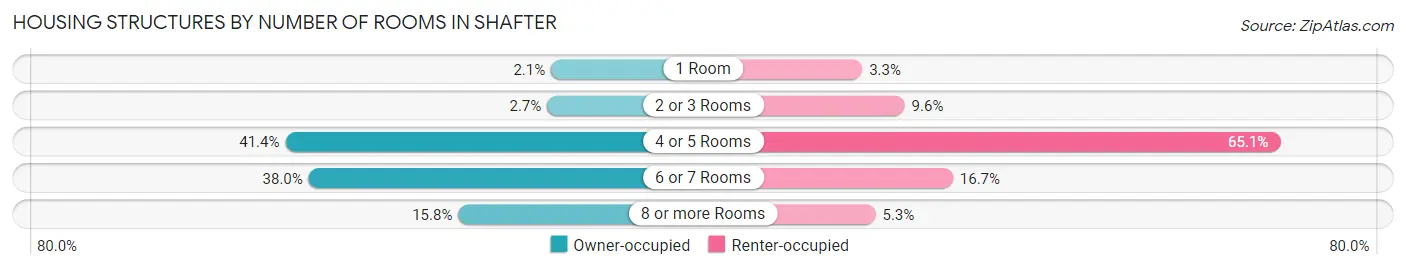
| Number of Rooms | Owner-occupied | Renter-occupied |
| 1 Room | 69 (2.1%) | 62 (3.3%) |
| 2 or 3 Rooms | 88 (2.7%) | 180 (9.6%) |
| 4 or 5 Rooms | 1,358 (41.4%) | 1,224 (65.1%) |
| 6 or 7 Rooms | 1,245 (38.0%) | 314 (16.7%) |
| 8 or more Rooms | 519 (15.8%) | 99 (5.3%) |
| Total | 3,279 (100.0%) | 1,879 (100.0%) |
Housing Structure by Heating Type in Shafter
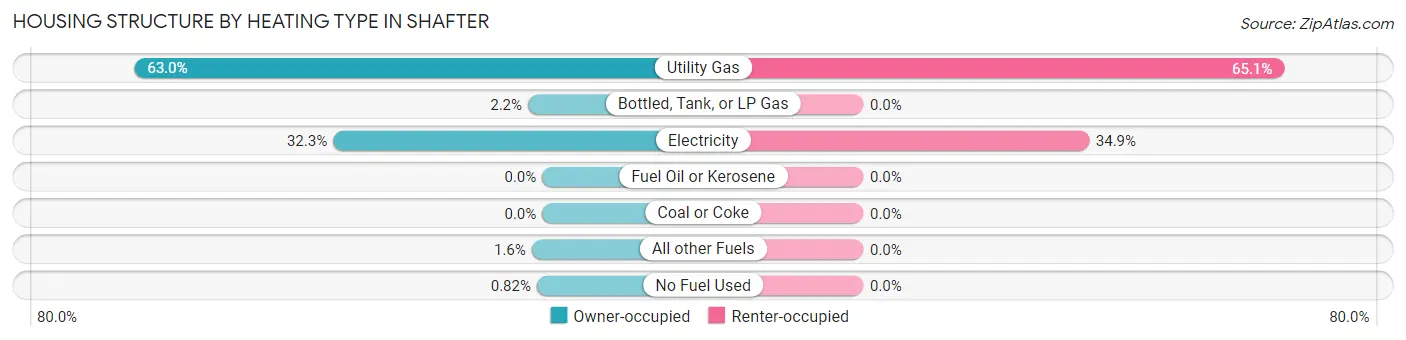
| Heating Type | Owner-occupied | Renter-occupied |
| Utility Gas | 2,067 (63.0%) | 1,223 (65.1%) |
| Bottled, Tank, or LP Gas | 72 (2.2%) | 0 (0.0%) |
| Electricity | 1,060 (32.3%) | 656 (34.9%) |
| Fuel Oil or Kerosene | 0 (0.0%) | 0 (0.0%) |
| Coal or Coke | 0 (0.0%) | 0 (0.0%) |
| All other Fuels | 53 (1.6%) | 0 (0.0%) |
| No Fuel Used | 27 (0.8%) | 0 (0.0%) |
| Total | 3,279 (100.0%) | 1,879 (100.0%) |
Household Vehicle Usage in Shafter
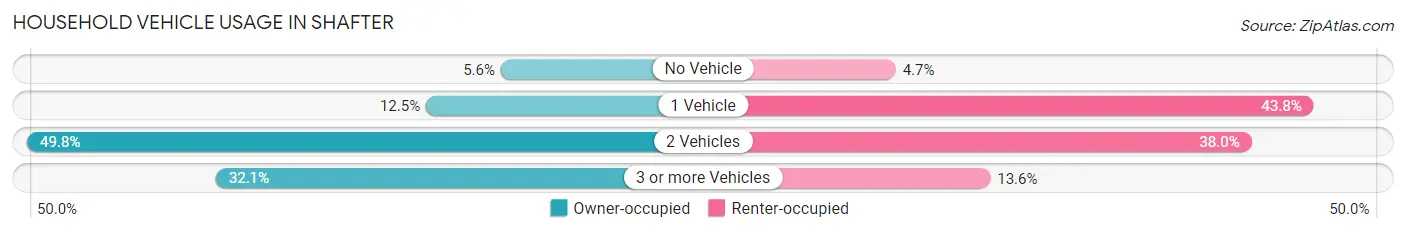
| Vehicles per Household | Owner-occupied | Renter-occupied |
| No Vehicle | 182 (5.6%) | 89 (4.7%) |
| 1 Vehicle | 411 (12.5%) | 822 (43.8%) |
| 2 Vehicles | 1,632 (49.8%) | 713 (38.0%) |
| 3 or more Vehicles | 1,054 (32.1%) | 255 (13.6%) |
| Total | 3,279 (100.0%) | 1,879 (100.0%) |
Real Estate & Mortgages in Shafter
Real Estate and Mortgage Overview in Shafter
| Characteristic | Without Mortgage | With Mortgage |
| Housing Units | 991 | 2,288 |
| Median Property Value | $209,100 | $309,800 |
| Median Household Income | $52,969 | $422 |
| Monthly Housing Costs | $430 | $41 |
| Real Estate Taxes | $1,391 | $106 |
Property Value by Mortgage Status in Shafter
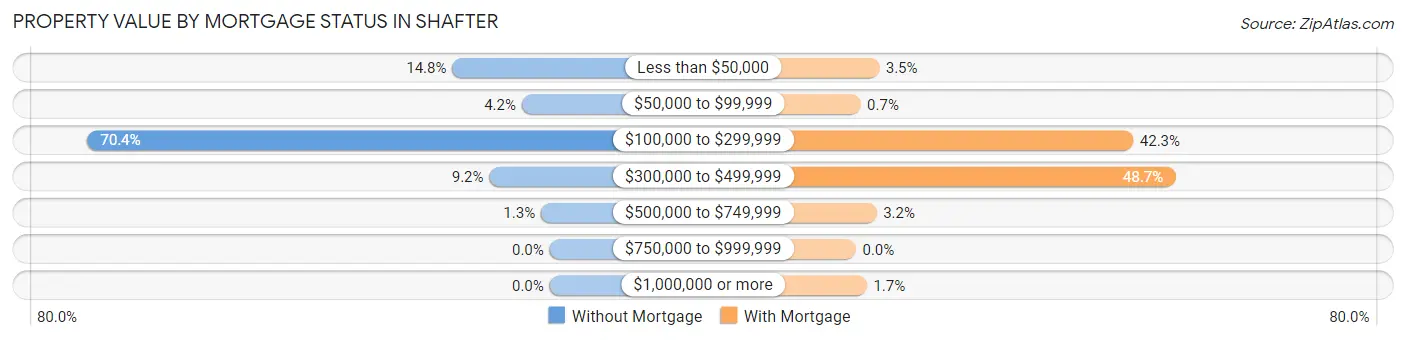
| Property Value | Without Mortgage | With Mortgage |
| Less than $50,000 | 147 (14.8%) | 81 (3.5%) |
| $50,000 to $99,999 | 42 (4.2%) | 16 (0.7%) |
| $100,000 to $299,999 | 698 (70.4%) | 967 (42.3%) |
| $300,000 to $499,999 | 91 (9.2%) | 1,114 (48.7%) |
| $500,000 to $749,999 | 13 (1.3%) | 72 (3.2%) |
| $750,000 to $999,999 | 0 (0.0%) | 0 (0.0%) |
| $1,000,000 or more | 0 (0.0%) | 38 (1.7%) |
| Total | 991 (100.0%) | 2,288 (100.0%) |
Household Income by Mortgage Status in Shafter
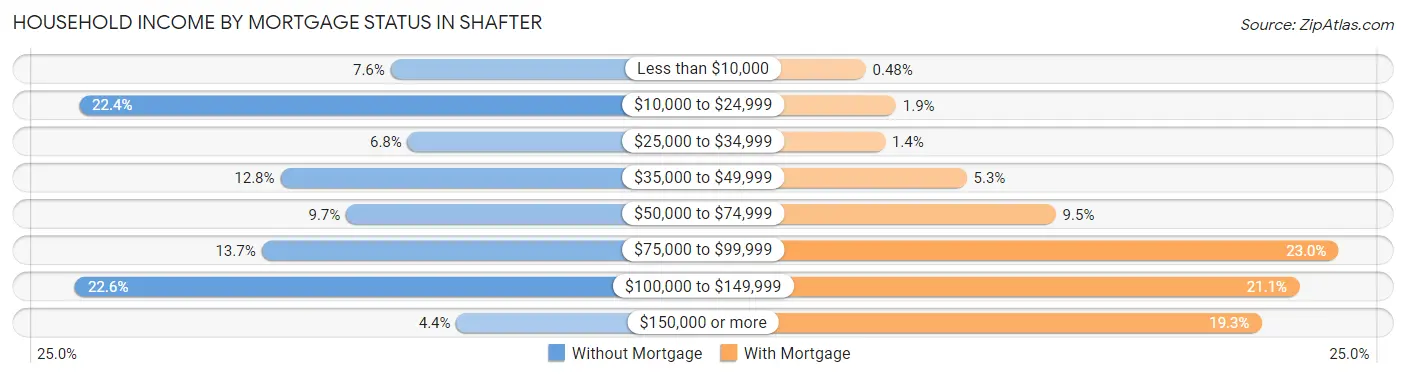
| Household Income | Without Mortgage | With Mortgage |
| Less than $10,000 | 75 (7.6%) | 11 (0.5%) |
| $10,000 to $24,999 | 222 (22.4%) | 44 (1.9%) |
| $25,000 to $34,999 | 67 (6.8%) | 32 (1.4%) |
| $35,000 to $49,999 | 127 (12.8%) | 121 (5.3%) |
| $50,000 to $74,999 | 96 (9.7%) | 218 (9.5%) |
| $75,000 to $99,999 | 136 (13.7%) | 526 (23.0%) |
| $100,000 to $149,999 | 224 (22.6%) | 483 (21.1%) |
| $150,000 or more | 44 (4.4%) | 442 (19.3%) |
| Total | 991 (100.0%) | 2,288 (100.0%) |
Property Value to Household Income Ratio in Shafter
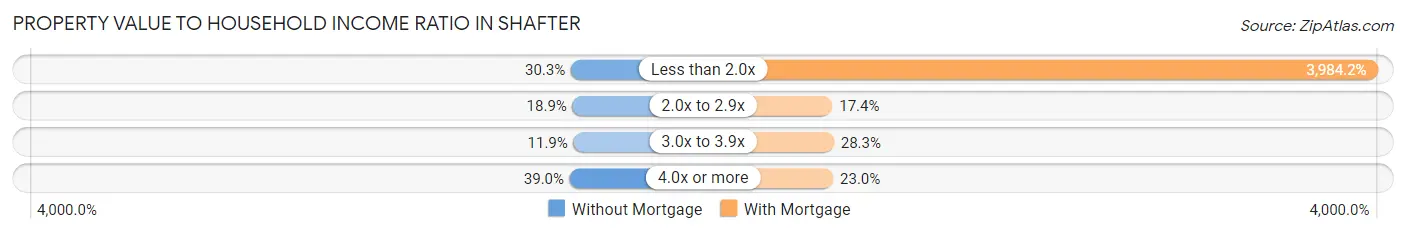
| Value-to-Income Ratio | Without Mortgage | With Mortgage |
| Less than 2.0x | 300 (30.3%) | 91,159 (3,984.2%) |
| 2.0x to 2.9x | 187 (18.9%) | 399 (17.4%) |
| 3.0x to 3.9x | 118 (11.9%) | 647 (28.3%) |
| 4.0x or more | 386 (39.0%) | 527 (23.0%) |
| Total | 991 (100.0%) | 2,288 (100.0%) |
Real Estate Taxes by Mortgage Status in Shafter
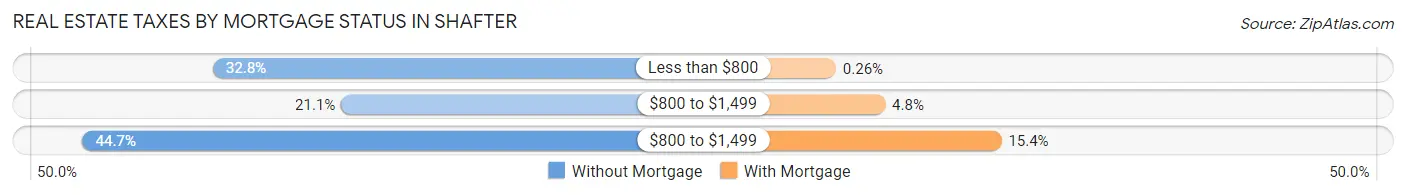
| Property Taxes | Without Mortgage | With Mortgage |
| Less than $800 | 325 (32.8%) | 6 (0.3%) |
| $800 to $1,499 | 209 (21.1%) | 109 (4.8%) |
| $800 to $1,499 | 443 (44.7%) | 352 (15.4%) |
| Total | 991 (100.0%) | 2,288 (100.0%) |
Health & Disability in Shafter
Health Insurance Coverage by Age in Shafter
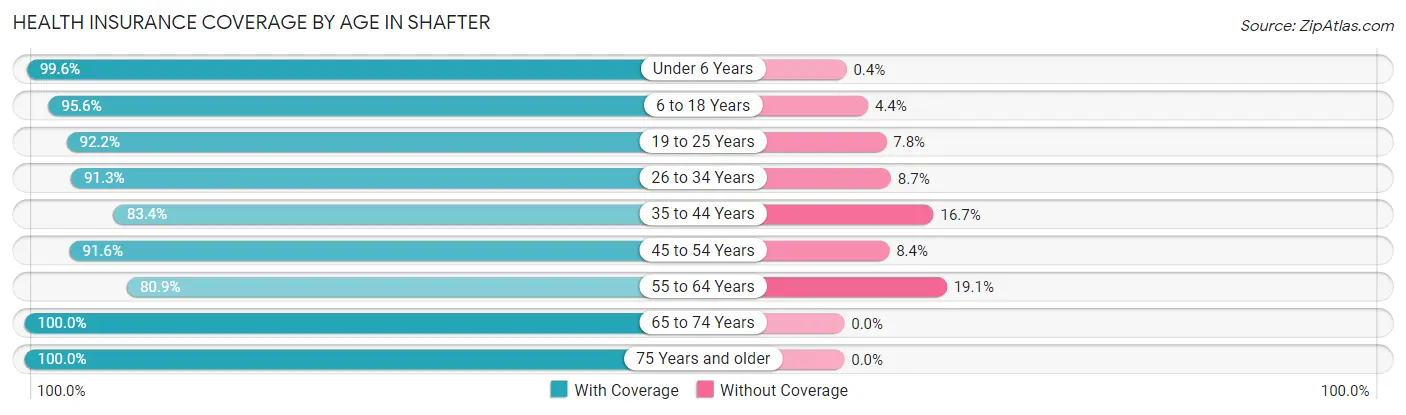
| Age Bracket | With Coverage | Without Coverage |
| Under 6 Years | 1,740 (99.6%) | 7 (0.4%) |
| 6 to 18 Years | 5,242 (95.6%) | 243 (4.4%) |
| 19 to 25 Years | 2,070 (92.2%) | 176 (7.8%) |
| 26 to 34 Years | 2,447 (91.3%) | 233 (8.7%) |
| 35 to 44 Years | 2,267 (83.4%) | 453 (16.7%) |
| 45 to 54 Years | 1,859 (91.6%) | 170 (8.4%) |
| 55 to 64 Years | 1,110 (80.9%) | 262 (19.1%) |
| 65 to 74 Years | 933 (100.0%) | 0 (0.0%) |
| 75 Years and older | 464 (100.0%) | 0 (0.0%) |
| Total | 18,132 (92.1%) | 1,544 (7.9%) |
Health Insurance Coverage by Citizenship Status in Shafter
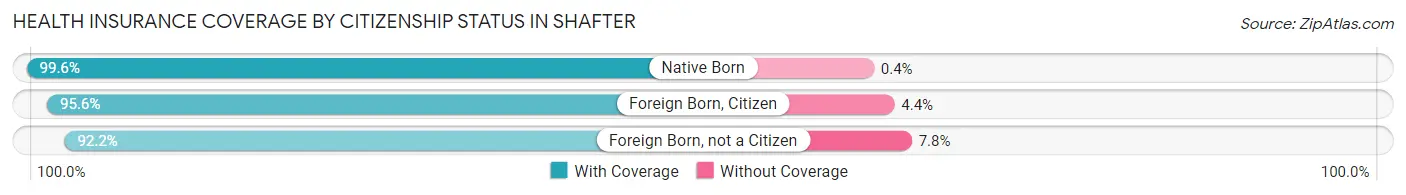
| Citizenship Status | With Coverage | Without Coverage |
| Native Born | 1,740 (99.6%) | 7 (0.4%) |
| Foreign Born, Citizen | 5,242 (95.6%) | 243 (4.4%) |
| Foreign Born, not a Citizen | 2,070 (92.2%) | 176 (7.8%) |
Health Insurance Coverage by Household Income in Shafter
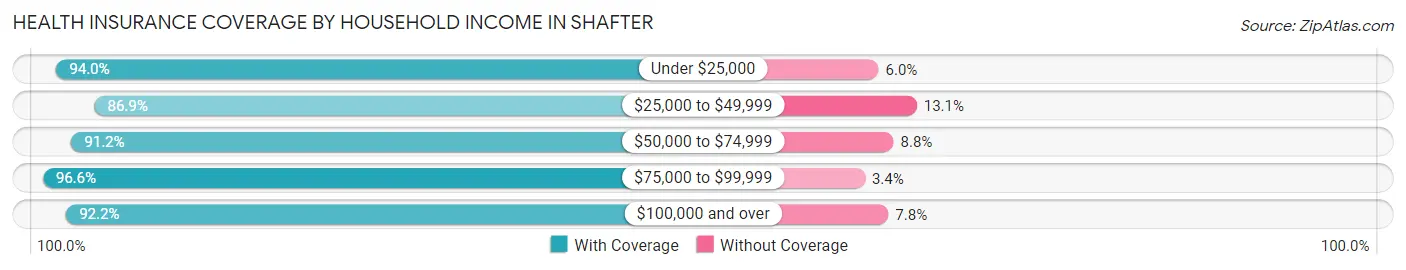
| Household Income | With Coverage | Without Coverage |
| Under $25,000 | 2,114 (94.0%) | 134 (6.0%) |
| $25,000 to $49,999 | 3,526 (86.9%) | 532 (13.1%) |
| $50,000 to $74,999 | 2,953 (91.2%) | 284 (8.8%) |
| $75,000 to $99,999 | 3,932 (96.6%) | 139 (3.4%) |
| $100,000 and over | 5,381 (92.2%) | 455 (7.8%) |
Public vs Private Health Insurance Coverage by Age in Shafter
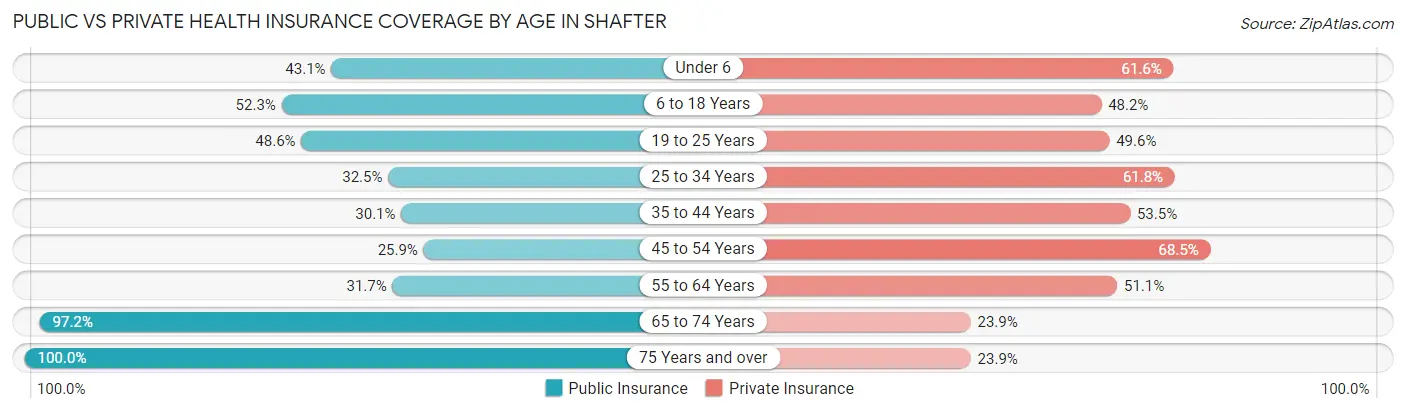
| Age Bracket | Public Insurance | Private Insurance |
| Under 6 | 752 (43.0%) | 1,076 (61.6%) |
| 6 to 18 Years | 2,868 (52.3%) | 2,641 (48.1%) |
| 19 to 25 Years | 1,092 (48.6%) | 1,115 (49.6%) |
| 25 to 34 Years | 871 (32.5%) | 1,657 (61.8%) |
| 35 to 44 Years | 818 (30.1%) | 1,455 (53.5%) |
| 45 to 54 Years | 526 (25.9%) | 1,389 (68.5%) |
| 55 to 64 Years | 435 (31.7%) | 701 (51.1%) |
| 65 to 74 Years | 907 (97.2%) | 223 (23.9%) |
| 75 Years and over | 464 (100.0%) | 111 (23.9%) |
| Total | 8,733 (44.4%) | 10,368 (52.7%) |
Disability Status by Sex by Age in Shafter
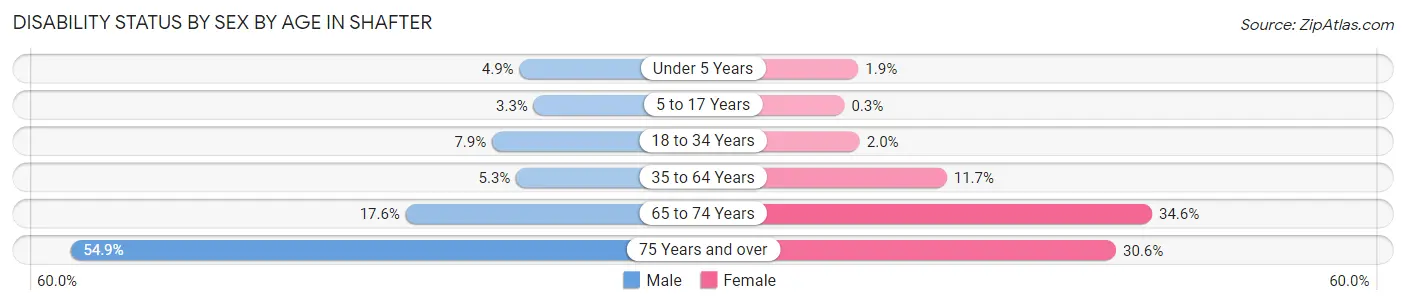
| Age Bracket | Male | Female |
| Under 5 Years | 36 (4.9%) | 13 (1.8%) |
| 5 to 17 Years | 78 (3.3%) | 9 (0.3%) |
| 18 to 34 Years | 204 (7.9%) | 56 (2.0%) |
| 35 to 64 Years | 169 (5.2%) | 339 (11.7%) |
| 65 to 74 Years | 82 (17.6%) | 161 (34.5%) |
| 75 Years and over | 84 (54.9%) | 95 (30.5%) |
Disability Class by Sex by Age in Shafter
Disability Class: Hearing Difficulty
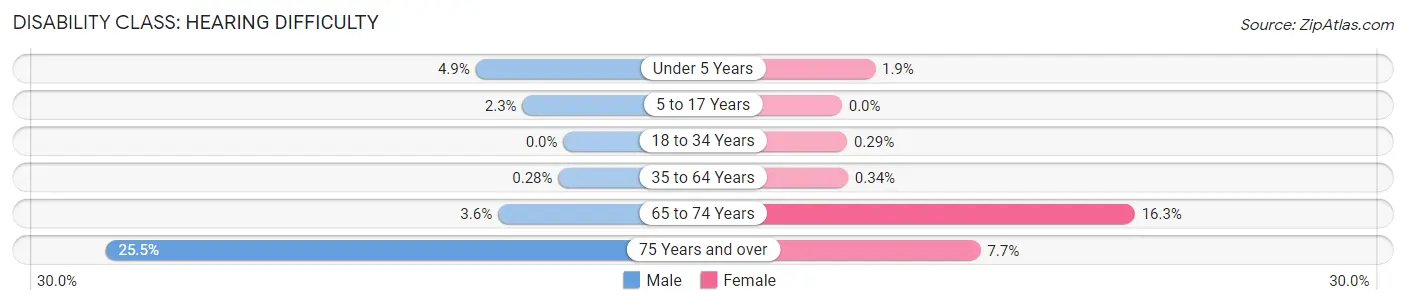
| Age Bracket | Male | Female |
| Under 5 Years | 36 (4.9%) | 13 (1.8%) |
| 5 to 17 Years | 54 (2.3%) | 0 (0.0%) |
| 18 to 34 Years | 0 (0.0%) | 8 (0.3%) |
| 35 to 64 Years | 9 (0.3%) | 10 (0.3%) |
| 65 to 74 Years | 17 (3.6%) | 76 (16.3%) |
| 75 Years and over | 39 (25.5%) | 24 (7.7%) |
Disability Class: Vision Difficulty
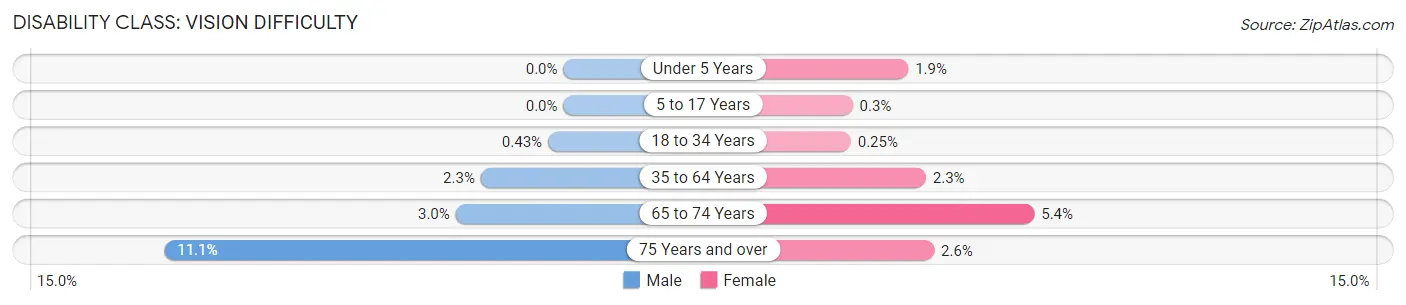
| Age Bracket | Male | Female |
| Under 5 Years | 0 (0.0%) | 13 (1.8%) |
| 5 to 17 Years | 0 (0.0%) | 9 (0.3%) |
| 18 to 34 Years | 11 (0.4%) | 7 (0.3%) |
| 35 to 64 Years | 74 (2.3%) | 68 (2.3%) |
| 65 to 74 Years | 14 (3.0%) | 25 (5.4%) |
| 75 Years and over | 17 (11.1%) | 8 (2.6%) |
Disability Class: Cognitive Difficulty
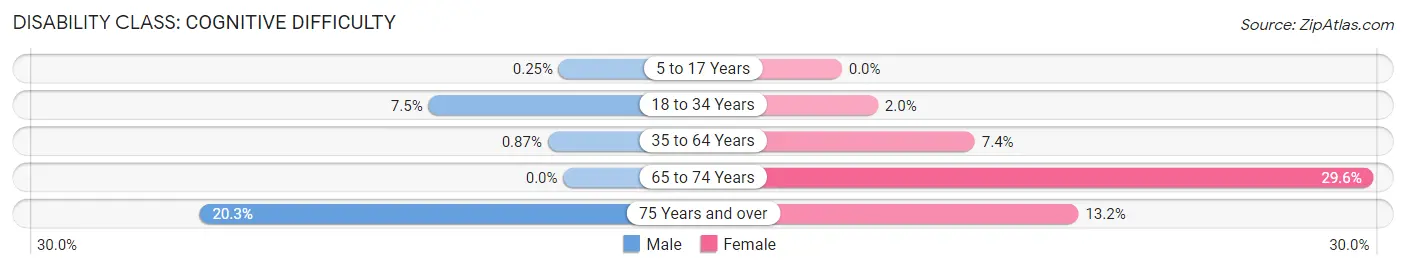
| Age Bracket | Male | Female |
| 5 to 17 Years | 6 (0.3%) | 0 (0.0%) |
| 18 to 34 Years | 193 (7.5%) | 56 (2.0%) |
| 35 to 64 Years | 28 (0.9%) | 215 (7.4%) |
| 65 to 74 Years | 0 (0.0%) | 138 (29.6%) |
| 75 Years and over | 31 (20.3%) | 41 (13.2%) |
Disability Class: Ambulatory Difficulty
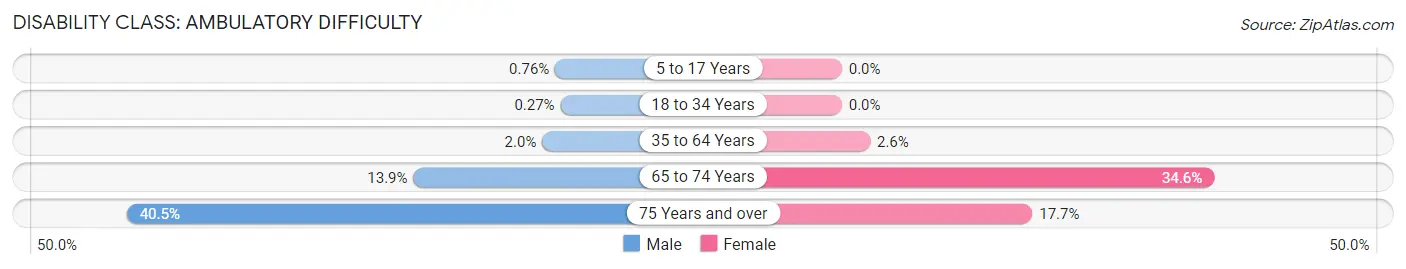
| Age Bracket | Male | Female |
| 5 to 17 Years | 18 (0.8%) | 0 (0.0%) |
| 18 to 34 Years | 7 (0.3%) | 0 (0.0%) |
| 35 to 64 Years | 63 (2.0%) | 76 (2.6%) |
| 65 to 74 Years | 65 (13.9%) | 161 (34.5%) |
| 75 Years and over | 62 (40.5%) | 55 (17.7%) |
Disability Class: Self-Care Difficulty
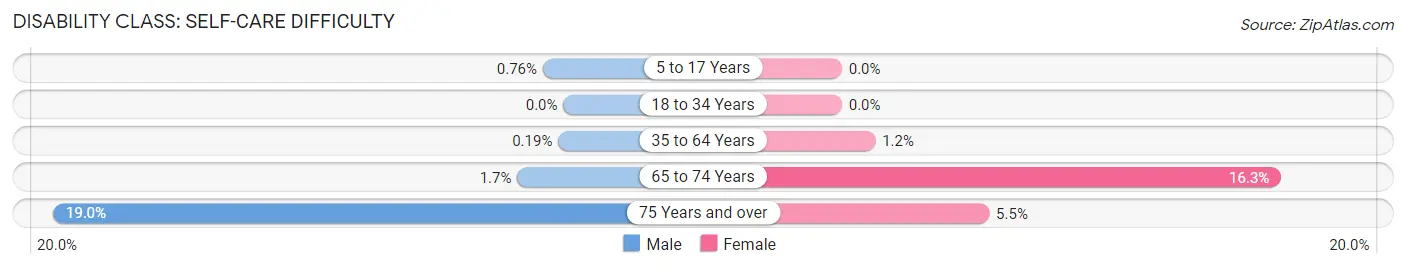
| Age Bracket | Male | Female |
| 5 to 17 Years | 18 (0.8%) | 0 (0.0%) |
| 18 to 34 Years | 0 (0.0%) | 0 (0.0%) |
| 35 to 64 Years | 6 (0.2%) | 36 (1.2%) |
| 65 to 74 Years | 8 (1.7%) | 76 (16.3%) |
| 75 Years and over | 29 (19.0%) | 17 (5.5%) |
Technology Access in Shafter
Computing Device Access in Shafter
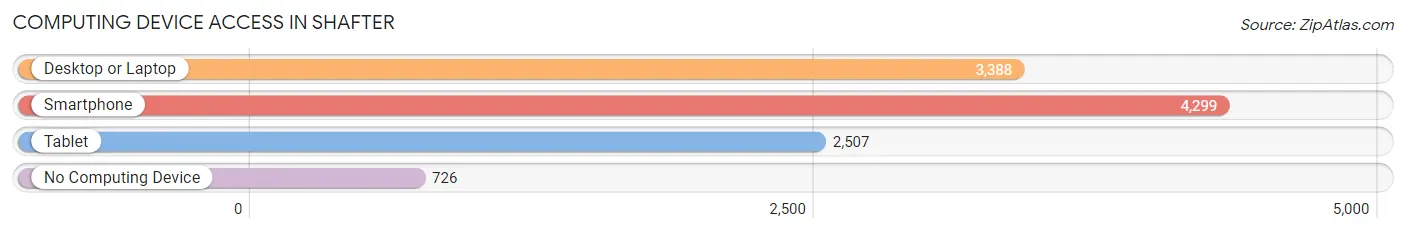
| Device Type | # Households | % Households |
| Desktop or Laptop | 3,388 | 65.7% |
| Smartphone | 4,299 | 83.4% |
| Tablet | 2,507 | 48.6% |
| No Computing Device | 726 | 14.1% |
| Total | 5,158 | 100.0% |
Internet Access in Shafter
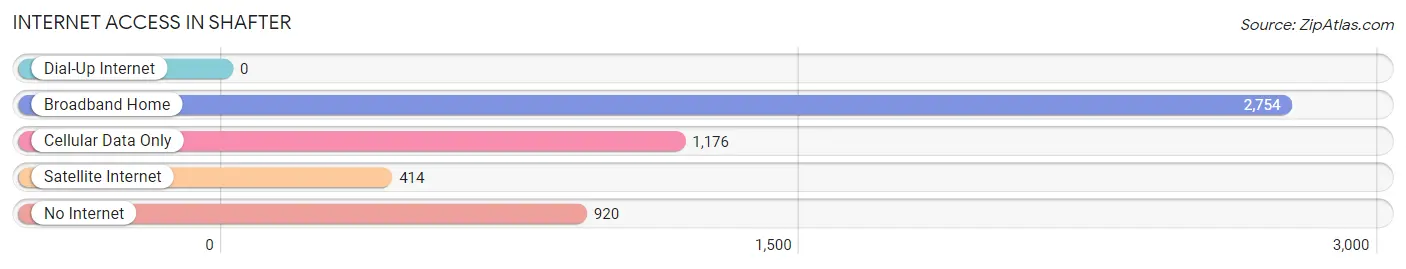
| Internet Type | # Households | % Households |
| Dial-Up Internet | 0 | 0.0% |
| Broadband Home | 2,754 | 53.4% |
| Cellular Data Only | 1,176 | 22.8% |
| Satellite Internet | 414 | 8.0% |
| No Internet | 920 | 17.8% |
| Total | 5,158 | 100.0% |
Shafter Summary
Shafter is a city located in Kern County, California, United States. It is located about 7 miles (11 km) west-northwest of Wasco, at an elevation of about 240 feet (73 m). The population was 16,988 at the 2010 census, up from 12,736 at the 2000 census.
History
The city of Shafter was founded in 1907 by William Henry Shafter, a retired Civil War general. The city was named in his honor. The city was incorporated in 1938.
Geography
Shafter is located at 35°30′33″N 119°17′17″W (35.509050, -119.288100). According to the United States Census Bureau, the city has a total area of 5.3 square miles (13.7 km2), all of it land.
Economy
Shafter is a major agricultural center, with a variety of crops grown in the area. The city is home to a number of food processing plants, including the world's largest pistachio processing plant, operated by Paramount Farms. The city is also home to a number of manufacturing and distribution centers, including a distribution center for Walmart.
Demographics
As of the census of 2000, there were 12,736 people, 3,912 households, and 3,072 families residing in the city. The population density was 2,426.2 people per square mile (936.2/km2). There were 4,084 housing units at an average density of 776.3 per square mile (299.3/km2). The racial makeup of the city was 57.2% White, 1.2% African American, 1.3% Native American, 0.7% Asian, 0.1% Pacific Islander, 36.2% from other races, and 3.3% from two or more races. Hispanic or Latino of any race were 64.2% of the population.
There were 3,912 households, out of which 44.2% had children under the age of 18 living with them, 57.2% were married couples living together, 15.2% had a female householder with no husband present, and 20.7% were non-families. 16.3% of all households were made up of individuals, and 7.2% had someone living alone who was 65 years of age or older. The average household size was 3.23 and the average family size was 3.60.
In the city, the population was spread out, with 33.2% under the age of 18, 10.3% from 18 to 24, 28.2% from 25 to 44, 18.3% from 45 to 64, and 10.0% who were 65 years of age or older. The median age was 30 years. For every 100 females, there were 94.8 males. For every 100 females age 18 and over, there were 90.7 males.
The median income for a household in the city was $30,917, and the median income for a family was $33,867. Males had a median income of $27,817 versus $21,813 for females. The per capita income for the city was $12,945. About 19.2% of families and 22.2% of the population were below the poverty line, including 28.2% of those under age 18 and 10.7% of those age 65 or over.
Common Questions
What is the Total Population of Shafter?
Total Population of Shafter is 20,162.
What is the Total Male Population of Shafter?
Total Male Population of Shafter is 9,985.
What is the Total Female Population of Shafter?
Total Female Population of Shafter is 10,177.
What is the Ratio of Males per 100 Females in Shafter?
There are 98.11 Males per 100 Females in Shafter.
What is the Ratio of Females per 100 Males in Shafter?
There are 101.92 Females per 100 Males in Shafter.
What is the Median Population Age in Shafter?
Median Population Age in Shafter is 27.4 Years.
What is the Average Family Size in Shafter
Average Family Size in Shafter is 4.1 People.
What is the Average Household Size in Shafter
Average Household Size in Shafter is 3.8 People.
What is Per Capita Income in Shafter?
Per Capita income in Shafter is $20,708.
What is the Median Family Income in Shafter?
Median Family Income in Shafter is $64,891.
What is the Median Household income in Shafter?
Median Household Income in Shafter is $66,418.
What is Income or Wage Gap in Shafter?
Income or Wage Gap in Shafter is 28.1%.
Women in Shafter earn 71.9 cents for every dollar earned by a man.
What is Family Income Deficit in Shafter?
Family Income Deficit in Shafter is $10,343.
Families that are below poverty line in Shafter earn $10,343 less on average than the poverty threshold level.
What is Inequality or Gini Index in Shafter?
Inequality or Gini Index in Shafter is 0.40.
How Large is the Labor Force in Shafter?
There are 8,703 People in the Labor Forcein in Shafter.
What is the Percentage of People in the Labor Force in Shafter?
61.0% of People are in the Labor Force in Shafter.
What is the Unemployment Rate in Shafter?
Unemployment Rate in Shafter is 7.1%.