Seacliff, CA
Seacliff Map
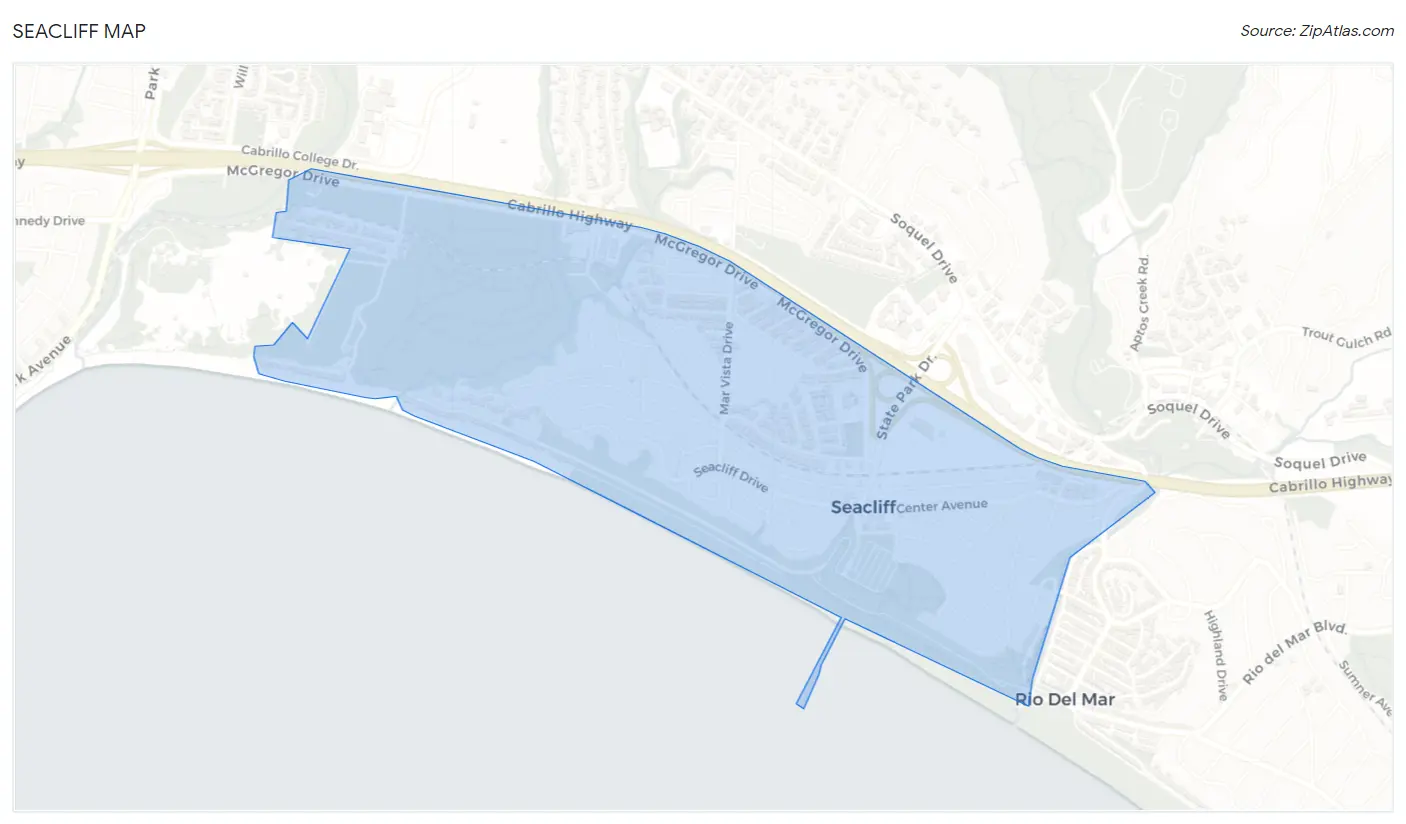
Seacliff Overview
3,550
TOTAL POPULATION
1,672
MALE POPULATION
1,878
FEMALE POPULATION
89.03
MALES / 100 FEMALES
112.32
FEMALES / 100 MALES
43.5
MEDIAN AGE
2.7
AVG FAMILY SIZE
2.1
AVG HOUSEHOLD SIZE
$73,934
PER CAPITA INCOME
$128,553
AVG FAMILY INCOME
$109,269
AVG HOUSEHOLD INCOME
35.1%
WAGE / INCOME GAP [ % ]
64.9¢/ $1
WAGE / INCOME GAP [ $ ]
0.48
INEQUALITY / GINI INDEX
2,209
LABOR FORCE [ PEOPLE ]
71.2%
PERCENT IN LABOR FORCE
6.5%
UNEMPLOYMENT RATE
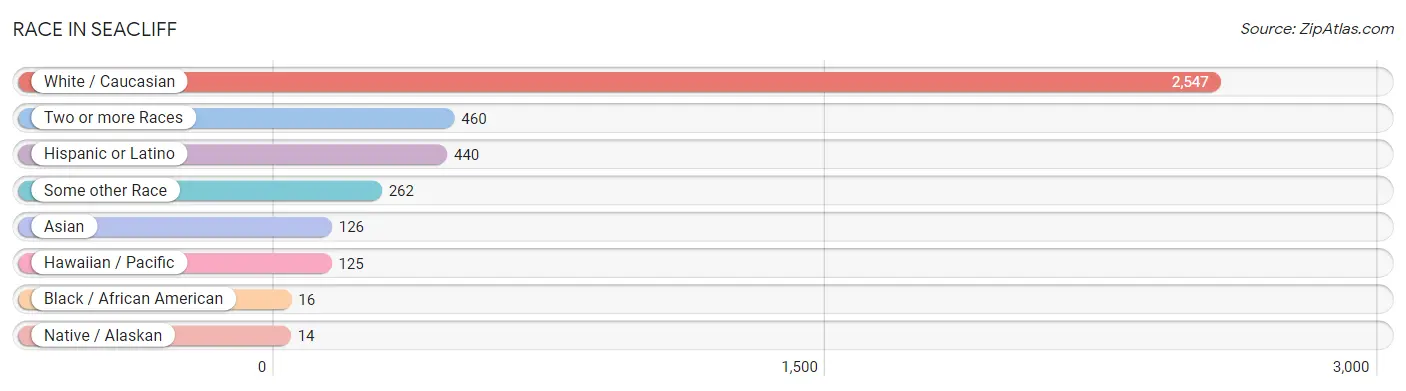
Race in Seacliff
The most populous races in Seacliff are White / Caucasian (2,547 | 71.8%), Two or more Races (460 | 13.0%), and Hispanic or Latino (440 | 12.4%).
| Race | # Population | % Population |
| Asian | 126 | 3.5% |
| Black / African American | 16 | 0.4% |
| Hawaiian / Pacific | 125 | 3.5% |
| Hispanic or Latino | 440 | 12.4% |
| Native / Alaskan | 14 | 0.4% |
| White / Caucasian | 2,547 | 71.8% |
| Two or more Races | 460 | 13.0% |
| Some other Race | 262 | 7.4% |
| Total | 3,550 | 100.0% |
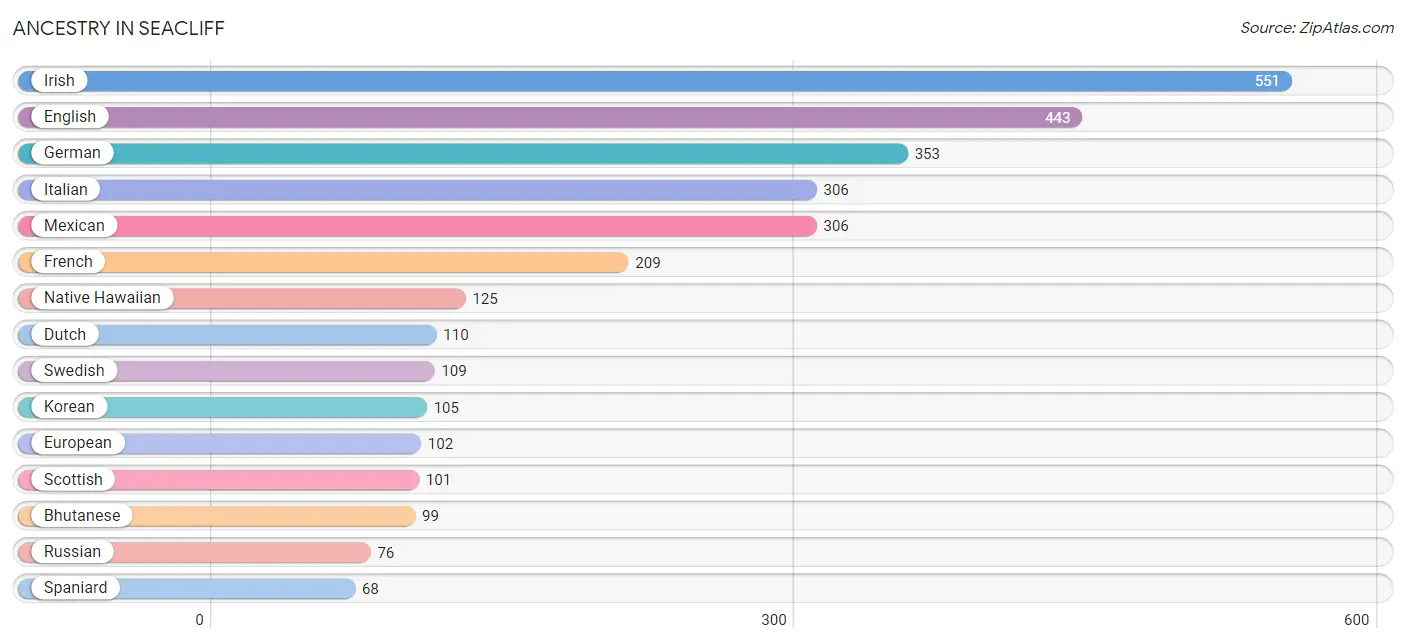
Ancestry in Seacliff
The most populous ancestries reported in Seacliff are Irish (551 | 15.5%), English (443 | 12.5%), German (353 | 9.9%), Italian (306 | 8.6%), and Mexican (306 | 8.6%), together accounting for 55.2% of all Seacliff residents.
| Ancestry | # Population | % Population |
| American | 67 | 1.9% |
| Apache | 21 | 0.6% |
| Arab | 19 | 0.5% |
| Armenian | 33 | 0.9% |
| Basque | 8 | 0.2% |
| Belizean | 32 | 0.9% |
| Bhutanese | 99 | 2.8% |
| Blackfeet | 14 | 0.4% |
| British | 34 | 1.0% |
| Cambodian | 7 | 0.2% |
| Canadian | 10 | 0.3% |
| Central American | 54 | 1.5% |
| Czech | 25 | 0.7% |
| Danish | 53 | 1.5% |
| Dutch | 110 | 3.1% |
| Eastern European | 7 | 0.2% |
| English | 443 | 12.5% |
| European | 102 | 2.9% |
| French | 209 | 5.9% |
| French Canadian | 27 | 0.8% |
| German | 353 | 9.9% |
| Greek | 33 | 0.9% |
| Hungarian | 8 | 0.2% |
| Indian (Asian) | 40 | 1.1% |
| Iranian | 8 | 0.2% |
| Irish | 551 | 15.5% |
| Iroquois | 7 | 0.2% |
| Italian | 306 | 8.6% |
| Japanese | 9 | 0.3% |
| Korean | 105 | 3.0% |
| Maltese | 12 | 0.3% |
| Mexican | 306 | 8.6% |
| Native Hawaiian | 125 | 3.5% |
| New Zealander | 7 | 0.2% |
| Nicaraguan | 16 | 0.4% |
| Northern European | 16 | 0.4% |
| Norwegian | 41 | 1.1% |
| Peruvian | 12 | 0.3% |
| Polish | 48 | 1.3% |
| Portuguese | 37 | 1.0% |
| Russian | 76 | 2.1% |
| Salvadoran | 38 | 1.1% |
| Scandinavian | 14 | 0.4% |
| Scotch-Irish | 46 | 1.3% |
| Scottish | 101 | 2.9% |
| South African | 13 | 0.4% |
| South American | 12 | 0.3% |
| Spaniard | 68 | 1.9% |
| Sri Lankan | 5 | 0.1% |
| Subsaharan African | 13 | 0.4% |
| Swedish | 109 | 3.1% |
| Swiss | 18 | 0.5% |
| Thai | 10 | 0.3% |
| Ukrainian | 21 | 0.6% |
| Welsh | 26 | 0.7% |
| Yaqui | 13 | 0.4% | View All 56 Rows |
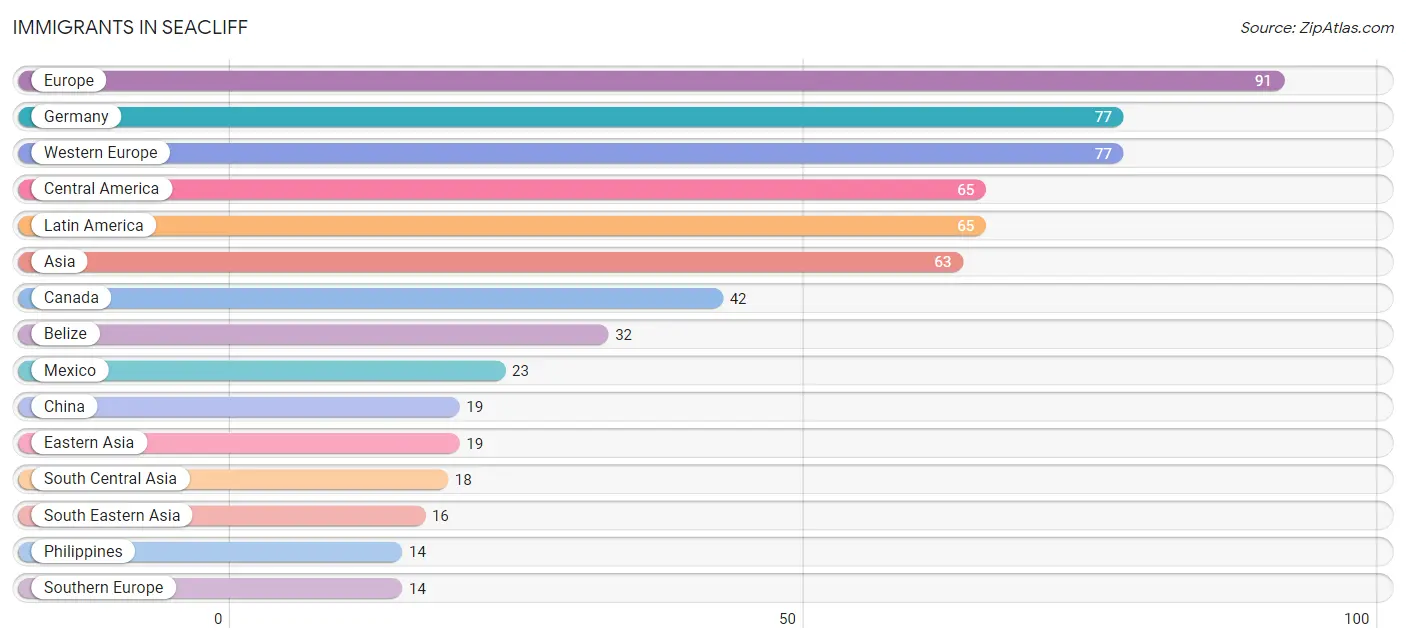
Immigrants in Seacliff
The most numerous immigrant groups reported in Seacliff came from Europe (91 | 2.6%), Germany (77 | 2.2%), Western Europe (77 | 2.2%), Central America (65 | 1.8%), and Latin America (65 | 1.8%), together accounting for 10.6% of all Seacliff residents.
| Immigration Origin | # Population | % Population |
| Asia | 63 | 1.8% |
| Belize | 32 | 0.9% |
| Cambodia | 2 | 0.1% |
| Canada | 42 | 1.2% |
| Central America | 65 | 1.8% |
| China | 19 | 0.5% |
| Costa Rica | 10 | 0.3% |
| Eastern Asia | 19 | 0.5% |
| Europe | 91 | 2.6% |
| Germany | 77 | 2.2% |
| Hong Kong | 10 | 0.3% |
| India | 10 | 0.3% |
| Iran | 8 | 0.2% |
| Israel | 10 | 0.3% |
| Latin America | 65 | 1.8% |
| Mexico | 23 | 0.6% |
| Philippines | 14 | 0.4% |
| South Central Asia | 18 | 0.5% |
| South Eastern Asia | 16 | 0.4% |
| Southern Europe | 14 | 0.4% |
| Spain | 14 | 0.4% |
| Western Asia | 10 | 0.3% |
| Western Europe | 77 | 2.2% | View All 23 Rows |
Sex and Age in Seacliff
Sex and Age in Seacliff
The most populous age groups in Seacliff are 55 to 59 Years (271 | 16.2%) for men and 15 to 19 Years (227 | 12.1%) for women.
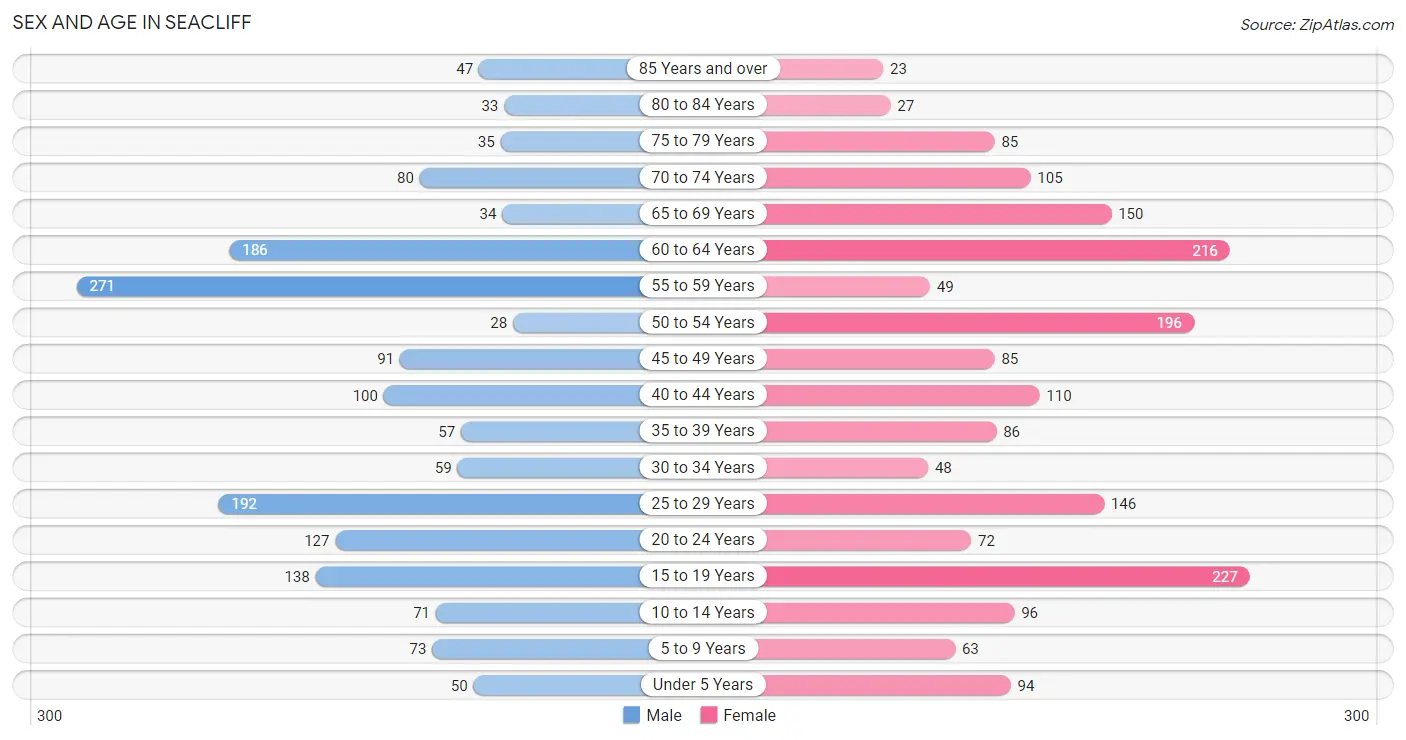
| Age Bracket | Male | Female |
| Under 5 Years | 50 (3.0%) | 94 (5.0%) |
| 5 to 9 Years | 73 (4.4%) | 63 (3.4%) |
| 10 to 14 Years | 71 (4.3%) | 96 (5.1%) |
| 15 to 19 Years | 138 (8.3%) | 227 (12.1%) |
| 20 to 24 Years | 127 (7.6%) | 72 (3.8%) |
| 25 to 29 Years | 192 (11.5%) | 146 (7.8%) |
| 30 to 34 Years | 59 (3.5%) | 48 (2.6%) |
| 35 to 39 Years | 57 (3.4%) | 86 (4.6%) |
| 40 to 44 Years | 100 (6.0%) | 110 (5.9%) |
| 45 to 49 Years | 91 (5.4%) | 85 (4.5%) |
| 50 to 54 Years | 28 (1.7%) | 196 (10.4%) |
| 55 to 59 Years | 271 (16.2%) | 49 (2.6%) |
| 60 to 64 Years | 186 (11.1%) | 216 (11.5%) |
| 65 to 69 Years | 34 (2.0%) | 150 (8.0%) |
| 70 to 74 Years | 80 (4.8%) | 105 (5.6%) |
| 75 to 79 Years | 35 (2.1%) | 85 (4.5%) |
| 80 to 84 Years | 33 (2.0%) | 27 (1.4%) |
| 85 Years and over | 47 (2.8%) | 23 (1.2%) |
| Total | 1,672 (100.0%) | 1,878 (100.0%) |
Families and Households in Seacliff
Median Family Size in Seacliff
The median family size in Seacliff is 2.69 persons per family, with married-couple families (663 | 69.2%) accounting for the largest median family size of 2.82 persons per family. On the other hand, single male/father families (124 | 12.9%) represent the smallest median family size with 1.85 persons per family.
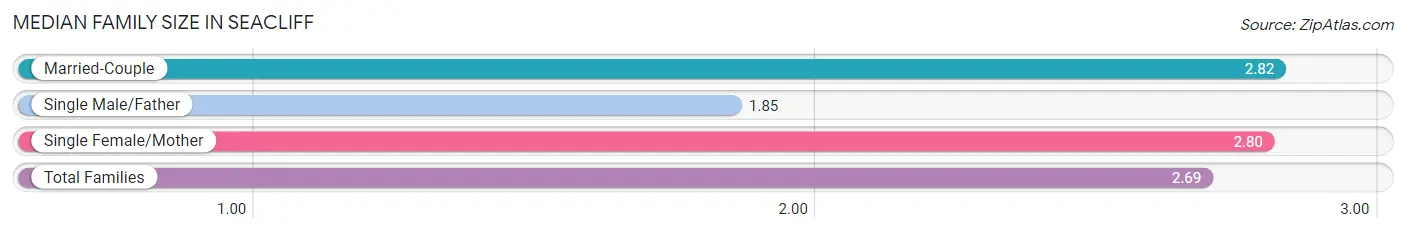
| Family Type | # Families | Family Size |
| Married-Couple | 663 (69.2%) | 2.82 |
| Single Male/Father | 124 (12.9%) | 1.85 |
| Single Female/Mother | 171 (17.8%) | 2.80 |
| Total Families | 958 (100.0%) | 2.69 |
Median Household Size in Seacliff
The median household size in Seacliff is 2.14 persons per household, with single female/mother households (171 | 10.3%) accounting for the largest median household size of 2.97 persons per household. non-family households (698 | 42.1%) represent the smallest median household size with 1.34 persons per household.

| Household Type | # Households | Household Size |
| Married-Couple | 663 (40.0%) | 2.83 |
| Single Male/Father | 124 (7.5%) | 1.85 |
| Single Female/Mother | 171 (10.3%) | 2.97 |
| Non-family | 698 (42.1%) | 1.34 |
| Total Households | 1,656 (100.0%) | 2.14 |
Household Size by Marriage Status in Seacliff
Out of a total of 1,656 households in Seacliff, 958 (57.9%) are family households, while 698 (42.1%) are nonfamily households. The most numerous type of family households are 2-person households, comprising 579, and the most common type of nonfamily households are 1-person households, comprising 543.
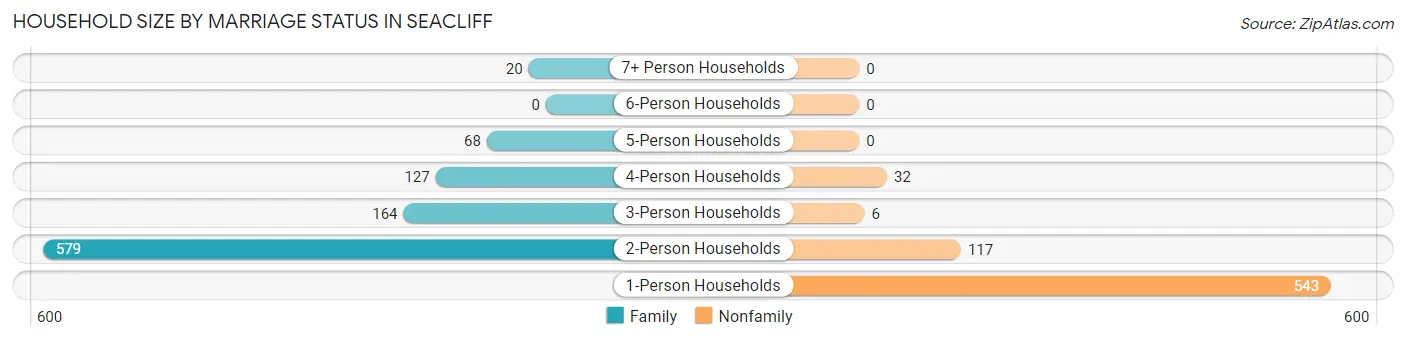
| Household Size | Family Households | Nonfamily Households |
| 1-Person Households | - | 543 (32.8%) |
| 2-Person Households | 579 (35.0%) | 117 (7.1%) |
| 3-Person Households | 164 (9.9%) | 6 (0.4%) |
| 4-Person Households | 127 (7.7%) | 32 (1.9%) |
| 5-Person Households | 68 (4.1%) | 0 (0.0%) |
| 6-Person Households | 0 (0.0%) | 0 (0.0%) |
| 7+ Person Households | 20 (1.2%) | 0 (0.0%) |
| Total | 958 (57.9%) | 698 (42.1%) |
Female Fertility in Seacliff
Fertility by Age in Seacliff
Average fertility rate in Seacliff is 60.0 births per 1,000 women. Women in the age bracket of 35 to 50 years have the highest fertility rate with 92.0 births per 1,000 women. Women in the age bracket of 35 to 50 years acount for 57.5% of all women with births.
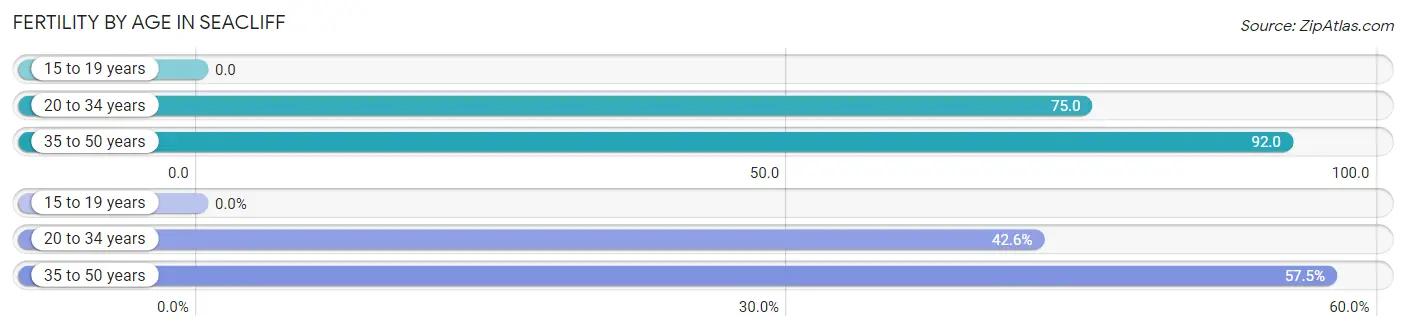
| Age Bracket | Women with Births | Births / 1,000 Women |
| 15 to 19 years | 0 (0.0%) | 0.0 |
| 20 to 34 years | 20 (42.5%) | 75.0 |
| 35 to 50 years | 27 (57.5%) | 92.0 |
| Total | 47 (100.0%) | 60.0 |
Fertility by Age by Marriage Status in Seacliff
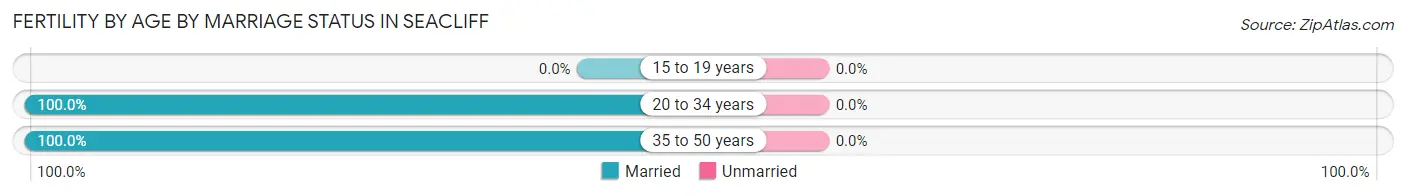
| Age Bracket | Married | Unmarried |
| 15 to 19 years | 0 (0.0%) | 0 (0.0%) |
| 20 to 34 years | 20 (100.0%) | 0 (0.0%) |
| 35 to 50 years | 27 (100.0%) | 0 (0.0%) |
| Total | 47 (100.0%) | 0 (0.0%) |
Fertility by Education in Seacliff
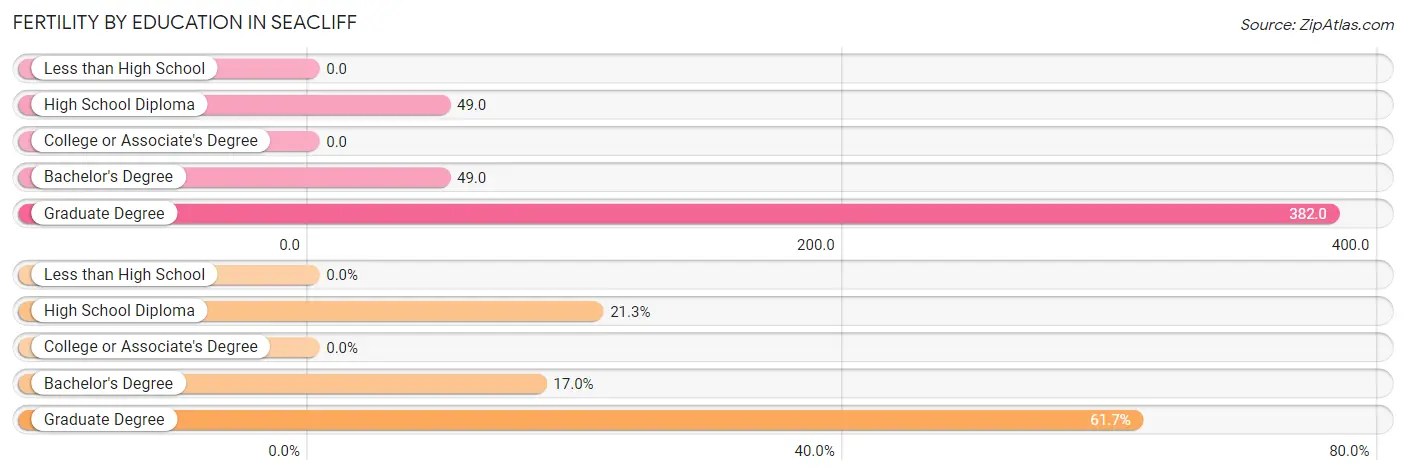
| Educational Attainment | Women with Births | Births / 1,000 Women |
| Less than High School | 0 (0.0%) | 0.0 |
| High School Diploma | 10 (21.3%) | 49.0 |
| College or Associate's Degree | 0 (0.0%) | 0.0 |
| Bachelor's Degree | 8 (17.0%) | 49.0 |
| Graduate Degree | 29 (61.7%) | 382.0 |
| Total | 47 (100.0%) | 60.0 |
Fertility by Education by Marriage Status in Seacliff
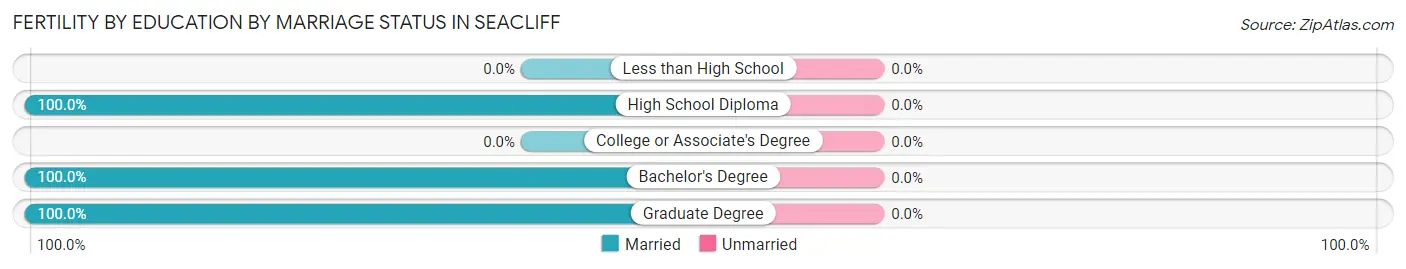
| Educational Attainment | Married | Unmarried |
| Less than High School | 0 (0.0%) | 0 (0.0%) |
| High School Diploma | 10 (100.0%) | 0 (0.0%) |
| College or Associate's Degree | 0 (0.0%) | 0 (0.0%) |
| Bachelor's Degree | 8 (100.0%) | 0 (0.0%) |
| Graduate Degree | 29 (100.0%) | 0 (0.0%) |
| Total | 47 (100.0%) | 0 (0.0%) |
Income in Seacliff
Income Overview in Seacliff
Per Capita Income in Seacliff is $73,934, while median incomes of families and households are $128,553 and $109,269 respectively.
| Characteristic | Number | Measure |
| Per Capita Income | 3,550 | $73,934 |
| Median Family Income | 958 | $128,553 |
| Mean Family Income | 958 | $191,792 |
| Median Household Income | 1,656 | $109,269 |
| Mean Household Income | 1,656 | $159,232 |
| Income Deficit | 958 | $0 |
| Wage / Income Gap (%) | 3,550 | 35.12% |
| Wage / Income Gap ($) | 3,550 | 64.88¢ per $1 |
| Gini / Inequality Index | 3,550 | 0.48 |
Earnings by Sex in Seacliff
Average Earnings in Seacliff are $63,973, $81,319 for men and $52,760 for women, a difference of 35.1%.
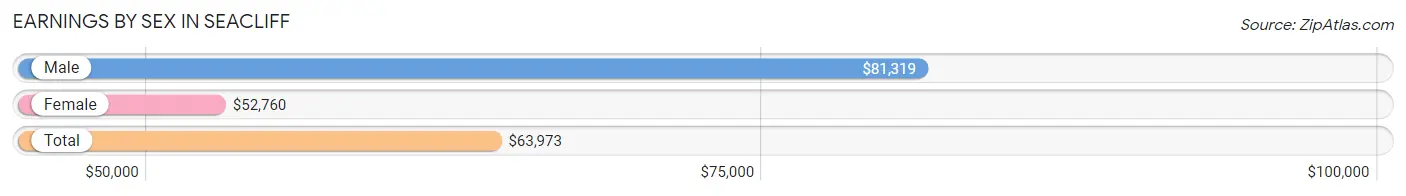
| Sex | Number | Average Earnings |
| Male | 1,138 (50.0%) | $81,319 |
| Female | 1,136 (50.0%) | $52,760 |
| Total | 2,274 (100.0%) | $63,973 |
Earnings by Sex by Income Bracket in Seacliff
The most common earnings brackets in Seacliff are $100,000+ for men (477 | 41.9%) and $100,000+ for women (207 | 18.2%).
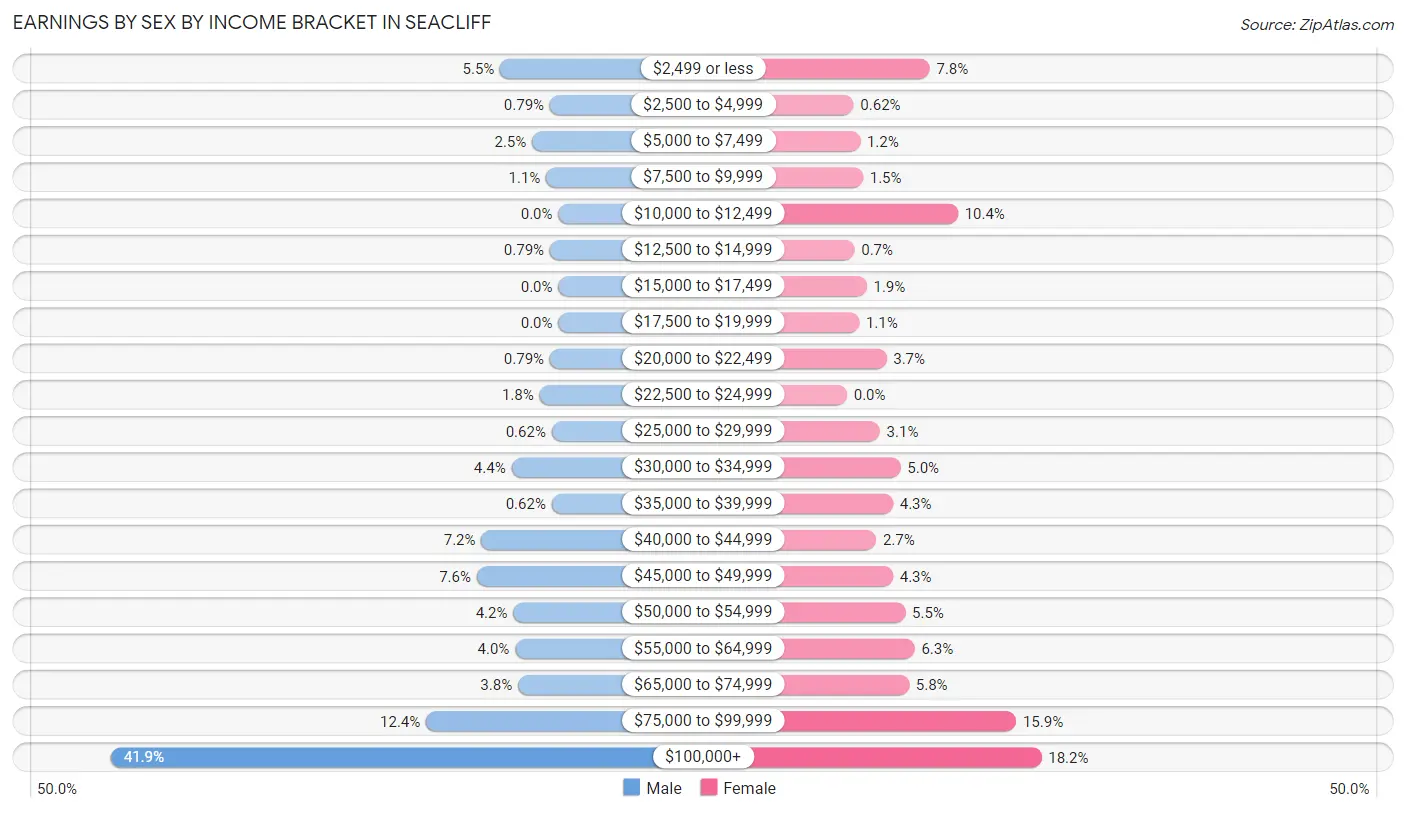
| Income | Male | Female |
| $2,499 or less | 62 (5.4%) | 88 (7.7%) |
| $2,500 to $4,999 | 9 (0.8%) | 7 (0.6%) |
| $5,000 to $7,499 | 28 (2.5%) | 14 (1.2%) |
| $7,500 to $9,999 | 13 (1.1%) | 17 (1.5%) |
| $10,000 to $12,499 | 0 (0.0%) | 118 (10.4%) |
| $12,500 to $14,999 | 9 (0.8%) | 8 (0.7%) |
| $15,000 to $17,499 | 0 (0.0%) | 21 (1.8%) |
| $17,500 to $19,999 | 0 (0.0%) | 13 (1.1%) |
| $20,000 to $22,499 | 9 (0.8%) | 42 (3.7%) |
| $22,500 to $24,999 | 20 (1.8%) | 0 (0.0%) |
| $25,000 to $29,999 | 7 (0.6%) | 35 (3.1%) |
| $30,000 to $34,999 | 50 (4.4%) | 57 (5.0%) |
| $35,000 to $39,999 | 7 (0.6%) | 49 (4.3%) |
| $40,000 to $44,999 | 82 (7.2%) | 31 (2.7%) |
| $45,000 to $49,999 | 87 (7.6%) | 49 (4.3%) |
| $50,000 to $54,999 | 48 (4.2%) | 62 (5.5%) |
| $55,000 to $64,999 | 46 (4.0%) | 72 (6.3%) |
| $65,000 to $74,999 | 43 (3.8%) | 66 (5.8%) |
| $75,000 to $99,999 | 141 (12.4%) | 180 (15.9%) |
| $100,000+ | 477 (41.9%) | 207 (18.2%) |
| Total | 1,138 (100.0%) | 1,136 (100.0%) |
Earnings by Sex by Educational Attainment in Seacliff
Average earnings in Seacliff are $105,066 for men and $64,659 for women, a difference of 38.5%. Men with an educational attainment of college or associate's degree enjoy the highest average annual earnings of $118,488, while those with graduate degree education earn the least with $86,250. Women with an educational attainment of bachelor's degree earn the most with the average annual earnings of $88,750, while those with less than high school education have the smallest earnings of $63,409.
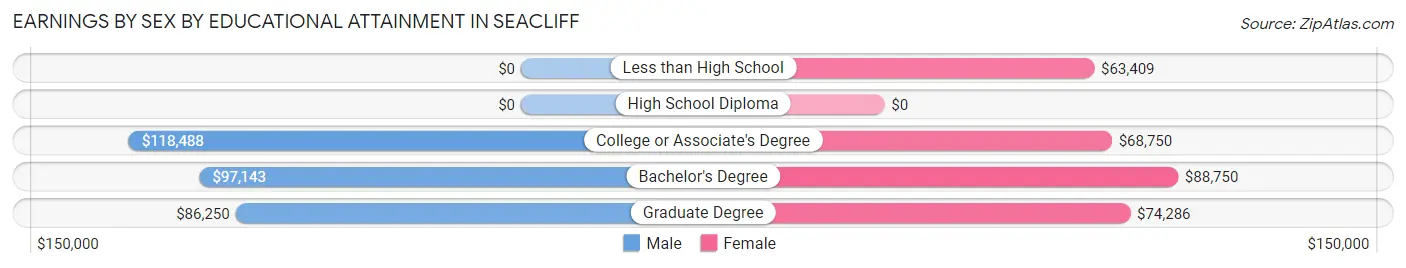
| Educational Attainment | Male Income | Female Income |
| Less than High School | - | - |
| High School Diploma | - | - |
| College or Associate's Degree | $118,488 | $68,750 |
| Bachelor's Degree | $97,143 | $88,750 |
| Graduate Degree | $86,250 | $74,286 |
| Total | $105,066 | $64,659 |
Family Income in Seacliff
Family Income Brackets in Seacliff
According to the Seacliff family income data, there are 337 families falling into the $200,000+ income range, which is the most common income bracket and makes up 35.2% of all families. Conversely, the less than $10,000 income bracket is the least frequent group with only 4 families (0.4%) belonging to this category.
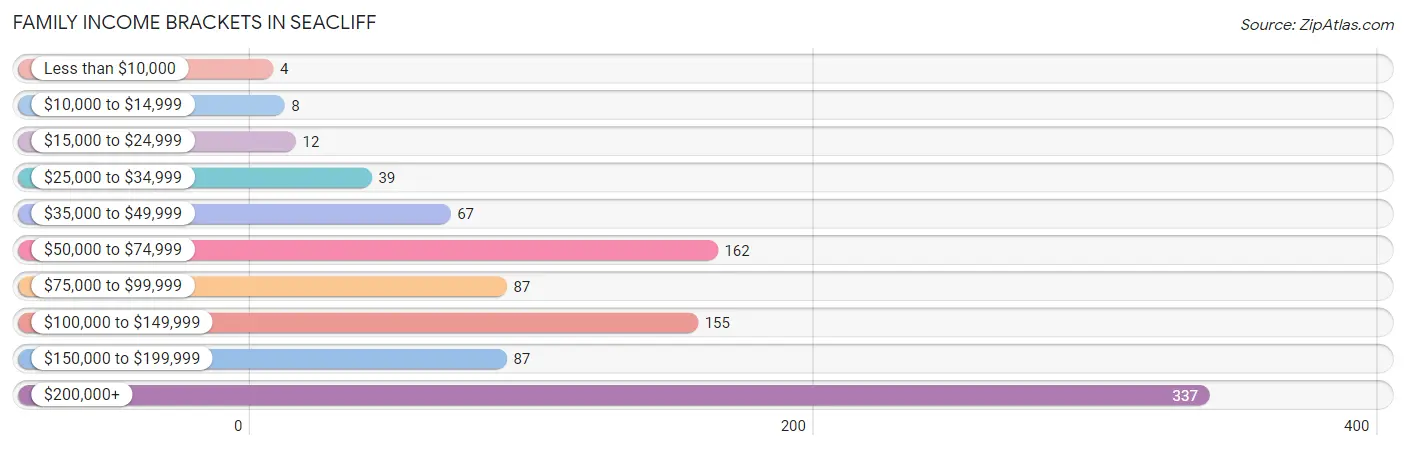
| Income Bracket | # Families | % Families |
| Less than $10,000 | 4 | 0.4% |
| $10,000 to $14,999 | 8 | 0.8% |
| $15,000 to $24,999 | 12 | 1.3% |
| $25,000 to $34,999 | 39 | 4.1% |
| $35,000 to $49,999 | 67 | 7.0% |
| $50,000 to $74,999 | 162 | 16.9% |
| $75,000 to $99,999 | 87 | 9.1% |
| $100,000 to $149,999 | 155 | 16.2% |
| $150,000 to $199,999 | 87 | 9.1% |
| $200,000+ | 337 | 35.2% |
Family Income by Famaliy Size in Seacliff
3-person families (143 | 14.9%) account for the highest median family income in Seacliff with $220,770 per family, while 3-person families (143 | 14.9%) have the highest median income of $73,590 per family member.
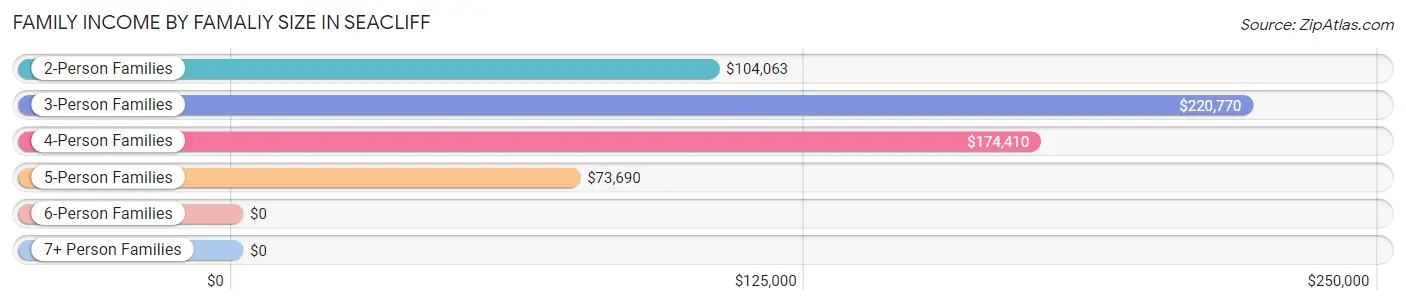
| Income Bracket | # Families | Median Income |
| 2-Person Families | 600 (62.6%) | $104,063 |
| 3-Person Families | 143 (14.9%) | $220,770 |
| 4-Person Families | 145 (15.1%) | $174,410 |
| 5-Person Families | 50 (5.2%) | $73,690 |
| 6-Person Families | 0 (0.0%) | $0 |
| 7+ Person Families | 20 (2.1%) | $0 |
| Total | 958 (100.0%) | $128,553 |
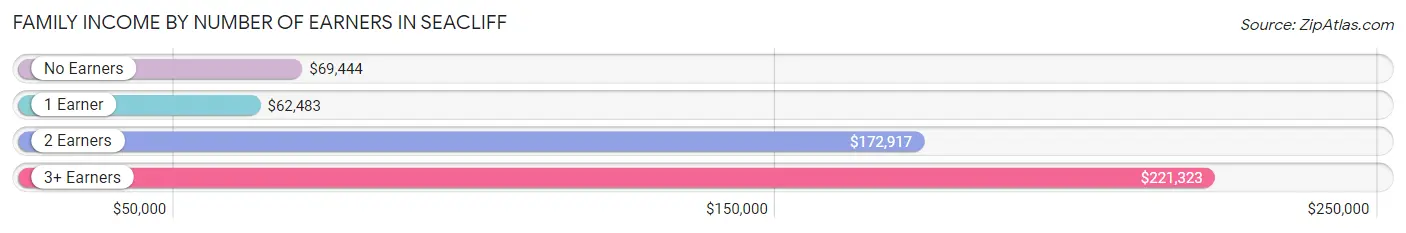
Family Income by Number of Earners in Seacliff
The median family income in Seacliff is $128,553, with families comprising 3+ earners (109) having the highest median family income of $221,323, while families with 1 earner (263) have the lowest median family income of $62,483, accounting for 11.4% and 27.5% of families, respectively.
| Number of Earners | # Families | Median Income |
| No Earners | 118 (12.3%) | $69,444 |
| 1 Earner | 263 (27.5%) | $62,483 |
| 2 Earners | 468 (48.8%) | $172,917 |
| 3+ Earners | 109 (11.4%) | $221,323 |
| Total | 958 (100.0%) | $128,553 |
Household Income in Seacliff
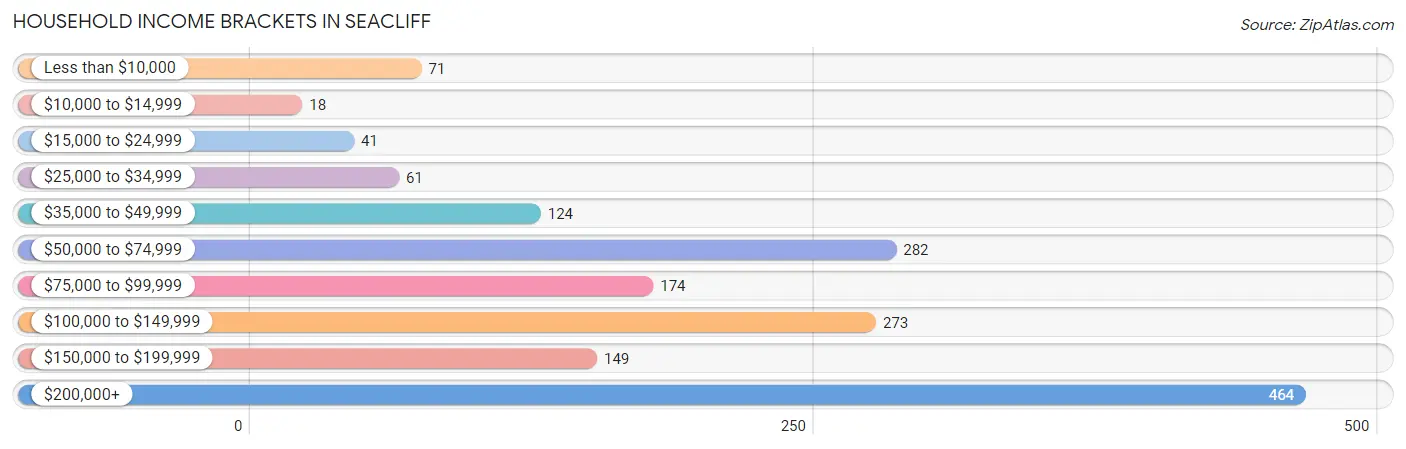
Household Income Brackets in Seacliff
With 464 households falling in the category, the $200,000+ income range is the most frequent in Seacliff, accounting for 28.0% of all households. In contrast, only 18 households (1.1%) fall into the $10,000 to $14,999 income bracket, making it the least populous group.
| Income Bracket | # Households | % Households |
| Less than $10,000 | 71 | 4.3% |
| $10,000 to $14,999 | 18 | 1.1% |
| $15,000 to $24,999 | 41 | 2.5% |
| $25,000 to $34,999 | 61 | 3.7% |
| $35,000 to $49,999 | 124 | 7.5% |
| $50,000 to $74,999 | 282 | 17.0% |
| $75,000 to $99,999 | 174 | 10.5% |
| $100,000 to $149,999 | 273 | 16.5% |
| $150,000 to $199,999 | 149 | 9.0% |
| $200,000+ | 464 | 28.0% |
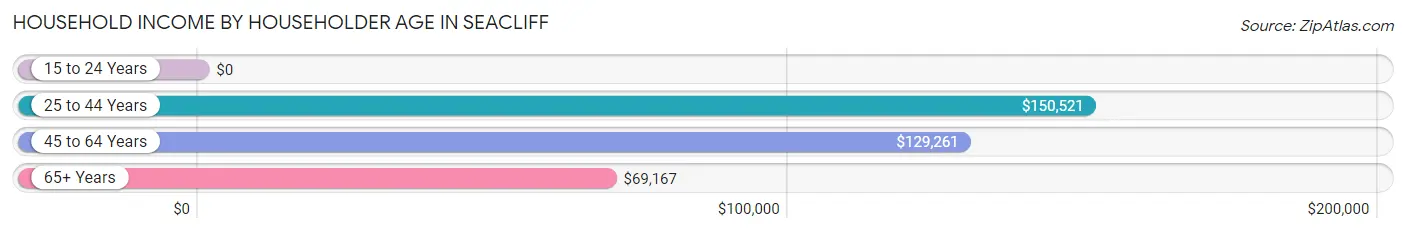
Household Income by Householder Age in Seacliff
The median household income in Seacliff is $109,269, with the highest median household income of $150,521 found in the 25 to 44 years age bracket for the primary householder. A total of 359 households (21.7%) fall into this category. Meanwhile, the 15 to 24 years age bracket for the primary householder has the lowest median household income of $0, with 110 households (6.6%) in this group.
| Income Bracket | # Households | Median Income |
| 15 to 24 Years | 110 (6.6%) | $0 |
| 25 to 44 Years | 359 (21.7%) | $150,521 |
| 45 to 64 Years | 771 (46.6%) | $129,261 |
| 65+ Years | 416 (25.1%) | $69,167 |
| Total | 1,656 (100.0%) | $109,269 |
Poverty in Seacliff
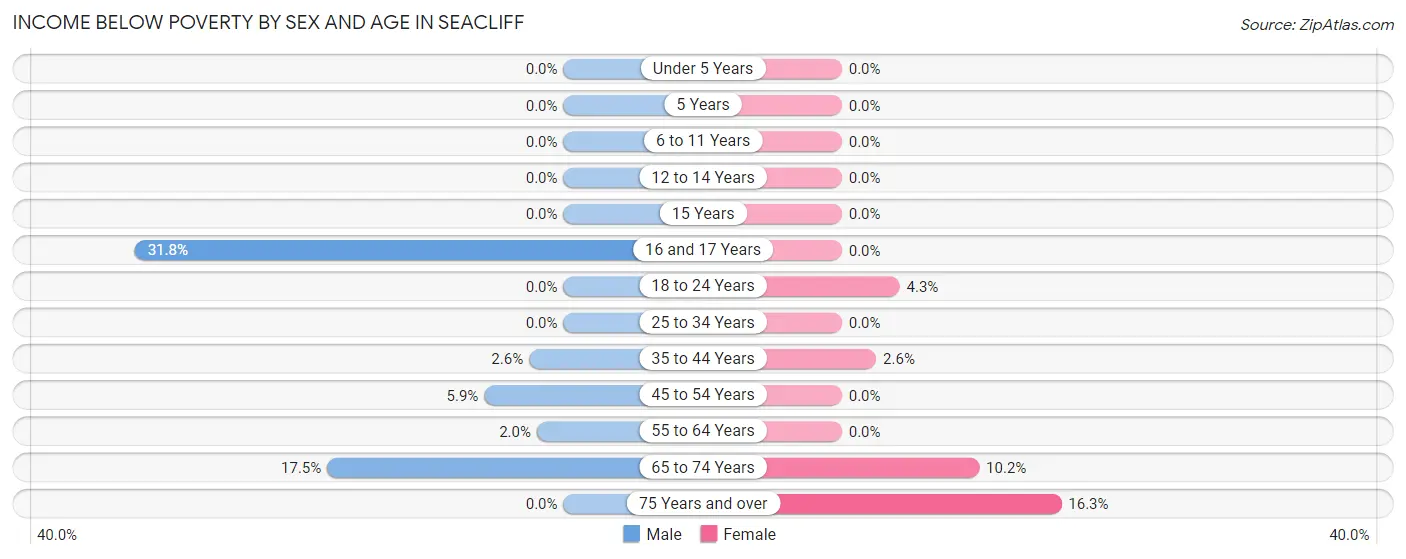
Income Below Poverty by Sex and Age in Seacliff
With 4.1% poverty level for males and 3.4% for females among the residents of Seacliff, 16 and 17 year old males and 75 year old and over females are the most vulnerable to poverty, with 28 males (31.8%) and 22 females (16.3%) in their respective age groups living below the poverty level.
| Age Bracket | Male | Female |
| Under 5 Years | 0 (0.0%) | 0 (0.0%) |
| 5 Years | 0 (0.0%) | 0 (0.0%) |
| 6 to 11 Years | 0 (0.0%) | 0 (0.0%) |
| 12 to 14 Years | 0 (0.0%) | 0 (0.0%) |
| 15 Years | 0 (0.0%) | 0 (0.0%) |
| 16 and 17 Years | 28 (31.8%) | 0 (0.0%) |
| 18 to 24 Years | 0 (0.0%) | 10 (4.3%) |
| 25 to 34 Years | 0 (0.0%) | 0 (0.0%) |
| 35 to 44 Years | 4 (2.5%) | 5 (2.5%) |
| 45 to 54 Years | 7 (5.9%) | 0 (0.0%) |
| 55 to 64 Years | 9 (2.0%) | 0 (0.0%) |
| 65 to 74 Years | 20 (17.5%) | 26 (10.2%) |
| 75 Years and over | 0 (0.0%) | 22 (16.3%) |
| Total | 68 (4.1%) | 63 (3.4%) |
Income Above Poverty by Sex and Age in Seacliff
According to the poverty statistics in Seacliff, males aged under 5 years and females aged under 5 years are the age groups that are most secure financially, with 100.0% of males and 100.0% of females in these age groups living above the poverty line.
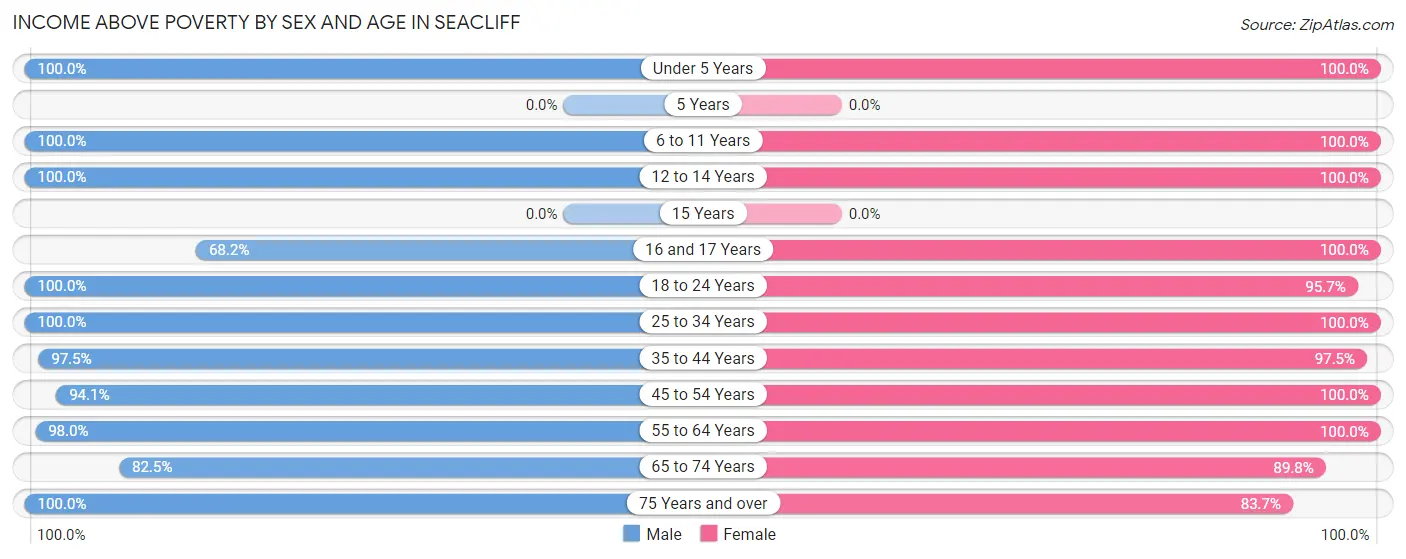
| Age Bracket | Male | Female |
| Under 5 Years | 50 (100.0%) | 86 (100.0%) |
| 5 Years | 0 (0.0%) | 0 (0.0%) |
| 6 to 11 Years | 105 (100.0%) | 107 (100.0%) |
| 12 to 14 Years | 39 (100.0%) | 52 (100.0%) |
| 15 Years | 0 (0.0%) | 0 (0.0%) |
| 16 and 17 Years | 60 (68.2%) | 66 (100.0%) |
| 18 to 24 Years | 177 (100.0%) | 223 (95.7%) |
| 25 to 34 Years | 251 (100.0%) | 194 (100.0%) |
| 35 to 44 Years | 153 (97.5%) | 191 (97.5%) |
| 45 to 54 Years | 112 (94.1%) | 281 (100.0%) |
| 55 to 64 Years | 448 (98.0%) | 265 (100.0%) |
| 65 to 74 Years | 94 (82.5%) | 229 (89.8%) |
| 75 Years and over | 115 (100.0%) | 113 (83.7%) |
| Total | 1,604 (95.9%) | 1,807 (96.6%) |
Income Below Poverty Among Married-Couple Families in Seacliff
The poverty statistics for married-couple families in Seacliff show that 1.8% or 12 of the total 663 families live below the poverty line. Families with no children have the highest poverty rate of 2.3%, comprising of 12 families. On the other hand, families with 1 or 2 children have the lowest poverty rate of 0.0%, which includes 0 families.
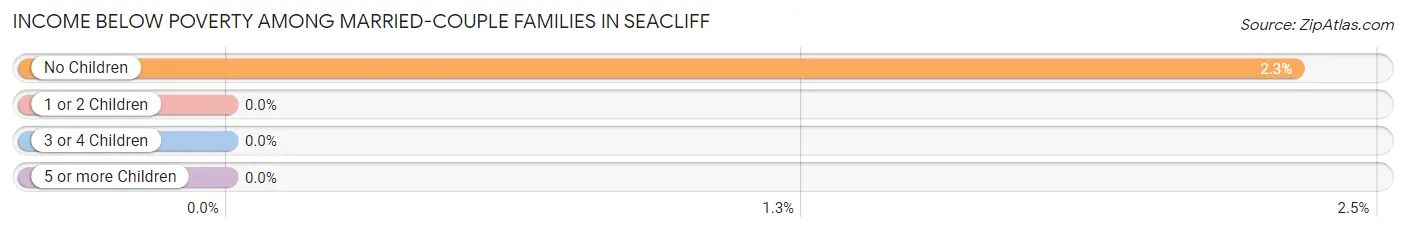
| Children | Above Poverty | Below Poverty |
| No Children | 505 (97.7%) | 12 (2.3%) |
| 1 or 2 Children | 104 (100.0%) | 0 (0.0%) |
| 3 or 4 Children | 22 (100.0%) | 0 (0.0%) |
| 5 or more Children | 20 (100.0%) | 0 (0.0%) |
| Total | 651 (98.2%) | 12 (1.8%) |
Income Below Poverty Among Single-Parent Households in Seacliff
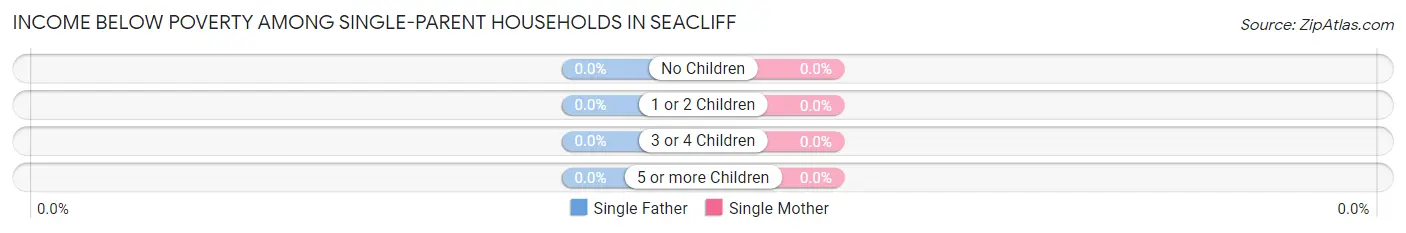
| Children | Single Father | Single Mother |
| No Children | 0 (0.0%) | 0 (0.0%) |
| 1 or 2 Children | 0 (0.0%) | 0 (0.0%) |
| 3 or 4 Children | 0 (0.0%) | 0 (0.0%) |
| 5 or more Children | 0 (0.0%) | 0 (0.0%) |
| Total | 0 (0.0%) | 0 (0.0%) |
Income Below Poverty Among Married-Couple vs Single-Parent Households in Seacliff
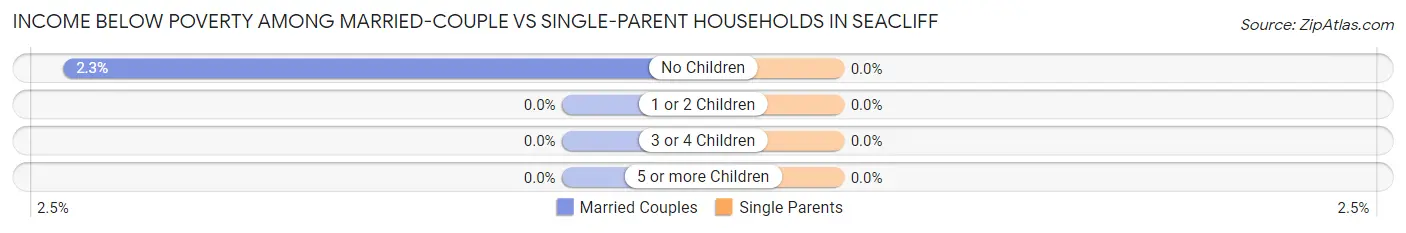
| Children | Married-Couple Families | Single-Parent Households |
| No Children | 12 (2.3%) | 0 (0.0%) |
| 1 or 2 Children | 0 (0.0%) | 0 (0.0%) |
| 3 or 4 Children | 0 (0.0%) | 0 (0.0%) |
| 5 or more Children | 0 (0.0%) | 0 (0.0%) |
| Total | 12 (1.8%) | 0 (0.0%) |
Employment Characteristics in Seacliff
Employment by Class of Employer in Seacliff
Among the 2,059 employed individuals in Seacliff, private company employees (1,411 | 68.5%), local government employees (228 | 11.1%), and self-employed (not incorporated) (206 | 10.0%) make up the most common classes of employment.
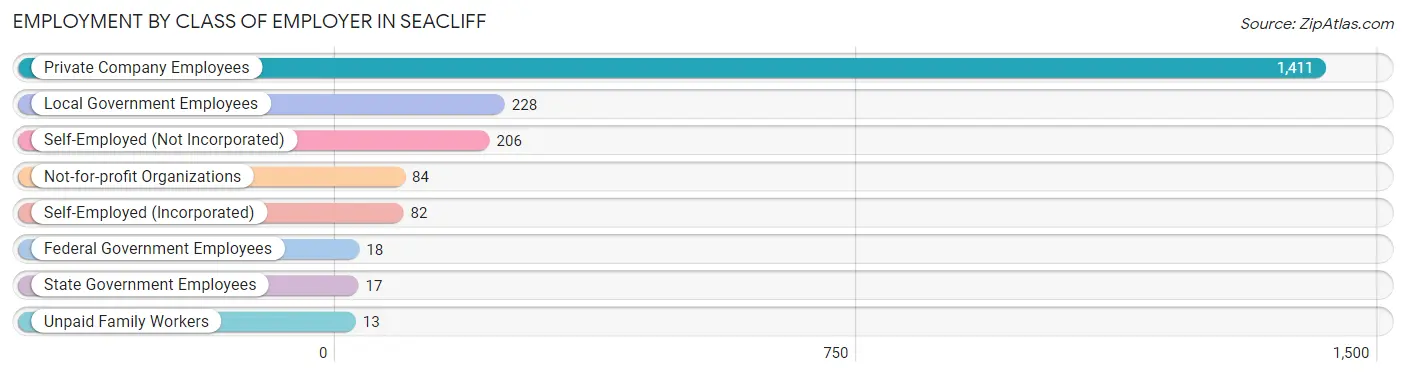
| Employer Class | # Employees | % Employees |
| Private Company Employees | 1,411 | 68.5% |
| Self-Employed (Incorporated) | 82 | 4.0% |
| Self-Employed (Not Incorporated) | 206 | 10.0% |
| Not-for-profit Organizations | 84 | 4.1% |
| Local Government Employees | 228 | 11.1% |
| State Government Employees | 17 | 0.8% |
| Federal Government Employees | 18 | 0.9% |
| Unpaid Family Workers | 13 | 0.6% |
| Total | 2,059 | 100.0% |
Employment Status by Age in Seacliff
According to the labor force statistics for Seacliff, out of the total population over 16 years of age (3,103), 71.2% or 2,209 individuals are in the labor force, with 6.5% or 144 of them unemployed. The age group with the highest labor force participation rate is 25 to 29 years, with 100.0% or 338 individuals in the labor force. Within the labor force, the 75 years and over age range has the highest percentage of unemployed individuals, with 25.6% or 10 of them being unemployed.
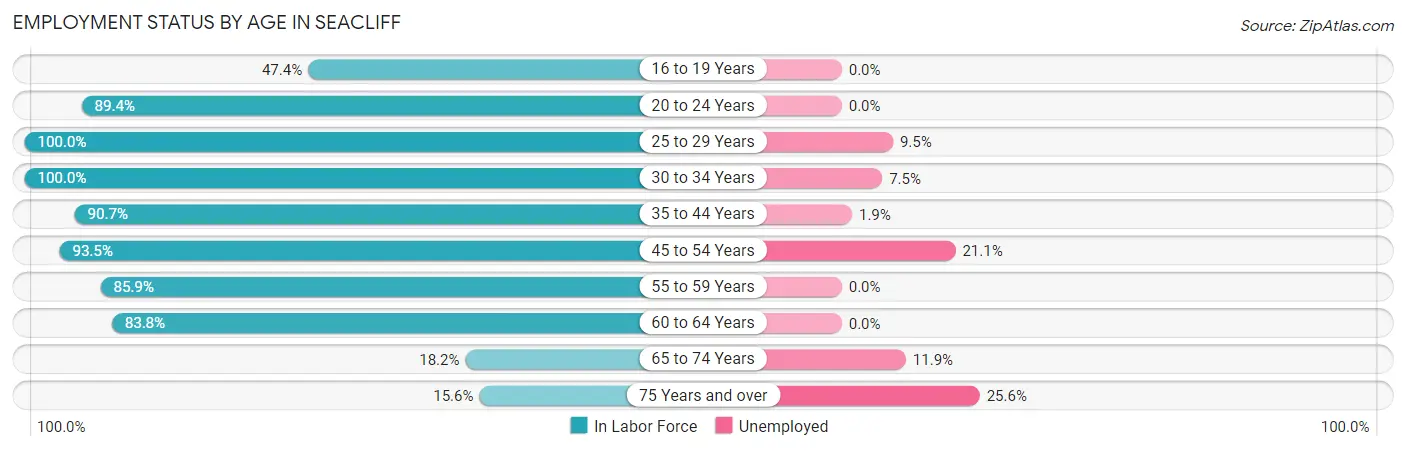
| Age Bracket | In Labor Force | Unemployed |
| 16 to 19 Years | 173 (47.4%) | 0 (0.0%) |
| 20 to 24 Years | 178 (89.4%) | 0 (0.0%) |
| 25 to 29 Years | 338 (100.0%) | 32 (9.5%) |
| 30 to 34 Years | 107 (100.0%) | 8 (7.5%) |
| 35 to 44 Years | 320 (90.7%) | 6 (1.9%) |
| 45 to 54 Years | 374 (93.5%) | 79 (21.1%) |
| 55 to 59 Years | 275 (85.9%) | 0 (0.0%) |
| 60 to 64 Years | 337 (83.8%) | 0 (0.0%) |
| 65 to 74 Years | 67 (18.2%) | 8 (11.9%) |
| 75 Years and over | 39 (15.6%) | 10 (25.6%) |
| Total | 2,209 (71.2%) | 144 (6.5%) |
Employment Status by Educational Attainment in Seacliff
According to labor force statistics for Seacliff, 91.2% of individuals (1,751) out of the total population between 25 and 64 years of age (1,920) are in the labor force, with 7.1% or 124 of them being unemployed. The group with the highest labor force participation rate are those with the educational attainment of less than high school, with 100.0% or 42 individuals in the labor force. Within the labor force, individuals with high school diploma education have the highest percentage of unemployment, with 11.6% or 32 of them being unemployed.
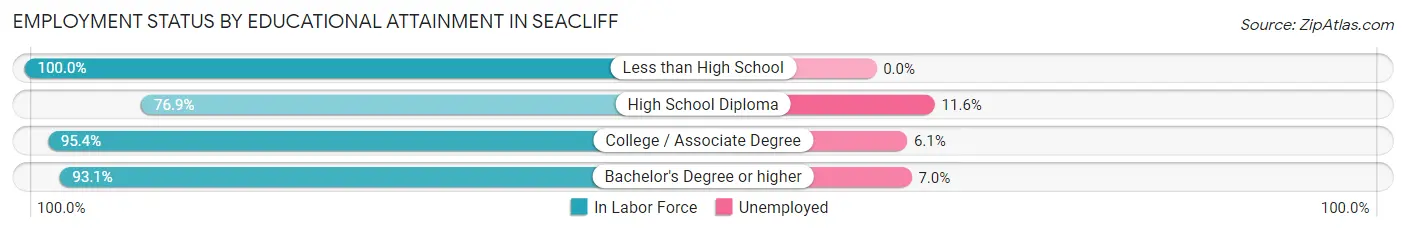
| Educational Attainment | In Labor Force | Unemployed |
| Less than High School | 42 (100.0%) | 0 (0.0%) |
| High School Diploma | 276 (76.9%) | 42 (11.6%) |
| College / Associate Degree | 774 (95.4%) | 49 (6.1%) |
| Bachelor's Degree or higher | 659 (93.1%) | 50 (7.0%) |
| Total | 1,751 (91.2%) | 136 (7.1%) |
Employment Occupations by Sex in Seacliff
Management, Business, Science and Arts Occupations
The most common Management, Business, Science and Arts occupations in Seacliff are Computers, Engineering & Science (265 | 12.8%), Community & Social Service (254 | 12.3%), Management (223 | 10.8%), Health Diagnosing & Treating (206 | 10.0%), and Education Instruction & Library (186 | 9.0%).
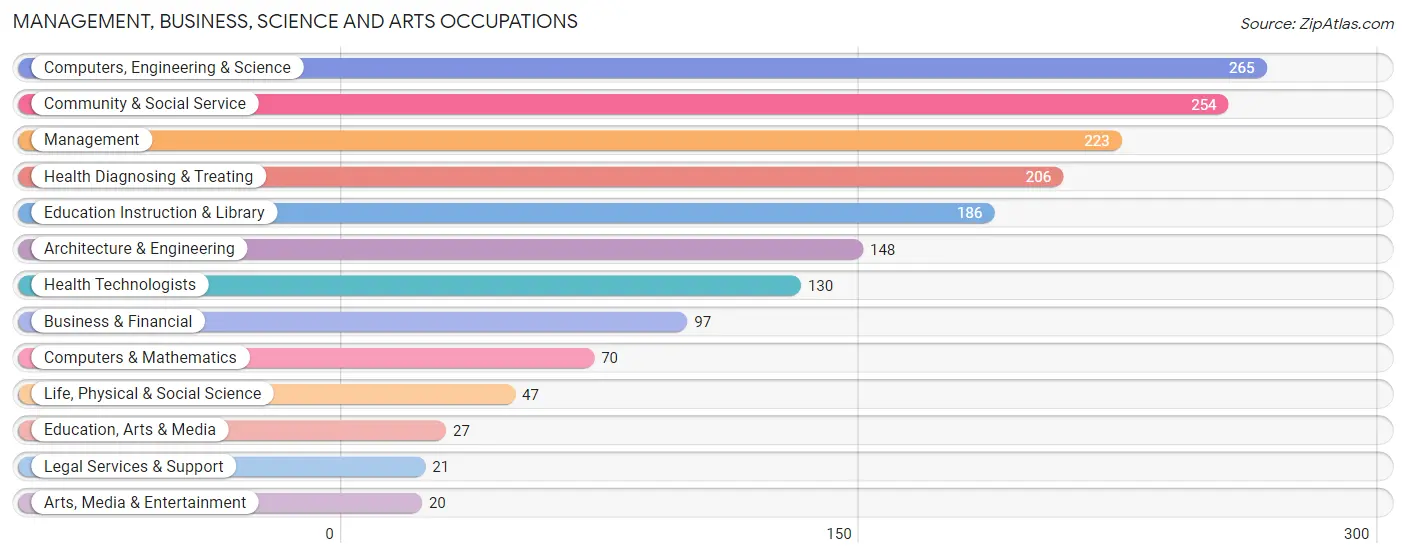
Management, Business, Science and Arts Occupations by Sex
Within the Management, Business, Science and Arts occupations in Seacliff, the most male-oriented occupations are Architecture & Engineering (89.9%), Computers & Mathematics (81.4%), and Computers, Engineering & Science (76.6%), while the most female-oriented occupations are Health Diagnosing & Treating (80.1%), Health Technologists (73.1%), and Life, Physical & Social Science (72.3%).
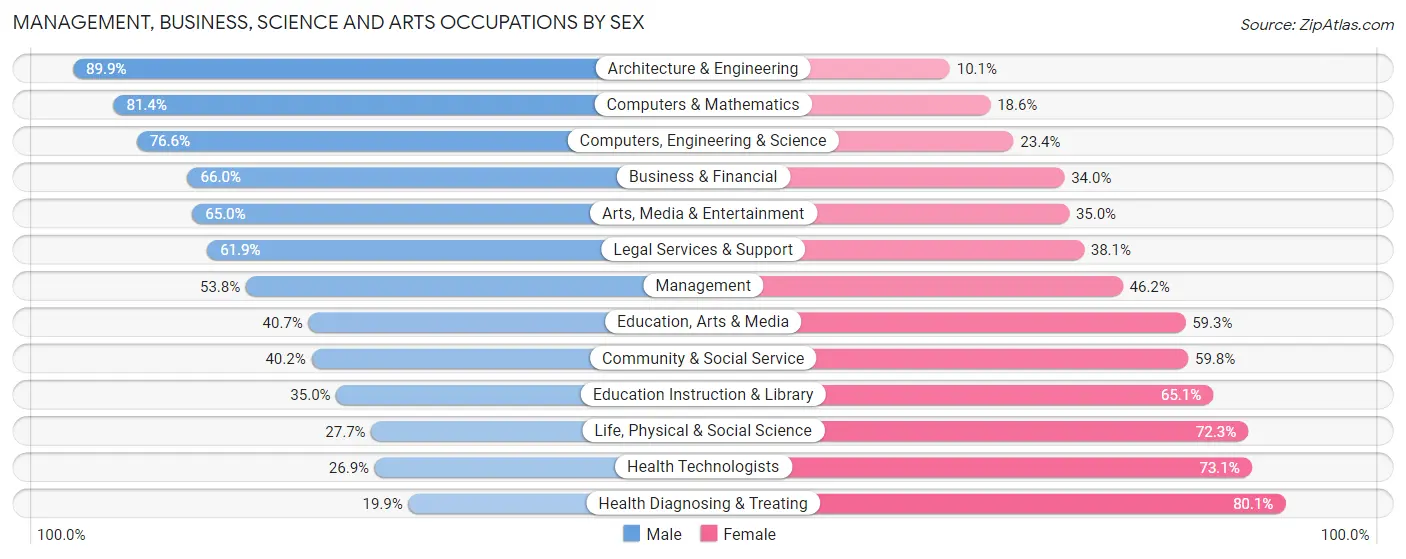
| Occupation | Male | Female |
| Management | 120 (53.8%) | 103 (46.2%) |
| Business & Financial | 64 (66.0%) | 33 (34.0%) |
| Computers, Engineering & Science | 203 (76.6%) | 62 (23.4%) |
| Computers & Mathematics | 57 (81.4%) | 13 (18.6%) |
| Architecture & Engineering | 133 (89.9%) | 15 (10.1%) |
| Life, Physical & Social Science | 13 (27.7%) | 34 (72.3%) |
| Community & Social Service | 102 (40.2%) | 152 (59.8%) |
| Education, Arts & Media | 11 (40.7%) | 16 (59.3%) |
| Legal Services & Support | 13 (61.9%) | 8 (38.1%) |
| Education Instruction & Library | 65 (34.9%) | 121 (65.0%) |
| Arts, Media & Entertainment | 13 (65.0%) | 7 (35.0%) |
| Health Diagnosing & Treating | 41 (19.9%) | 165 (80.1%) |
| Health Technologists | 35 (26.9%) | 95 (73.1%) |
| Total (Category) | 530 (50.7%) | 515 (49.3%) |
| Total (Overall) | 1,112 (53.8%) | 953 (46.2%) |
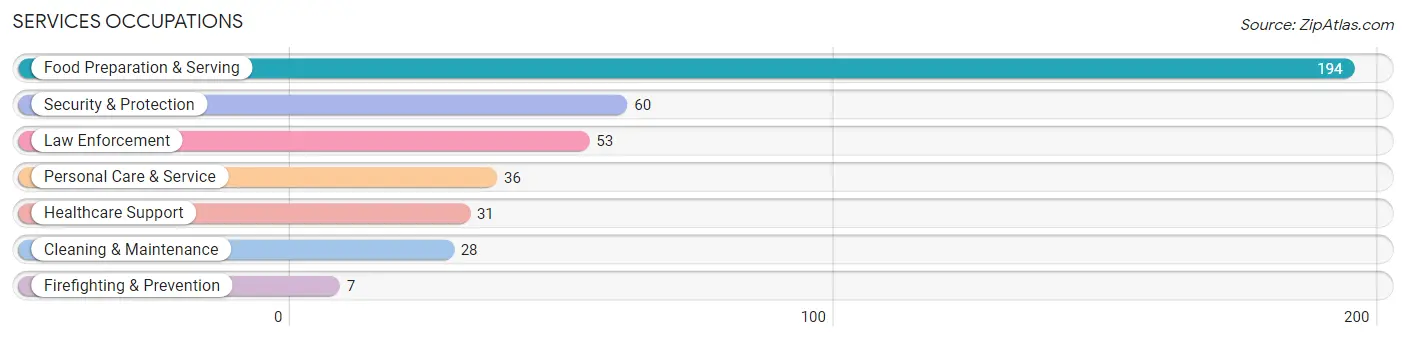
Services Occupations
The most common Services occupations in Seacliff are Food Preparation & Serving (194 | 9.4%), Security & Protection (60 | 2.9%), Law Enforcement (53 | 2.6%), Personal Care & Service (36 | 1.7%), and Healthcare Support (31 | 1.5%).
Services Occupations by Sex
Within the Services occupations in Seacliff, the most male-oriented occupations are Security & Protection (100.0%), Firefighting & Prevention (100.0%), and Law Enforcement (100.0%), while the most female-oriented occupations are Healthcare Support (100.0%), Personal Care & Service (100.0%), and Cleaning & Maintenance (82.1%).
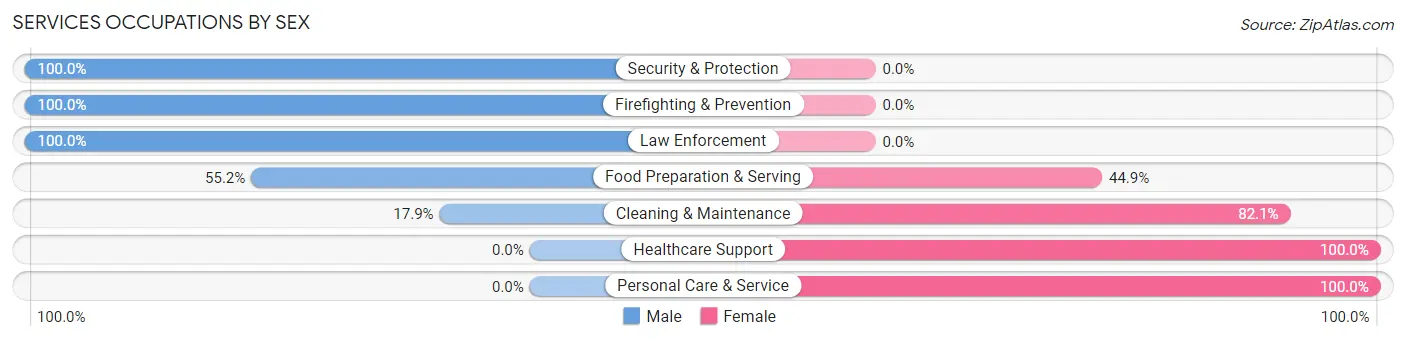
| Occupation | Male | Female |
| Healthcare Support | 0 (0.0%) | 31 (100.0%) |
| Security & Protection | 60 (100.0%) | 0 (0.0%) |
| Firefighting & Prevention | 7 (100.0%) | 0 (0.0%) |
| Law Enforcement | 53 (100.0%) | 0 (0.0%) |
| Food Preparation & Serving | 107 (55.1%) | 87 (44.9%) |
| Cleaning & Maintenance | 5 (17.9%) | 23 (82.1%) |
| Personal Care & Service | 0 (0.0%) | 36 (100.0%) |
| Total (Category) | 172 (49.3%) | 177 (50.7%) |
| Total (Overall) | 1,112 (53.8%) | 953 (46.2%) |
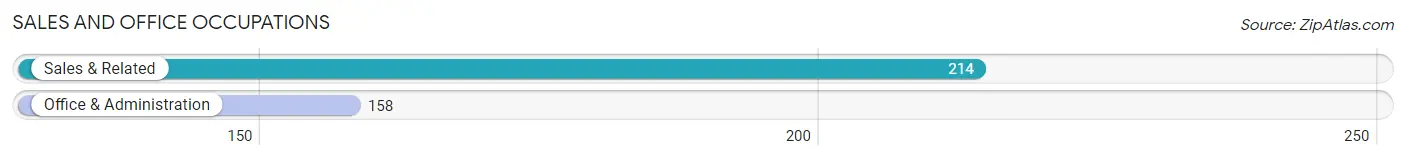
Sales and Office Occupations
The most common Sales and Office occupations in Seacliff are Sales & Related (214 | 10.4%), and Office & Administration (158 | 7.6%).
Sales and Office Occupations by Sex
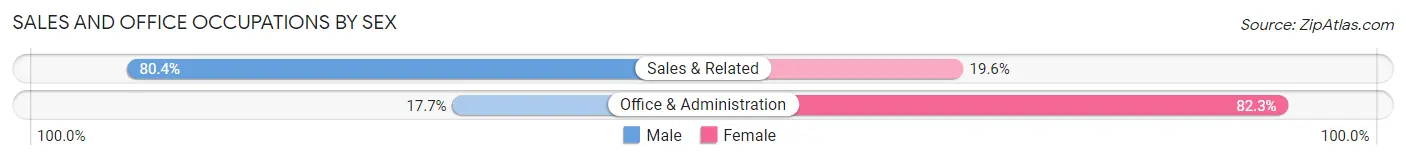
| Occupation | Male | Female |
| Sales & Related | 172 (80.4%) | 42 (19.6%) |
| Office & Administration | 28 (17.7%) | 130 (82.3%) |
| Total (Category) | 200 (53.8%) | 172 (46.2%) |
| Total (Overall) | 1,112 (53.8%) | 953 (46.2%) |
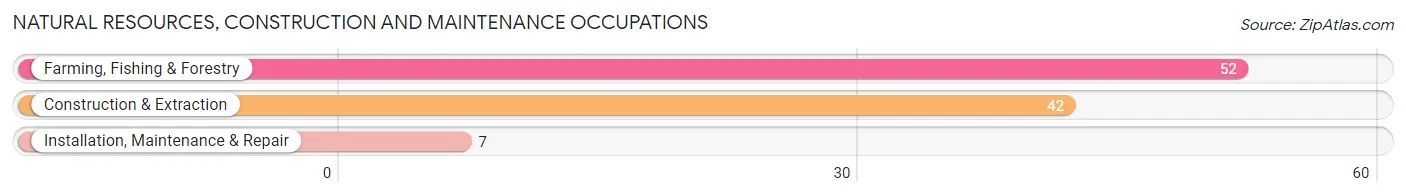
Natural Resources, Construction and Maintenance Occupations
The most common Natural Resources, Construction and Maintenance occupations in Seacliff are Farming, Fishing & Forestry (52 | 2.5%), Construction & Extraction (42 | 2.0%), and Installation, Maintenance & Repair (7 | 0.3%).
Natural Resources, Construction and Maintenance Occupations by Sex
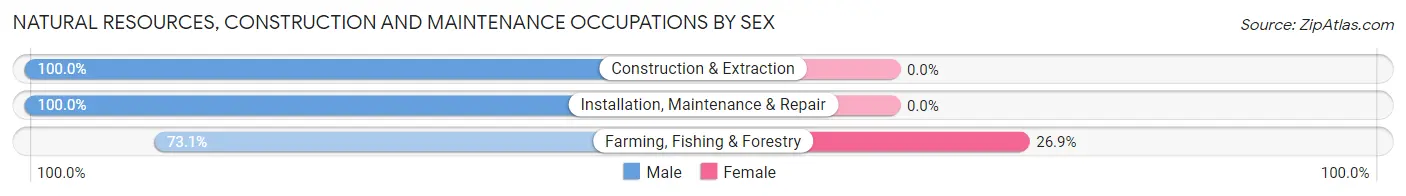
| Occupation | Male | Female |
| Farming, Fishing & Forestry | 38 (73.1%) | 14 (26.9%) |
| Construction & Extraction | 42 (100.0%) | 0 (0.0%) |
| Installation, Maintenance & Repair | 7 (100.0%) | 0 (0.0%) |
| Total (Category) | 87 (86.1%) | 14 (13.9%) |
| Total (Overall) | 1,112 (53.8%) | 953 (46.2%) |
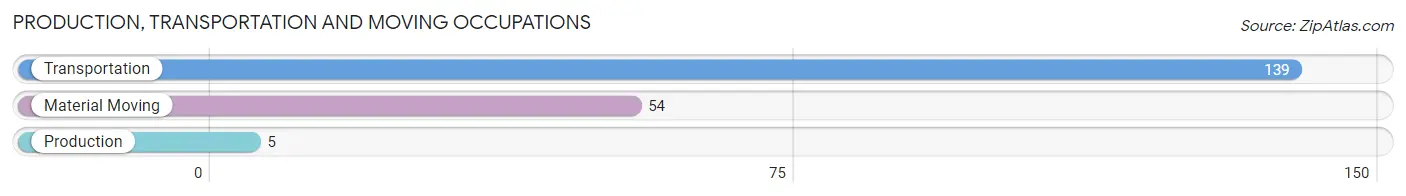
Production, Transportation and Moving Occupations
The most common Production, Transportation and Moving occupations in Seacliff are Transportation (139 | 6.7%), Material Moving (54 | 2.6%), and Production (5 | 0.2%).
Production, Transportation and Moving Occupations by Sex
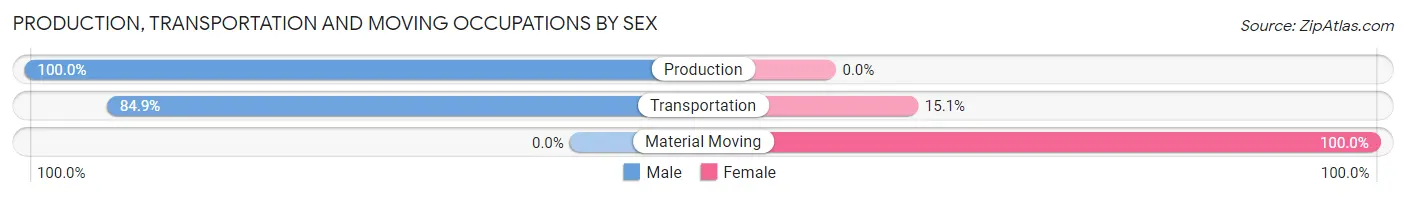
| Occupation | Male | Female |
| Production | 5 (100.0%) | 0 (0.0%) |
| Transportation | 118 (84.9%) | 21 (15.1%) |
| Material Moving | 0 (0.0%) | 54 (100.0%) |
| Total (Category) | 123 (62.1%) | 75 (37.9%) |
| Total (Overall) | 1,112 (53.8%) | 953 (46.2%) |
Employment Industries by Sex in Seacliff
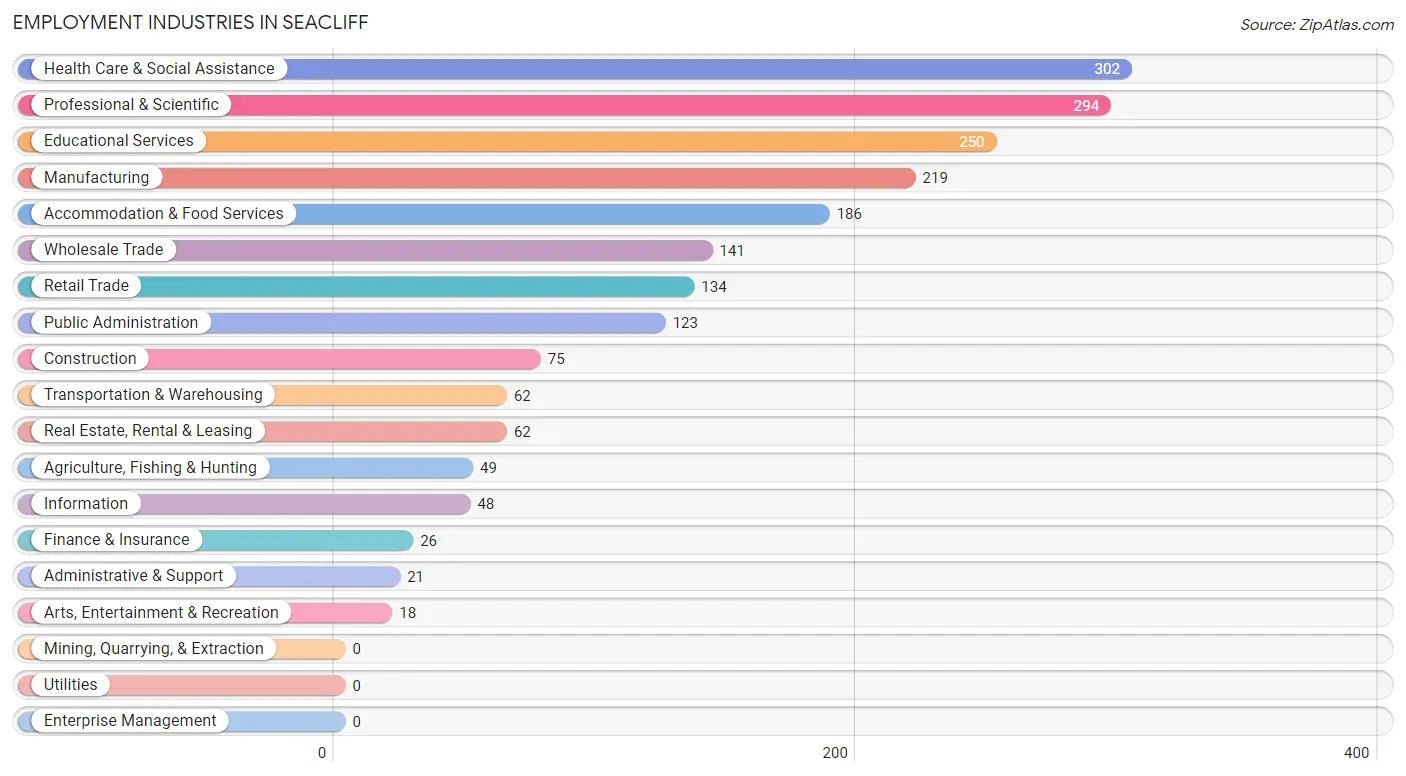
Employment Industries in Seacliff
The major employment industries in Seacliff include Health Care & Social Assistance (302 | 14.6%), Professional & Scientific (294 | 14.2%), Educational Services (250 | 12.1%), Manufacturing (219 | 10.6%), and Accommodation & Food Services (186 | 9.0%).
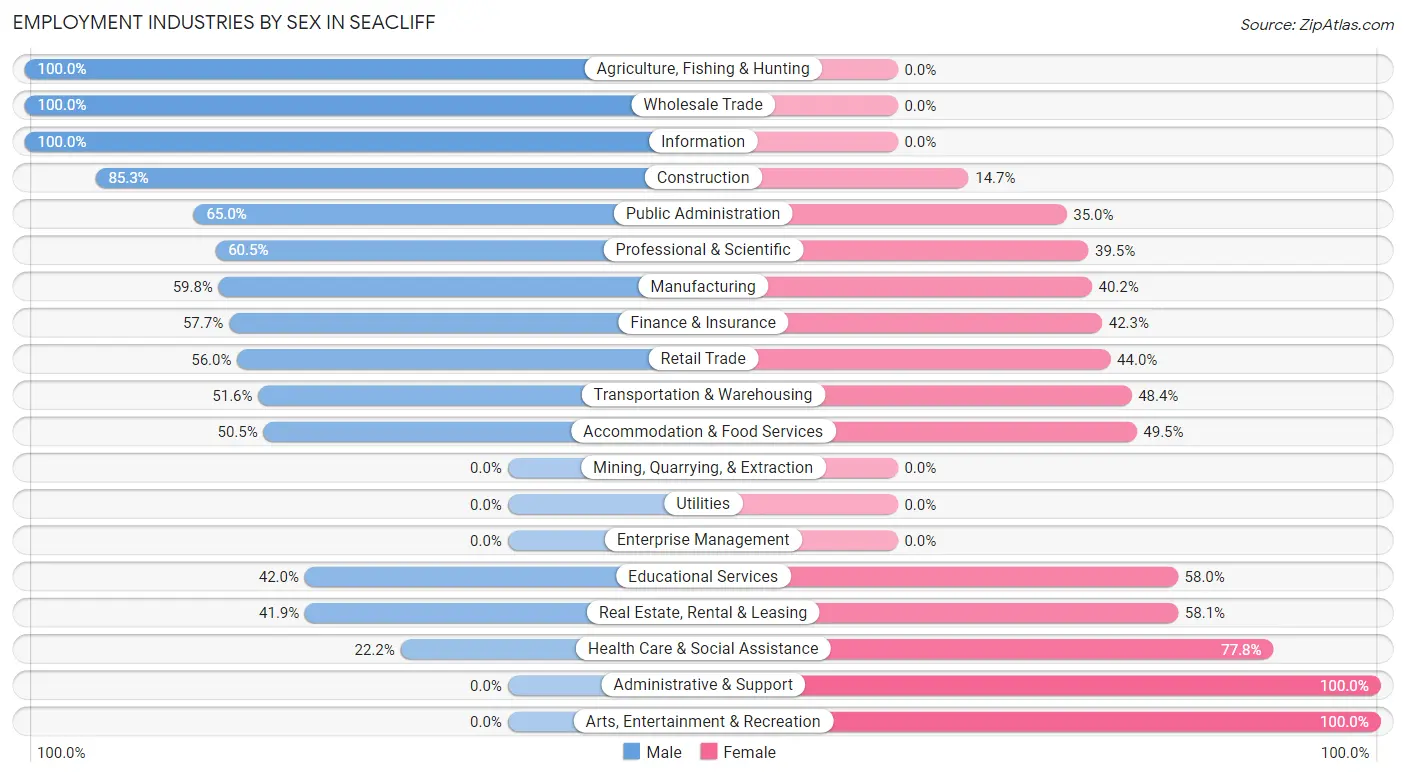
Employment Industries by Sex in Seacliff
The Seacliff industries that see more men than women are Agriculture, Fishing & Hunting (100.0%), Wholesale Trade (100.0%), and Information (100.0%), whereas the industries that tend to have a higher number of women are Administrative & Support (100.0%), Arts, Entertainment & Recreation (100.0%), and Health Care & Social Assistance (77.8%).
| Industry | Male | Female |
| Agriculture, Fishing & Hunting | 49 (100.0%) | 0 (0.0%) |
| Mining, Quarrying, & Extraction | 0 (0.0%) | 0 (0.0%) |
| Construction | 64 (85.3%) | 11 (14.7%) |
| Manufacturing | 131 (59.8%) | 88 (40.2%) |
| Wholesale Trade | 141 (100.0%) | 0 (0.0%) |
| Retail Trade | 75 (56.0%) | 59 (44.0%) |
| Transportation & Warehousing | 32 (51.6%) | 30 (48.4%) |
| Utilities | 0 (0.0%) | 0 (0.0%) |
| Information | 48 (100.0%) | 0 (0.0%) |
| Finance & Insurance | 15 (57.7%) | 11 (42.3%) |
| Real Estate, Rental & Leasing | 26 (41.9%) | 36 (58.1%) |
| Professional & Scientific | 178 (60.5%) | 116 (39.5%) |
| Enterprise Management | 0 (0.0%) | 0 (0.0%) |
| Administrative & Support | 0 (0.0%) | 21 (100.0%) |
| Educational Services | 105 (42.0%) | 145 (58.0%) |
| Health Care & Social Assistance | 67 (22.2%) | 235 (77.8%) |
| Arts, Entertainment & Recreation | 0 (0.0%) | 18 (100.0%) |
| Accommodation & Food Services | 94 (50.5%) | 92 (49.5%) |
| Public Administration | 80 (65.0%) | 43 (35.0%) |
| Total | 1,112 (53.8%) | 953 (46.2%) |
Education in Seacliff
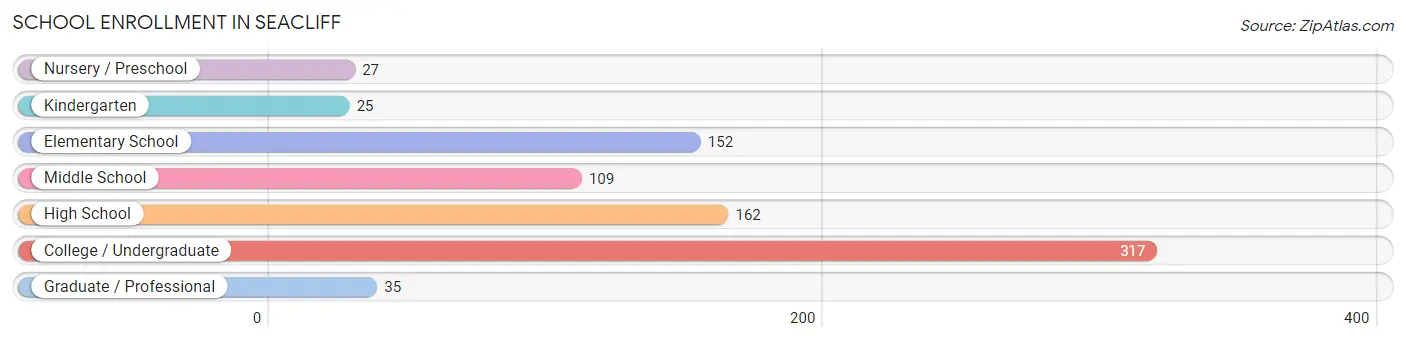
School Enrollment in Seacliff
The most common levels of schooling among the 827 students in Seacliff are college / undergraduate (317 | 38.3%), high school (162 | 19.6%), and elementary school (152 | 18.4%).
| School Level | # Students | % Students |
| Nursery / Preschool | 27 | 3.3% |
| Kindergarten | 25 | 3.0% |
| Elementary School | 152 | 18.4% |
| Middle School | 109 | 13.2% |
| High School | 162 | 19.6% |
| College / Undergraduate | 317 | 38.3% |
| Graduate / Professional | 35 | 4.2% |
| Total | 827 | 100.0% |
School Enrollment by Age by Funding Source in Seacliff
Out of a total of 827 students who are enrolled in schools in Seacliff, 177 (21.4%) attend a private institution, while the remaining 650 (78.6%) are enrolled in public schools. The age group of 35 years and over has the highest likelihood of being enrolled in private schools, with 61 (72.6% in the age bracket) enrolled. Conversely, the age group of 18 to 19 year olds has the lowest likelihood of being enrolled in a private school, with 191 (100.0% in the age bracket) attending a public institution.
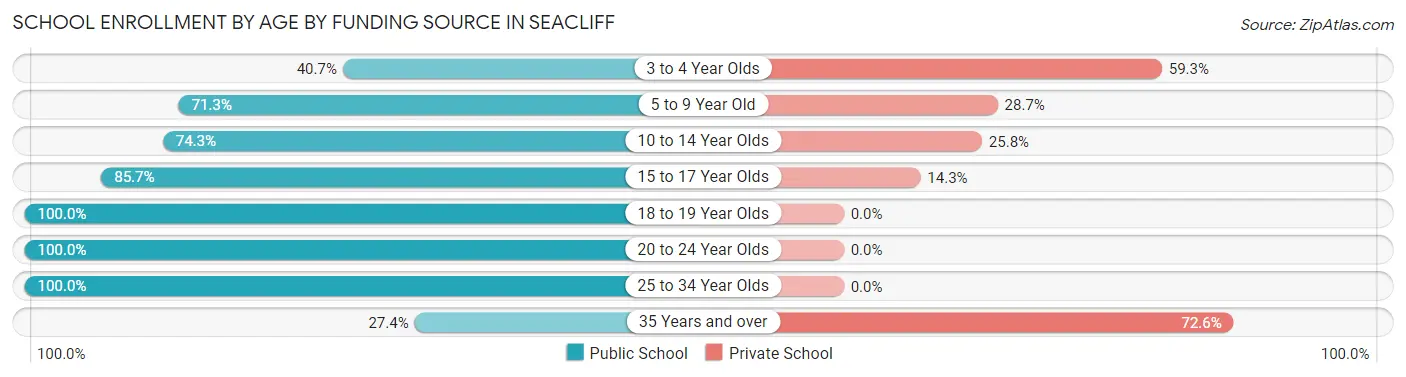
| Age Bracket | Public School | Private School |
| 3 to 4 Year Olds | 11 (40.7%) | 16 (59.3%) |
| 5 to 9 Year Old | 97 (71.3%) | 39 (28.7%) |
| 10 to 14 Year Olds | 124 (74.3%) | 43 (25.8%) |
| 15 to 17 Year Olds | 108 (85.7%) | 18 (14.3%) |
| 18 to 19 Year Olds | 191 (100.0%) | 0 (0.0%) |
| 20 to 24 Year Olds | 44 (100.0%) | 0 (0.0%) |
| 25 to 34 Year Olds | 52 (100.0%) | 0 (0.0%) |
| 35 Years and over | 23 (27.4%) | 61 (72.6%) |
| Total | 650 (78.6%) | 177 (21.4%) |
Educational Attainment by Field of Study in Seacliff
Business (143 | 12.9%), psychology (117 | 10.5%), literature & languages (101 | 9.1%), bio, nature & agricultural (98 | 8.8%), and education (95 | 8.5%) are the most common fields of study among 1,113 individuals in Seacliff who have obtained a bachelor's degree or higher.
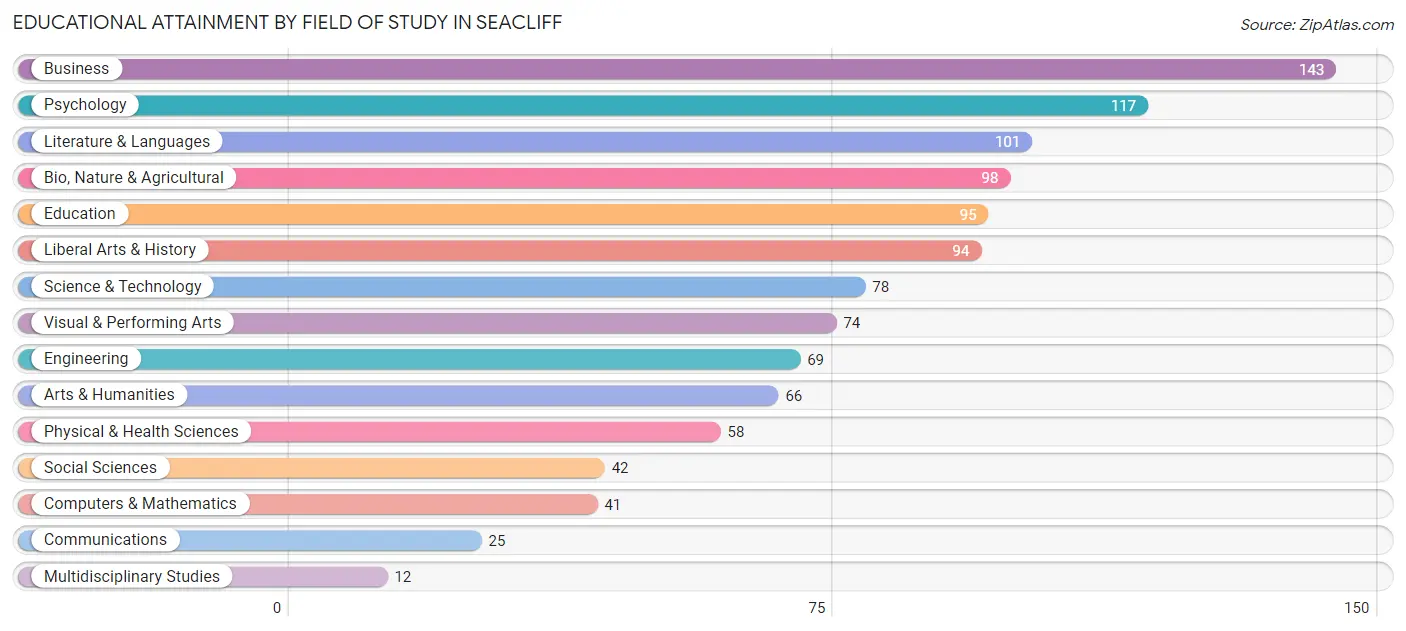
| Field of Study | # Graduates | % Graduates |
| Computers & Mathematics | 41 | 3.7% |
| Bio, Nature & Agricultural | 98 | 8.8% |
| Physical & Health Sciences | 58 | 5.2% |
| Psychology | 117 | 10.5% |
| Social Sciences | 42 | 3.8% |
| Engineering | 69 | 6.2% |
| Multidisciplinary Studies | 12 | 1.1% |
| Science & Technology | 78 | 7.0% |
| Business | 143 | 12.9% |
| Education | 95 | 8.5% |
| Literature & Languages | 101 | 9.1% |
| Liberal Arts & History | 94 | 8.5% |
| Visual & Performing Arts | 74 | 6.7% |
| Communications | 25 | 2.2% |
| Arts & Humanities | 66 | 5.9% |
| Total | 1,113 | 100.0% |
Transportation & Commute in Seacliff
Vehicle Availability by Sex in Seacliff
The most prevalent vehicle ownership categories in Seacliff are males with 2 vehicles (460, accounting for 41.4%) and females with 2 vehicles (488, making up 48.6%).
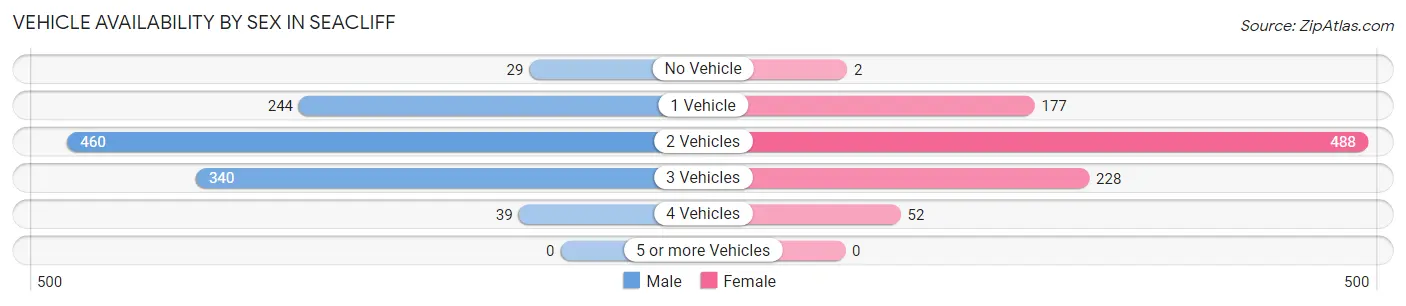
| Vehicles Available | Male | Female |
| No Vehicle | 29 (2.6%) | 2 (0.2%) |
| 1 Vehicle | 244 (21.9%) | 177 (18.7%) |
| 2 Vehicles | 460 (41.4%) | 488 (51.5%) |
| 3 Vehicles | 340 (30.6%) | 228 (24.1%) |
| 4 Vehicles | 39 (3.5%) | 52 (5.5%) |
| 5 or more Vehicles | 0 (0.0%) | 0 (0.0%) |
| Total | 1,112 (100.0%) | 947 (100.0%) |
Commute Time in Seacliff
The most frequently occuring commute durations in Seacliff are 15 to 19 minutes (296 commuters, 15.9%), 5 to 9 minutes (267 commuters, 14.3%), and 10 to 14 minutes (265 commuters, 14.2%).
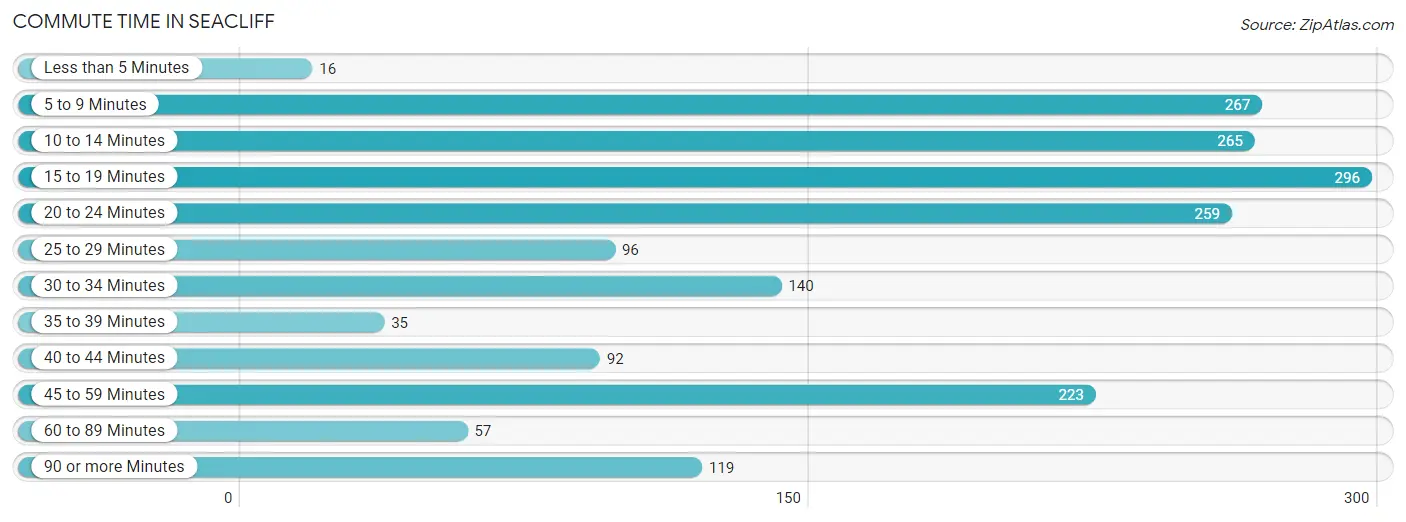
| Commute Time | # Commuters | % Commuters |
| Less than 5 Minutes | 16 | 0.9% |
| 5 to 9 Minutes | 267 | 14.3% |
| 10 to 14 Minutes | 265 | 14.2% |
| 15 to 19 Minutes | 296 | 15.9% |
| 20 to 24 Minutes | 259 | 13.9% |
| 25 to 29 Minutes | 96 | 5.1% |
| 30 to 34 Minutes | 140 | 7.5% |
| 35 to 39 Minutes | 35 | 1.9% |
| 40 to 44 Minutes | 92 | 4.9% |
| 45 to 59 Minutes | 223 | 12.0% |
| 60 to 89 Minutes | 57 | 3.1% |
| 90 or more Minutes | 119 | 6.4% |
Commute Time by Sex in Seacliff
The most common commute times in Seacliff are 10 to 14 minutes (200 commuters, 19.3%) for males and 20 to 24 minutes (181 commuters, 21.8%) for females.
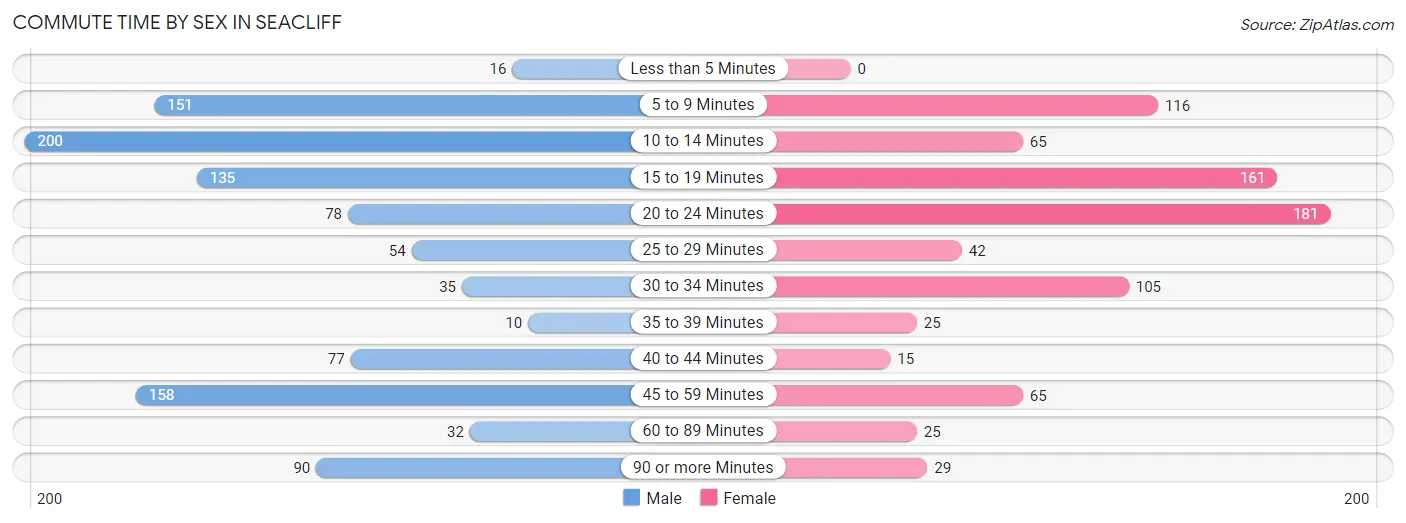
| Commute Time | Male | Female |
| Less than 5 Minutes | 16 (1.5%) | 0 (0.0%) |
| 5 to 9 Minutes | 151 (14.6%) | 116 (14.0%) |
| 10 to 14 Minutes | 200 (19.3%) | 65 (7.8%) |
| 15 to 19 Minutes | 135 (13.0%) | 161 (19.4%) |
| 20 to 24 Minutes | 78 (7.5%) | 181 (21.8%) |
| 25 to 29 Minutes | 54 (5.2%) | 42 (5.1%) |
| 30 to 34 Minutes | 35 (3.4%) | 105 (12.7%) |
| 35 to 39 Minutes | 10 (1.0%) | 25 (3.0%) |
| 40 to 44 Minutes | 77 (7.4%) | 15 (1.8%) |
| 45 to 59 Minutes | 158 (15.2%) | 65 (7.8%) |
| 60 to 89 Minutes | 32 (3.1%) | 25 (3.0%) |
| 90 or more Minutes | 90 (8.7%) | 29 (3.5%) |
Time of Departure to Work by Sex in Seacliff
The most frequent times of departure to work in Seacliff are 7:30 AM to 7:59 AM (206, 19.9%) for males and 6:30 AM to 6:59 AM (141, 17.0%) for females.
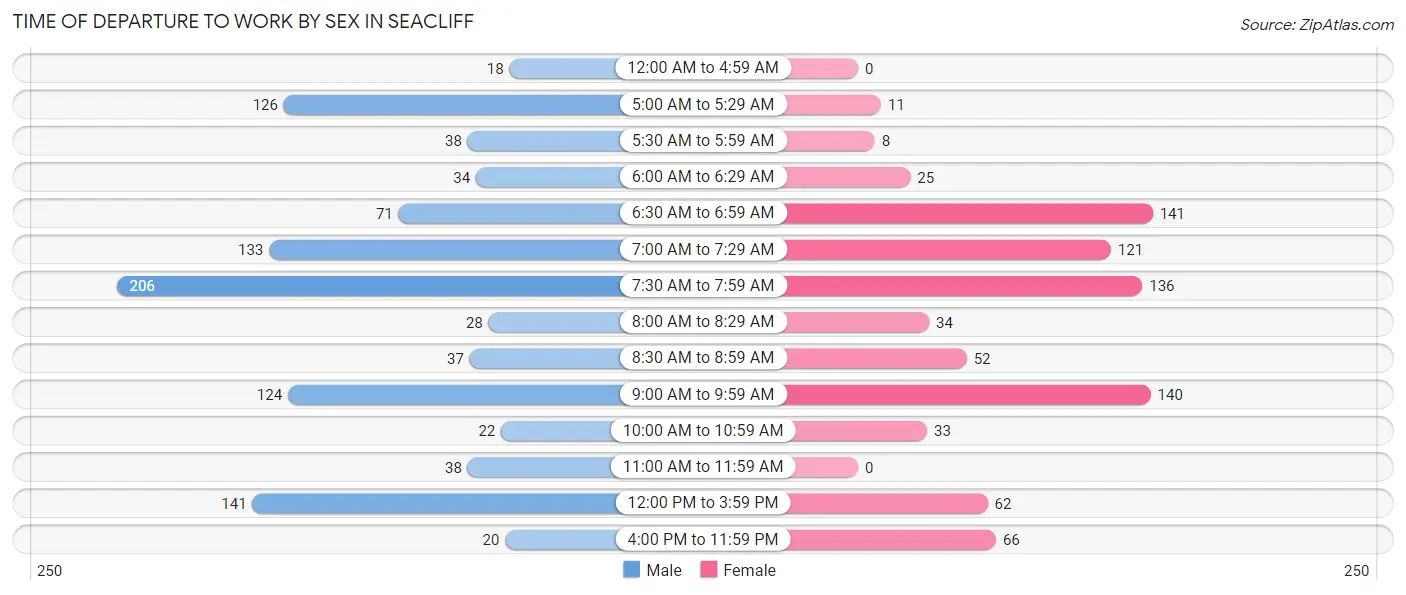
| Time of Departure | Male | Female |
| 12:00 AM to 4:59 AM | 18 (1.7%) | 0 (0.0%) |
| 5:00 AM to 5:29 AM | 126 (12.2%) | 11 (1.3%) |
| 5:30 AM to 5:59 AM | 38 (3.7%) | 8 (1.0%) |
| 6:00 AM to 6:29 AM | 34 (3.3%) | 25 (3.0%) |
| 6:30 AM to 6:59 AM | 71 (6.9%) | 141 (17.0%) |
| 7:00 AM to 7:29 AM | 133 (12.8%) | 121 (14.6%) |
| 7:30 AM to 7:59 AM | 206 (19.9%) | 136 (16.4%) |
| 8:00 AM to 8:29 AM | 28 (2.7%) | 34 (4.1%) |
| 8:30 AM to 8:59 AM | 37 (3.6%) | 52 (6.3%) |
| 9:00 AM to 9:59 AM | 124 (12.0%) | 140 (16.9%) |
| 10:00 AM to 10:59 AM | 22 (2.1%) | 33 (4.0%) |
| 11:00 AM to 11:59 AM | 38 (3.7%) | 0 (0.0%) |
| 12:00 PM to 3:59 PM | 141 (13.6%) | 62 (7.5%) |
| 4:00 PM to 11:59 PM | 20 (1.9%) | 66 (8.0%) |
| Total | 1,036 (100.0%) | 829 (100.0%) |
Housing Occupancy in Seacliff
Occupancy by Ownership in Seacliff
Of the total 1,656 dwellings in Seacliff, owner-occupied units account for 1,008 (60.9%), while renter-occupied units make up 648 (39.1%).
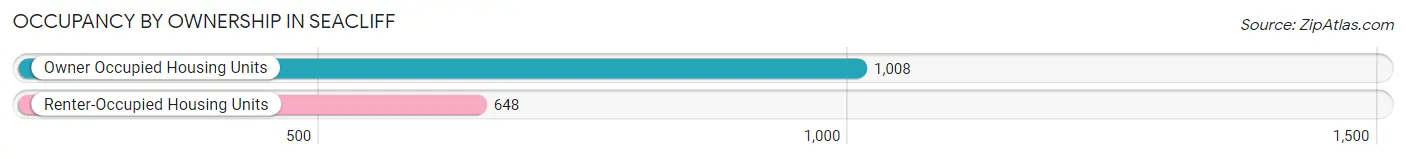
| Occupancy | # Housing Units | % Housing Units |
| Owner Occupied Housing Units | 1,008 | 60.9% |
| Renter-Occupied Housing Units | 648 | 39.1% |
| Total Occupied Housing Units | 1,656 | 100.0% |
Occupancy by Household Size in Seacliff
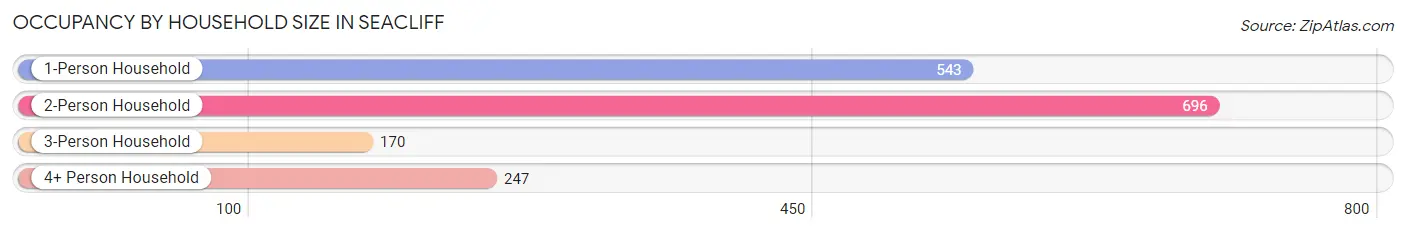
| Household Size | # Housing Units | % Housing Units |
| 1-Person Household | 543 | 32.8% |
| 2-Person Household | 696 | 42.0% |
| 3-Person Household | 170 | 10.3% |
| 4+ Person Household | 247 | 14.9% |
| Total Housing Units | 1,656 | 100.0% |
Occupancy by Ownership by Household Size in Seacliff
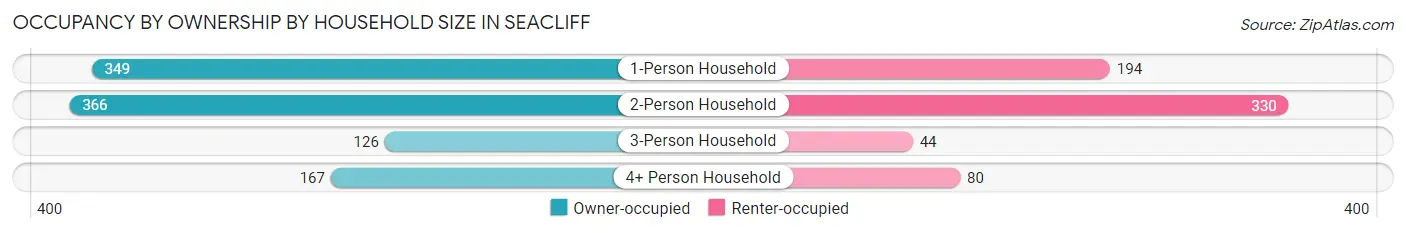
| Household Size | Owner-occupied | Renter-occupied |
| 1-Person Household | 349 (64.3%) | 194 (35.7%) |
| 2-Person Household | 366 (52.6%) | 330 (47.4%) |
| 3-Person Household | 126 (74.1%) | 44 (25.9%) |
| 4+ Person Household | 167 (67.6%) | 80 (32.4%) |
| Total Housing Units | 1,008 (60.9%) | 648 (39.1%) |
Occupancy by Educational Attainment in Seacliff
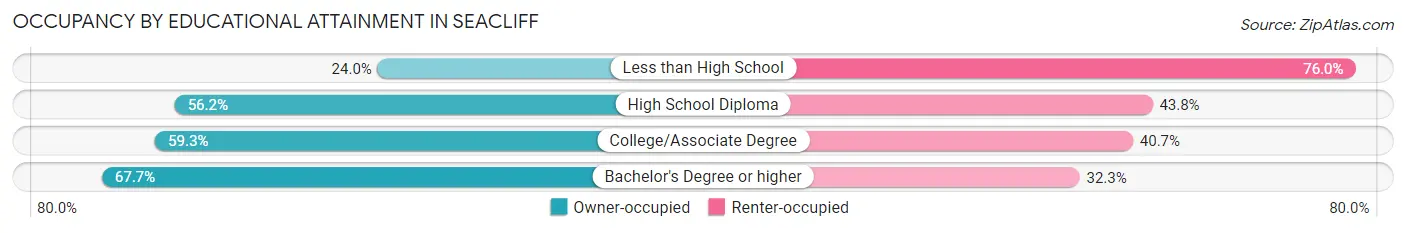
| Household Size | Owner-occupied | Renter-occupied |
| Less than High School | 12 (24.0%) | 38 (76.0%) |
| High School Diploma | 159 (56.2%) | 124 (43.8%) |
| College/Associate Degree | 415 (59.3%) | 285 (40.7%) |
| Bachelor's Degree or higher | 422 (67.7%) | 201 (32.3%) |
Occupancy by Age of Householder in Seacliff
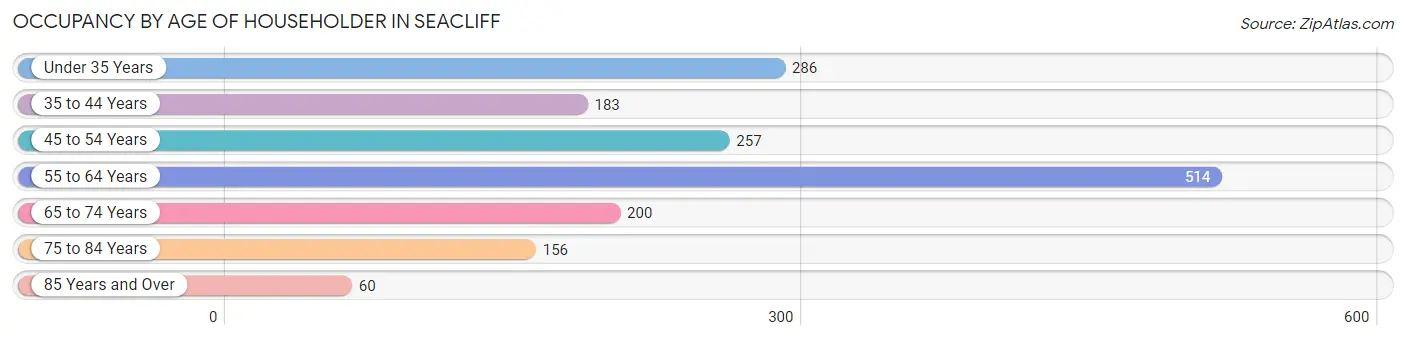
| Age Bracket | # Households | % Households |
| Under 35 Years | 286 | 17.3% |
| 35 to 44 Years | 183 | 11.1% |
| 45 to 54 Years | 257 | 15.5% |
| 55 to 64 Years | 514 | 31.0% |
| 65 to 74 Years | 200 | 12.1% |
| 75 to 84 Years | 156 | 9.4% |
| 85 Years and Over | 60 | 3.6% |
| Total | 1,656 | 100.0% |
Housing Finances in Seacliff
Median Income by Occupancy in Seacliff
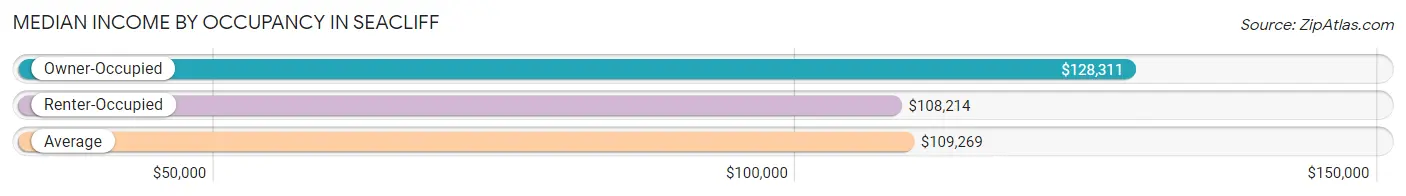
| Occupancy Type | # Households | Median Income |
| Owner-Occupied | 1,008 (60.9%) | $128,311 |
| Renter-Occupied | 648 (39.1%) | $108,214 |
| Average | 1,656 (100.0%) | $109,269 |
Occupancy by Householder Income Bracket in Seacliff
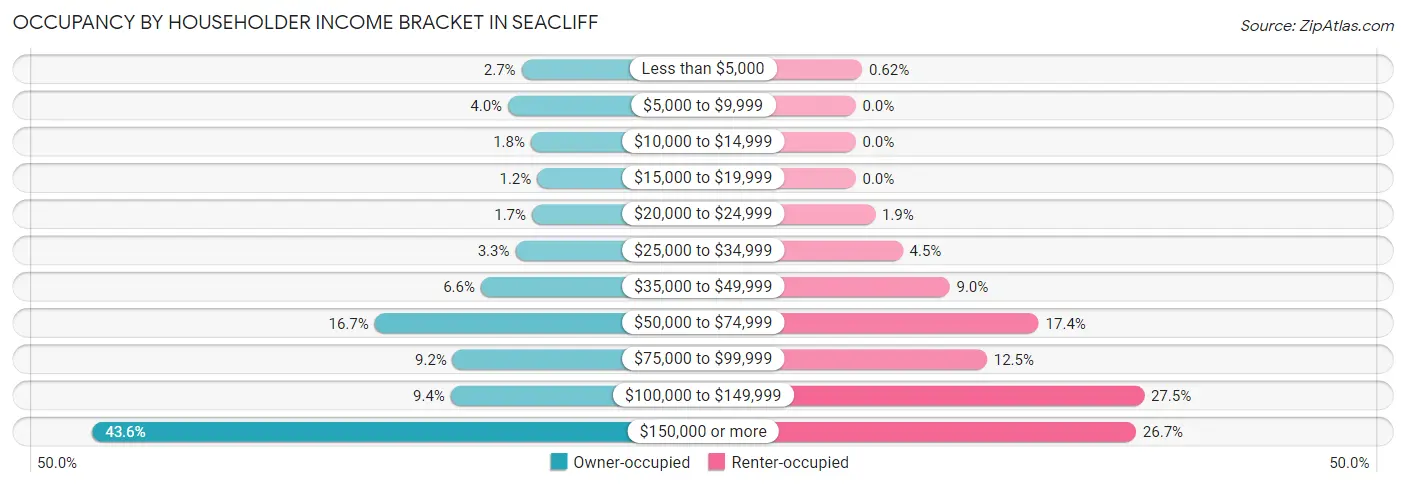
| Income Bracket | Owner-occupied | Renter-occupied |
| Less than $5,000 | 27 (2.7%) | 4 (0.6%) |
| $5,000 to $9,999 | 40 (4.0%) | 0 (0.0%) |
| $10,000 to $14,999 | 18 (1.8%) | 0 (0.0%) |
| $15,000 to $19,999 | 12 (1.2%) | 0 (0.0%) |
| $20,000 to $24,999 | 17 (1.7%) | 12 (1.8%) |
| $25,000 to $34,999 | 33 (3.3%) | 29 (4.5%) |
| $35,000 to $49,999 | 66 (6.6%) | 58 (8.9%) |
| $50,000 to $74,999 | 168 (16.7%) | 113 (17.4%) |
| $75,000 to $99,999 | 93 (9.2%) | 81 (12.5%) |
| $100,000 to $149,999 | 95 (9.4%) | 178 (27.5%) |
| $150,000 or more | 439 (43.5%) | 173 (26.7%) |
| Total | 1,008 (100.0%) | 648 (100.0%) |
Monthly Housing Cost Tiers in Seacliff
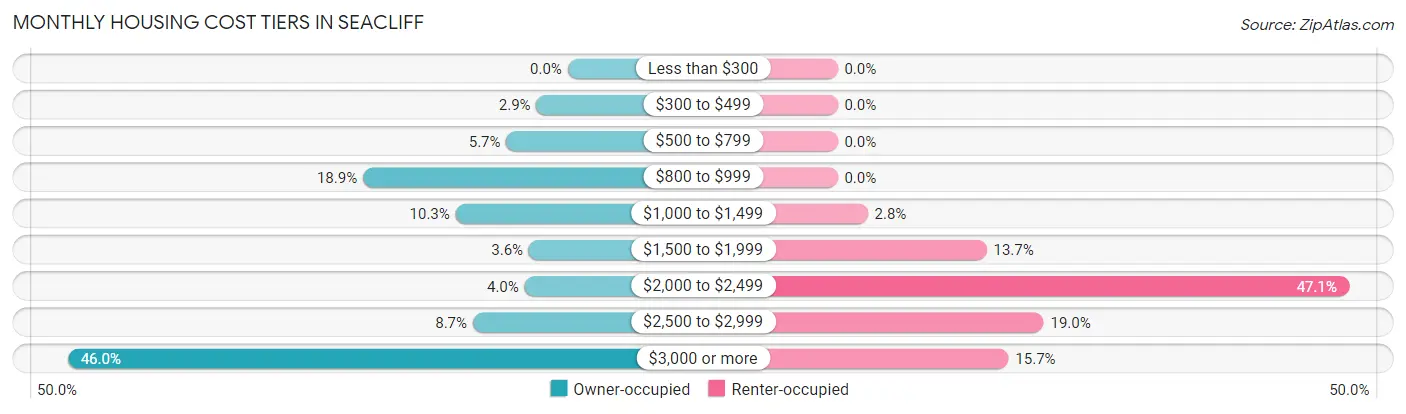
| Monthly Cost | Owner-occupied | Renter-occupied |
| Less than $300 | 0 (0.0%) | 0 (0.0%) |
| $300 to $499 | 29 (2.9%) | 0 (0.0%) |
| $500 to $799 | 57 (5.7%) | 0 (0.0%) |
| $800 to $999 | 190 (18.9%) | 0 (0.0%) |
| $1,000 to $1,499 | 104 (10.3%) | 18 (2.8%) |
| $1,500 to $1,999 | 36 (3.6%) | 89 (13.7%) |
| $2,000 to $2,499 | 40 (4.0%) | 305 (47.1%) |
| $2,500 to $2,999 | 88 (8.7%) | 123 (19.0%) |
| $3,000 or more | 464 (46.0%) | 102 (15.7%) |
| Total | 1,008 (100.0%) | 648 (100.0%) |
Physical Housing Characteristics in Seacliff
Housing Structures in Seacliff
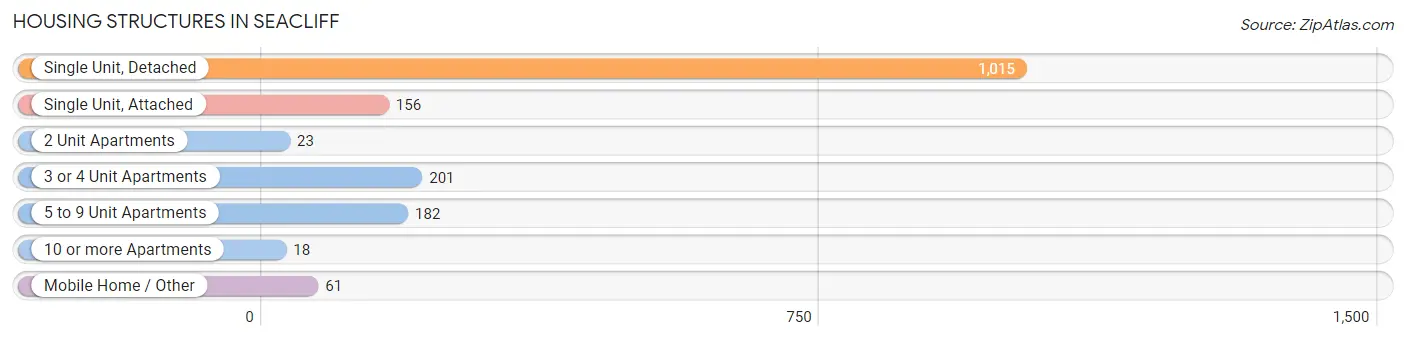
| Structure Type | # Housing Units | % Housing Units |
| Single Unit, Detached | 1,015 | 61.3% |
| Single Unit, Attached | 156 | 9.4% |
| 2 Unit Apartments | 23 | 1.4% |
| 3 or 4 Unit Apartments | 201 | 12.1% |
| 5 to 9 Unit Apartments | 182 | 11.0% |
| 10 or more Apartments | 18 | 1.1% |
| Mobile Home / Other | 61 | 3.7% |
| Total | 1,656 | 100.0% |
Housing Structures by Occupancy in Seacliff
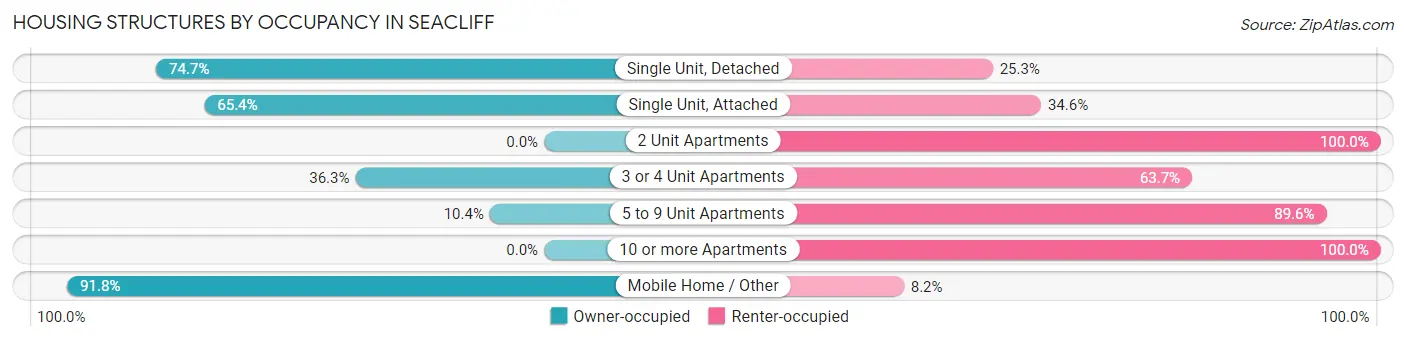
| Structure Type | Owner-occupied | Renter-occupied |
| Single Unit, Detached | 758 (74.7%) | 257 (25.3%) |
| Single Unit, Attached | 102 (65.4%) | 54 (34.6%) |
| 2 Unit Apartments | 0 (0.0%) | 23 (100.0%) |
| 3 or 4 Unit Apartments | 73 (36.3%) | 128 (63.7%) |
| 5 to 9 Unit Apartments | 19 (10.4%) | 163 (89.6%) |
| 10 or more Apartments | 0 (0.0%) | 18 (100.0%) |
| Mobile Home / Other | 56 (91.8%) | 5 (8.2%) |
| Total | 1,008 (60.9%) | 648 (39.1%) |
Housing Structures by Number of Rooms in Seacliff
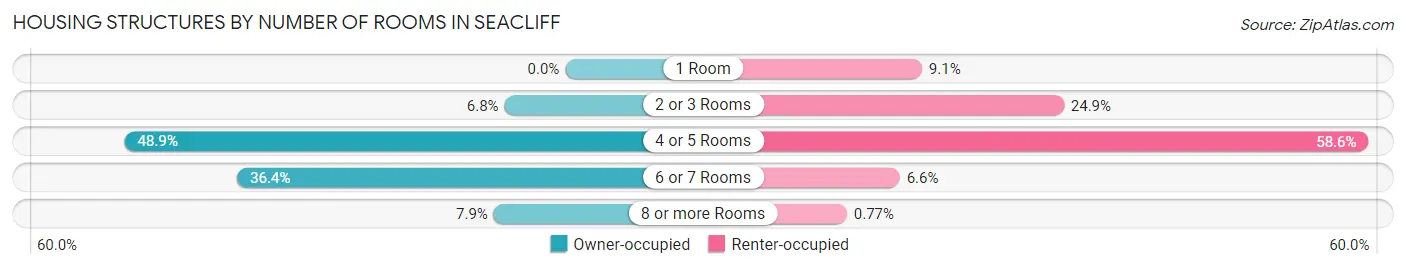
| Number of Rooms | Owner-occupied | Renter-occupied |
| 1 Room | 0 (0.0%) | 59 (9.1%) |
| 2 or 3 Rooms | 68 (6.8%) | 161 (24.8%) |
| 4 or 5 Rooms | 493 (48.9%) | 380 (58.6%) |
| 6 or 7 Rooms | 367 (36.4%) | 43 (6.6%) |
| 8 or more Rooms | 80 (7.9%) | 5 (0.8%) |
| Total | 1,008 (100.0%) | 648 (100.0%) |
Housing Structure by Heating Type in Seacliff
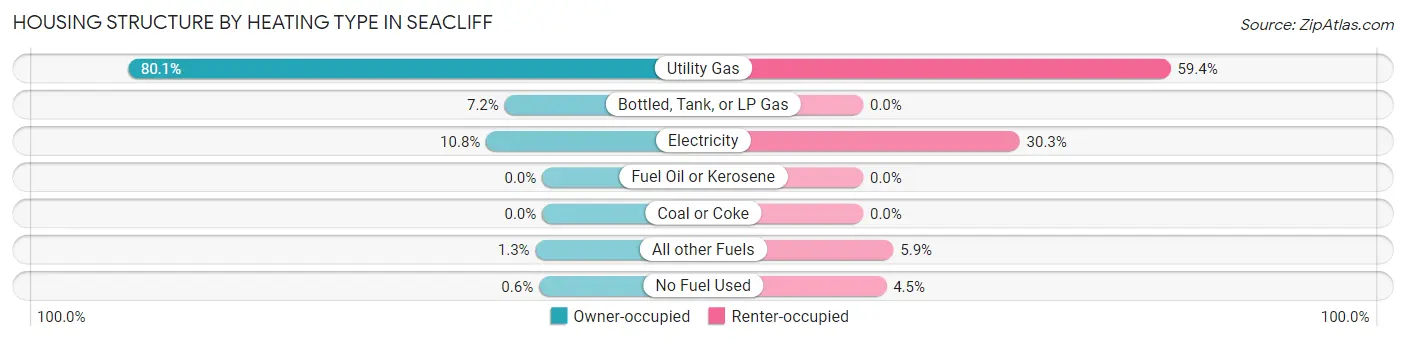
| Heating Type | Owner-occupied | Renter-occupied |
| Utility Gas | 807 (80.1%) | 385 (59.4%) |
| Bottled, Tank, or LP Gas | 73 (7.2%) | 0 (0.0%) |
| Electricity | 109 (10.8%) | 196 (30.2%) |
| Fuel Oil or Kerosene | 0 (0.0%) | 0 (0.0%) |
| Coal or Coke | 0 (0.0%) | 0 (0.0%) |
| All other Fuels | 13 (1.3%) | 38 (5.9%) |
| No Fuel Used | 6 (0.6%) | 29 (4.5%) |
| Total | 1,008 (100.0%) | 648 (100.0%) |
Household Vehicle Usage in Seacliff
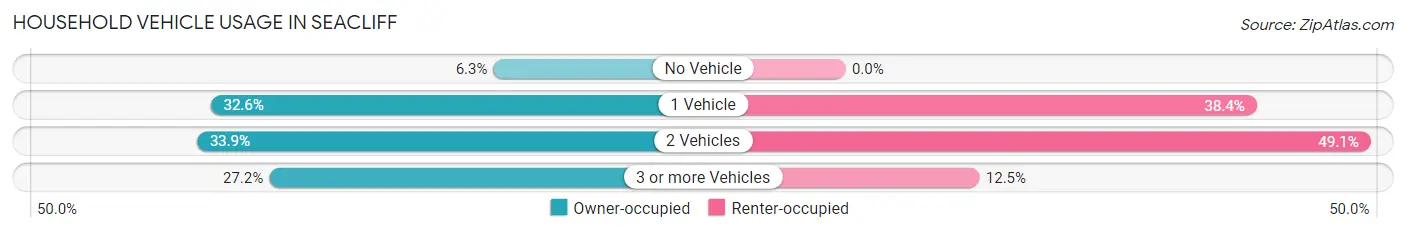
| Vehicles per Household | Owner-occupied | Renter-occupied |
| No Vehicle | 63 (6.2%) | 0 (0.0%) |
| 1 Vehicle | 329 (32.6%) | 249 (38.4%) |
| 2 Vehicles | 342 (33.9%) | 318 (49.1%) |
| 3 or more Vehicles | 274 (27.2%) | 81 (12.5%) |
| Total | 1,008 (100.0%) | 648 (100.0%) |
Real Estate & Mortgages in Seacliff
Real Estate and Mortgage Overview in Seacliff
| Characteristic | Without Mortgage | With Mortgage |
| Housing Units | 380 | 628 |
| Median Property Value | $923,900 | $1,072,600 |
| Median Household Income | $61,898 | $344 |
| Monthly Housing Costs | $891 | $464 |
| Real Estate Taxes | $3,840 | $0 |
Property Value by Mortgage Status in Seacliff
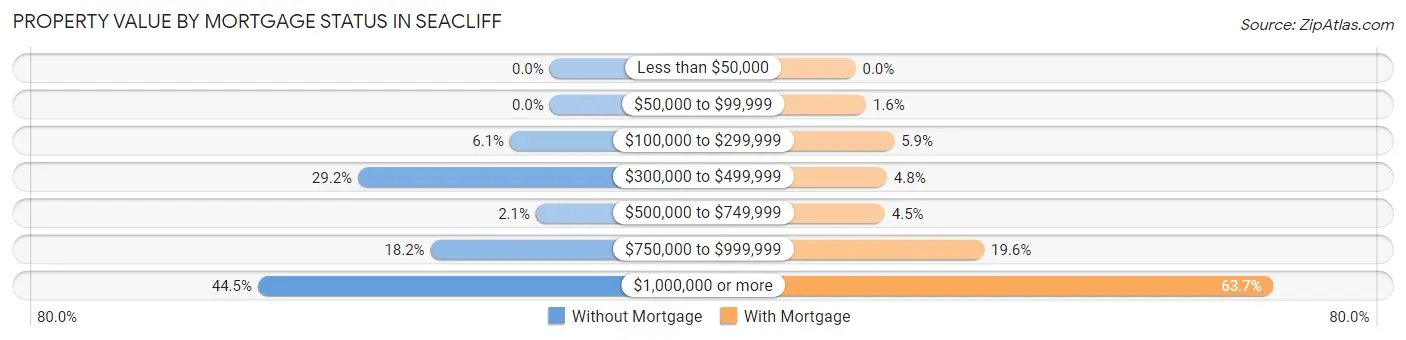
| Property Value | Without Mortgage | With Mortgage |
| Less than $50,000 | 0 (0.0%) | 0 (0.0%) |
| $50,000 to $99,999 | 0 (0.0%) | 10 (1.6%) |
| $100,000 to $299,999 | 23 (6.0%) | 37 (5.9%) |
| $300,000 to $499,999 | 111 (29.2%) | 30 (4.8%) |
| $500,000 to $749,999 | 8 (2.1%) | 28 (4.5%) |
| $750,000 to $999,999 | 69 (18.2%) | 123 (19.6%) |
| $1,000,000 or more | 169 (44.5%) | 400 (63.7%) |
| Total | 380 (100.0%) | 628 (100.0%) |
Household Income by Mortgage Status in Seacliff
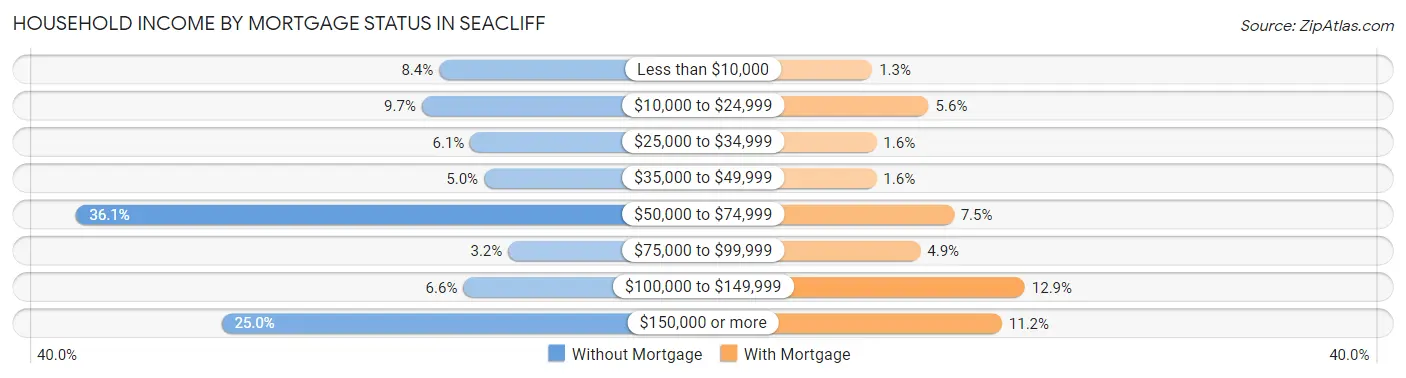
| Household Income | Without Mortgage | With Mortgage |
| Less than $10,000 | 32 (8.4%) | 8 (1.3%) |
| $10,000 to $24,999 | 37 (9.7%) | 35 (5.6%) |
| $25,000 to $34,999 | 23 (6.0%) | 10 (1.6%) |
| $35,000 to $49,999 | 19 (5.0%) | 10 (1.6%) |
| $50,000 to $74,999 | 137 (36.0%) | 47 (7.5%) |
| $75,000 to $99,999 | 12 (3.2%) | 31 (4.9%) |
| $100,000 to $149,999 | 25 (6.6%) | 81 (12.9%) |
| $150,000 or more | 95 (25.0%) | 70 (11.2%) |
| Total | 380 (100.0%) | 628 (100.0%) |
Property Value to Household Income Ratio in Seacliff
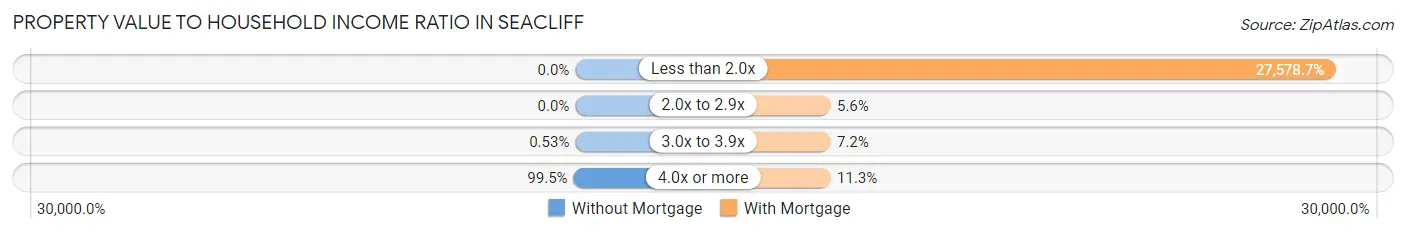
| Value-to-Income Ratio | Without Mortgage | With Mortgage |
| Less than 2.0x | 0 (0.0%) | 173,194 (27,578.7%) |
| 2.0x to 2.9x | 0 (0.0%) | 35 (5.6%) |
| 3.0x to 3.9x | 2 (0.5%) | 45 (7.2%) |
| 4.0x or more | 378 (99.5%) | 71 (11.3%) |
| Total | 380 (100.0%) | 628 (100.0%) |
Real Estate Taxes by Mortgage Status in Seacliff
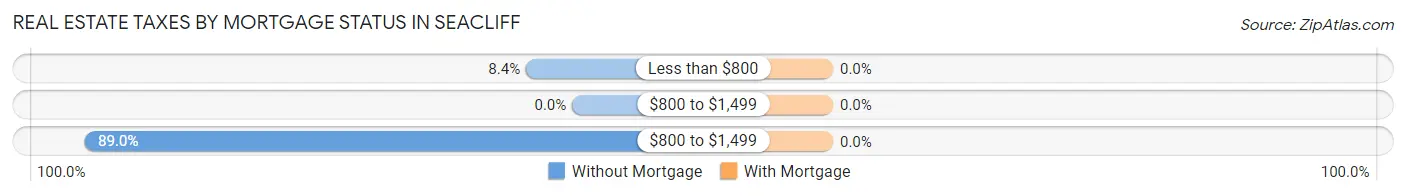
| Property Taxes | Without Mortgage | With Mortgage |
| Less than $800 | 32 (8.4%) | 0 (0.0%) |
| $800 to $1,499 | 0 (0.0%) | 0 (0.0%) |
| $800 to $1,499 | 338 (88.9%) | 0 (0.0%) |
| Total | 380 (100.0%) | 628 (100.0%) |
Health & Disability in Seacliff
Health Insurance Coverage by Age in Seacliff
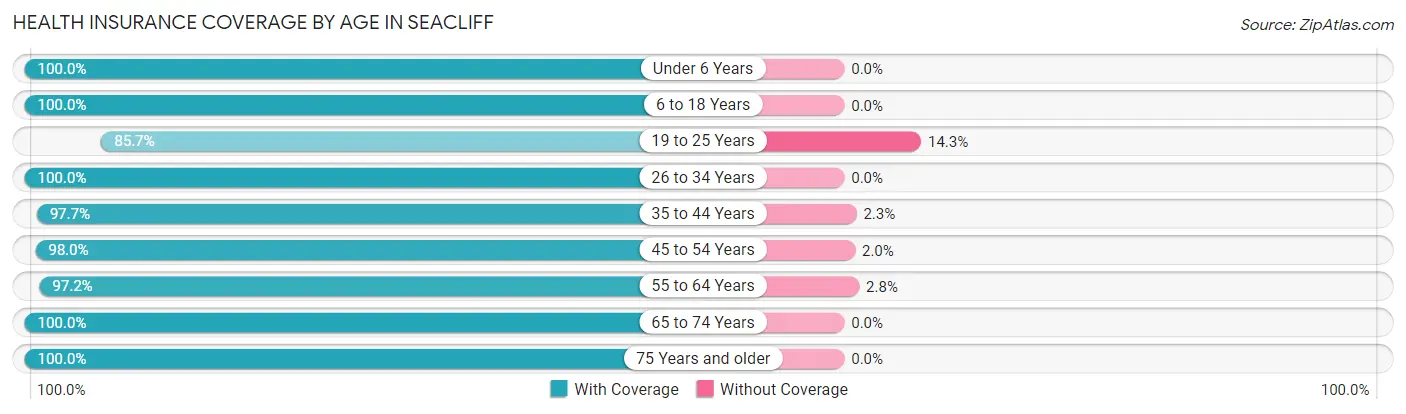
| Age Bracket | With Coverage | Without Coverage |
| Under 6 Years | 144 (100.0%) | 0 (0.0%) |
| 6 to 18 Years | 532 (100.0%) | 0 (0.0%) |
| 19 to 25 Years | 353 (85.7%) | 59 (14.3%) |
| 26 to 34 Years | 368 (100.0%) | 0 (0.0%) |
| 35 to 44 Years | 345 (97.7%) | 8 (2.3%) |
| 45 to 54 Years | 392 (98.0%) | 8 (2.0%) |
| 55 to 64 Years | 702 (97.2%) | 20 (2.8%) |
| 65 to 74 Years | 369 (100.0%) | 0 (0.0%) |
| 75 Years and older | 250 (100.0%) | 0 (0.0%) |
| Total | 3,455 (97.3%) | 95 (2.7%) |
Health Insurance Coverage by Citizenship Status in Seacliff
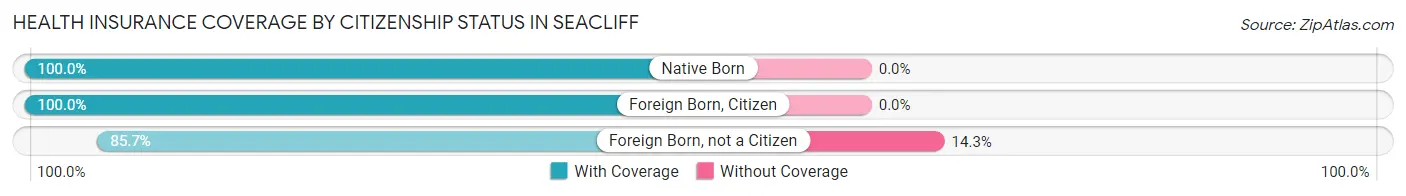
| Citizenship Status | With Coverage | Without Coverage |
| Native Born | 144 (100.0%) | 0 (0.0%) |
| Foreign Born, Citizen | 532 (100.0%) | 0 (0.0%) |
| Foreign Born, not a Citizen | 353 (85.7%) | 59 (14.3%) |
Health Insurance Coverage by Household Income in Seacliff
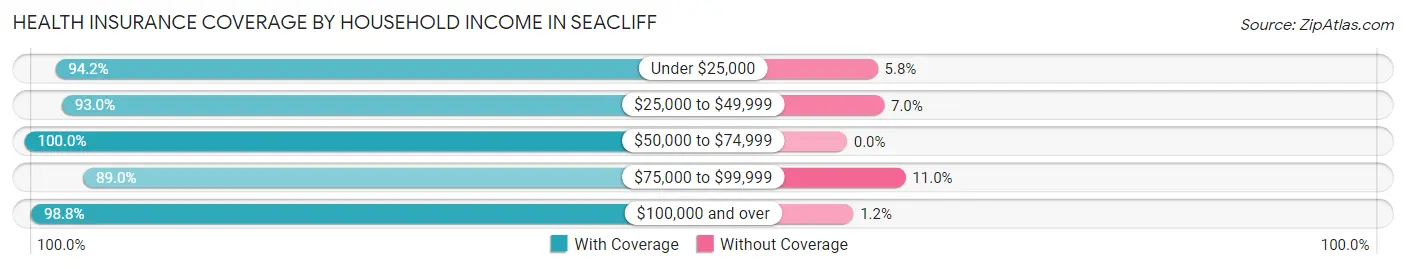
| Household Income | With Coverage | Without Coverage |
| Under $25,000 | 147 (94.2%) | 9 (5.8%) |
| $25,000 to $49,999 | 280 (93.0%) | 21 (7.0%) |
| $50,000 to $74,999 | 519 (100.0%) | 0 (0.0%) |
| $75,000 to $99,999 | 308 (89.0%) | 38 (11.0%) |
| $100,000 and over | 2,201 (98.8%) | 27 (1.2%) |
Public vs Private Health Insurance Coverage by Age in Seacliff
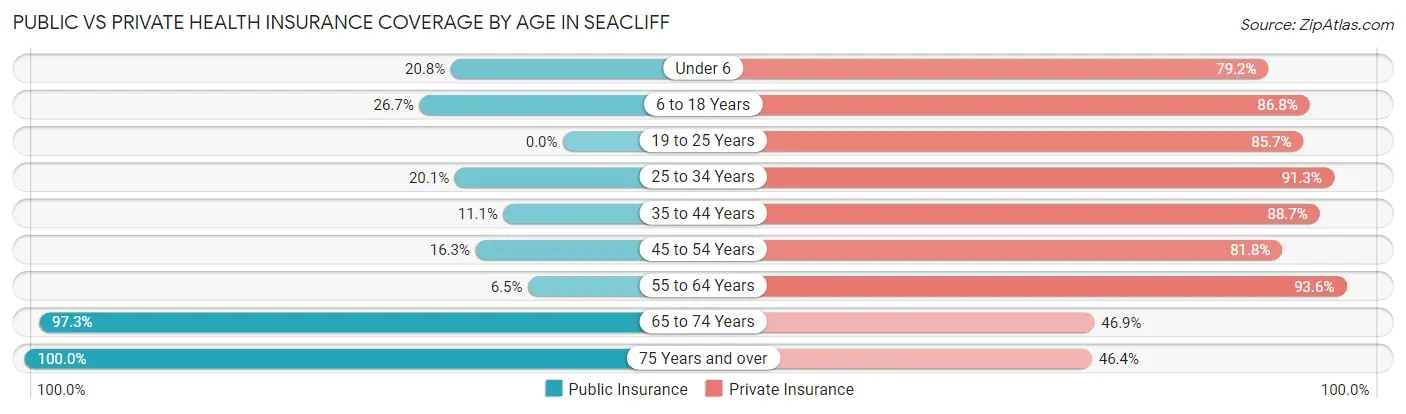
| Age Bracket | Public Insurance | Private Insurance |
| Under 6 | 30 (20.8%) | 114 (79.2%) |
| 6 to 18 Years | 142 (26.7%) | 462 (86.8%) |
| 19 to 25 Years | 0 (0.0%) | 353 (85.7%) |
| 25 to 34 Years | 74 (20.1%) | 336 (91.3%) |
| 35 to 44 Years | 39 (11.1%) | 313 (88.7%) |
| 45 to 54 Years | 65 (16.3%) | 327 (81.8%) |
| 55 to 64 Years | 47 (6.5%) | 676 (93.6%) |
| 65 to 74 Years | 359 (97.3%) | 173 (46.9%) |
| 75 Years and over | 250 (100.0%) | 116 (46.4%) |
| Total | 1,006 (28.3%) | 2,870 (80.8%) |
Disability Status by Sex by Age in Seacliff
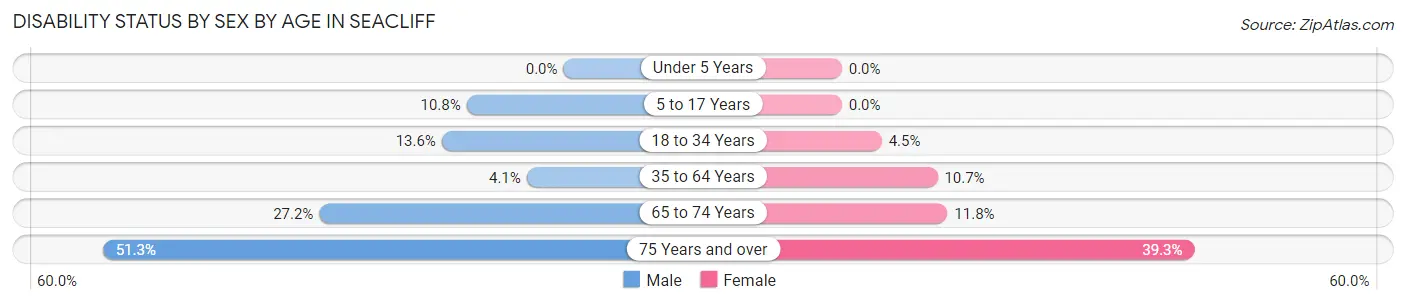
| Age Bracket | Male | Female |
| Under 5 Years | 0 (0.0%) | 0 (0.0%) |
| 5 to 17 Years | 25 (10.8%) | 0 (0.0%) |
| 18 to 34 Years | 58 (13.6%) | 19 (4.4%) |
| 35 to 64 Years | 30 (4.1%) | 79 (10.6%) |
| 65 to 74 Years | 31 (27.2%) | 30 (11.8%) |
| 75 Years and over | 59 (51.3%) | 53 (39.3%) |
Disability Class by Sex by Age in Seacliff
Disability Class: Hearing Difficulty
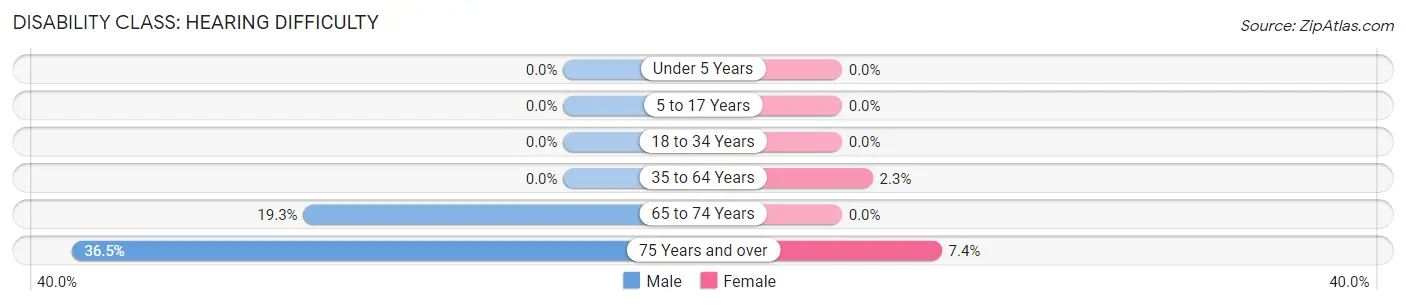
| Age Bracket | Male | Female |
| Under 5 Years | 0 (0.0%) | 0 (0.0%) |
| 5 to 17 Years | 0 (0.0%) | 0 (0.0%) |
| 18 to 34 Years | 0 (0.0%) | 0 (0.0%) |
| 35 to 64 Years | 0 (0.0%) | 17 (2.3%) |
| 65 to 74 Years | 22 (19.3%) | 0 (0.0%) |
| 75 Years and over | 42 (36.5%) | 10 (7.4%) |
Disability Class: Vision Difficulty
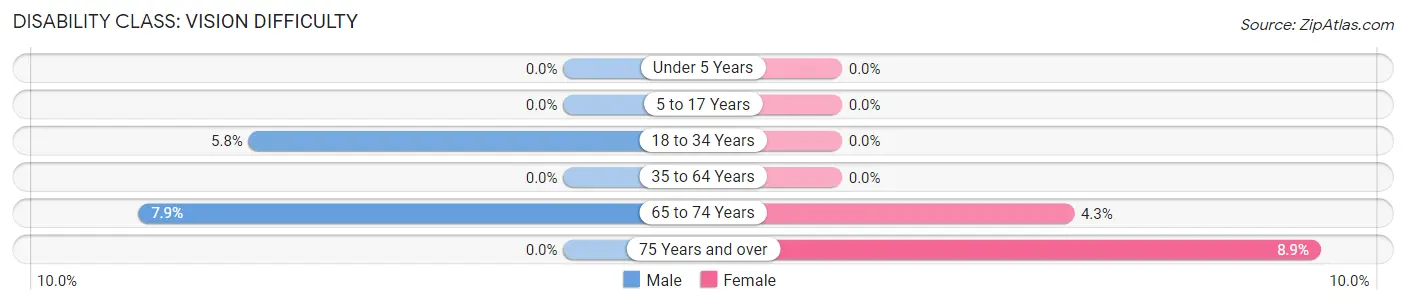
| Age Bracket | Male | Female |
| Under 5 Years | 0 (0.0%) | 0 (0.0%) |
| 5 to 17 Years | 0 (0.0%) | 0 (0.0%) |
| 18 to 34 Years | 25 (5.8%) | 0 (0.0%) |
| 35 to 64 Years | 0 (0.0%) | 0 (0.0%) |
| 65 to 74 Years | 9 (7.9%) | 11 (4.3%) |
| 75 Years and over | 0 (0.0%) | 12 (8.9%) |
Disability Class: Cognitive Difficulty
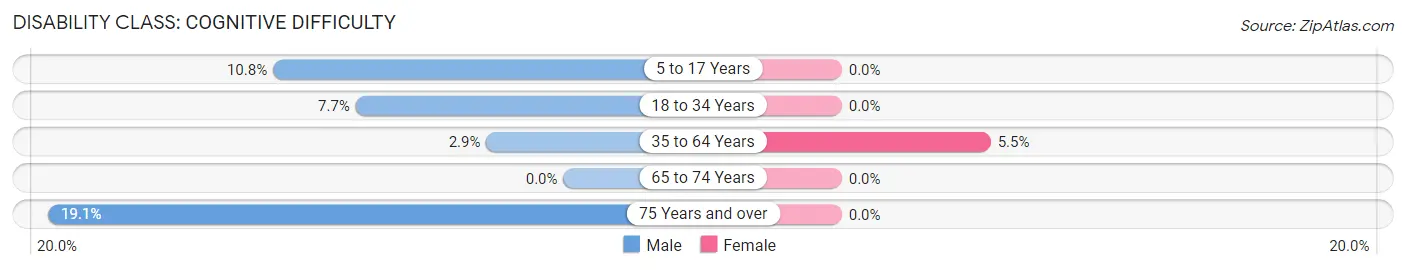
| Age Bracket | Male | Female |
| 5 to 17 Years | 25 (10.8%) | 0 (0.0%) |
| 18 to 34 Years | 33 (7.7%) | 0 (0.0%) |
| 35 to 64 Years | 21 (2.9%) | 41 (5.5%) |
| 65 to 74 Years | 0 (0.0%) | 0 (0.0%) |
| 75 Years and over | 22 (19.1%) | 0 (0.0%) |
Disability Class: Ambulatory Difficulty
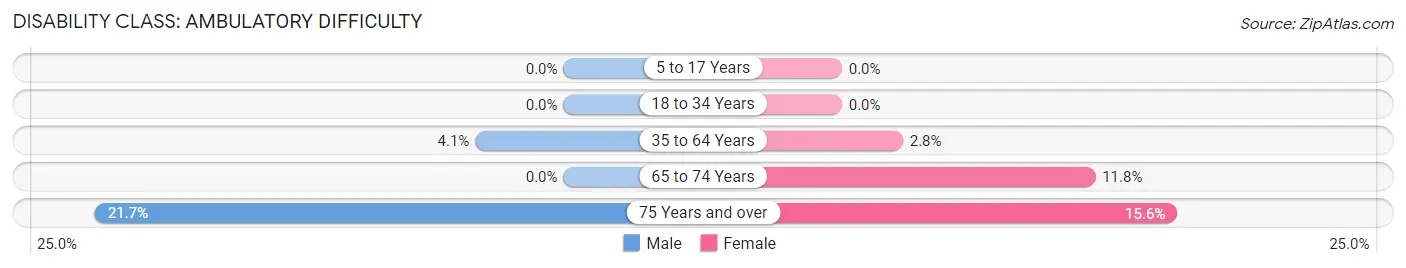
| Age Bracket | Male | Female |
| 5 to 17 Years | 0 (0.0%) | 0 (0.0%) |
| 18 to 34 Years | 0 (0.0%) | 0 (0.0%) |
| 35 to 64 Years | 30 (4.1%) | 21 (2.8%) |
| 65 to 74 Years | 0 (0.0%) | 30 (11.8%) |
| 75 Years and over | 25 (21.7%) | 21 (15.6%) |
Disability Class: Self-Care Difficulty
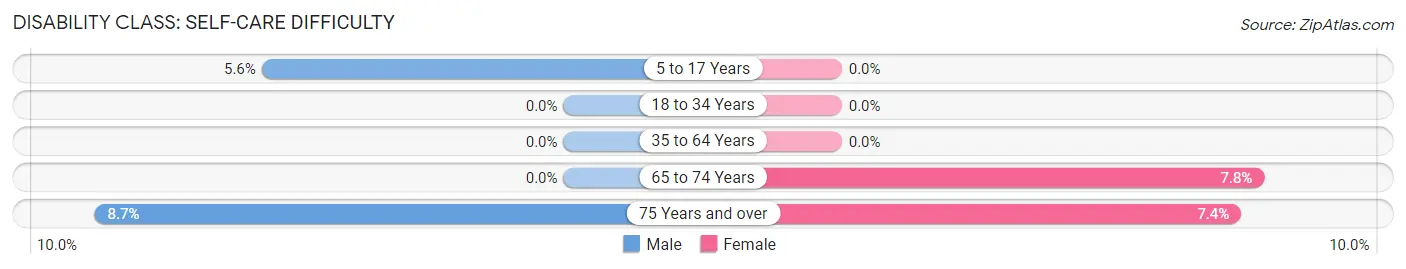
| Age Bracket | Male | Female |
| 5 to 17 Years | 13 (5.6%) | 0 (0.0%) |
| 18 to 34 Years | 0 (0.0%) | 0 (0.0%) |
| 35 to 64 Years | 0 (0.0%) | 0 (0.0%) |
| 65 to 74 Years | 0 (0.0%) | 20 (7.8%) |
| 75 Years and over | 10 (8.7%) | 10 (7.4%) |
Technology Access in Seacliff
Computing Device Access in Seacliff
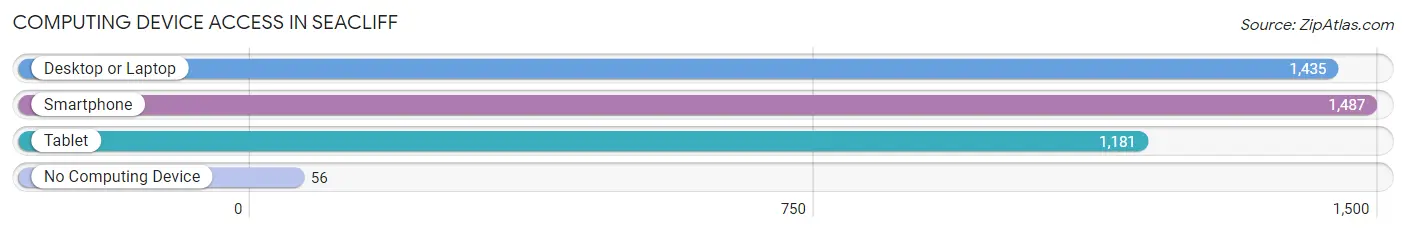
| Device Type | # Households | % Households |
| Desktop or Laptop | 1,435 | 86.7% |
| Smartphone | 1,487 | 89.8% |
| Tablet | 1,181 | 71.3% |
| No Computing Device | 56 | 3.4% |
| Total | 1,656 | 100.0% |
Internet Access in Seacliff
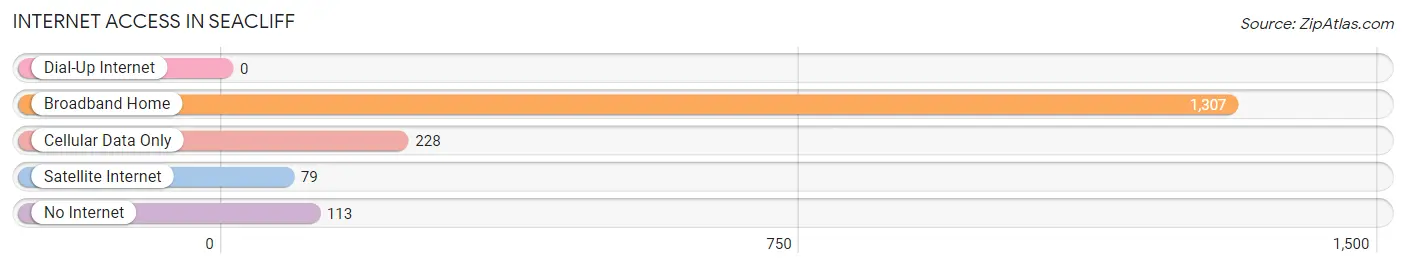
| Internet Type | # Households | % Households |
| Dial-Up Internet | 0 | 0.0% |
| Broadband Home | 1,307 | 78.9% |
| Cellular Data Only | 228 | 13.8% |
| Satellite Internet | 79 | 4.8% |
| No Internet | 113 | 6.8% |
| Total | 1,656 | 100.0% |
Seacliff Summary
Seacliff, California is a small unincorporated community located in the San Francisco Bay Area of California. It is situated on the eastern shore of the San Francisco Bay, just south of the city of San Francisco. Seacliff is bordered by the cities of San Francisco, Oakland, and Berkeley. The population of Seacliff was estimated to be 1,845 in 2019.
History
Seacliff was originally part of the Rancho San Antonio land grant, which was granted to the Peralta family in 1820. The area was later developed by the Seacliff Land and Improvement Company in the late 19th century. The company was founded by William Ralston, a prominent San Francisco banker and real estate developer. The company built a pier and a resort hotel, the Seacliff Inn, which opened in 1887. The hotel was a popular destination for tourists and locals alike.
In the early 20th century, the area became a popular spot for fishing and boating. The Seacliff Yacht Club was founded in 1906 and the Seacliff Fishing Pier was built in 1909. The pier was destroyed in a storm in 1913, but was rebuilt in 1915.
In the 1920s, the area began to be developed for residential use. The Seacliff Improvement Company built a number of homes in the area, and the population began to grow. The area was annexed by the City of San Francisco in 1927.
Geography
Seacliff is located on the eastern shore of the San Francisco Bay, just south of the city of San Francisco. It is bordered by the cities of San Francisco, Oakland, and Berkeley. The area is characterized by rolling hills and a mild climate.
The area is home to a number of parks and open spaces, including the Seacliff State Beach, the Seacliff Park, and the Seacliff Nature Preserve. The area is also home to a number of historic sites, including the Seacliff Inn, the Seacliff Yacht Club, and the Seacliff Fishing Pier.
Economy
The economy of Seacliff is largely based on tourism and recreation. The area is home to a number of hotels, restaurants, and other businesses that cater to tourists and locals alike. The Seacliff State Beach is a popular destination for swimming, fishing, and other recreational activities.
The area is also home to a number of small businesses, including retail stores, restaurants, and other services. The area is also home to a number of tech companies, including Google, Apple, and Oracle.
Demographics
The population of Seacliff was estimated to be 1,845 in 2019. The population is largely white (77.3%), followed by Asian (13.2%), Hispanic (4.7%), and African American (2.7%). The median household income is $90,845, and the median home value is $1,092,000.
Conclusion
Seacliff, California is a small unincorporated community located in the San Francisco Bay Area of California. It is situated on the eastern shore of the San Francisco Bay, just south of the city of San Francisco. Seacliff is bordered by the cities of San Francisco, Oakland, and Berkeley. The population of Seacliff was estimated to be 1,845 in 2019. The area is characterized by rolling hills and a mild climate, and is home to a number of parks and open spaces. The economy of Seacliff is largely based on tourism and recreation, and the population is largely white.
Common Questions
What is the Total Population of Seacliff?
Total Population of Seacliff is 3,550.
What is the Total Male Population of Seacliff?
Total Male Population of Seacliff is 1,672.
What is the Total Female Population of Seacliff?
Total Female Population of Seacliff is 1,878.
What is the Ratio of Males per 100 Females in Seacliff?
There are 89.03 Males per 100 Females in Seacliff.
What is the Ratio of Females per 100 Males in Seacliff?
There are 112.32 Females per 100 Males in Seacliff.
What is the Median Population Age in Seacliff?
Median Population Age in Seacliff is 43.5 Years.
What is the Average Family Size in Seacliff
Average Family Size in Seacliff is 2.7 People.
What is the Average Household Size in Seacliff
Average Household Size in Seacliff is 2.1 People.
What is Per Capita Income in Seacliff?
Per Capita income in Seacliff is $73,934.
What is the Median Family Income in Seacliff?
Median Family Income in Seacliff is $128,553.
What is the Median Household income in Seacliff?
Median Household Income in Seacliff is $109,269.
What is Income or Wage Gap in Seacliff?
Income or Wage Gap in Seacliff is 35.1%.
Women in Seacliff earn 64.9 cents for every dollar earned by a man.
What is Inequality or Gini Index in Seacliff?
Inequality or Gini Index in Seacliff is 0.48.
How Large is the Labor Force in Seacliff?
There are 2,209 People in the Labor Forcein in Seacliff.
What is the Percentage of People in the Labor Force in Seacliff?
71.2% of People are in the Labor Force in Seacliff.
What is the Unemployment Rate in Seacliff?
Unemployment Rate in Seacliff is 6.5%.