Sand City, CA
Sand City Map
Sand City Overview
319
TOTAL POPULATION
178
MALE POPULATION
141
FEMALE POPULATION
126.24
MALES / 100 FEMALES
79.21
FEMALES / 100 MALES
45.6
MEDIAN AGE
2.8
AVG FAMILY SIZE
1.9
AVG HOUSEHOLD SIZE
$47,525
PER CAPITA INCOME
$86,500
AVG FAMILY INCOME
$68,333
AVG HOUSEHOLD INCOME
20.0%
WAGE / INCOME GAP [ % ]
80.0¢/ $1
WAGE / INCOME GAP [ $ ]
0.36
INEQUALITY / GINI INDEX
204
LABOR FORCE [ PEOPLE ]
73.4%
PERCENT IN LABOR FORCE
1.6%
UNEMPLOYMENT RATE
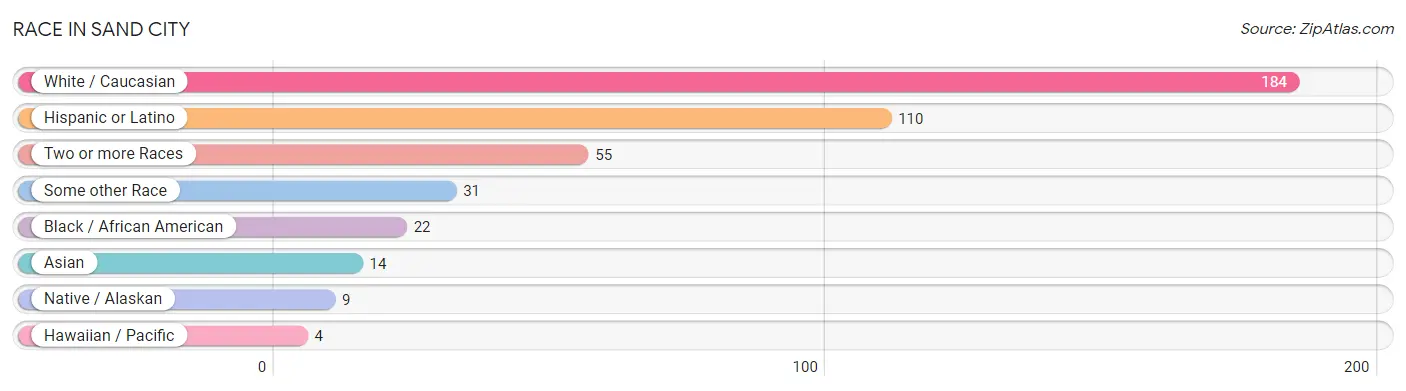
Race in Sand City
The most populous races in Sand City are White / Caucasian (184 | 57.7%), Hispanic or Latino (110 | 34.5%), and Two or more Races (55 | 17.2%).
| Race | # Population | % Population |
| Asian | 14 | 4.4% |
| Black / African American | 22 | 6.9% |
| Hawaiian / Pacific | 4 | 1.3% |
| Hispanic or Latino | 110 | 34.5% |
| Native / Alaskan | 9 | 2.8% |
| White / Caucasian | 184 | 57.7% |
| Two or more Races | 55 | 17.2% |
| Some other Race | 31 | 9.7% |
| Total | 319 | 100.0% |
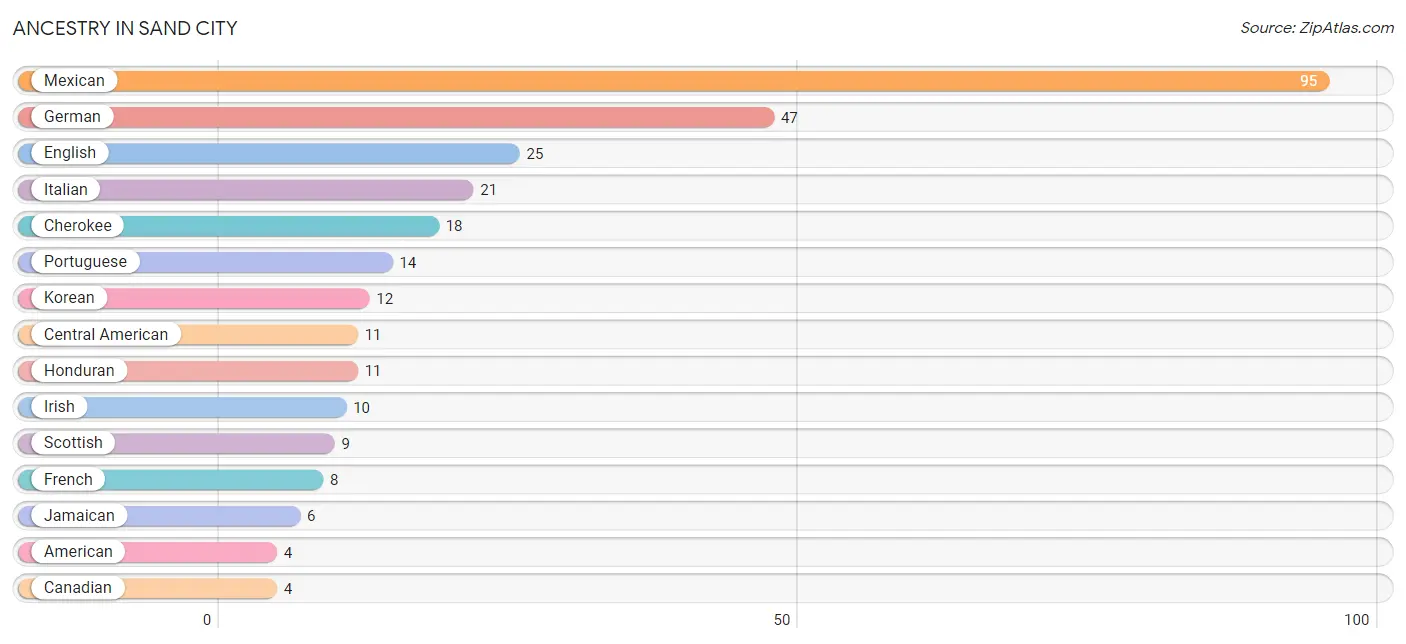
Ancestry in Sand City
The most populous ancestries reported in Sand City are Mexican (95 | 29.8%), German (47 | 14.7%), English (25 | 7.8%), Italian (21 | 6.6%), and Cherokee (18 | 5.6%), together accounting for 64.6% of all Sand City residents.
| Ancestry | # Population | % Population |
| American | 4 | 1.3% |
| Arab | 2 | 0.6% |
| British | 1 | 0.3% |
| Canadian | 4 | 1.3% |
| Central American | 11 | 3.5% |
| Cherokee | 18 | 5.6% |
| Croatian | 1 | 0.3% |
| Danish | 3 | 0.9% |
| English | 25 | 7.8% |
| European | 3 | 0.9% |
| Filipino | 1 | 0.3% |
| French | 8 | 2.5% |
| German | 47 | 14.7% |
| Honduran | 11 | 3.5% |
| Indian (Asian) | 1 | 0.3% |
| Iranian | 2 | 0.6% |
| Irish | 10 | 3.1% |
| Italian | 21 | 6.6% |
| Jamaican | 6 | 1.9% |
| Korean | 12 | 3.8% |
| Lebanese | 2 | 0.6% |
| Mexican | 95 | 29.8% |
| Native Hawaiian | 4 | 1.3% |
| Norwegian | 2 | 0.6% |
| Polish | 2 | 0.6% |
| Portuguese | 14 | 4.4% |
| Russian | 2 | 0.6% |
| Scotch-Irish | 4 | 1.3% |
| Scottish | 9 | 2.8% |
| Spaniard | 4 | 1.3% |
| Swiss | 2 | 0.6% |
| Ukrainian | 1 | 0.3% |
| Welsh | 2 | 0.6% | View All 33 Rows |
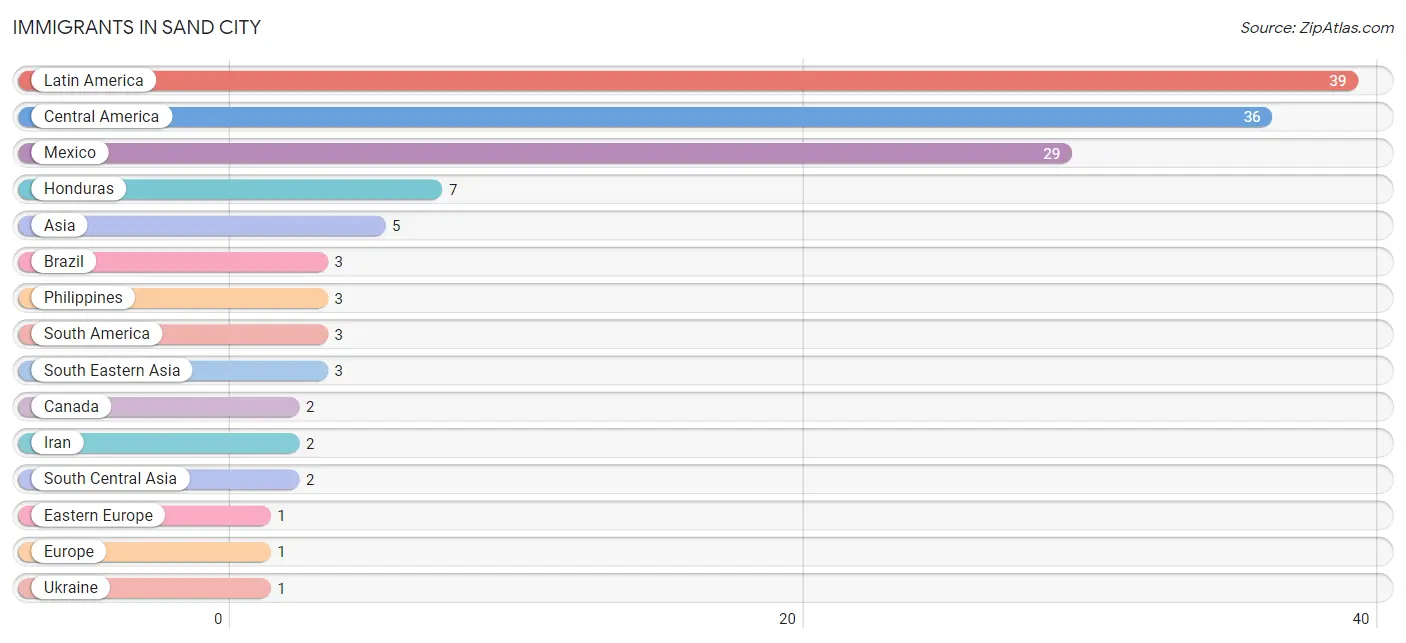
Immigrants in Sand City
The most numerous immigrant groups reported in Sand City came from Latin America (39 | 12.2%), Central America (36 | 11.3%), Mexico (29 | 9.1%), Honduras (7 | 2.2%), and Asia (5 | 1.6%), together accounting for 36.4% of all Sand City residents.
| Immigration Origin | # Population | % Population |
| Asia | 5 | 1.6% |
| Brazil | 3 | 0.9% |
| Canada | 2 | 0.6% |
| Central America | 36 | 11.3% |
| Eastern Europe | 1 | 0.3% |
| Europe | 1 | 0.3% |
| Honduras | 7 | 2.2% |
| Iran | 2 | 0.6% |
| Latin America | 39 | 12.2% |
| Mexico | 29 | 9.1% |
| Philippines | 3 | 0.9% |
| South America | 3 | 0.9% |
| South Central Asia | 2 | 0.6% |
| South Eastern Asia | 3 | 0.9% |
| Ukraine | 1 | 0.3% | View All 15 Rows |
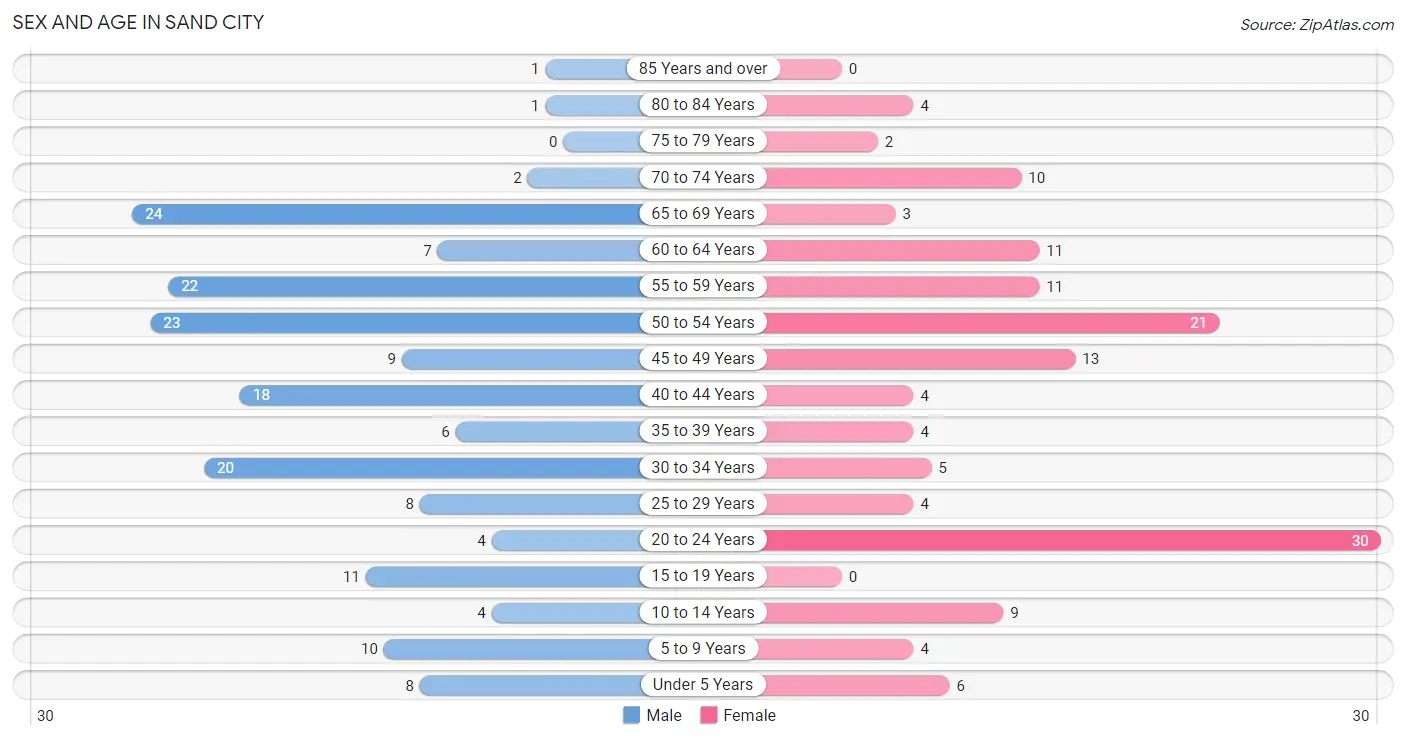
Sex and Age in Sand City
Sex and Age in Sand City
The most populous age groups in Sand City are 65 to 69 Years (24 | 13.5%) for men and 20 to 24 Years (30 | 21.3%) for women.
| Age Bracket | Male | Female |
| Under 5 Years | 8 (4.5%) | 6 (4.3%) |
| 5 to 9 Years | 10 (5.6%) | 4 (2.8%) |
| 10 to 14 Years | 4 (2.2%) | 9 (6.4%) |
| 15 to 19 Years | 11 (6.2%) | 0 (0.0%) |
| 20 to 24 Years | 4 (2.2%) | 30 (21.3%) |
| 25 to 29 Years | 8 (4.5%) | 4 (2.8%) |
| 30 to 34 Years | 20 (11.2%) | 5 (3.5%) |
| 35 to 39 Years | 6 (3.4%) | 4 (2.8%) |
| 40 to 44 Years | 18 (10.1%) | 4 (2.8%) |
| 45 to 49 Years | 9 (5.1%) | 13 (9.2%) |
| 50 to 54 Years | 23 (12.9%) | 21 (14.9%) |
| 55 to 59 Years | 22 (12.4%) | 11 (7.8%) |
| 60 to 64 Years | 7 (3.9%) | 11 (7.8%) |
| 65 to 69 Years | 24 (13.5%) | 3 (2.1%) |
| 70 to 74 Years | 2 (1.1%) | 10 (7.1%) |
| 75 to 79 Years | 0 (0.0%) | 2 (1.4%) |
| 80 to 84 Years | 1 (0.6%) | 4 (2.8%) |
| 85 Years and over | 1 (0.6%) | 0 (0.0%) |
| Total | 178 (100.0%) | 141 (100.0%) |
Families and Households in Sand City
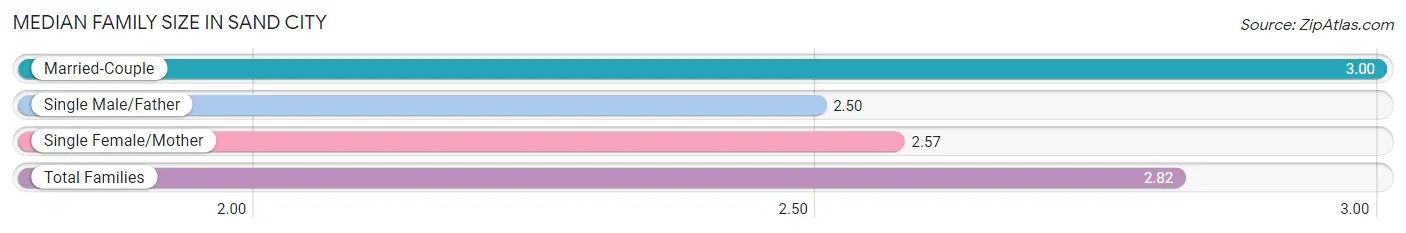
Median Family Size in Sand City
The median family size in Sand City is 2.82 persons per family, with married-couple families (39 | 59.1%) accounting for the largest median family size of 3 persons per family. On the other hand, single male/father families (6 | 9.1%) represent the smallest median family size with 2.50 persons per family.
| Family Type | # Families | Family Size |
| Married-Couple | 39 (59.1%) | 3.00 |
| Single Male/Father | 6 (9.1%) | 2.50 |
| Single Female/Mother | 21 (31.8%) | 2.57 |
| Total Families | 66 (100.0%) | 2.82 |
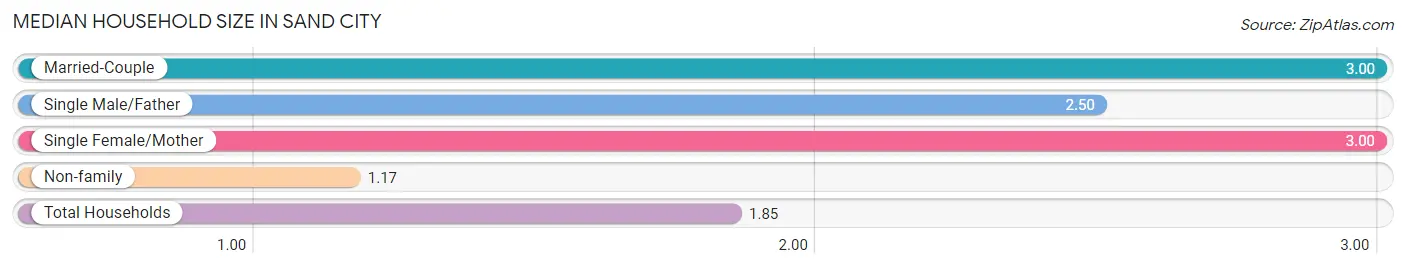
Median Household Size in Sand City
The median household size in Sand City is 1.85 persons per household, with married-couple households (39 | 22.7%) accounting for the largest median household size of 3 persons per household. non-family households (106 | 61.6%) represent the smallest median household size with 1.17 persons per household.
| Household Type | # Households | Household Size |
| Married-Couple | 39 (22.7%) | 3.00 |
| Single Male/Father | 6 (3.5%) | 2.50 |
| Single Female/Mother | 21 (12.2%) | 3.00 |
| Non-family | 106 (61.6%) | 1.17 |
| Total Households | 172 (100.0%) | 1.85 |
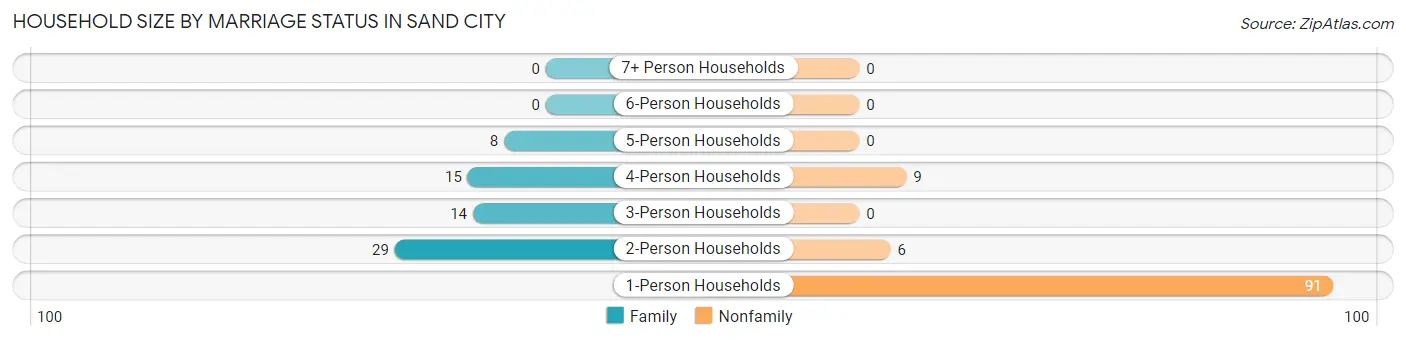
Household Size by Marriage Status in Sand City
Out of a total of 172 households in Sand City, 66 (38.4%) are family households, while 106 (61.6%) are nonfamily households. The most numerous type of family households are 2-person households, comprising 29, and the most common type of nonfamily households are 1-person households, comprising 91.
| Household Size | Family Households | Nonfamily Households |
| 1-Person Households | - | 91 (52.9%) |
| 2-Person Households | 29 (16.9%) | 6 (3.5%) |
| 3-Person Households | 14 (8.1%) | 0 (0.0%) |
| 4-Person Households | 15 (8.7%) | 9 (5.2%) |
| 5-Person Households | 8 (4.6%) | 0 (0.0%) |
| 6-Person Households | 0 (0.0%) | 0 (0.0%) |
| 7+ Person Households | 0 (0.0%) | 0 (0.0%) |
| Total | 66 (38.4%) | 106 (61.6%) |
Female Fertility in Sand City
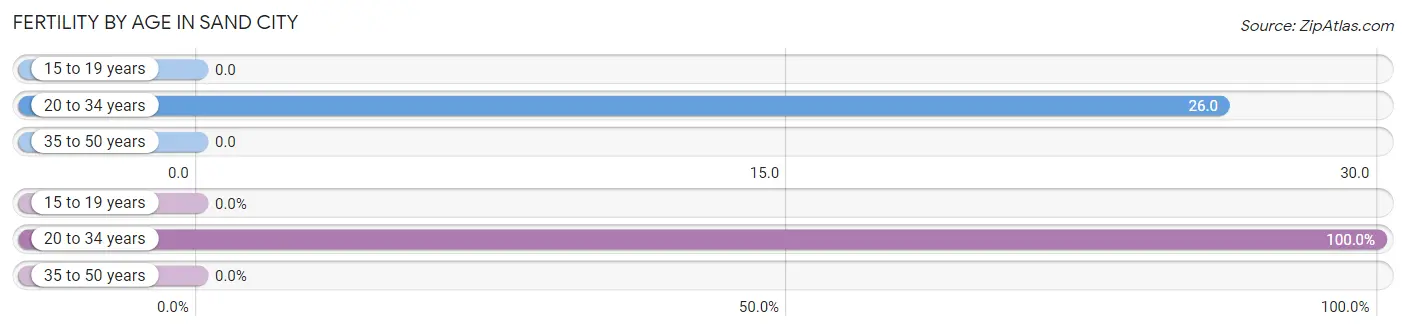
Fertility by Age in Sand City
Average fertility rate in Sand City is 17.0 births per 1,000 women. Women in the age bracket of 20 to 34 years have the highest fertility rate with 26.0 births per 1,000 women. Women in the age bracket of 20 to 34 years acount for 100.0% of all women with births.
| Age Bracket | Women with Births | Births / 1,000 Women |
| 15 to 19 years | 0 (0.0%) | 0.0 |
| 20 to 34 years | 1 (100.0%) | 26.0 |
| 35 to 50 years | 0 (0.0%) | 0.0 |
| Total | 1 (100.0%) | 17.0 |
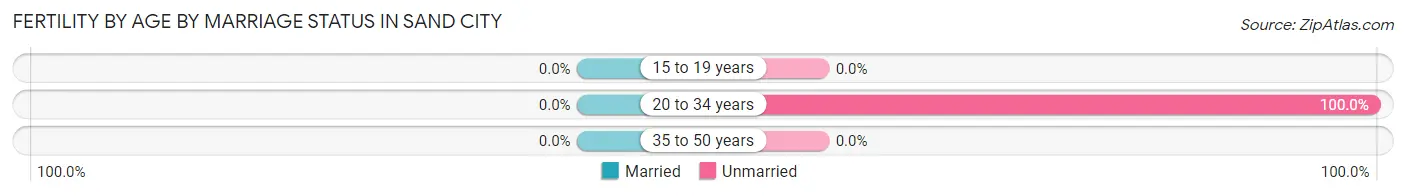
Fertility by Age by Marriage Status in Sand City
| Age Bracket | Married | Unmarried |
| 15 to 19 years | 0 (0.0%) | 0 (0.0%) |
| 20 to 34 years | 0 (0.0%) | 1 (100.0%) |
| 35 to 50 years | 0 (0.0%) | 0 (0.0%) |
| Total | 0 (0.0%) | 1 (100.0%) |
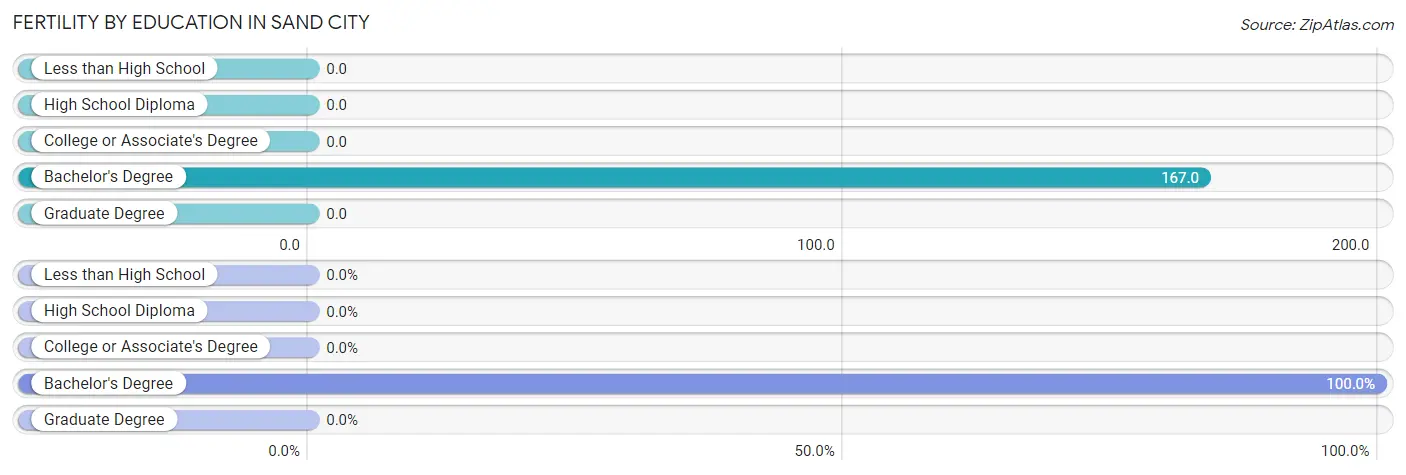
Fertility by Education in Sand City
| Educational Attainment | Women with Births | Births / 1,000 Women |
| Less than High School | 0 (0.0%) | 0.0 |
| High School Diploma | 0 (0.0%) | 0.0 |
| College or Associate's Degree | 0 (0.0%) | 0.0 |
| Bachelor's Degree | 1 (100.0%) | 167.0 |
| Graduate Degree | 0 (0.0%) | 0.0 |
| Total | 1 (100.0%) | 17.0 |
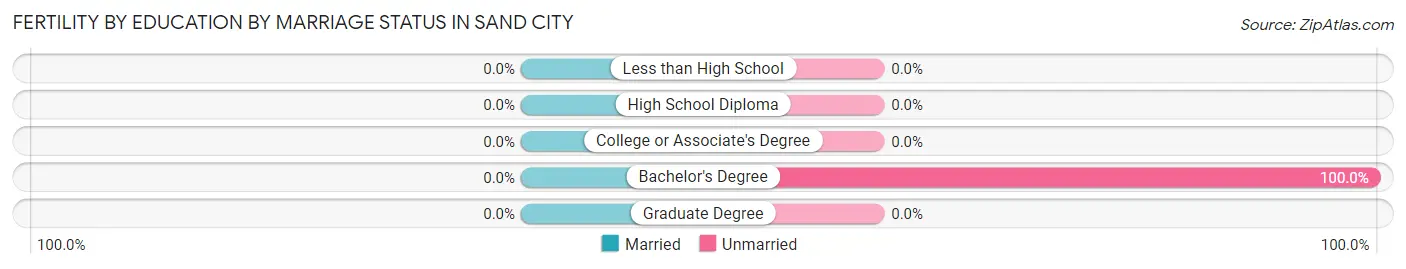
Fertility by Education by Marriage Status in Sand City
| Educational Attainment | Married | Unmarried |
| Less than High School | 0 (0.0%) | 0 (0.0%) |
| High School Diploma | 0 (0.0%) | 0 (0.0%) |
| College or Associate's Degree | 0 (0.0%) | 0 (0.0%) |
| Bachelor's Degree | 0 (0.0%) | 1 (100.0%) |
| Graduate Degree | 0 (0.0%) | 0 (0.0%) |
| Total | 0 (0.0%) | 1 (100.0%) |
Income in Sand City
Income Overview in Sand City
Per Capita Income in Sand City is $47,525, while median incomes of families and households are $86,500 and $68,333 respectively.
| Characteristic | Number | Measure |
| Per Capita Income | 319 | $47,525 |
| Median Family Income | 66 | $86,500 |
| Mean Family Income | 66 | $109,348 |
| Median Household Income | 172 | $68,333 |
| Mean Household Income | 172 | $88,283 |
| Income Deficit | 66 | $0 |
| Wage / Income Gap (%) | 319 | 20.00% |
| Wage / Income Gap ($) | 319 | 80.00¢ per $1 |
| Gini / Inequality Index | 319 | 0.36 |
Earnings by Sex in Sand City
Average Earnings in Sand City are $43,021, $53,125 for men and $42,500 for women, a difference of 20.0%.
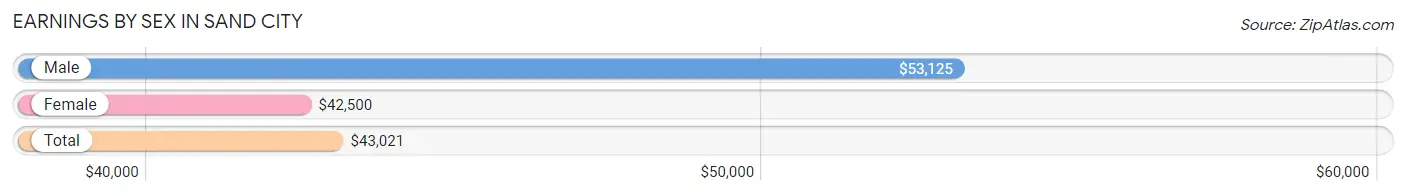
| Sex | Number | Average Earnings |
| Male | 127 (57.5%) | $53,125 |
| Female | 94 (42.5%) | $42,500 |
| Total | 221 (100.0%) | $43,021 |
Earnings by Sex by Income Bracket in Sand City
The most common earnings brackets in Sand City are $55,000 to $64,999 for men (25 | 19.7%) and $100,000+ for women (17 | 18.1%).
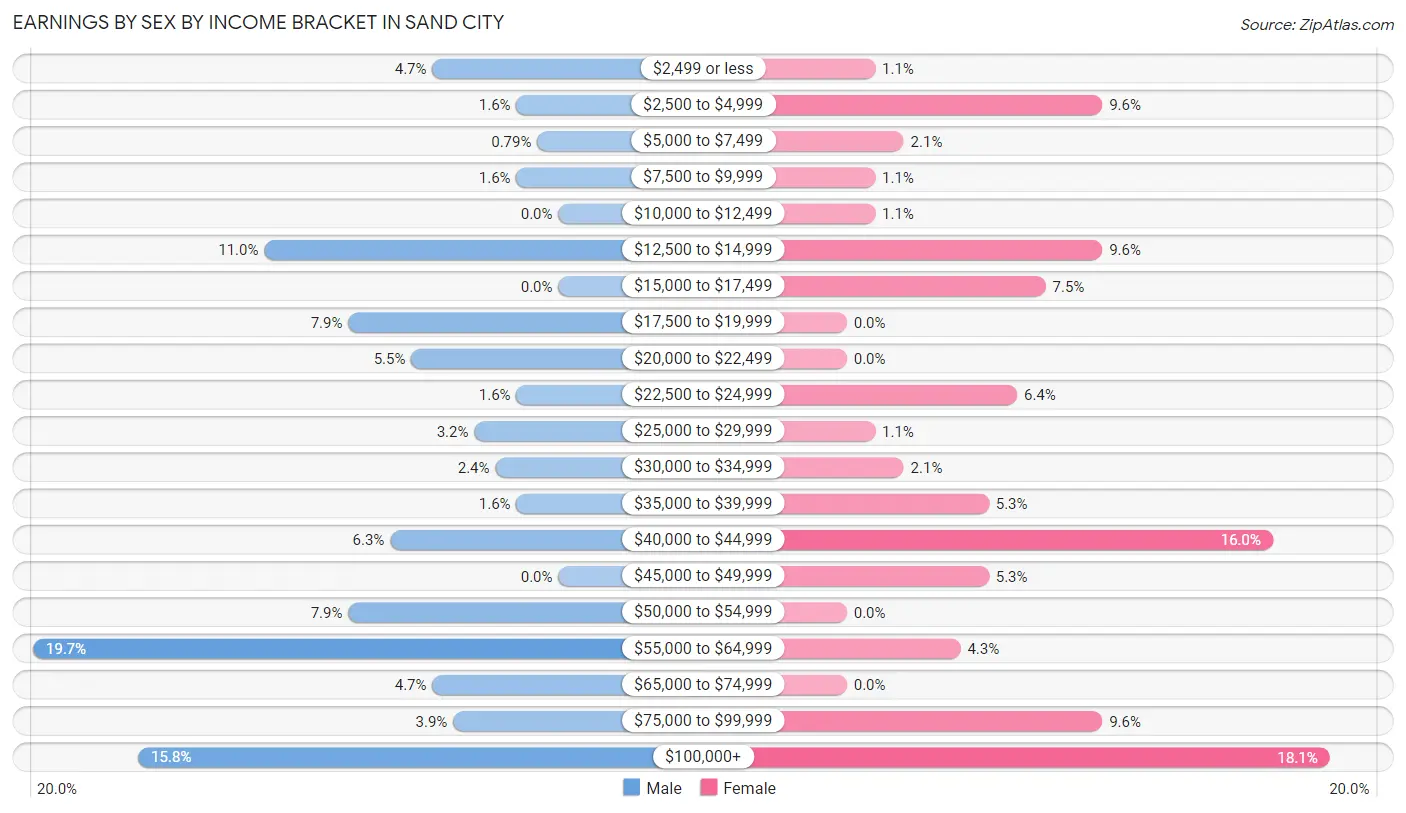
| Income | Male | Female |
| $2,499 or less | 6 (4.7%) | 1 (1.1%) |
| $2,500 to $4,999 | 2 (1.6%) | 9 (9.6%) |
| $5,000 to $7,499 | 1 (0.8%) | 2 (2.1%) |
| $7,500 to $9,999 | 2 (1.6%) | 1 (1.1%) |
| $10,000 to $12,499 | 0 (0.0%) | 1 (1.1%) |
| $12,500 to $14,999 | 14 (11.0%) | 9 (9.6%) |
| $15,000 to $17,499 | 0 (0.0%) | 7 (7.4%) |
| $17,500 to $19,999 | 10 (7.9%) | 0 (0.0%) |
| $20,000 to $22,499 | 7 (5.5%) | 0 (0.0%) |
| $22,500 to $24,999 | 2 (1.6%) | 6 (6.4%) |
| $25,000 to $29,999 | 4 (3.2%) | 1 (1.1%) |
| $30,000 to $34,999 | 3 (2.4%) | 2 (2.1%) |
| $35,000 to $39,999 | 2 (1.6%) | 5 (5.3%) |
| $40,000 to $44,999 | 8 (6.3%) | 15 (16.0%) |
| $45,000 to $49,999 | 0 (0.0%) | 5 (5.3%) |
| $50,000 to $54,999 | 10 (7.9%) | 0 (0.0%) |
| $55,000 to $64,999 | 25 (19.7%) | 4 (4.3%) |
| $65,000 to $74,999 | 6 (4.7%) | 0 (0.0%) |
| $75,000 to $99,999 | 5 (3.9%) | 9 (9.6%) |
| $100,000+ | 20 (15.8%) | 17 (18.1%) |
| Total | 127 (100.0%) | 94 (100.0%) |
Earnings by Sex by Educational Attainment in Sand City
Average earnings in Sand City are $54,000 for men and $46,500 for women, a difference of 13.9%. Men with an educational attainment of bachelor's degree enjoy the highest average annual earnings of $97,500, while those with less than high school education earn the least with $19,167. Women with an educational attainment of bachelor's degree earn the most with the average annual earnings of $99,375, while those with college or associate's degree education have the smallest earnings of $43,594.
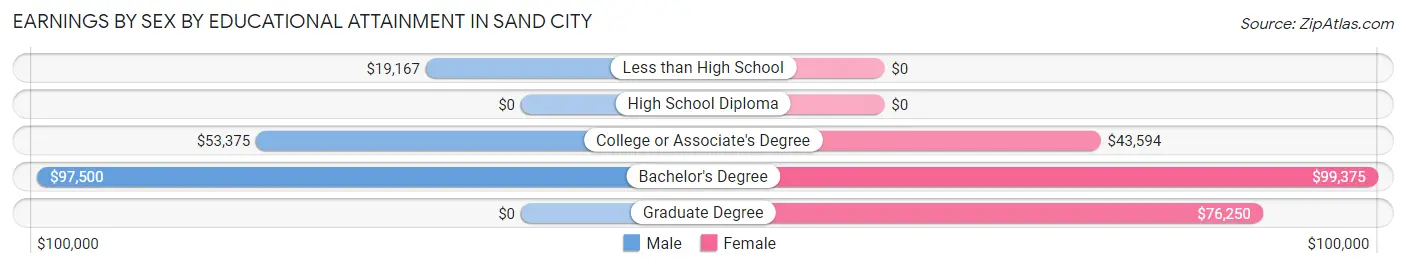
| Educational Attainment | Male Income | Female Income |
| Less than High School | $19,167 | $0 |
| High School Diploma | - | - |
| College or Associate's Degree | $53,375 | $43,594 |
| Bachelor's Degree | $97,500 | $99,375 |
| Graduate Degree | - | - |
| Total | $54,000 | $46,500 |
Family Income in Sand City
Family Income Brackets in Sand City
According to the Sand City family income data, there are 18 families falling into the $100,000 to $149,999 income range, which is the most common income bracket and makes up 27.3% of all families.
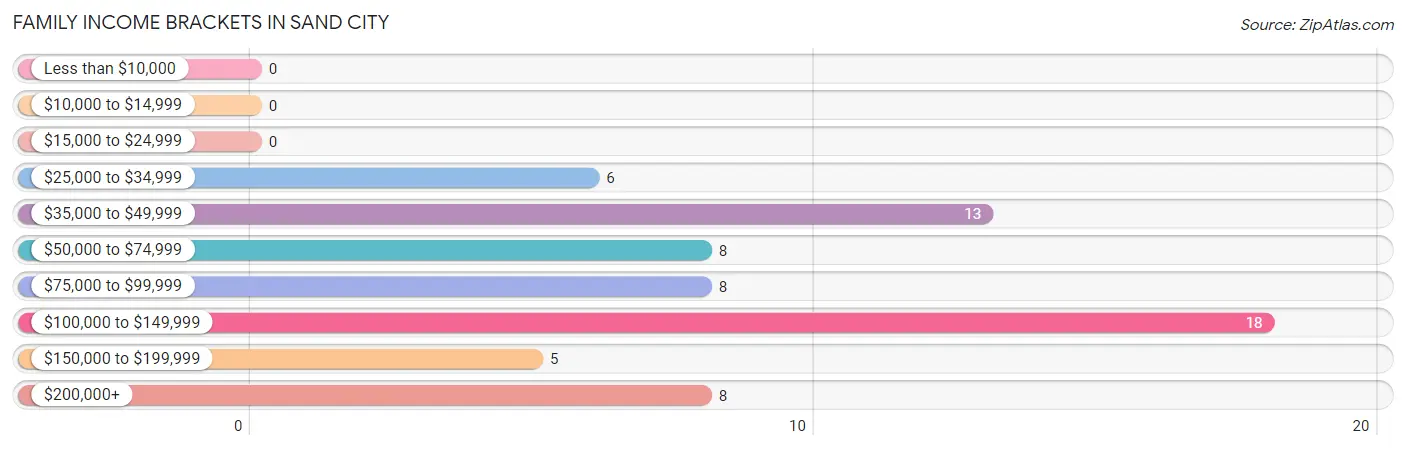
| Income Bracket | # Families | % Families |
| Less than $10,000 | 0 | 0.0% |
| $10,000 to $14,999 | 0 | 0.0% |
| $15,000 to $24,999 | 0 | 0.0% |
| $25,000 to $34,999 | 6 | 9.1% |
| $35,000 to $49,999 | 13 | 19.7% |
| $50,000 to $74,999 | 8 | 12.1% |
| $75,000 to $99,999 | 8 | 12.1% |
| $100,000 to $149,999 | 18 | 27.3% |
| $150,000 to $199,999 | 5 | 7.6% |
| $200,000+ | 8 | 12.1% |
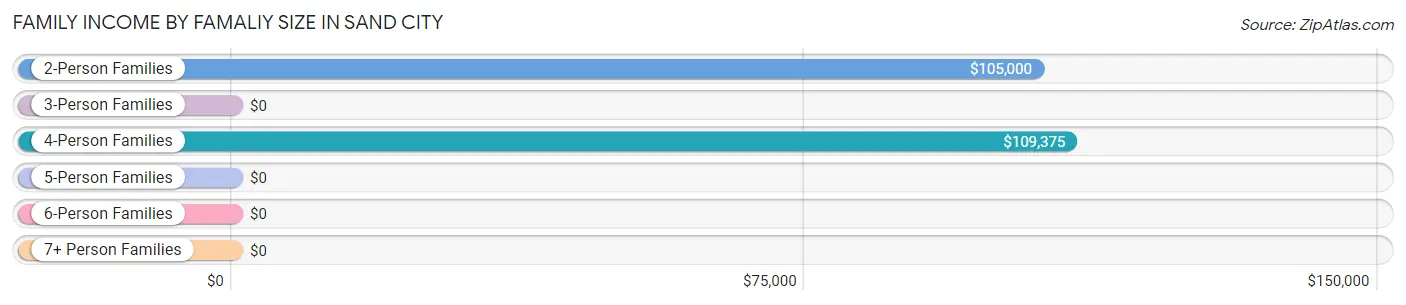
Family Income by Famaliy Size in Sand City
4-person families (6 | 9.1%) account for the highest median family income in Sand City with $109,375 per family, while 2-person families (30 | 45.5%) have the highest median income of $52,500 per family member.
| Income Bracket | # Families | Median Income |
| 2-Person Families | 30 (45.5%) | $105,000 |
| 3-Person Families | 22 (33.3%) | $0 |
| 4-Person Families | 6 (9.1%) | $109,375 |
| 5-Person Families | 8 (12.1%) | $0 |
| 6-Person Families | 0 (0.0%) | $0 |
| 7+ Person Families | 0 (0.0%) | $0 |
| Total | 66 (100.0%) | $86,500 |
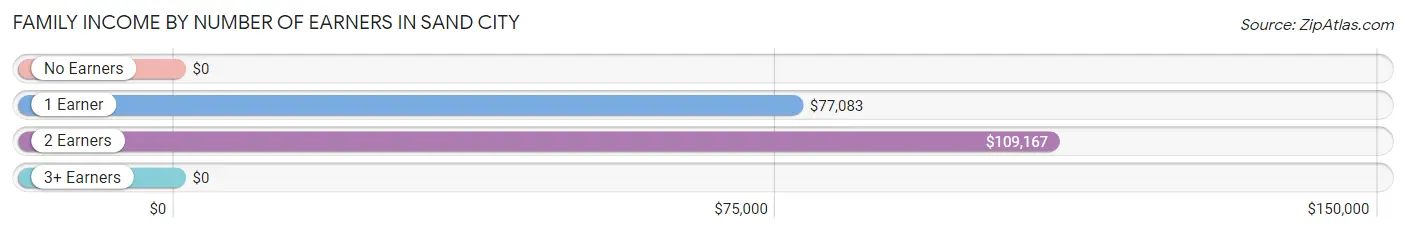
Family Income by Number of Earners in Sand City
| Number of Earners | # Families | Median Income |
| No Earners | 2 (3.0%) | $0 |
| 1 Earner | 19 (28.8%) | $77,083 |
| 2 Earners | 40 (60.6%) | $109,167 |
| 3+ Earners | 5 (7.6%) | $0 |
| Total | 66 (100.0%) | $86,500 |
Household Income in Sand City
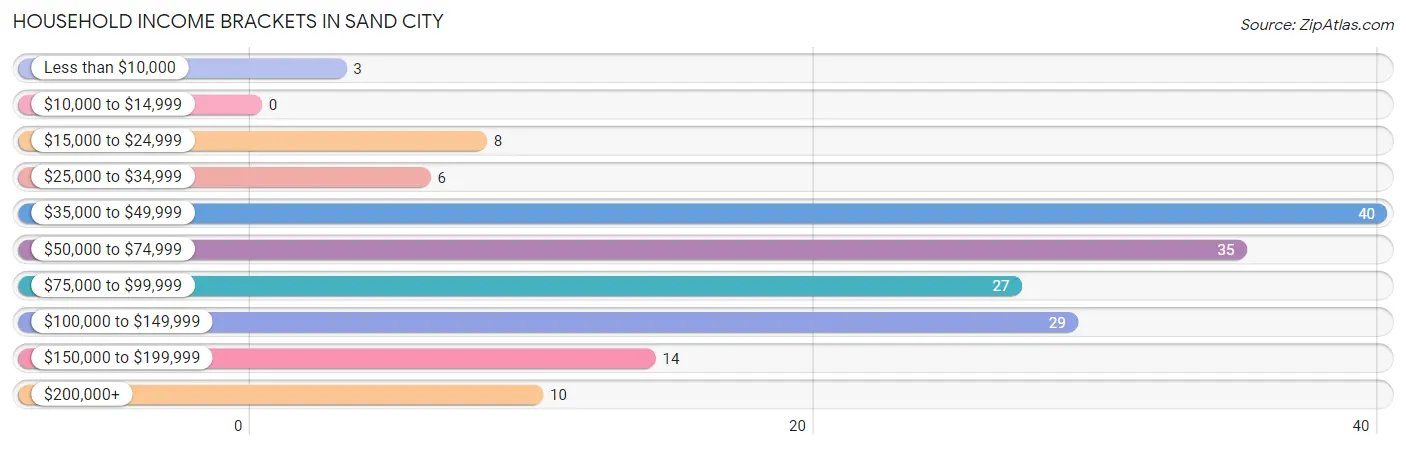
Household Income Brackets in Sand City
With 40 households falling in the category, the $35,000 to $49,999 income range is the most frequent in Sand City, accounting for 23.3% of all households.
| Income Bracket | # Households | % Households |
| Less than $10,000 | 3 | 1.7% |
| $10,000 to $14,999 | 0 | 0.0% |
| $15,000 to $24,999 | 8 | 4.7% |
| $25,000 to $34,999 | 6 | 3.5% |
| $35,000 to $49,999 | 40 | 23.3% |
| $50,000 to $74,999 | 35 | 20.3% |
| $75,000 to $99,999 | 27 | 15.7% |
| $100,000 to $149,999 | 29 | 16.9% |
| $150,000 to $199,999 | 14 | 8.1% |
| $200,000+ | 10 | 5.8% |
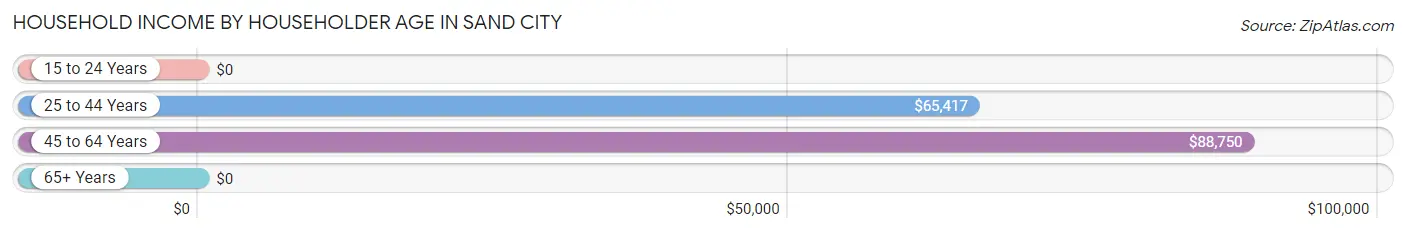
Household Income by Householder Age in Sand City
The median household income in Sand City is $68,333, with the highest median household income of $88,750 found in the 45 to 64 years age bracket for the primary householder. A total of 81 households (47.1%) fall into this category. Meanwhile, the 15 to 24 years age bracket for the primary householder has the lowest median household income of $0, with 5 households (2.9%) in this group.
| Income Bracket | # Households | Median Income |
| 15 to 24 Years | 5 (2.9%) | $0 |
| 25 to 44 Years | 53 (30.8%) | $65,417 |
| 45 to 64 Years | 81 (47.1%) | $88,750 |
| 65+ Years | 33 (19.2%) | $0 |
| Total | 172 (100.0%) | $68,333 |
Poverty in Sand City
Income Below Poverty by Sex and Age in Sand City
With 8.1% poverty level for males and 3.5% for females among the residents of Sand City, 12 to 14 year old males and 35 to 44 year old females are the most vulnerable to poverty, with 2 males (100.0%) and 2 females (25.0%) in their respective age groups living below the poverty level.
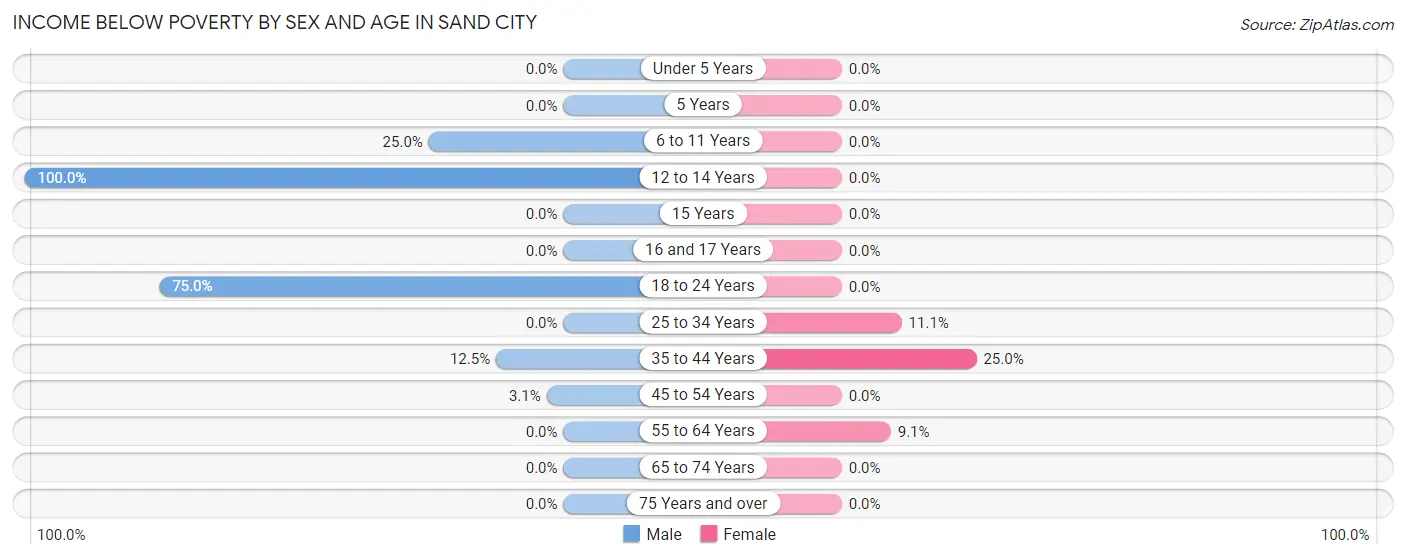
| Age Bracket | Male | Female |
| Under 5 Years | 0 (0.0%) | 0 (0.0%) |
| 5 Years | 0 (0.0%) | 0 (0.0%) |
| 6 to 11 Years | 2 (25.0%) | 0 (0.0%) |
| 12 to 14 Years | 2 (100.0%) | 0 (0.0%) |
| 15 Years | 0 (0.0%) | 0 (0.0%) |
| 16 and 17 Years | 0 (0.0%) | 0 (0.0%) |
| 18 to 24 Years | 6 (75.0%) | 0 (0.0%) |
| 25 to 34 Years | 0 (0.0%) | 1 (11.1%) |
| 35 to 44 Years | 3 (12.5%) | 2 (25.0%) |
| 45 to 54 Years | 1 (3.1%) | 0 (0.0%) |
| 55 to 64 Years | 0 (0.0%) | 2 (9.1%) |
| 65 to 74 Years | 0 (0.0%) | 0 (0.0%) |
| 75 Years and over | 0 (0.0%) | 0 (0.0%) |
| Total | 14 (8.1%) | 5 (3.5%) |
Income Above Poverty by Sex and Age in Sand City
According to the poverty statistics in Sand City, males aged under 5 years and females aged under 5 years are the age groups that are most secure financially, with 100.0% of males and 100.0% of females in these age groups living above the poverty line.
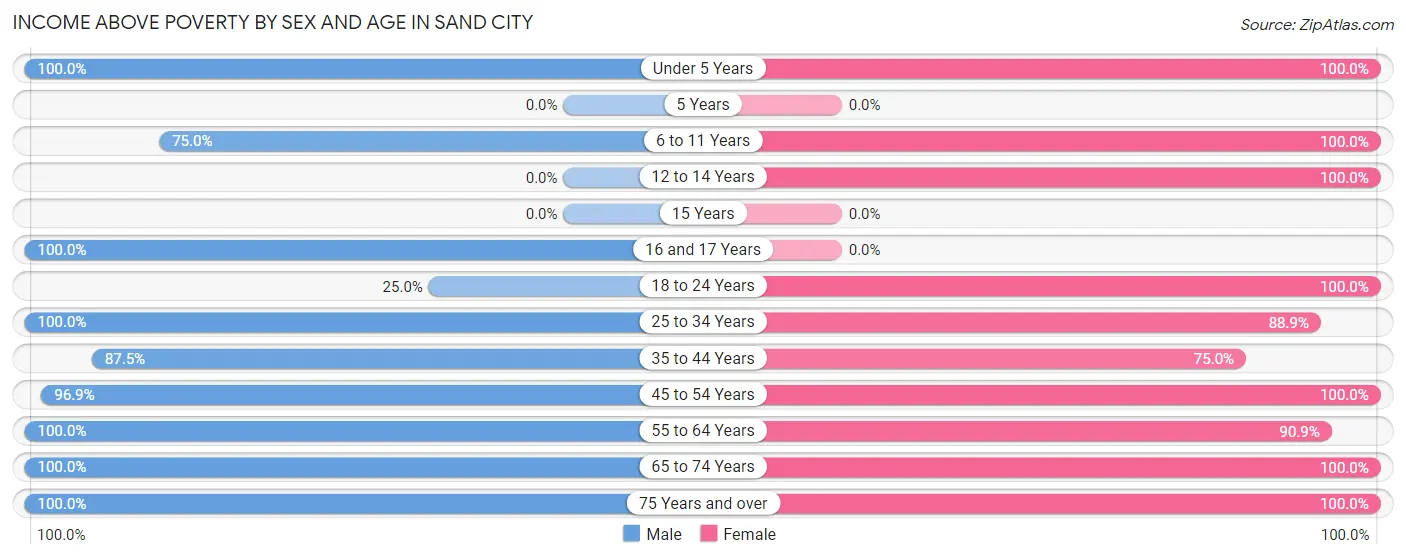
| Age Bracket | Male | Female |
| Under 5 Years | 8 (100.0%) | 6 (100.0%) |
| 5 Years | 0 (0.0%) | 0 (0.0%) |
| 6 to 11 Years | 6 (75.0%) | 10 (100.0%) |
| 12 to 14 Years | 0 (0.0%) | 3 (100.0%) |
| 15 Years | 0 (0.0%) | 0 (0.0%) |
| 16 and 17 Years | 7 (100.0%) | 0 (0.0%) |
| 18 to 24 Years | 2 (25.0%) | 30 (100.0%) |
| 25 to 34 Years | 28 (100.0%) | 8 (88.9%) |
| 35 to 44 Years | 21 (87.5%) | 6 (75.0%) |
| 45 to 54 Years | 31 (96.9%) | 34 (100.0%) |
| 55 to 64 Years | 29 (100.0%) | 20 (90.9%) |
| 65 to 74 Years | 26 (100.0%) | 13 (100.0%) |
| 75 Years and over | 2 (100.0%) | 6 (100.0%) |
| Total | 160 (91.9%) | 136 (96.5%) |
Income Below Poverty Among Married-Couple Families in Sand City
The poverty statistics for married-couple families in Sand City show that 5.1% or 2 of the total 39 families live below the poverty line. Families with 1 or 2 children have the highest poverty rate of 15.4%, comprising of 2 families. On the other hand, families with no children have the lowest poverty rate of 0.0%, which includes 0 families.
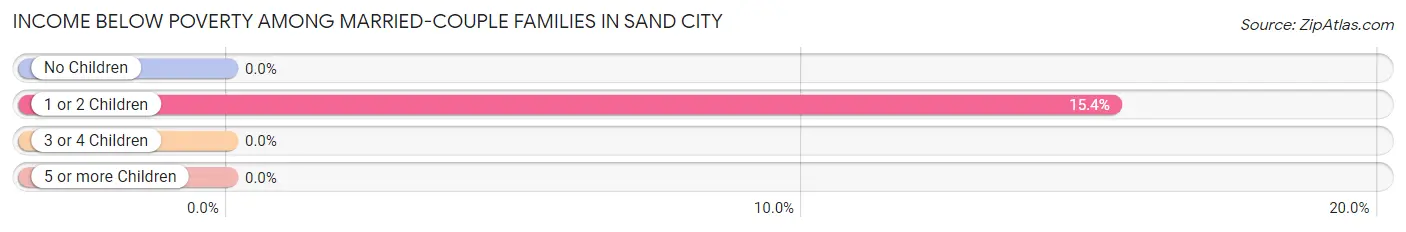
| Children | Above Poverty | Below Poverty |
| No Children | 26 (100.0%) | 0 (0.0%) |
| 1 or 2 Children | 11 (84.6%) | 2 (15.4%) |
| 3 or 4 Children | 0 (0.0%) | 0 (0.0%) |
| 5 or more Children | 0 (0.0%) | 0 (0.0%) |
| Total | 37 (94.9%) | 2 (5.1%) |
Income Below Poverty Among Single-Parent Households in Sand City
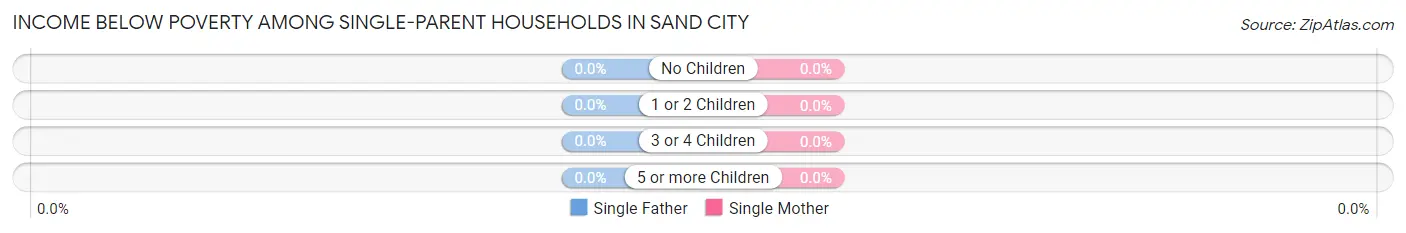
| Children | Single Father | Single Mother |
| No Children | 0 (0.0%) | 0 (0.0%) |
| 1 or 2 Children | 0 (0.0%) | 0 (0.0%) |
| 3 or 4 Children | 0 (0.0%) | 0 (0.0%) |
| 5 or more Children | 0 (0.0%) | 0 (0.0%) |
| Total | 0 (0.0%) | 0 (0.0%) |
Income Below Poverty Among Married-Couple vs Single-Parent Households in Sand City
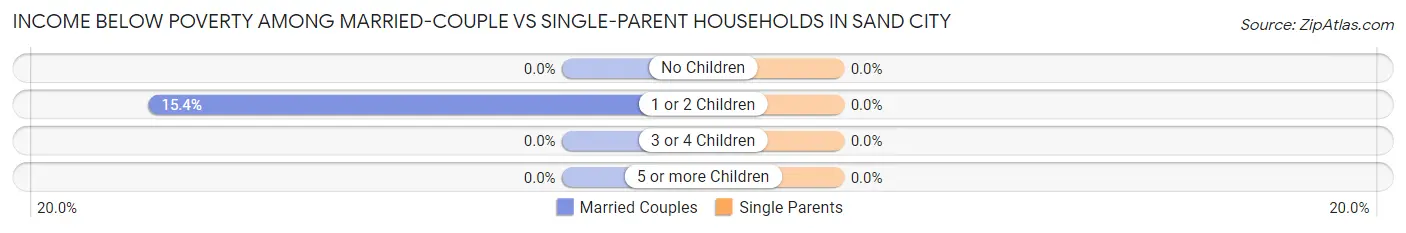
| Children | Married-Couple Families | Single-Parent Households |
| No Children | 0 (0.0%) | 0 (0.0%) |
| 1 or 2 Children | 2 (15.4%) | 0 (0.0%) |
| 3 or 4 Children | 0 (0.0%) | 0 (0.0%) |
| 5 or more Children | 0 (0.0%) | 0 (0.0%) |
| Total | 2 (5.1%) | 0 (0.0%) |
Employment Characteristics in Sand City
Employment by Class of Employer in Sand City
Among the 187 employed individuals in Sand City, private company employees (98 | 52.4%), local government employees (36 | 19.3%), and federal government employees (20 | 10.7%) make up the most common classes of employment.
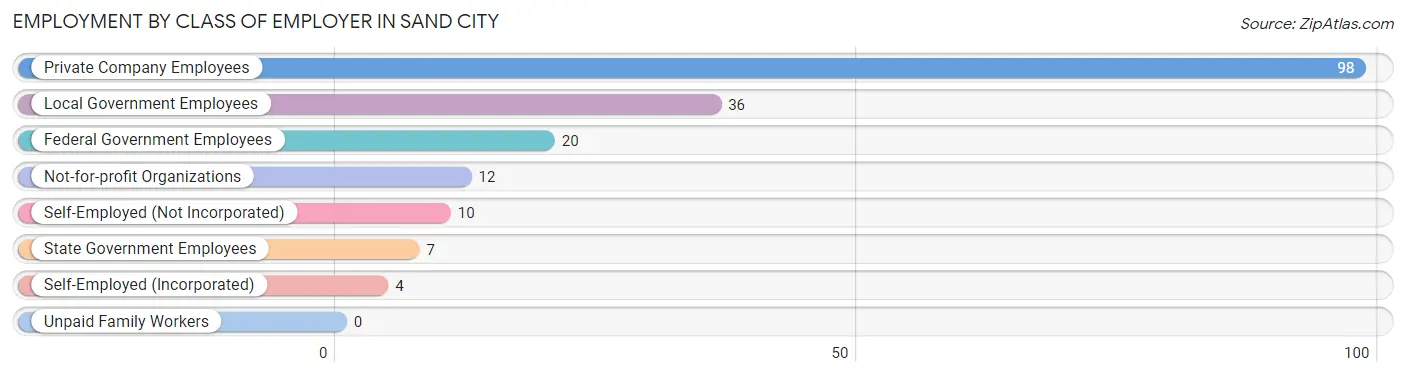
| Employer Class | # Employees | % Employees |
| Private Company Employees | 98 | 52.4% |
| Self-Employed (Incorporated) | 4 | 2.1% |
| Self-Employed (Not Incorporated) | 10 | 5.3% |
| Not-for-profit Organizations | 12 | 6.4% |
| Local Government Employees | 36 | 19.3% |
| State Government Employees | 7 | 3.7% |
| Federal Government Employees | 20 | 10.7% |
| Unpaid Family Workers | 0 | 0.0% |
| Total | 187 | 100.0% |
Employment Status by Age in Sand City
According to the labor force statistics for Sand City, out of the total population over 16 years of age (278), 73.4% or 204 individuals are in the labor force, with 1.6% or 3 of them unemployed. The age group with the highest labor force participation rate is 25 to 29 years, with 100.0% or 12 individuals in the labor force. Within the labor force, the 30 to 34 years age range has the highest percentage of unemployed individuals, with 6.3% or 2 of them being unemployed.
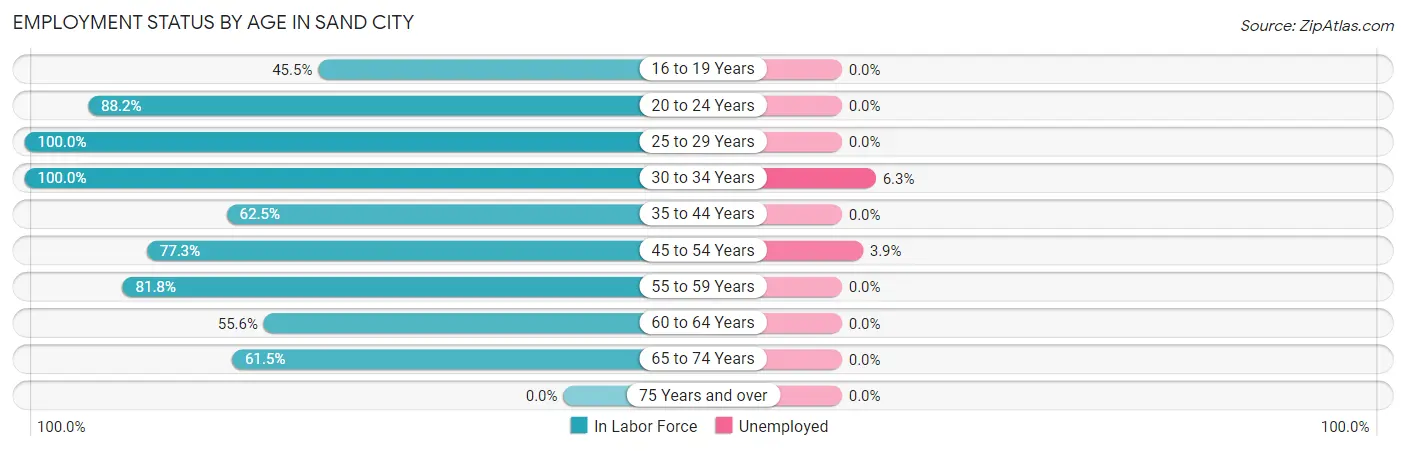
| Age Bracket | In Labor Force | Unemployed |
| 16 to 19 Years | 5 (45.5%) | 0 (0.0%) |
| 20 to 24 Years | 30 (88.2%) | 0 (0.0%) |
| 25 to 29 Years | 12 (100.0%) | 0 (0.0%) |
| 30 to 34 Years | 25 (100.0%) | 2 (6.3%) |
| 35 to 44 Years | 20 (62.5%) | 0 (0.0%) |
| 45 to 54 Years | 51 (77.3%) | 2 (3.9%) |
| 55 to 59 Years | 27 (81.8%) | 0 (0.0%) |
| 60 to 64 Years | 10 (55.6%) | 0 (0.0%) |
| 65 to 74 Years | 24 (61.5%) | 0 (0.0%) |
| 75 Years and over | 0 (0.0%) | 0 (0.0%) |
| Total | 204 (73.4%) | 3 (1.6%) |
Employment Status by Educational Attainment in Sand City
According to labor force statistics for Sand City, 78.0% of individuals (145) out of the total population between 25 and 64 years of age (186) are in the labor force, with 2.3% or 3 of them being unemployed. The group with the highest labor force participation rate are those with the educational attainment of bachelor's degree or higher, with 89.9% or 62 individuals in the labor force. Within the labor force, individuals with less than high school education have the highest percentage of unemployment, with 14.3% or 2 of them being unemployed.
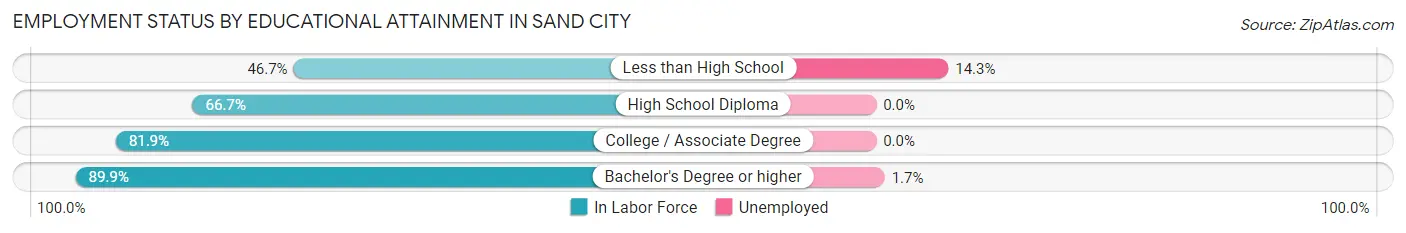
| Educational Attainment | In Labor Force | Unemployed |
| Less than High School | 14 (46.7%) | 4 (14.3%) |
| High School Diploma | 10 (66.7%) | 0 (0.0%) |
| College / Associate Degree | 59 (81.9%) | 0 (0.0%) |
| Bachelor's Degree or higher | 62 (89.9%) | 1 (1.7%) |
| Total | 145 (78.0%) | 4 (2.3%) |
Employment Occupations by Sex in Sand City
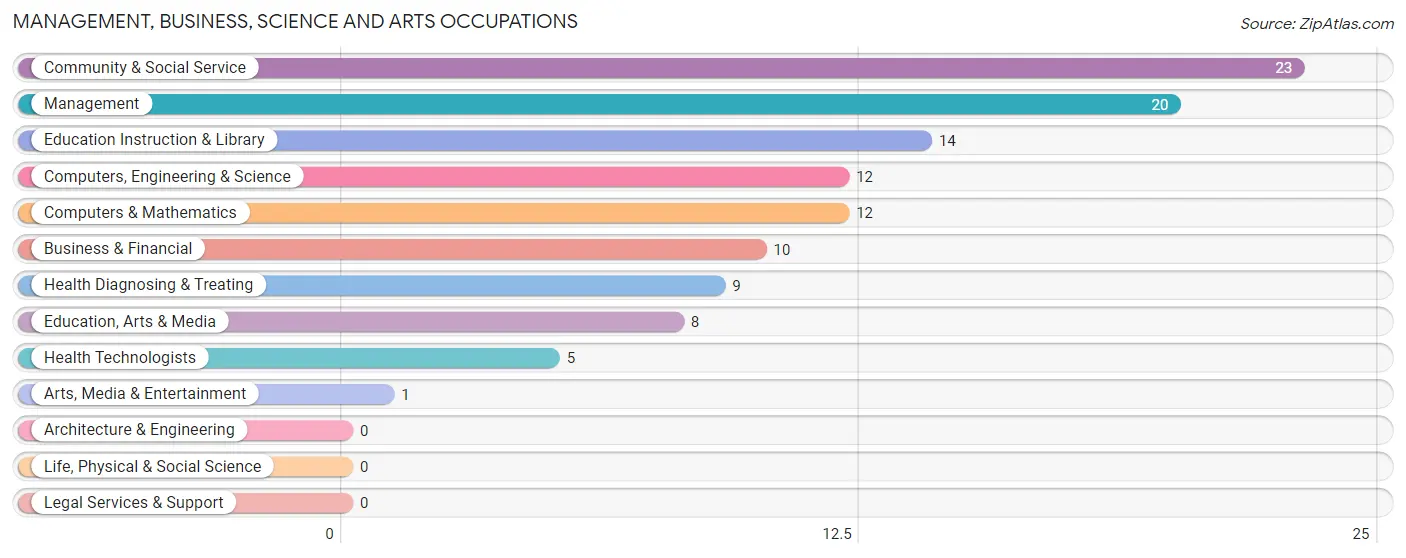
Management, Business, Science and Arts Occupations
The most common Management, Business, Science and Arts occupations in Sand City are Community & Social Service (23 | 12.2%), Management (20 | 10.6%), Education Instruction & Library (14 | 7.4%), Computers, Engineering & Science (12 | 6.4%), and Computers & Mathematics (12 | 6.4%).
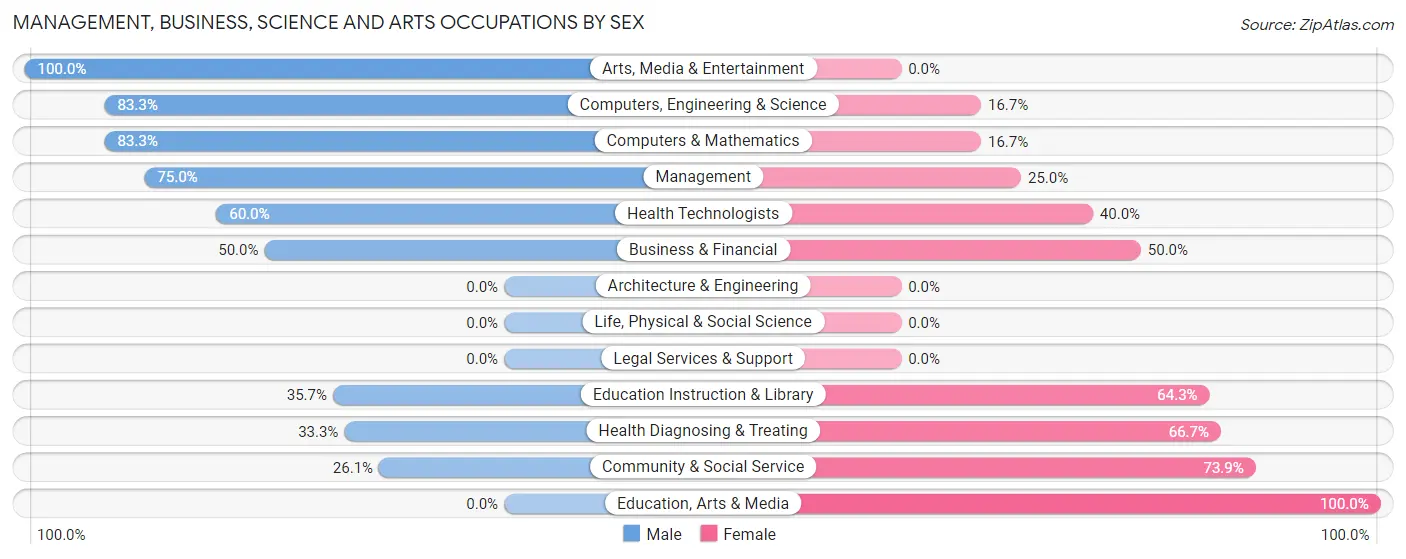
Management, Business, Science and Arts Occupations by Sex
Within the Management, Business, Science and Arts occupations in Sand City, the most male-oriented occupations are Arts, Media & Entertainment (100.0%), Computers, Engineering & Science (83.3%), and Computers & Mathematics (83.3%), while the most female-oriented occupations are Education, Arts & Media (100.0%), Community & Social Service (73.9%), and Health Diagnosing & Treating (66.7%).
| Occupation | Male | Female |
| Management | 15 (75.0%) | 5 (25.0%) |
| Business & Financial | 5 (50.0%) | 5 (50.0%) |
| Computers, Engineering & Science | 10 (83.3%) | 2 (16.7%) |
| Computers & Mathematics | 10 (83.3%) | 2 (16.7%) |
| Architecture & Engineering | 0 (0.0%) | 0 (0.0%) |
| Life, Physical & Social Science | 0 (0.0%) | 0 (0.0%) |
| Community & Social Service | 6 (26.1%) | 17 (73.9%) |
| Education, Arts & Media | 0 (0.0%) | 8 (100.0%) |
| Legal Services & Support | 0 (0.0%) | 0 (0.0%) |
| Education Instruction & Library | 5 (35.7%) | 9 (64.3%) |
| Arts, Media & Entertainment | 1 (100.0%) | 0 (0.0%) |
| Health Diagnosing & Treating | 3 (33.3%) | 6 (66.7%) |
| Health Technologists | 3 (60.0%) | 2 (40.0%) |
| Total (Category) | 39 (52.7%) | 35 (47.3%) |
| Total (Overall) | 98 (52.1%) | 90 (47.9%) |
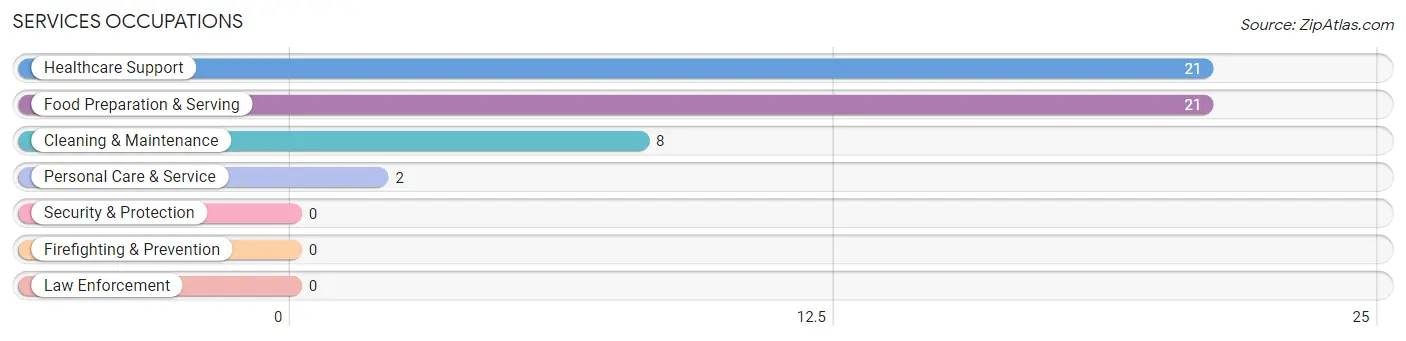
Services Occupations
The most common Services occupations in Sand City are Healthcare Support (21 | 11.2%), Food Preparation & Serving (21 | 11.2%), Cleaning & Maintenance (8 | 4.3%), and Personal Care & Service (2 | 1.1%).
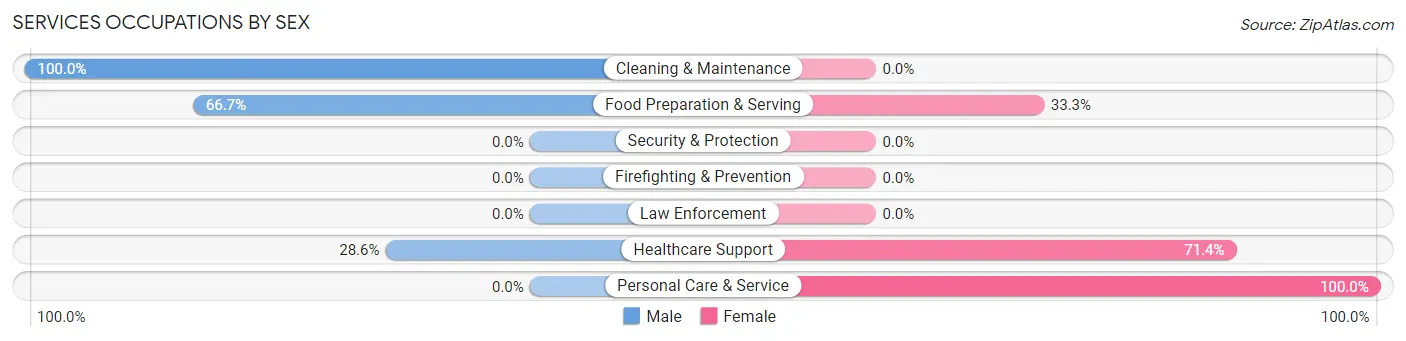
Services Occupations by Sex
Within the Services occupations in Sand City, the most male-oriented occupations are Cleaning & Maintenance (100.0%), Food Preparation & Serving (66.7%), and Healthcare Support (28.6%), while the most female-oriented occupations are Personal Care & Service (100.0%), Healthcare Support (71.4%), and Food Preparation & Serving (33.3%).
| Occupation | Male | Female |
| Healthcare Support | 6 (28.6%) | 15 (71.4%) |
| Security & Protection | 0 (0.0%) | 0 (0.0%) |
| Firefighting & Prevention | 0 (0.0%) | 0 (0.0%) |
| Law Enforcement | 0 (0.0%) | 0 (0.0%) |
| Food Preparation & Serving | 14 (66.7%) | 7 (33.3%) |
| Cleaning & Maintenance | 8 (100.0%) | 0 (0.0%) |
| Personal Care & Service | 0 (0.0%) | 2 (100.0%) |
| Total (Category) | 28 (53.8%) | 24 (46.2%) |
| Total (Overall) | 98 (52.1%) | 90 (47.9%) |
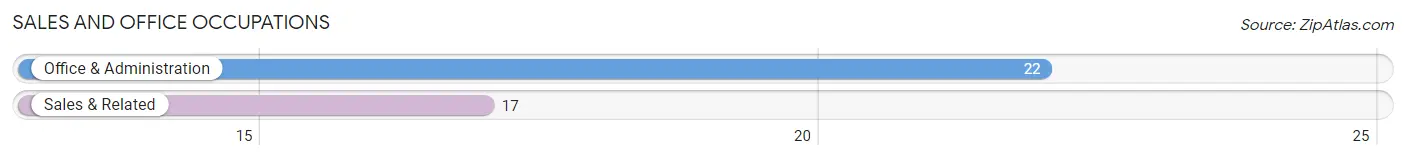
Sales and Office Occupations
The most common Sales and Office occupations in Sand City are Office & Administration (22 | 11.7%), and Sales & Related (17 | 9.0%).
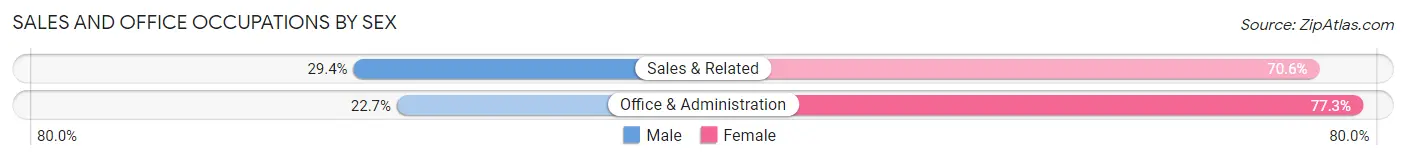
Sales and Office Occupations by Sex
| Occupation | Male | Female |
| Sales & Related | 5 (29.4%) | 12 (70.6%) |
| Office & Administration | 5 (22.7%) | 17 (77.3%) |
| Total (Category) | 10 (25.6%) | 29 (74.4%) |
| Total (Overall) | 98 (52.1%) | 90 (47.9%) |
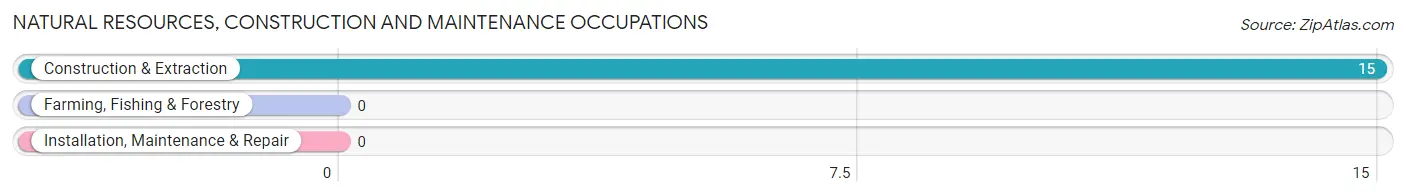
Natural Resources, Construction and Maintenance Occupations
The most common Natural Resources, Construction and Maintenance occupations in Sand City are , and Construction & Extraction (15 | 8.0%).
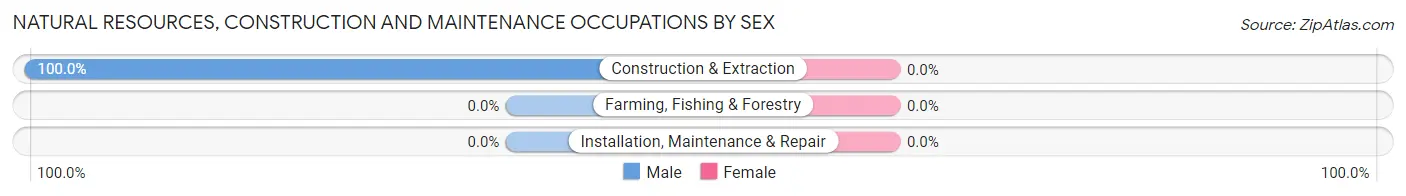
Natural Resources, Construction and Maintenance Occupations by Sex
| Occupation | Male | Female |
| Farming, Fishing & Forestry | 0 (0.0%) | 0 (0.0%) |
| Construction & Extraction | 15 (100.0%) | 0 (0.0%) |
| Installation, Maintenance & Repair | 0 (0.0%) | 0 (0.0%) |
| Total (Category) | 15 (100.0%) | 0 (0.0%) |
| Total (Overall) | 98 (52.1%) | 90 (47.9%) |
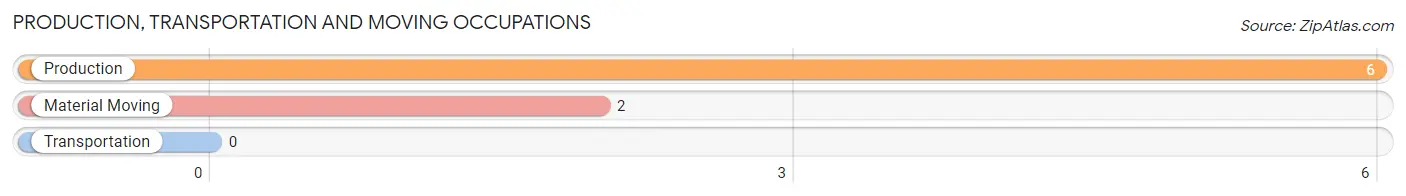
Production, Transportation and Moving Occupations
The most common Production, Transportation and Moving occupations in Sand City are Production (6 | 3.2%), and Material Moving (2 | 1.1%).
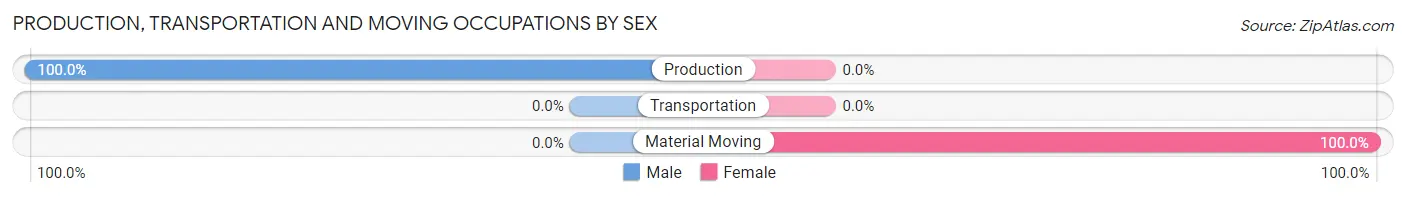
Production, Transportation and Moving Occupations by Sex
| Occupation | Male | Female |
| Production | 6 (100.0%) | 0 (0.0%) |
| Transportation | 0 (0.0%) | 0 (0.0%) |
| Material Moving | 0 (0.0%) | 2 (100.0%) |
| Total (Category) | 6 (75.0%) | 2 (25.0%) |
| Total (Overall) | 98 (52.1%) | 90 (47.9%) |
Employment Industries by Sex in Sand City
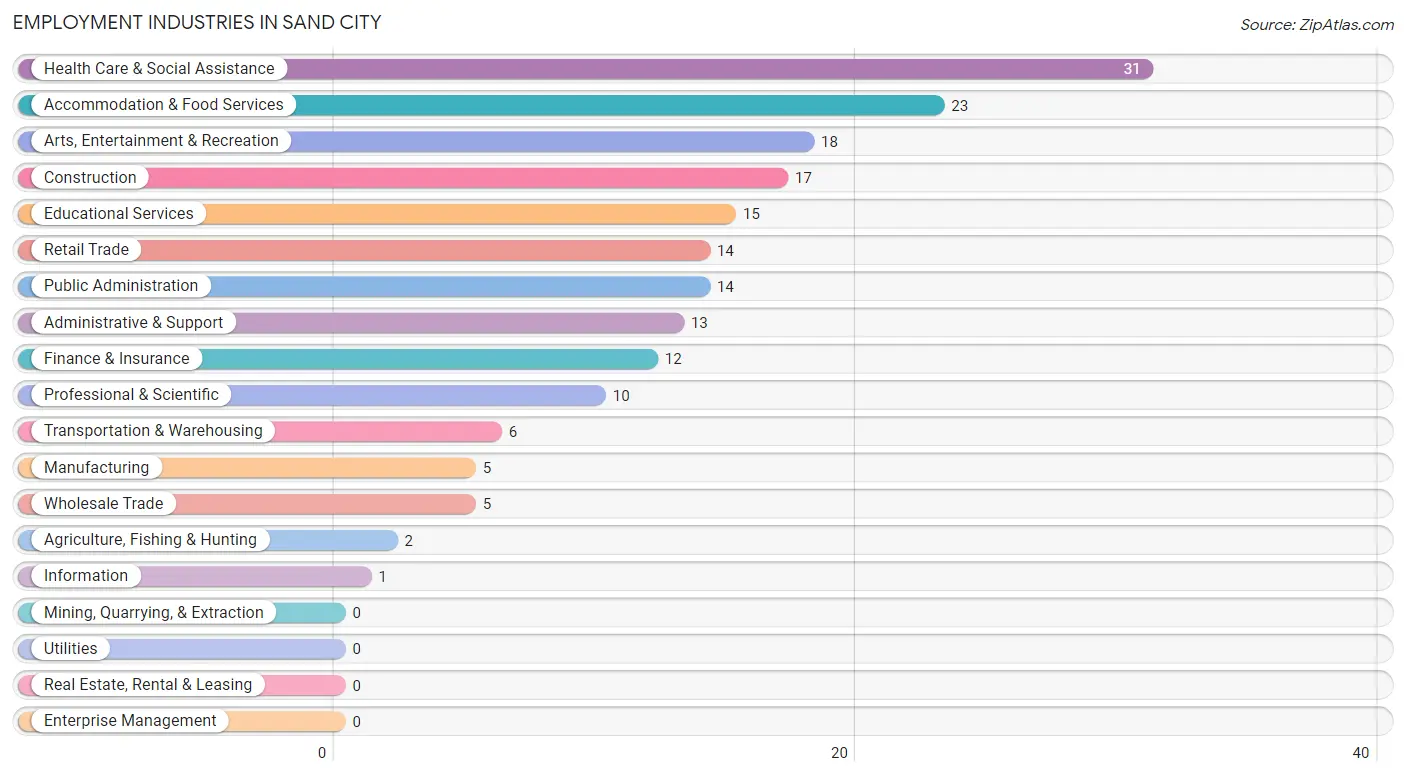
Employment Industries in Sand City
The major employment industries in Sand City include Health Care & Social Assistance (31 | 16.5%), Accommodation & Food Services (23 | 12.2%), Arts, Entertainment & Recreation (18 | 9.6%), Construction (17 | 9.0%), and Educational Services (15 | 8.0%).
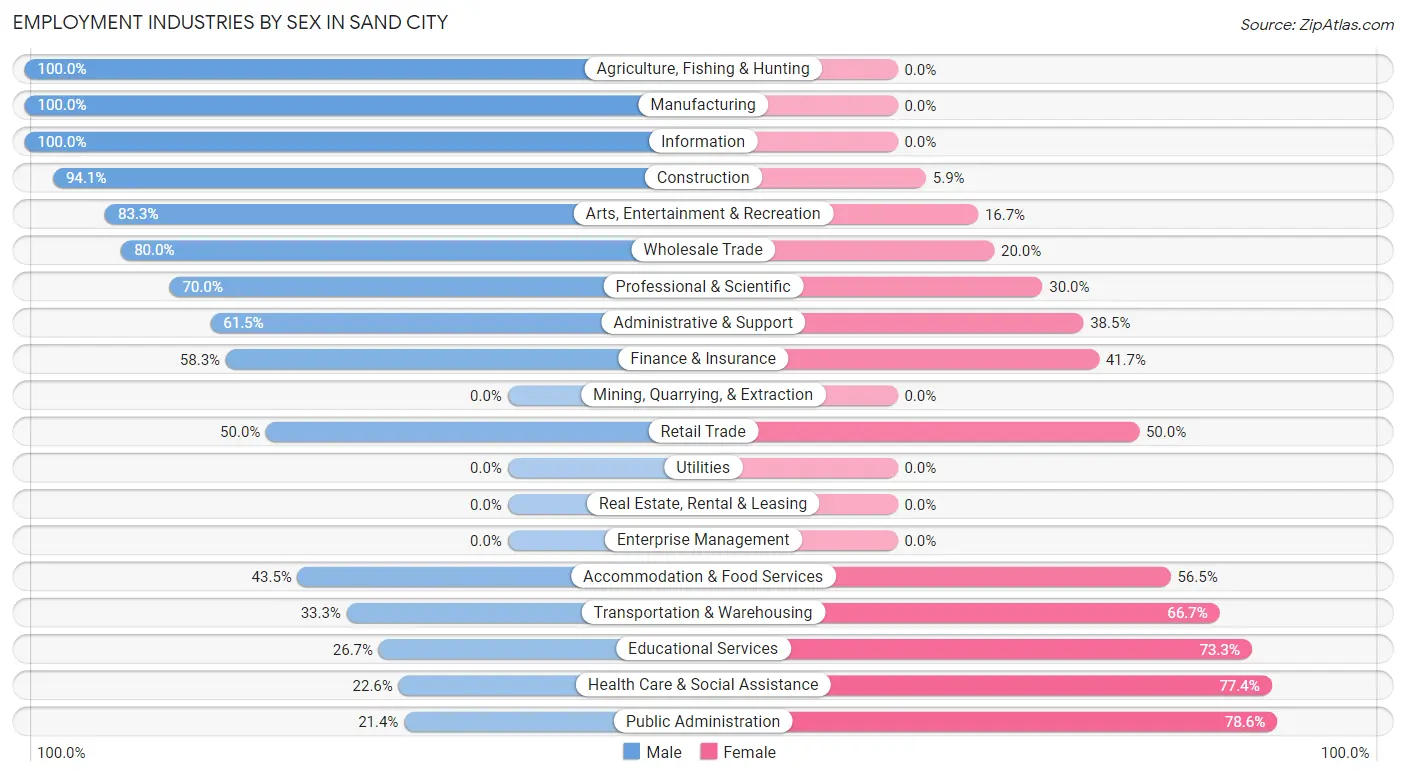
Employment Industries by Sex in Sand City
The Sand City industries that see more men than women are Agriculture, Fishing & Hunting (100.0%), Manufacturing (100.0%), and Information (100.0%), whereas the industries that tend to have a higher number of women are Public Administration (78.6%), Health Care & Social Assistance (77.4%), and Educational Services (73.3%).
| Industry | Male | Female |
| Agriculture, Fishing & Hunting | 2 (100.0%) | 0 (0.0%) |
| Mining, Quarrying, & Extraction | 0 (0.0%) | 0 (0.0%) |
| Construction | 16 (94.1%) | 1 (5.9%) |
| Manufacturing | 5 (100.0%) | 0 (0.0%) |
| Wholesale Trade | 4 (80.0%) | 1 (20.0%) |
| Retail Trade | 7 (50.0%) | 7 (50.0%) |
| Transportation & Warehousing | 2 (33.3%) | 4 (66.7%) |
| Utilities | 0 (0.0%) | 0 (0.0%) |
| Information | 1 (100.0%) | 0 (0.0%) |
| Finance & Insurance | 7 (58.3%) | 5 (41.7%) |
| Real Estate, Rental & Leasing | 0 (0.0%) | 0 (0.0%) |
| Professional & Scientific | 7 (70.0%) | 3 (30.0%) |
| Enterprise Management | 0 (0.0%) | 0 (0.0%) |
| Administrative & Support | 8 (61.5%) | 5 (38.5%) |
| Educational Services | 4 (26.7%) | 11 (73.3%) |
| Health Care & Social Assistance | 7 (22.6%) | 24 (77.4%) |
| Arts, Entertainment & Recreation | 15 (83.3%) | 3 (16.7%) |
| Accommodation & Food Services | 10 (43.5%) | 13 (56.5%) |
| Public Administration | 3 (21.4%) | 11 (78.6%) |
| Total | 98 (52.1%) | 90 (47.9%) |
Education in Sand City
School Enrollment in Sand City
The most common levels of schooling among the 78 students in Sand City are college / undergraduate (24 | 30.8%), elementary school (16 | 20.5%), and graduate / professional (13 | 16.7%).
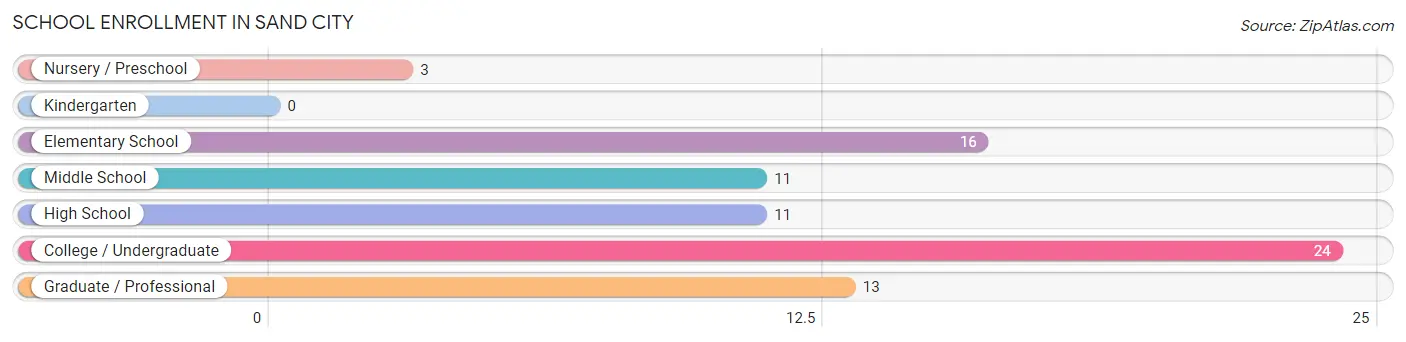
| School Level | # Students | % Students |
| Nursery / Preschool | 3 | 3.8% |
| Kindergarten | 0 | 0.0% |
| Elementary School | 16 | 20.5% |
| Middle School | 11 | 14.1% |
| High School | 11 | 14.1% |
| College / Undergraduate | 24 | 30.8% |
| Graduate / Professional | 13 | 16.7% |
| Total | 78 | 100.0% |
School Enrollment by Age by Funding Source in Sand City
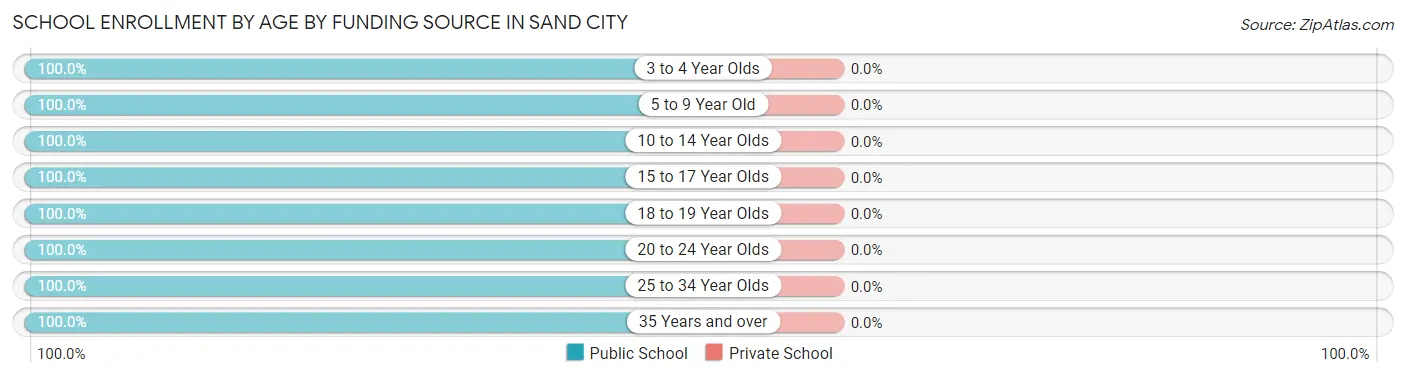
| Age Bracket | Public School | Private School |
| 3 to 4 Year Olds | 3 (100.0%) | 0 (0.0%) |
| 5 to 9 Year Old | 14 (100.0%) | 0 (0.0%) |
| 10 to 14 Year Olds | 13 (100.0%) | 0 (0.0%) |
| 15 to 17 Year Olds | 7 (100.0%) | 0 (0.0%) |
| 18 to 19 Year Olds | 4 (100.0%) | 0 (0.0%) |
| 20 to 24 Year Olds | 12 (100.0%) | 0 (0.0%) |
| 25 to 34 Year Olds | 15 (100.0%) | 0 (0.0%) |
| 35 Years and over | 10 (100.0%) | 0 (0.0%) |
| Total | 78 (100.0%) | 0 (0.0%) |
Educational Attainment by Field of Study in Sand City
Business (29 | 26.6%), liberal arts & history (12 | 11.0%), education (10 | 9.2%), science & technology (9 | 8.3%), and communications (8 | 7.3%) are the most common fields of study among 109 individuals in Sand City who have obtained a bachelor's degree or higher.
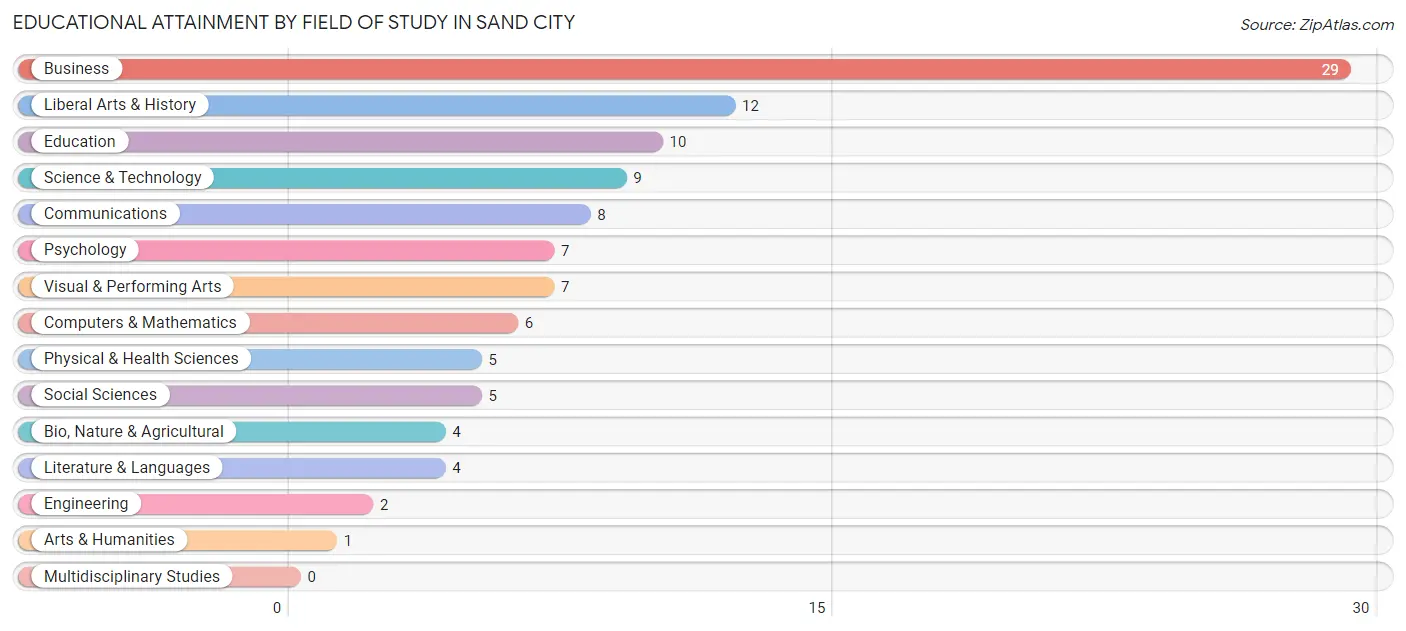
| Field of Study | # Graduates | % Graduates |
| Computers & Mathematics | 6 | 5.5% |
| Bio, Nature & Agricultural | 4 | 3.7% |
| Physical & Health Sciences | 5 | 4.6% |
| Psychology | 7 | 6.4% |
| Social Sciences | 5 | 4.6% |
| Engineering | 2 | 1.8% |
| Multidisciplinary Studies | 0 | 0.0% |
| Science & Technology | 9 | 8.3% |
| Business | 29 | 26.6% |
| Education | 10 | 9.2% |
| Literature & Languages | 4 | 3.7% |
| Liberal Arts & History | 12 | 11.0% |
| Visual & Performing Arts | 7 | 6.4% |
| Communications | 8 | 7.3% |
| Arts & Humanities | 1 | 0.9% |
| Total | 109 | 100.0% |
Transportation & Commute in Sand City
Vehicle Availability by Sex in Sand City
The most prevalent vehicle ownership categories in Sand City are males with 2 vehicles (52, accounting for 52.5%) and females with 2 vehicles (36, making up 59.1%).
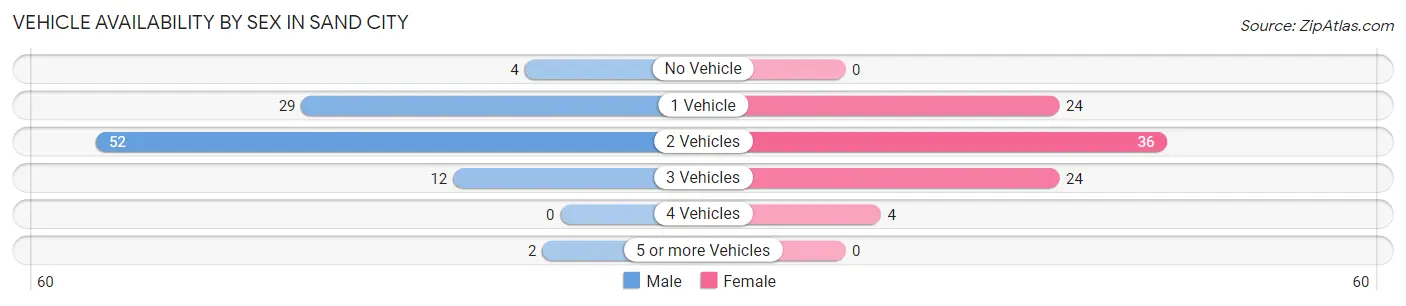
| Vehicles Available | Male | Female |
| No Vehicle | 4 (4.0%) | 0 (0.0%) |
| 1 Vehicle | 29 (29.3%) | 24 (27.3%) |
| 2 Vehicles | 52 (52.5%) | 36 (40.9%) |
| 3 Vehicles | 12 (12.1%) | 24 (27.3%) |
| 4 Vehicles | 0 (0.0%) | 4 (4.5%) |
| 5 or more Vehicles | 2 (2.0%) | 0 (0.0%) |
| Total | 99 (100.0%) | 88 (100.0%) |
Commute Time in Sand City
The most frequently occuring commute durations in Sand City are 15 to 19 minutes (39 commuters, 23.5%), 30 to 34 minutes (36 commuters, 21.7%), and 10 to 14 minutes (30 commuters, 18.1%).
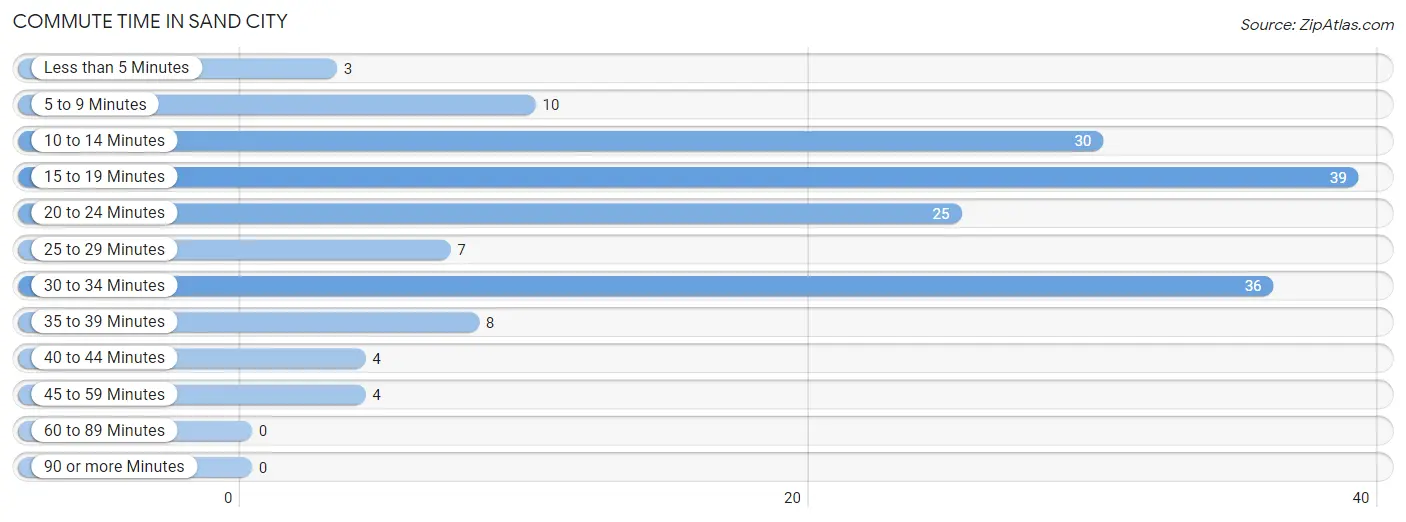
| Commute Time | # Commuters | % Commuters |
| Less than 5 Minutes | 3 | 1.8% |
| 5 to 9 Minutes | 10 | 6.0% |
| 10 to 14 Minutes | 30 | 18.1% |
| 15 to 19 Minutes | 39 | 23.5% |
| 20 to 24 Minutes | 25 | 15.1% |
| 25 to 29 Minutes | 7 | 4.2% |
| 30 to 34 Minutes | 36 | 21.7% |
| 35 to 39 Minutes | 8 | 4.8% |
| 40 to 44 Minutes | 4 | 2.4% |
| 45 to 59 Minutes | 4 | 2.4% |
| 60 to 89 Minutes | 0 | 0.0% |
| 90 or more Minutes | 0 | 0.0% |
Commute Time by Sex in Sand City
The most common commute times in Sand City are 15 to 19 minutes (23 commuters, 28.1%) for males and 30 to 34 minutes (26 commuters, 30.9%) for females.
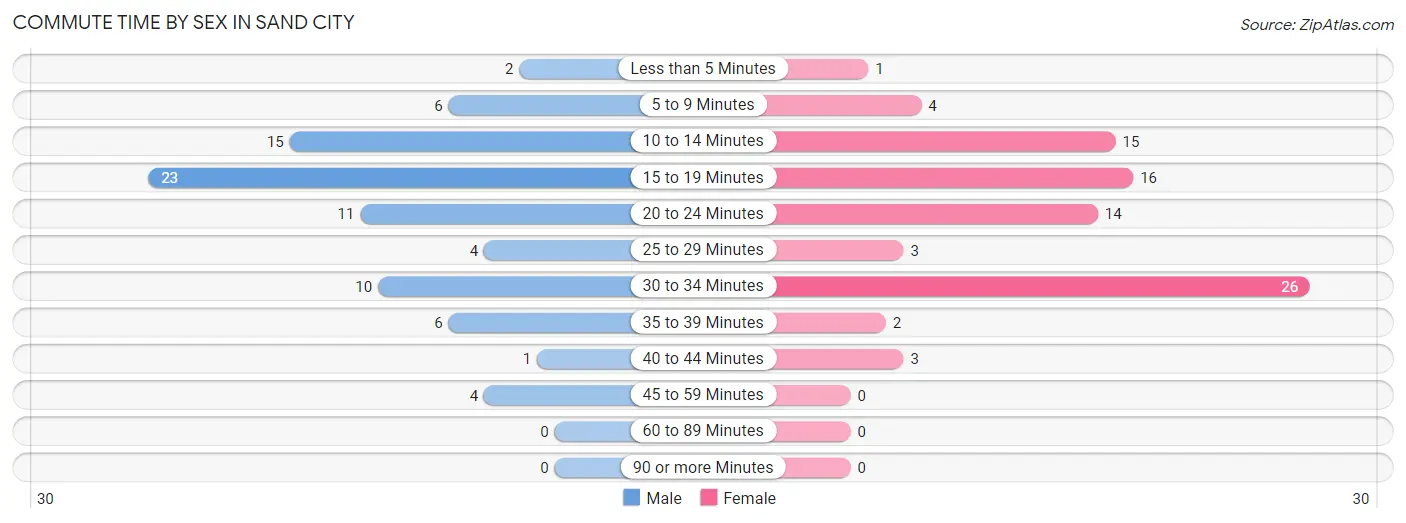
| Commute Time | Male | Female |
| Less than 5 Minutes | 2 (2.4%) | 1 (1.2%) |
| 5 to 9 Minutes | 6 (7.3%) | 4 (4.8%) |
| 10 to 14 Minutes | 15 (18.3%) | 15 (17.9%) |
| 15 to 19 Minutes | 23 (28.1%) | 16 (19.1%) |
| 20 to 24 Minutes | 11 (13.4%) | 14 (16.7%) |
| 25 to 29 Minutes | 4 (4.9%) | 3 (3.6%) |
| 30 to 34 Minutes | 10 (12.2%) | 26 (30.9%) |
| 35 to 39 Minutes | 6 (7.3%) | 2 (2.4%) |
| 40 to 44 Minutes | 1 (1.2%) | 3 (3.6%) |
| 45 to 59 Minutes | 4 (4.9%) | 0 (0.0%) |
| 60 to 89 Minutes | 0 (0.0%) | 0 (0.0%) |
| 90 or more Minutes | 0 (0.0%) | 0 (0.0%) |
Time of Departure to Work by Sex in Sand City
The most frequent times of departure to work in Sand City are 7:30 AM to 7:59 AM (19, 23.2%) for males and 7:00 AM to 7:29 AM (22, 26.2%) for females.
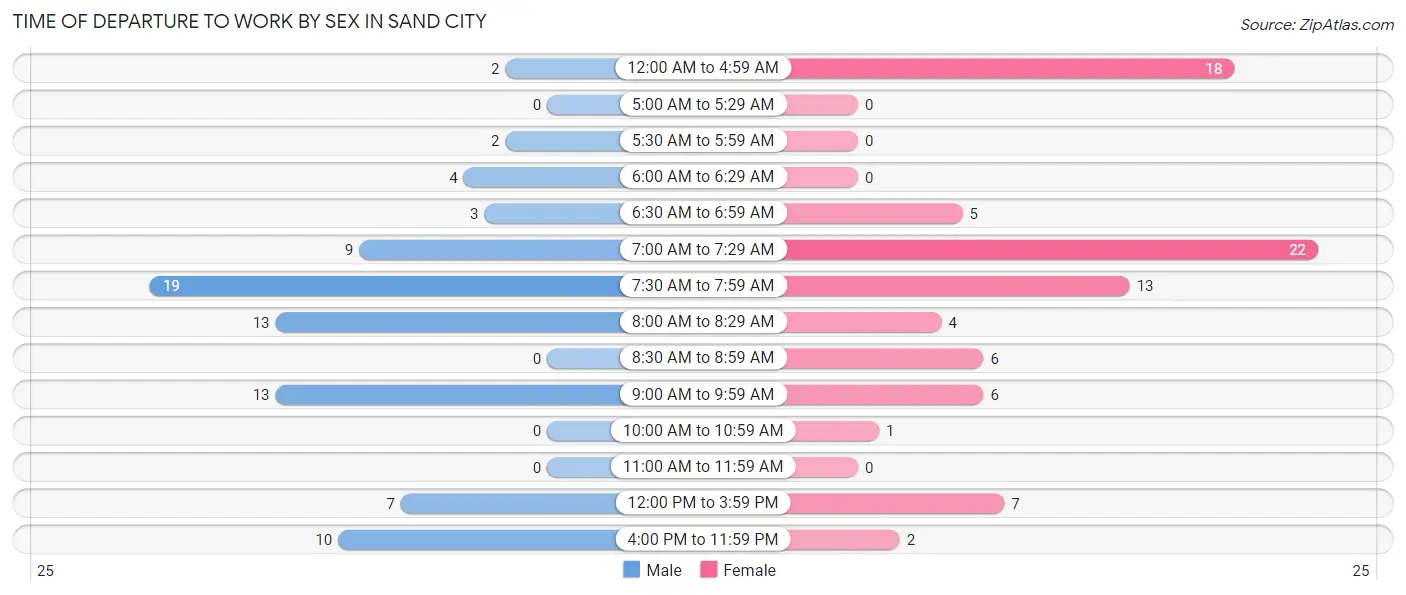
| Time of Departure | Male | Female |
| 12:00 AM to 4:59 AM | 2 (2.4%) | 18 (21.4%) |
| 5:00 AM to 5:29 AM | 0 (0.0%) | 0 (0.0%) |
| 5:30 AM to 5:59 AM | 2 (2.4%) | 0 (0.0%) |
| 6:00 AM to 6:29 AM | 4 (4.9%) | 0 (0.0%) |
| 6:30 AM to 6:59 AM | 3 (3.7%) | 5 (5.9%) |
| 7:00 AM to 7:29 AM | 9 (11.0%) | 22 (26.2%) |
| 7:30 AM to 7:59 AM | 19 (23.2%) | 13 (15.5%) |
| 8:00 AM to 8:29 AM | 13 (15.9%) | 4 (4.8%) |
| 8:30 AM to 8:59 AM | 0 (0.0%) | 6 (7.1%) |
| 9:00 AM to 9:59 AM | 13 (15.9%) | 6 (7.1%) |
| 10:00 AM to 10:59 AM | 0 (0.0%) | 1 (1.2%) |
| 11:00 AM to 11:59 AM | 0 (0.0%) | 0 (0.0%) |
| 12:00 PM to 3:59 PM | 7 (8.5%) | 7 (8.3%) |
| 4:00 PM to 11:59 PM | 10 (12.2%) | 2 (2.4%) |
| Total | 82 (100.0%) | 84 (100.0%) |
Housing Occupancy in Sand City
Occupancy by Ownership in Sand City
Of the total 172 dwellings in Sand City, owner-occupied units account for 37 (21.5%), while renter-occupied units make up 135 (78.5%).
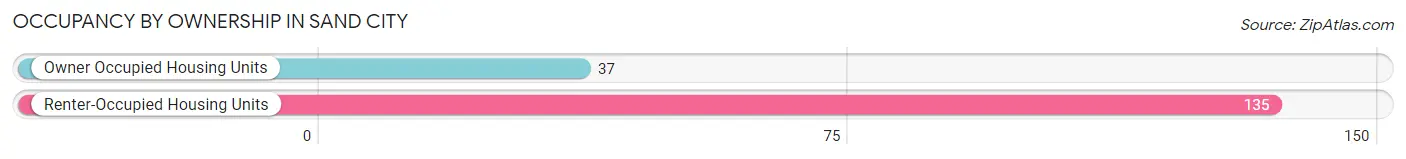
| Occupancy | # Housing Units | % Housing Units |
| Owner Occupied Housing Units | 37 | 21.5% |
| Renter-Occupied Housing Units | 135 | 78.5% |
| Total Occupied Housing Units | 172 | 100.0% |
Occupancy by Household Size in Sand City
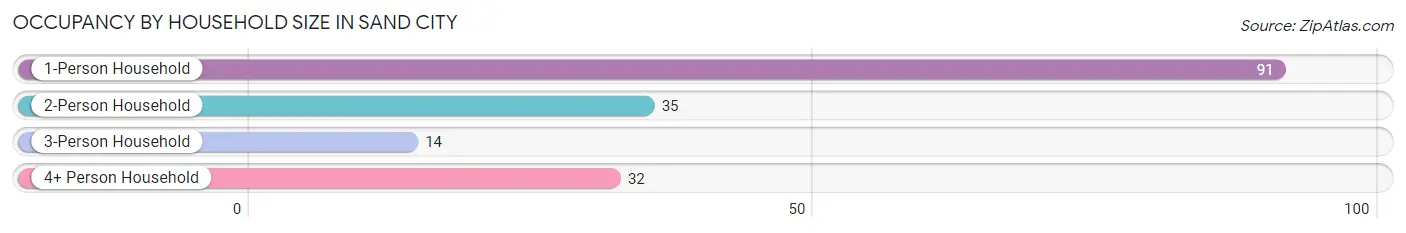
| Household Size | # Housing Units | % Housing Units |
| 1-Person Household | 91 | 52.9% |
| 2-Person Household | 35 | 20.3% |
| 3-Person Household | 14 | 8.1% |
| 4+ Person Household | 32 | 18.6% |
| Total Housing Units | 172 | 100.0% |
Occupancy by Ownership by Household Size in Sand City
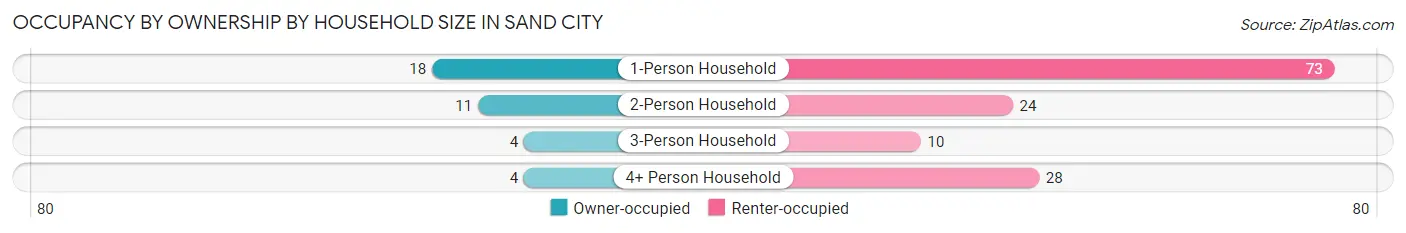
| Household Size | Owner-occupied | Renter-occupied |
| 1-Person Household | 18 (19.8%) | 73 (80.2%) |
| 2-Person Household | 11 (31.4%) | 24 (68.6%) |
| 3-Person Household | 4 (28.6%) | 10 (71.4%) |
| 4+ Person Household | 4 (12.5%) | 28 (87.5%) |
| Total Housing Units | 37 (21.5%) | 135 (78.5%) |
Occupancy by Educational Attainment in Sand City
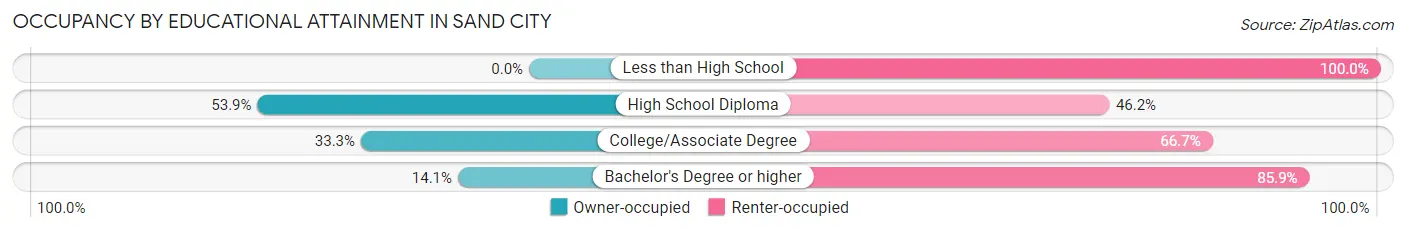
| Household Size | Owner-occupied | Renter-occupied |
| Less than High School | 0 (0.0%) | 24 (100.0%) |
| High School Diploma | 7 (53.8%) | 6 (46.2%) |
| College/Associate Degree | 19 (33.3%) | 38 (66.7%) |
| Bachelor's Degree or higher | 11 (14.1%) | 67 (85.9%) |
Occupancy by Age of Householder in Sand City
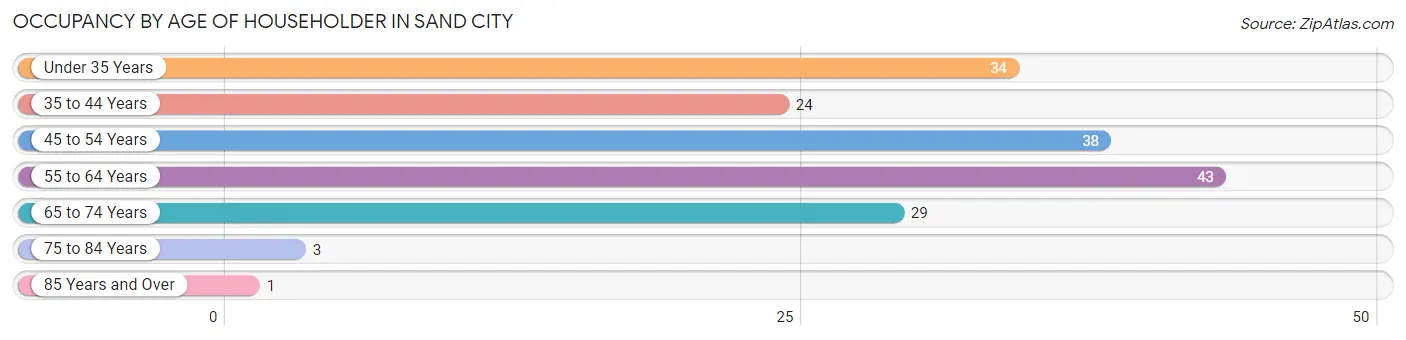
| Age Bracket | # Households | % Households |
| Under 35 Years | 34 | 19.8% |
| 35 to 44 Years | 24 | 14.0% |
| 45 to 54 Years | 38 | 22.1% |
| 55 to 64 Years | 43 | 25.0% |
| 65 to 74 Years | 29 | 16.9% |
| 75 to 84 Years | 3 | 1.7% |
| 85 Years and Over | 1 | 0.6% |
| Total | 172 | 100.0% |
Housing Finances in Sand City
Median Income by Occupancy in Sand City
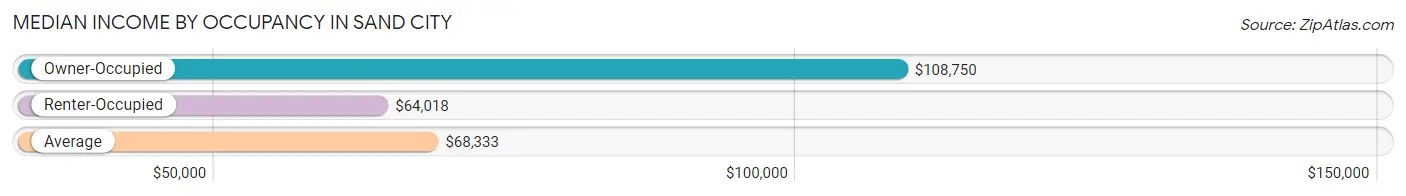
| Occupancy Type | # Households | Median Income |
| Owner-Occupied | 37 (21.5%) | $108,750 |
| Renter-Occupied | 135 (78.5%) | $64,018 |
| Average | 172 (100.0%) | $68,333 |
Occupancy by Householder Income Bracket in Sand City
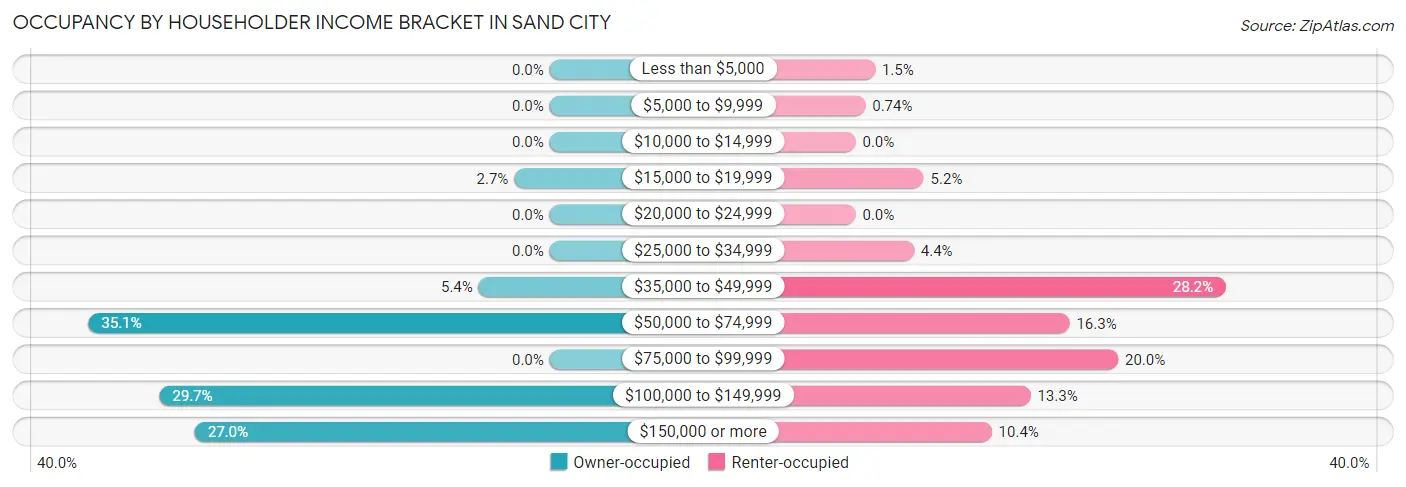
| Income Bracket | Owner-occupied | Renter-occupied |
| Less than $5,000 | 0 (0.0%) | 2 (1.5%) |
| $5,000 to $9,999 | 0 (0.0%) | 1 (0.7%) |
| $10,000 to $14,999 | 0 (0.0%) | 0 (0.0%) |
| $15,000 to $19,999 | 1 (2.7%) | 7 (5.2%) |
| $20,000 to $24,999 | 0 (0.0%) | 0 (0.0%) |
| $25,000 to $34,999 | 0 (0.0%) | 6 (4.4%) |
| $35,000 to $49,999 | 2 (5.4%) | 38 (28.1%) |
| $50,000 to $74,999 | 13 (35.1%) | 22 (16.3%) |
| $75,000 to $99,999 | 0 (0.0%) | 27 (20.0%) |
| $100,000 to $149,999 | 11 (29.7%) | 18 (13.3%) |
| $150,000 or more | 10 (27.0%) | 14 (10.4%) |
| Total | 37 (100.0%) | 135 (100.0%) |
Monthly Housing Cost Tiers in Sand City
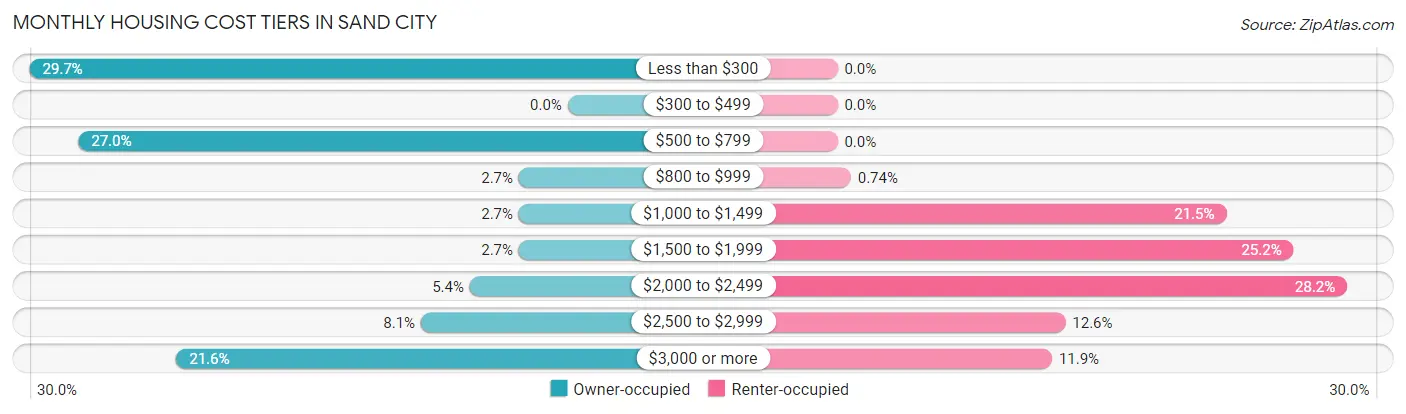
| Monthly Cost | Owner-occupied | Renter-occupied |
| Less than $300 | 11 (29.7%) | 0 (0.0%) |
| $300 to $499 | 0 (0.0%) | 0 (0.0%) |
| $500 to $799 | 10 (27.0%) | 0 (0.0%) |
| $800 to $999 | 1 (2.7%) | 1 (0.7%) |
| $1,000 to $1,499 | 1 (2.7%) | 29 (21.5%) |
| $1,500 to $1,999 | 1 (2.7%) | 34 (25.2%) |
| $2,000 to $2,499 | 2 (5.4%) | 38 (28.1%) |
| $2,500 to $2,999 | 3 (8.1%) | 17 (12.6%) |
| $3,000 or more | 8 (21.6%) | 16 (11.8%) |
| Total | 37 (100.0%) | 135 (100.0%) |
Physical Housing Characteristics in Sand City
Housing Structures in Sand City
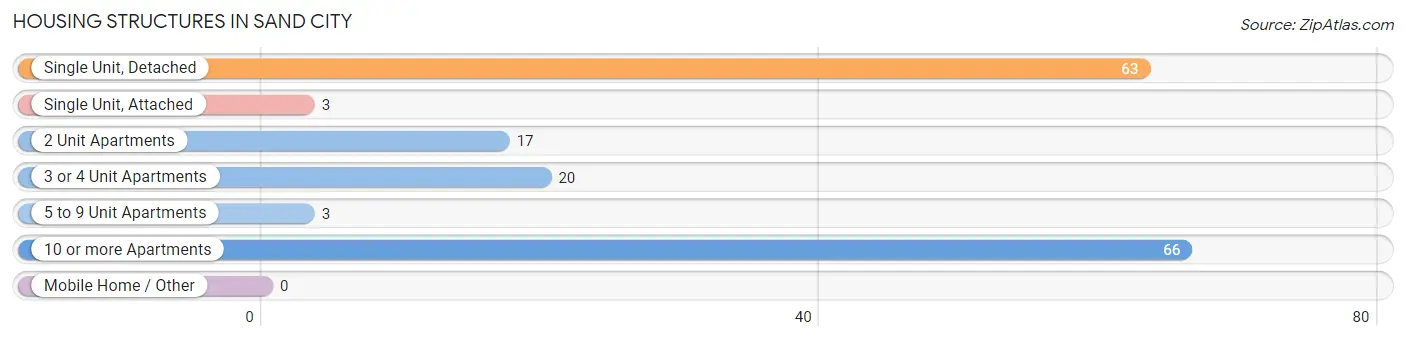
| Structure Type | # Housing Units | % Housing Units |
| Single Unit, Detached | 63 | 36.6% |
| Single Unit, Attached | 3 | 1.7% |
| 2 Unit Apartments | 17 | 9.9% |
| 3 or 4 Unit Apartments | 20 | 11.6% |
| 5 to 9 Unit Apartments | 3 | 1.7% |
| 10 or more Apartments | 66 | 38.4% |
| Mobile Home / Other | 0 | 0.0% |
| Total | 172 | 100.0% |
Housing Structures by Occupancy in Sand City
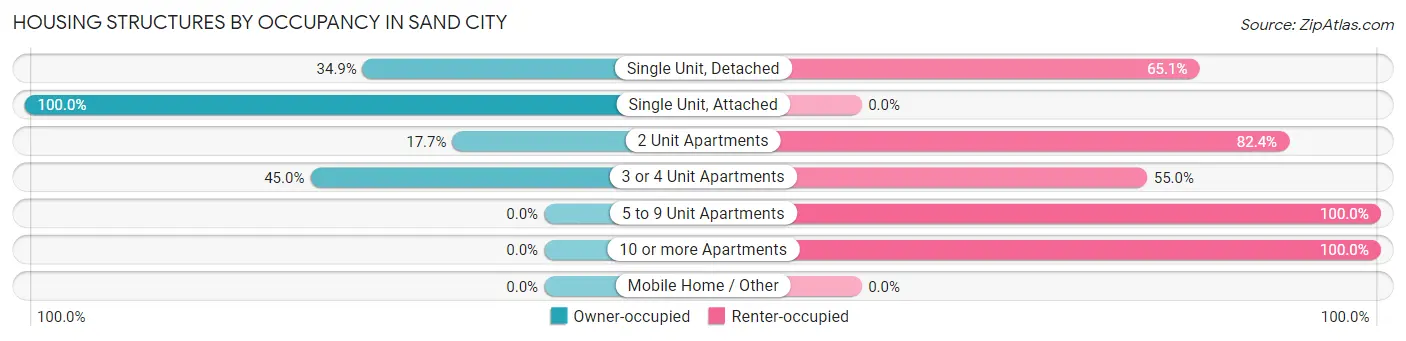
| Structure Type | Owner-occupied | Renter-occupied |
| Single Unit, Detached | 22 (34.9%) | 41 (65.1%) |
| Single Unit, Attached | 3 (100.0%) | 0 (0.0%) |
| 2 Unit Apartments | 3 (17.6%) | 14 (82.4%) |
| 3 or 4 Unit Apartments | 9 (45.0%) | 11 (55.0%) |
| 5 to 9 Unit Apartments | 0 (0.0%) | 3 (100.0%) |
| 10 or more Apartments | 0 (0.0%) | 66 (100.0%) |
| Mobile Home / Other | 0 (0.0%) | 0 (0.0%) |
| Total | 37 (21.5%) | 135 (78.5%) |
Housing Structures by Number of Rooms in Sand City
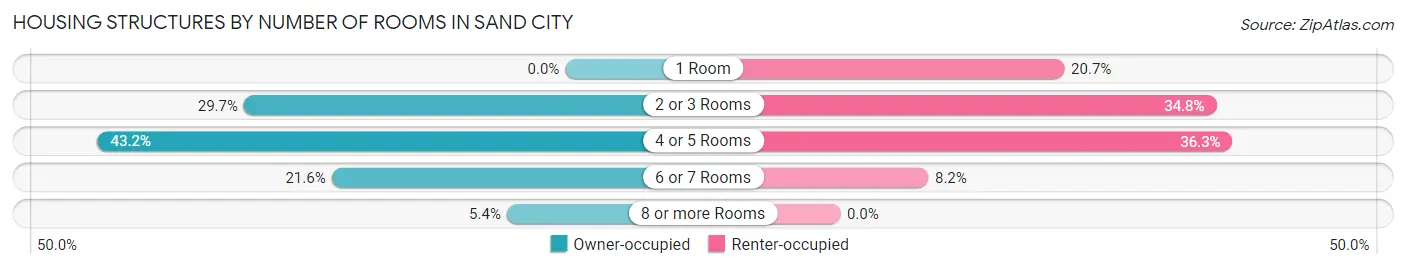
| Number of Rooms | Owner-occupied | Renter-occupied |
| 1 Room | 0 (0.0%) | 28 (20.7%) |
| 2 or 3 Rooms | 11 (29.7%) | 47 (34.8%) |
| 4 or 5 Rooms | 16 (43.2%) | 49 (36.3%) |
| 6 or 7 Rooms | 8 (21.6%) | 11 (8.2%) |
| 8 or more Rooms | 2 (5.4%) | 0 (0.0%) |
| Total | 37 (100.0%) | 135 (100.0%) |
Housing Structure by Heating Type in Sand City
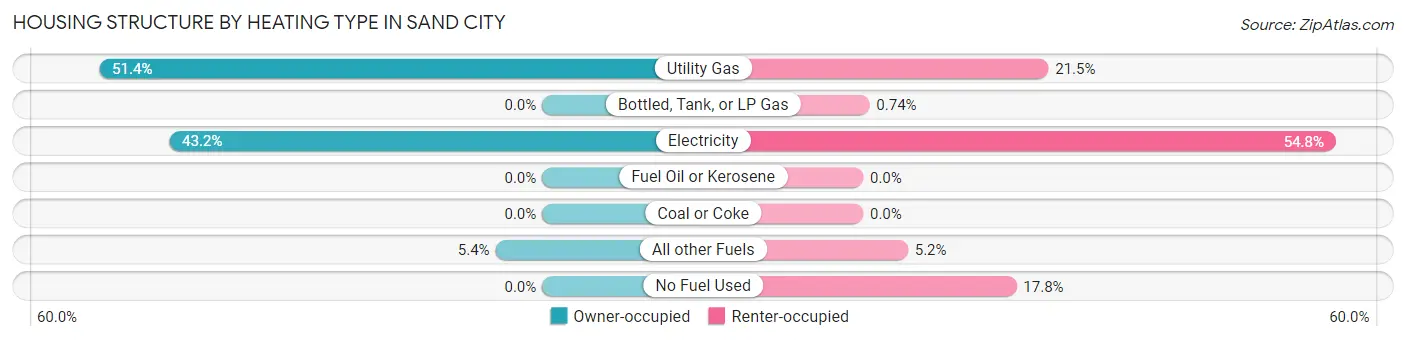
| Heating Type | Owner-occupied | Renter-occupied |
| Utility Gas | 19 (51.3%) | 29 (21.5%) |
| Bottled, Tank, or LP Gas | 0 (0.0%) | 1 (0.7%) |
| Electricity | 16 (43.2%) | 74 (54.8%) |
| Fuel Oil or Kerosene | 0 (0.0%) | 0 (0.0%) |
| Coal or Coke | 0 (0.0%) | 0 (0.0%) |
| All other Fuels | 2 (5.4%) | 7 (5.2%) |
| No Fuel Used | 0 (0.0%) | 24 (17.8%) |
| Total | 37 (100.0%) | 135 (100.0%) |
Household Vehicle Usage in Sand City
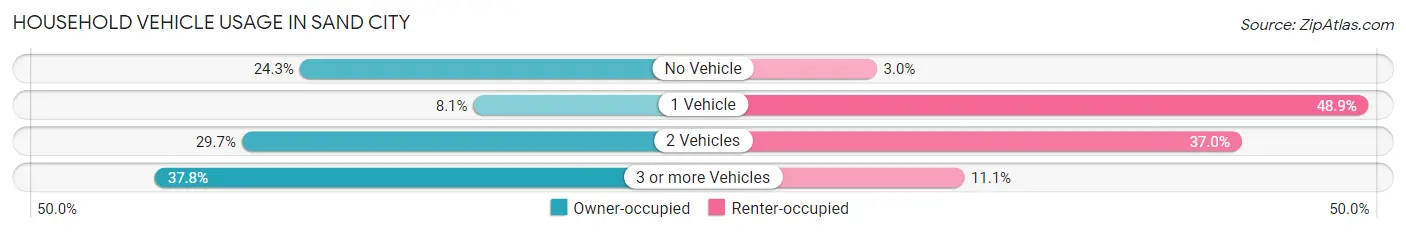
| Vehicles per Household | Owner-occupied | Renter-occupied |
| No Vehicle | 9 (24.3%) | 4 (3.0%) |
| 1 Vehicle | 3 (8.1%) | 66 (48.9%) |
| 2 Vehicles | 11 (29.7%) | 50 (37.0%) |
| 3 or more Vehicles | 14 (37.8%) | 15 (11.1%) |
| Total | 37 (100.0%) | 135 (100.0%) |
Real Estate & Mortgages in Sand City
Real Estate and Mortgage Overview in Sand City
| Characteristic | Without Mortgage | With Mortgage |
| Housing Units | 23 | 14 |
| Median Property Value | - | - |
| Median Household Income | $67,361 | $9 |
| Monthly Housing Costs | - | - |
| Real Estate Taxes | $4,400 | $0 |
Property Value by Mortgage Status in Sand City
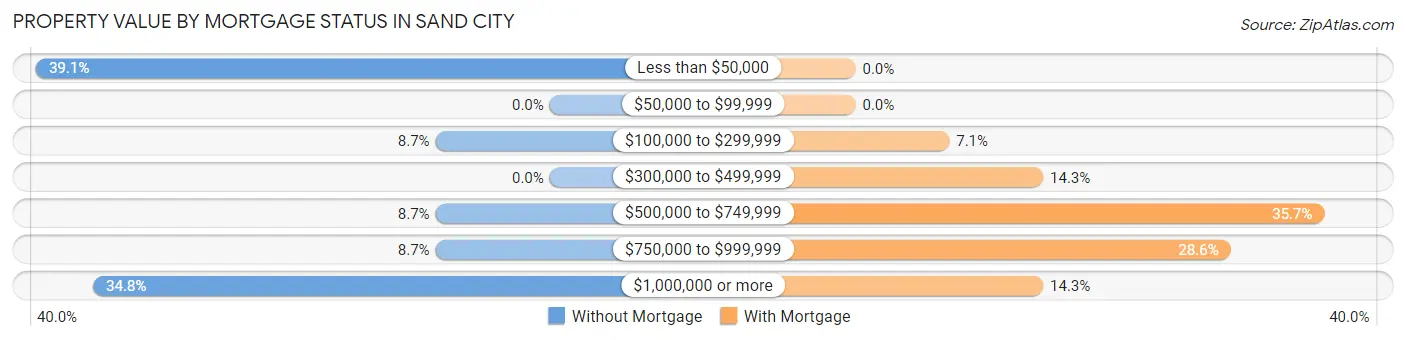
| Property Value | Without Mortgage | With Mortgage |
| Less than $50,000 | 9 (39.1%) | 0 (0.0%) |
| $50,000 to $99,999 | 0 (0.0%) | 0 (0.0%) |
| $100,000 to $299,999 | 2 (8.7%) | 1 (7.1%) |
| $300,000 to $499,999 | 0 (0.0%) | 2 (14.3%) |
| $500,000 to $749,999 | 2 (8.7%) | 5 (35.7%) |
| $750,000 to $999,999 | 2 (8.7%) | 4 (28.6%) |
| $1,000,000 or more | 8 (34.8%) | 2 (14.3%) |
| Total | 23 (100.0%) | 14 (100.0%) |
Household Income by Mortgage Status in Sand City
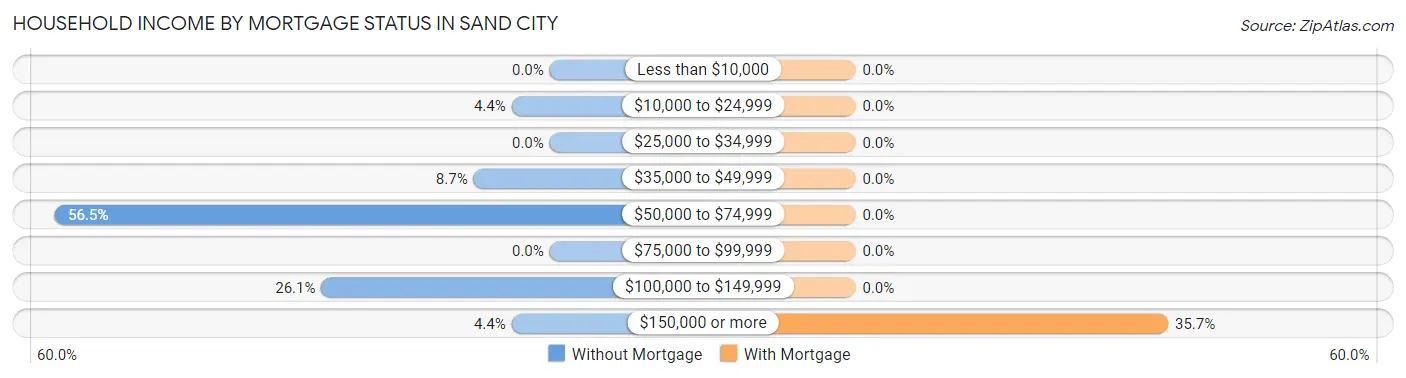
| Household Income | Without Mortgage | With Mortgage |
| Less than $10,000 | 0 (0.0%) | 0 (0.0%) |
| $10,000 to $24,999 | 1 (4.3%) | 0 (0.0%) |
| $25,000 to $34,999 | 0 (0.0%) | 0 (0.0%) |
| $35,000 to $49,999 | 2 (8.7%) | 0 (0.0%) |
| $50,000 to $74,999 | 13 (56.5%) | 0 (0.0%) |
| $75,000 to $99,999 | 0 (0.0%) | 0 (0.0%) |
| $100,000 to $149,999 | 6 (26.1%) | 0 (0.0%) |
| $150,000 or more | 1 (4.3%) | 5 (35.7%) |
| Total | 23 (100.0%) | 14 (100.0%) |
Property Value to Household Income Ratio in Sand City
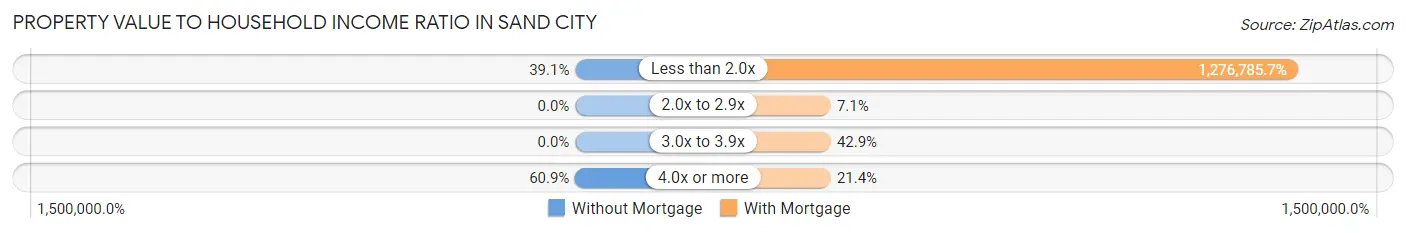
| Value-to-Income Ratio | Without Mortgage | With Mortgage |
| Less than 2.0x | 9 (39.1%) | 178,750 (1,276,785.7%) |
| 2.0x to 2.9x | 0 (0.0%) | 1 (7.1%) |
| 3.0x to 3.9x | 0 (0.0%) | 6 (42.9%) |
| 4.0x or more | 14 (60.9%) | 3 (21.4%) |
| Total | 23 (100.0%) | 14 (100.0%) |
Real Estate Taxes by Mortgage Status in Sand City
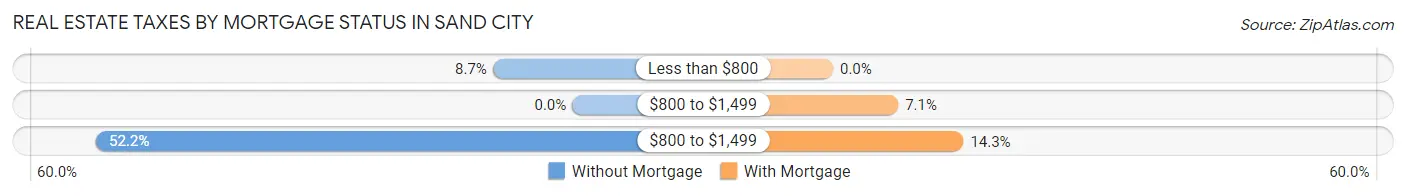
| Property Taxes | Without Mortgage | With Mortgage |
| Less than $800 | 2 (8.7%) | 0 (0.0%) |
| $800 to $1,499 | 0 (0.0%) | 1 (7.1%) |
| $800 to $1,499 | 12 (52.2%) | 2 (14.3%) |
| Total | 23 (100.0%) | 14 (100.0%) |
Health & Disability in Sand City
Health Insurance Coverage by Age in Sand City
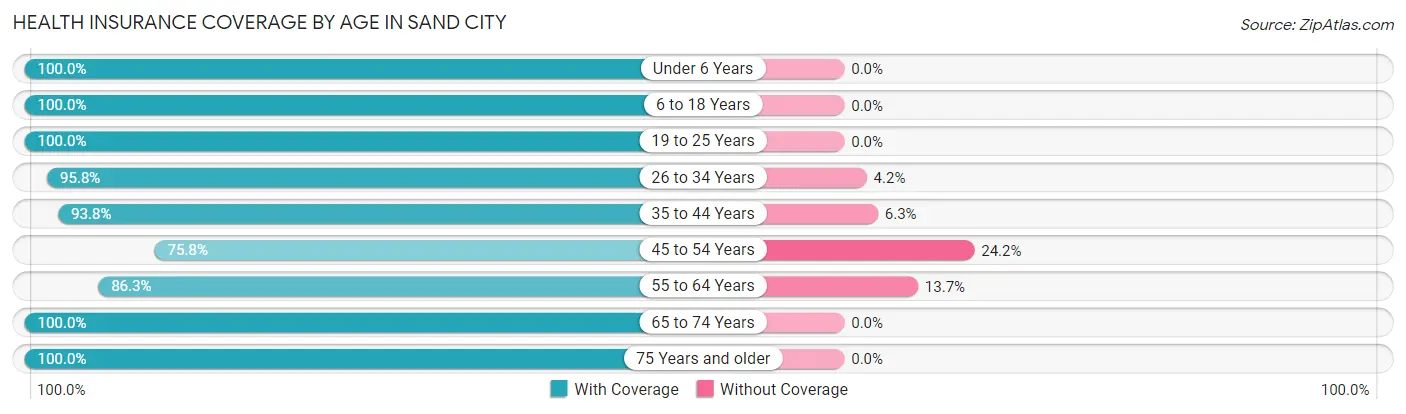
| Age Bracket | With Coverage | Without Coverage |
| Under 6 Years | 14 (100.0%) | 0 (0.0%) |
| 6 to 18 Years | 38 (100.0%) | 0 (0.0%) |
| 19 to 25 Years | 34 (100.0%) | 0 (0.0%) |
| 26 to 34 Years | 23 (95.8%) | 1 (4.2%) |
| 35 to 44 Years | 30 (93.8%) | 2 (6.2%) |
| 45 to 54 Years | 50 (75.8%) | 16 (24.2%) |
| 55 to 64 Years | 44 (86.3%) | 7 (13.7%) |
| 65 to 74 Years | 39 (100.0%) | 0 (0.0%) |
| 75 Years and older | 8 (100.0%) | 0 (0.0%) |
| Total | 280 (91.5%) | 26 (8.5%) |
Health Insurance Coverage by Citizenship Status in Sand City
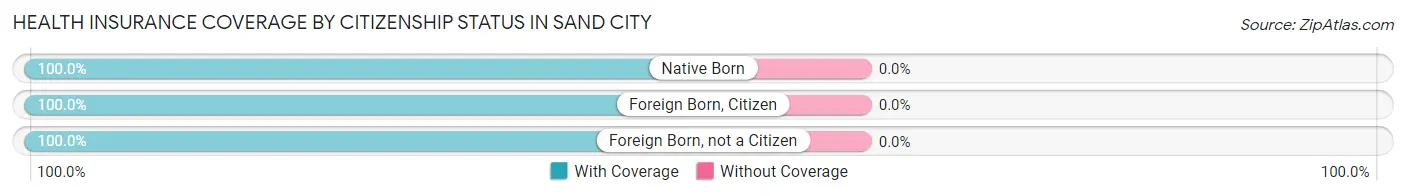
| Citizenship Status | With Coverage | Without Coverage |
| Native Born | 14 (100.0%) | 0 (0.0%) |
| Foreign Born, Citizen | 38 (100.0%) | 0 (0.0%) |
| Foreign Born, not a Citizen | 34 (100.0%) | 0 (0.0%) |
Health Insurance Coverage by Household Income in Sand City
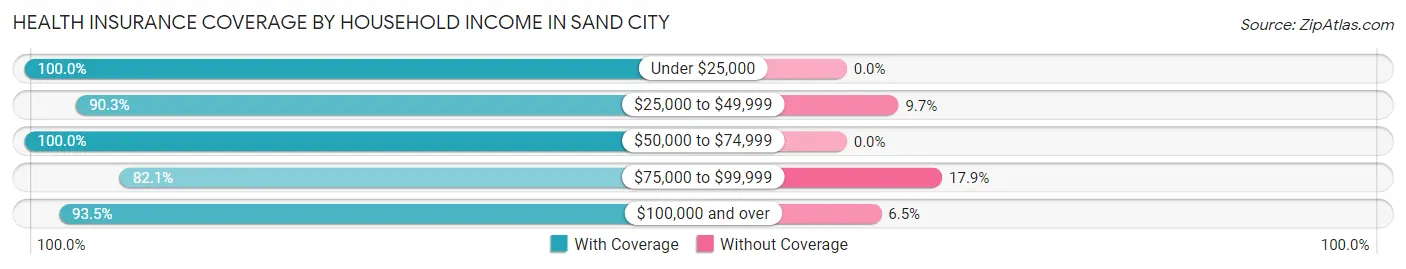
| Household Income | With Coverage | Without Coverage |
| Under $25,000 | 11 (100.0%) | 0 (0.0%) |
| $25,000 to $49,999 | 84 (90.3%) | 9 (9.7%) |
| $50,000 to $74,999 | 38 (100.0%) | 0 (0.0%) |
| $75,000 to $99,999 | 46 (82.1%) | 10 (17.9%) |
| $100,000 and over | 101 (93.5%) | 7 (6.5%) |
Public vs Private Health Insurance Coverage by Age in Sand City
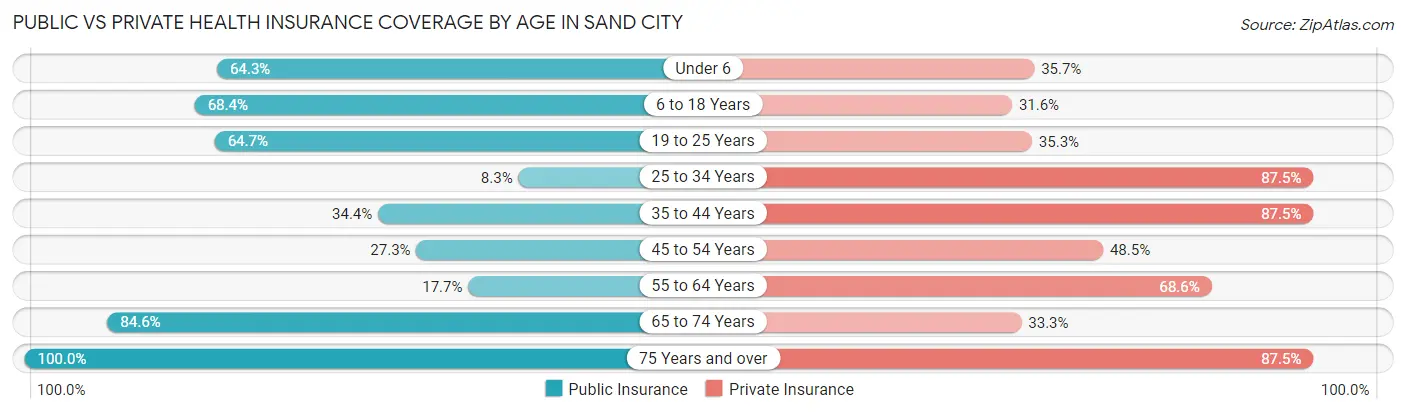
| Age Bracket | Public Insurance | Private Insurance |
| Under 6 | 9 (64.3%) | 5 (35.7%) |
| 6 to 18 Years | 26 (68.4%) | 12 (31.6%) |
| 19 to 25 Years | 22 (64.7%) | 12 (35.3%) |
| 25 to 34 Years | 2 (8.3%) | 21 (87.5%) |
| 35 to 44 Years | 11 (34.4%) | 28 (87.5%) |
| 45 to 54 Years | 18 (27.3%) | 32 (48.5%) |
| 55 to 64 Years | 9 (17.6%) | 35 (68.6%) |
| 65 to 74 Years | 33 (84.6%) | 13 (33.3%) |
| 75 Years and over | 8 (100.0%) | 7 (87.5%) |
| Total | 138 (45.1%) | 165 (53.9%) |
Disability Status by Sex by Age in Sand City
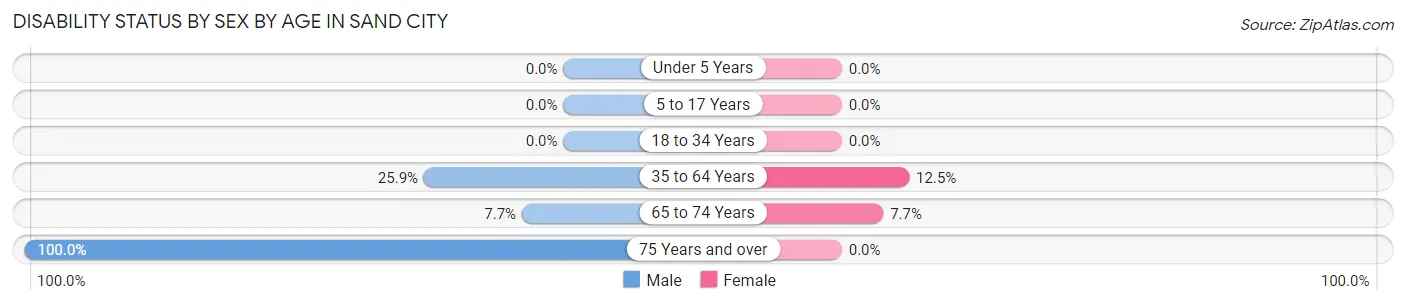
| Age Bracket | Male | Female |
| Under 5 Years | 0 (0.0%) | 0 (0.0%) |
| 5 to 17 Years | 0 (0.0%) | 0 (0.0%) |
| 18 to 34 Years | 0 (0.0%) | 0 (0.0%) |
| 35 to 64 Years | 22 (25.9%) | 8 (12.5%) |
| 65 to 74 Years | 2 (7.7%) | 1 (7.7%) |
| 75 Years and over | 2 (100.0%) | 0 (0.0%) |
Disability Class by Sex by Age in Sand City
Disability Class: Hearing Difficulty
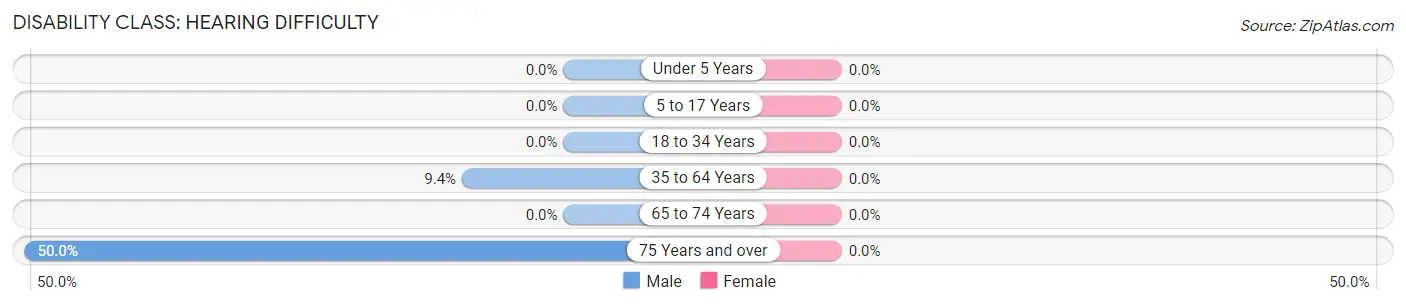
| Age Bracket | Male | Female |
| Under 5 Years | 0 (0.0%) | 0 (0.0%) |
| 5 to 17 Years | 0 (0.0%) | 0 (0.0%) |
| 18 to 34 Years | 0 (0.0%) | 0 (0.0%) |
| 35 to 64 Years | 8 (9.4%) | 0 (0.0%) |
| 65 to 74 Years | 0 (0.0%) | 0 (0.0%) |
| 75 Years and over | 1 (50.0%) | 0 (0.0%) |
Disability Class: Vision Difficulty
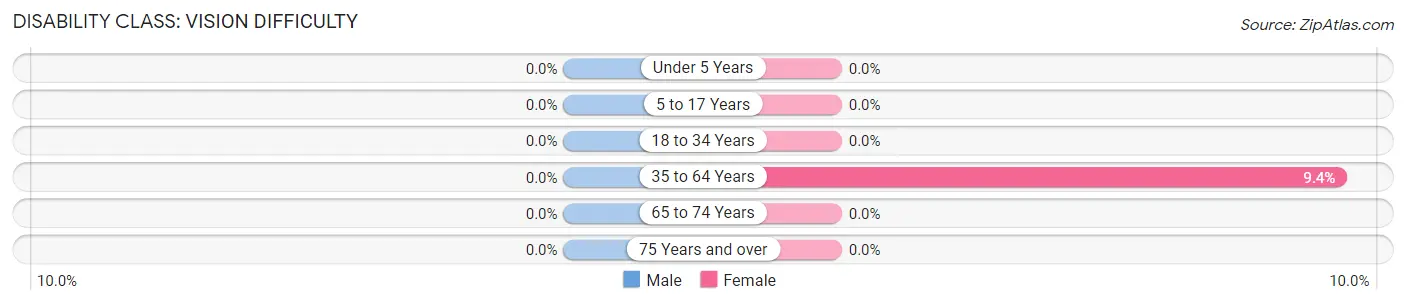
| Age Bracket | Male | Female |
| Under 5 Years | 0 (0.0%) | 0 (0.0%) |
| 5 to 17 Years | 0 (0.0%) | 0 (0.0%) |
| 18 to 34 Years | 0 (0.0%) | 0 (0.0%) |
| 35 to 64 Years | 0 (0.0%) | 6 (9.4%) |
| 65 to 74 Years | 0 (0.0%) | 0 (0.0%) |
| 75 Years and over | 0 (0.0%) | 0 (0.0%) |
Disability Class: Cognitive Difficulty
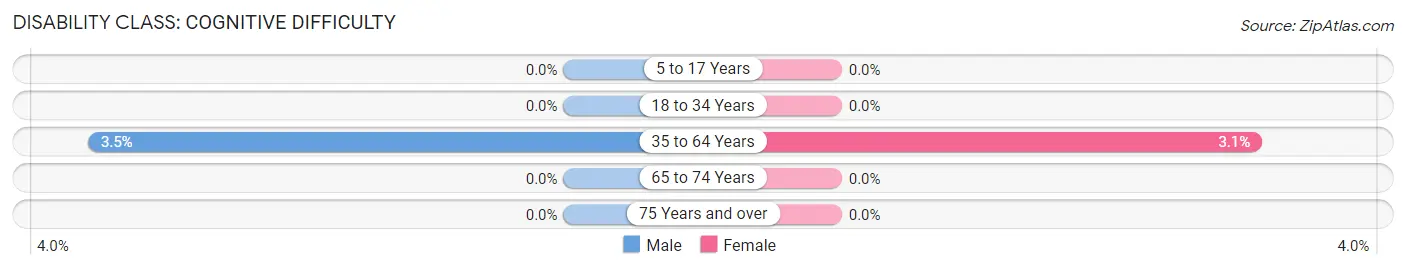
| Age Bracket | Male | Female |
| 5 to 17 Years | 0 (0.0%) | 0 (0.0%) |
| 18 to 34 Years | 0 (0.0%) | 0 (0.0%) |
| 35 to 64 Years | 3 (3.5%) | 2 (3.1%) |
| 65 to 74 Years | 0 (0.0%) | 0 (0.0%) |
| 75 Years and over | 0 (0.0%) | 0 (0.0%) |
Disability Class: Ambulatory Difficulty
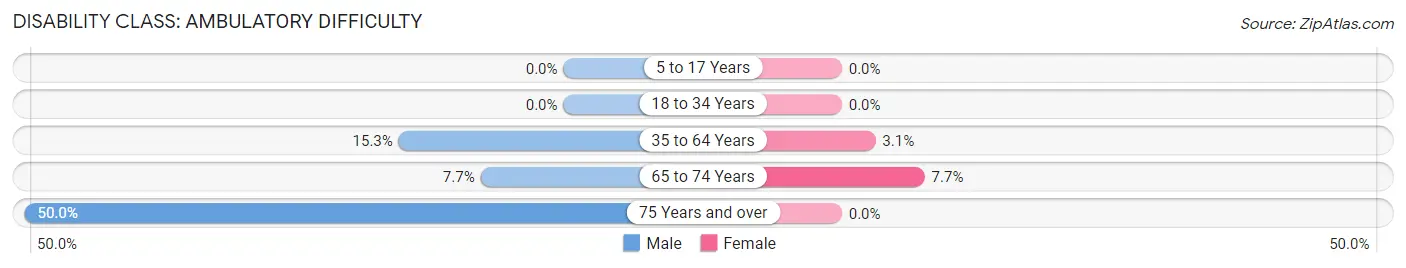
| Age Bracket | Male | Female |
| 5 to 17 Years | 0 (0.0%) | 0 (0.0%) |
| 18 to 34 Years | 0 (0.0%) | 0 (0.0%) |
| 35 to 64 Years | 13 (15.3%) | 2 (3.1%) |
| 65 to 74 Years | 2 (7.7%) | 1 (7.7%) |
| 75 Years and over | 1 (50.0%) | 0 (0.0%) |
Disability Class: Self-Care Difficulty
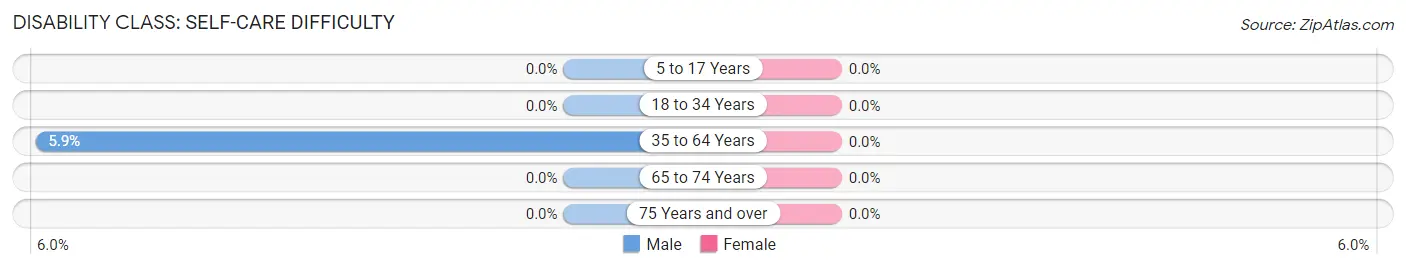
| Age Bracket | Male | Female |
| 5 to 17 Years | 0 (0.0%) | 0 (0.0%) |
| 18 to 34 Years | 0 (0.0%) | 0 (0.0%) |
| 35 to 64 Years | 5 (5.9%) | 0 (0.0%) |
| 65 to 74 Years | 0 (0.0%) | 0 (0.0%) |
| 75 Years and over | 0 (0.0%) | 0 (0.0%) |
Technology Access in Sand City
Computing Device Access in Sand City
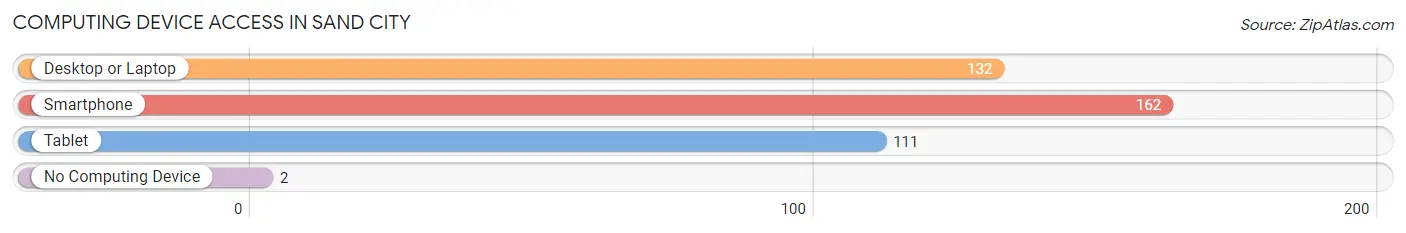
| Device Type | # Households | % Households |
| Desktop or Laptop | 132 | 76.7% |
| Smartphone | 162 | 94.2% |
| Tablet | 111 | 64.5% |
| No Computing Device | 2 | 1.2% |
| Total | 172 | 100.0% |
Internet Access in Sand City
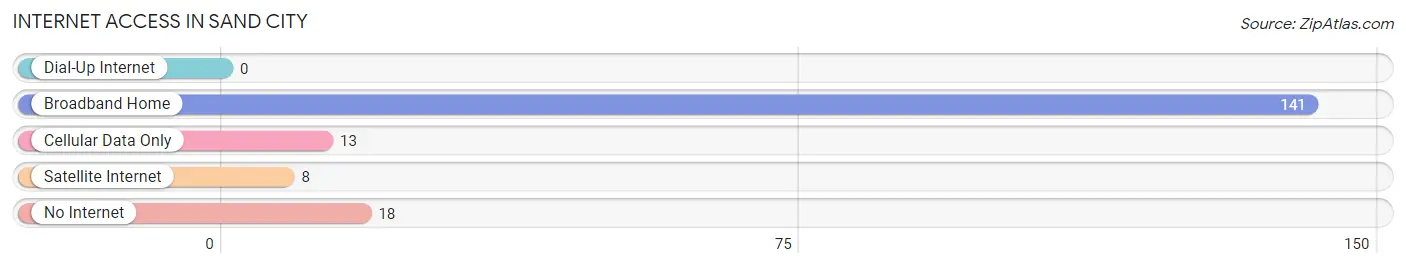
| Internet Type | # Households | % Households |
| Dial-Up Internet | 0 | 0.0% |
| Broadband Home | 141 | 82.0% |
| Cellular Data Only | 13 | 7.6% |
| Satellite Internet | 8 | 4.6% |
| No Internet | 18 | 10.5% |
| Total | 172 | 100.0% |
Sand City Summary
Sand City is a small city located in Monterey County, California, United States. It is situated on the Monterey Bay, approximately 10 miles north of Monterey and 8 miles south of Santa Cruz. The city was incorporated in 1959 and has a population of approximately 1,800 people.
History
The area that is now Sand City was originally inhabited by the Ohlone people, who lived in the area for thousands of years before the arrival of Europeans. The first Europeans to settle in the area were Spanish missionaries, who established a mission in nearby Monterey in 1770. The area remained largely undeveloped until the late 19th century, when the area began to be used for farming and ranching.
In the early 20th century, the area began to be developed as a resort destination. The first hotel in the area was built in 1906, and the area soon became a popular destination for tourists. In the 1950s, the area began to be developed as a residential community, and in 1959, the city of Sand City was incorporated.
Geography
Sand City is located in Monterey County, California, on the Monterey Bay. It is situated approximately 10 miles north of Monterey and 8 miles south of Santa Cruz. The city covers an area of 1.2 square miles, and has a population of approximately 1,800 people.
The city is bordered by the cities of Seaside to the north, Monterey to the south, and Pacific Grove to the east. The city is located on a narrow strip of land between the Monterey Bay and the Santa Cruz Mountains. The city is home to several beaches, including Sand City Beach, which is located on the Monterey Bay.
Economy
The economy of Sand City is largely based on tourism and retail. The city is home to several hotels and restaurants, as well as a variety of shops and stores. The city is also home to several art galleries and museums, as well as a number of recreational activities, such as fishing, boating, and surfing.
The city is also home to several businesses, including a number of technology companies. The city is home to several software companies, as well as a number of medical device companies. The city is also home to a number of manufacturing companies, including a number of food processing companies.
Demographics
As of the 2010 census, the population of Sand City was 1,788. The racial makeup of the city was 79.2% White, 0.9% African American, 0.7% Native American, 5.2% Asian, 0.2% Pacific Islander, 9.2% from other races, and 4.7% from two or more races. Hispanic or Latino of any race were 18.2% of the population.
The median income for a household in the city was $50,972, and the median income for a family was $60,972. The per capita income for the city was $25,972. About 8.2% of families and 11.2% of the population were below the poverty line, including 15.2% of those under age 18 and 6.2% of those age 65 or over.
Common Questions
What is the Total Population of Sand City?
Total Population of Sand City is 319.
What is the Total Male Population of Sand City?
Total Male Population of Sand City is 178.
What is the Total Female Population of Sand City?
Total Female Population of Sand City is 141.
What is the Ratio of Males per 100 Females in Sand City?
There are 126.24 Males per 100 Females in Sand City.
What is the Ratio of Females per 100 Males in Sand City?
There are 79.21 Females per 100 Males in Sand City.
What is the Median Population Age in Sand City?
Median Population Age in Sand City is 45.6 Years.
What is the Average Family Size in Sand City
Average Family Size in Sand City is 2.8 People.
What is the Average Household Size in Sand City
Average Household Size in Sand City is 1.9 People.
What is Per Capita Income in Sand City?
Per Capita income in Sand City is $47,525.
What is the Median Family Income in Sand City?
Median Family Income in Sand City is $86,500.
What is the Median Household income in Sand City?
Median Household Income in Sand City is $68,333.
What is Income or Wage Gap in Sand City?
Income or Wage Gap in Sand City is 20.0%.
Women in Sand City earn 80.0 cents for every dollar earned by a man.
What is Inequality or Gini Index in Sand City?
Inequality or Gini Index in Sand City is 0.36.
How Large is the Labor Force in Sand City?
There are 204 People in the Labor Forcein in Sand City.
What is the Percentage of People in the Labor Force in Sand City?
73.4% of People are in the Labor Force in Sand City.
What is the Unemployment Rate in Sand City?
Unemployment Rate in Sand City is 1.6%.