Romoland, CA
Romoland Map
Romoland Overview
2,738
TOTAL POPULATION
1,305
MALE POPULATION
1,433
FEMALE POPULATION
91.07
MALES / 100 FEMALES
109.81
FEMALES / 100 MALES
31.3
MEDIAN AGE
4.8
AVG FAMILY SIZE
4.6
AVG HOUSEHOLD SIZE
$19,229
PER CAPITA INCOME
$74,167
AVG FAMILY INCOME
$73,500
AVG HOUSEHOLD INCOME
44.5%
WAGE / INCOME GAP [ % ]
55.5¢/ $1
WAGE / INCOME GAP [ $ ]
0.40
INEQUALITY / GINI INDEX
1,075
LABOR FORCE [ PEOPLE ]
58.4%
PERCENT IN LABOR FORCE
6.0%
UNEMPLOYMENT RATE
Romoland Area Codes
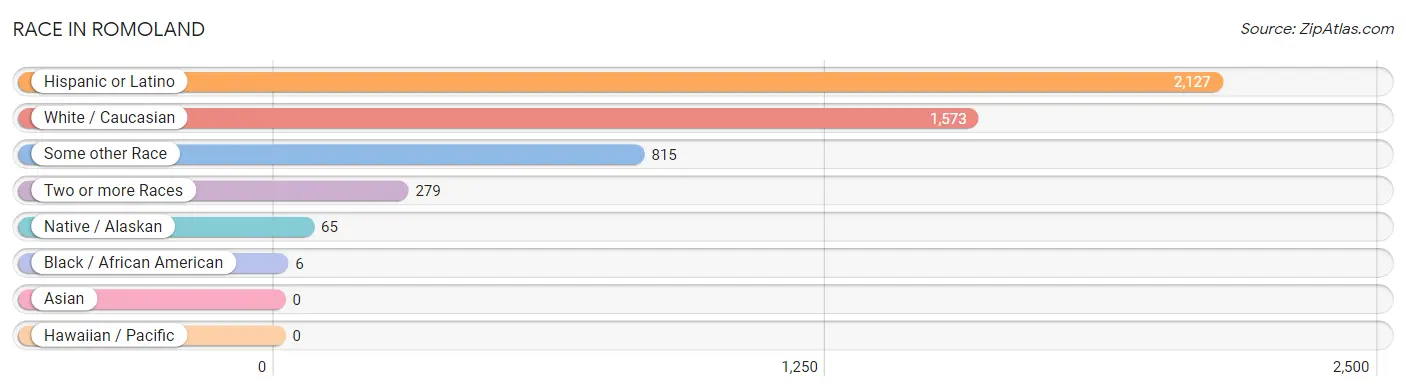
Race in Romoland
The most populous races in Romoland are Hispanic or Latino (2,127 | 77.7%), White / Caucasian (1,573 | 57.5%), and Some other Race (815 | 29.8%).
| Race | # Population | % Population |
| Asian | 0 | 0.0% |
| Black / African American | 6 | 0.2% |
| Hawaiian / Pacific | 0 | 0.0% |
| Hispanic or Latino | 2,127 | 77.7% |
| Native / Alaskan | 65 | 2.4% |
| White / Caucasian | 1,573 | 57.5% |
| Two or more Races | 279 | 10.2% |
| Some other Race | 815 | 29.8% |
| Total | 2,738 | 100.0% |
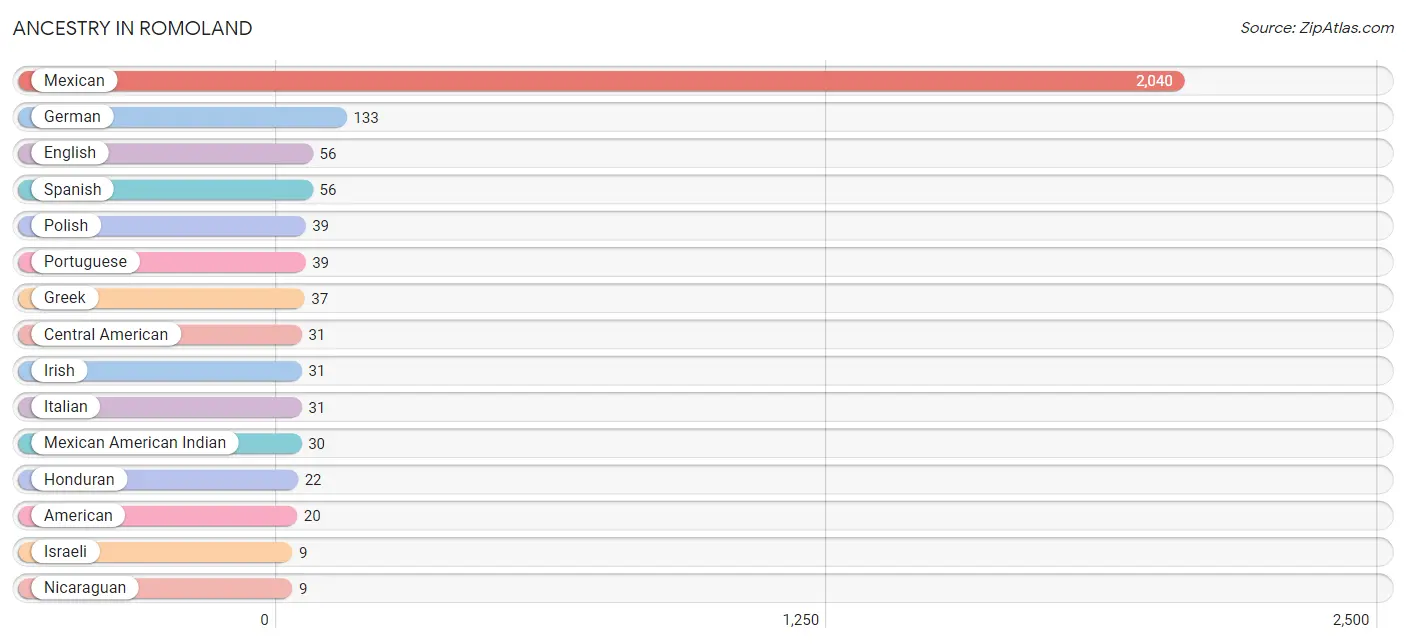
Ancestry in Romoland
The most populous ancestries reported in Romoland are Mexican (2,040 | 74.5%), German (133 | 4.9%), English (56 | 2.1%), Spanish (56 | 2.1%), and Polish (39 | 1.4%), together accounting for 84.9% of all Romoland residents.
| Ancestry | # Population | % Population |
| American | 20 | 0.7% |
| Central American | 31 | 1.1% |
| Cherokee | 8 | 0.3% |
| English | 56 | 2.1% |
| German | 133 | 4.9% |
| Greek | 37 | 1.3% |
| Honduran | 22 | 0.8% |
| Irish | 31 | 1.1% |
| Israeli | 9 | 0.3% |
| Italian | 31 | 1.1% |
| Mexican | 2,040 | 74.5% |
| Mexican American Indian | 30 | 1.1% |
| Nicaraguan | 9 | 0.3% |
| Polish | 39 | 1.4% |
| Portuguese | 39 | 1.4% |
| Spanish | 56 | 2.1% |
| Welsh | 9 | 0.3% | View All 17 Rows |
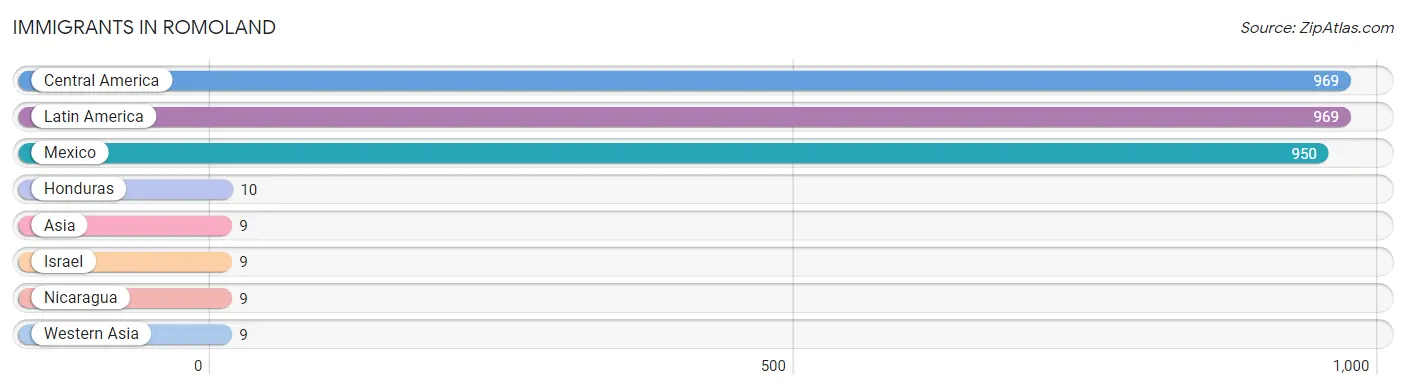
Immigrants in Romoland
The most numerous immigrant groups reported in Romoland came from Central America (969 | 35.4%), Latin America (969 | 35.4%), Mexico (950 | 34.7%), Honduras (10 | 0.4%), and Asia (9 | 0.3%), together accounting for 106.2% of all Romoland residents.
| Immigration Origin | # Population | % Population |
| Asia | 9 | 0.3% |
| Central America | 969 | 35.4% |
| Honduras | 10 | 0.4% |
| Israel | 9 | 0.3% |
| Latin America | 969 | 35.4% |
| Mexico | 950 | 34.7% |
| Nicaragua | 9 | 0.3% |
| Western Asia | 9 | 0.3% | View All 8 Rows |
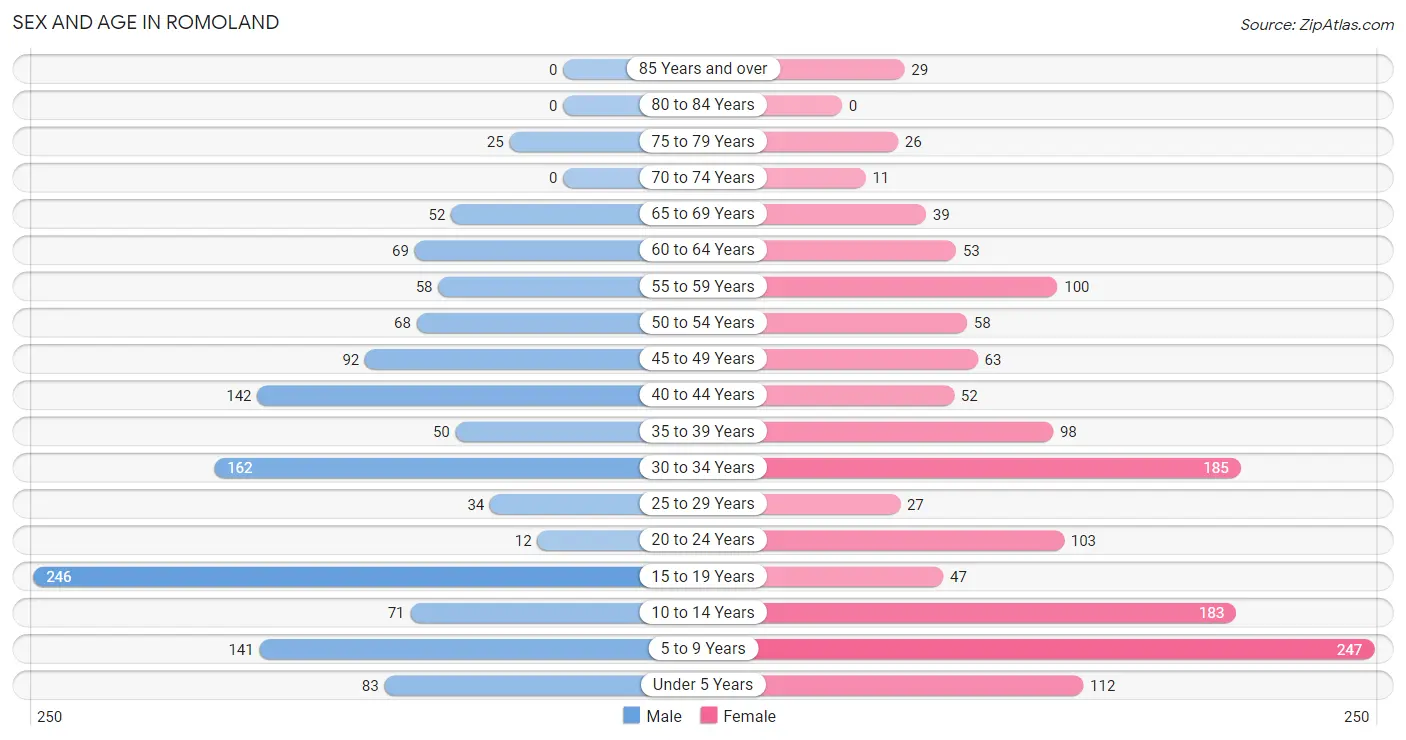
Sex and Age in Romoland
Sex and Age in Romoland
The most populous age groups in Romoland are 15 to 19 Years (246 | 18.9%) for men and 5 to 9 Years (247 | 17.2%) for women.
| Age Bracket | Male | Female |
| Under 5 Years | 83 (6.4%) | 112 (7.8%) |
| 5 to 9 Years | 141 (10.8%) | 247 (17.2%) |
| 10 to 14 Years | 71 (5.4%) | 183 (12.8%) |
| 15 to 19 Years | 246 (18.9%) | 47 (3.3%) |
| 20 to 24 Years | 12 (0.9%) | 103 (7.2%) |
| 25 to 29 Years | 34 (2.6%) | 27 (1.9%) |
| 30 to 34 Years | 162 (12.4%) | 185 (12.9%) |
| 35 to 39 Years | 50 (3.8%) | 98 (6.8%) |
| 40 to 44 Years | 142 (10.9%) | 52 (3.6%) |
| 45 to 49 Years | 92 (7.0%) | 63 (4.4%) |
| 50 to 54 Years | 68 (5.2%) | 58 (4.1%) |
| 55 to 59 Years | 58 (4.4%) | 100 (7.0%) |
| 60 to 64 Years | 69 (5.3%) | 53 (3.7%) |
| 65 to 69 Years | 52 (4.0%) | 39 (2.7%) |
| 70 to 74 Years | 0 (0.0%) | 11 (0.8%) |
| 75 to 79 Years | 25 (1.9%) | 26 (1.8%) |
| 80 to 84 Years | 0 (0.0%) | 0 (0.0%) |
| 85 Years and over | 0 (0.0%) | 29 (2.0%) |
| Total | 1,305 (100.0%) | 1,433 (100.0%) |
Families and Households in Romoland
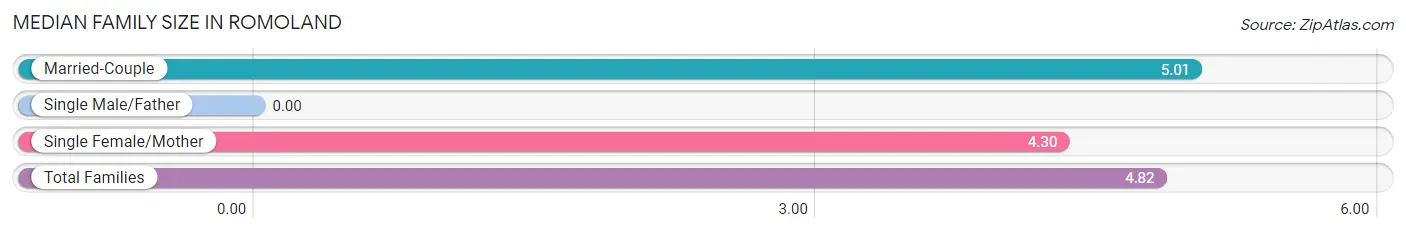
Median Family Size in Romoland
| Family Type | # Families | Family Size |
| Married-Couple | 395 (74.5%) | 5.01 |
| Single Male/Father | 0 (0.0%) | - |
| Single Female/Mother | 135 (25.5%) | 4.30 |
| Total Families | 530 (100.0%) | 4.82 |
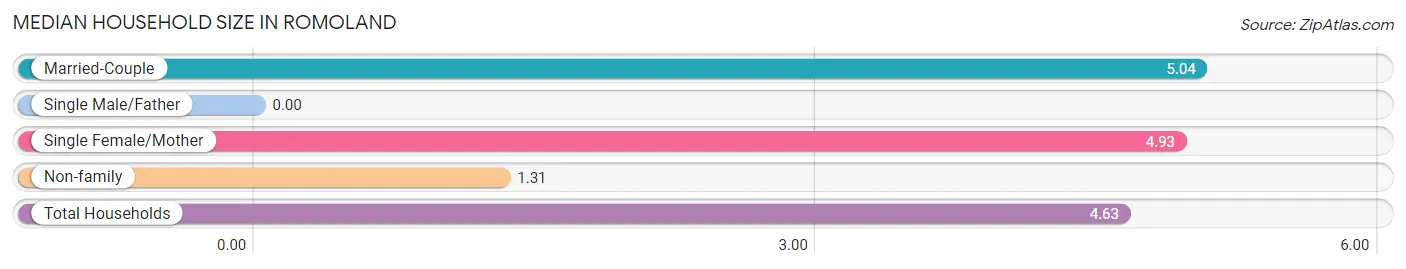
Median Household Size in Romoland
| Household Type | # Households | Household Size |
| Married-Couple | 395 (66.7%) | 5.04 |
| Single Male/Father | 0 (0.0%) | - |
| Single Female/Mother | 135 (22.8%) | 4.93 |
| Non-family | 62 (10.5%) | 1.31 |
| Total Households | 592 (100.0%) | 4.63 |
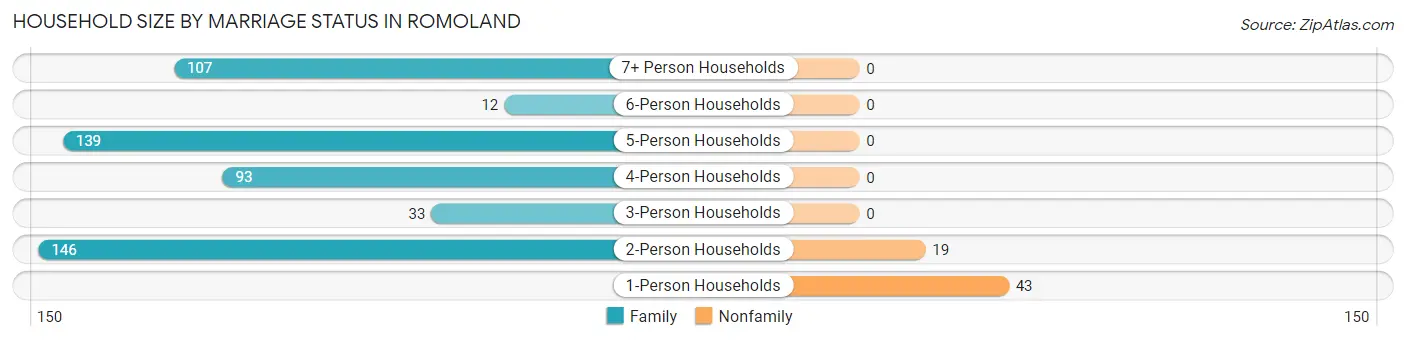
Household Size by Marriage Status in Romoland
Out of a total of 592 households in Romoland, 530 (89.5%) are family households, while 62 (10.5%) are nonfamily households. The most numerous type of family households are 2-person households, comprising 146, and the most common type of nonfamily households are 1-person households, comprising 43.
| Household Size | Family Households | Nonfamily Households |
| 1-Person Households | - | 43 (7.3%) |
| 2-Person Households | 146 (24.7%) | 19 (3.2%) |
| 3-Person Households | 33 (5.6%) | 0 (0.0%) |
| 4-Person Households | 93 (15.7%) | 0 (0.0%) |
| 5-Person Households | 139 (23.5%) | 0 (0.0%) |
| 6-Person Households | 12 (2.0%) | 0 (0.0%) |
| 7+ Person Households | 107 (18.1%) | 0 (0.0%) |
| Total | 530 (89.5%) | 62 (10.5%) |
Female Fertility in Romoland
Fertility by Age in Romoland
| Age Bracket | Women with Births | Births / 1,000 Women |
| 15 to 19 years | 0 (0.0%) | 0.0 |
| 20 to 34 years | 0 (0.0%) | 0.0 |
| 35 to 50 years | 0 (0.0%) | 0.0 |
| Total | 0 (0.0%) | 0.0 |
Fertility by Age by Marriage Status in Romoland
| Age Bracket | Married | Unmarried |
| 15 to 19 years | 0 (0.0%) | 0 (0.0%) |
| 20 to 34 years | 0 (0.0%) | 0 (0.0%) |
| 35 to 50 years | 0 (0.0%) | 0 (0.0%) |
| Total | 0 (0.0%) | 0 (0.0%) |
Fertility by Education in Romoland
| Educational Attainment | Women with Births | Births / 1,000 Women |
| Less than High School | 0 (0.0%) | 0.0 |
| High School Diploma | 0 (0.0%) | 0.0 |
| College or Associate's Degree | 0 (0.0%) | 0.0 |
| Bachelor's Degree | 0 (0.0%) | 0.0 |
| Graduate Degree | 0 (0.0%) | 0.0 |
| Total | 0 (0.0%) | 0.0 |
Fertility by Education by Marriage Status in Romoland
| Educational Attainment | Married | Unmarried |
| Less than High School | 0 (0.0%) | 0 (0.0%) |
| High School Diploma | 0 (0.0%) | 0 (0.0%) |
| College or Associate's Degree | 0 (0.0%) | 0 (0.0%) |
| Bachelor's Degree | 0 (0.0%) | 0 (0.0%) |
| Graduate Degree | 0 (0.0%) | 0 (0.0%) |
| Total | 0 (0.0%) | 0 (0.0%) |
Income in Romoland
Income Overview in Romoland
Per Capita Income in Romoland is $19,229, while median incomes of families and households are $74,167 and $73,500 respectively.
| Characteristic | Number | Measure |
| Per Capita Income | 2,738 | $19,229 |
| Median Family Income | 530 | $74,167 |
| Mean Family Income | 530 | $85,460 |
| Median Household Income | 592 | $73,500 |
| Mean Household Income | 592 | $87,756 |
| Income Deficit | 530 | $0 |
| Wage / Income Gap (%) | 2,738 | 44.47% |
| Wage / Income Gap ($) | 2,738 | 55.53¢ per $1 |
| Gini / Inequality Index | 2,738 | 0.40 |
Earnings by Sex in Romoland
Average Earnings in Romoland are $34,651, $41,806 for men and $23,214 for women, a difference of 44.5%.
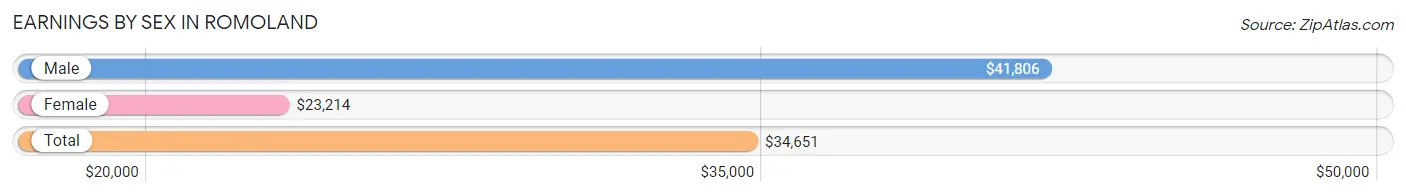
| Sex | Number | Average Earnings |
| Male | 568 (53.9%) | $41,806 |
| Female | 486 (46.1%) | $23,214 |
| Total | 1,054 (100.0%) | $34,651 |
Earnings by Sex by Income Bracket in Romoland
The most common earnings brackets in Romoland are $100,000+ for men (97 | 17.1%) and $10,000 to $12,499 for women (43 | 8.8%).
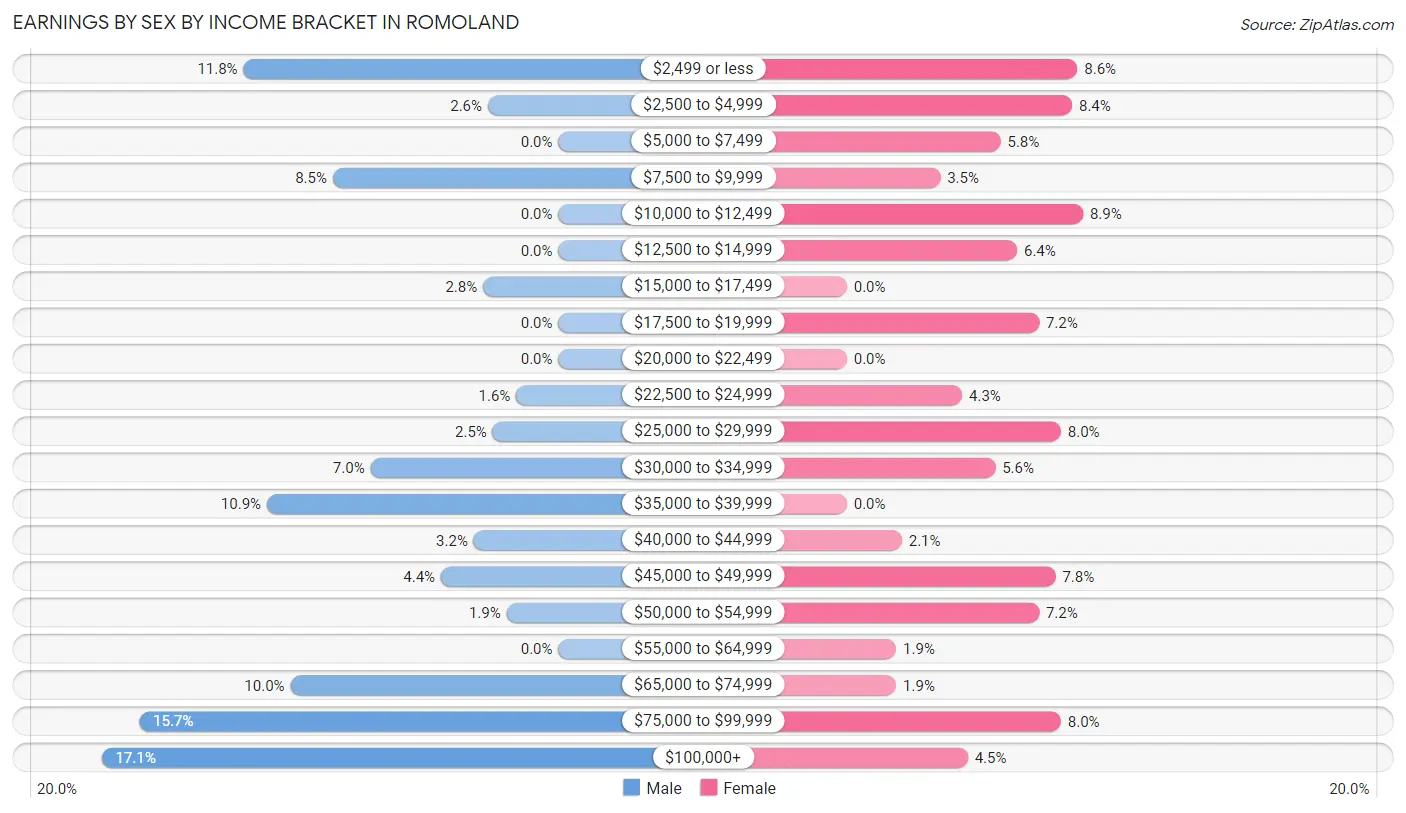
| Income | Male | Female |
| $2,499 or less | 67 (11.8%) | 42 (8.6%) |
| $2,500 to $4,999 | 15 (2.6%) | 41 (8.4%) |
| $5,000 to $7,499 | 0 (0.0%) | 28 (5.8%) |
| $7,500 to $9,999 | 48 (8.5%) | 17 (3.5%) |
| $10,000 to $12,499 | 0 (0.0%) | 43 (8.8%) |
| $12,500 to $14,999 | 0 (0.0%) | 31 (6.4%) |
| $15,000 to $17,499 | 16 (2.8%) | 0 (0.0%) |
| $17,500 to $19,999 | 0 (0.0%) | 35 (7.2%) |
| $20,000 to $22,499 | 0 (0.0%) | 0 (0.0%) |
| $22,500 to $24,999 | 9 (1.6%) | 21 (4.3%) |
| $25,000 to $29,999 | 14 (2.5%) | 39 (8.0%) |
| $30,000 to $34,999 | 40 (7.0%) | 27 (5.6%) |
| $35,000 to $39,999 | 62 (10.9%) | 0 (0.0%) |
| $40,000 to $44,999 | 18 (3.2%) | 10 (2.1%) |
| $45,000 to $49,999 | 25 (4.4%) | 38 (7.8%) |
| $50,000 to $54,999 | 11 (1.9%) | 35 (7.2%) |
| $55,000 to $64,999 | 0 (0.0%) | 9 (1.8%) |
| $65,000 to $74,999 | 57 (10.0%) | 9 (1.8%) |
| $75,000 to $99,999 | 89 (15.7%) | 39 (8.0%) |
| $100,000+ | 97 (17.1%) | 22 (4.5%) |
| Total | 568 (100.0%) | 486 (100.0%) |
Earnings by Sex by Educational Attainment in Romoland
Average earnings in Romoland are $65,521 for men and $28,083 for women, a difference of 57.1%. Men with an educational attainment of less than high school enjoy the highest average annual earnings of $66,250, while those with college or associate's degree education earn the least with $65,227. Women with an educational attainment of bachelor's degree earn the most with the average annual earnings of $51,033, while those with high school diploma education have the smallest earnings of $13,508.
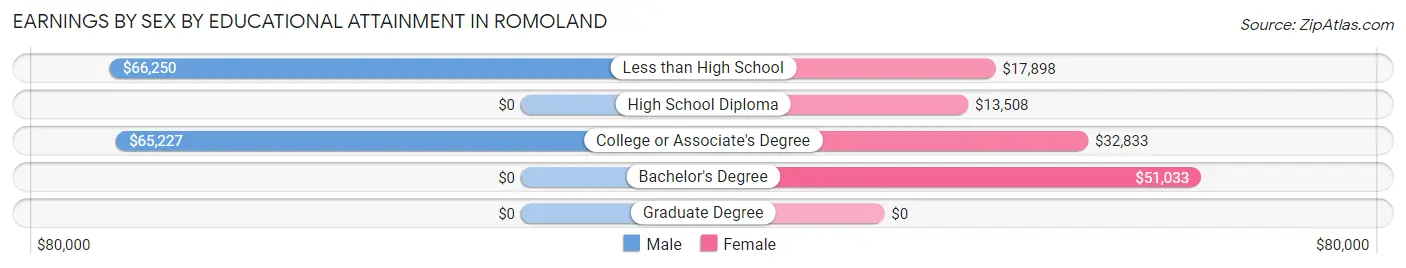
| Educational Attainment | Male Income | Female Income |
| Less than High School | $66,250 | $17,898 |
| High School Diploma | - | - |
| College or Associate's Degree | $65,227 | $32,833 |
| Bachelor's Degree | - | - |
| Graduate Degree | - | - |
| Total | $65,521 | $28,083 |
Family Income in Romoland
Family Income Brackets in Romoland
According to the Romoland family income data, there are 134 families falling into the $100,000 to $149,999 income range, which is the most common income bracket and makes up 25.3% of all families.
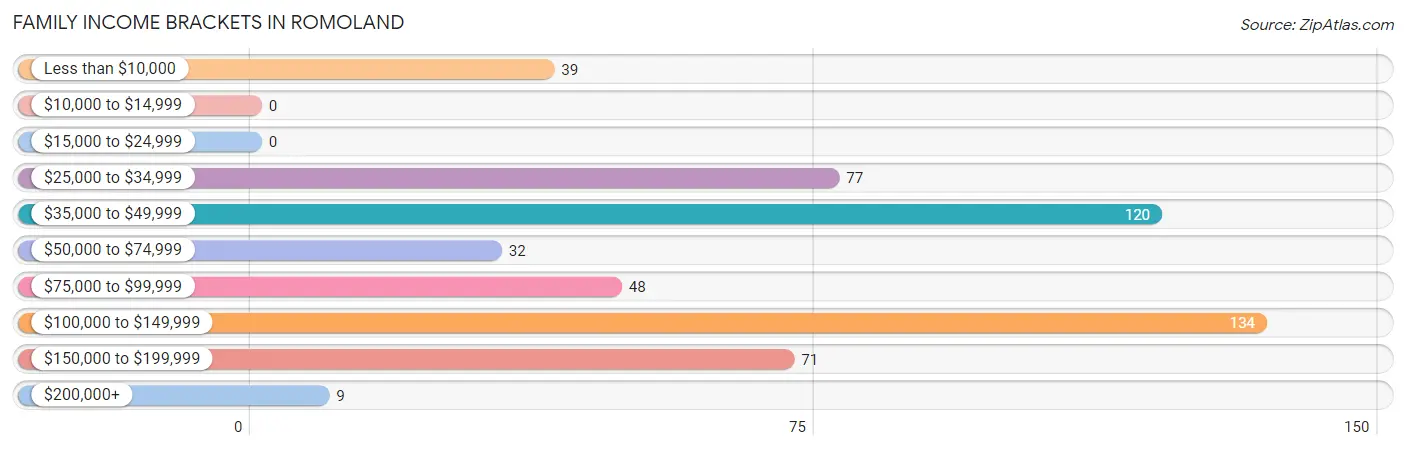
| Income Bracket | # Families | % Families |
| Less than $10,000 | 39 | 7.4% |
| $10,000 to $14,999 | 0 | 0.0% |
| $15,000 to $24,999 | 0 | 0.0% |
| $25,000 to $34,999 | 77 | 14.5% |
| $35,000 to $49,999 | 120 | 22.6% |
| $50,000 to $74,999 | 32 | 6.0% |
| $75,000 to $99,999 | 48 | 9.1% |
| $100,000 to $149,999 | 134 | 25.3% |
| $150,000 to $199,999 | 71 | 13.4% |
| $200,000+ | 9 | 1.7% |
Family Income by Famaliy Size in Romoland
7+ person families (95 | 17.9%) account for the highest median family income in Romoland with $116,125 per family, while 2-person families (155 | 29.2%) have the highest median income of $24,128 per family member.
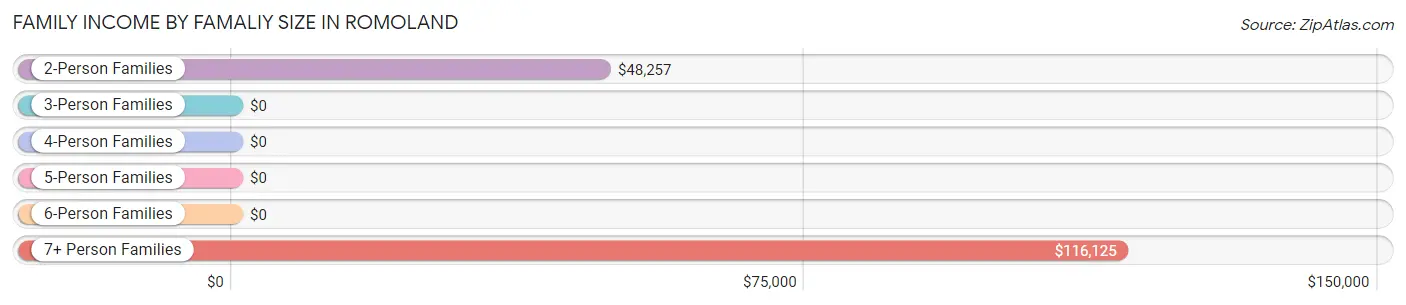
| Income Bracket | # Families | Median Income |
| 2-Person Families | 155 (29.2%) | $48,257 |
| 3-Person Families | 33 (6.2%) | $0 |
| 4-Person Families | 84 (15.9%) | $0 |
| 5-Person Families | 139 (26.2%) | $0 |
| 6-Person Families | 24 (4.5%) | $0 |
| 7+ Person Families | 95 (17.9%) | $116,125 |
| Total | 530 (100.0%) | $74,167 |
Family Income by Number of Earners in Romoland
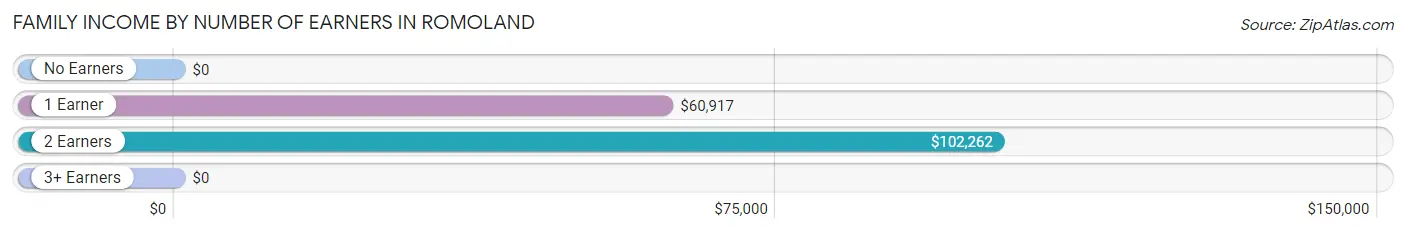
| Number of Earners | # Families | Median Income |
| No Earners | 56 (10.6%) | $0 |
| 1 Earner | 159 (30.0%) | $60,917 |
| 2 Earners | 206 (38.9%) | $102,262 |
| 3+ Earners | 109 (20.6%) | $0 |
| Total | 530 (100.0%) | $74,167 |
Household Income in Romoland
Household Income Brackets in Romoland
With 142 households falling in the category, the $35,000 to $49,999 income range is the most frequent in Romoland, accounting for 24.0% of all households.
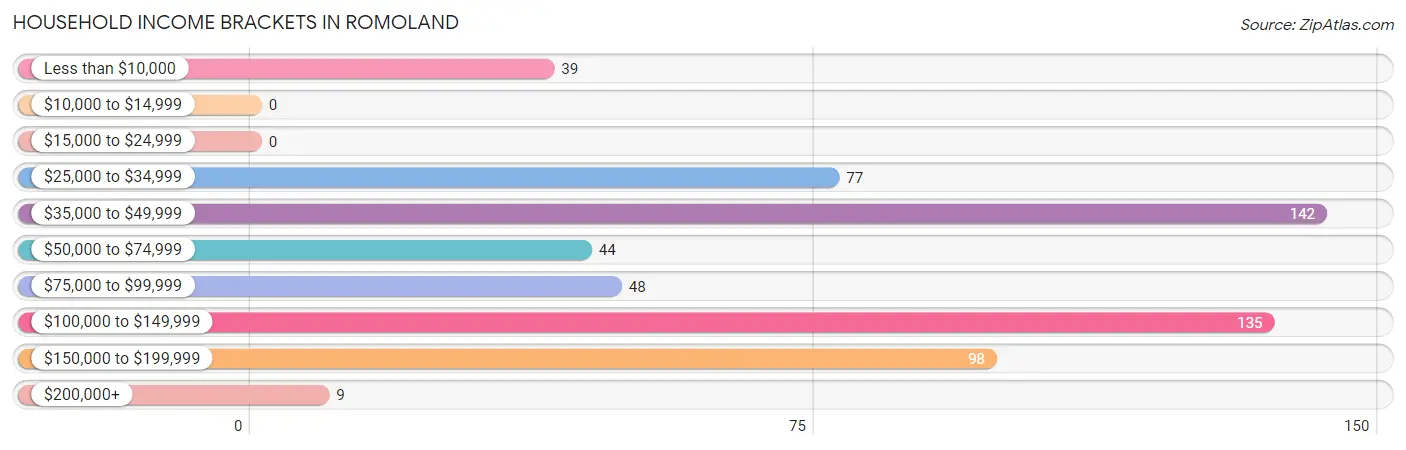
| Income Bracket | # Households | % Households |
| Less than $10,000 | 39 | 6.6% |
| $10,000 to $14,999 | 0 | 0.0% |
| $15,000 to $24,999 | 0 | 0.0% |
| $25,000 to $34,999 | 77 | 13.0% |
| $35,000 to $49,999 | 142 | 24.0% |
| $50,000 to $74,999 | 44 | 7.4% |
| $75,000 to $99,999 | 48 | 8.1% |
| $100,000 to $149,999 | 135 | 22.8% |
| $150,000 to $199,999 | 98 | 16.6% |
| $200,000+ | 9 | 1.5% |
Household Income by Householder Age in Romoland
The median household income in Romoland is $73,500, with the highest median household income of $101,905 found in the 25 to 44 years age bracket for the primary householder. A total of 232 households (39.2%) fall into this category.
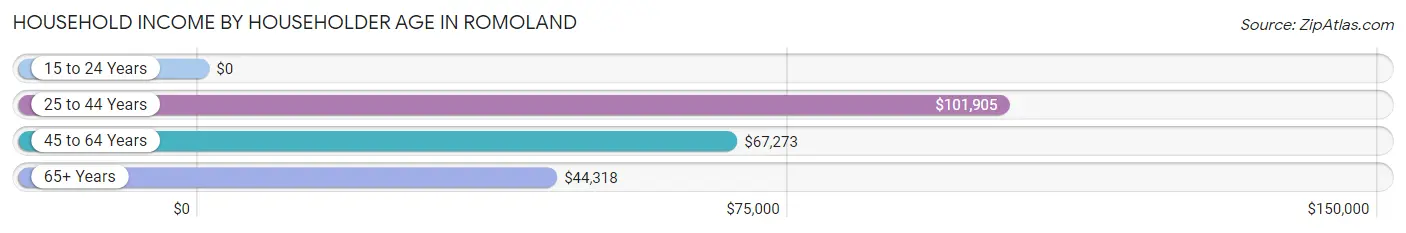
| Income Bracket | # Households | Median Income |
| 15 to 24 Years | 0 (0.0%) | $0 |
| 25 to 44 Years | 232 (39.2%) | $101,905 |
| 45 to 64 Years | 284 (48.0%) | $67,273 |
| 65+ Years | 76 (12.8%) | $44,318 |
| Total | 592 (100.0%) | $73,500 |
Poverty in Romoland
Income Below Poverty by Sex and Age in Romoland
With 16.5% poverty level for males and 21.4% for females among the residents of Romoland, 18 to 24 year old males and 12 to 14 year old females are the most vulnerable to poverty, with 48 males (49.0%) and 85 females (62.5%) in their respective age groups living below the poverty level.
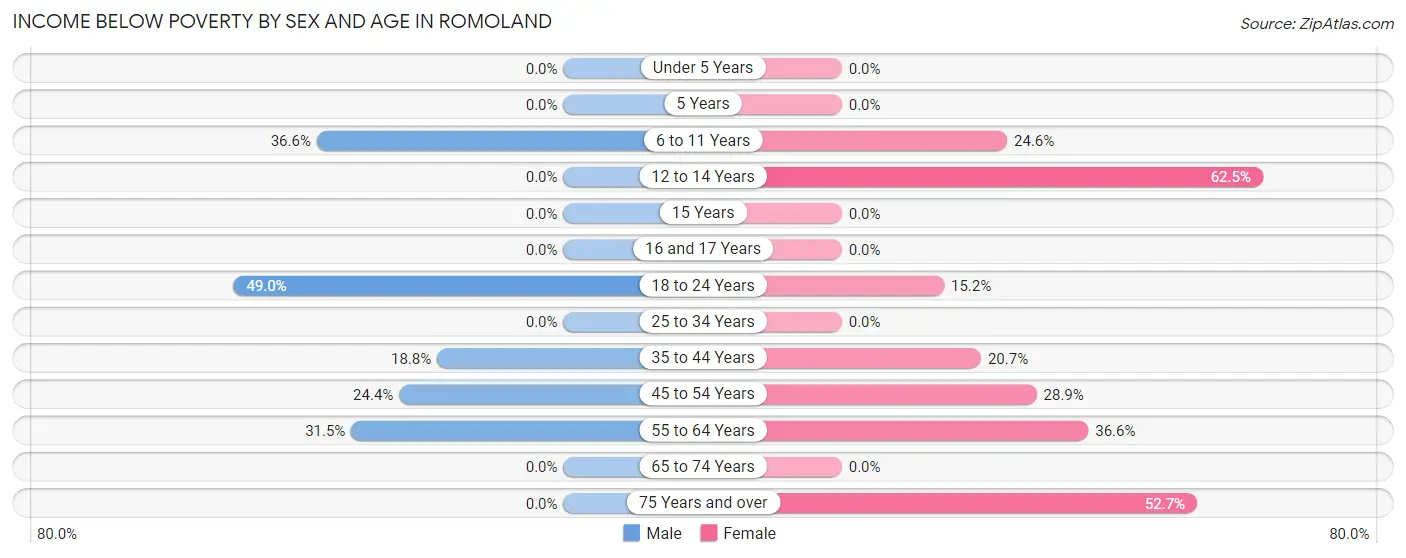
| Age Bracket | Male | Female |
| Under 5 Years | 0 (0.0%) | 0 (0.0%) |
| 5 Years | 0 (0.0%) | 0 (0.0%) |
| 6 to 11 Years | 52 (36.6%) | 54 (24.5%) |
| 12 to 14 Years | 0 (0.0%) | 85 (62.5%) |
| 15 Years | 0 (0.0%) | 0 (0.0%) |
| 16 and 17 Years | 0 (0.0%) | 0 (0.0%) |
| 18 to 24 Years | 48 (49.0%) | 17 (15.2%) |
| 25 to 34 Years | 0 (0.0%) | 0 (0.0%) |
| 35 to 44 Years | 36 (18.8%) | 31 (20.7%) |
| 45 to 54 Years | 39 (24.4%) | 35 (28.9%) |
| 55 to 64 Years | 40 (31.5%) | 56 (36.6%) |
| 65 to 74 Years | 0 (0.0%) | 0 (0.0%) |
| 75 Years and over | 0 (0.0%) | 29 (52.7%) |
| Total | 215 (16.5%) | 307 (21.4%) |
Income Above Poverty by Sex and Age in Romoland
According to the poverty statistics in Romoland, males aged under 5 years and females aged under 5 years are the age groups that are most secure financially, with 100.0% of males and 100.0% of females in these age groups living above the poverty line.
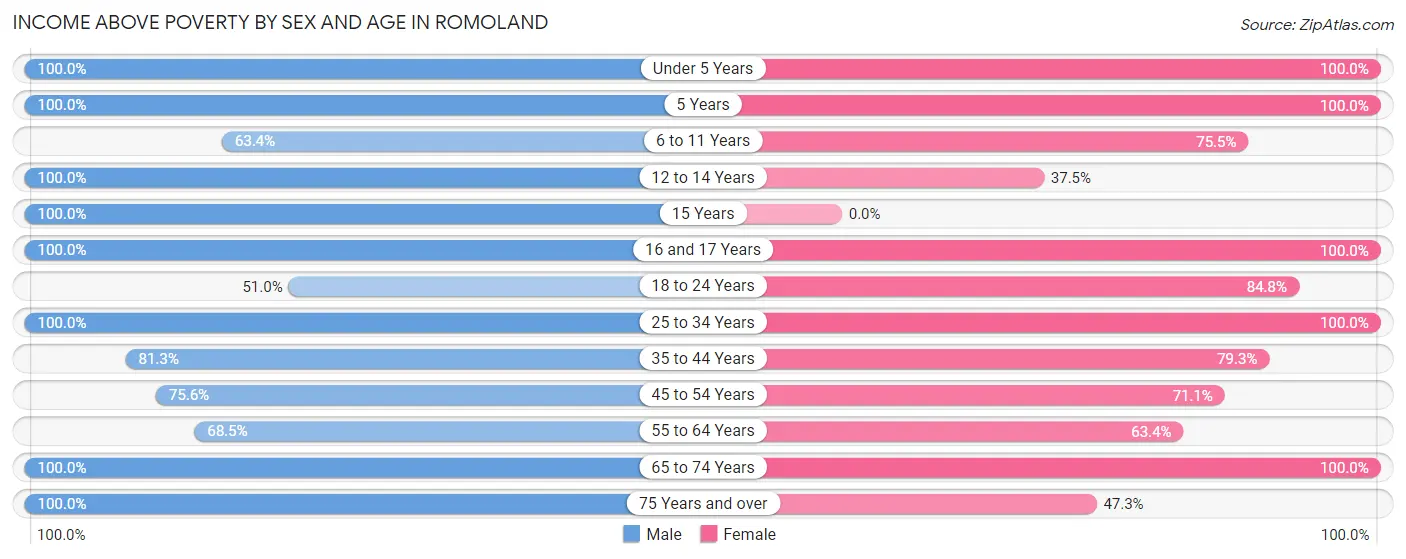
| Age Bracket | Male | Female |
| Under 5 Years | 83 (100.0%) | 112 (100.0%) |
| 5 Years | 19 (100.0%) | 74 (100.0%) |
| 6 to 11 Years | 90 (63.4%) | 166 (75.4%) |
| 12 to 14 Years | 51 (100.0%) | 51 (37.5%) |
| 15 Years | 60 (100.0%) | 0 (0.0%) |
| 16 and 17 Years | 100 (100.0%) | 38 (100.0%) |
| 18 to 24 Years | 50 (51.0%) | 95 (84.8%) |
| 25 to 34 Years | 196 (100.0%) | 212 (100.0%) |
| 35 to 44 Years | 156 (81.2%) | 119 (79.3%) |
| 45 to 54 Years | 121 (75.6%) | 86 (71.1%) |
| 55 to 64 Years | 87 (68.5%) | 97 (63.4%) |
| 65 to 74 Years | 52 (100.0%) | 50 (100.0%) |
| 75 Years and over | 25 (100.0%) | 26 (47.3%) |
| Total | 1,090 (83.5%) | 1,126 (78.6%) |
Income Below Poverty Among Married-Couple Families in Romoland
The poverty statistics for married-couple families in Romoland show that 9.9% or 39 of the total 395 families live below the poverty line. Families with no children have the highest poverty rate of 30.5%, comprising of 39 families. On the other hand, families with 1 or 2 children have the lowest poverty rate of 0.0%, which includes 0 families.
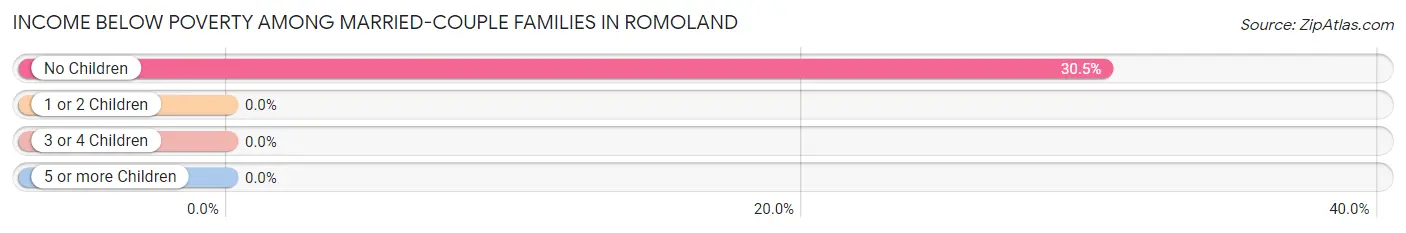
| Children | Above Poverty | Below Poverty |
| No Children | 89 (69.5%) | 39 (30.5%) |
| 1 or 2 Children | 64 (100.0%) | 0 (0.0%) |
| 3 or 4 Children | 186 (100.0%) | 0 (0.0%) |
| 5 or more Children | 17 (100.0%) | 0 (0.0%) |
| Total | 356 (90.1%) | 39 (9.9%) |
Income Below Poverty Among Single-Parent Households in Romoland
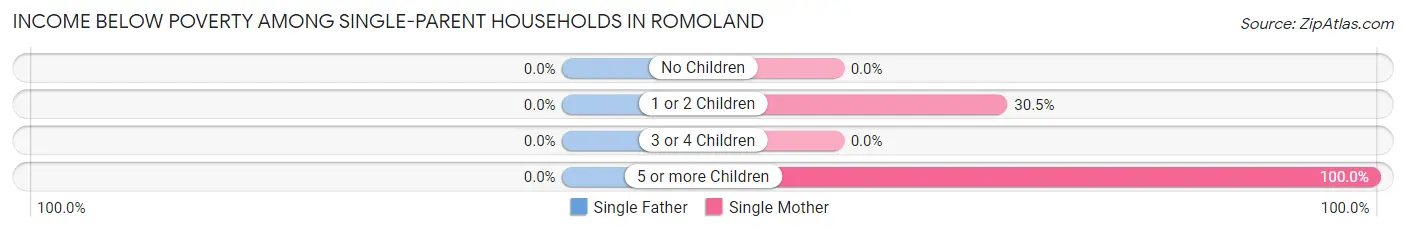
| Children | Single Father | Single Mother |
| No Children | 0 (0.0%) | 0 (0.0%) |
| 1 or 2 Children | 0 (0.0%) | 25 (30.5%) |
| 3 or 4 Children | 0 (0.0%) | 0 (0.0%) |
| 5 or more Children | 0 (0.0%) | 22 (100.0%) |
| Total | 0 (0.0%) | 47 (34.8%) |
Income Below Poverty Among Married-Couple vs Single-Parent Households in Romoland
The poverty data for Romoland shows that 39 of the married-couple family households (9.9%) and 47 of the single-parent households (34.8%) are living below the poverty level. Within the married-couple family households, those with no children have the highest poverty rate, with 39 households (30.5%) falling below the poverty line. Among the single-parent households, those with 5 or more children have the highest poverty rate, with 22 household (100.0%) living below poverty.
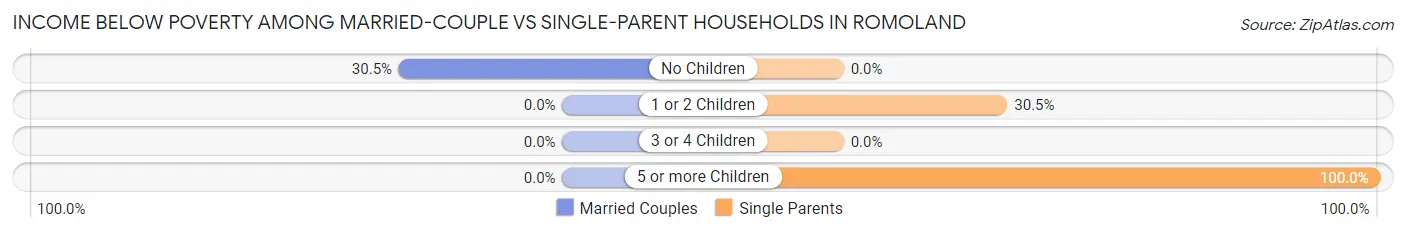
| Children | Married-Couple Families | Single-Parent Households |
| No Children | 39 (30.5%) | 0 (0.0%) |
| 1 or 2 Children | 0 (0.0%) | 25 (30.5%) |
| 3 or 4 Children | 0 (0.0%) | 0 (0.0%) |
| 5 or more Children | 0 (0.0%) | 22 (100.0%) |
| Total | 39 (9.9%) | 47 (34.8%) |
Employment Characteristics in Romoland
Employment by Class of Employer in Romoland
Among the 1,010 employed individuals in Romoland, private company employees (701 | 69.4%), self-employed (not incorporated) (181 | 17.9%), and local government employees (78 | 7.7%) make up the most common classes of employment.
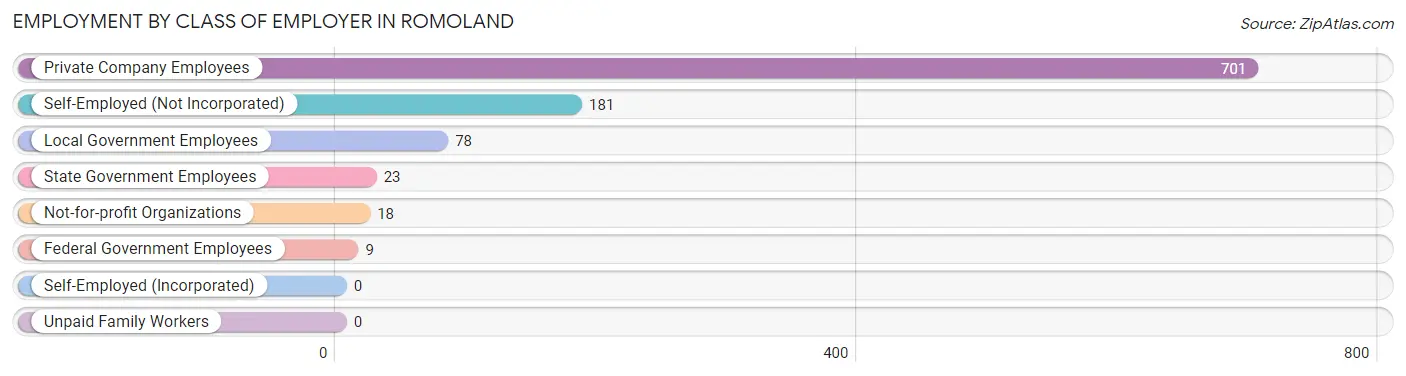
| Employer Class | # Employees | % Employees |
| Private Company Employees | 701 | 69.4% |
| Self-Employed (Incorporated) | 0 | 0.0% |
| Self-Employed (Not Incorporated) | 181 | 17.9% |
| Not-for-profit Organizations | 18 | 1.8% |
| Local Government Employees | 78 | 7.7% |
| State Government Employees | 23 | 2.3% |
| Federal Government Employees | 9 | 0.9% |
| Unpaid Family Workers | 0 | 0.0% |
| Total | 1,010 | 100.0% |
Employment Status by Age in Romoland
According to the labor force statistics for Romoland, out of the total population over 16 years of age (1,841), 58.4% or 1,075 individuals are in the labor force, with 6.0% or 64 of them unemployed. The age group with the highest labor force participation rate is 35 to 44 years, with 82.7% or 283 individuals in the labor force. Within the labor force, the 20 to 24 years age range has the highest percentage of unemployed individuals, with 28.1% or 16 of them being unemployed.
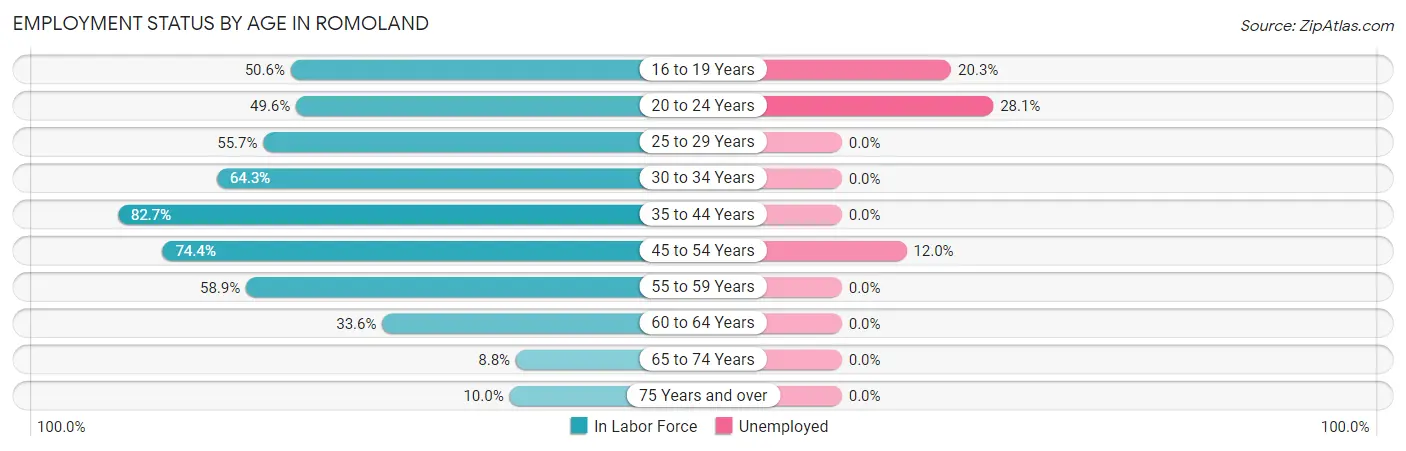
| Age Bracket | In Labor Force | Unemployed |
| 16 to 19 Years | 118 (50.6%) | 24 (20.3%) |
| 20 to 24 Years | 57 (49.6%) | 16 (28.1%) |
| 25 to 29 Years | 34 (55.7%) | 0 (0.0%) |
| 30 to 34 Years | 223 (64.3%) | 0 (0.0%) |
| 35 to 44 Years | 283 (82.7%) | 0 (0.0%) |
| 45 to 54 Years | 209 (74.4%) | 25 (12.0%) |
| 55 to 59 Years | 93 (58.9%) | 0 (0.0%) |
| 60 to 64 Years | 41 (33.6%) | 0 (0.0%) |
| 65 to 74 Years | 9 (8.8%) | 0 (0.0%) |
| 75 Years and over | 8 (10.0%) | 0 (0.0%) |
| Total | 1,075 (58.4%) | 64 (6.0%) |
Employment Status by Educational Attainment in Romoland
According to labor force statistics for Romoland, 67.4% of individuals (884) out of the total population between 25 and 64 years of age (1,311) are in the labor force, with 2.8% or 25 of them being unemployed. The group with the highest labor force participation rate are those with the educational attainment of bachelor's degree or higher, with 88.9% or 104 individuals in the labor force. Within the labor force, individuals with less than high school education have the highest percentage of unemployment, with 12.0% or 25 of them being unemployed.
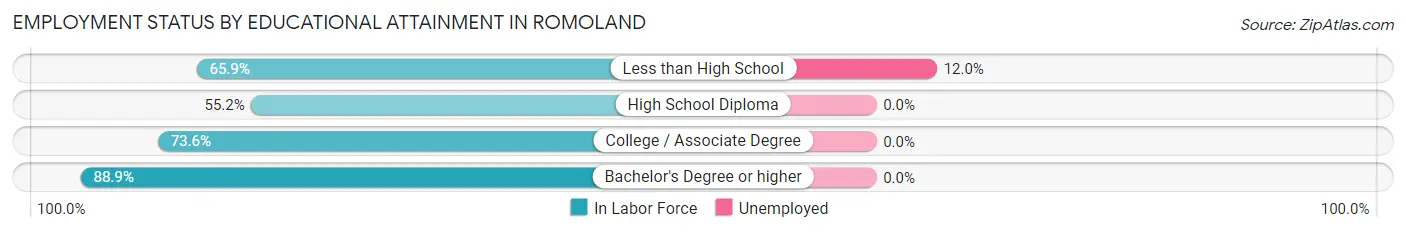
| Educational Attainment | In Labor Force | Unemployed |
| Less than High School | 209 (65.9%) | 38 (12.0%) |
| High School Diploma | 227 (55.2%) | 0 (0.0%) |
| College / Associate Degree | 343 (73.6%) | 0 (0.0%) |
| Bachelor's Degree or higher | 104 (88.9%) | 0 (0.0%) |
| Total | 884 (67.4%) | 37 (2.8%) |
Employment Occupations by Sex in Romoland
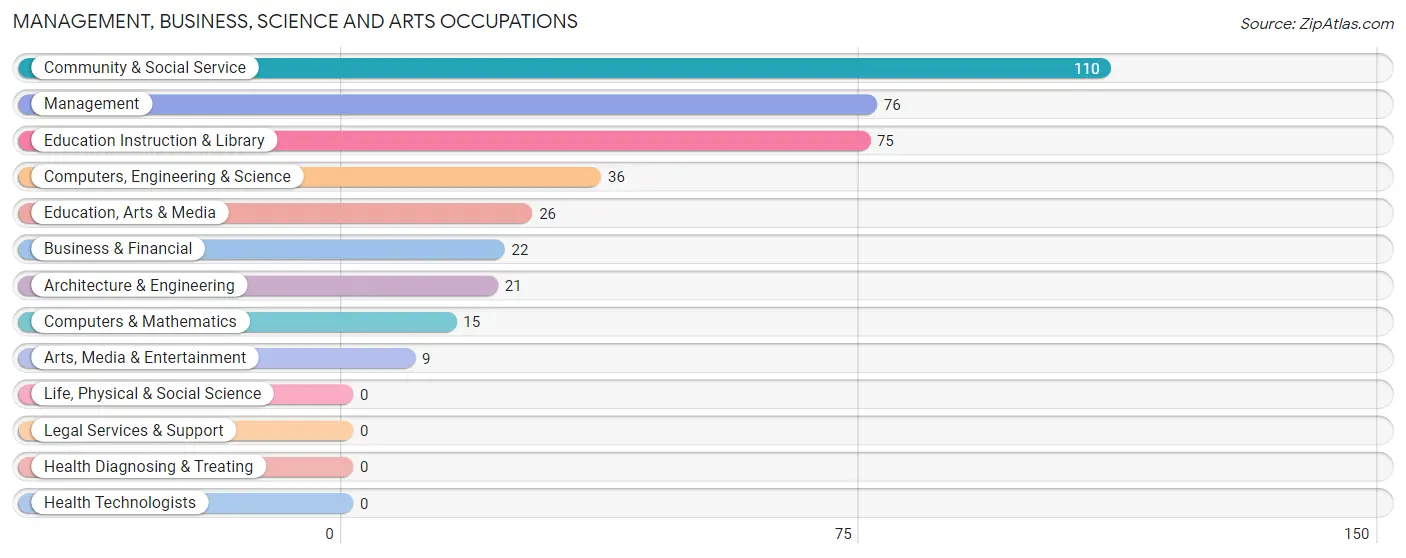
Management, Business, Science and Arts Occupations
The most common Management, Business, Science and Arts occupations in Romoland are Community & Social Service (110 | 10.9%), Management (76 | 7.5%), Education Instruction & Library (75 | 7.4%), Computers, Engineering & Science (36 | 3.6%), and Education, Arts & Media (26 | 2.6%).
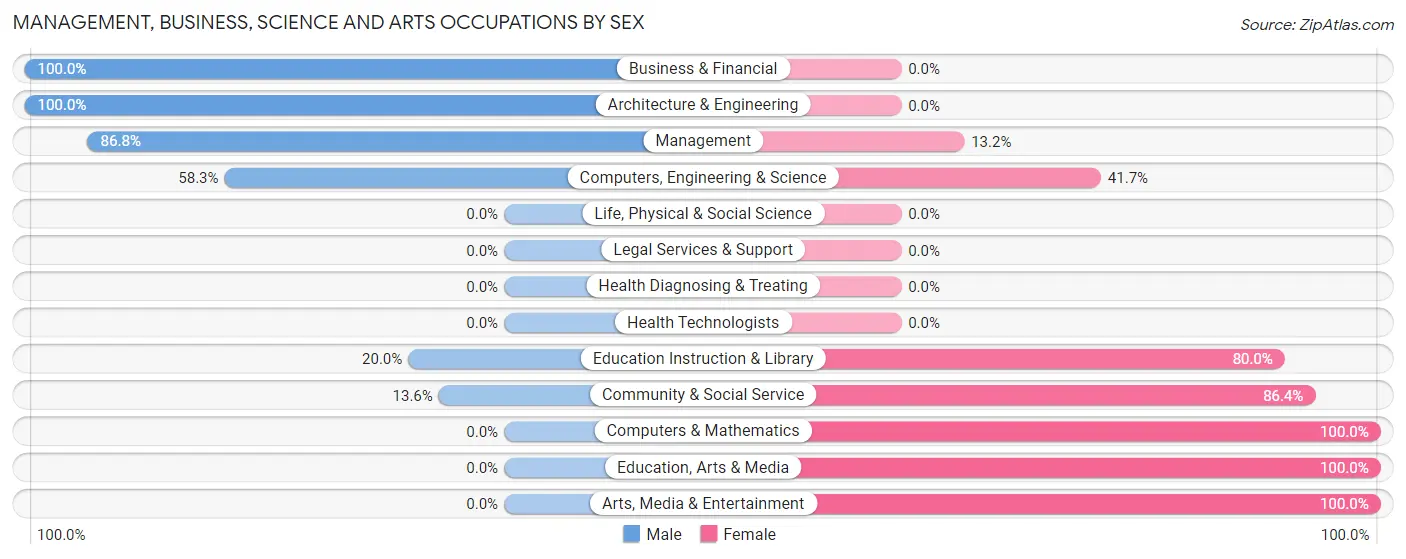
Management, Business, Science and Arts Occupations by Sex
Within the Management, Business, Science and Arts occupations in Romoland, the most male-oriented occupations are Business & Financial (100.0%), Architecture & Engineering (100.0%), and Management (86.8%), while the most female-oriented occupations are Computers & Mathematics (100.0%), Education, Arts & Media (100.0%), and Arts, Media & Entertainment (100.0%).
| Occupation | Male | Female |
| Management | 66 (86.8%) | 10 (13.2%) |
| Business & Financial | 22 (100.0%) | 0 (0.0%) |
| Computers, Engineering & Science | 21 (58.3%) | 15 (41.7%) |
| Computers & Mathematics | 0 (0.0%) | 15 (100.0%) |
| Architecture & Engineering | 21 (100.0%) | 0 (0.0%) |
| Life, Physical & Social Science | 0 (0.0%) | 0 (0.0%) |
| Community & Social Service | 15 (13.6%) | 95 (86.4%) |
| Education, Arts & Media | 0 (0.0%) | 26 (100.0%) |
| Legal Services & Support | 0 (0.0%) | 0 (0.0%) |
| Education Instruction & Library | 15 (20.0%) | 60 (80.0%) |
| Arts, Media & Entertainment | 0 (0.0%) | 9 (100.0%) |
| Health Diagnosing & Treating | 0 (0.0%) | 0 (0.0%) |
| Health Technologists | 0 (0.0%) | 0 (0.0%) |
| Total (Category) | 124 (50.8%) | 120 (49.2%) |
| Total (Overall) | 544 (53.9%) | 466 (46.1%) |
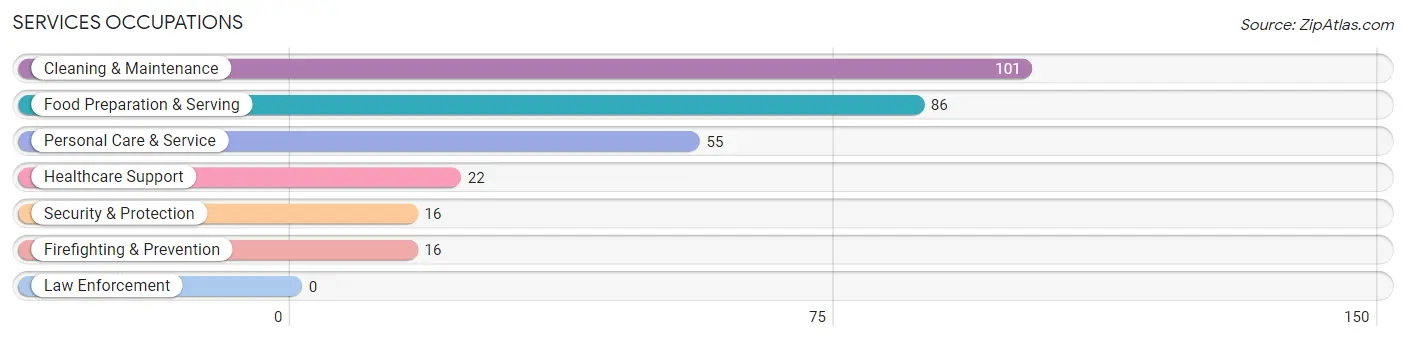
Services Occupations
The most common Services occupations in Romoland are Cleaning & Maintenance (101 | 10.0%), Food Preparation & Serving (86 | 8.5%), Personal Care & Service (55 | 5.4%), Healthcare Support (22 | 2.2%), and Security & Protection (16 | 1.6%).
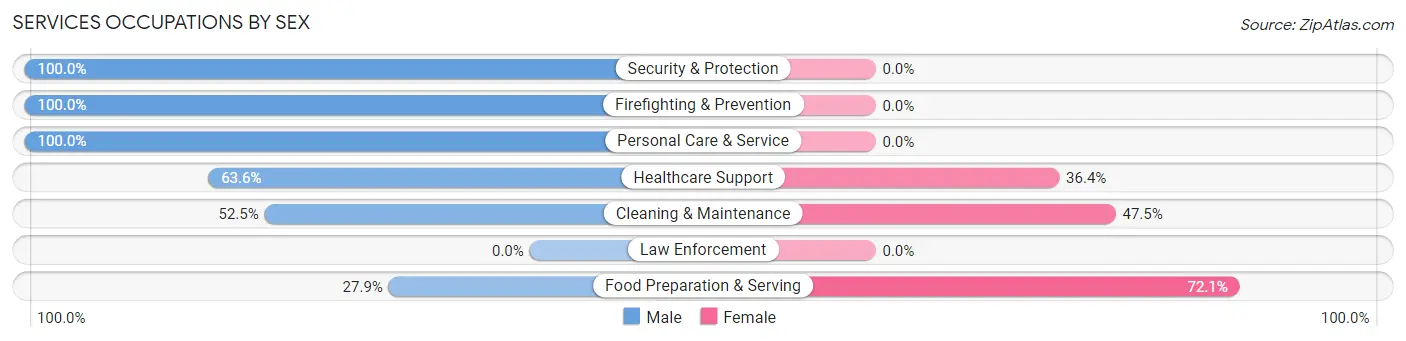
Services Occupations by Sex
Within the Services occupations in Romoland, the most male-oriented occupations are Security & Protection (100.0%), Firefighting & Prevention (100.0%), and Personal Care & Service (100.0%), while the most female-oriented occupations are Food Preparation & Serving (72.1%), Cleaning & Maintenance (47.5%), and Healthcare Support (36.4%).
| Occupation | Male | Female |
| Healthcare Support | 14 (63.6%) | 8 (36.4%) |
| Security & Protection | 16 (100.0%) | 0 (0.0%) |
| Firefighting & Prevention | 16 (100.0%) | 0 (0.0%) |
| Law Enforcement | 0 (0.0%) | 0 (0.0%) |
| Food Preparation & Serving | 24 (27.9%) | 62 (72.1%) |
| Cleaning & Maintenance | 53 (52.5%) | 48 (47.5%) |
| Personal Care & Service | 55 (100.0%) | 0 (0.0%) |
| Total (Category) | 162 (57.9%) | 118 (42.1%) |
| Total (Overall) | 544 (53.9%) | 466 (46.1%) |
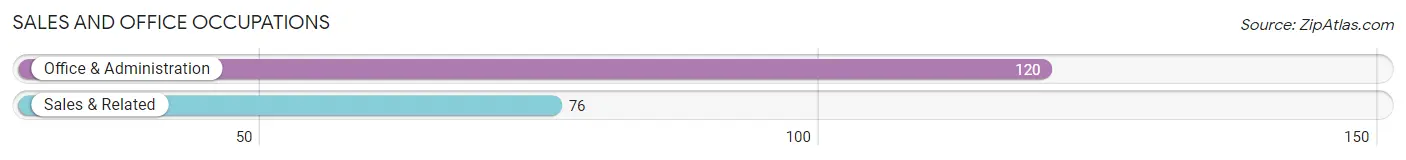
Sales and Office Occupations
The most common Sales and Office occupations in Romoland are Office & Administration (120 | 11.9%), and Sales & Related (76 | 7.5%).
Sales and Office Occupations by Sex
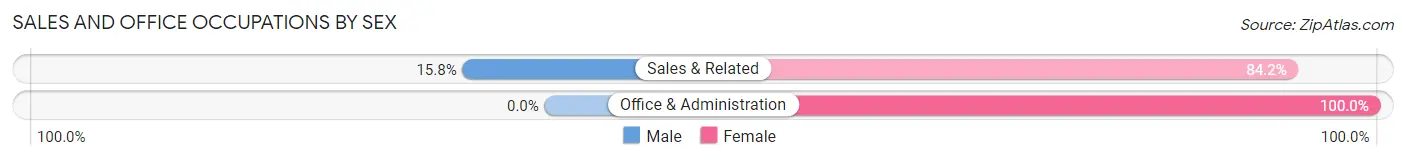
| Occupation | Male | Female |
| Sales & Related | 12 (15.8%) | 64 (84.2%) |
| Office & Administration | 0 (0.0%) | 120 (100.0%) |
| Total (Category) | 12 (6.1%) | 184 (93.9%) |
| Total (Overall) | 544 (53.9%) | 466 (46.1%) |
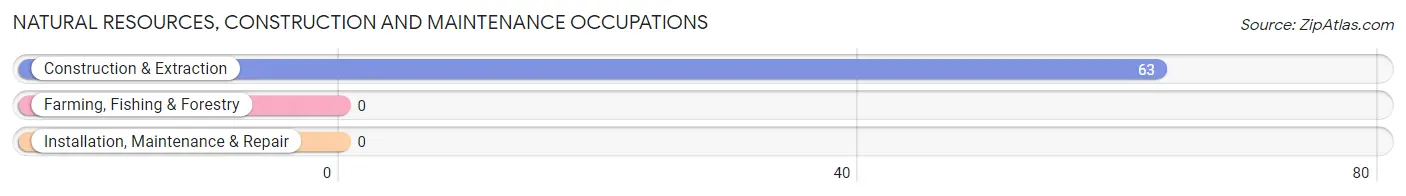
Natural Resources, Construction and Maintenance Occupations
The most common Natural Resources, Construction and Maintenance occupations in Romoland are , and Construction & Extraction (63 | 6.2%).
Natural Resources, Construction and Maintenance Occupations by Sex
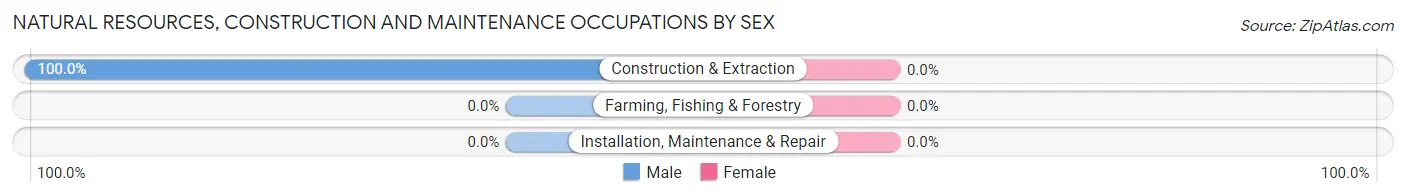
| Occupation | Male | Female |
| Farming, Fishing & Forestry | 0 (0.0%) | 0 (0.0%) |
| Construction & Extraction | 63 (100.0%) | 0 (0.0%) |
| Installation, Maintenance & Repair | 0 (0.0%) | 0 (0.0%) |
| Total (Category) | 63 (100.0%) | 0 (0.0%) |
| Total (Overall) | 544 (53.9%) | 466 (46.1%) |
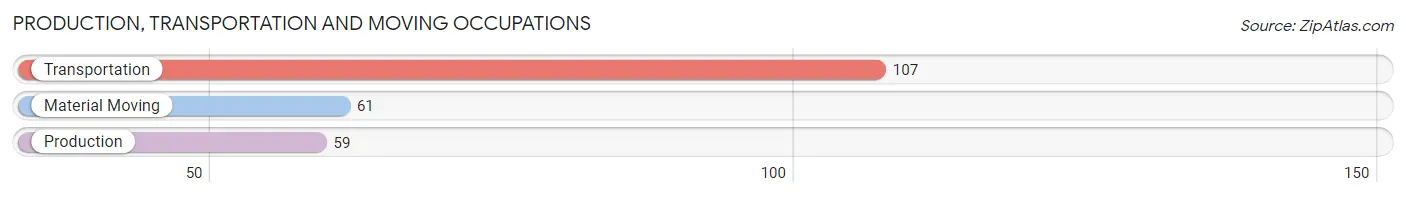
Production, Transportation and Moving Occupations
The most common Production, Transportation and Moving occupations in Romoland are Transportation (107 | 10.6%), Material Moving (61 | 6.0%), and Production (59 | 5.8%).
Production, Transportation and Moving Occupations by Sex
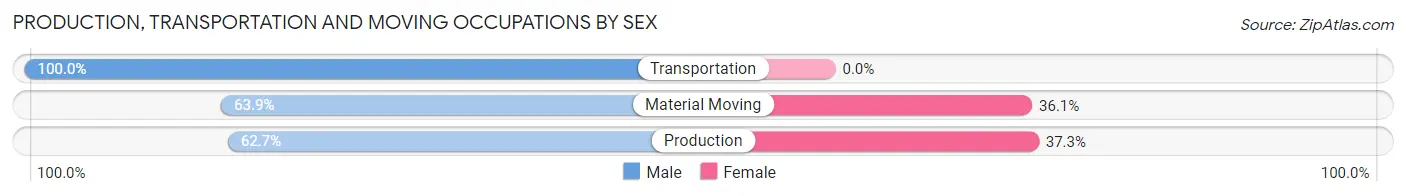
| Occupation | Male | Female |
| Production | 37 (62.7%) | 22 (37.3%) |
| Transportation | 107 (100.0%) | 0 (0.0%) |
| Material Moving | 39 (63.9%) | 22 (36.1%) |
| Total (Category) | 183 (80.6%) | 44 (19.4%) |
| Total (Overall) | 544 (53.9%) | 466 (46.1%) |
Employment Industries by Sex in Romoland
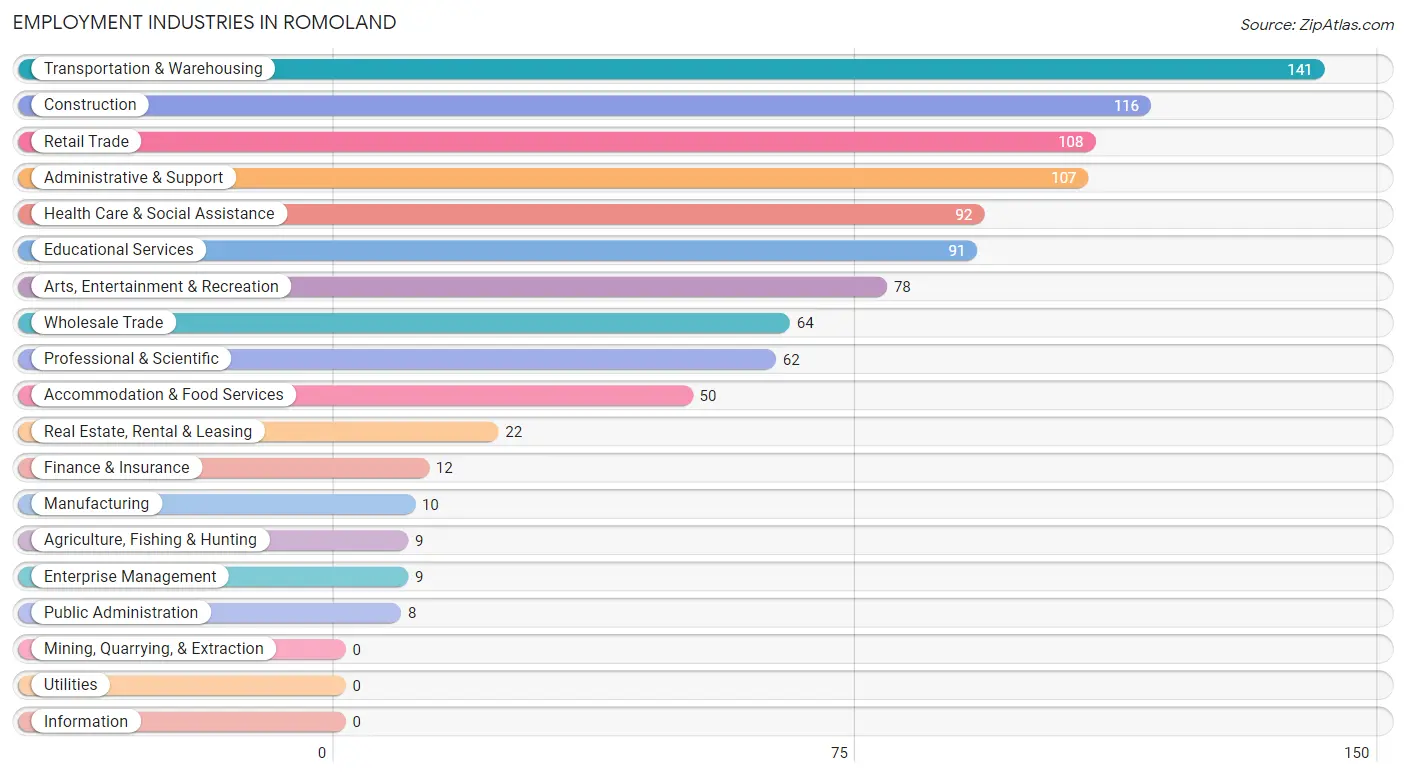
Employment Industries in Romoland
The major employment industries in Romoland include Transportation & Warehousing (141 | 14.0%), Construction (116 | 11.5%), Retail Trade (108 | 10.7%), Administrative & Support (107 | 10.6%), and Health Care & Social Assistance (92 | 9.1%).
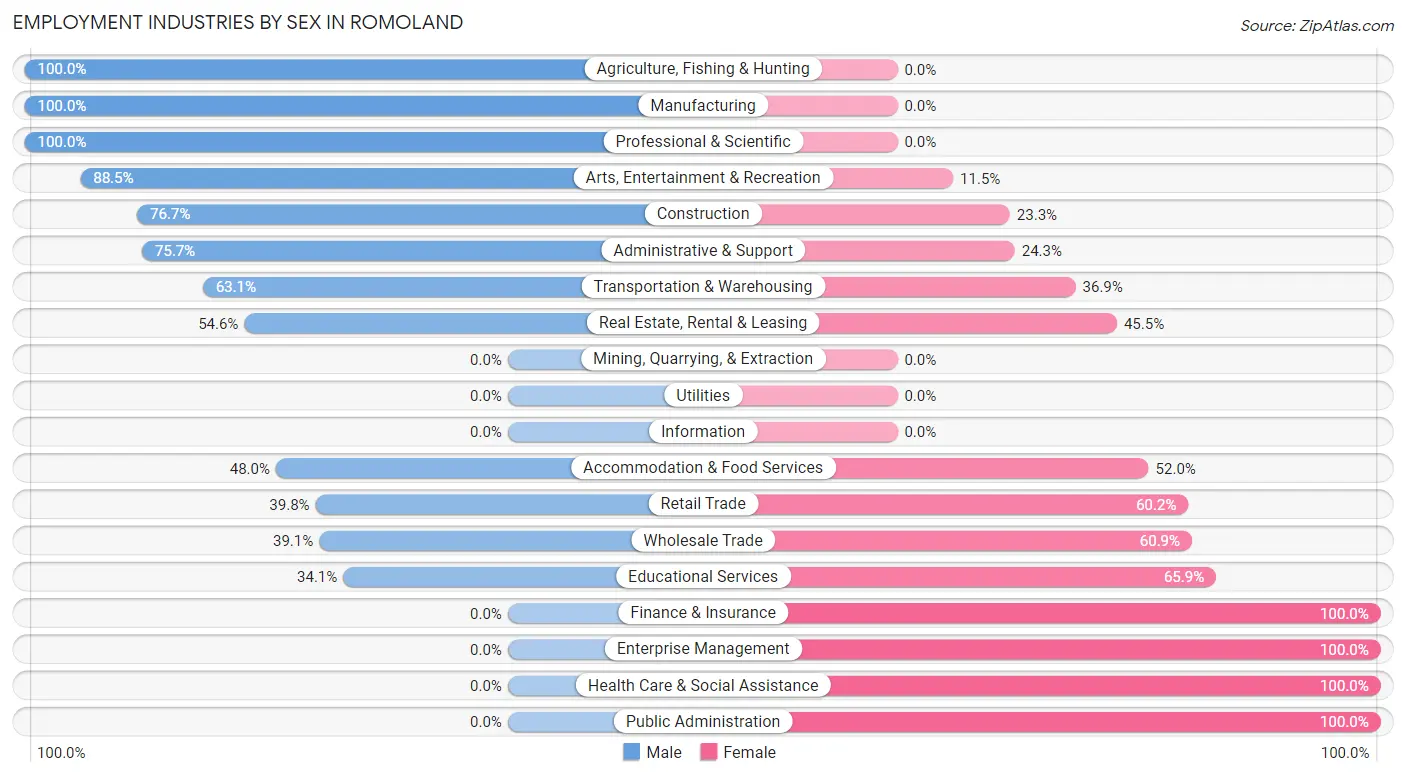
Employment Industries by Sex in Romoland
The Romoland industries that see more men than women are Agriculture, Fishing & Hunting (100.0%), Manufacturing (100.0%), and Professional & Scientific (100.0%), whereas the industries that tend to have a higher number of women are Finance & Insurance (100.0%), Enterprise Management (100.0%), and Health Care & Social Assistance (100.0%).
| Industry | Male | Female |
| Agriculture, Fishing & Hunting | 9 (100.0%) | 0 (0.0%) |
| Mining, Quarrying, & Extraction | 0 (0.0%) | 0 (0.0%) |
| Construction | 89 (76.7%) | 27 (23.3%) |
| Manufacturing | 10 (100.0%) | 0 (0.0%) |
| Wholesale Trade | 25 (39.1%) | 39 (60.9%) |
| Retail Trade | 43 (39.8%) | 65 (60.2%) |
| Transportation & Warehousing | 89 (63.1%) | 52 (36.9%) |
| Utilities | 0 (0.0%) | 0 (0.0%) |
| Information | 0 (0.0%) | 0 (0.0%) |
| Finance & Insurance | 0 (0.0%) | 12 (100.0%) |
| Real Estate, Rental & Leasing | 12 (54.5%) | 10 (45.5%) |
| Professional & Scientific | 62 (100.0%) | 0 (0.0%) |
| Enterprise Management | 0 (0.0%) | 9 (100.0%) |
| Administrative & Support | 81 (75.7%) | 26 (24.3%) |
| Educational Services | 31 (34.1%) | 60 (65.9%) |
| Health Care & Social Assistance | 0 (0.0%) | 92 (100.0%) |
| Arts, Entertainment & Recreation | 69 (88.5%) | 9 (11.5%) |
| Accommodation & Food Services | 24 (48.0%) | 26 (52.0%) |
| Public Administration | 0 (0.0%) | 8 (100.0%) |
| Total | 544 (53.9%) | 466 (46.1%) |
Education in Romoland
School Enrollment in Romoland
The most common levels of schooling among the 1,033 students in Romoland are elementary school (275 | 26.6%), high school (249 | 24.1%), and middle school (203 | 19.7%).
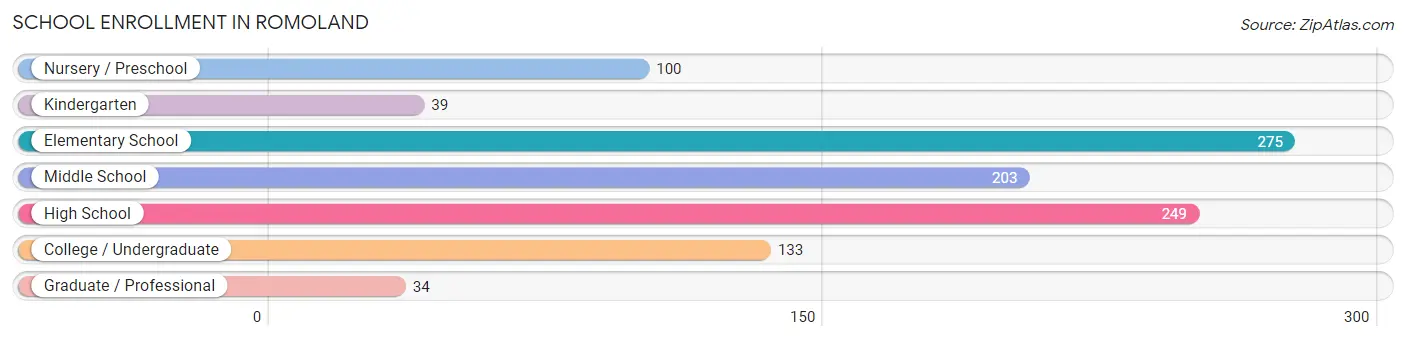
| School Level | # Students | % Students |
| Nursery / Preschool | 100 | 9.7% |
| Kindergarten | 39 | 3.8% |
| Elementary School | 275 | 26.6% |
| Middle School | 203 | 19.7% |
| High School | 249 | 24.1% |
| College / Undergraduate | 133 | 12.9% |
| Graduate / Professional | 34 | 3.3% |
| Total | 1,033 | 100.0% |
School Enrollment by Age by Funding Source in Romoland
Out of a total of 1,033 students who are enrolled in schools in Romoland, 106 (10.3%) attend a private institution, while the remaining 927 (89.7%) are enrolled in public schools. The age group of 25 to 34 year olds has the highest likelihood of being enrolled in private schools, with 12 (41.4% in the age bracket) enrolled. Conversely, the age group of 3 to 4 year olds has the lowest likelihood of being enrolled in a private school, with 26 (100.0% in the age bracket) attending a public institution.
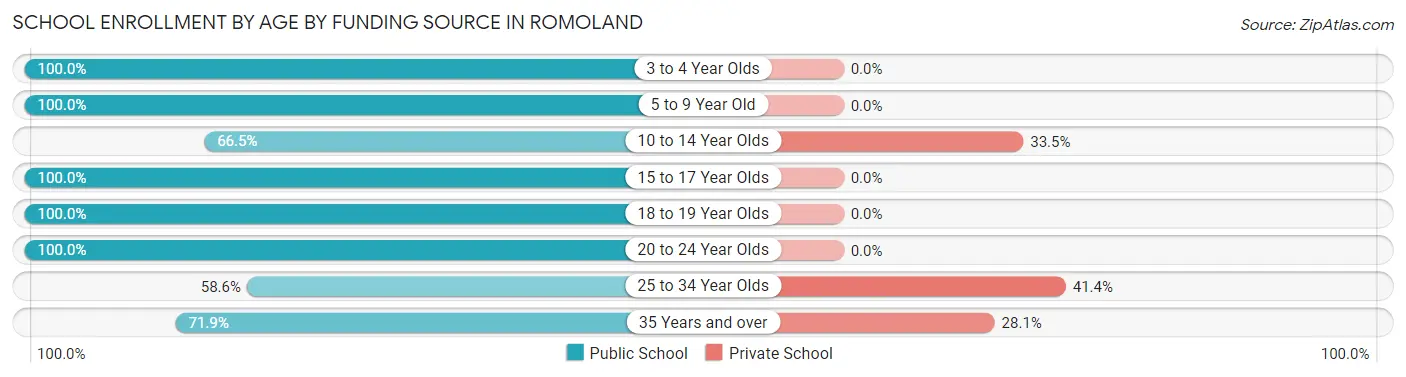
| Age Bracket | Public School | Private School |
| 3 to 4 Year Olds | 26 (100.0%) | 0 (0.0%) |
| 5 to 9 Year Old | 388 (100.0%) | 0 (0.0%) |
| 10 to 14 Year Olds | 169 (66.5%) | 85 (33.5%) |
| 15 to 17 Year Olds | 198 (100.0%) | 0 (0.0%) |
| 18 to 19 Year Olds | 67 (100.0%) | 0 (0.0%) |
| 20 to 24 Year Olds | 39 (100.0%) | 0 (0.0%) |
| 25 to 34 Year Olds | 17 (58.6%) | 12 (41.4%) |
| 35 Years and over | 23 (71.9%) | 9 (28.1%) |
| Total | 927 (89.7%) | 106 (10.3%) |
Educational Attainment by Field of Study in Romoland
Psychology (23 | 16.6%), business (22 | 15.8%), liberal arts & history (22 | 15.8%), literature & languages (15 | 10.8%), and social sciences (13 | 9.3%) are the most common fields of study among 139 individuals in Romoland who have obtained a bachelor's degree or higher.
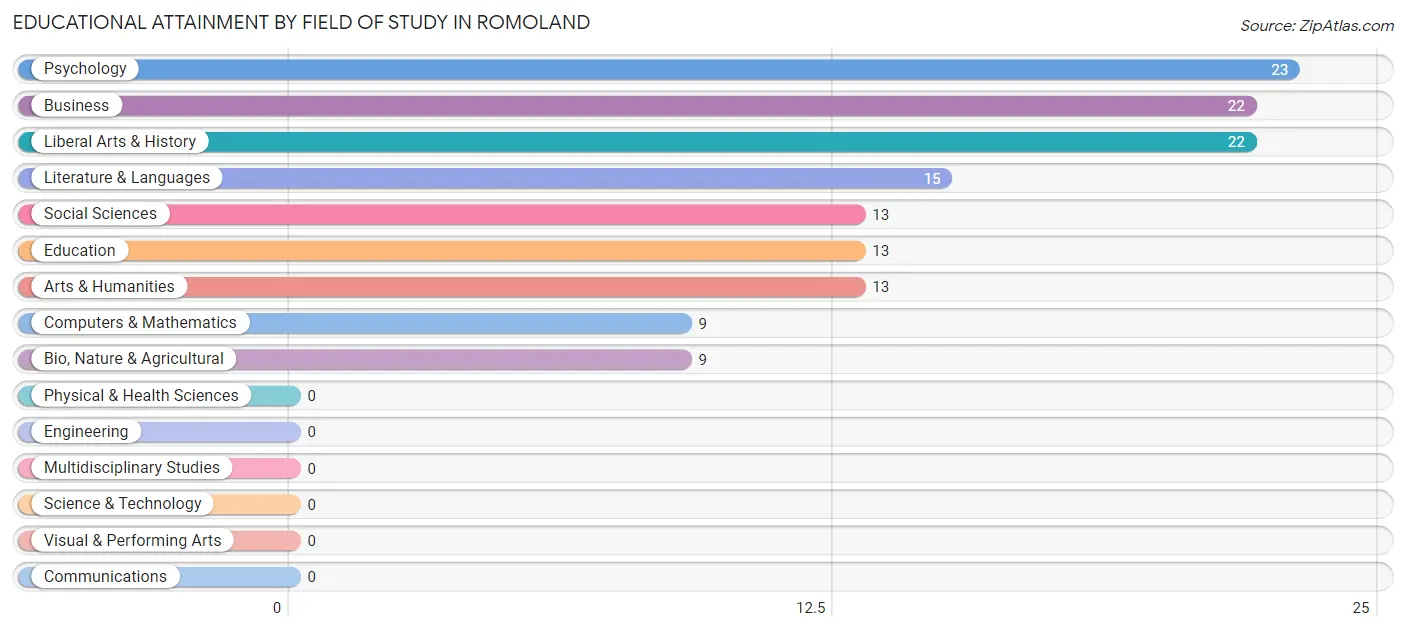
| Field of Study | # Graduates | % Graduates |
| Computers & Mathematics | 9 | 6.5% |
| Bio, Nature & Agricultural | 9 | 6.5% |
| Physical & Health Sciences | 0 | 0.0% |
| Psychology | 23 | 16.6% |
| Social Sciences | 13 | 9.3% |
| Engineering | 0 | 0.0% |
| Multidisciplinary Studies | 0 | 0.0% |
| Science & Technology | 0 | 0.0% |
| Business | 22 | 15.8% |
| Education | 13 | 9.3% |
| Literature & Languages | 15 | 10.8% |
| Liberal Arts & History | 22 | 15.8% |
| Visual & Performing Arts | 0 | 0.0% |
| Communications | 0 | 0.0% |
| Arts & Humanities | 13 | 9.3% |
| Total | 139 | 100.0% |
Transportation & Commute in Romoland
Vehicle Availability by Sex in Romoland
The most prevalent vehicle ownership categories in Romoland are males with 5 or more vehicles (217, accounting for 39.9%) and females with 5 or more vehicles (125, making up 46.6%).
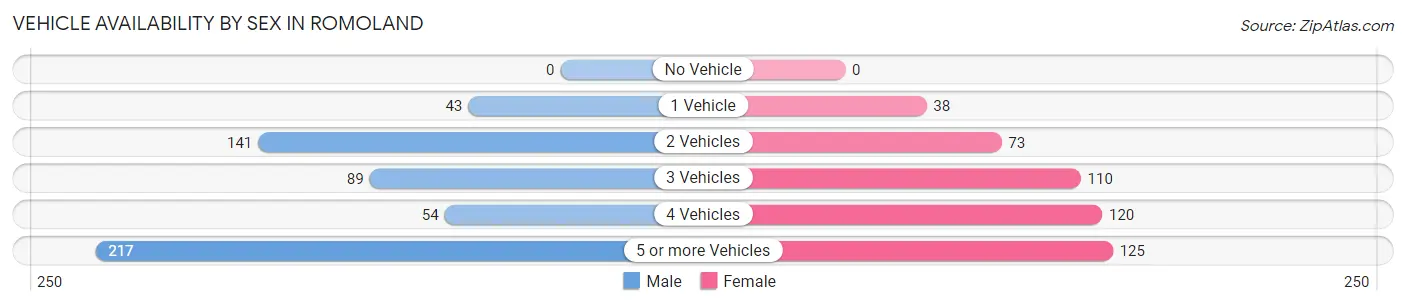
| Vehicles Available | Male | Female |
| No Vehicle | 0 (0.0%) | 0 (0.0%) |
| 1 Vehicle | 43 (7.9%) | 38 (8.2%) |
| 2 Vehicles | 141 (25.9%) | 73 (15.7%) |
| 3 Vehicles | 89 (16.4%) | 110 (23.6%) |
| 4 Vehicles | 54 (9.9%) | 120 (25.8%) |
| 5 or more Vehicles | 217 (39.9%) | 125 (26.8%) |
| Total | 544 (100.0%) | 466 (100.0%) |
Commute Time in Romoland
The most frequently occuring commute durations in Romoland are 15 to 19 minutes (168 commuters, 18.2%), 45 to 59 minutes (156 commuters, 16.9%), and 60 to 89 minutes (130 commuters, 14.1%).
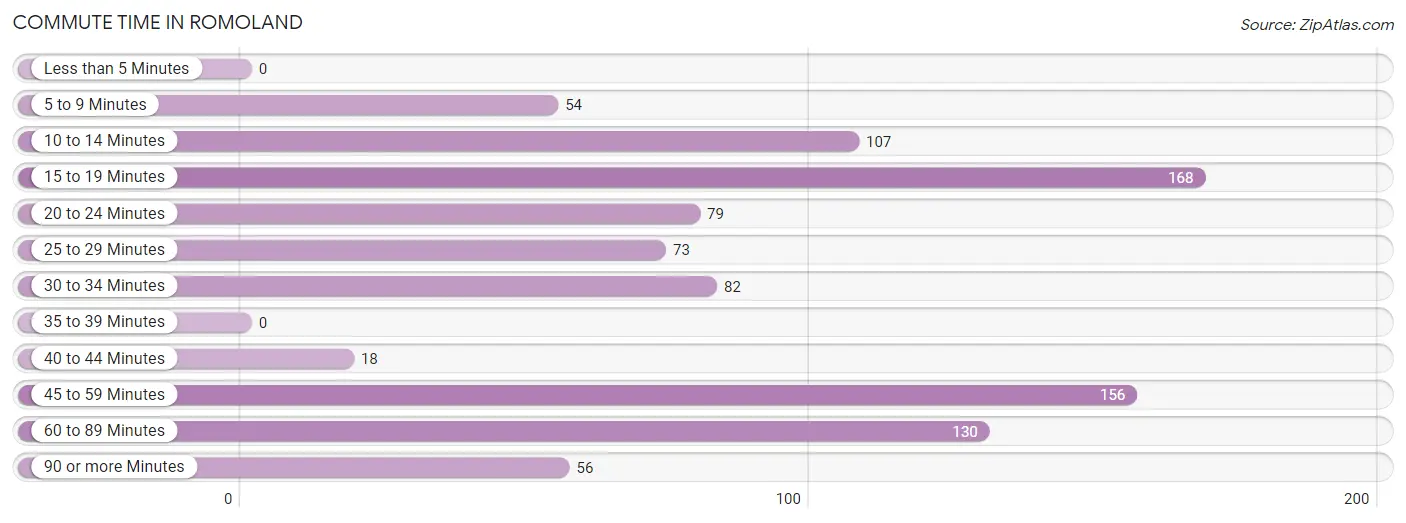
| Commute Time | # Commuters | % Commuters |
| Less than 5 Minutes | 0 | 0.0% |
| 5 to 9 Minutes | 54 | 5.9% |
| 10 to 14 Minutes | 107 | 11.6% |
| 15 to 19 Minutes | 168 | 18.2% |
| 20 to 24 Minutes | 79 | 8.6% |
| 25 to 29 Minutes | 73 | 7.9% |
| 30 to 34 Minutes | 82 | 8.9% |
| 35 to 39 Minutes | 0 | 0.0% |
| 40 to 44 Minutes | 18 | 1.9% |
| 45 to 59 Minutes | 156 | 16.9% |
| 60 to 89 Minutes | 130 | 14.1% |
| 90 or more Minutes | 56 | 6.1% |
Commute Time by Sex in Romoland
The most common commute times in Romoland are 60 to 89 minutes (121 commuters, 23.6%) for males and 15 to 19 minutes (101 commuters, 24.6%) for females.
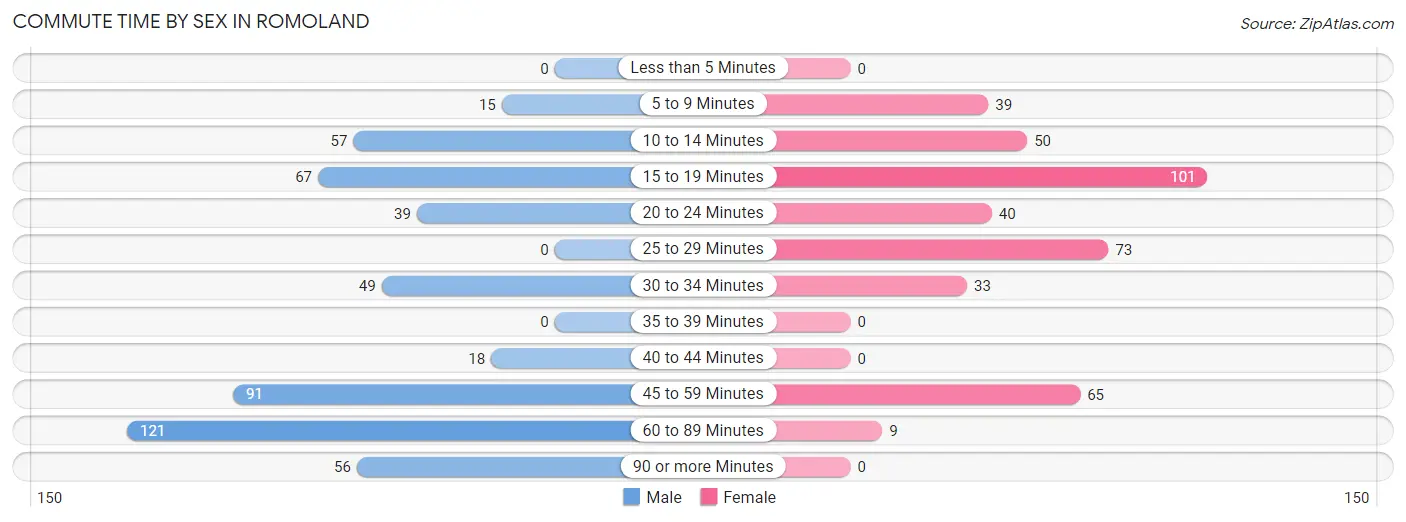
| Commute Time | Male | Female |
| Less than 5 Minutes | 0 (0.0%) | 0 (0.0%) |
| 5 to 9 Minutes | 15 (2.9%) | 39 (9.5%) |
| 10 to 14 Minutes | 57 (11.1%) | 50 (12.2%) |
| 15 to 19 Minutes | 67 (13.1%) | 101 (24.6%) |
| 20 to 24 Minutes | 39 (7.6%) | 40 (9.8%) |
| 25 to 29 Minutes | 0 (0.0%) | 73 (17.8%) |
| 30 to 34 Minutes | 49 (9.6%) | 33 (8.1%) |
| 35 to 39 Minutes | 0 (0.0%) | 0 (0.0%) |
| 40 to 44 Minutes | 18 (3.5%) | 0 (0.0%) |
| 45 to 59 Minutes | 91 (17.7%) | 65 (15.9%) |
| 60 to 89 Minutes | 121 (23.6%) | 9 (2.2%) |
| 90 or more Minutes | 56 (10.9%) | 0 (0.0%) |
Time of Departure to Work by Sex in Romoland
The most frequent times of departure to work in Romoland are 5:00 AM to 5:29 AM (94, 18.3%) for males and 12:00 AM to 4:59 AM (128, 31.2%) for females.
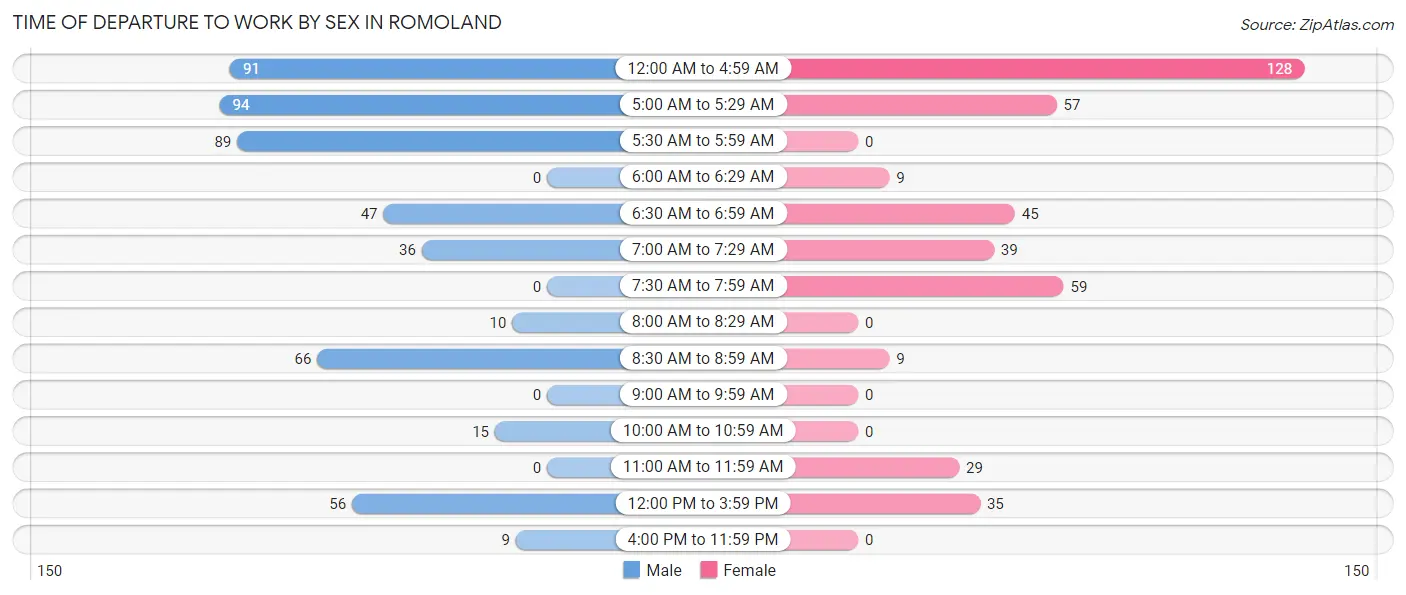
| Time of Departure | Male | Female |
| 12:00 AM to 4:59 AM | 91 (17.7%) | 128 (31.2%) |
| 5:00 AM to 5:29 AM | 94 (18.3%) | 57 (13.9%) |
| 5:30 AM to 5:59 AM | 89 (17.3%) | 0 (0.0%) |
| 6:00 AM to 6:29 AM | 0 (0.0%) | 9 (2.2%) |
| 6:30 AM to 6:59 AM | 47 (9.2%) | 45 (11.0%) |
| 7:00 AM to 7:29 AM | 36 (7.0%) | 39 (9.5%) |
| 7:30 AM to 7:59 AM | 0 (0.0%) | 59 (14.4%) |
| 8:00 AM to 8:29 AM | 10 (1.9%) | 0 (0.0%) |
| 8:30 AM to 8:59 AM | 66 (12.9%) | 9 (2.2%) |
| 9:00 AM to 9:59 AM | 0 (0.0%) | 0 (0.0%) |
| 10:00 AM to 10:59 AM | 15 (2.9%) | 0 (0.0%) |
| 11:00 AM to 11:59 AM | 0 (0.0%) | 29 (7.1%) |
| 12:00 PM to 3:59 PM | 56 (10.9%) | 35 (8.5%) |
| 4:00 PM to 11:59 PM | 9 (1.8%) | 0 (0.0%) |
| Total | 513 (100.0%) | 410 (100.0%) |
Housing Occupancy in Romoland
Occupancy by Ownership in Romoland
Of the total 592 dwellings in Romoland, owner-occupied units account for 457 (77.2%), while renter-occupied units make up 135 (22.8%).
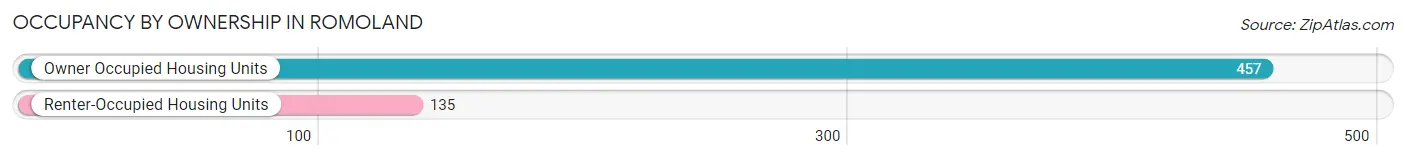
| Occupancy | # Housing Units | % Housing Units |
| Owner Occupied Housing Units | 457 | 77.2% |
| Renter-Occupied Housing Units | 135 | 22.8% |
| Total Occupied Housing Units | 592 | 100.0% |
Occupancy by Household Size in Romoland
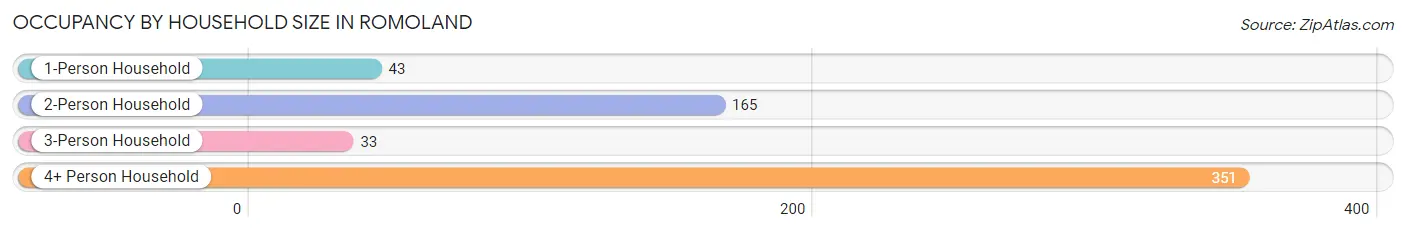
| Household Size | # Housing Units | % Housing Units |
| 1-Person Household | 43 | 7.3% |
| 2-Person Household | 165 | 27.9% |
| 3-Person Household | 33 | 5.6% |
| 4+ Person Household | 351 | 59.3% |
| Total Housing Units | 592 | 100.0% |
Occupancy by Ownership by Household Size in Romoland
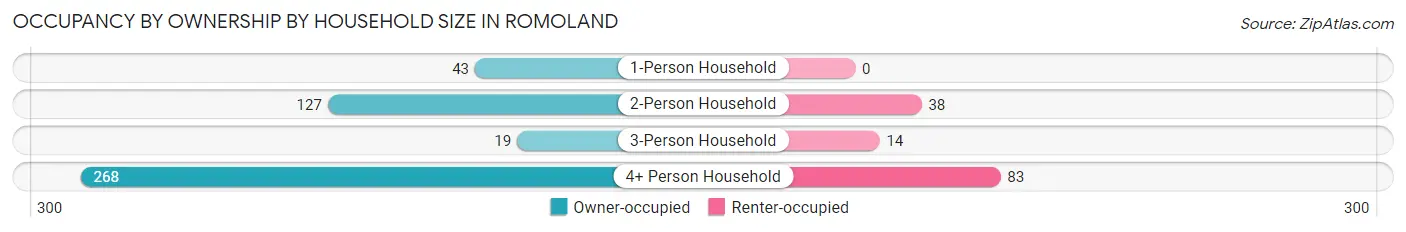
| Household Size | Owner-occupied | Renter-occupied |
| 1-Person Household | 43 (100.0%) | 0 (0.0%) |
| 2-Person Household | 127 (77.0%) | 38 (23.0%) |
| 3-Person Household | 19 (57.6%) | 14 (42.4%) |
| 4+ Person Household | 268 (76.3%) | 83 (23.6%) |
| Total Housing Units | 457 (77.2%) | 135 (22.8%) |
Occupancy by Educational Attainment in Romoland
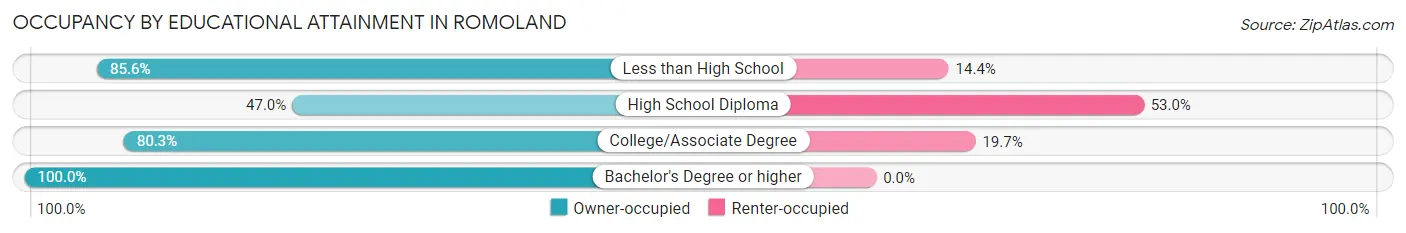
| Household Size | Owner-occupied | Renter-occupied |
| Less than High School | 143 (85.6%) | 24 (14.4%) |
| High School Diploma | 54 (47.0%) | 61 (53.0%) |
| College/Associate Degree | 204 (80.3%) | 50 (19.7%) |
| Bachelor's Degree or higher | 56 (100.0%) | 0 (0.0%) |
Occupancy by Age of Householder in Romoland
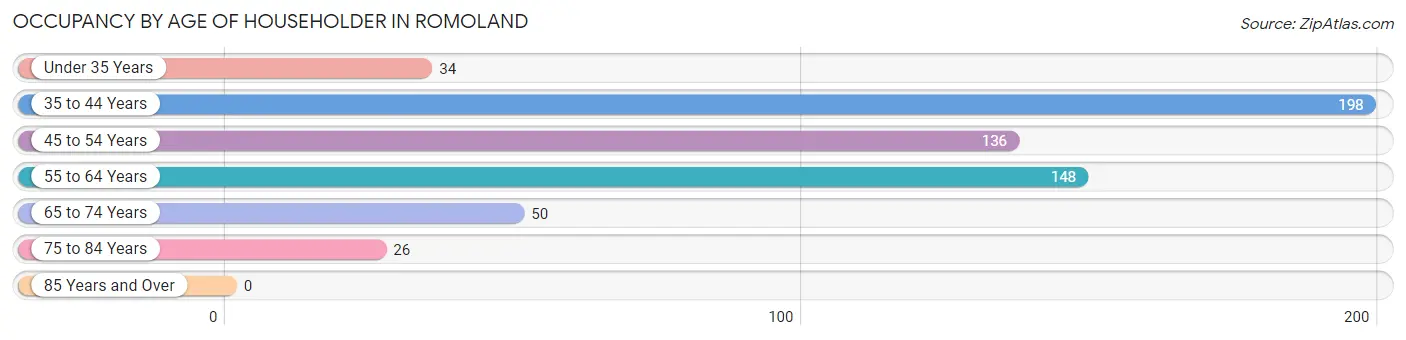
| Age Bracket | # Households | % Households |
| Under 35 Years | 34 | 5.7% |
| 35 to 44 Years | 198 | 33.5% |
| 45 to 54 Years | 136 | 23.0% |
| 55 to 64 Years | 148 | 25.0% |
| 65 to 74 Years | 50 | 8.5% |
| 75 to 84 Years | 26 | 4.4% |
| 85 Years and Over | 0 | 0.0% |
| Total | 592 | 100.0% |
Housing Finances in Romoland
Median Income by Occupancy in Romoland
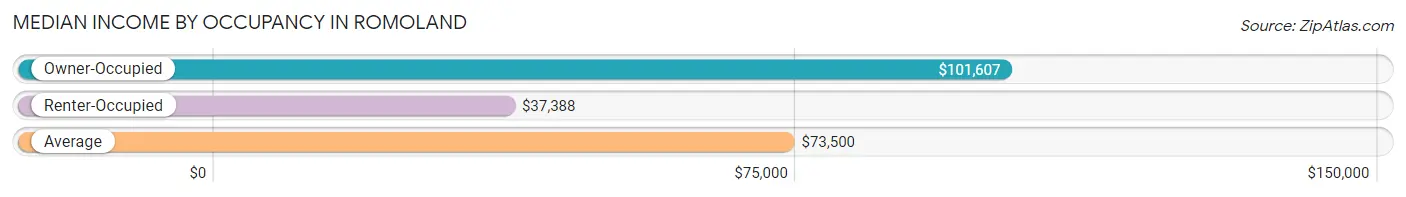
| Occupancy Type | # Households | Median Income |
| Owner-Occupied | 457 (77.2%) | $101,607 |
| Renter-Occupied | 135 (22.8%) | $37,388 |
| Average | 592 (100.0%) | $73,500 |
Occupancy by Householder Income Bracket in Romoland
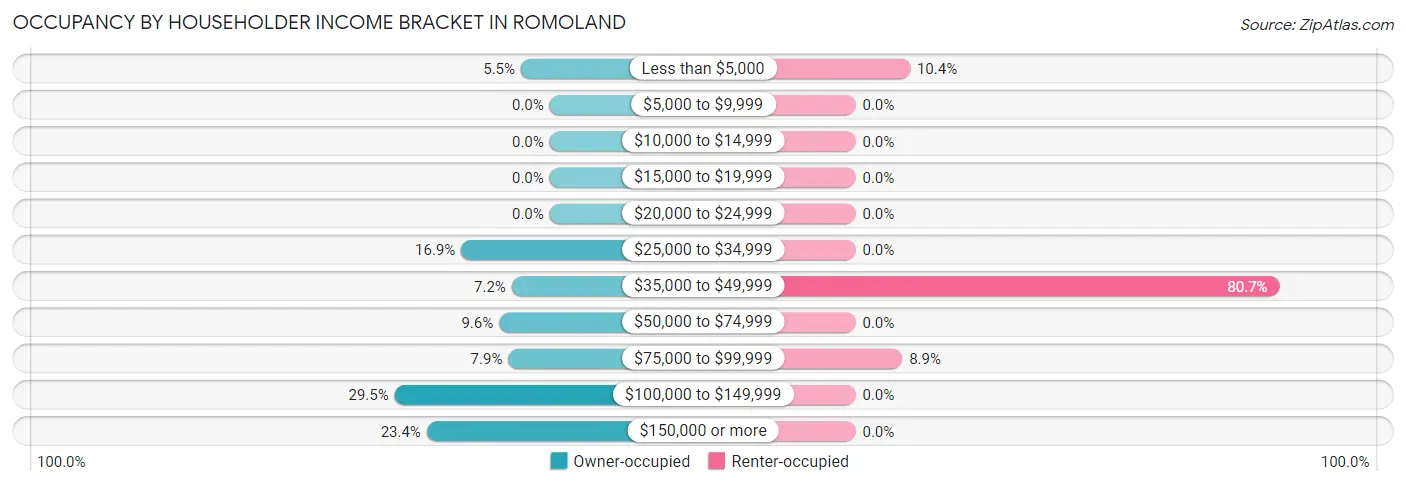
| Income Bracket | Owner-occupied | Renter-occupied |
| Less than $5,000 | 25 (5.5%) | 14 (10.4%) |
| $5,000 to $9,999 | 0 (0.0%) | 0 (0.0%) |
| $10,000 to $14,999 | 0 (0.0%) | 0 (0.0%) |
| $15,000 to $19,999 | 0 (0.0%) | 0 (0.0%) |
| $20,000 to $24,999 | 0 (0.0%) | 0 (0.0%) |
| $25,000 to $34,999 | 77 (16.9%) | 0 (0.0%) |
| $35,000 to $49,999 | 33 (7.2%) | 109 (80.7%) |
| $50,000 to $74,999 | 44 (9.6%) | 0 (0.0%) |
| $75,000 to $99,999 | 36 (7.9%) | 12 (8.9%) |
| $100,000 to $149,999 | 135 (29.5%) | 0 (0.0%) |
| $150,000 or more | 107 (23.4%) | 0 (0.0%) |
| Total | 457 (100.0%) | 135 (100.0%) |
Monthly Housing Cost Tiers in Romoland
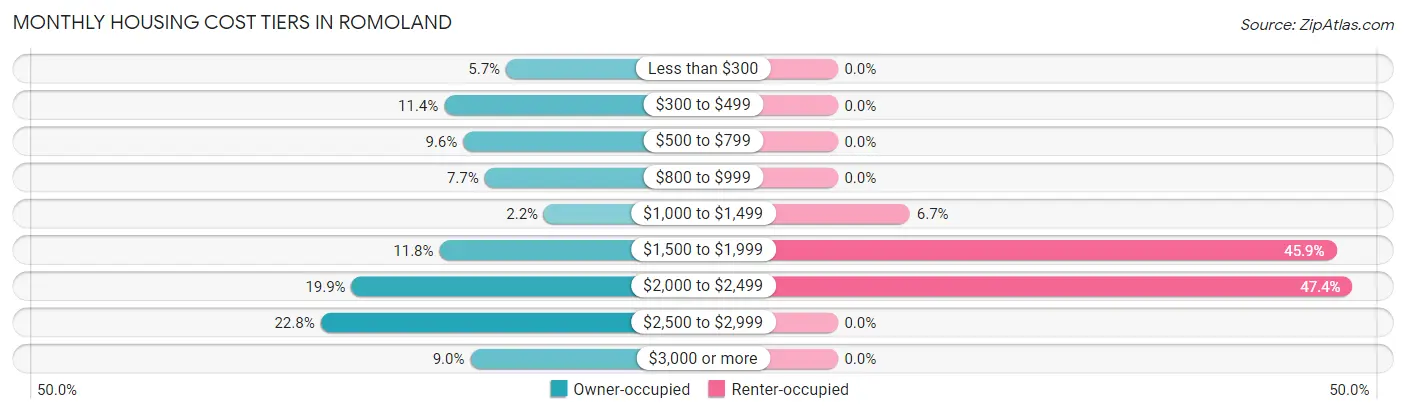
| Monthly Cost | Owner-occupied | Renter-occupied |
| Less than $300 | 26 (5.7%) | 0 (0.0%) |
| $300 to $499 | 52 (11.4%) | 0 (0.0%) |
| $500 to $799 | 44 (9.6%) | 0 (0.0%) |
| $800 to $999 | 35 (7.7%) | 0 (0.0%) |
| $1,000 to $1,499 | 10 (2.2%) | 9 (6.7%) |
| $1,500 to $1,999 | 54 (11.8%) | 62 (45.9%) |
| $2,000 to $2,499 | 91 (19.9%) | 64 (47.4%) |
| $2,500 to $2,999 | 104 (22.8%) | 0 (0.0%) |
| $3,000 or more | 41 (9.0%) | 0 (0.0%) |
| Total | 457 (100.0%) | 135 (100.0%) |
Physical Housing Characteristics in Romoland
Housing Structures in Romoland
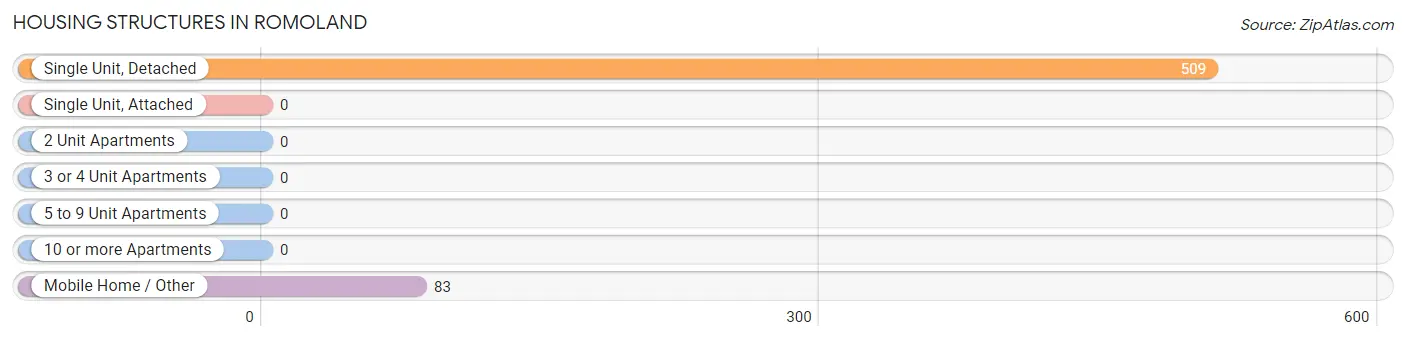
| Structure Type | # Housing Units | % Housing Units |
| Single Unit, Detached | 509 | 86.0% |
| Single Unit, Attached | 0 | 0.0% |
| 2 Unit Apartments | 0 | 0.0% |
| 3 or 4 Unit Apartments | 0 | 0.0% |
| 5 to 9 Unit Apartments | 0 | 0.0% |
| 10 or more Apartments | 0 | 0.0% |
| Mobile Home / Other | 83 | 14.0% |
| Total | 592 | 100.0% |
Housing Structures by Occupancy in Romoland
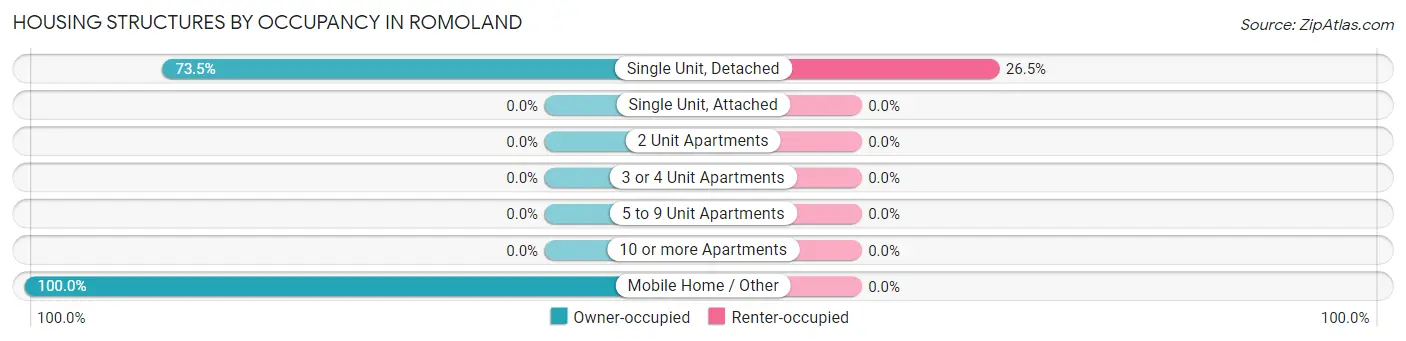
| Structure Type | Owner-occupied | Renter-occupied |
| Single Unit, Detached | 374 (73.5%) | 135 (26.5%) |
| Single Unit, Attached | 0 (0.0%) | 0 (0.0%) |
| 2 Unit Apartments | 0 (0.0%) | 0 (0.0%) |
| 3 or 4 Unit Apartments | 0 (0.0%) | 0 (0.0%) |
| 5 to 9 Unit Apartments | 0 (0.0%) | 0 (0.0%) |
| 10 or more Apartments | 0 (0.0%) | 0 (0.0%) |
| Mobile Home / Other | 83 (100.0%) | 0 (0.0%) |
| Total | 457 (77.2%) | 135 (22.8%) |
Housing Structures by Number of Rooms in Romoland
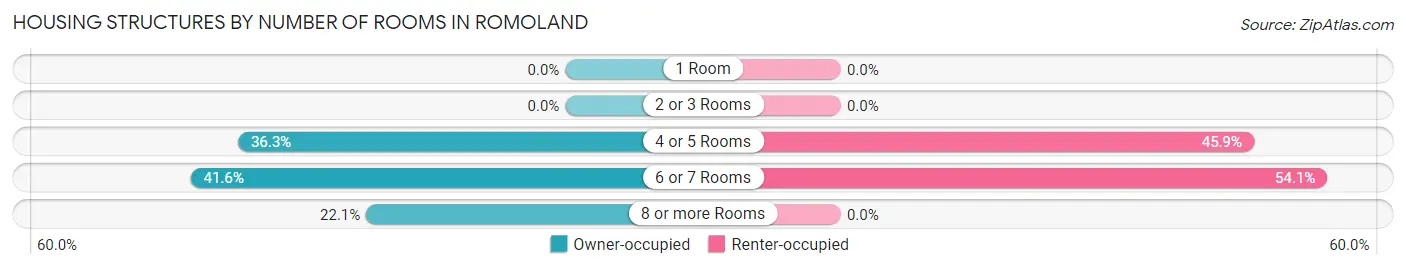
| Number of Rooms | Owner-occupied | Renter-occupied |
| 1 Room | 0 (0.0%) | 0 (0.0%) |
| 2 or 3 Rooms | 0 (0.0%) | 0 (0.0%) |
| 4 or 5 Rooms | 166 (36.3%) | 62 (45.9%) |
| 6 or 7 Rooms | 190 (41.6%) | 73 (54.1%) |
| 8 or more Rooms | 101 (22.1%) | 0 (0.0%) |
| Total | 457 (100.0%) | 135 (100.0%) |
Housing Structure by Heating Type in Romoland
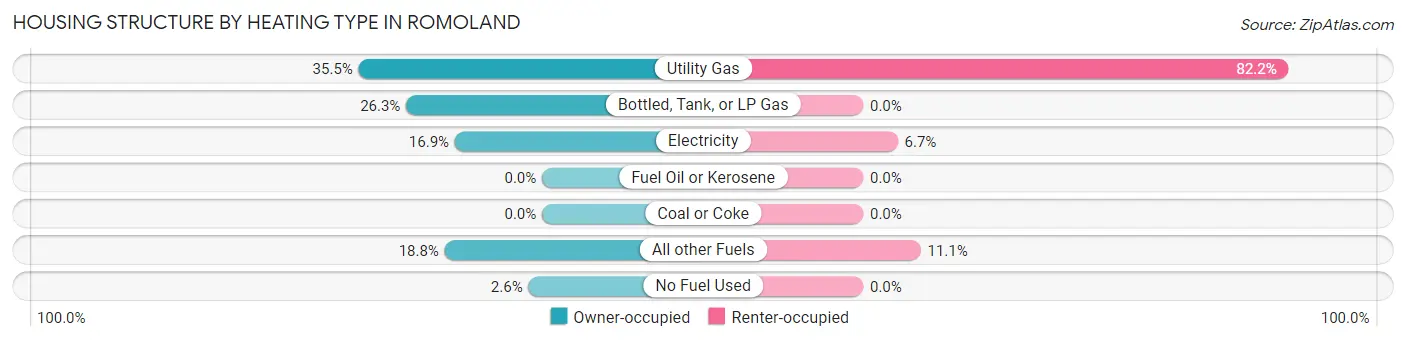
| Heating Type | Owner-occupied | Renter-occupied |
| Utility Gas | 162 (35.4%) | 111 (82.2%) |
| Bottled, Tank, or LP Gas | 120 (26.3%) | 0 (0.0%) |
| Electricity | 77 (16.9%) | 9 (6.7%) |
| Fuel Oil or Kerosene | 0 (0.0%) | 0 (0.0%) |
| Coal or Coke | 0 (0.0%) | 0 (0.0%) |
| All other Fuels | 86 (18.8%) | 15 (11.1%) |
| No Fuel Used | 12 (2.6%) | 0 (0.0%) |
| Total | 457 (100.0%) | 135 (100.0%) |
Household Vehicle Usage in Romoland
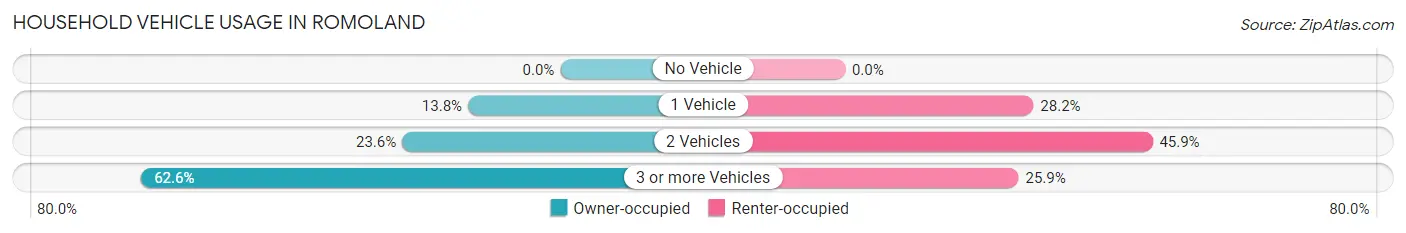
| Vehicles per Household | Owner-occupied | Renter-occupied |
| No Vehicle | 0 (0.0%) | 0 (0.0%) |
| 1 Vehicle | 63 (13.8%) | 38 (28.1%) |
| 2 Vehicles | 108 (23.6%) | 62 (45.9%) |
| 3 or more Vehicles | 286 (62.6%) | 35 (25.9%) |
| Total | 457 (100.0%) | 135 (100.0%) |
Real Estate & Mortgages in Romoland
Real Estate and Mortgage Overview in Romoland
| Characteristic | Without Mortgage | With Mortgage |
| Housing Units | 157 | 300 |
| Median Property Value | $414,600 | $390,400 |
| Median Household Income | $135,125 | $63 |
| Monthly Housing Costs | $505 | $41 |
| Real Estate Taxes | $2,302 | $0 |
Property Value by Mortgage Status in Romoland
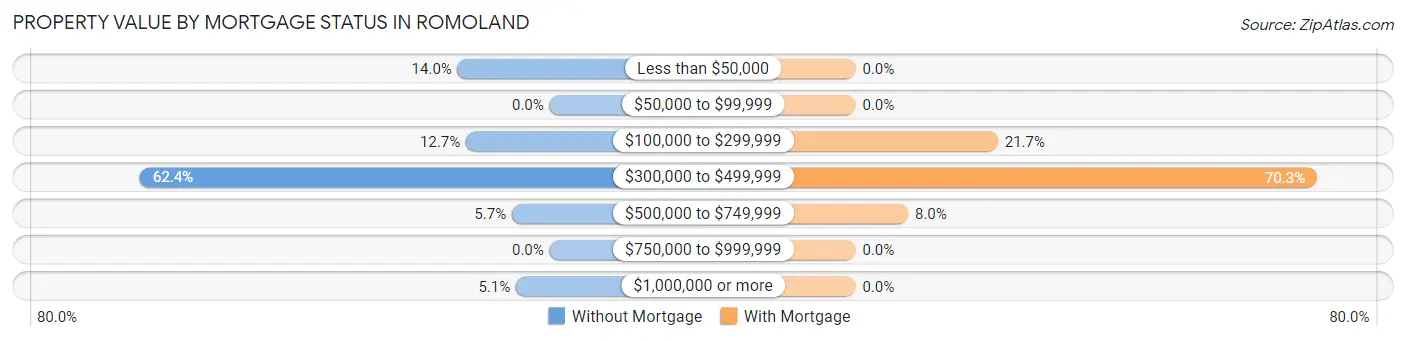
| Property Value | Without Mortgage | With Mortgage |
| Less than $50,000 | 22 (14.0%) | 0 (0.0%) |
| $50,000 to $99,999 | 0 (0.0%) | 0 (0.0%) |
| $100,000 to $299,999 | 20 (12.7%) | 65 (21.7%) |
| $300,000 to $499,999 | 98 (62.4%) | 211 (70.3%) |
| $500,000 to $749,999 | 9 (5.7%) | 24 (8.0%) |
| $750,000 to $999,999 | 0 (0.0%) | 0 (0.0%) |
| $1,000,000 or more | 8 (5.1%) | 0 (0.0%) |
| Total | 157 (100.0%) | 300 (100.0%) |
Household Income by Mortgage Status in Romoland
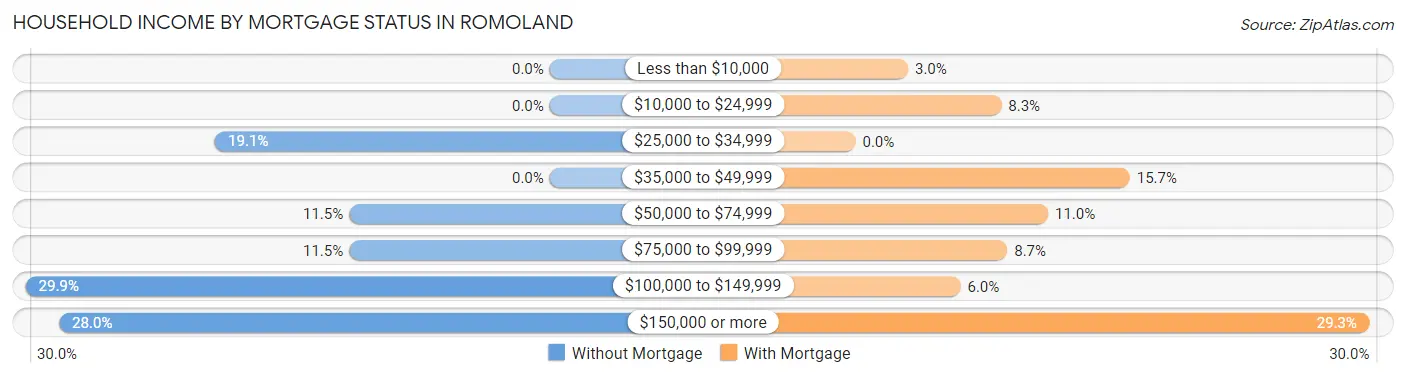
| Household Income | Without Mortgage | With Mortgage |
| Less than $10,000 | 0 (0.0%) | 9 (3.0%) |
| $10,000 to $24,999 | 0 (0.0%) | 25 (8.3%) |
| $25,000 to $34,999 | 30 (19.1%) | 0 (0.0%) |
| $35,000 to $49,999 | 0 (0.0%) | 47 (15.7%) |
| $50,000 to $74,999 | 18 (11.5%) | 33 (11.0%) |
| $75,000 to $99,999 | 18 (11.5%) | 26 (8.7%) |
| $100,000 to $149,999 | 47 (29.9%) | 18 (6.0%) |
| $150,000 or more | 44 (28.0%) | 88 (29.3%) |
| Total | 157 (100.0%) | 300 (100.0%) |
Property Value to Household Income Ratio in Romoland
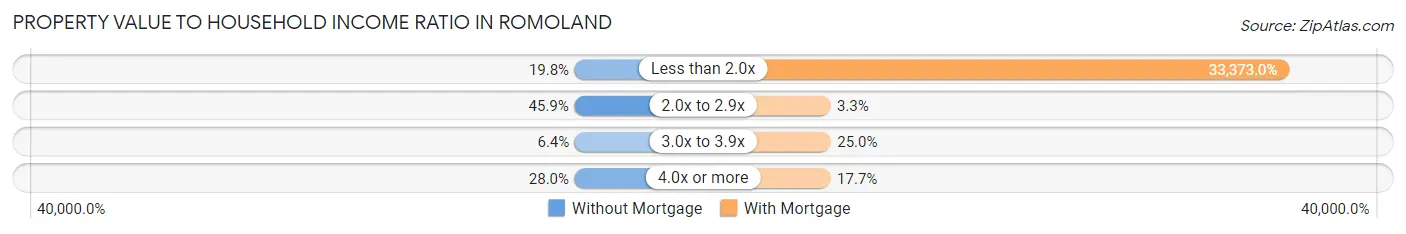
| Value-to-Income Ratio | Without Mortgage | With Mortgage |
| Less than 2.0x | 31 (19.8%) | 100,119 (33,373.0%) |
| 2.0x to 2.9x | 72 (45.9%) | 10 (3.3%) |
| 3.0x to 3.9x | 10 (6.4%) | 75 (25.0%) |
| 4.0x or more | 44 (28.0%) | 53 (17.7%) |
| Total | 157 (100.0%) | 300 (100.0%) |
Real Estate Taxes by Mortgage Status in Romoland
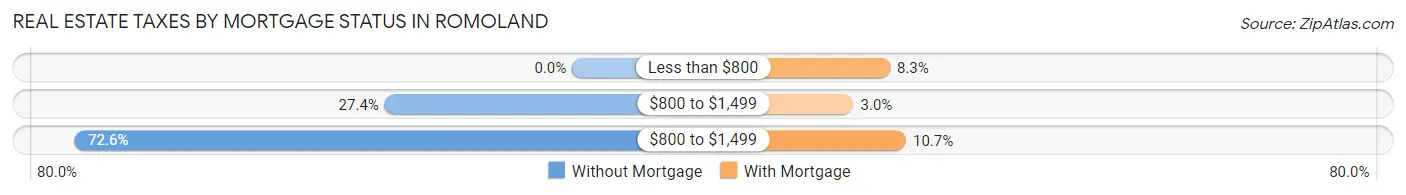
| Property Taxes | Without Mortgage | With Mortgage |
| Less than $800 | 0 (0.0%) | 25 (8.3%) |
| $800 to $1,499 | 43 (27.4%) | 9 (3.0%) |
| $800 to $1,499 | 114 (72.6%) | 32 (10.7%) |
| Total | 157 (100.0%) | 300 (100.0%) |
Health & Disability in Romoland
Health Insurance Coverage by Age in Romoland
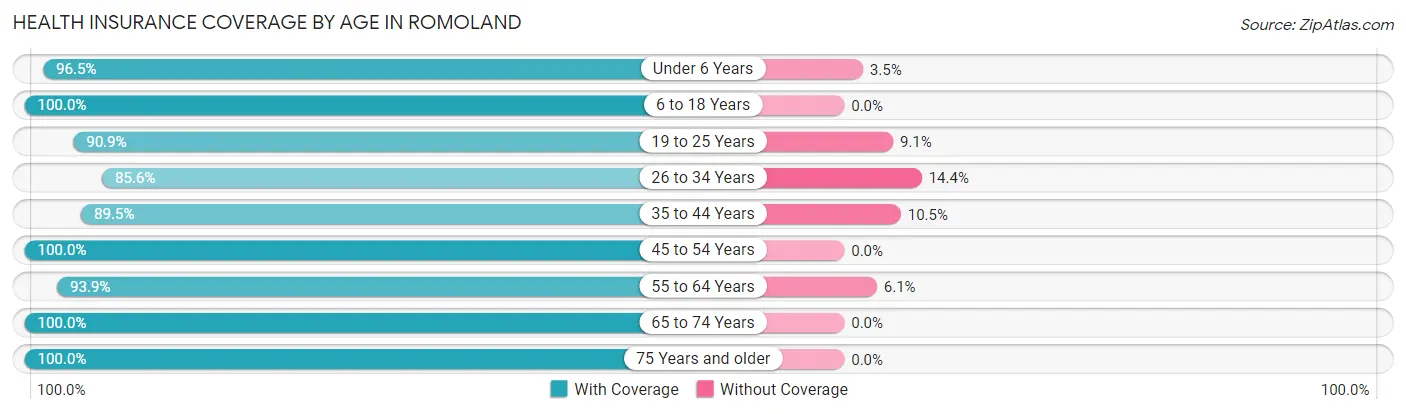
| Age Bracket | With Coverage | Without Coverage |
| Under 6 Years | 278 (96.5%) | 10 (3.5%) |
| 6 to 18 Years | 804 (100.0%) | 0 (0.0%) |
| 19 to 25 Years | 170 (90.9%) | 17 (9.1%) |
| 26 to 34 Years | 320 (85.6%) | 54 (14.4%) |
| 35 to 44 Years | 306 (89.5%) | 36 (10.5%) |
| 45 to 54 Years | 281 (100.0%) | 0 (0.0%) |
| 55 to 64 Years | 263 (93.9%) | 17 (6.1%) |
| 65 to 74 Years | 102 (100.0%) | 0 (0.0%) |
| 75 Years and older | 80 (100.0%) | 0 (0.0%) |
| Total | 2,604 (95.1%) | 134 (4.9%) |
Health Insurance Coverage by Citizenship Status in Romoland
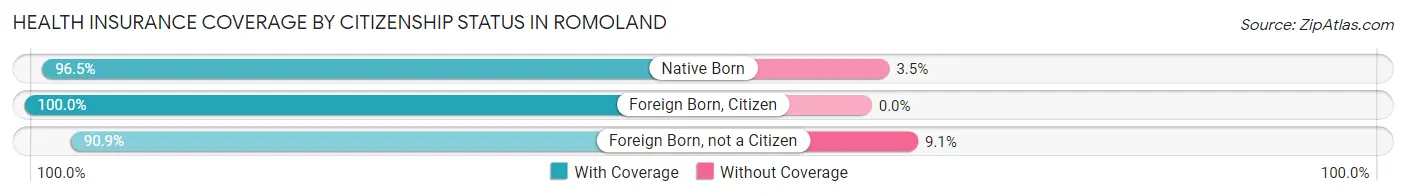
| Citizenship Status | With Coverage | Without Coverage |
| Native Born | 278 (96.5%) | 10 (3.5%) |
| Foreign Born, Citizen | 804 (100.0%) | 0 (0.0%) |
| Foreign Born, not a Citizen | 170 (90.9%) | 17 (9.1%) |
Health Insurance Coverage by Household Income in Romoland
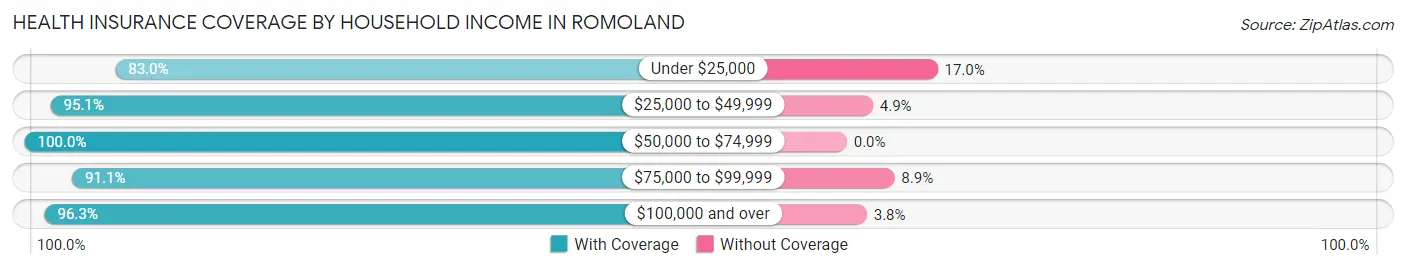
| Household Income | With Coverage | Without Coverage |
| Under $25,000 | 83 (83.0%) | 17 (17.0%) |
| $25,000 to $49,999 | 858 (95.1%) | 44 (4.9%) |
| $50,000 to $74,999 | 84 (100.0%) | 0 (0.0%) |
| $75,000 to $99,999 | 194 (91.1%) | 19 (8.9%) |
| $100,000 and over | 1,385 (96.3%) | 54 (3.7%) |
Public vs Private Health Insurance Coverage by Age in Romoland
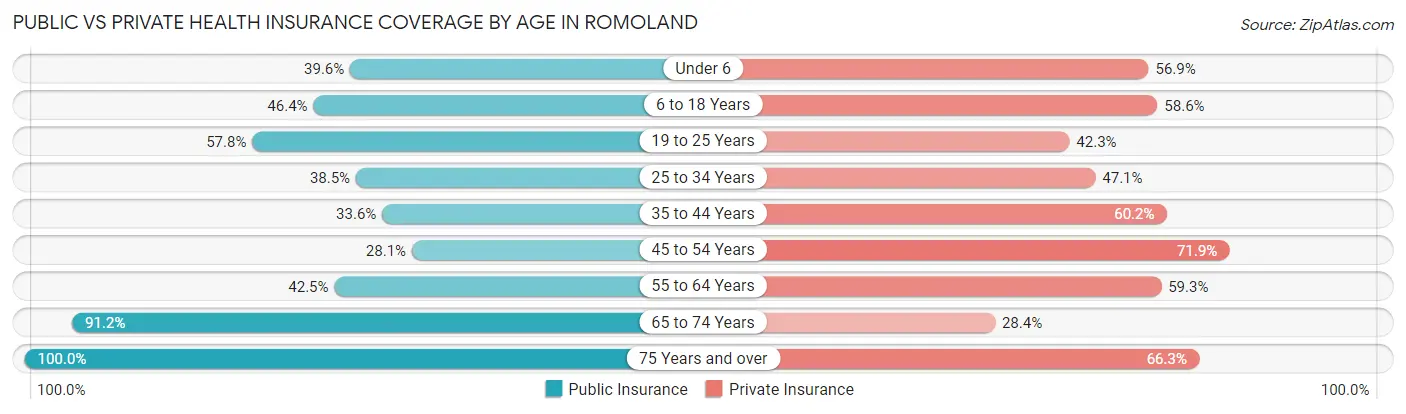
| Age Bracket | Public Insurance | Private Insurance |
| Under 6 | 114 (39.6%) | 164 (56.9%) |
| 6 to 18 Years | 373 (46.4%) | 471 (58.6%) |
| 19 to 25 Years | 108 (57.8%) | 79 (42.2%) |
| 25 to 34 Years | 144 (38.5%) | 176 (47.1%) |
| 35 to 44 Years | 115 (33.6%) | 206 (60.2%) |
| 45 to 54 Years | 79 (28.1%) | 202 (71.9%) |
| 55 to 64 Years | 119 (42.5%) | 166 (59.3%) |
| 65 to 74 Years | 93 (91.2%) | 29 (28.4%) |
| 75 Years and over | 80 (100.0%) | 53 (66.2%) |
| Total | 1,225 (44.7%) | 1,546 (56.5%) |
Disability Status by Sex by Age in Romoland
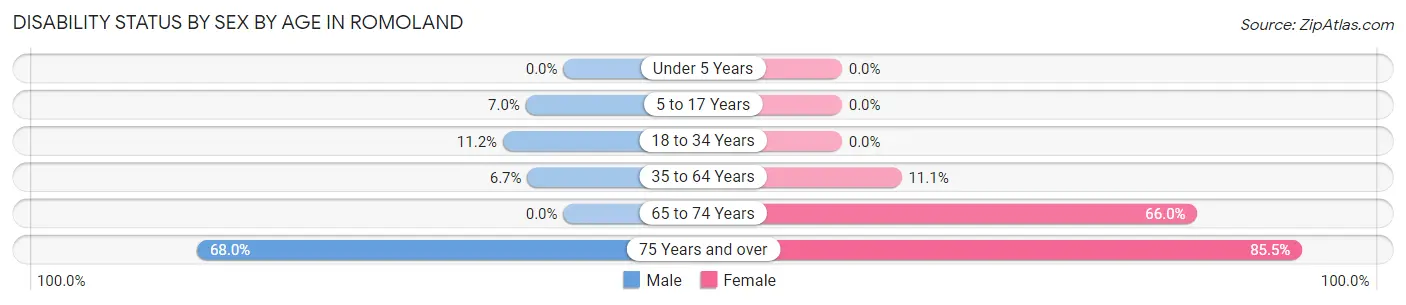
| Age Bracket | Male | Female |
| Under 5 Years | 0 (0.0%) | 0 (0.0%) |
| 5 to 17 Years | 26 (7.0%) | 0 (0.0%) |
| 18 to 34 Years | 33 (11.2%) | 0 (0.0%) |
| 35 to 64 Years | 32 (6.7%) | 47 (11.1%) |
| 65 to 74 Years | 0 (0.0%) | 33 (66.0%) |
| 75 Years and over | 17 (68.0%) | 47 (85.5%) |
Disability Class by Sex by Age in Romoland
Disability Class: Hearing Difficulty
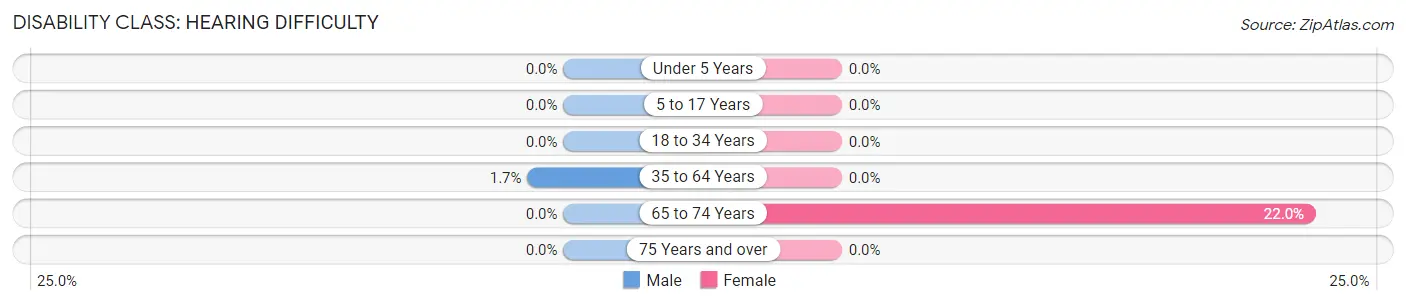
| Age Bracket | Male | Female |
| Under 5 Years | 0 (0.0%) | 0 (0.0%) |
| 5 to 17 Years | 0 (0.0%) | 0 (0.0%) |
| 18 to 34 Years | 0 (0.0%) | 0 (0.0%) |
| 35 to 64 Years | 8 (1.7%) | 0 (0.0%) |
| 65 to 74 Years | 0 (0.0%) | 11 (22.0%) |
| 75 Years and over | 0 (0.0%) | 0 (0.0%) |
Disability Class: Vision Difficulty
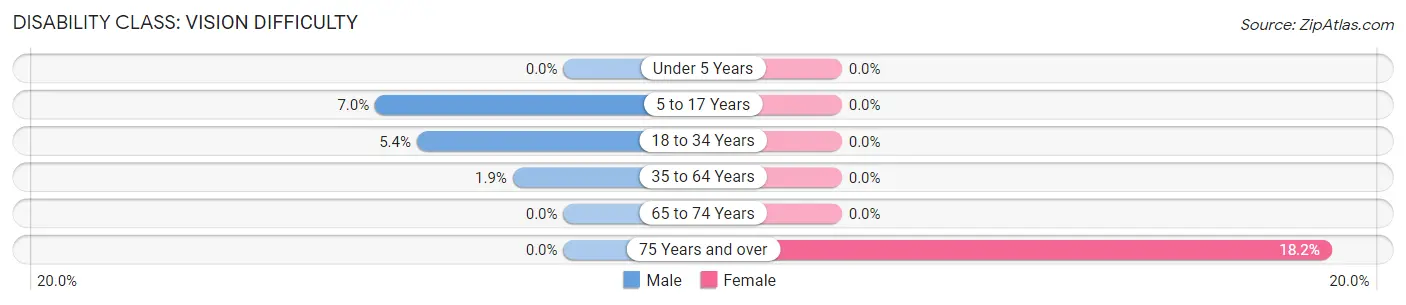
| Age Bracket | Male | Female |
| Under 5 Years | 0 (0.0%) | 0 (0.0%) |
| 5 to 17 Years | 26 (7.0%) | 0 (0.0%) |
| 18 to 34 Years | 16 (5.4%) | 0 (0.0%) |
| 35 to 64 Years | 9 (1.9%) | 0 (0.0%) |
| 65 to 74 Years | 0 (0.0%) | 0 (0.0%) |
| 75 Years and over | 0 (0.0%) | 10 (18.2%) |
Disability Class: Cognitive Difficulty
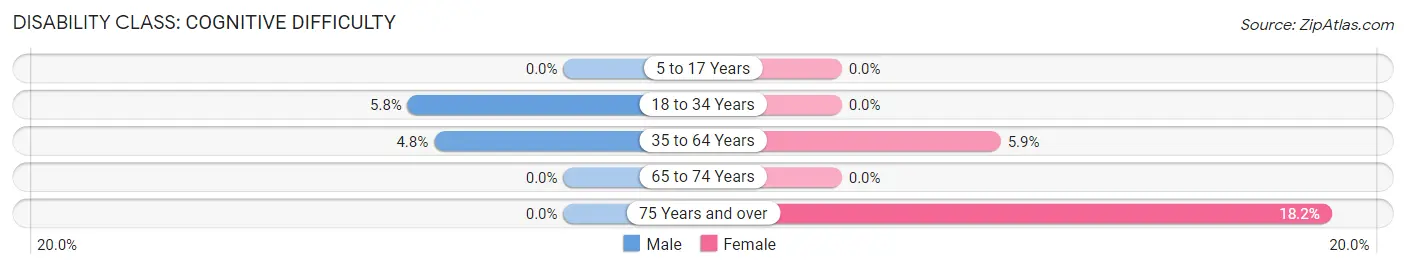
| Age Bracket | Male | Female |
| 5 to 17 Years | 0 (0.0%) | 0 (0.0%) |
| 18 to 34 Years | 17 (5.8%) | 0 (0.0%) |
| 35 to 64 Years | 23 (4.8%) | 25 (5.9%) |
| 65 to 74 Years | 0 (0.0%) | 0 (0.0%) |
| 75 Years and over | 0 (0.0%) | 10 (18.2%) |
Disability Class: Ambulatory Difficulty
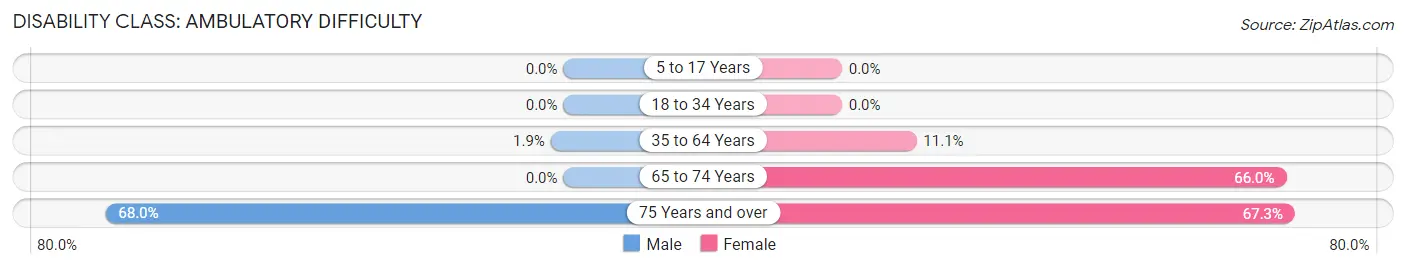
| Age Bracket | Male | Female |
| 5 to 17 Years | 0 (0.0%) | 0 (0.0%) |
| 18 to 34 Years | 0 (0.0%) | 0 (0.0%) |
| 35 to 64 Years | 9 (1.9%) | 47 (11.1%) |
| 65 to 74 Years | 0 (0.0%) | 33 (66.0%) |
| 75 Years and over | 17 (68.0%) | 37 (67.3%) |
Disability Class: Self-Care Difficulty
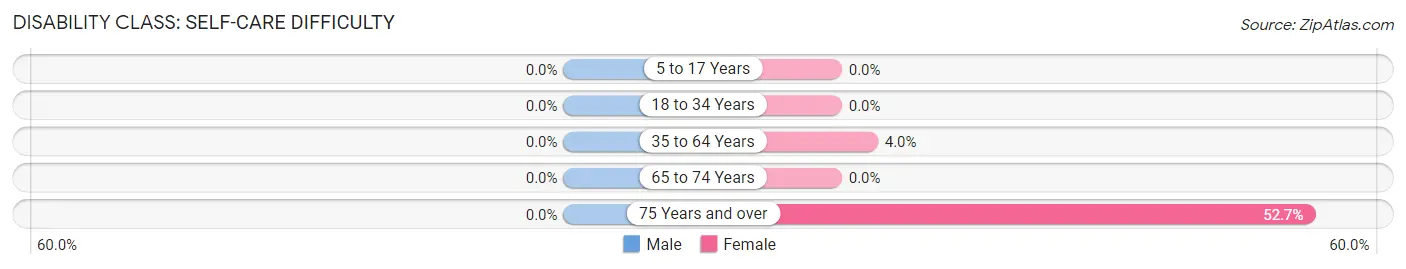
| Age Bracket | Male | Female |
| 5 to 17 Years | 0 (0.0%) | 0 (0.0%) |
| 18 to 34 Years | 0 (0.0%) | 0 (0.0%) |
| 35 to 64 Years | 0 (0.0%) | 17 (4.0%) |
| 65 to 74 Years | 0 (0.0%) | 0 (0.0%) |
| 75 Years and over | 0 (0.0%) | 29 (52.7%) |
Technology Access in Romoland
Computing Device Access in Romoland
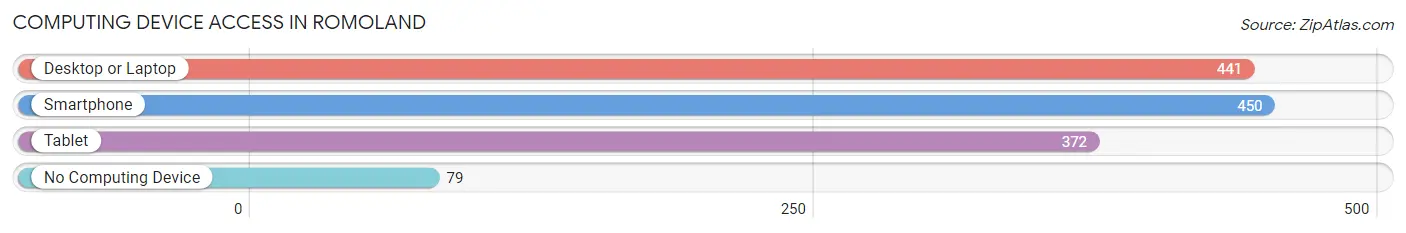
| Device Type | # Households | % Households |
| Desktop or Laptop | 441 | 74.5% |
| Smartphone | 450 | 76.0% |
| Tablet | 372 | 62.8% |
| No Computing Device | 79 | 13.3% |
| Total | 592 | 100.0% |
Internet Access in Romoland
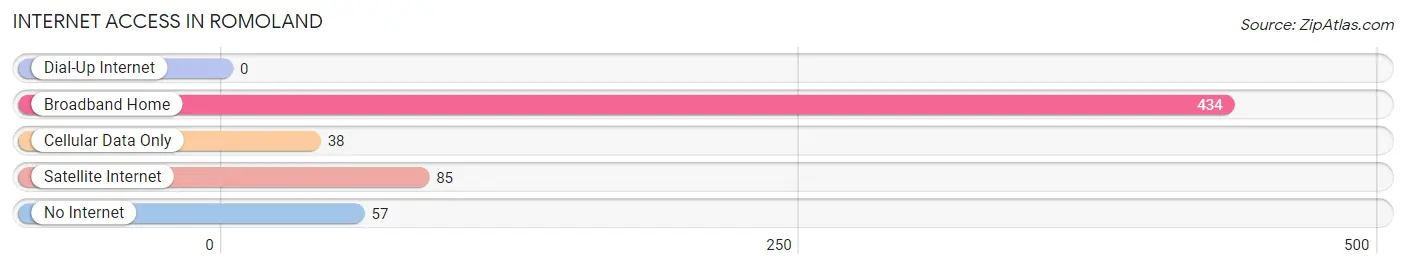
| Internet Type | # Households | % Households |
| Dial-Up Internet | 0 | 0.0% |
| Broadband Home | 434 | 73.3% |
| Cellular Data Only | 38 | 6.4% |
| Satellite Internet | 85 | 14.4% |
| No Internet | 57 | 9.6% |
| Total | 592 | 100.0% |
Romoland Summary
Romoland is a small unincorporated community located in Riverside County, California. It is situated in the San Jacinto Valley, approximately 8 miles east of the city of Hemet. The population of Romoland was estimated to be around 4,000 in 2020.
History
Romoland was originally inhabited by the Cahuilla Indians, who were the original inhabitants of the area. The first European settlers arrived in the area in the late 1800s, and the town was officially founded in 1887. The town was named after the Roman family, who were the first settlers in the area.
The town was initially a farming community, with the main crops being citrus, grapes, and olives. The town also had a small sawmill, which provided lumber for the local area. In the early 1900s, the town began to grow and develop, with the construction of a post office, a school, and a general store.
Geography
Romoland is located in the San Jacinto Valley, which is a large valley located in Riverside County, California. The valley is surrounded by the San Jacinto Mountains to the north and the Santa Rosa Mountains to the south. The valley is approximately 8 miles wide and 25 miles long.
The climate in Romoland is generally mild, with temperatures ranging from the mid-50s in the winter to the mid-90s in the summer. The area receives an average of 10 inches of rain per year.
Economy
The economy of Romoland is largely based on agriculture. The main crops grown in the area are citrus, grapes, and olives. The town also has a small sawmill, which provides lumber for the local area.
In addition to agriculture, Romoland is home to several small businesses, including a gas station, a grocery store, and a few restaurants. The town also has a post office and a school.
Demographics
As of 2020, the population of Romoland was estimated to be around 4,000. The racial makeup of the town is predominantly white (83.3%), followed by Hispanic or Latino (9.3%), African American (3.3%), and Asian (2.3%). The median household income in Romoland is $50,000, and the median age is 37.
Romoland is a small, rural community with a strong sense of community. The town is home to a variety of churches, and there are several community events held throughout the year. The town is also home to a variety of recreational activities, including hiking, fishing, and camping.
Common Questions
What is the Total Population of Romoland?
Total Population of Romoland is 2,738.
What is the Total Male Population of Romoland?
Total Male Population of Romoland is 1,305.
What is the Total Female Population of Romoland?
Total Female Population of Romoland is 1,433.
What is the Ratio of Males per 100 Females in Romoland?
There are 91.07 Males per 100 Females in Romoland.
What is the Ratio of Females per 100 Males in Romoland?
There are 109.81 Females per 100 Males in Romoland.
What is the Median Population Age in Romoland?
Median Population Age in Romoland is 31.3 Years.
What is the Average Family Size in Romoland
Average Family Size in Romoland is 4.8 People.
What is the Average Household Size in Romoland
Average Household Size in Romoland is 4.6 People.
What is Per Capita Income in Romoland?
Per Capita income in Romoland is $19,229.
What is the Median Family Income in Romoland?
Median Family Income in Romoland is $74,167.
What is the Median Household income in Romoland?
Median Household Income in Romoland is $73,500.
What is Income or Wage Gap in Romoland?
Income or Wage Gap in Romoland is 44.5%.
Women in Romoland earn 55.5 cents for every dollar earned by a man.
What is Inequality or Gini Index in Romoland?
Inequality or Gini Index in Romoland is 0.40.
How Large is the Labor Force in Romoland?
There are 1,075 People in the Labor Forcein in Romoland.
What is the Percentage of People in the Labor Force in Romoland?
58.4% of People are in the Labor Force in Romoland.
What is the Unemployment Rate in Romoland?
Unemployment Rate in Romoland is 6.0%.