Rio Vista, CA
Rio Vista Map
Rio Vista Overview
10,074
TOTAL POPULATION
4,619
MALE POPULATION
5,455
FEMALE POPULATION
84.67
MALES / 100 FEMALES
118.10
FEMALES / 100 MALES
64.6
MEDIAN AGE
2.6
AVG FAMILY SIZE
2.0
AVG HOUSEHOLD SIZE
$48,159
PER CAPITA INCOME
$97,277
AVG FAMILY INCOME
$83,538
AVG HOUSEHOLD INCOME
7.9%
WAGE / INCOME GAP [ % ]
92.1¢/ $1
WAGE / INCOME GAP [ $ ]
$11,838
FAMILY INCOME DEFICIT
0.37
INEQUALITY / GINI INDEX
3,896
LABOR FORCE [ PEOPLE ]
41.3%
PERCENT IN LABOR FORCE
13.4%
UNEMPLOYMENT RATE
Rio Vista Zip Codes
Rio Vista Area Codes
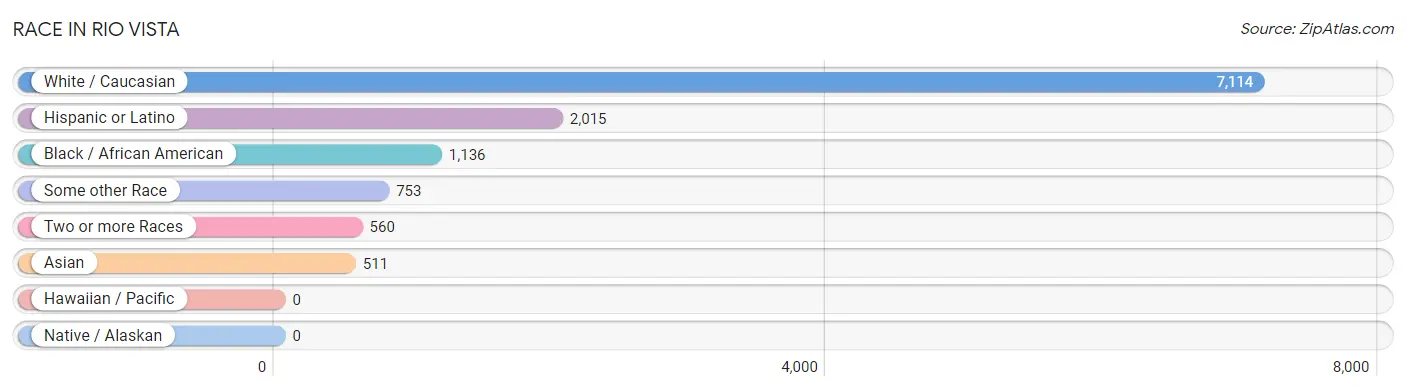
Race in Rio Vista
The most populous races in Rio Vista are White / Caucasian (7,114 | 70.6%), Hispanic or Latino (2,015 | 20.0%), and Black / African American (1,136 | 11.3%).
| Race | # Population | % Population |
| Asian | 511 | 5.1% |
| Black / African American | 1,136 | 11.3% |
| Hawaiian / Pacific | 0 | 0.0% |
| Hispanic or Latino | 2,015 | 20.0% |
| Native / Alaskan | 0 | 0.0% |
| White / Caucasian | 7,114 | 70.6% |
| Two or more Races | 560 | 5.6% |
| Some other Race | 753 | 7.5% |
| Total | 10,074 | 100.0% |
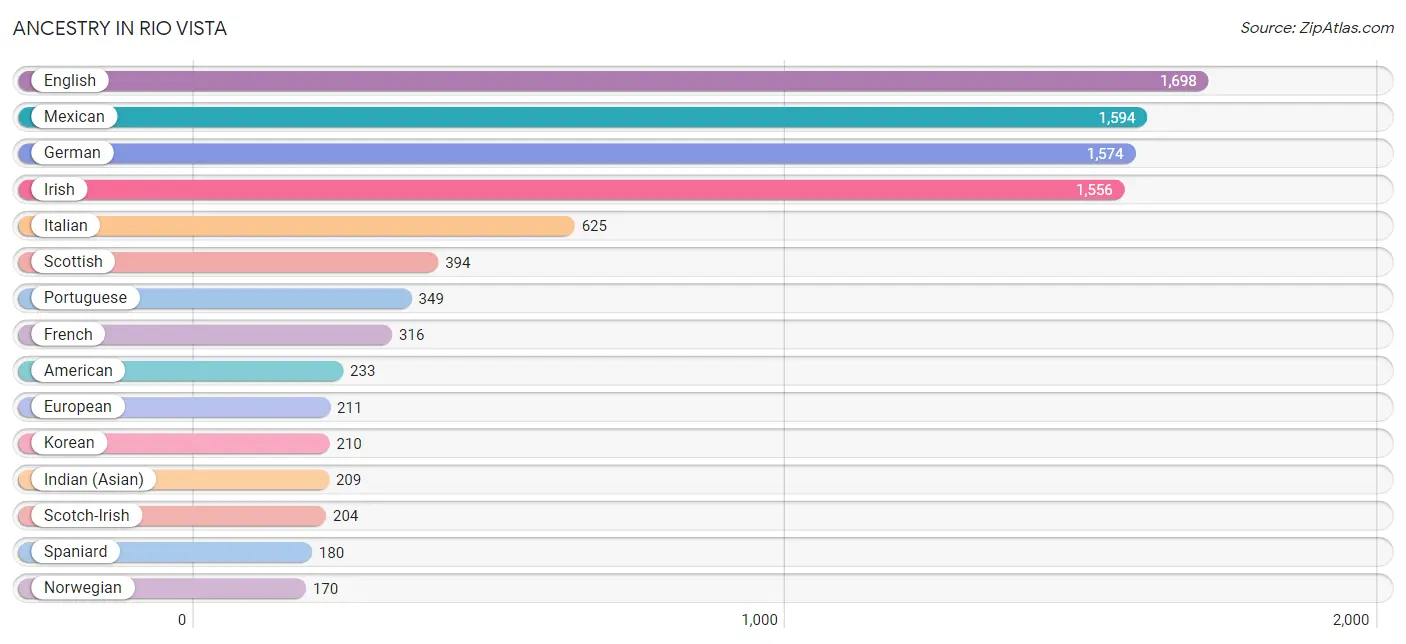
Ancestry in Rio Vista
The most populous ancestries reported in Rio Vista are English (1,698 | 16.9%), Mexican (1,594 | 15.8%), German (1,574 | 15.6%), Irish (1,556 | 15.4%), and Italian (625 | 6.2%), together accounting for 70.0% of all Rio Vista residents.
| Ancestry | # Population | % Population |
| African | 55 | 0.5% |
| American | 233 | 2.3% |
| Austrian | 81 | 0.8% |
| Bhutanese | 113 | 1.1% |
| British | 37 | 0.4% |
| Burmese | 38 | 0.4% |
| Central American | 35 | 0.4% |
| Chilean | 62 | 0.6% |
| Croatian | 13 | 0.1% |
| Czech | 20 | 0.2% |
| Czechoslovakian | 36 | 0.4% |
| Danish | 106 | 1.1% |
| Dutch | 14 | 0.1% |
| Eastern European | 87 | 0.9% |
| English | 1,698 | 16.9% |
| European | 211 | 2.1% |
| Finnish | 21 | 0.2% |
| French | 316 | 3.1% |
| French Canadian | 38 | 0.4% |
| German | 1,574 | 15.6% |
| Greek | 19 | 0.2% |
| Hungarian | 12 | 0.1% |
| Indian (Asian) | 209 | 2.1% |
| Irish | 1,556 | 15.4% |
| Italian | 625 | 6.2% |
| Korean | 210 | 2.1% |
| Lithuanian | 56 | 0.6% |
| Malaysian | 18 | 0.2% |
| Mexican | 1,594 | 15.8% |
| Northern European | 100 | 1.0% |
| Norwegian | 170 | 1.7% |
| Peruvian | 56 | 0.6% |
| Polish | 142 | 1.4% |
| Portuguese | 349 | 3.5% |
| Russian | 100 | 1.0% |
| Salvadoran | 35 | 0.4% |
| Scotch-Irish | 204 | 2.0% |
| Scottish | 394 | 3.9% |
| Slovene | 17 | 0.2% |
| South American | 118 | 1.2% |
| Spaniard | 180 | 1.8% |
| Sri Lankan | 1 | 0.0% |
| Subsaharan African | 78 | 0.8% |
| Swedish | 54 | 0.5% |
| Swiss | 57 | 0.6% |
| Ugandan | 23 | 0.2% |
| Welsh | 31 | 0.3% | View All 47 Rows |
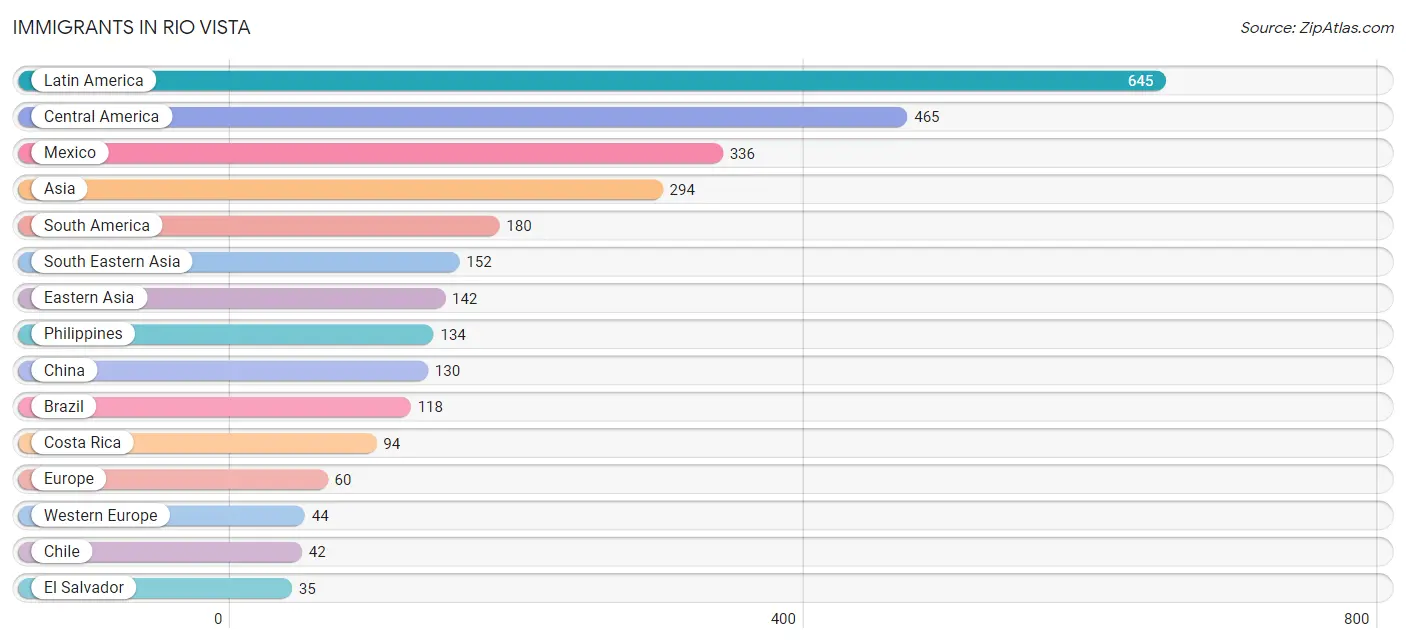
Immigrants in Rio Vista
The most numerous immigrant groups reported in Rio Vista came from Latin America (645 | 6.4%), Central America (465 | 4.6%), Mexico (336 | 3.3%), Asia (294 | 2.9%), and South America (180 | 1.8%), together accounting for 19.1% of all Rio Vista residents.
| Immigration Origin | # Population | % Population |
| Africa | 23 | 0.2% |
| Argentina | 20 | 0.2% |
| Asia | 294 | 2.9% |
| Brazil | 118 | 1.2% |
| Central America | 465 | 4.6% |
| Chile | 42 | 0.4% |
| China | 130 | 1.3% |
| Costa Rica | 94 | 0.9% |
| Eastern Africa | 23 | 0.2% |
| Eastern Asia | 142 | 1.4% |
| Eastern Europe | 16 | 0.2% |
| El Salvador | 35 | 0.4% |
| Europe | 60 | 0.6% |
| France | 27 | 0.3% |
| Germany | 17 | 0.2% |
| Korea | 12 | 0.1% |
| Laos | 18 | 0.2% |
| Latin America | 645 | 6.4% |
| Mexico | 336 | 3.3% |
| Philippines | 134 | 1.3% |
| Russia | 16 | 0.2% |
| South America | 180 | 1.8% |
| South Eastern Asia | 152 | 1.5% |
| Taiwan | 26 | 0.3% |
| Uganda | 23 | 0.2% |
| Western Europe | 44 | 0.4% | View All 26 Rows |
Sex and Age in Rio Vista
Sex and Age in Rio Vista
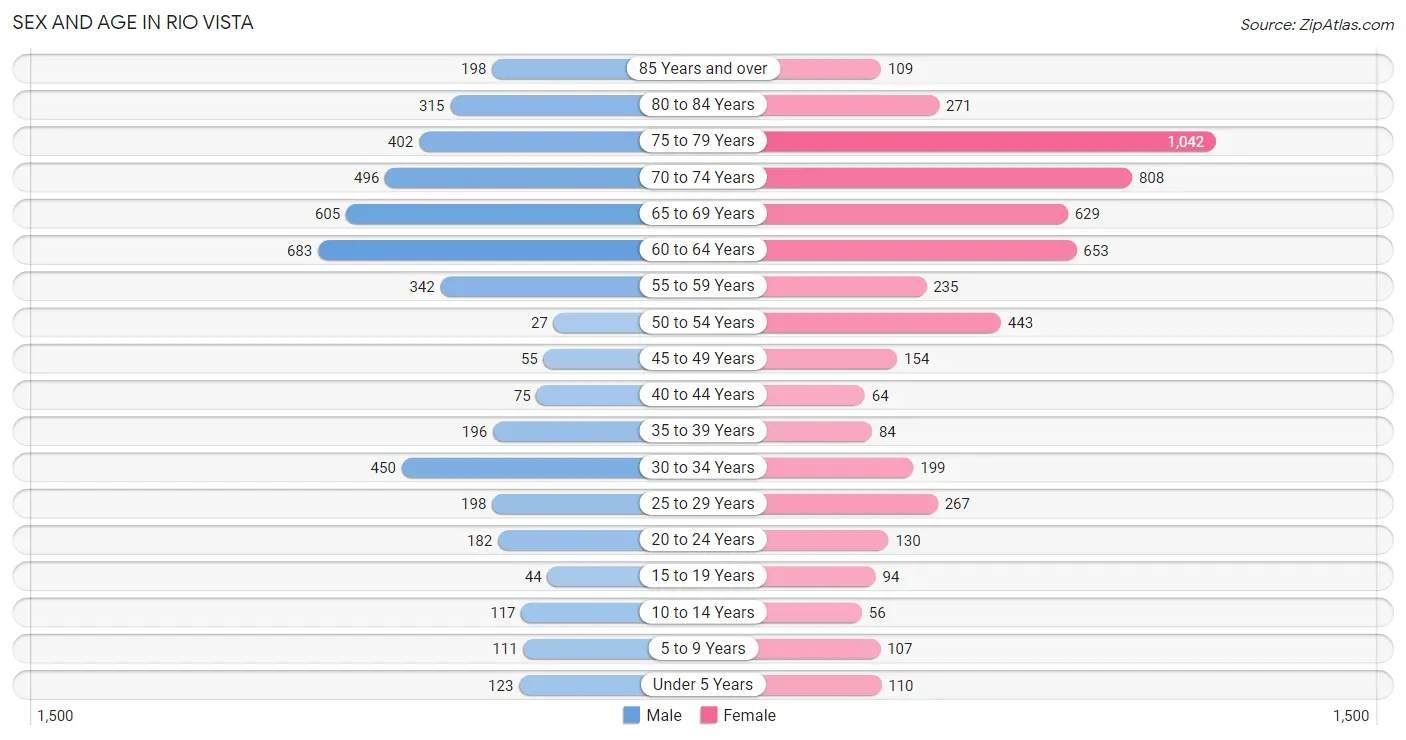
The most populous age groups in Rio Vista are 60 to 64 Years (683 | 14.8%) for men and 75 to 79 Years (1,042 | 19.1%) for women.
| Age Bracket | Male | Female |
| Under 5 Years | 123 (2.7%) | 110 (2.0%) |
| 5 to 9 Years | 111 (2.4%) | 107 (2.0%) |
| 10 to 14 Years | 117 (2.5%) | 56 (1.0%) |
| 15 to 19 Years | 44 (0.9%) | 94 (1.7%) |
| 20 to 24 Years | 182 (3.9%) | 130 (2.4%) |
| 25 to 29 Years | 198 (4.3%) | 267 (4.9%) |
| 30 to 34 Years | 450 (9.7%) | 199 (3.6%) |
| 35 to 39 Years | 196 (4.2%) | 84 (1.5%) |
| 40 to 44 Years | 75 (1.6%) | 64 (1.2%) |
| 45 to 49 Years | 55 (1.2%) | 154 (2.8%) |
| 50 to 54 Years | 27 (0.6%) | 443 (8.1%) |
| 55 to 59 Years | 342 (7.4%) | 235 (4.3%) |
| 60 to 64 Years | 683 (14.8%) | 653 (12.0%) |
| 65 to 69 Years | 605 (13.1%) | 629 (11.5%) |
| 70 to 74 Years | 496 (10.7%) | 808 (14.8%) |
| 75 to 79 Years | 402 (8.7%) | 1,042 (19.1%) |
| 80 to 84 Years | 315 (6.8%) | 271 (5.0%) |
| 85 Years and over | 198 (4.3%) | 109 (2.0%) |
| Total | 4,619 (100.0%) | 5,455 (100.0%) |
Families and Households in Rio Vista
Median Family Size in Rio Vista
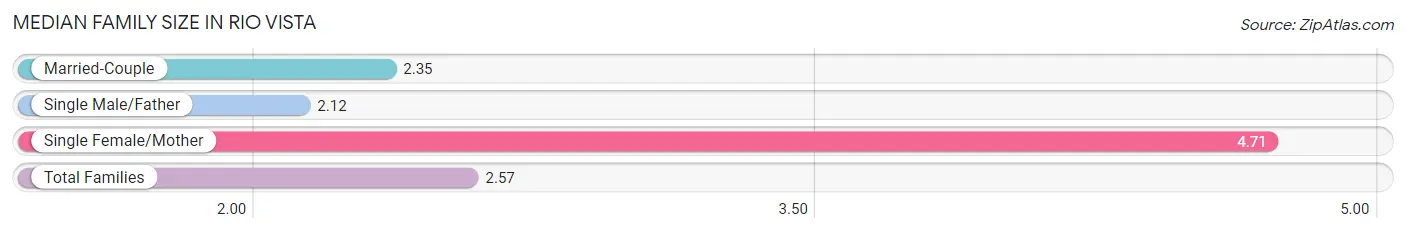
The median family size in Rio Vista is 2.57 persons per family, with single female/mother families (291 | 10.2%) accounting for the largest median family size of 4.71 persons per family. On the other hand, single male/father families (276 | 9.7%) represent the smallest median family size with 2.12 persons per family.
| Family Type | # Families | Family Size |
| Married-Couple | 2,275 (80.0%) | 2.35 |
| Single Male/Father | 276 (9.7%) | 2.12 |
| Single Female/Mother | 291 (10.2%) | 4.71 |
| Total Families | 2,842 (100.0%) | 2.57 |
Median Household Size in Rio Vista
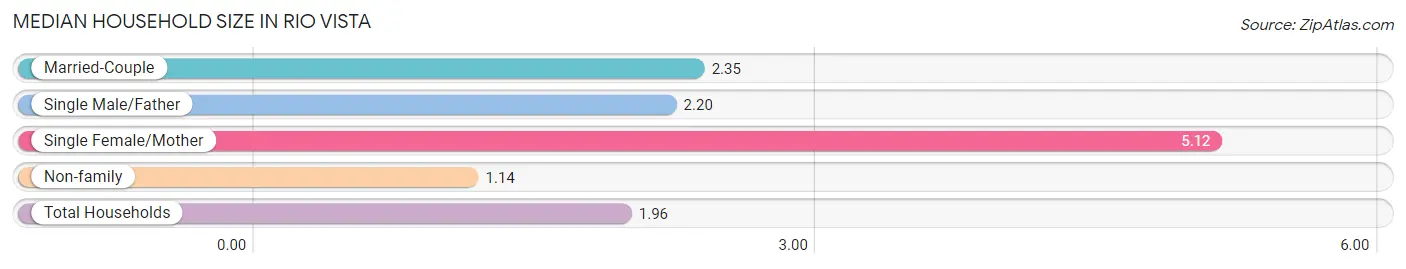
The median household size in Rio Vista is 1.96 persons per household, with single female/mother households (291 | 5.7%) accounting for the largest median household size of 5.12 persons per household. non-family households (2,283 | 44.6%) represent the smallest median household size with 1.14 persons per household.
| Household Type | # Households | Household Size |
| Married-Couple | 2,275 (44.4%) | 2.35 |
| Single Male/Father | 276 (5.4%) | 2.20 |
| Single Female/Mother | 291 (5.7%) | 5.12 |
| Non-family | 2,283 (44.6%) | 1.14 |
| Total Households | 5,125 (100.0%) | 1.96 |
Household Size by Marriage Status in Rio Vista
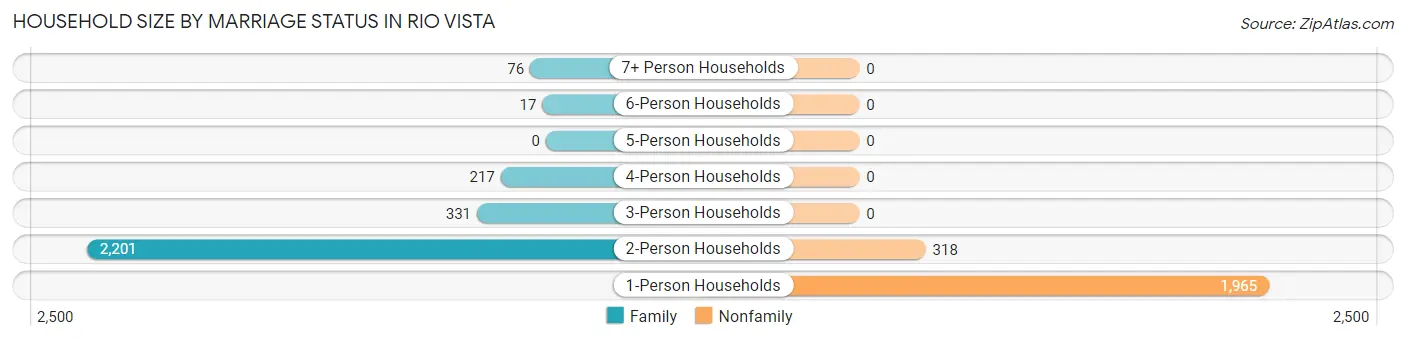
Out of a total of 5,125 households in Rio Vista, 2,842 (55.4%) are family households, while 2,283 (44.6%) are nonfamily households. The most numerous type of family households are 2-person households, comprising 2,201, and the most common type of nonfamily households are 1-person households, comprising 1,965.
| Household Size | Family Households | Nonfamily Households |
| 1-Person Households | - | 1,965 (38.3%) |
| 2-Person Households | 2,201 (42.9%) | 318 (6.2%) |
| 3-Person Households | 331 (6.5%) | 0 (0.0%) |
| 4-Person Households | 217 (4.2%) | 0 (0.0%) |
| 5-Person Households | 0 (0.0%) | 0 (0.0%) |
| 6-Person Households | 17 (0.3%) | 0 (0.0%) |
| 7+ Person Households | 76 (1.5%) | 0 (0.0%) |
| Total | 2,842 (55.4%) | 2,283 (44.6%) |
Female Fertility in Rio Vista
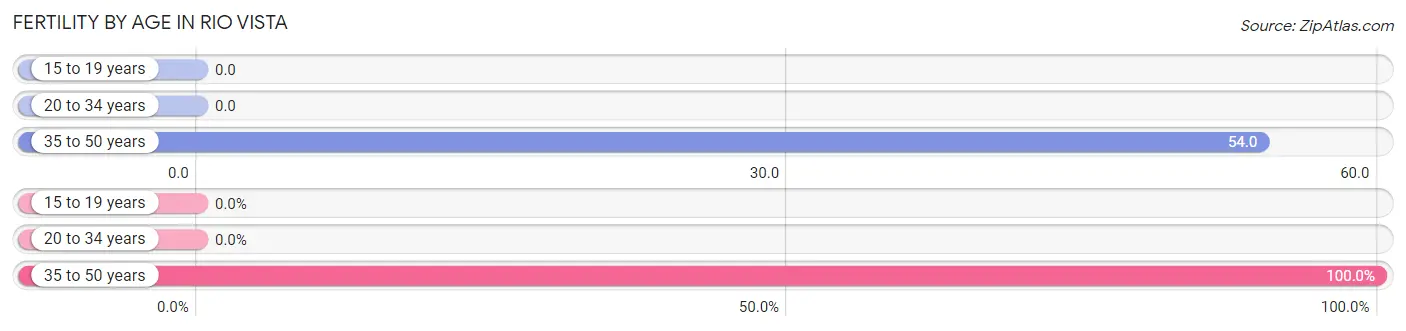
Fertility by Age in Rio Vista
Average fertility rate in Rio Vista is 17.0 births per 1,000 women. Women in the age bracket of 35 to 50 years have the highest fertility rate with 54.0 births per 1,000 women. Women in the age bracket of 35 to 50 years acount for 100.0% of all women with births.
| Age Bracket | Women with Births | Births / 1,000 Women |
| 15 to 19 years | 0 (0.0%) | 0.0 |
| 20 to 34 years | 0 (0.0%) | 0.0 |
| 35 to 50 years | 17 (100.0%) | 54.0 |
| Total | 17 (100.0%) | 17.0 |
Fertility by Age by Marriage Status in Rio Vista

| Age Bracket | Married | Unmarried |
| 15 to 19 years | 0 (0.0%) | 0 (0.0%) |
| 20 to 34 years | 0 (0.0%) | 0 (0.0%) |
| 35 to 50 years | 17 (100.0%) | 0 (0.0%) |
| Total | 17 (100.0%) | 0 (0.0%) |
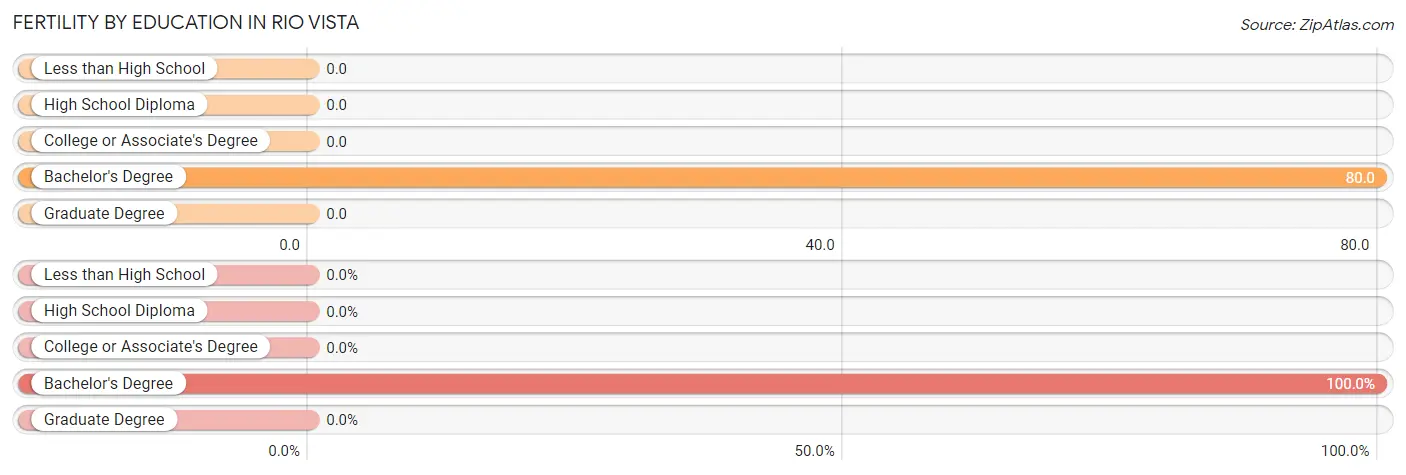
Fertility by Education in Rio Vista
| Educational Attainment | Women with Births | Births / 1,000 Women |
| Less than High School | 0 (0.0%) | 0.0 |
| High School Diploma | 0 (0.0%) | 0.0 |
| College or Associate's Degree | 0 (0.0%) | 0.0 |
| Bachelor's Degree | 17 (100.0%) | 80.0 |
| Graduate Degree | 0 (0.0%) | 0.0 |
| Total | 17 (100.0%) | 17.0 |
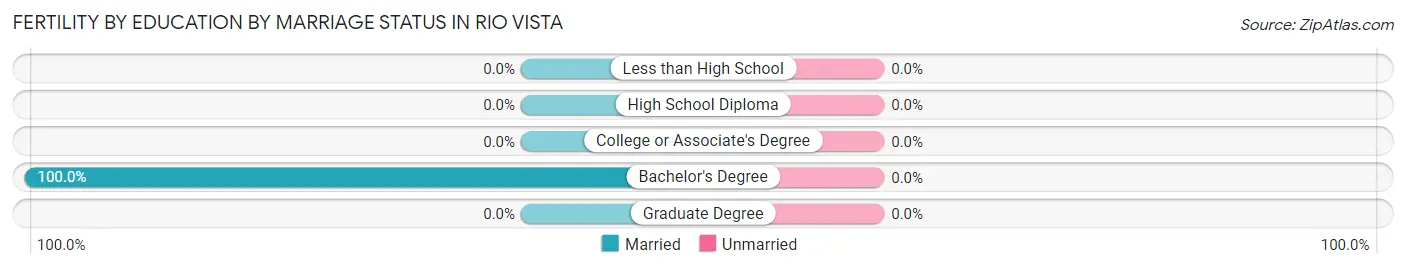
Fertility by Education by Marriage Status in Rio Vista
| Educational Attainment | Married | Unmarried |
| Less than High School | 0 (0.0%) | 0 (0.0%) |
| High School Diploma | 0 (0.0%) | 0 (0.0%) |
| College or Associate's Degree | 0 (0.0%) | 0 (0.0%) |
| Bachelor's Degree | 17 (100.0%) | 0 (0.0%) |
| Graduate Degree | 0 (0.0%) | 0 (0.0%) |
| Total | 17 (100.0%) | 0 (0.0%) |
Income in Rio Vista
Income Overview in Rio Vista
Per Capita Income in Rio Vista is $48,159, while median incomes of families and households are $97,277 and $83,538 respectively.
| Characteristic | Number | Measure |
| Per Capita Income | 10,074 | $48,159 |
| Median Family Income | 2,842 | $97,277 |
| Mean Family Income | 2,842 | $117,516 |
| Median Household Income | 5,125 | $83,538 |
| Mean Household Income | 5,125 | $94,836 |
| Income Deficit | 2,842 | $11,838 |
| Wage / Income Gap (%) | 10,074 | 7.87% |
| Wage / Income Gap ($) | 10,074 | 92.13¢ per $1 |
| Gini / Inequality Index | 10,074 | 0.37 |
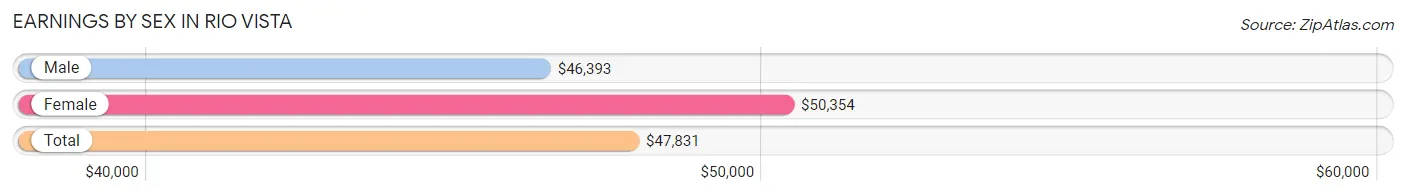
Earnings by Sex in Rio Vista
Average Earnings in Rio Vista are $47,831, $46,393 for men and $50,354 for women, a difference of 7.9%.
| Sex | Number | Average Earnings |
| Male | 2,053 (49.9%) | $46,393 |
| Female | 2,057 (50.0%) | $50,354 |
| Total | 4,110 (100.0%) | $47,831 |
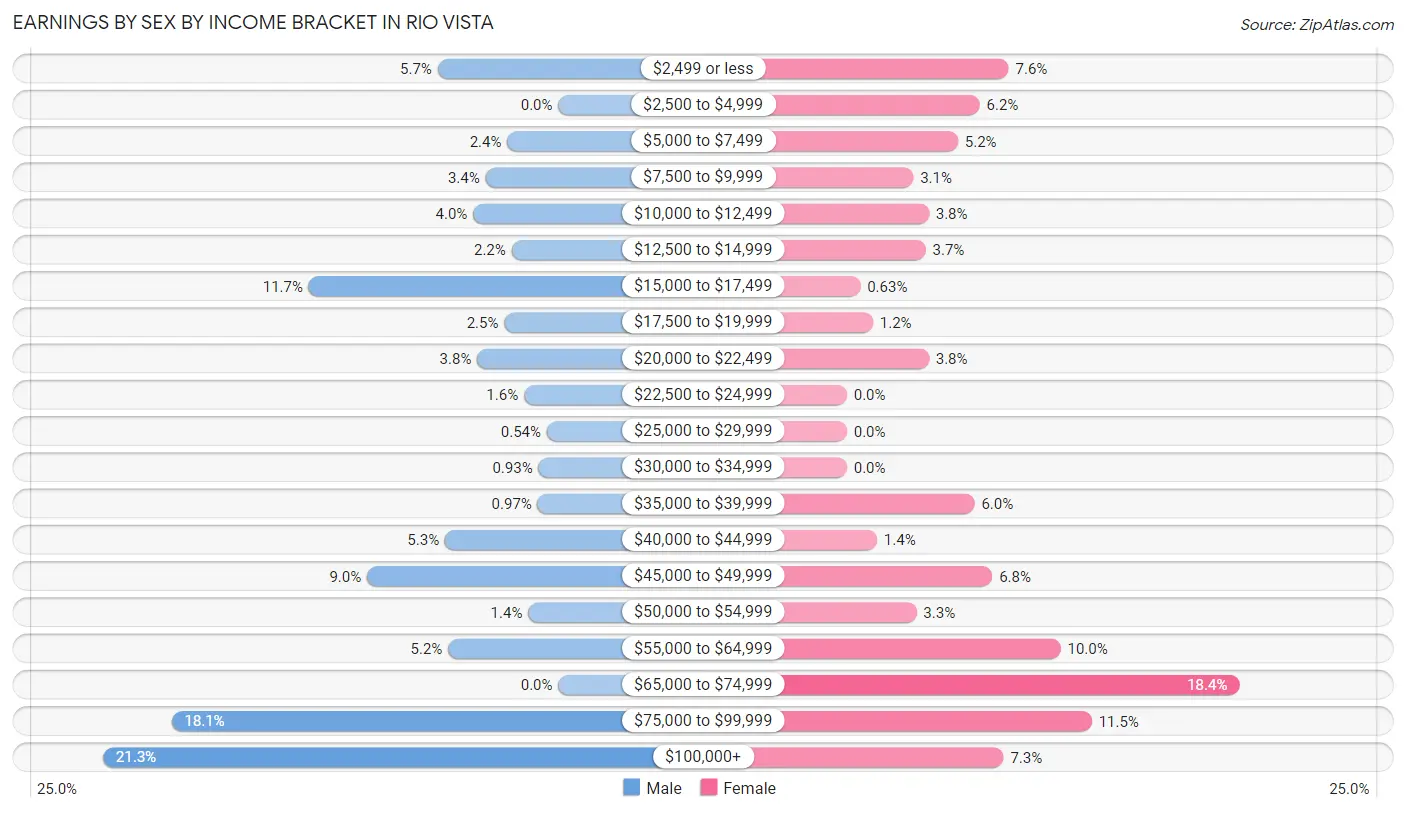
Earnings by Sex by Income Bracket in Rio Vista
The most common earnings brackets in Rio Vista are $100,000+ for men (438 | 21.3%) and $65,000 to $74,999 for women (378 | 18.4%).
| Income | Male | Female |
| $2,499 or less | 116 (5.7%) | 156 (7.6%) |
| $2,500 to $4,999 | 0 (0.0%) | 128 (6.2%) |
| $5,000 to $7,499 | 49 (2.4%) | 107 (5.2%) |
| $7,500 to $9,999 | 70 (3.4%) | 64 (3.1%) |
| $10,000 to $12,499 | 82 (4.0%) | 79 (3.8%) |
| $12,500 to $14,999 | 45 (2.2%) | 76 (3.7%) |
| $15,000 to $17,499 | 240 (11.7%) | 13 (0.6%) |
| $17,500 to $19,999 | 52 (2.5%) | 25 (1.2%) |
| $20,000 to $22,499 | 78 (3.8%) | 79 (3.8%) |
| $22,500 to $24,999 | 33 (1.6%) | 0 (0.0%) |
| $25,000 to $29,999 | 11 (0.5%) | 0 (0.0%) |
| $30,000 to $34,999 | 19 (0.9%) | 0 (0.0%) |
| $35,000 to $39,999 | 20 (1.0%) | 123 (6.0%) |
| $40,000 to $44,999 | 109 (5.3%) | 29 (1.4%) |
| $45,000 to $49,999 | 184 (9.0%) | 140 (6.8%) |
| $50,000 to $54,999 | 29 (1.4%) | 67 (3.3%) |
| $55,000 to $64,999 | 106 (5.2%) | 206 (10.0%) |
| $65,000 to $74,999 | 0 (0.0%) | 378 (18.4%) |
| $75,000 to $99,999 | 372 (18.1%) | 236 (11.5%) |
| $100,000+ | 438 (21.3%) | 151 (7.3%) |
| Total | 2,053 (100.0%) | 2,057 (100.0%) |
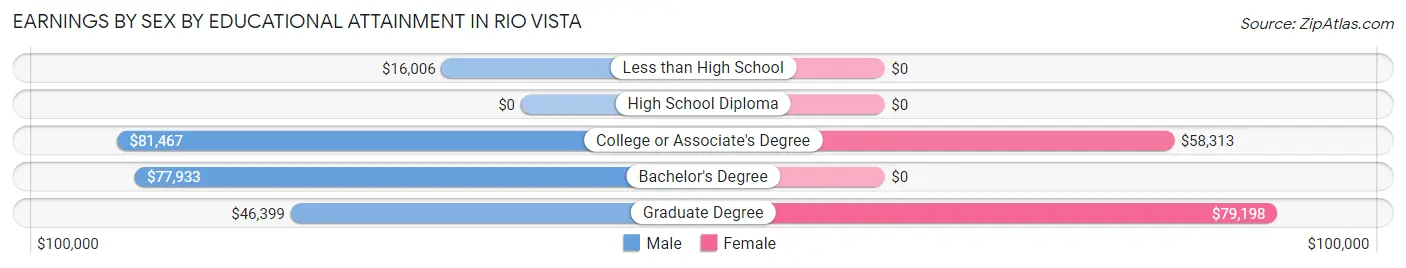
Earnings by Sex by Educational Attainment in Rio Vista
Average earnings in Rio Vista are $46,895 for men and $52,164 for women, a difference of 10.1%. Men with an educational attainment of college or associate's degree enjoy the highest average annual earnings of $81,467, while those with less than high school education earn the least with $16,006. Women with an educational attainment of graduate degree earn the most with the average annual earnings of $79,198, while those with college or associate's degree education have the smallest earnings of $58,313.
| Educational Attainment | Male Income | Female Income |
| Less than High School | $16,006 | $0 |
| High School Diploma | - | - |
| College or Associate's Degree | $81,467 | $58,313 |
| Bachelor's Degree | $77,933 | $0 |
| Graduate Degree | $46,399 | $79,198 |
| Total | $46,895 | $52,164 |
Family Income in Rio Vista
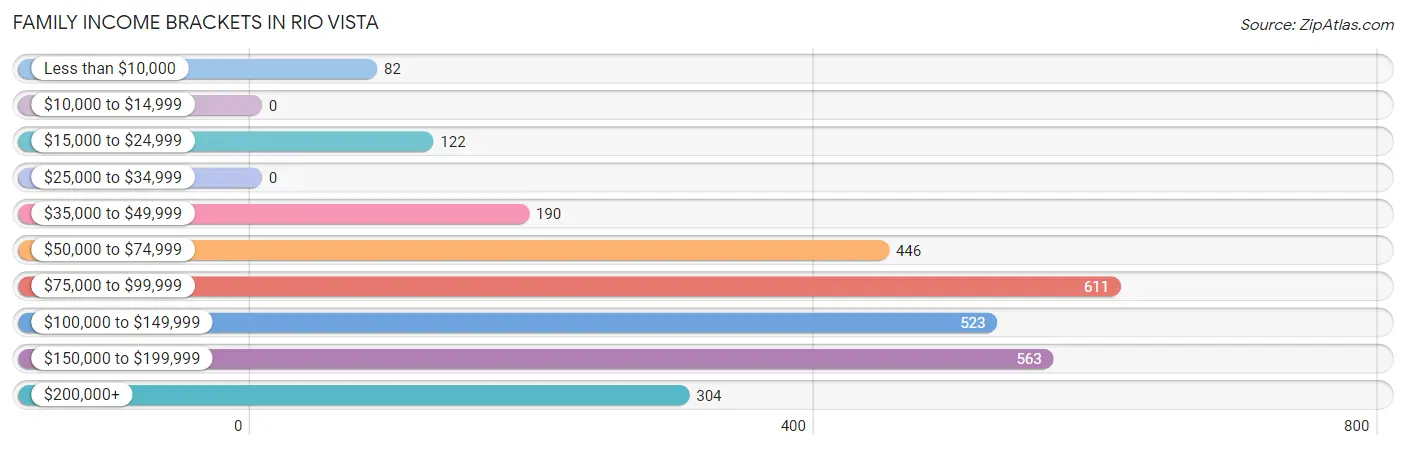
Family Income Brackets in Rio Vista
According to the Rio Vista family income data, there are 611 families falling into the $75,000 to $99,999 income range, which is the most common income bracket and makes up 21.5% of all families.
| Income Bracket | # Families | % Families |
| Less than $10,000 | 82 | 2.9% |
| $10,000 to $14,999 | 0 | 0.0% |
| $15,000 to $24,999 | 122 | 4.3% |
| $25,000 to $34,999 | 0 | 0.0% |
| $35,000 to $49,999 | 190 | 6.7% |
| $50,000 to $74,999 | 446 | 15.7% |
| $75,000 to $99,999 | 611 | 21.5% |
| $100,000 to $149,999 | 523 | 18.4% |
| $150,000 to $199,999 | 563 | 19.8% |
| $200,000+ | 304 | 10.7% |
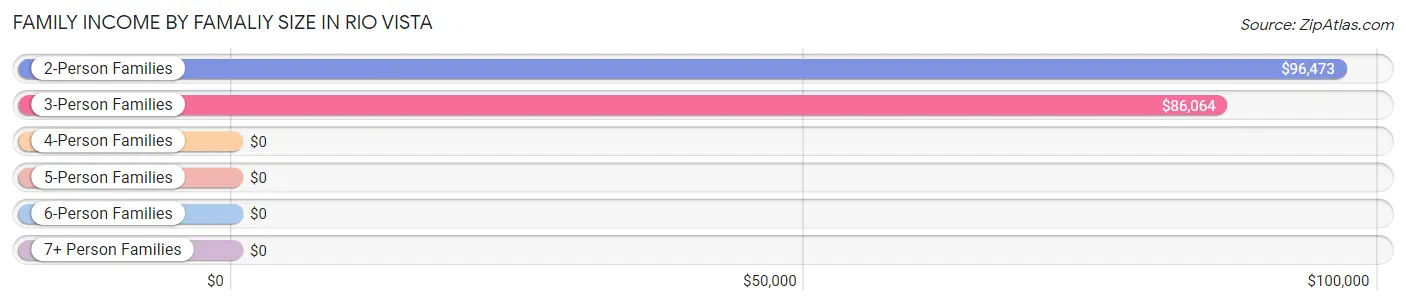
Family Income by Famaliy Size in Rio Vista
2-person families (2,228 | 78.4%) account for the highest median family income in Rio Vista with $96,473 per family, while 2-person families (2,228 | 78.4%) have the highest median income of $48,236 per family member.
| Income Bracket | # Families | Median Income |
| 2-Person Families | 2,228 (78.4%) | $96,473 |
| 3-Person Families | 380 (13.4%) | $86,064 |
| 4-Person Families | 141 (5.0%) | $0 |
| 5-Person Families | 0 (0.0%) | $0 |
| 6-Person Families | 17 (0.6%) | $0 |
| 7+ Person Families | 76 (2.7%) | $0 |
| Total | 2,842 (100.0%) | $97,277 |
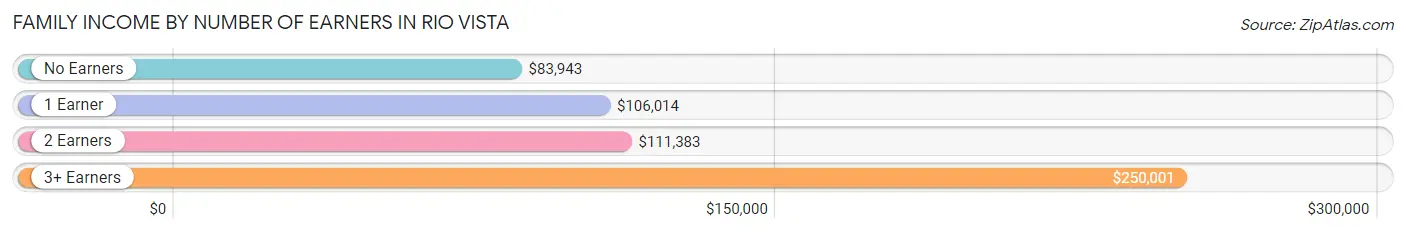
Family Income by Number of Earners in Rio Vista
The median family income in Rio Vista is $97,277, with families comprising 3+ earners (156) having the highest median family income of $250,001, while families with no earners (1,207) have the lowest median family income of $83,943, accounting for 5.5% and 42.5% of families, respectively.
| Number of Earners | # Families | Median Income |
| No Earners | 1,207 (42.5%) | $83,943 |
| 1 Earner | 826 (29.1%) | $106,014 |
| 2 Earners | 653 (23.0%) | $111,383 |
| 3+ Earners | 156 (5.5%) | $250,001 |
| Total | 2,842 (100.0%) | $97,277 |
Household Income in Rio Vista
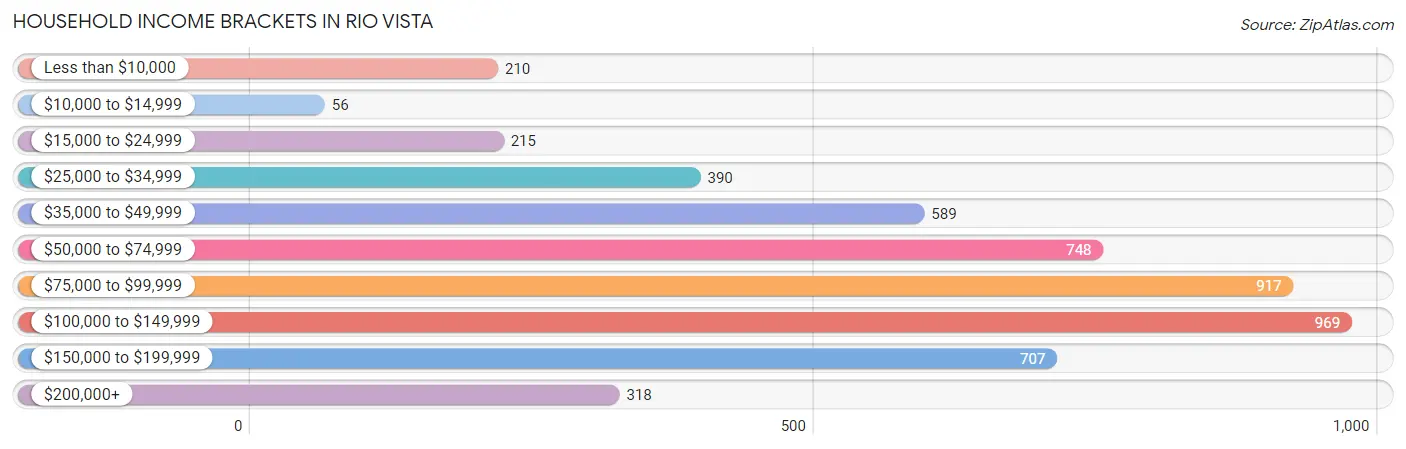
Household Income Brackets in Rio Vista
With 969 households falling in the category, the $100,000 to $149,999 income range is the most frequent in Rio Vista, accounting for 18.9% of all households. In contrast, only 56 households (1.1%) fall into the $10,000 to $14,999 income bracket, making it the least populous group.
| Income Bracket | # Households | % Households |
| Less than $10,000 | 210 | 4.1% |
| $10,000 to $14,999 | 56 | 1.1% |
| $15,000 to $24,999 | 215 | 4.2% |
| $25,000 to $34,999 | 390 | 7.6% |
| $35,000 to $49,999 | 589 | 11.5% |
| $50,000 to $74,999 | 748 | 14.6% |
| $75,000 to $99,999 | 917 | 17.9% |
| $100,000 to $149,999 | 969 | 18.9% |
| $150,000 to $199,999 | 707 | 13.8% |
| $200,000+ | 318 | 6.2% |
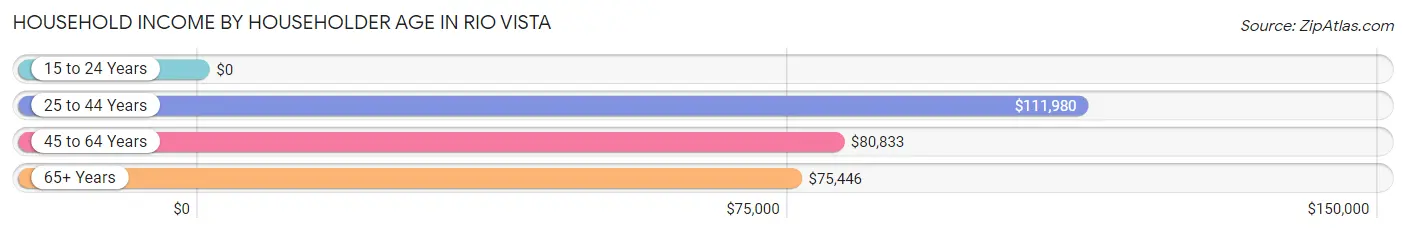
Household Income by Householder Age in Rio Vista
The median household income in Rio Vista is $83,538, with the highest median household income of $111,980 found in the 25 to 44 years age bracket for the primary householder. A total of 523 households (10.2%) fall into this category. Meanwhile, the 15 to 24 years age bracket for the primary householder has the lowest median household income of $0, with 26 households (0.5%) in this group.
| Income Bracket | # Households | Median Income |
| 15 to 24 Years | 26 (0.5%) | $0 |
| 25 to 44 Years | 523 (10.2%) | $111,980 |
| 45 to 64 Years | 1,620 (31.6%) | $80,833 |
| 65+ Years | 2,956 (57.7%) | $75,446 |
| Total | 5,125 (100.0%) | $83,538 |
Poverty in Rio Vista
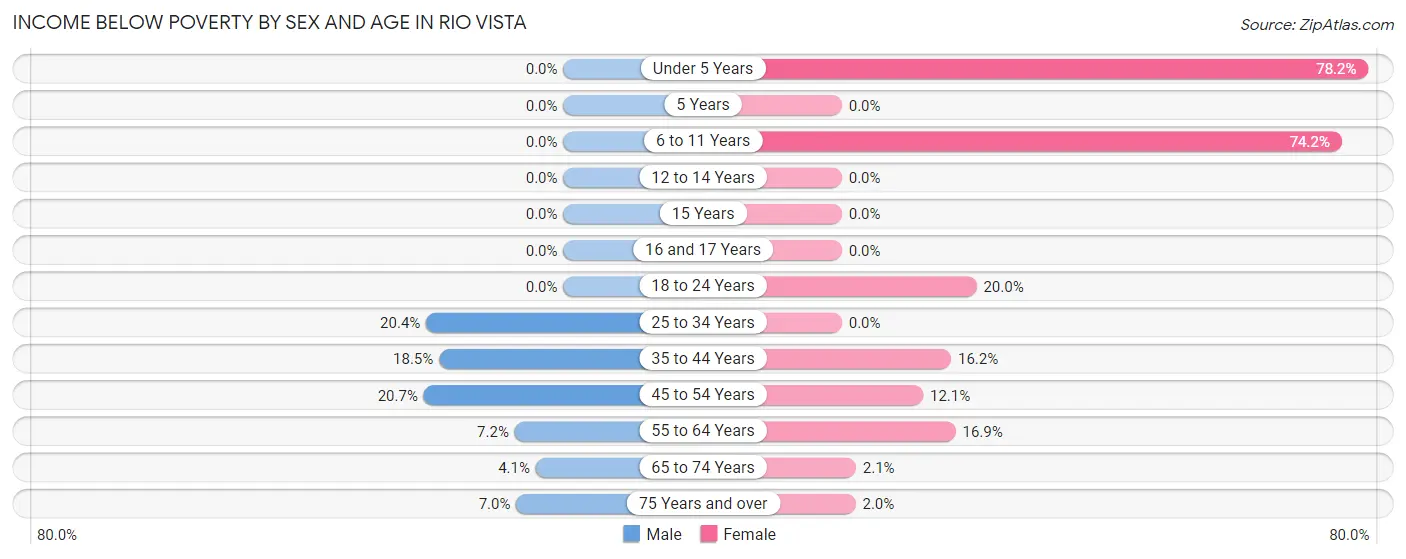
Income Below Poverty by Sex and Age in Rio Vista
With 8.3% poverty level for males and 9.9% for females among the residents of Rio Vista, 45 to 54 year old males and under 5 year old females are the most vulnerable to poverty, with 17 males (20.7%) and 86 females (78.2%) in their respective age groups living below the poverty level.
| Age Bracket | Male | Female |
| Under 5 Years | 0 (0.0%) | 86 (78.2%) |
| 5 Years | 0 (0.0%) | 0 (0.0%) |
| 6 to 11 Years | 0 (0.0%) | 121 (74.2%) |
| 12 to 14 Years | 0 (0.0%) | 0 (0.0%) |
| 15 Years | 0 (0.0%) | 0 (0.0%) |
| 16 and 17 Years | 0 (0.0%) | 0 (0.0%) |
| 18 to 24 Years | 0 (0.0%) | 26 (20.0%) |
| 25 to 34 Years | 132 (20.4%) | 0 (0.0%) |
| 35 to 44 Years | 50 (18.4%) | 24 (16.2%) |
| 45 to 54 Years | 17 (20.7%) | 72 (12.1%) |
| 55 to 64 Years | 74 (7.2%) | 150 (16.9%) |
| 65 to 74 Years | 45 (4.1%) | 30 (2.1%) |
| 75 Years and over | 64 (7.0%) | 29 (2.0%) |
| Total | 382 (8.3%) | 538 (9.9%) |
Income Above Poverty by Sex and Age in Rio Vista
According to the poverty statistics in Rio Vista, males aged under 5 years and females aged 15 years are the age groups that are most secure financially, with 100.0% of males and 100.0% of females in these age groups living above the poverty line.
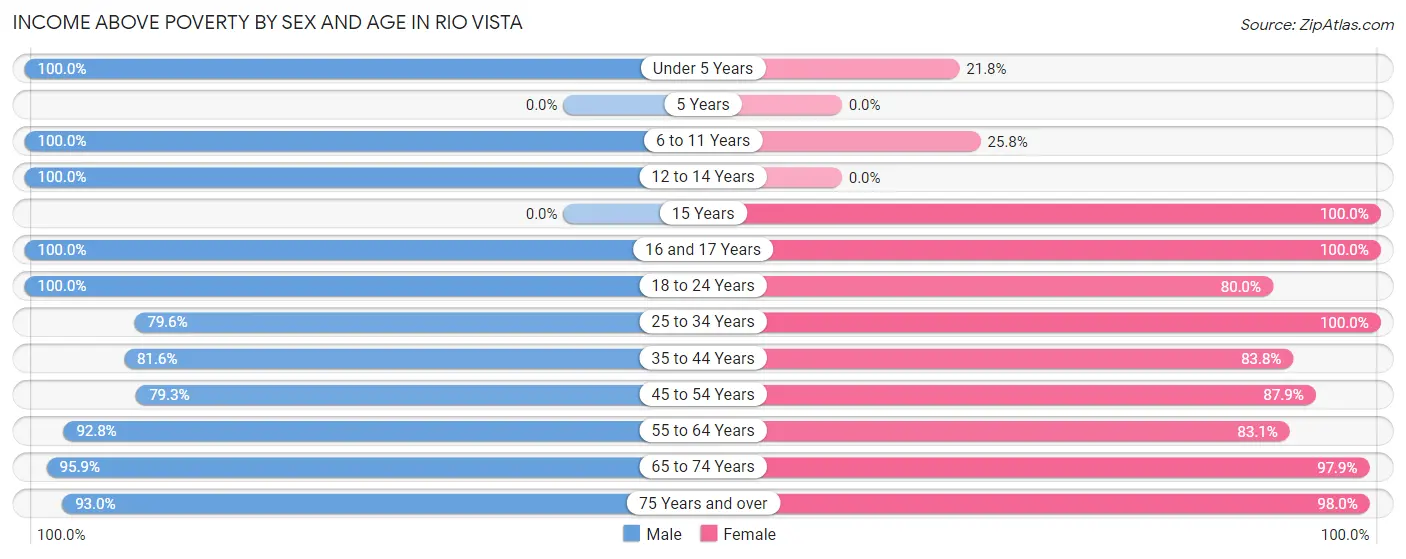
| Age Bracket | Male | Female |
| Under 5 Years | 123 (100.0%) | 24 (21.8%) |
| 5 Years | 0 (0.0%) | 0 (0.0%) |
| 6 to 11 Years | 158 (100.0%) | 42 (25.8%) |
| 12 to 14 Years | 70 (100.0%) | 0 (0.0%) |
| 15 Years | 0 (0.0%) | 17 (100.0%) |
| 16 and 17 Years | 24 (100.0%) | 77 (100.0%) |
| 18 to 24 Years | 202 (100.0%) | 104 (80.0%) |
| 25 to 34 Years | 516 (79.6%) | 466 (100.0%) |
| 35 to 44 Years | 221 (81.6%) | 124 (83.8%) |
| 45 to 54 Years | 65 (79.3%) | 525 (87.9%) |
| 55 to 64 Years | 951 (92.8%) | 738 (83.1%) |
| 65 to 74 Years | 1,056 (95.9%) | 1,407 (97.9%) |
| 75 Years and over | 851 (93.0%) | 1,393 (98.0%) |
| Total | 4,237 (91.7%) | 4,917 (90.1%) |
Income Below Poverty Among Married-Couple Families in Rio Vista
The poverty statistics for married-couple families in Rio Vista show that 5.4% or 122 of the total 2,275 families live below the poverty line. Families with 1 or 2 children have the highest poverty rate of 31.6%, comprising of 83 families. On the other hand, families with 3 or 4 children have the lowest poverty rate of 0.0%, which includes 0 families.
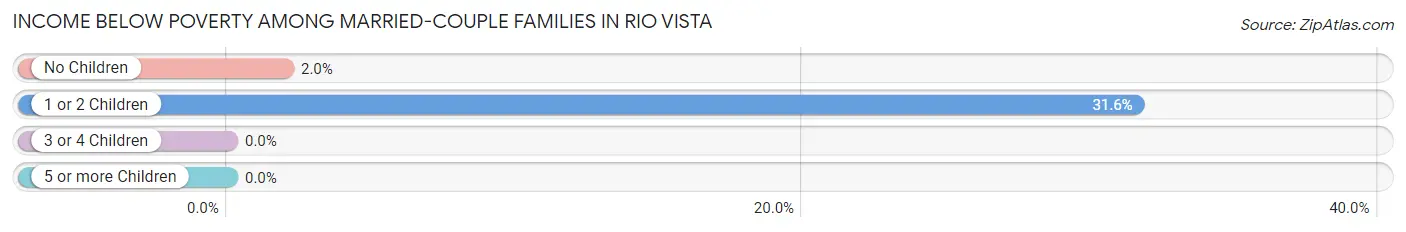
| Children | Above Poverty | Below Poverty |
| No Children | 1,956 (98.1%) | 39 (1.9%) |
| 1 or 2 Children | 180 (68.4%) | 83 (31.6%) |
| 3 or 4 Children | 17 (100.0%) | 0 (0.0%) |
| 5 or more Children | 0 (0.0%) | 0 (0.0%) |
| Total | 2,153 (94.6%) | 122 (5.4%) |
Income Below Poverty Among Single-Parent Households in Rio Vista
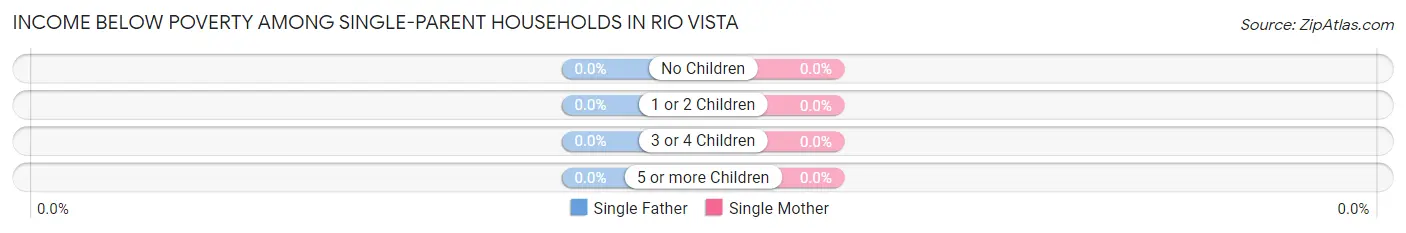
| Children | Single Father | Single Mother |
| No Children | 0 (0.0%) | 0 (0.0%) |
| 1 or 2 Children | 0 (0.0%) | 0 (0.0%) |
| 3 or 4 Children | 0 (0.0%) | 0 (0.0%) |
| 5 or more Children | 0 (0.0%) | 0 (0.0%) |
| Total | 0 (0.0%) | 0 (0.0%) |
Income Below Poverty Among Married-Couple vs Single-Parent Households in Rio Vista
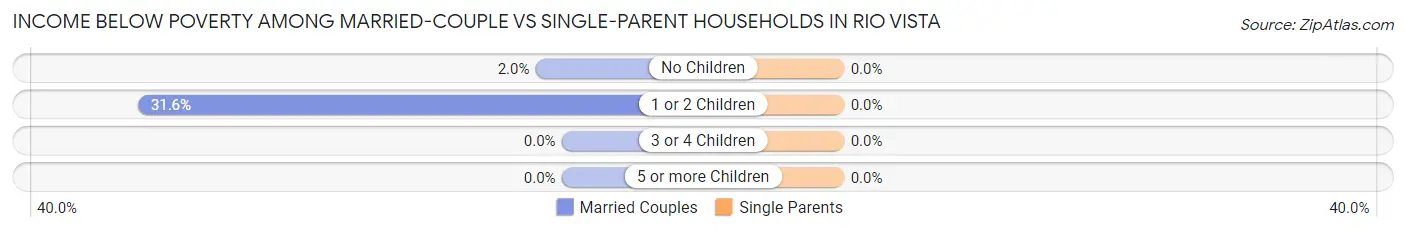
| Children | Married-Couple Families | Single-Parent Households |
| No Children | 39 (1.9%) | 0 (0.0%) |
| 1 or 2 Children | 83 (31.6%) | 0 (0.0%) |
| 3 or 4 Children | 0 (0.0%) | 0 (0.0%) |
| 5 or more Children | 0 (0.0%) | 0 (0.0%) |
| Total | 122 (5.4%) | 0 (0.0%) |
Employment Characteristics in Rio Vista
Employment by Class of Employer in Rio Vista
Among the 3,245 employed individuals in Rio Vista, private company employees (1,812 | 55.8%), local government employees (447 | 13.8%), and self-employed (not incorporated) (410 | 12.6%) make up the most common classes of employment.
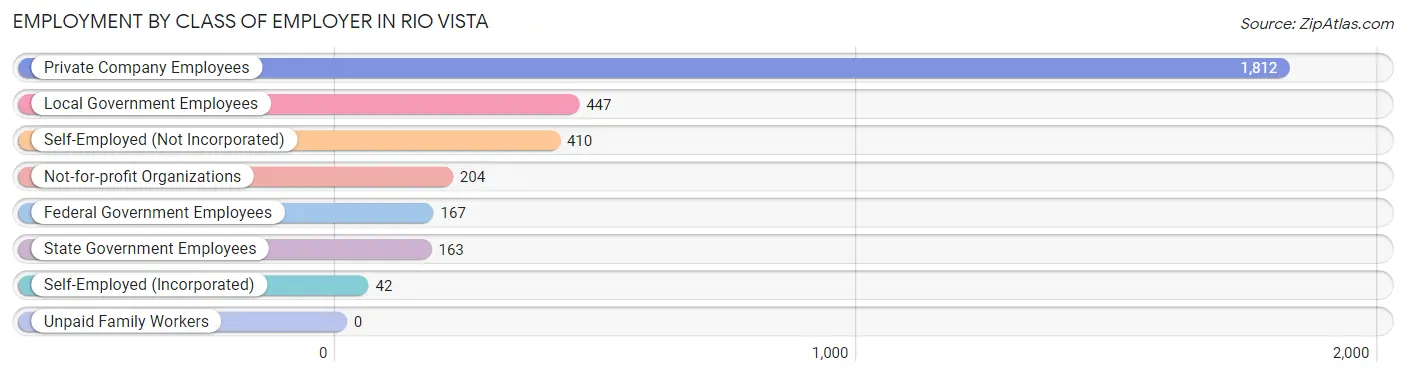
| Employer Class | # Employees | % Employees |
| Private Company Employees | 1,812 | 55.8% |
| Self-Employed (Incorporated) | 42 | 1.3% |
| Self-Employed (Not Incorporated) | 410 | 12.6% |
| Not-for-profit Organizations | 204 | 6.3% |
| Local Government Employees | 447 | 13.8% |
| State Government Employees | 163 | 5.0% |
| Federal Government Employees | 167 | 5.1% |
| Unpaid Family Workers | 0 | 0.0% |
| Total | 3,245 | 100.0% |
Employment Status by Age in Rio Vista
According to the labor force statistics for Rio Vista, out of the total population over 16 years of age (9,433), 41.3% or 3,896 individuals are in the labor force, with 13.4% or 522 of them unemployed. The age group with the highest labor force participation rate is 30 to 34 years, with 96.5% or 626 individuals in the labor force. Within the labor force, the 45 to 54 years age range has the highest percentage of unemployed individuals, with 31.3% or 100 of them being unemployed.
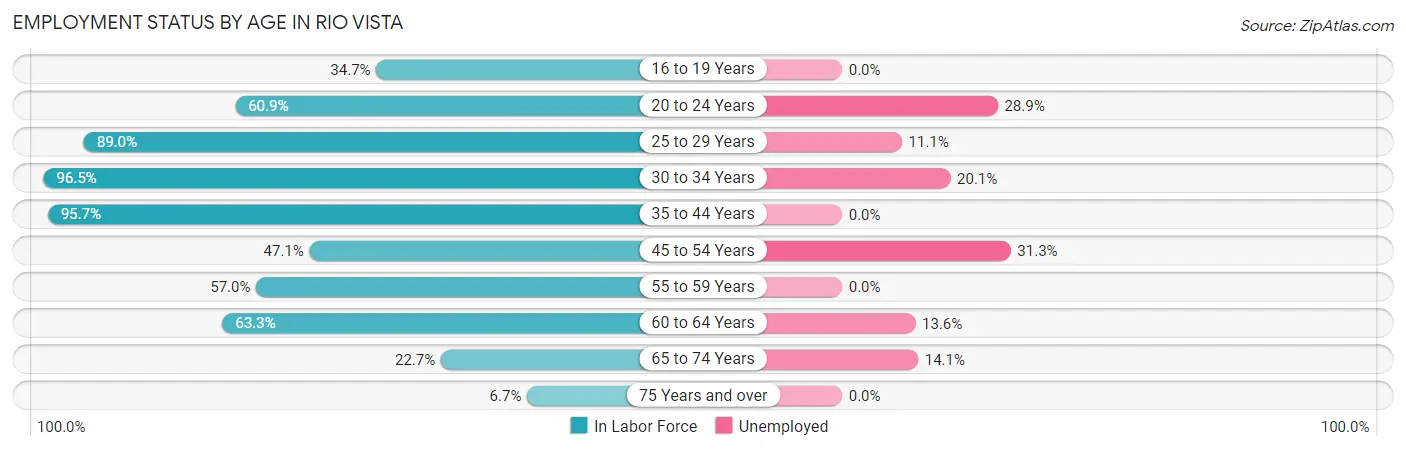
| Age Bracket | In Labor Force | Unemployed |
| 16 to 19 Years | 42 (34.7%) | 0 (0.0%) |
| 20 to 24 Years | 190 (60.9%) | 55 (28.9%) |
| 25 to 29 Years | 414 (89.0%) | 46 (11.1%) |
| 30 to 34 Years | 626 (96.5%) | 126 (20.1%) |
| 35 to 44 Years | 401 (95.7%) | 0 (0.0%) |
| 45 to 54 Years | 320 (47.1%) | 100 (31.3%) |
| 55 to 59 Years | 329 (57.0%) | 0 (0.0%) |
| 60 to 64 Years | 846 (63.3%) | 115 (13.6%) |
| 65 to 74 Years | 576 (22.7%) | 81 (14.1%) |
| 75 Years and over | 157 (6.7%) | 0 (0.0%) |
| Total | 3,896 (41.3%) | 522 (13.4%) |
Employment Status by Educational Attainment in Rio Vista
According to labor force statistics for Rio Vista, 71.2% of individuals (2,937) out of the total population between 25 and 64 years of age (4,125) are in the labor force, with 13.2% or 388 of them being unemployed. The group with the highest labor force participation rate are those with the educational attainment of less than high school, with 83.2% or 318 individuals in the labor force. Within the labor force, individuals with less than high school education have the highest percentage of unemployment, with 31.1% or 99 of them being unemployed.
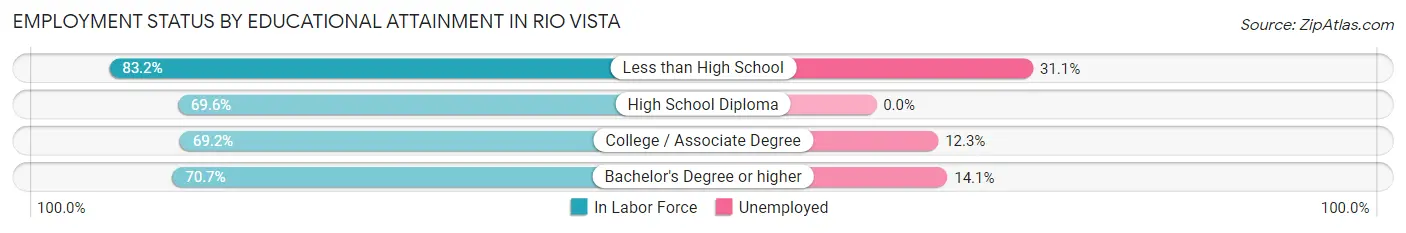
| Educational Attainment | In Labor Force | Unemployed |
| Less than High School | 318 (83.2%) | 119 (31.1%) |
| High School Diploma | 450 (69.6%) | 0 (0.0%) |
| College / Associate Degree | 1,028 (69.2%) | 183 (12.3%) |
| Bachelor's Degree or higher | 1,138 (70.7%) | 227 (14.1%) |
| Total | 2,937 (71.2%) | 544 (13.2%) |
Employment Occupations by Sex in Rio Vista
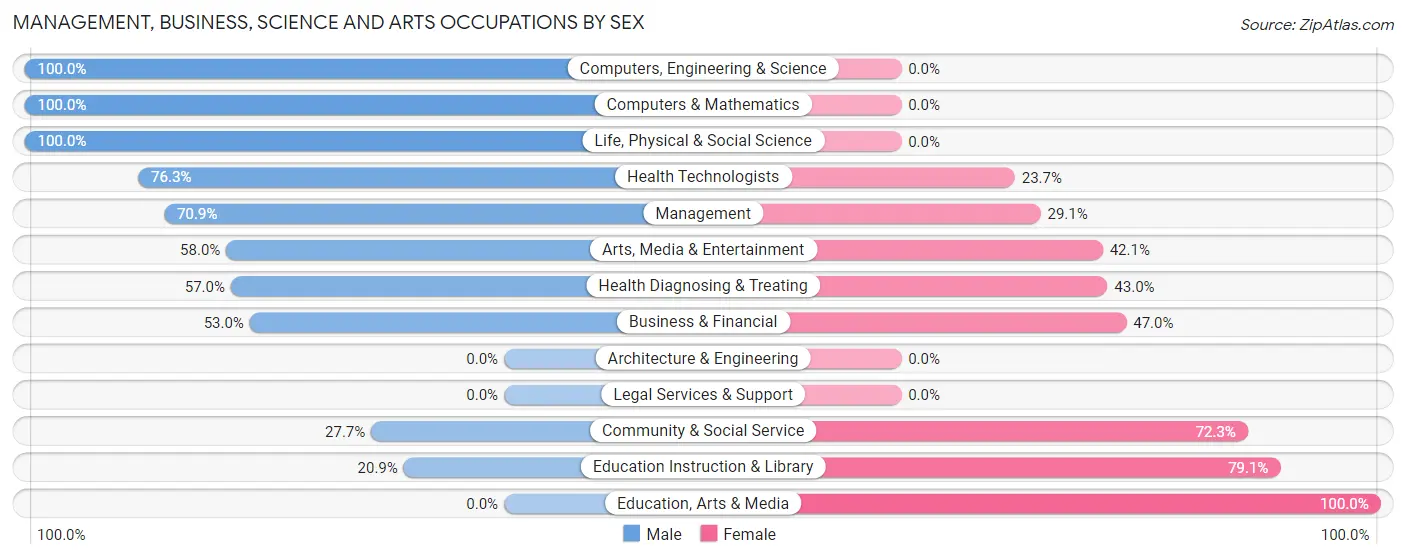
Management, Business, Science and Arts Occupations
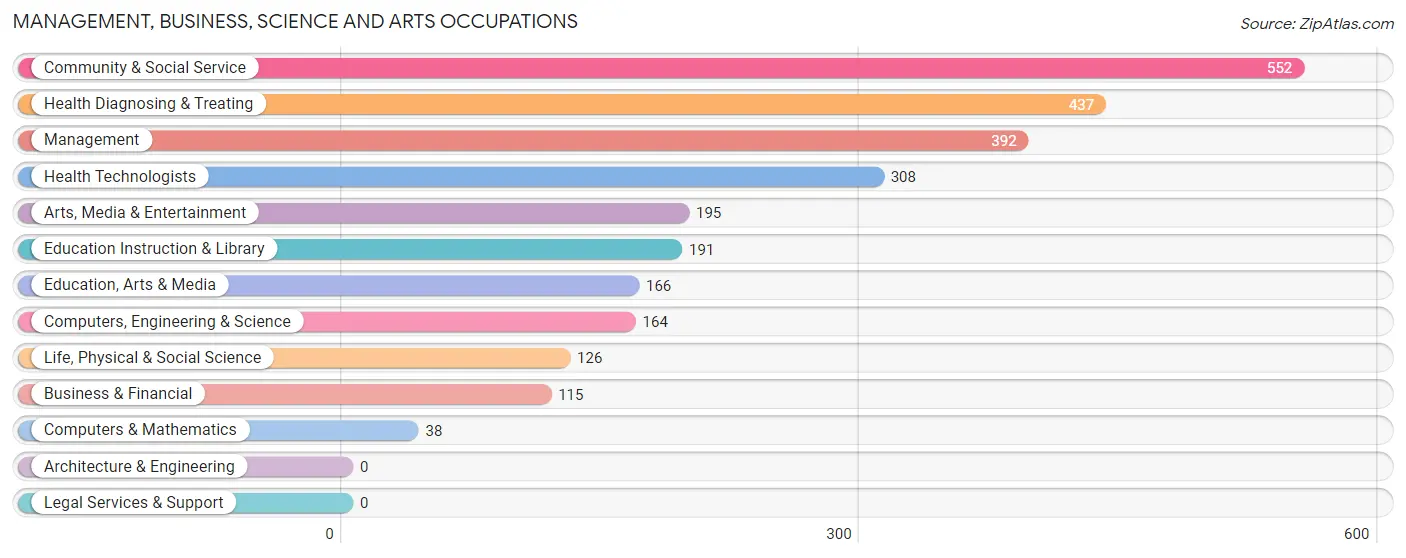
The most common Management, Business, Science and Arts occupations in Rio Vista are Community & Social Service (552 | 16.4%), Health Diagnosing & Treating (437 | 12.9%), Management (392 | 11.6%), Health Technologists (308 | 9.1%), and Arts, Media & Entertainment (195 | 5.8%).
Management, Business, Science and Arts Occupations by Sex
Within the Management, Business, Science and Arts occupations in Rio Vista, the most male-oriented occupations are Computers, Engineering & Science (100.0%), Computers & Mathematics (100.0%), and Life, Physical & Social Science (100.0%), while the most female-oriented occupations are Education, Arts & Media (100.0%), Education Instruction & Library (79.1%), and Community & Social Service (72.3%).
| Occupation | Male | Female |
| Management | 278 (70.9%) | 114 (29.1%) |
| Business & Financial | 61 (53.0%) | 54 (47.0%) |
| Computers, Engineering & Science | 164 (100.0%) | 0 (0.0%) |
| Computers & Mathematics | 38 (100.0%) | 0 (0.0%) |
| Architecture & Engineering | 0 (0.0%) | 0 (0.0%) |
| Life, Physical & Social Science | 126 (100.0%) | 0 (0.0%) |
| Community & Social Service | 153 (27.7%) | 399 (72.3%) |
| Education, Arts & Media | 0 (0.0%) | 166 (100.0%) |
| Legal Services & Support | 0 (0.0%) | 0 (0.0%) |
| Education Instruction & Library | 40 (20.9%) | 151 (79.1%) |
| Arts, Media & Entertainment | 113 (58.0%) | 82 (42.0%) |
| Health Diagnosing & Treating | 249 (57.0%) | 188 (43.0%) |
| Health Technologists | 235 (76.3%) | 73 (23.7%) |
| Total (Category) | 905 (54.5%) | 755 (45.5%) |
| Total (Overall) | 1,803 (53.4%) | 1,573 (46.6%) |
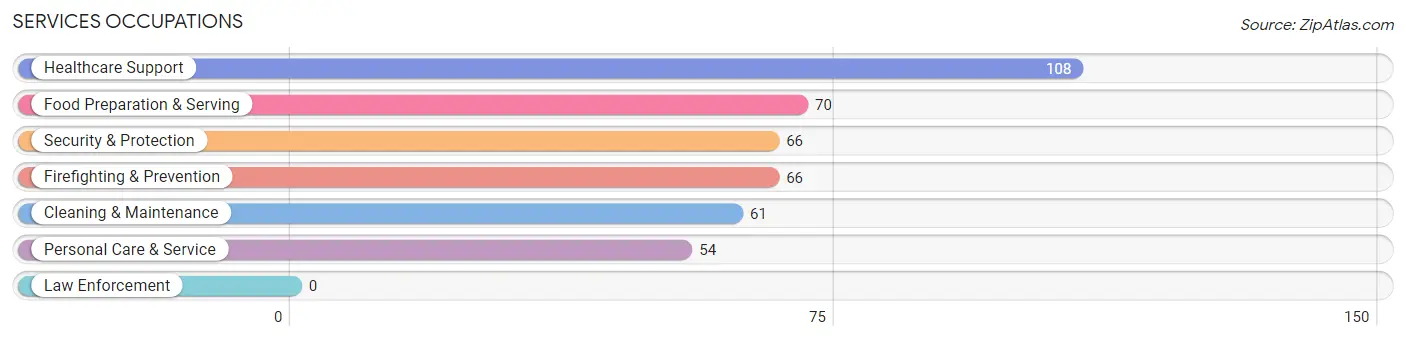
Services Occupations
The most common Services occupations in Rio Vista are Healthcare Support (108 | 3.2%), Food Preparation & Serving (70 | 2.1%), Security & Protection (66 | 1.9%), Firefighting & Prevention (66 | 1.9%), and Cleaning & Maintenance (61 | 1.8%).
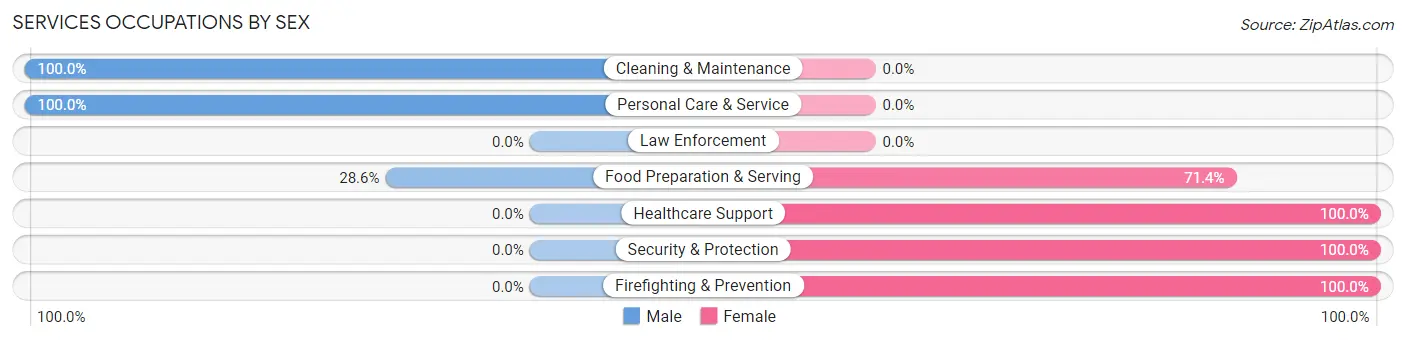
Services Occupations by Sex
Within the Services occupations in Rio Vista, the most male-oriented occupations are Cleaning & Maintenance (100.0%), Personal Care & Service (100.0%), and Food Preparation & Serving (28.6%), while the most female-oriented occupations are Healthcare Support (100.0%), Security & Protection (100.0%), and Firefighting & Prevention (100.0%).
| Occupation | Male | Female |
| Healthcare Support | 0 (0.0%) | 108 (100.0%) |
| Security & Protection | 0 (0.0%) | 66 (100.0%) |
| Firefighting & Prevention | 0 (0.0%) | 66 (100.0%) |
| Law Enforcement | 0 (0.0%) | 0 (0.0%) |
| Food Preparation & Serving | 20 (28.6%) | 50 (71.4%) |
| Cleaning & Maintenance | 61 (100.0%) | 0 (0.0%) |
| Personal Care & Service | 54 (100.0%) | 0 (0.0%) |
| Total (Category) | 135 (37.6%) | 224 (62.4%) |
| Total (Overall) | 1,803 (53.4%) | 1,573 (46.6%) |
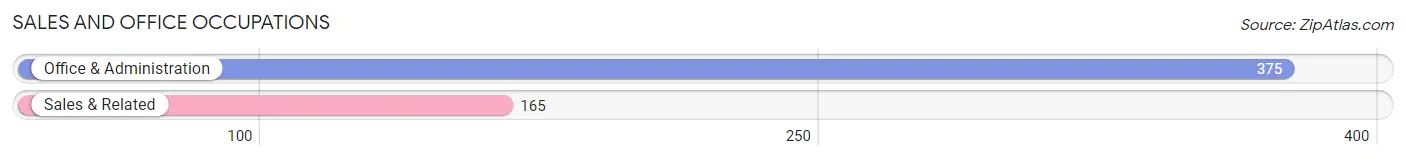
Sales and Office Occupations
The most common Sales and Office occupations in Rio Vista are Office & Administration (375 | 11.1%), and Sales & Related (165 | 4.9%).
Sales and Office Occupations by Sex

| Occupation | Male | Female |
| Sales & Related | 44 (26.7%) | 121 (73.3%) |
| Office & Administration | 14 (3.7%) | 361 (96.3%) |
| Total (Category) | 58 (10.7%) | 482 (89.3%) |
| Total (Overall) | 1,803 (53.4%) | 1,573 (46.6%) |
Natural Resources, Construction and Maintenance Occupations
The most common Natural Resources, Construction and Maintenance occupations in Rio Vista are Construction & Extraction (205 | 6.1%), Installation, Maintenance & Repair (176 | 5.2%), and Farming, Fishing & Forestry (103 | 3.0%).

Natural Resources, Construction and Maintenance Occupations by Sex

| Occupation | Male | Female |
| Farming, Fishing & Forestry | 103 (100.0%) | 0 (0.0%) |
| Construction & Extraction | 185 (90.2%) | 20 (9.8%) |
| Installation, Maintenance & Repair | 176 (100.0%) | 0 (0.0%) |
| Total (Category) | 464 (95.9%) | 20 (4.1%) |
| Total (Overall) | 1,803 (53.4%) | 1,573 (46.6%) |
Production, Transportation and Moving Occupations
The most common Production, Transportation and Moving occupations in Rio Vista are Material Moving (150 | 4.4%), Production (136 | 4.0%), and Transportation (47 | 1.4%).
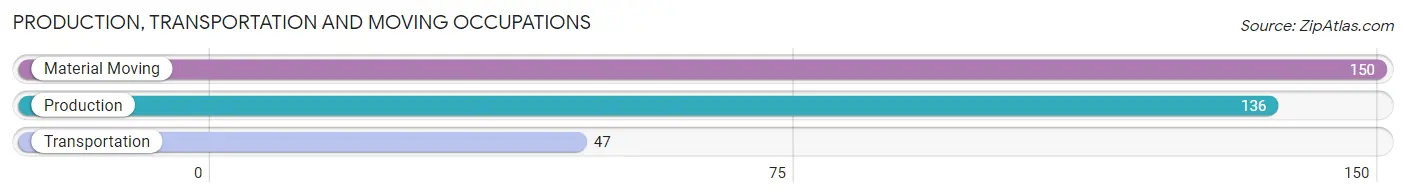
Production, Transportation and Moving Occupations by Sex

| Occupation | Male | Female |
| Production | 84 (61.8%) | 52 (38.2%) |
| Transportation | 47 (100.0%) | 0 (0.0%) |
| Material Moving | 110 (73.3%) | 40 (26.7%) |
| Total (Category) | 241 (72.4%) | 92 (27.6%) |
| Total (Overall) | 1,803 (53.4%) | 1,573 (46.6%) |
Employment Industries by Sex in Rio Vista
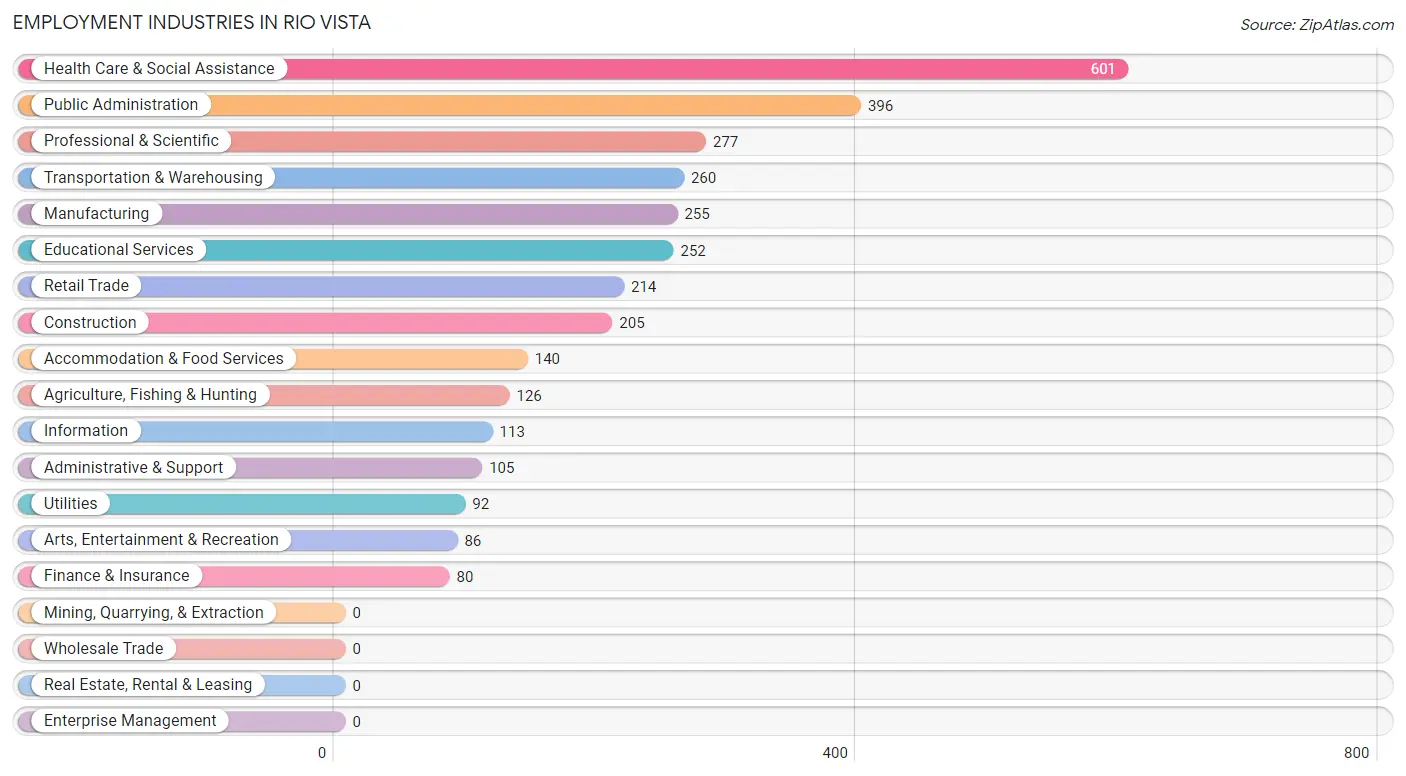
Employment Industries in Rio Vista
The major employment industries in Rio Vista include Health Care & Social Assistance (601 | 17.8%), Public Administration (396 | 11.7%), Professional & Scientific (277 | 8.2%), Transportation & Warehousing (260 | 7.7%), and Manufacturing (255 | 7.5%).
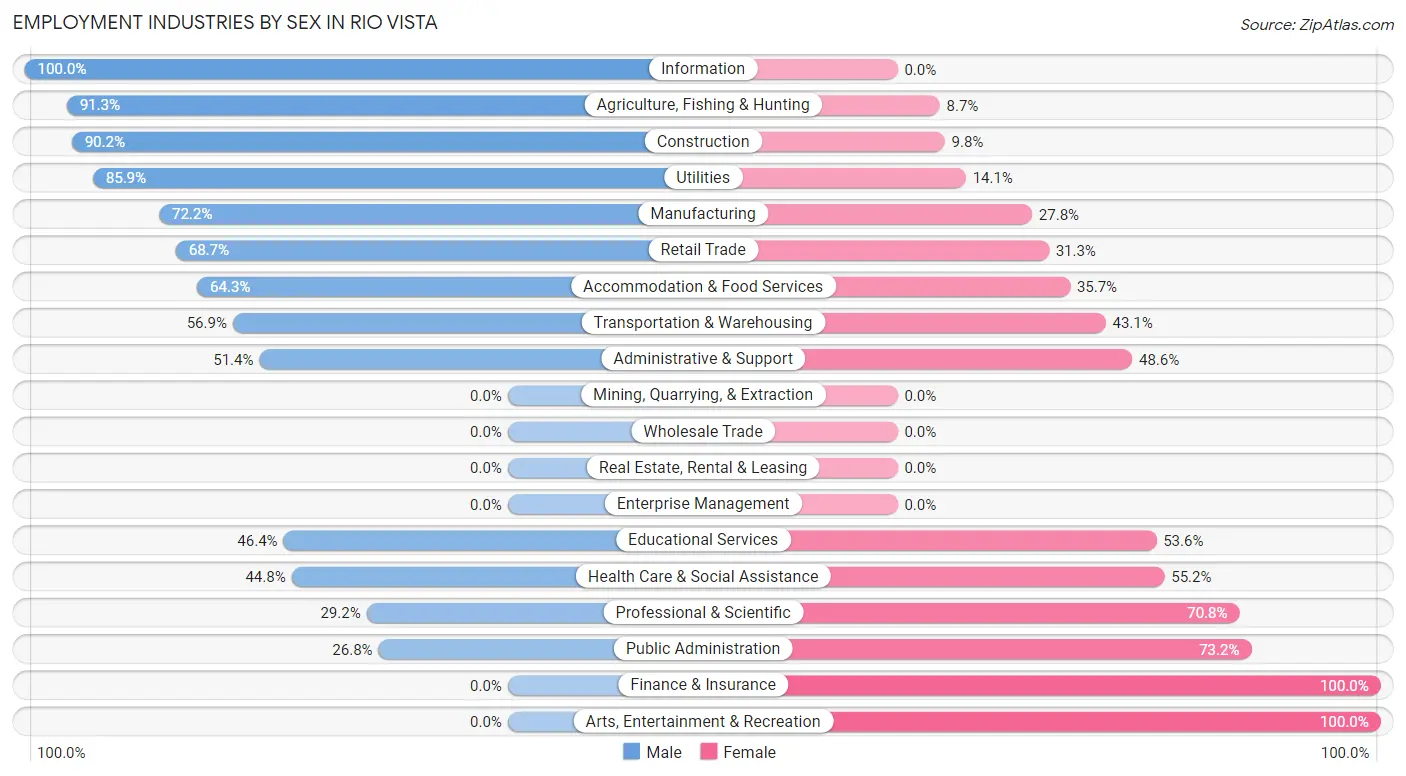
Employment Industries by Sex in Rio Vista
The Rio Vista industries that see more men than women are Information (100.0%), Agriculture, Fishing & Hunting (91.3%), and Construction (90.2%), whereas the industries that tend to have a higher number of women are Finance & Insurance (100.0%), Arts, Entertainment & Recreation (100.0%), and Public Administration (73.2%).
| Industry | Male | Female |
| Agriculture, Fishing & Hunting | 115 (91.3%) | 11 (8.7%) |
| Mining, Quarrying, & Extraction | 0 (0.0%) | 0 (0.0%) |
| Construction | 185 (90.2%) | 20 (9.8%) |
| Manufacturing | 184 (72.2%) | 71 (27.8%) |
| Wholesale Trade | 0 (0.0%) | 0 (0.0%) |
| Retail Trade | 147 (68.7%) | 67 (31.3%) |
| Transportation & Warehousing | 148 (56.9%) | 112 (43.1%) |
| Utilities | 79 (85.9%) | 13 (14.1%) |
| Information | 113 (100.0%) | 0 (0.0%) |
| Finance & Insurance | 0 (0.0%) | 80 (100.0%) |
| Real Estate, Rental & Leasing | 0 (0.0%) | 0 (0.0%) |
| Professional & Scientific | 81 (29.2%) | 196 (70.8%) |
| Enterprise Management | 0 (0.0%) | 0 (0.0%) |
| Administrative & Support | 54 (51.4%) | 51 (48.6%) |
| Educational Services | 117 (46.4%) | 135 (53.6%) |
| Health Care & Social Assistance | 269 (44.8%) | 332 (55.2%) |
| Arts, Entertainment & Recreation | 0 (0.0%) | 86 (100.0%) |
| Accommodation & Food Services | 90 (64.3%) | 50 (35.7%) |
| Public Administration | 106 (26.8%) | 290 (73.2%) |
| Total | 1,803 (53.4%) | 1,573 (46.6%) |
Education in Rio Vista
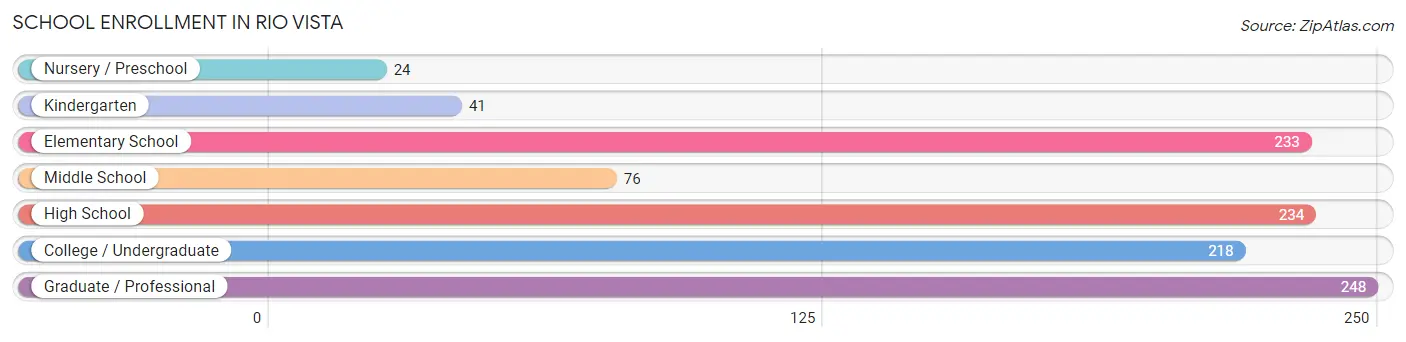
School Enrollment in Rio Vista
The most common levels of schooling among the 1,074 students in Rio Vista are graduate / professional (248 | 23.1%), high school (234 | 21.8%), and elementary school (233 | 21.7%).
| School Level | # Students | % Students |
| Nursery / Preschool | 24 | 2.2% |
| Kindergarten | 41 | 3.8% |
| Elementary School | 233 | 21.7% |
| Middle School | 76 | 7.1% |
| High School | 234 | 21.8% |
| College / Undergraduate | 218 | 20.3% |
| Graduate / Professional | 248 | 23.1% |
| Total | 1,074 | 100.0% |
School Enrollment by Age by Funding Source in Rio Vista
Out of a total of 1,074 students who are enrolled in schools in Rio Vista, 221 (20.6%) attend a private institution, while the remaining 853 (79.4%) are enrolled in public schools. The age group of 35 years and over has the highest likelihood of being enrolled in private schools, with 131 (70.1% in the age bracket) enrolled. Conversely, the age group of 3 to 4 year olds has the lowest likelihood of being enrolled in a private school, with 24 (100.0% in the age bracket) attending a public institution.
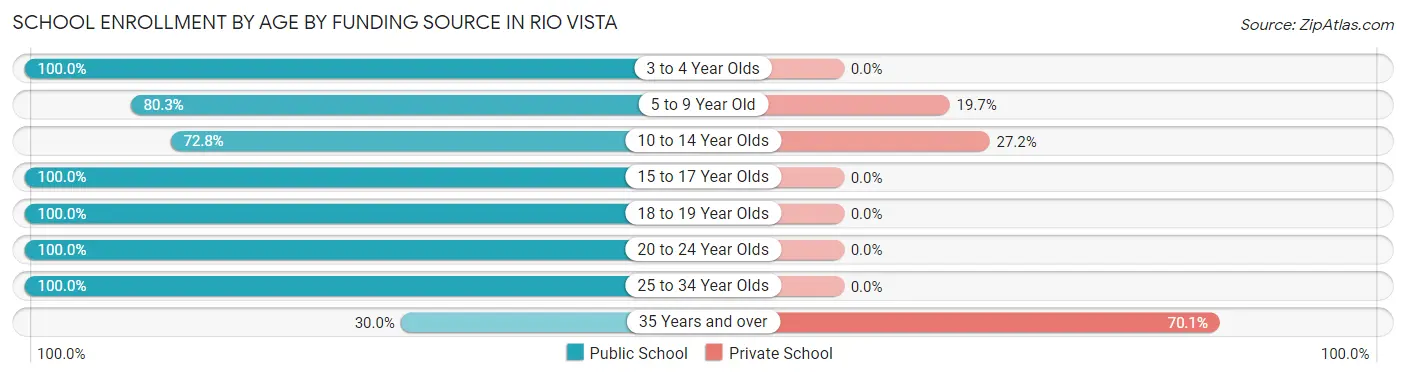
| Age Bracket | Public School | Private School |
| 3 to 4 Year Olds | 24 (100.0%) | 0 (0.0%) |
| 5 to 9 Year Old | 175 (80.3%) | 43 (19.7%) |
| 10 to 14 Year Olds | 126 (72.8%) | 47 (27.2%) |
| 15 to 17 Year Olds | 118 (100.0%) | 0 (0.0%) |
| 18 to 19 Year Olds | 20 (100.0%) | 0 (0.0%) |
| 20 to 24 Year Olds | 138 (100.0%) | 0 (0.0%) |
| 25 to 34 Year Olds | 196 (100.0%) | 0 (0.0%) |
| 35 Years and over | 56 (29.9%) | 131 (70.1%) |
| Total | 853 (79.4%) | 221 (20.6%) |
Educational Attainment by Field of Study in Rio Vista
Science & technology (547 | 15.1%), liberal arts & history (497 | 13.7%), business (488 | 13.5%), arts & humanities (470 | 13.0%), and social sciences (386 | 10.6%) are the most common fields of study among 3,626 individuals in Rio Vista who have obtained a bachelor's degree or higher.
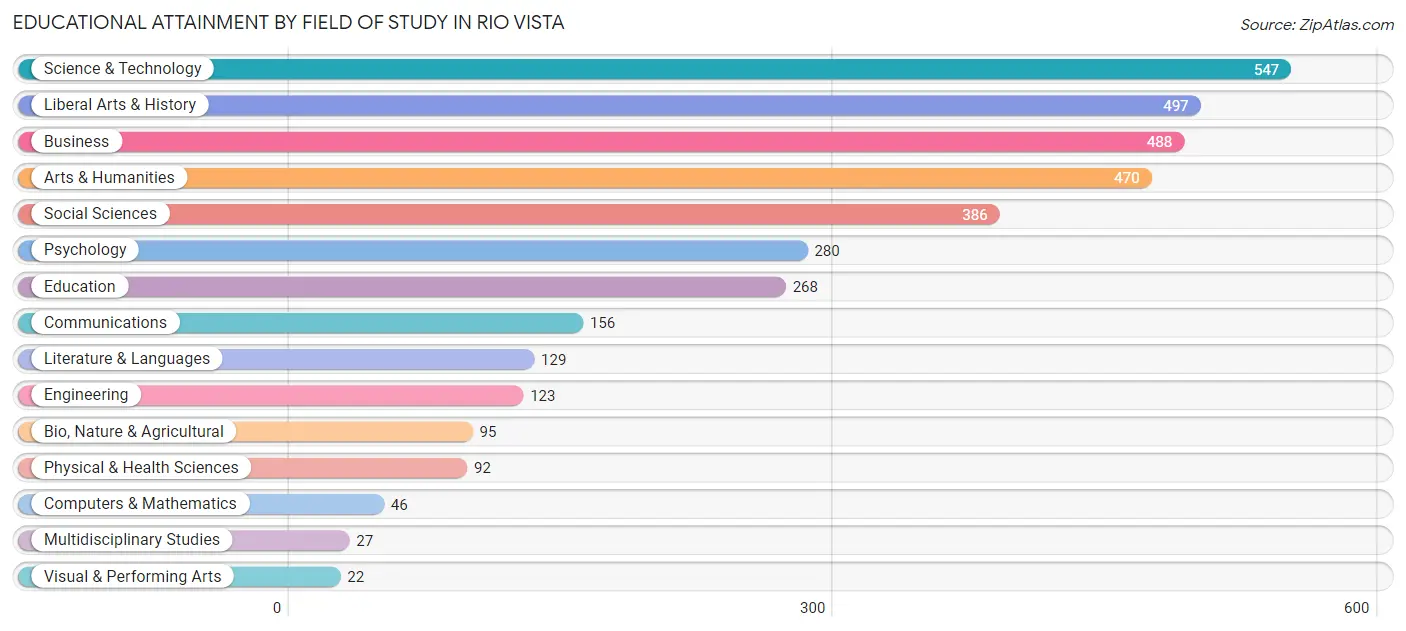
| Field of Study | # Graduates | % Graduates |
| Computers & Mathematics | 46 | 1.3% |
| Bio, Nature & Agricultural | 95 | 2.6% |
| Physical & Health Sciences | 92 | 2.5% |
| Psychology | 280 | 7.7% |
| Social Sciences | 386 | 10.6% |
| Engineering | 123 | 3.4% |
| Multidisciplinary Studies | 27 | 0.7% |
| Science & Technology | 547 | 15.1% |
| Business | 488 | 13.5% |
| Education | 268 | 7.4% |
| Literature & Languages | 129 | 3.6% |
| Liberal Arts & History | 497 | 13.7% |
| Visual & Performing Arts | 22 | 0.6% |
| Communications | 156 | 4.3% |
| Arts & Humanities | 470 | 13.0% |
| Total | 3,626 | 100.0% |
Transportation & Commute in Rio Vista
Vehicle Availability by Sex in Rio Vista
The most prevalent vehicle ownership categories in Rio Vista are males with 2 vehicles (1,030, accounting for 59.3%) and females with 2 vehicles (635, making up 68.3%).
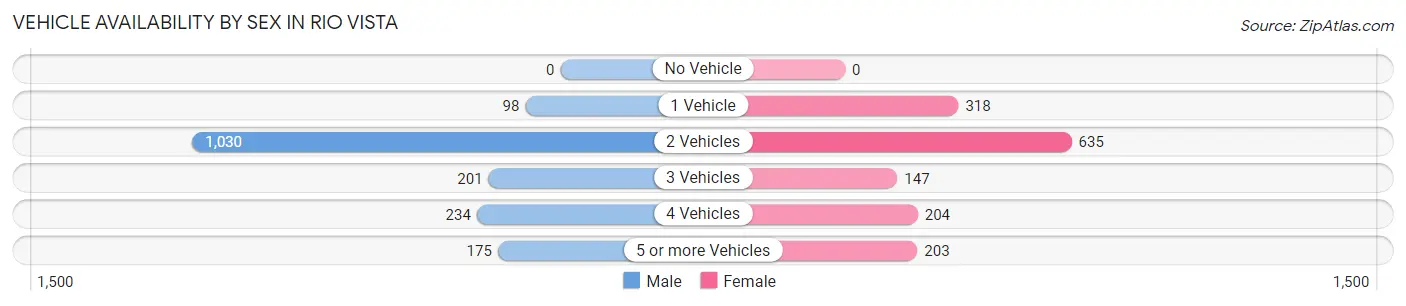
| Vehicles Available | Male | Female |
| No Vehicle | 0 (0.0%) | 0 (0.0%) |
| 1 Vehicle | 98 (5.6%) | 318 (21.1%) |
| 2 Vehicles | 1,030 (59.3%) | 635 (42.1%) |
| 3 Vehicles | 201 (11.6%) | 147 (9.8%) |
| 4 Vehicles | 234 (13.5%) | 204 (13.5%) |
| 5 or more Vehicles | 175 (10.1%) | 203 (13.5%) |
| Total | 1,738 (100.0%) | 1,507 (100.0%) |
Commute Time in Rio Vista
The most frequently occuring commute durations in Rio Vista are 45 to 59 minutes (758 commuters, 26.7%), 30 to 34 minutes (496 commuters, 17.4%), and 10 to 14 minutes (417 commuters, 14.7%).
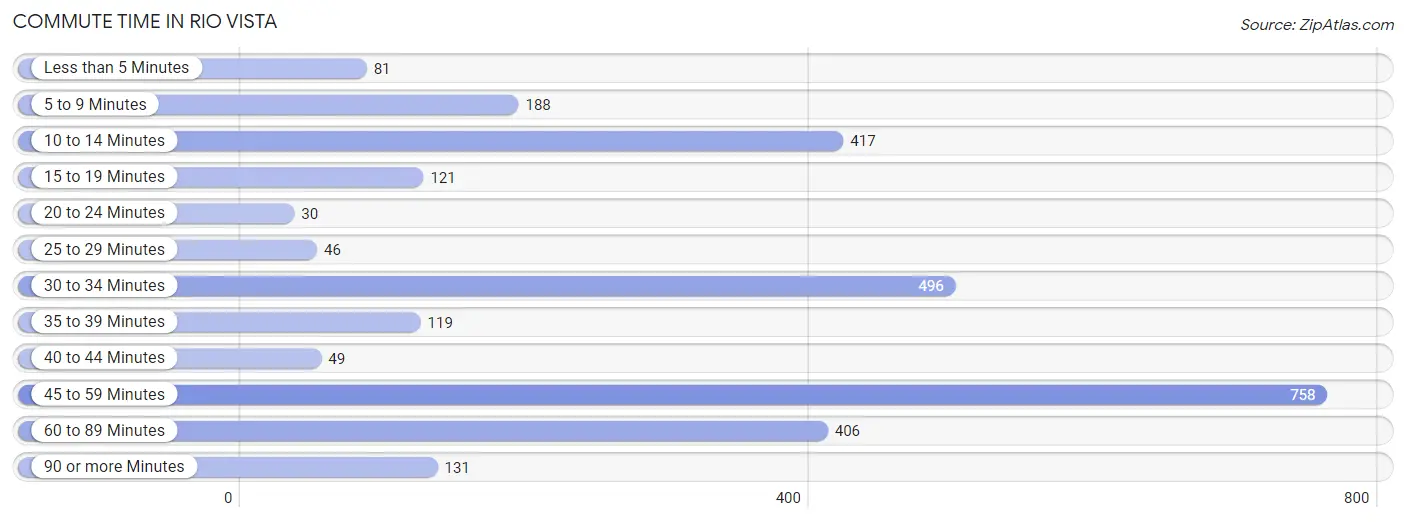
| Commute Time | # Commuters | % Commuters |
| Less than 5 Minutes | 81 | 2.9% |
| 5 to 9 Minutes | 188 | 6.6% |
| 10 to 14 Minutes | 417 | 14.7% |
| 15 to 19 Minutes | 121 | 4.3% |
| 20 to 24 Minutes | 30 | 1.1% |
| 25 to 29 Minutes | 46 | 1.6% |
| 30 to 34 Minutes | 496 | 17.4% |
| 35 to 39 Minutes | 119 | 4.2% |
| 40 to 44 Minutes | 49 | 1.7% |
| 45 to 59 Minutes | 758 | 26.7% |
| 60 to 89 Minutes | 406 | 14.3% |
| 90 or more Minutes | 131 | 4.6% |
Commute Time by Sex in Rio Vista
The most common commute times in Rio Vista are 45 to 59 minutes (333 commuters, 21.1%) for males and 45 to 59 minutes (425 commuters, 33.6%) for females.
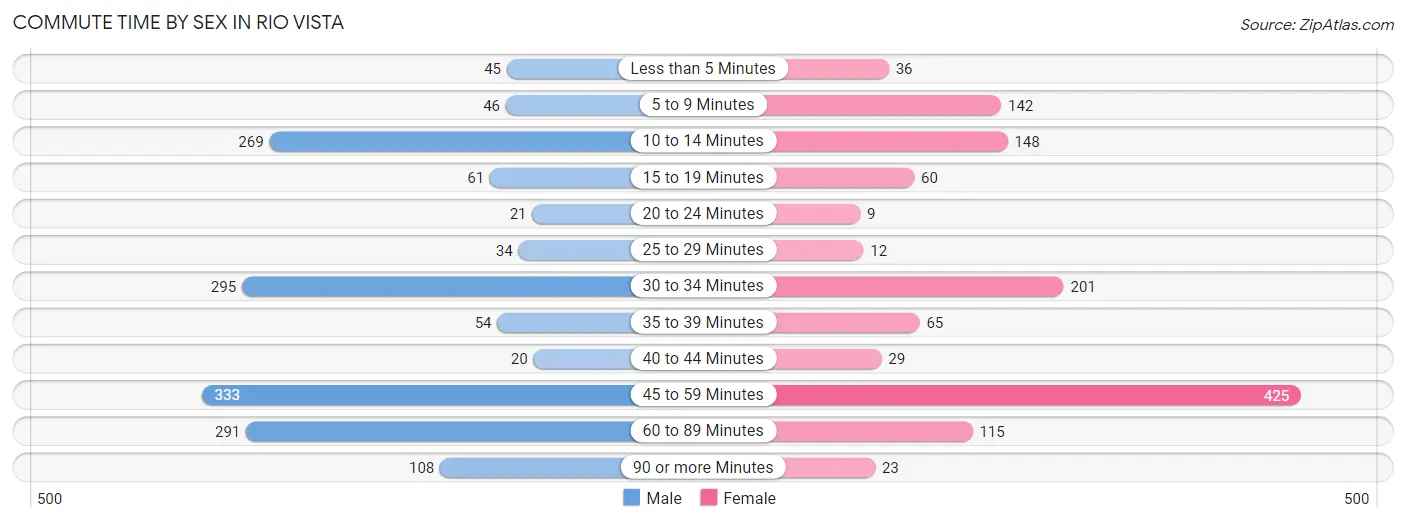
| Commute Time | Male | Female |
| Less than 5 Minutes | 45 (2.9%) | 36 (2.9%) |
| 5 to 9 Minutes | 46 (2.9%) | 142 (11.2%) |
| 10 to 14 Minutes | 269 (17.1%) | 148 (11.7%) |
| 15 to 19 Minutes | 61 (3.9%) | 60 (4.7%) |
| 20 to 24 Minutes | 21 (1.3%) | 9 (0.7%) |
| 25 to 29 Minutes | 34 (2.2%) | 12 (0.9%) |
| 30 to 34 Minutes | 295 (18.7%) | 201 (15.9%) |
| 35 to 39 Minutes | 54 (3.4%) | 65 (5.1%) |
| 40 to 44 Minutes | 20 (1.3%) | 29 (2.3%) |
| 45 to 59 Minutes | 333 (21.1%) | 425 (33.6%) |
| 60 to 89 Minutes | 291 (18.4%) | 115 (9.1%) |
| 90 or more Minutes | 108 (6.9%) | 23 (1.8%) |
Time of Departure to Work by Sex in Rio Vista
The most frequent times of departure to work in Rio Vista are 8:00 AM to 8:29 AM (462, 29.3%) for males and 5:00 AM to 5:29 AM (233, 18.4%) for females.
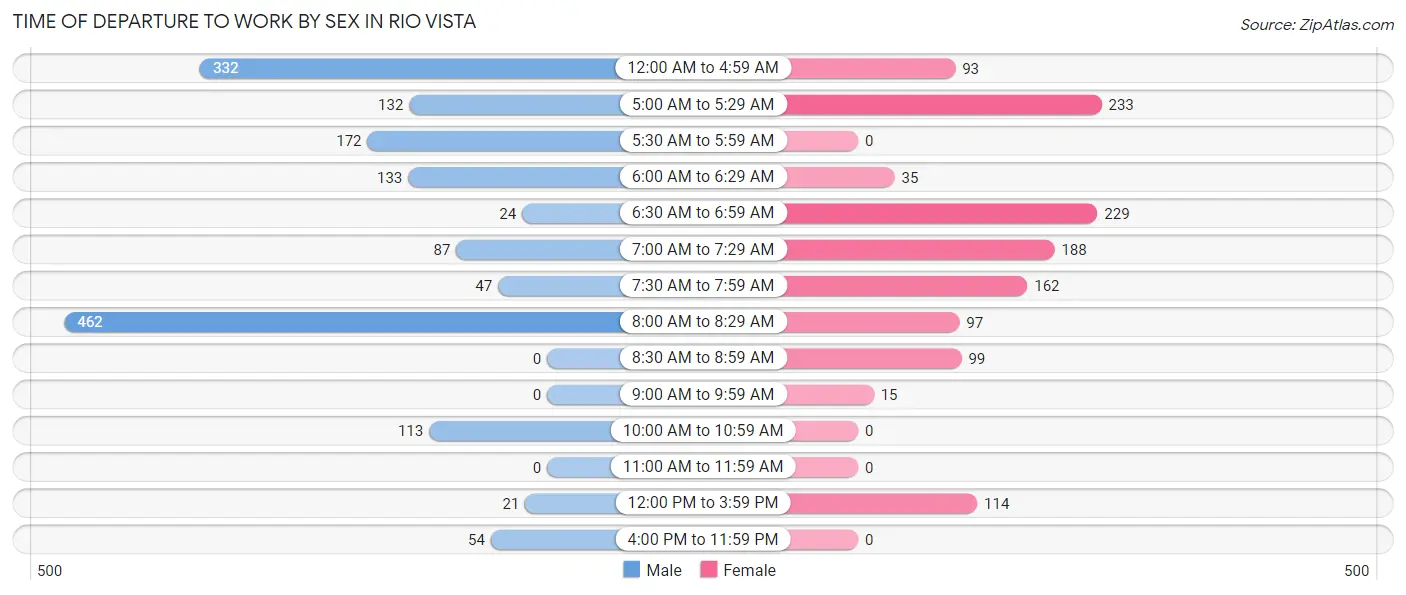
| Time of Departure | Male | Female |
| 12:00 AM to 4:59 AM | 332 (21.0%) | 93 (7.3%) |
| 5:00 AM to 5:29 AM | 132 (8.4%) | 233 (18.4%) |
| 5:30 AM to 5:59 AM | 172 (10.9%) | 0 (0.0%) |
| 6:00 AM to 6:29 AM | 133 (8.4%) | 35 (2.8%) |
| 6:30 AM to 6:59 AM | 24 (1.5%) | 229 (18.1%) |
| 7:00 AM to 7:29 AM | 87 (5.5%) | 188 (14.9%) |
| 7:30 AM to 7:59 AM | 47 (3.0%) | 162 (12.8%) |
| 8:00 AM to 8:29 AM | 462 (29.3%) | 97 (7.7%) |
| 8:30 AM to 8:59 AM | 0 (0.0%) | 99 (7.8%) |
| 9:00 AM to 9:59 AM | 0 (0.0%) | 15 (1.2%) |
| 10:00 AM to 10:59 AM | 113 (7.2%) | 0 (0.0%) |
| 11:00 AM to 11:59 AM | 0 (0.0%) | 0 (0.0%) |
| 12:00 PM to 3:59 PM | 21 (1.3%) | 114 (9.0%) |
| 4:00 PM to 11:59 PM | 54 (3.4%) | 0 (0.0%) |
| Total | 1,577 (100.0%) | 1,265 (100.0%) |
Housing Occupancy in Rio Vista
Occupancy by Ownership in Rio Vista
Of the total 5,125 dwellings in Rio Vista, owner-occupied units account for 4,116 (80.3%), while renter-occupied units make up 1,009 (19.7%).
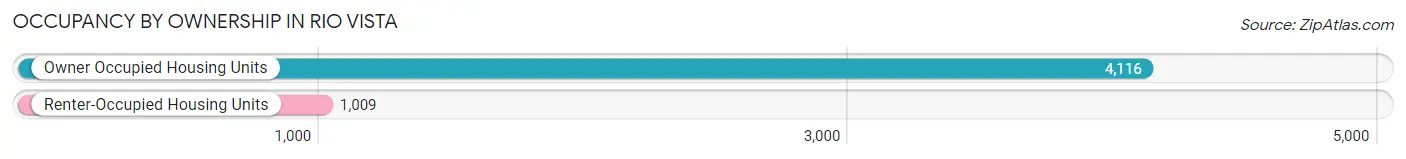
| Occupancy | # Housing Units | % Housing Units |
| Owner Occupied Housing Units | 4,116 | 80.3% |
| Renter-Occupied Housing Units | 1,009 | 19.7% |
| Total Occupied Housing Units | 5,125 | 100.0% |
Occupancy by Household Size in Rio Vista
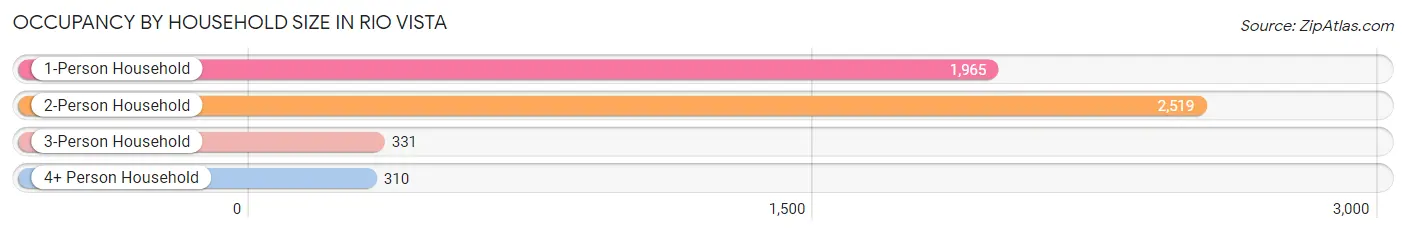
| Household Size | # Housing Units | % Housing Units |
| 1-Person Household | 1,965 | 38.3% |
| 2-Person Household | 2,519 | 49.1% |
| 3-Person Household | 331 | 6.5% |
| 4+ Person Household | 310 | 6.0% |
| Total Housing Units | 5,125 | 100.0% |
Occupancy by Ownership by Household Size in Rio Vista
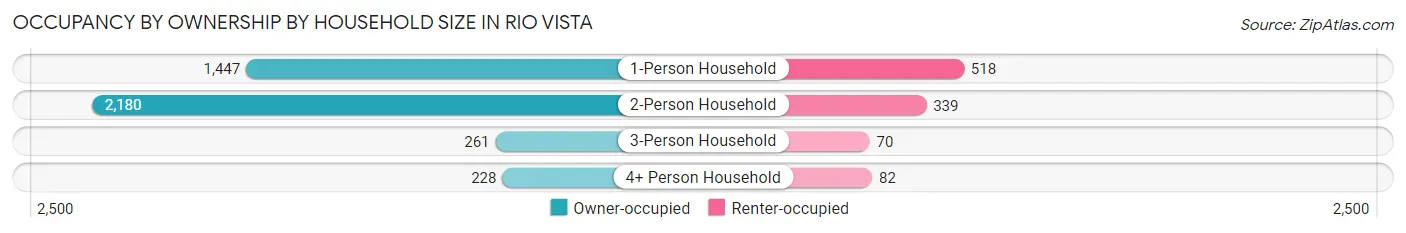
| Household Size | Owner-occupied | Renter-occupied |
| 1-Person Household | 1,447 (73.6%) | 518 (26.4%) |
| 2-Person Household | 2,180 (86.5%) | 339 (13.5%) |
| 3-Person Household | 261 (78.8%) | 70 (21.1%) |
| 4+ Person Household | 228 (73.6%) | 82 (26.5%) |
| Total Housing Units | 4,116 (80.3%) | 1,009 (19.7%) |
Occupancy by Educational Attainment in Rio Vista
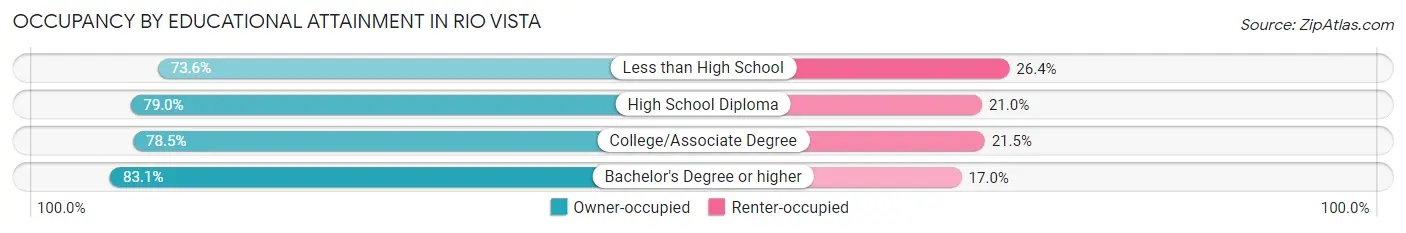
| Household Size | Owner-occupied | Renter-occupied |
| Less than High School | 117 (73.6%) | 42 (26.4%) |
| High School Diploma | 614 (79.0%) | 163 (21.0%) |
| College/Associate Degree | 1,607 (78.5%) | 441 (21.5%) |
| Bachelor's Degree or higher | 1,778 (83.1%) | 363 (17.0%) |
Occupancy by Age of Householder in Rio Vista
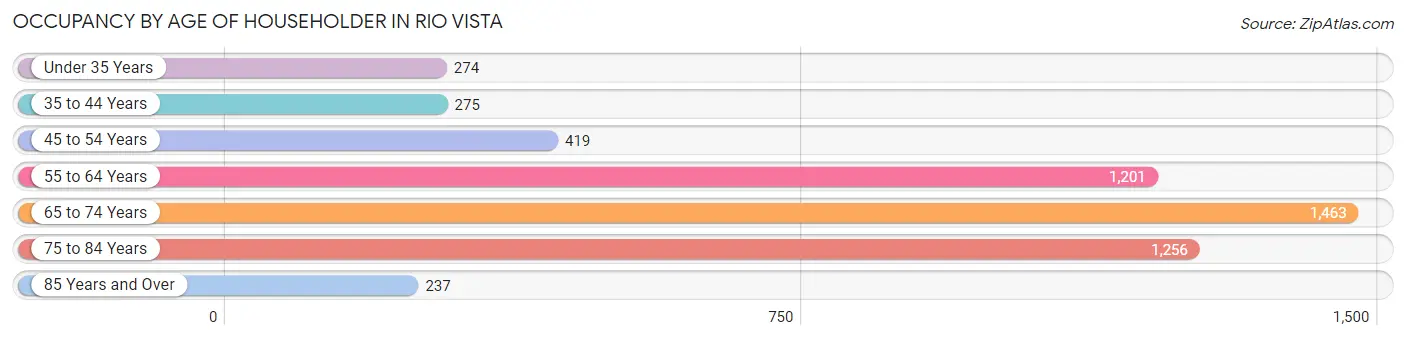
| Age Bracket | # Households | % Households |
| Under 35 Years | 274 | 5.3% |
| 35 to 44 Years | 275 | 5.4% |
| 45 to 54 Years | 419 | 8.2% |
| 55 to 64 Years | 1,201 | 23.4% |
| 65 to 74 Years | 1,463 | 28.5% |
| 75 to 84 Years | 1,256 | 24.5% |
| 85 Years and Over | 237 | 4.6% |
| Total | 5,125 | 100.0% |
Housing Finances in Rio Vista
Median Income by Occupancy in Rio Vista
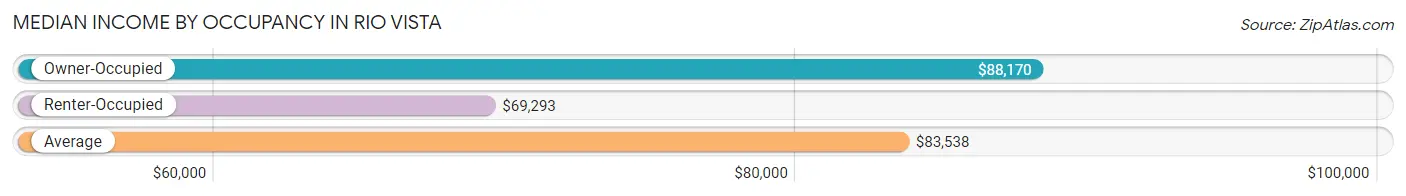
| Occupancy Type | # Households | Median Income |
| Owner-Occupied | 4,116 (80.3%) | $88,170 |
| Renter-Occupied | 1,009 (19.7%) | $69,293 |
| Average | 5,125 (100.0%) | $83,538 |
Occupancy by Householder Income Bracket in Rio Vista
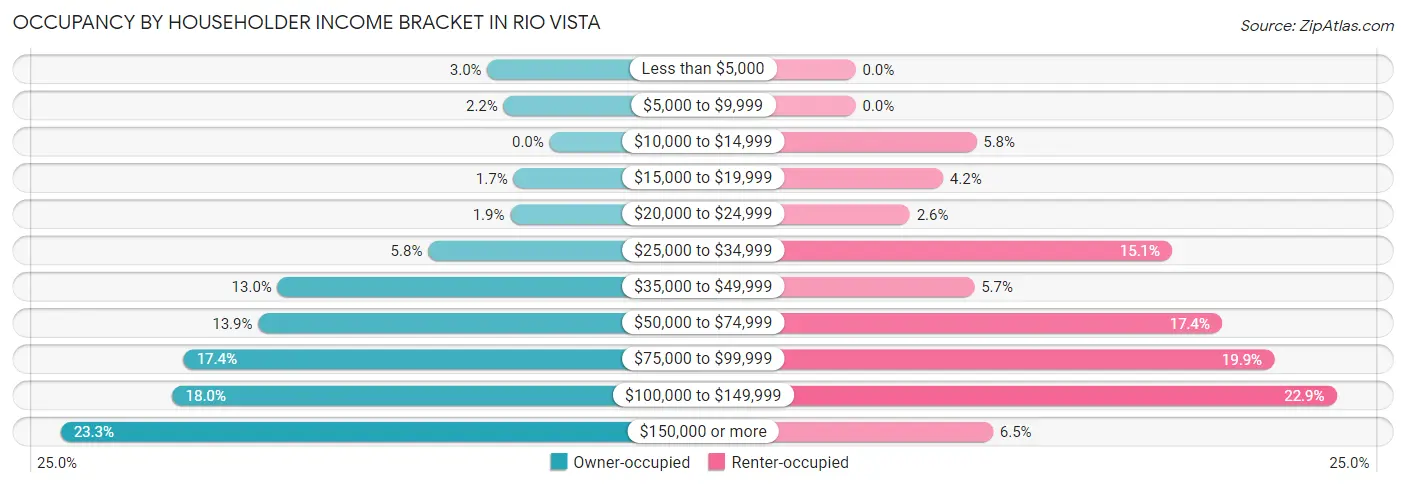
| Income Bracket | Owner-occupied | Renter-occupied |
| Less than $5,000 | 122 (3.0%) | 0 (0.0%) |
| $5,000 to $9,999 | 90 (2.2%) | 0 (0.0%) |
| $10,000 to $14,999 | 0 (0.0%) | 58 (5.8%) |
| $15,000 to $19,999 | 71 (1.7%) | 42 (4.2%) |
| $20,000 to $24,999 | 77 (1.9%) | 26 (2.6%) |
| $25,000 to $34,999 | 238 (5.8%) | 152 (15.1%) |
| $35,000 to $49,999 | 533 (13.0%) | 57 (5.7%) |
| $50,000 to $74,999 | 571 (13.9%) | 176 (17.4%) |
| $75,000 to $99,999 | 717 (17.4%) | 201 (19.9%) |
| $100,000 to $149,999 | 739 (17.9%) | 231 (22.9%) |
| $150,000 or more | 958 (23.3%) | 66 (6.5%) |
| Total | 4,116 (100.0%) | 1,009 (100.0%) |
Monthly Housing Cost Tiers in Rio Vista
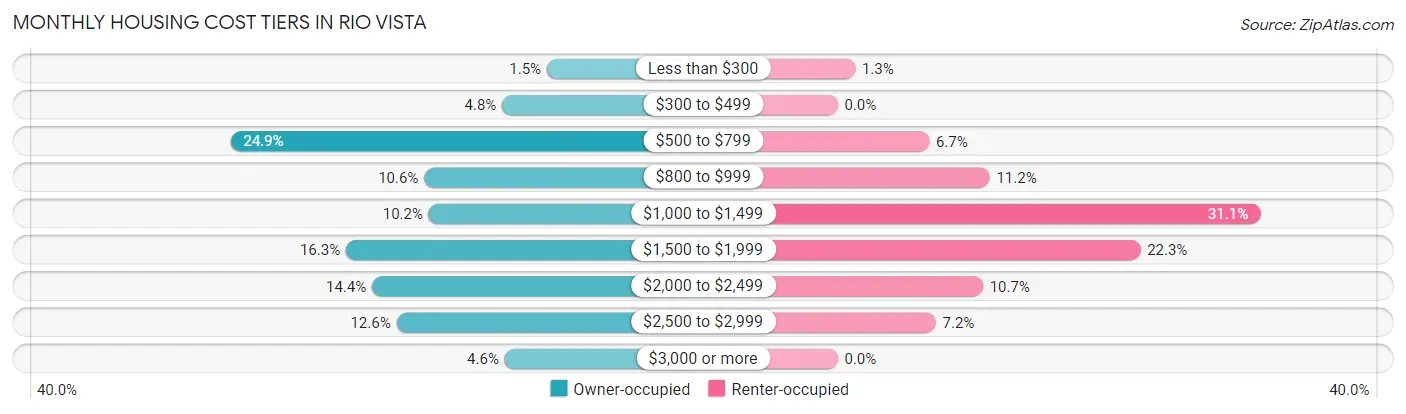
| Monthly Cost | Owner-occupied | Renter-occupied |
| Less than $300 | 63 (1.5%) | 13 (1.3%) |
| $300 to $499 | 199 (4.8%) | 0 (0.0%) |
| $500 to $799 | 1,023 (24.8%) | 68 (6.7%) |
| $800 to $999 | 435 (10.6%) | 113 (11.2%) |
| $1,000 to $1,499 | 421 (10.2%) | 314 (31.1%) |
| $1,500 to $1,999 | 672 (16.3%) | 225 (22.3%) |
| $2,000 to $2,499 | 593 (14.4%) | 108 (10.7%) |
| $2,500 to $2,999 | 519 (12.6%) | 73 (7.2%) |
| $3,000 or more | 191 (4.6%) | 0 (0.0%) |
| Total | 4,116 (100.0%) | 1,009 (100.0%) |
Physical Housing Characteristics in Rio Vista
Housing Structures in Rio Vista
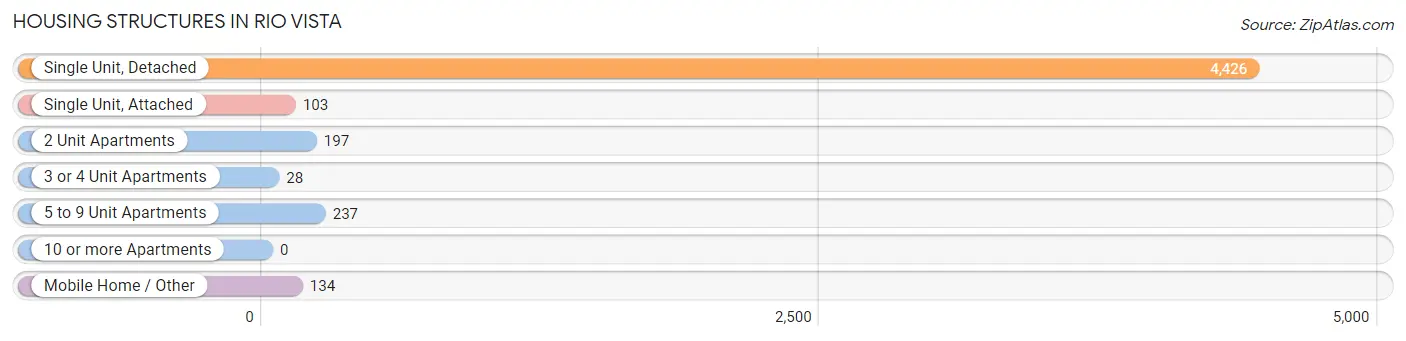
| Structure Type | # Housing Units | % Housing Units |
| Single Unit, Detached | 4,426 | 86.4% |
| Single Unit, Attached | 103 | 2.0% |
| 2 Unit Apartments | 197 | 3.8% |
| 3 or 4 Unit Apartments | 28 | 0.5% |
| 5 to 9 Unit Apartments | 237 | 4.6% |
| 10 or more Apartments | 0 | 0.0% |
| Mobile Home / Other | 134 | 2.6% |
| Total | 5,125 | 100.0% |
Housing Structures by Occupancy in Rio Vista
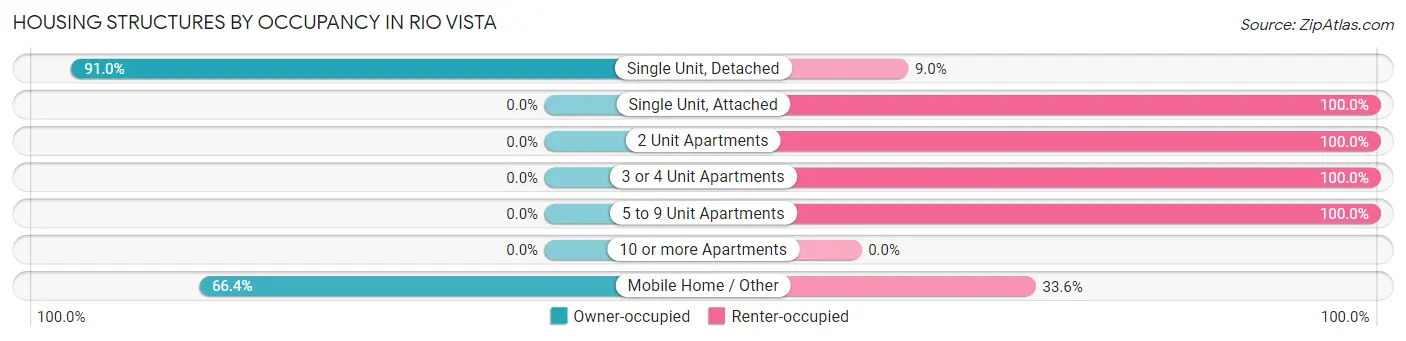
| Structure Type | Owner-occupied | Renter-occupied |
| Single Unit, Detached | 4,027 (91.0%) | 399 (9.0%) |
| Single Unit, Attached | 0 (0.0%) | 103 (100.0%) |
| 2 Unit Apartments | 0 (0.0%) | 197 (100.0%) |
| 3 or 4 Unit Apartments | 0 (0.0%) | 28 (100.0%) |
| 5 to 9 Unit Apartments | 0 (0.0%) | 237 (100.0%) |
| 10 or more Apartments | 0 (0.0%) | 0 (0.0%) |
| Mobile Home / Other | 89 (66.4%) | 45 (33.6%) |
| Total | 4,116 (80.3%) | 1,009 (19.7%) |
Housing Structures by Number of Rooms in Rio Vista
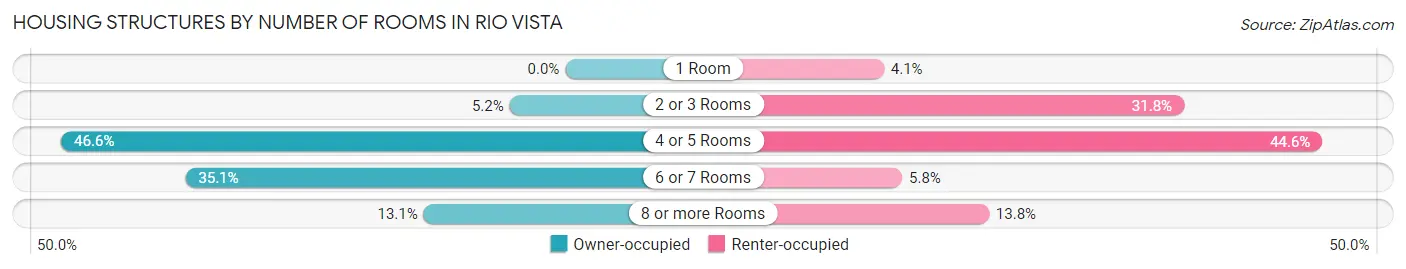
| Number of Rooms | Owner-occupied | Renter-occupied |
| 1 Room | 0 (0.0%) | 41 (4.1%) |
| 2 or 3 Rooms | 212 (5.1%) | 321 (31.8%) |
| 4 or 5 Rooms | 1,919 (46.6%) | 450 (44.6%) |
| 6 or 7 Rooms | 1,446 (35.1%) | 58 (5.8%) |
| 8 or more Rooms | 539 (13.1%) | 139 (13.8%) |
| Total | 4,116 (100.0%) | 1,009 (100.0%) |
Housing Structure by Heating Type in Rio Vista
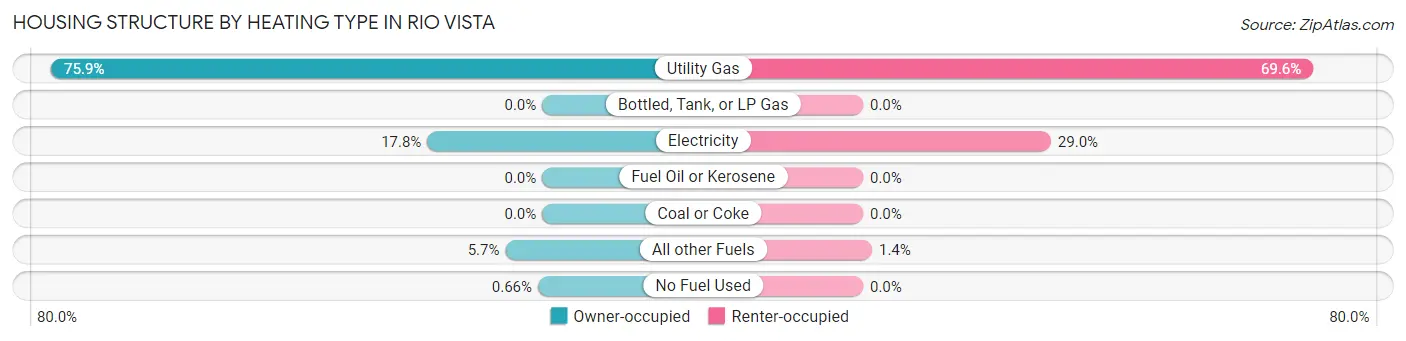
| Heating Type | Owner-occupied | Renter-occupied |
| Utility Gas | 3,124 (75.9%) | 702 (69.6%) |
| Bottled, Tank, or LP Gas | 0 (0.0%) | 0 (0.0%) |
| Electricity | 731 (17.8%) | 293 (29.0%) |
| Fuel Oil or Kerosene | 0 (0.0%) | 0 (0.0%) |
| Coal or Coke | 0 (0.0%) | 0 (0.0%) |
| All other Fuels | 234 (5.7%) | 14 (1.4%) |
| No Fuel Used | 27 (0.7%) | 0 (0.0%) |
| Total | 4,116 (100.0%) | 1,009 (100.0%) |
Household Vehicle Usage in Rio Vista
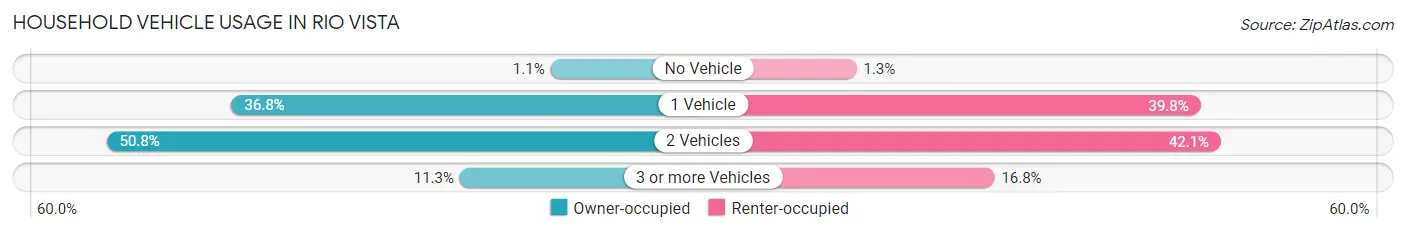
| Vehicles per Household | Owner-occupied | Renter-occupied |
| No Vehicle | 45 (1.1%) | 13 (1.3%) |
| 1 Vehicle | 1,516 (36.8%) | 402 (39.8%) |
| 2 Vehicles | 2,092 (50.8%) | 425 (42.1%) |
| 3 or more Vehicles | 463 (11.3%) | 169 (16.8%) |
| Total | 4,116 (100.0%) | 1,009 (100.0%) |
Real Estate & Mortgages in Rio Vista
Real Estate and Mortgage Overview in Rio Vista
| Characteristic | Without Mortgage | With Mortgage |
| Housing Units | 1,679 | 2,437 |
| Median Property Value | $455,500 | $456,400 |
| Median Household Income | $80,160 | $679 |
| Monthly Housing Costs | $690 | $191 |
| Real Estate Taxes | $4,211 | $14 |
Property Value by Mortgage Status in Rio Vista
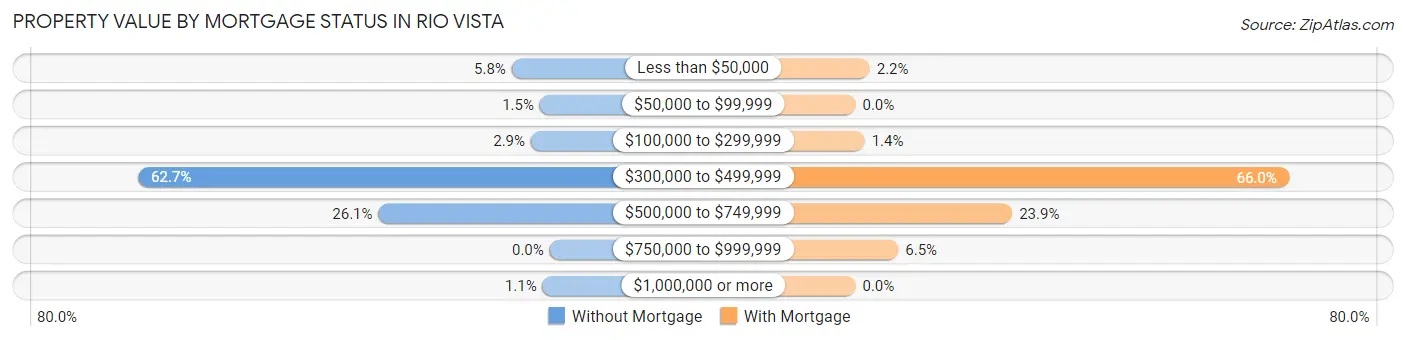
| Property Value | Without Mortgage | With Mortgage |
| Less than $50,000 | 97 (5.8%) | 53 (2.2%) |
| $50,000 to $99,999 | 25 (1.5%) | 0 (0.0%) |
| $100,000 to $299,999 | 48 (2.9%) | 34 (1.4%) |
| $300,000 to $499,999 | 1,053 (62.7%) | 1,609 (66.0%) |
| $500,000 to $749,999 | 438 (26.1%) | 582 (23.9%) |
| $750,000 to $999,999 | 0 (0.0%) | 159 (6.5%) |
| $1,000,000 or more | 18 (1.1%) | 0 (0.0%) |
| Total | 1,679 (100.0%) | 2,437 (100.0%) |
Household Income by Mortgage Status in Rio Vista
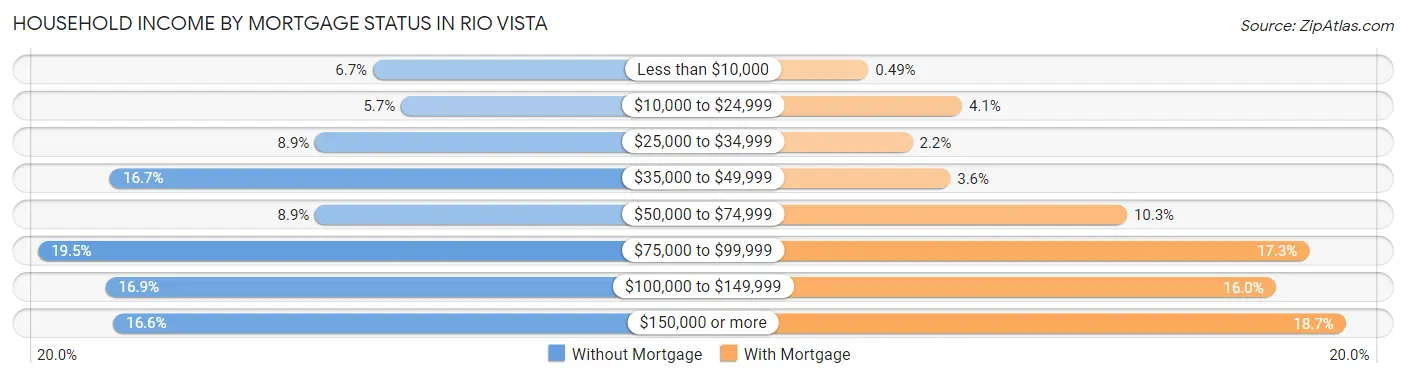
| Household Income | Without Mortgage | With Mortgage |
| Less than $10,000 | 113 (6.7%) | 12 (0.5%) |
| $10,000 to $24,999 | 95 (5.7%) | 99 (4.1%) |
| $25,000 to $34,999 | 150 (8.9%) | 53 (2.2%) |
| $35,000 to $49,999 | 281 (16.7%) | 88 (3.6%) |
| $50,000 to $74,999 | 150 (8.9%) | 252 (10.3%) |
| $75,000 to $99,999 | 327 (19.5%) | 421 (17.3%) |
| $100,000 to $149,999 | 284 (16.9%) | 390 (16.0%) |
| $150,000 or more | 279 (16.6%) | 455 (18.7%) |
| Total | 1,679 (100.0%) | 2,437 (100.0%) |
Property Value to Household Income Ratio in Rio Vista
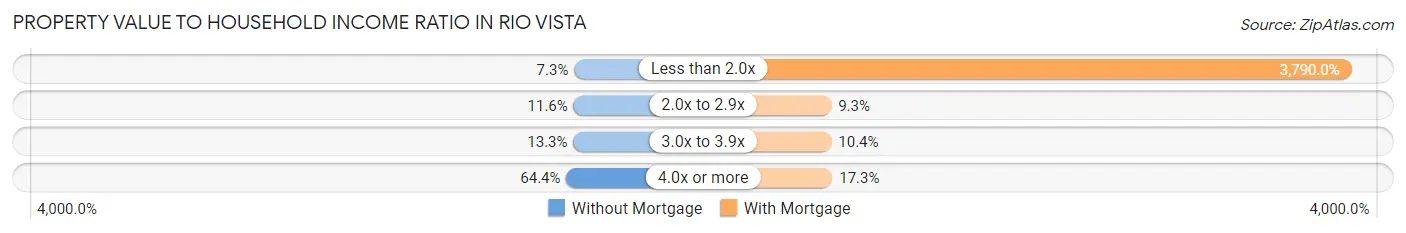
| Value-to-Income Ratio | Without Mortgage | With Mortgage |
| Less than 2.0x | 122 (7.3%) | 92,363 (3,790.0%) |
| 2.0x to 2.9x | 195 (11.6%) | 227 (9.3%) |
| 3.0x to 3.9x | 224 (13.3%) | 253 (10.4%) |
| 4.0x or more | 1,081 (64.4%) | 421 (17.3%) |
| Total | 1,679 (100.0%) | 2,437 (100.0%) |
Real Estate Taxes by Mortgage Status in Rio Vista

| Property Taxes | Without Mortgage | With Mortgage |
| Less than $800 | 105 (6.2%) | 26 (1.1%) |
| $800 to $1,499 | 185 (11.0%) | 7 (0.3%) |
| $800 to $1,499 | 1,322 (78.7%) | 102 (4.2%) |
| Total | 1,679 (100.0%) | 2,437 (100.0%) |
Health & Disability in Rio Vista
Health Insurance Coverage by Age in Rio Vista
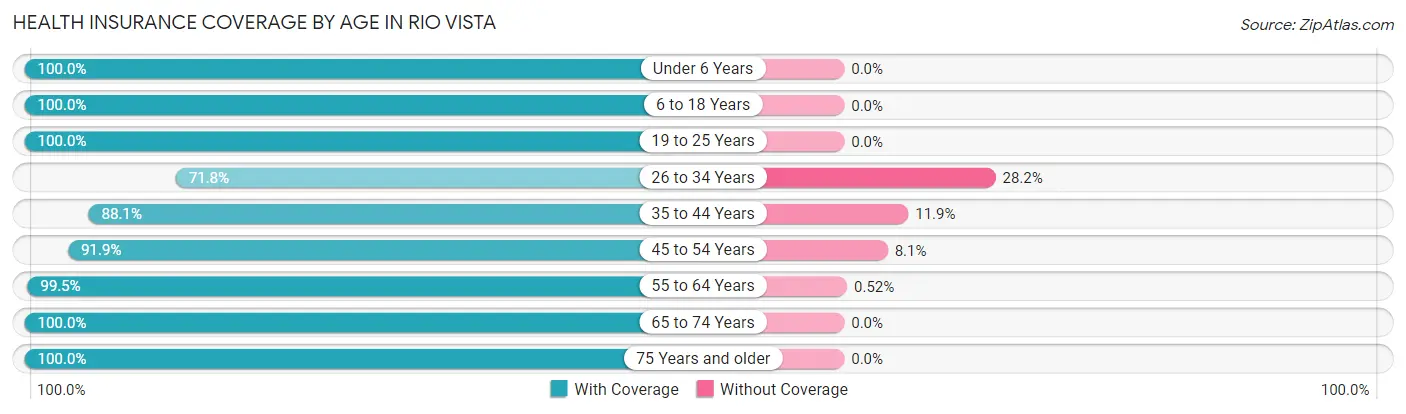
| Age Bracket | With Coverage | Without Coverage |
| Under 6 Years | 233 (100.0%) | 0 (0.0%) |
| 6 to 18 Years | 529 (100.0%) | 0 (0.0%) |
| 19 to 25 Years | 362 (100.0%) | 0 (0.0%) |
| 26 to 34 Years | 764 (71.8%) | 300 (28.2%) |
| 35 to 44 Years | 369 (88.1%) | 50 (11.9%) |
| 45 to 54 Years | 624 (91.9%) | 55 (8.1%) |
| 55 to 64 Years | 1,903 (99.5%) | 10 (0.5%) |
| 65 to 74 Years | 2,538 (100.0%) | 0 (0.0%) |
| 75 Years and older | 2,337 (100.0%) | 0 (0.0%) |
| Total | 9,659 (95.9%) | 415 (4.1%) |
Health Insurance Coverage by Citizenship Status in Rio Vista

| Citizenship Status | With Coverage | Without Coverage |
| Native Born | 233 (100.0%) | 0 (0.0%) |
| Foreign Born, Citizen | 529 (100.0%) | 0 (0.0%) |
| Foreign Born, not a Citizen | 362 (100.0%) | 0 (0.0%) |
Health Insurance Coverage by Household Income in Rio Vista
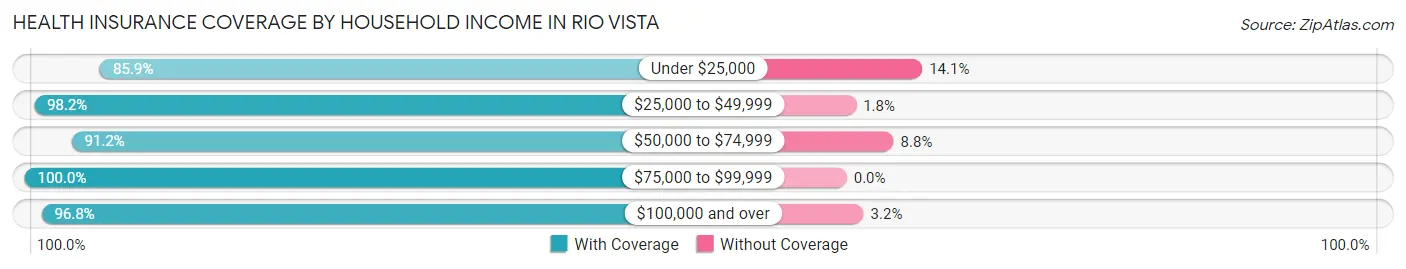
| Household Income | With Coverage | Without Coverage |
| Under $25,000 | 863 (85.9%) | 142 (14.1%) |
| $25,000 to $49,999 | 1,285 (98.2%) | 23 (1.8%) |
| $50,000 to $74,999 | 1,029 (91.2%) | 99 (8.8%) |
| $75,000 to $99,999 | 1,855 (100.0%) | 0 (0.0%) |
| $100,000 and over | 4,620 (96.8%) | 151 (3.2%) |
Public vs Private Health Insurance Coverage by Age in Rio Vista
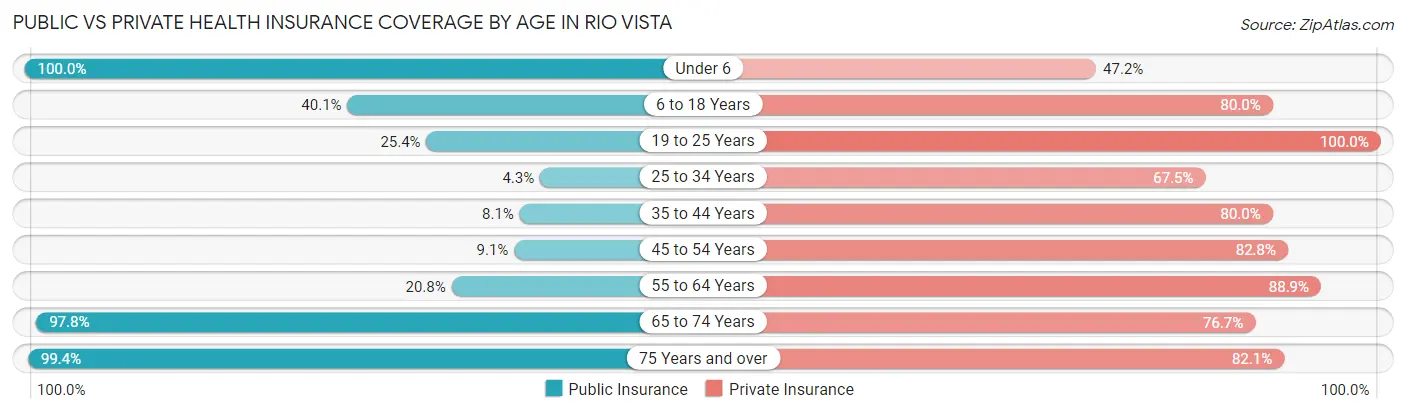
| Age Bracket | Public Insurance | Private Insurance |
| Under 6 | 233 (100.0%) | 110 (47.2%) |
| 6 to 18 Years | 212 (40.1%) | 423 (80.0%) |
| 19 to 25 Years | 92 (25.4%) | 362 (100.0%) |
| 25 to 34 Years | 46 (4.3%) | 718 (67.5%) |
| 35 to 44 Years | 34 (8.1%) | 335 (79.9%) |
| 45 to 54 Years | 62 (9.1%) | 562 (82.8%) |
| 55 to 64 Years | 397 (20.7%) | 1,701 (88.9%) |
| 65 to 74 Years | 2,483 (97.8%) | 1,947 (76.7%) |
| 75 Years and over | 2,323 (99.4%) | 1,918 (82.1%) |
| Total | 5,882 (58.4%) | 8,076 (80.2%) |
Disability Status by Sex by Age in Rio Vista
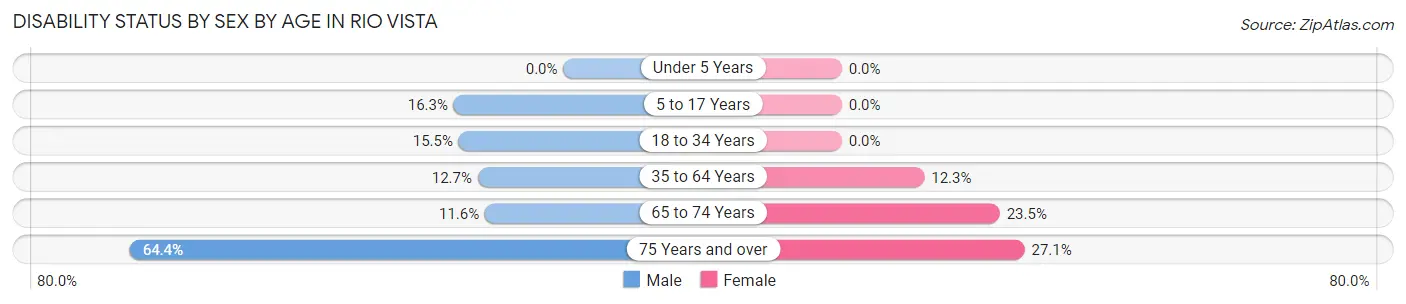
| Age Bracket | Male | Female |
| Under 5 Years | 0 (0.0%) | 0 (0.0%) |
| 5 to 17 Years | 41 (16.3%) | 0 (0.0%) |
| 18 to 34 Years | 132 (15.5%) | 0 (0.0%) |
| 35 to 64 Years | 175 (12.7%) | 200 (12.2%) |
| 65 to 74 Years | 128 (11.6%) | 337 (23.4%) |
| 75 Years and over | 589 (64.4%) | 386 (27.1%) |
Disability Class by Sex by Age in Rio Vista
Disability Class: Hearing Difficulty
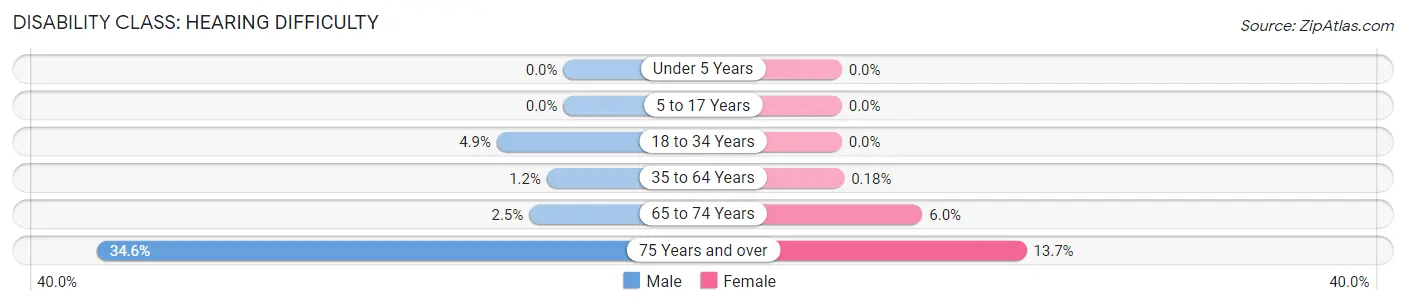
| Age Bracket | Male | Female |
| Under 5 Years | 0 (0.0%) | 0 (0.0%) |
| 5 to 17 Years | 0 (0.0%) | 0 (0.0%) |
| 18 to 34 Years | 42 (4.9%) | 0 (0.0%) |
| 35 to 64 Years | 17 (1.2%) | 3 (0.2%) |
| 65 to 74 Years | 28 (2.5%) | 86 (6.0%) |
| 75 Years and over | 317 (34.6%) | 195 (13.7%) |
Disability Class: Vision Difficulty
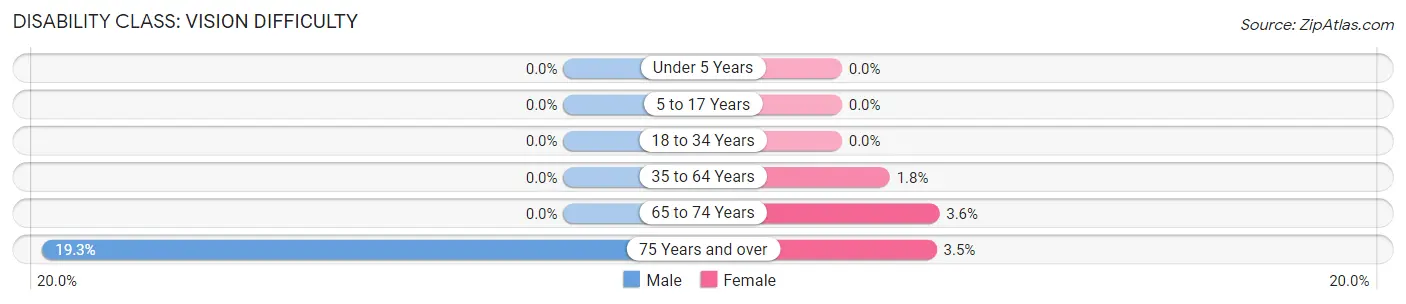
| Age Bracket | Male | Female |
| Under 5 Years | 0 (0.0%) | 0 (0.0%) |
| 5 to 17 Years | 0 (0.0%) | 0 (0.0%) |
| 18 to 34 Years | 0 (0.0%) | 0 (0.0%) |
| 35 to 64 Years | 0 (0.0%) | 29 (1.8%) |
| 65 to 74 Years | 0 (0.0%) | 52 (3.6%) |
| 75 Years and over | 177 (19.3%) | 50 (3.5%) |
Disability Class: Cognitive Difficulty
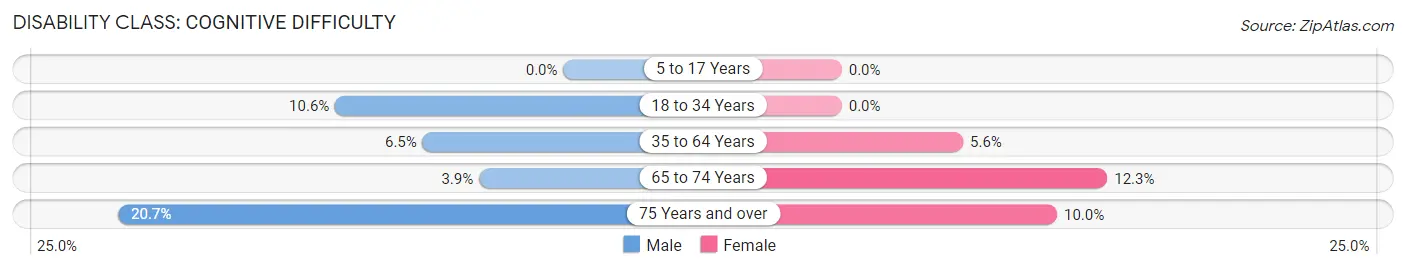
| Age Bracket | Male | Female |
| 5 to 17 Years | 0 (0.0%) | 0 (0.0%) |
| 18 to 34 Years | 90 (10.6%) | 0 (0.0%) |
| 35 to 64 Years | 90 (6.5%) | 92 (5.6%) |
| 65 to 74 Years | 43 (3.9%) | 177 (12.3%) |
| 75 Years and over | 189 (20.7%) | 142 (10.0%) |
Disability Class: Ambulatory Difficulty
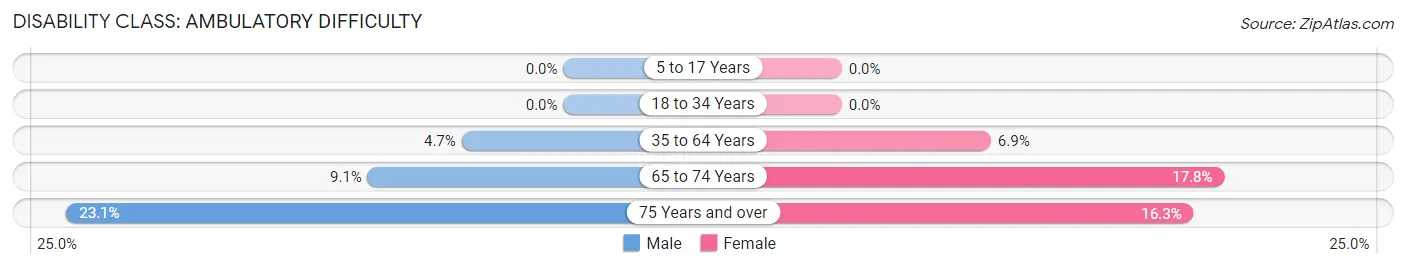
| Age Bracket | Male | Female |
| 5 to 17 Years | 0 (0.0%) | 0 (0.0%) |
| 18 to 34 Years | 0 (0.0%) | 0 (0.0%) |
| 35 to 64 Years | 65 (4.7%) | 113 (6.9%) |
| 65 to 74 Years | 100 (9.1%) | 255 (17.7%) |
| 75 Years and over | 211 (23.1%) | 232 (16.3%) |
Disability Class: Self-Care Difficulty
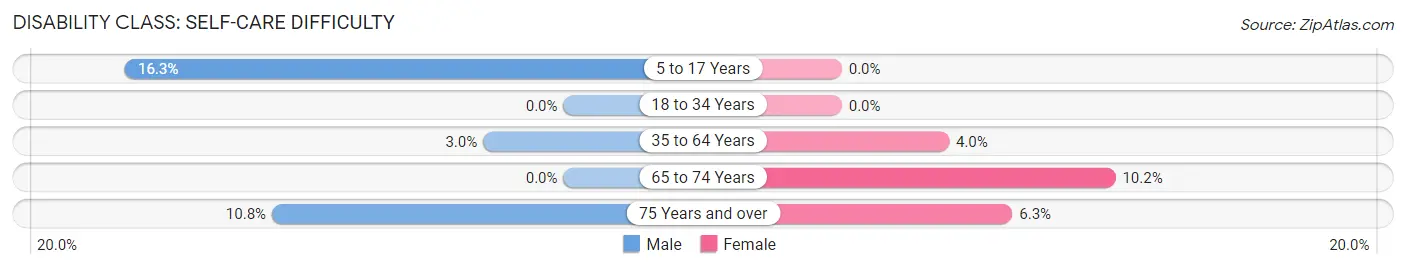
| Age Bracket | Male | Female |
| 5 to 17 Years | 41 (16.3%) | 0 (0.0%) |
| 18 to 34 Years | 0 (0.0%) | 0 (0.0%) |
| 35 to 64 Years | 41 (3.0%) | 65 (4.0%) |
| 65 to 74 Years | 0 (0.0%) | 146 (10.2%) |
| 75 Years and over | 99 (10.8%) | 90 (6.3%) |
Technology Access in Rio Vista
Computing Device Access in Rio Vista
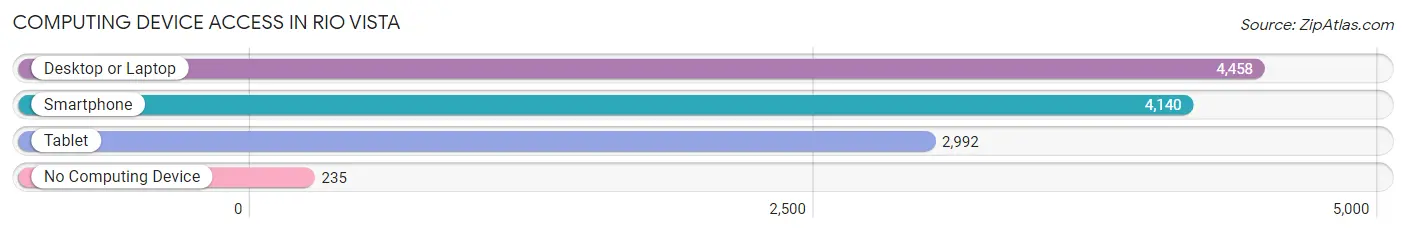
| Device Type | # Households | % Households |
| Desktop or Laptop | 4,458 | 87.0% |
| Smartphone | 4,140 | 80.8% |
| Tablet | 2,992 | 58.4% |
| No Computing Device | 235 | 4.6% |
| Total | 5,125 | 100.0% |
Internet Access in Rio Vista
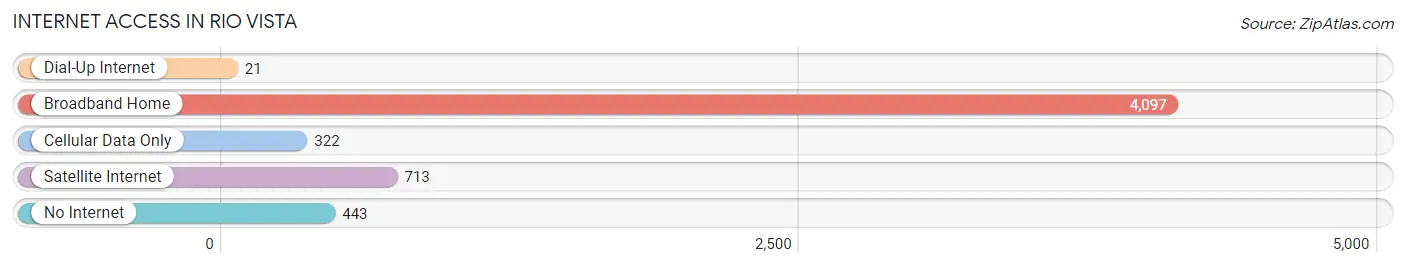
| Internet Type | # Households | % Households |
| Dial-Up Internet | 21 | 0.4% |
| Broadband Home | 4,097 | 79.9% |
| Cellular Data Only | 322 | 6.3% |
| Satellite Internet | 713 | 13.9% |
| No Internet | 443 | 8.6% |
| Total | 5,125 | 100.0% |
Rio Vista Summary
Rio Vista is a small city located in Solano County, California, United States. It is situated on the banks of the Sacramento River, approximately 60 miles northeast of San Francisco. The city has a population of 7,360 as of the 2010 census, and is part of the San Francisco Bay Area.
History
Rio Vista was originally inhabited by the Patwin Native American tribe. The first European settlers arrived in the area in the 1850s, and the city was officially incorporated in 1893. The city was named after the nearby Rio Vista Ferry, which was established in 1864. The ferry was used to transport people and goods across the Sacramento River.
In the early 1900s, the city was a popular destination for tourists, and it was known for its fishing and hunting opportunities. The city was also home to a number of resorts, including the Rio Vista Hotel, which was built in 1906.
In the 1950s, the city began to experience a decline in tourism, and the local economy shifted to focus on agriculture and industry. The city has since become a popular destination for retirees, and it is home to a number of retirement communities.
Geography
Rio Vista is located in the Sacramento Valley, at the confluence of the Sacramento and San Joaquin Rivers. The city is situated on the eastern side of the Sacramento River, approximately 60 miles northeast of San Francisco. The city has a total area of 4.2 square miles, all of which is land.
The city is surrounded by rolling hills and farmland, and it is located near the Suisun Marsh, which is the largest brackish marsh in the western United States. The marsh is home to a variety of wildlife, including birds, fish, and mammals.
Economy
The economy of Rio Vista is largely based on agriculture and industry. The city is home to a number of agricultural businesses, including vineyards, wineries, and farms. The city is also home to a number of industrial businesses, including a cement plant and a power plant.
The city is also home to a number of retail businesses, including restaurants, shops, and galleries. The city is also home to a number of tourist attractions, including the Rio Vista Museum and the Rio Vista Historical Society.
Demographics
As of the 2010 census, the population of Rio Vista was 7,360. The racial makeup of the city was 77.3% White, 1.3% African American, 0.7% Native American, 1.2% Asian, 0.2% Pacific Islander, 16.2% from other races, and 3.3% from two or more races. Hispanic or Latino of any race were 28.3% of the population.
The median income for a household in the city was $50,945, and the median income for a family was $60,917. The per capita income for the city was $25,945. About 11.3% of families and 14.2% of the population were below the poverty line, including 19.2% of those under age 18 and 8.2% of those age 65 or over.
Conclusion
Rio Vista is a small city located in Solano County, California, United States. It is situated on the banks of the Sacramento River, approximately 60 miles northeast of San Francisco. The city has a population of 7,360 as of the 2010 census, and is part of the San Francisco Bay Area. The city was originally inhabited by the Patwin Native American tribe, and was officially incorporated in 1893. The economy of Rio Vista is largely based on agriculture and industry, and the city is home to a number of tourist attractions. The racial makeup of the city is 77.3% White, 1.3% African American, 0.7% Native American, 1.2% Asian, 0.2% Pacific Islander, 16.2% from other races, and 3.3% from two or more races. The median income for a household in the city was $50,945, and the median income for a family was $60,917.
Common Questions
What is the Total Population of Rio Vista?
Total Population of Rio Vista is 10,074.
What is the Total Male Population of Rio Vista?
Total Male Population of Rio Vista is 4,619.
What is the Total Female Population of Rio Vista?
Total Female Population of Rio Vista is 5,455.
What is the Ratio of Males per 100 Females in Rio Vista?
There are 84.67 Males per 100 Females in Rio Vista.
What is the Ratio of Females per 100 Males in Rio Vista?
There are 118.10 Females per 100 Males in Rio Vista.
What is the Median Population Age in Rio Vista?
Median Population Age in Rio Vista is 64.6 Years.
What is the Average Family Size in Rio Vista
Average Family Size in Rio Vista is 2.6 People.
What is the Average Household Size in Rio Vista
Average Household Size in Rio Vista is 2.0 People.
What is Per Capita Income in Rio Vista?
Per Capita income in Rio Vista is $48,159.
What is the Median Family Income in Rio Vista?
Median Family Income in Rio Vista is $97,277.
What is the Median Household income in Rio Vista?
Median Household Income in Rio Vista is $83,538.
What is Income or Wage Gap in Rio Vista?
Income or Wage Gap in Rio Vista is 7.9%.
Women in Rio Vista earn 92.1 cents for every dollar earned by a man.
What is Family Income Deficit in Rio Vista?
Family Income Deficit in Rio Vista is $11,838.
Families that are below poverty line in Rio Vista earn $11,838 less on average than the poverty threshold level.
What is Inequality or Gini Index in Rio Vista?
Inequality or Gini Index in Rio Vista is 0.37.
How Large is the Labor Force in Rio Vista?
There are 3,896 People in the Labor Forcein in Rio Vista.
What is the Percentage of People in the Labor Force in Rio Vista?
41.3% of People are in the Labor Force in Rio Vista.
What is the Unemployment Rate in Rio Vista?
Unemployment Rate in Rio Vista is 13.4%.