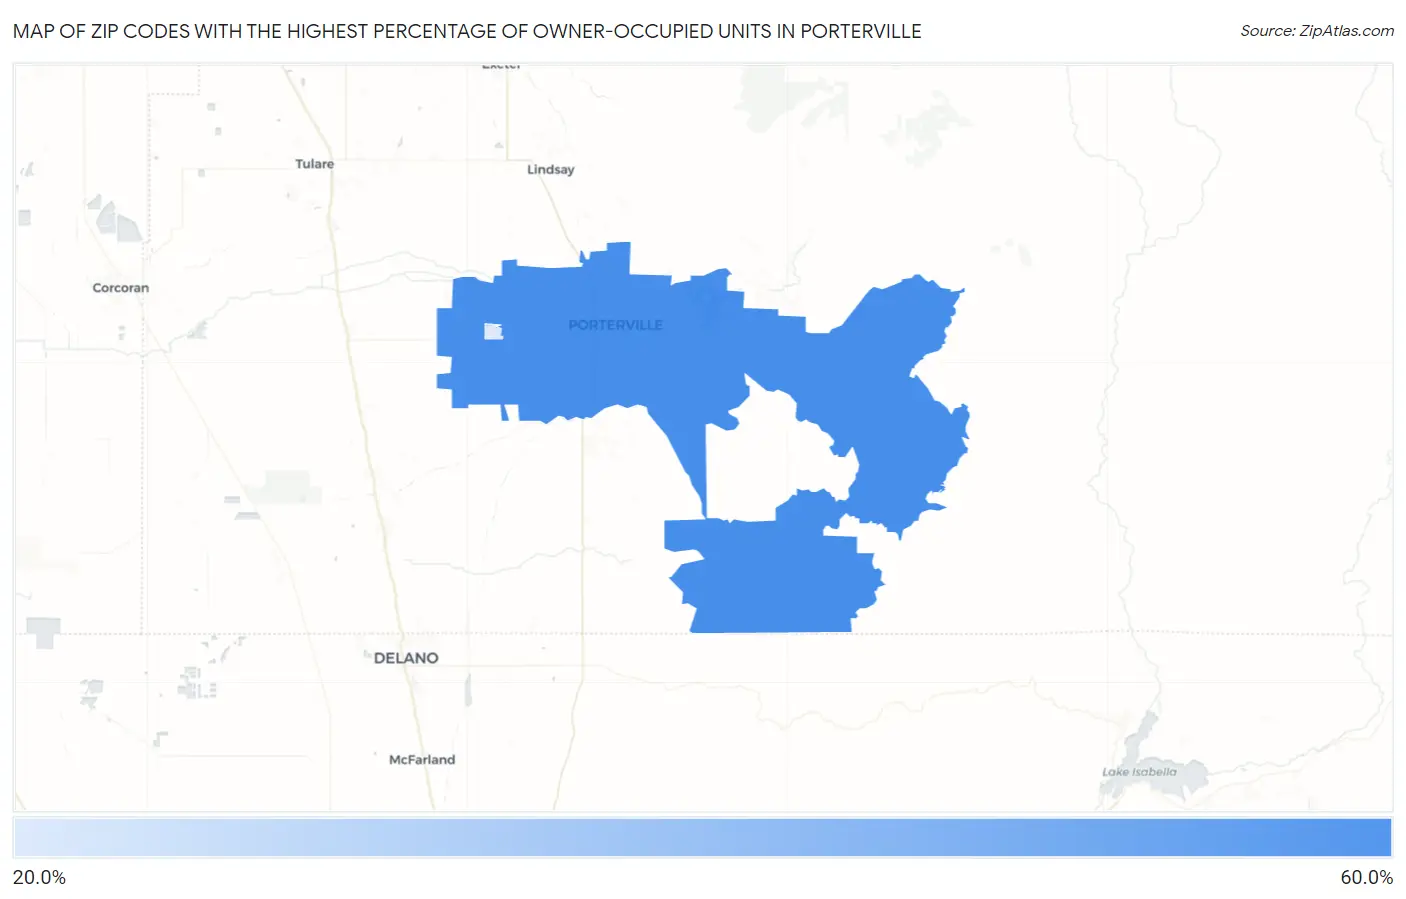
Zip Codes with the Highest Percentage of Owner-Occupied Units in Porterville, CA
RELATED REPORTS & OPTIONS
Highest Owner-Occupied
Porterville
Compare Zip Codes
Map of Zip Codes with the Highest Percentage of Owner-Occupied Units in Porterville
0.0%
60.0%
Zip Codes with the Highest Percentage of Owner-Occupied Units in Porterville, CA
| Zip Code | % Owner-Occupied | vs State | vs National | |
| 1. | 93257 | 56.1% | 55.6%(+0.454)#1,100 | 64.8%(-8.73)#28,480 |
| 2. | 93258 | 22.5% | 55.6%(-33.2)#1,625 | 64.8%(-42.4)#32,061 |
1
Common Questions
What are the Top Zip Codes with the Highest Percentage of Owner-Occupied Units in Porterville, CA?
Top Zip Codes with the Highest Percentage of Owner-Occupied Units in Porterville, CA are:
What zip code has the Highest Percentage of Owner-Occupied Units in Porterville, CA?
93257 has the Highest Percentage of Owner-Occupied Units in Porterville, CA with 56.1%.
What is the Percentage of Owner-Occupied Units in Porterville, CA?
Percentage of Owner-Occupied Units in Porterville is 55.0%.
What is the Percentage of Owner-Occupied Units in California?
Percentage of Owner-Occupied Units in California is 55.6%.
What is the Percentage of Owner-Occupied Units in the United States?
Percentage of Owner-Occupied Units in the United States is 64.8%.