Poplar Cotton Center, CA
Poplar Cotton Center Map
Poplar Cotton Center Overview
1,918
TOTAL POPULATION
1,192
MALE POPULATION
726
FEMALE POPULATION
164.19
MALES / 100 FEMALES
60.91
FEMALES / 100 MALES
30.7
MEDIAN AGE
3.9
AVG FAMILY SIZE
3.3
AVG HOUSEHOLD SIZE
$17,801
PER CAPITA INCOME
$55,391
AVG FAMILY INCOME
$47,951
AVG HOUSEHOLD INCOME
33.8%
WAGE / INCOME GAP [ % ]
66.2¢/ $1
WAGE / INCOME GAP [ $ ]
0.39
INEQUALITY / GINI INDEX
1,052
LABOR FORCE [ PEOPLE ]
69.2%
PERCENT IN LABOR FORCE
19.1%
UNEMPLOYMENT RATE
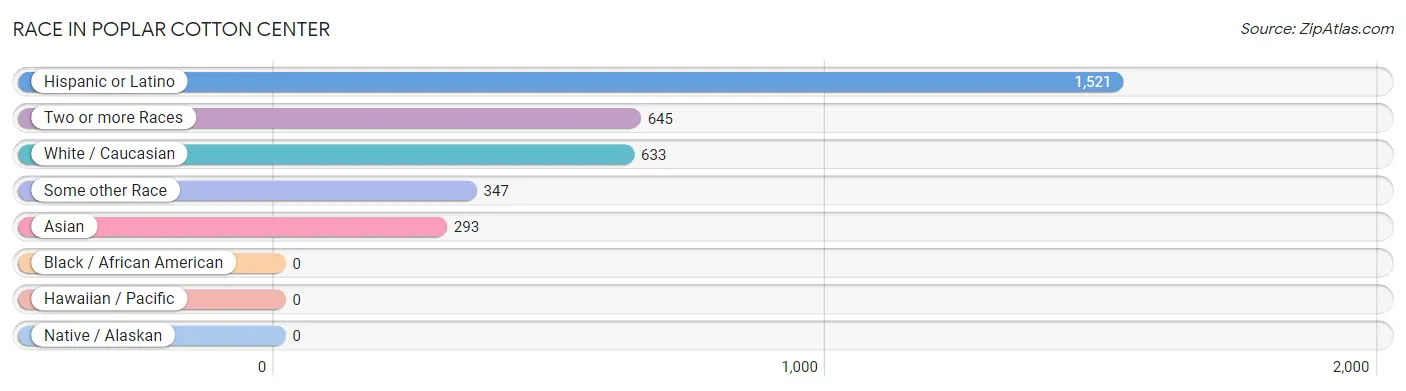
Race in Poplar Cotton Center
The most populous races in Poplar Cotton Center are Hispanic or Latino (1,521 | 79.3%), Two or more Races (645 | 33.6%), and White / Caucasian (633 | 33.0%).
| Race | # Population | % Population |
| Asian | 293 | 15.3% |
| Black / African American | 0 | 0.0% |
| Hawaiian / Pacific | 0 | 0.0% |
| Hispanic or Latino | 1,521 | 79.3% |
| Native / Alaskan | 0 | 0.0% |
| White / Caucasian | 633 | 33.0% |
| Two or more Races | 645 | 33.6% |
| Some other Race | 347 | 18.1% |
| Total | 1,918 | 100.0% |
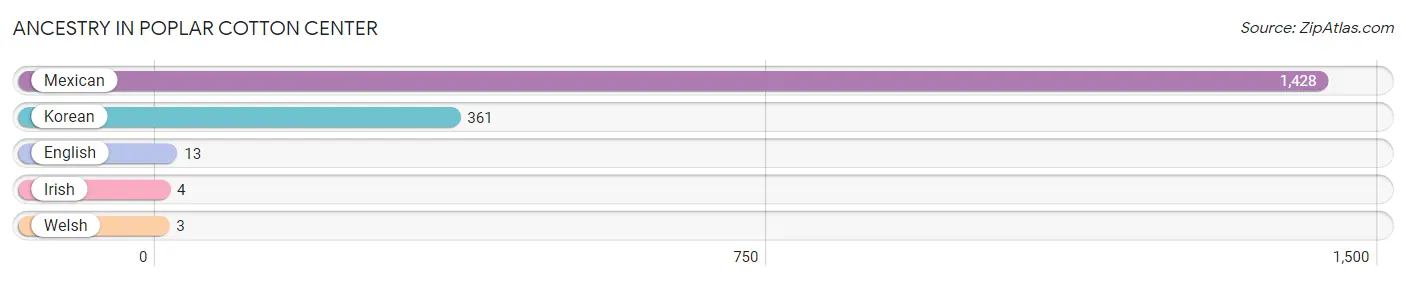
Ancestry in Poplar Cotton Center
The most populous ancestries reported in Poplar Cotton Center are Mexican (1,428 | 74.5%), Korean (361 | 18.8%), English (13 | 0.7%), Irish (4 | 0.2%), and Welsh (3 | 0.2%), together accounting for 94.3% of all Poplar Cotton Center residents.
| Ancestry | # Population | % Population |
| English | 13 | 0.7% |
| Irish | 4 | 0.2% |
| Korean | 361 | 18.8% |
| Mexican | 1,428 | 74.5% |
| Welsh | 3 | 0.2% | View All 5 Rows |
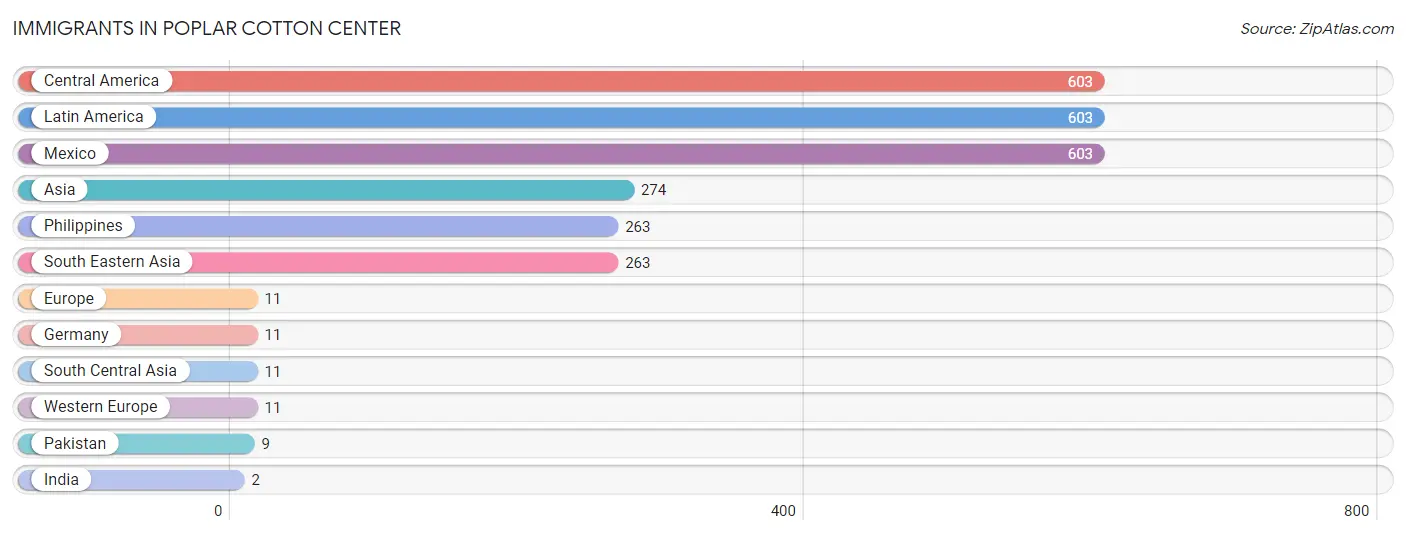
Immigrants in Poplar Cotton Center
The most numerous immigrant groups reported in Poplar Cotton Center came from Central America (603 | 31.4%), Latin America (603 | 31.4%), Mexico (603 | 31.4%), Asia (274 | 14.3%), and Philippines (263 | 13.7%), together accounting for 122.3% of all Poplar Cotton Center residents.
| Immigration Origin | # Population | % Population |
| Asia | 274 | 14.3% |
| Central America | 603 | 31.4% |
| Europe | 11 | 0.6% |
| Germany | 11 | 0.6% |
| India | 2 | 0.1% |
| Latin America | 603 | 31.4% |
| Mexico | 603 | 31.4% |
| Pakistan | 9 | 0.5% |
| Philippines | 263 | 13.7% |
| South Central Asia | 11 | 0.6% |
| South Eastern Asia | 263 | 13.7% |
| Western Europe | 11 | 0.6% | View All 12 Rows |
Sex and Age in Poplar Cotton Center
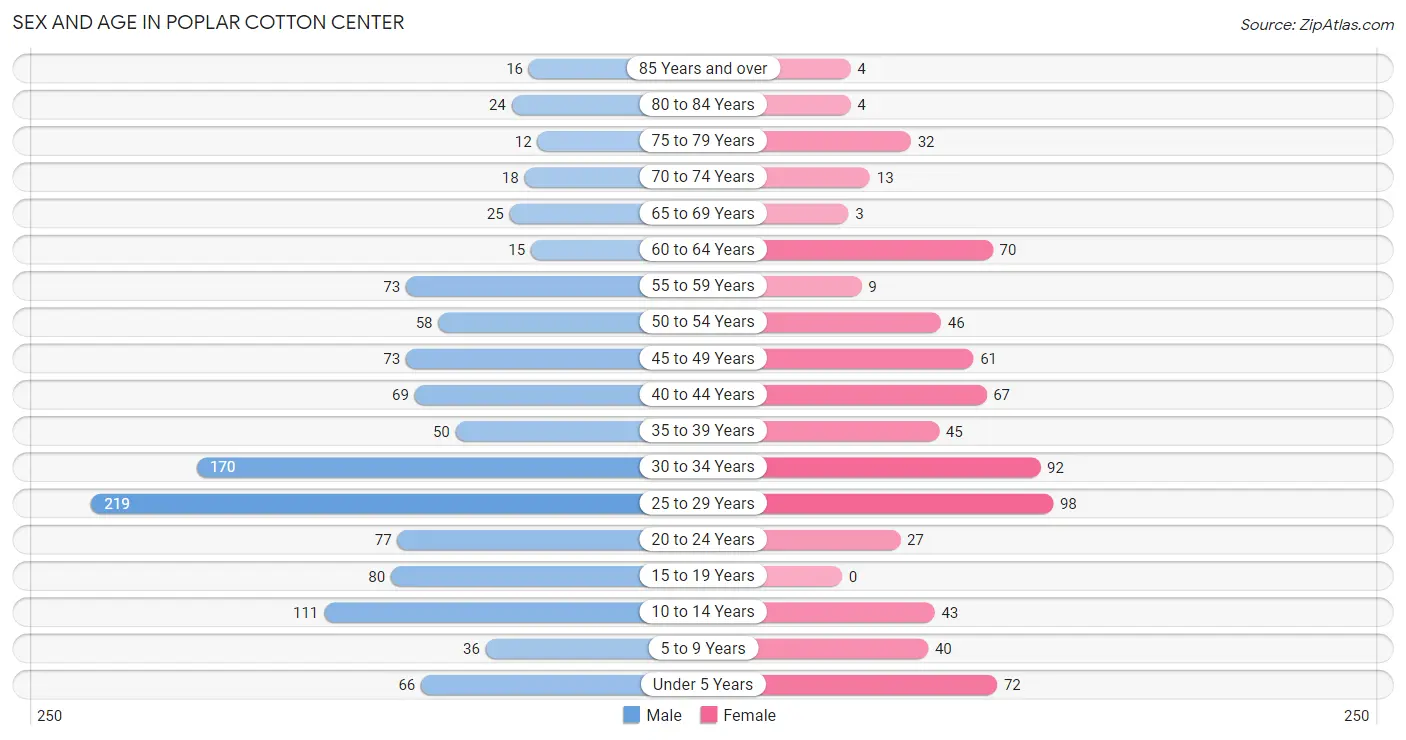
Sex and Age in Poplar Cotton Center
The most populous age groups in Poplar Cotton Center are 25 to 29 Years (219 | 18.4%) for men and 25 to 29 Years (98 | 13.5%) for women.
| Age Bracket | Male | Female |
| Under 5 Years | 66 (5.5%) | 72 (9.9%) |
| 5 to 9 Years | 36 (3.0%) | 40 (5.5%) |
| 10 to 14 Years | 111 (9.3%) | 43 (5.9%) |
| 15 to 19 Years | 80 (6.7%) | 0 (0.0%) |
| 20 to 24 Years | 77 (6.5%) | 27 (3.7%) |
| 25 to 29 Years | 219 (18.4%) | 98 (13.5%) |
| 30 to 34 Years | 170 (14.3%) | 92 (12.7%) |
| 35 to 39 Years | 50 (4.2%) | 45 (6.2%) |
| 40 to 44 Years | 69 (5.8%) | 67 (9.2%) |
| 45 to 49 Years | 73 (6.1%) | 61 (8.4%) |
| 50 to 54 Years | 58 (4.9%) | 46 (6.3%) |
| 55 to 59 Years | 73 (6.1%) | 9 (1.2%) |
| 60 to 64 Years | 15 (1.3%) | 70 (9.6%) |
| 65 to 69 Years | 25 (2.1%) | 3 (0.4%) |
| 70 to 74 Years | 18 (1.5%) | 13 (1.8%) |
| 75 to 79 Years | 12 (1.0%) | 32 (4.4%) |
| 80 to 84 Years | 24 (2.0%) | 4 (0.5%) |
| 85 Years and over | 16 (1.3%) | 4 (0.5%) |
| Total | 1,192 (100.0%) | 726 (100.0%) |
Families and Households in Poplar Cotton Center
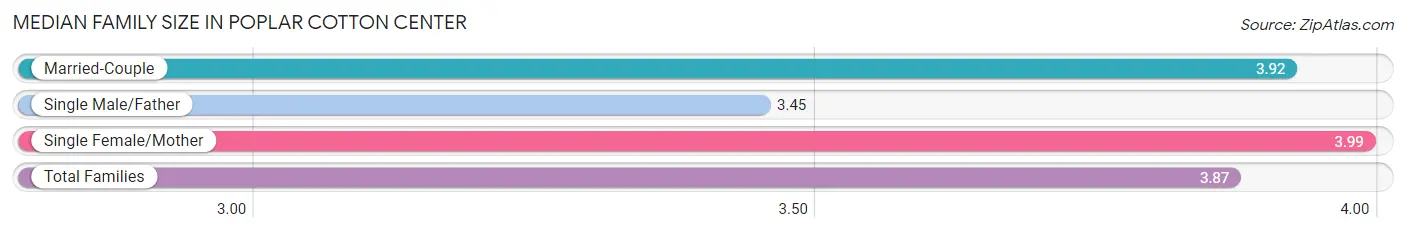
Median Family Size in Poplar Cotton Center
The median family size in Poplar Cotton Center is 3.87 persons per family, with single female/mother families (146 | 36.3%) accounting for the largest median family size of 3.99 persons per family. On the other hand, single male/father families (64 | 15.9%) represent the smallest median family size with 3.45 persons per family.
| Family Type | # Families | Family Size |
| Married-Couple | 192 (47.8%) | 3.92 |
| Single Male/Father | 64 (15.9%) | 3.45 |
| Single Female/Mother | 146 (36.3%) | 3.99 |
| Total Families | 402 (100.0%) | 3.87 |
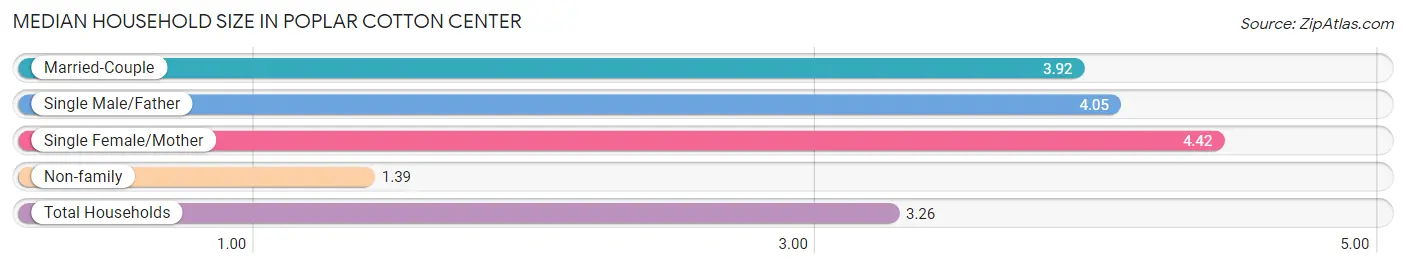
Median Household Size in Poplar Cotton Center
The median household size in Poplar Cotton Center is 3.26 persons per household, with single female/mother households (146 | 24.9%) accounting for the largest median household size of 4.42 persons per household. non-family households (185 | 31.5%) represent the smallest median household size with 1.39 persons per household.
| Household Type | # Households | Household Size |
| Married-Couple | 192 (32.7%) | 3.92 |
| Single Male/Father | 64 (10.9%) | 4.05 |
| Single Female/Mother | 146 (24.9%) | 4.42 |
| Non-family | 185 (31.5%) | 1.39 |
| Total Households | 587 (100.0%) | 3.26 |
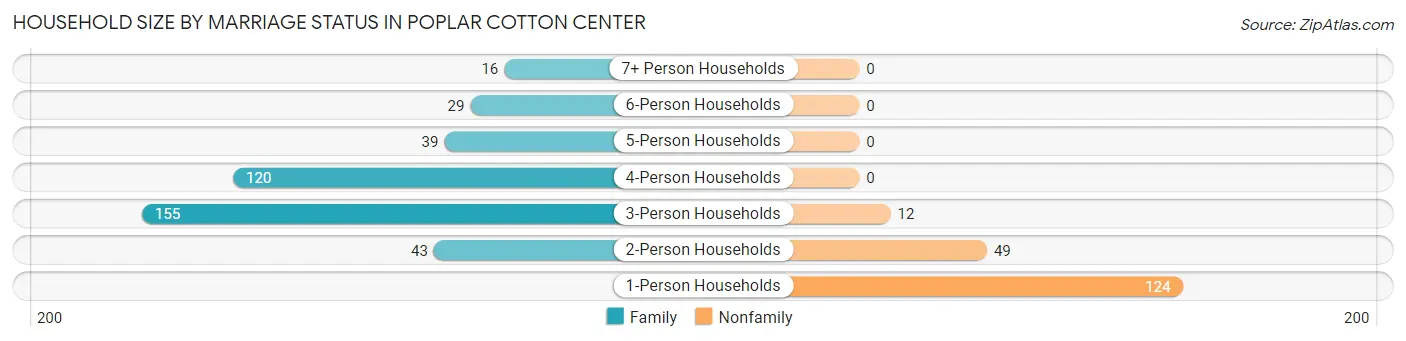
Household Size by Marriage Status in Poplar Cotton Center
Out of a total of 587 households in Poplar Cotton Center, 402 (68.5%) are family households, while 185 (31.5%) are nonfamily households. The most numerous type of family households are 3-person households, comprising 155, and the most common type of nonfamily households are 1-person households, comprising 124.
| Household Size | Family Households | Nonfamily Households |
| 1-Person Households | - | 124 (21.1%) |
| 2-Person Households | 43 (7.3%) | 49 (8.4%) |
| 3-Person Households | 155 (26.4%) | 12 (2.0%) |
| 4-Person Households | 120 (20.4%) | 0 (0.0%) |
| 5-Person Households | 39 (6.6%) | 0 (0.0%) |
| 6-Person Households | 29 (4.9%) | 0 (0.0%) |
| 7+ Person Households | 16 (2.7%) | 0 (0.0%) |
| Total | 402 (68.5%) | 185 (31.5%) |
Female Fertility in Poplar Cotton Center
Fertility by Age in Poplar Cotton Center
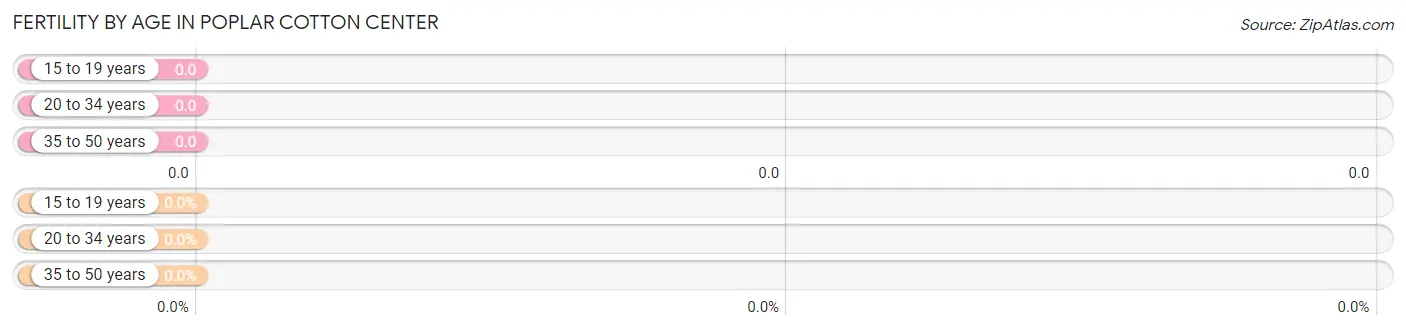
| Age Bracket | Women with Births | Births / 1,000 Women |
| 15 to 19 years | 0 (0.0%) | 0.0 |
| 20 to 34 years | 0 (0.0%) | 0.0 |
| 35 to 50 years | 0 (0.0%) | 0.0 |
| Total | 0 (0.0%) | 0.0 |
Fertility by Age by Marriage Status in Poplar Cotton Center
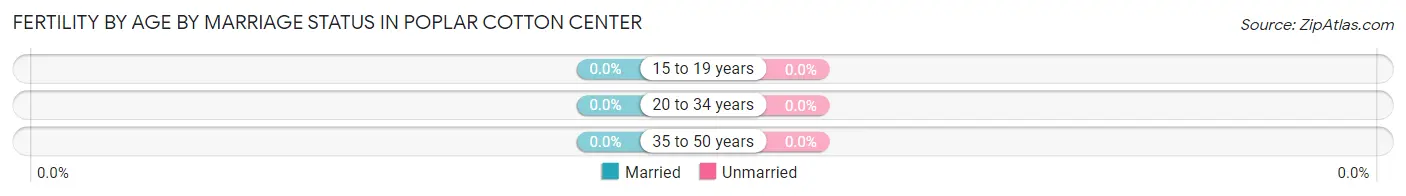
| Age Bracket | Married | Unmarried |
| 15 to 19 years | 0 (0.0%) | 0 (0.0%) |
| 20 to 34 years | 0 (0.0%) | 0 (0.0%) |
| 35 to 50 years | 0 (0.0%) | 0 (0.0%) |
| Total | 0 (0.0%) | 0 (0.0%) |
Fertility by Education in Poplar Cotton Center
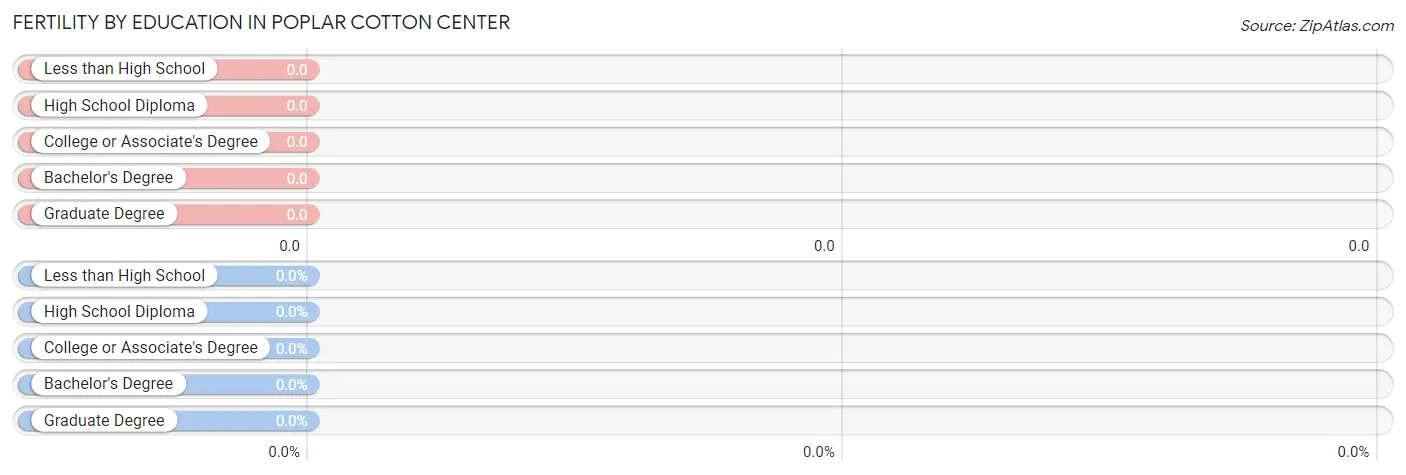
| Educational Attainment | Women with Births | Births / 1,000 Women |
| Less than High School | 0 (0.0%) | 0.0 |
| High School Diploma | 0 (0.0%) | 0.0 |
| College or Associate's Degree | 0 (0.0%) | 0.0 |
| Bachelor's Degree | 0 (0.0%) | 0.0 |
| Graduate Degree | 0 (0.0%) | 0.0 |
| Total | 0 (0.0%) | 0.0 |
Fertility by Education by Marriage Status in Poplar Cotton Center
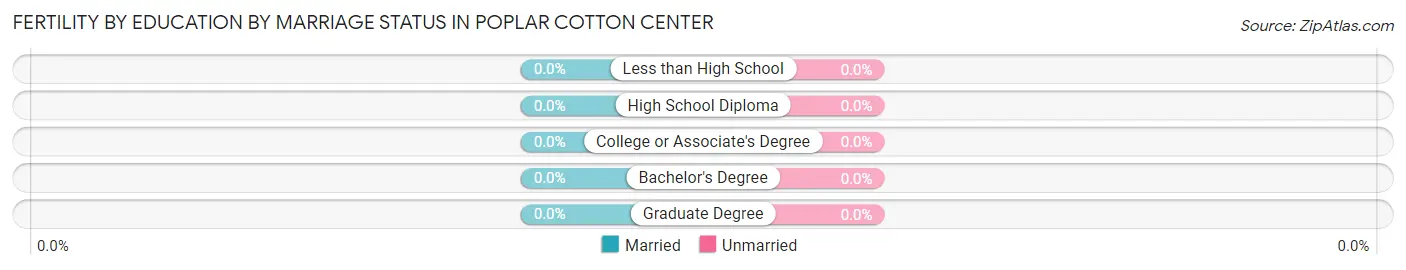
| Educational Attainment | Married | Unmarried |
| Less than High School | 0 (0.0%) | 0 (0.0%) |
| High School Diploma | 0 (0.0%) | 0 (0.0%) |
| College or Associate's Degree | 0 (0.0%) | 0 (0.0%) |
| Bachelor's Degree | 0 (0.0%) | 0 (0.0%) |
| Graduate Degree | 0 (0.0%) | 0 (0.0%) |
| Total | 0 (0.0%) | 0 (0.0%) |
Income in Poplar Cotton Center
Income Overview in Poplar Cotton Center
Per Capita Income in Poplar Cotton Center is $17,801, while median incomes of families and households are $55,391 and $47,951 respectively.
| Characteristic | Number | Measure |
| Per Capita Income | 1,918 | $17,801 |
| Median Family Income | 402 | $55,391 |
| Mean Family Income | 402 | $59,431 |
| Median Household Income | 587 | $47,951 |
| Mean Household Income | 587 | $54,494 |
| Income Deficit | 402 | $0 |
| Wage / Income Gap (%) | 1,918 | 33.78% |
| Wage / Income Gap ($) | 1,918 | 66.22¢ per $1 |
| Gini / Inequality Index | 1,918 | 0.39 |
Earnings by Sex in Poplar Cotton Center
Average Earnings in Poplar Cotton Center are $29,877, $34,722 for men and $22,994 for women, a difference of 33.8%.
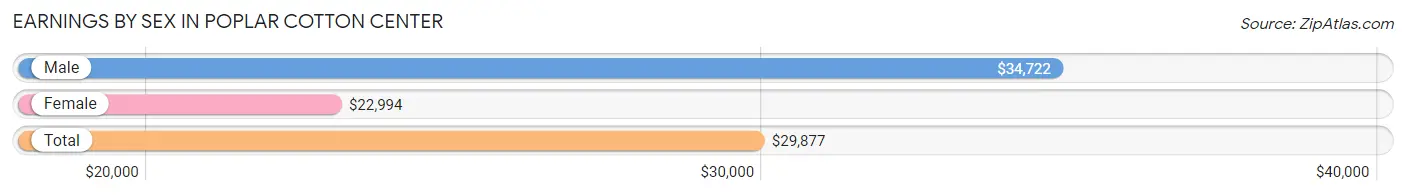
| Sex | Number | Average Earnings |
| Male | 756 (75.8%) | $34,722 |
| Female | 241 (24.2%) | $22,994 |
| Total | 997 (100.0%) | $29,877 |
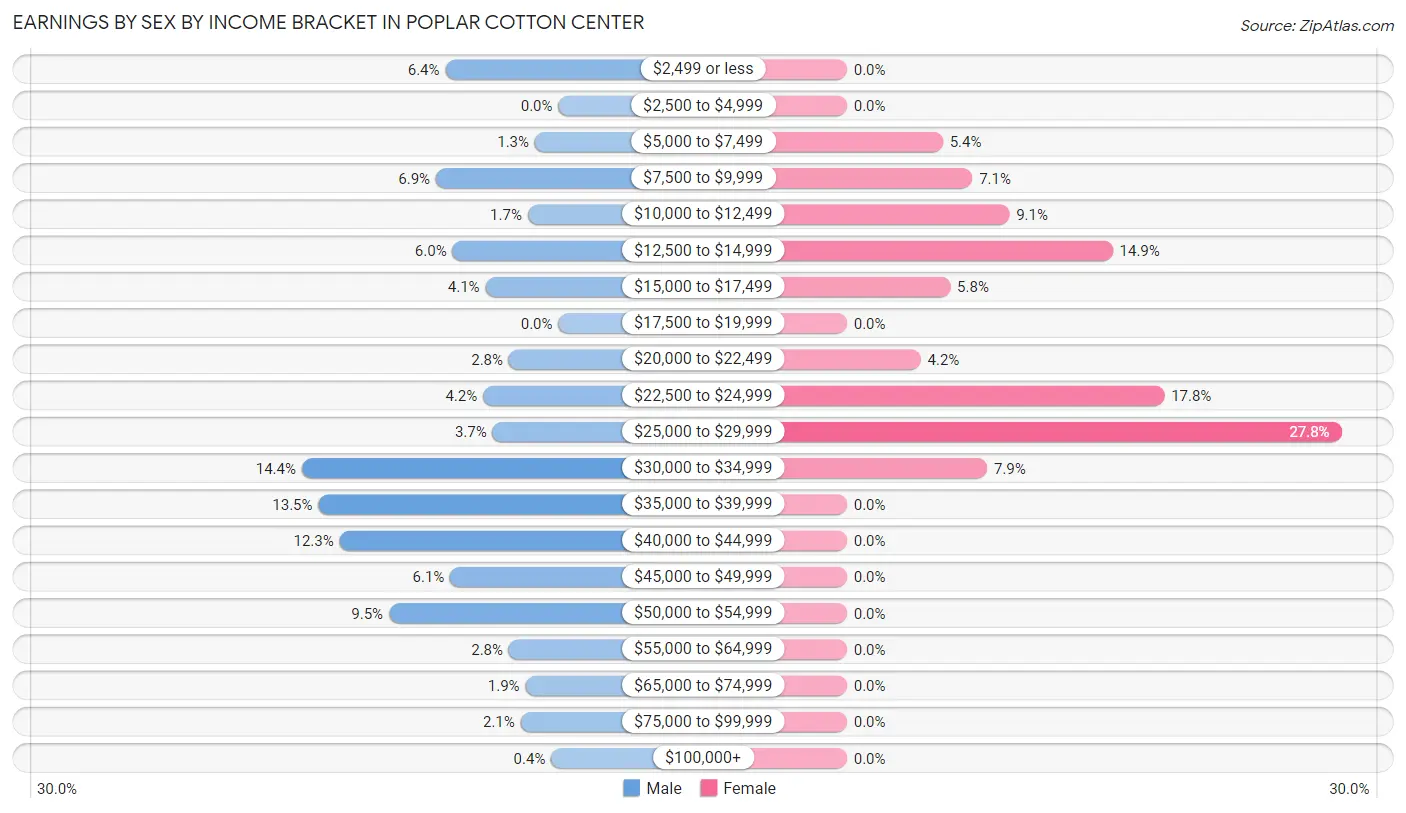
Earnings by Sex by Income Bracket in Poplar Cotton Center
The most common earnings brackets in Poplar Cotton Center are $30,000 to $34,999 for men (109 | 14.4%) and $25,000 to $29,999 for women (67 | 27.8%).
| Income | Male | Female |
| $2,499 or less | 48 (6.4%) | 0 (0.0%) |
| $2,500 to $4,999 | 0 (0.0%) | 0 (0.0%) |
| $5,000 to $7,499 | 10 (1.3%) | 13 (5.4%) |
| $7,500 to $9,999 | 52 (6.9%) | 17 (7.0%) |
| $10,000 to $12,499 | 13 (1.7%) | 22 (9.1%) |
| $12,500 to $14,999 | 45 (5.9%) | 36 (14.9%) |
| $15,000 to $17,499 | 31 (4.1%) | 14 (5.8%) |
| $17,500 to $19,999 | 0 (0.0%) | 0 (0.0%) |
| $20,000 to $22,499 | 21 (2.8%) | 10 (4.2%) |
| $22,500 to $24,999 | 32 (4.2%) | 43 (17.8%) |
| $25,000 to $29,999 | 28 (3.7%) | 67 (27.8%) |
| $30,000 to $34,999 | 109 (14.4%) | 19 (7.9%) |
| $35,000 to $39,999 | 102 (13.5%) | 0 (0.0%) |
| $40,000 to $44,999 | 93 (12.3%) | 0 (0.0%) |
| $45,000 to $49,999 | 46 (6.1%) | 0 (0.0%) |
| $50,000 to $54,999 | 72 (9.5%) | 0 (0.0%) |
| $55,000 to $64,999 | 21 (2.8%) | 0 (0.0%) |
| $65,000 to $74,999 | 14 (1.8%) | 0 (0.0%) |
| $75,000 to $99,999 | 16 (2.1%) | 0 (0.0%) |
| $100,000+ | 3 (0.4%) | 0 (0.0%) |
| Total | 756 (100.0%) | 241 (100.0%) |
Earnings by Sex by Educational Attainment in Poplar Cotton Center
Average earnings in Poplar Cotton Center are $36,932 for men and $23,779 for women, a difference of 35.6%. Men with an educational attainment of college or associate's degree enjoy the highest average annual earnings of $52,614, while those with less than high school education earn the least with $34,063. Women with an educational attainment of less than high school earn the most with the average annual earnings of $20,500, while those with less than high school education have the smallest earnings of $20,500.
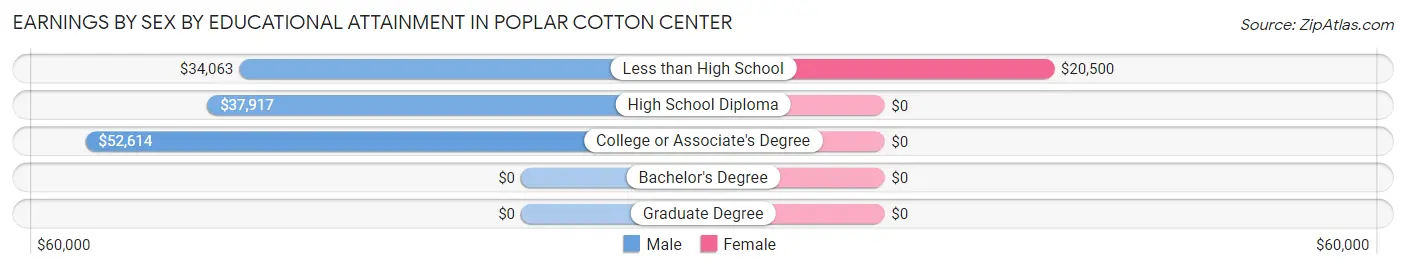
| Educational Attainment | Male Income | Female Income |
| Less than High School | $34,063 | $20,500 |
| High School Diploma | $37,917 | $0 |
| College or Associate's Degree | $52,614 | $0 |
| Bachelor's Degree | - | - |
| Graduate Degree | - | - |
| Total | $36,932 | $23,779 |
Family Income in Poplar Cotton Center
Family Income Brackets in Poplar Cotton Center
According to the Poplar Cotton Center family income data, there are 111 families falling into the $50,000 to $74,999 income range, which is the most common income bracket and makes up 27.6% of all families. Conversely, the $150,000 to $199,999 income bracket is the least frequent group with only 3 families (0.7%) belonging to this category.
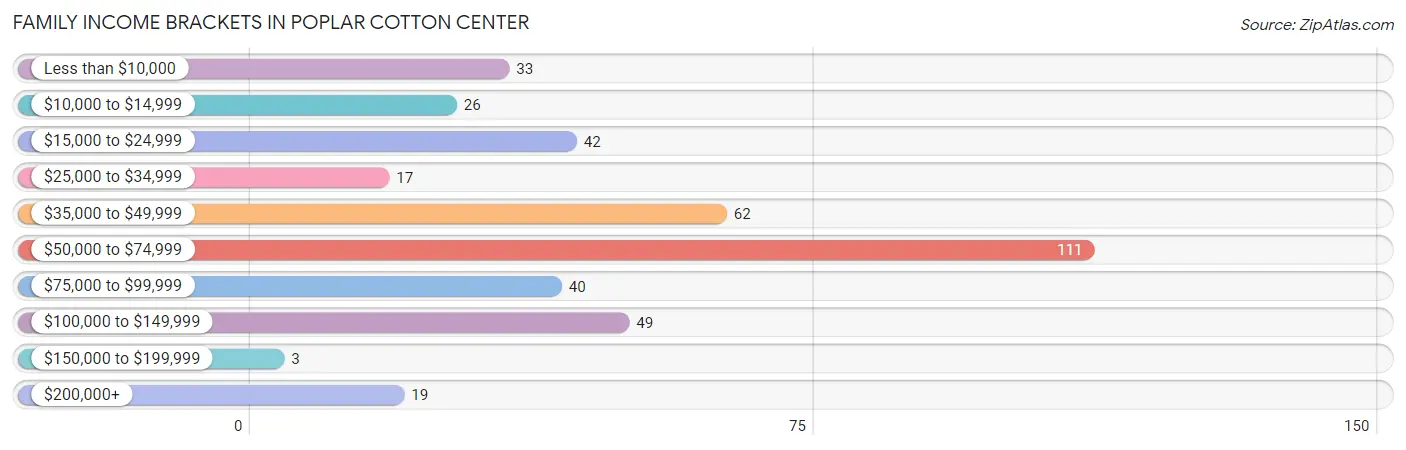
| Income Bracket | # Families | % Families |
| Less than $10,000 | 33 | 8.2% |
| $10,000 to $14,999 | 26 | 6.5% |
| $15,000 to $24,999 | 42 | 10.4% |
| $25,000 to $34,999 | 17 | 4.2% |
| $35,000 to $49,999 | 62 | 15.4% |
| $50,000 to $74,999 | 111 | 27.6% |
| $75,000 to $99,999 | 40 | 10.0% |
| $100,000 to $149,999 | 49 | 12.2% |
| $150,000 to $199,999 | 3 | 0.7% |
| $200,000+ | 19 | 4.7% |
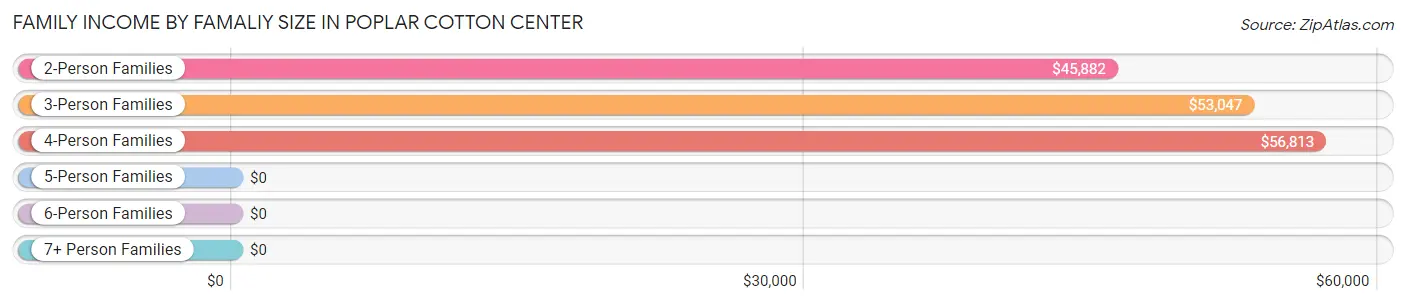
Family Income by Famaliy Size in Poplar Cotton Center
4-person families (109 | 27.1%) account for the highest median family income in Poplar Cotton Center with $56,813 per family, while 2-person families (66 | 16.4%) have the highest median income of $22,941 per family member.
| Income Bracket | # Families | Median Income |
| 2-Person Families | 66 (16.4%) | $45,882 |
| 3-Person Families | 165 (41.0%) | $53,047 |
| 4-Person Families | 109 (27.1%) | $56,813 |
| 5-Person Families | 17 (4.2%) | $0 |
| 6-Person Families | 29 (7.2%) | $0 |
| 7+ Person Families | 16 (4.0%) | $0 |
| Total | 402 (100.0%) | $55,391 |
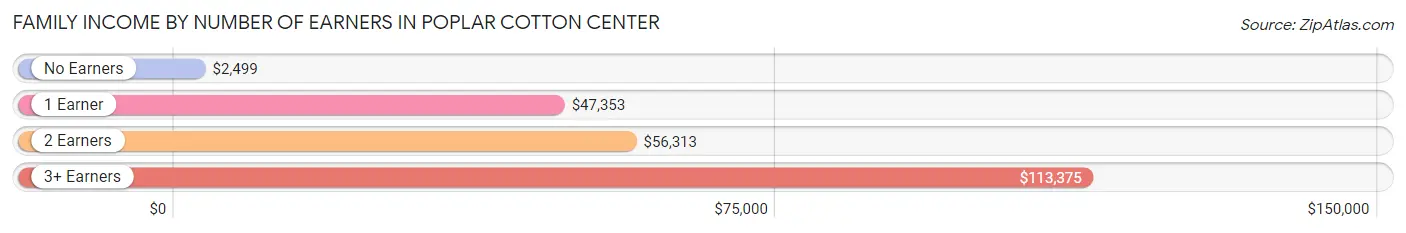
Family Income by Number of Earners in Poplar Cotton Center
The median family income in Poplar Cotton Center is $55,391, with families comprising 3+ earners (51) having the highest median family income of $113,375, while families with no earners (46) have the lowest median family income of $2,499, accounting for 12.7% and 11.4% of families, respectively.
| Number of Earners | # Families | Median Income |
| No Earners | 46 (11.4%) | $2,499 |
| 1 Earner | 168 (41.8%) | $47,353 |
| 2 Earners | 137 (34.1%) | $56,313 |
| 3+ Earners | 51 (12.7%) | $113,375 |
| Total | 402 (100.0%) | $55,391 |
Household Income in Poplar Cotton Center
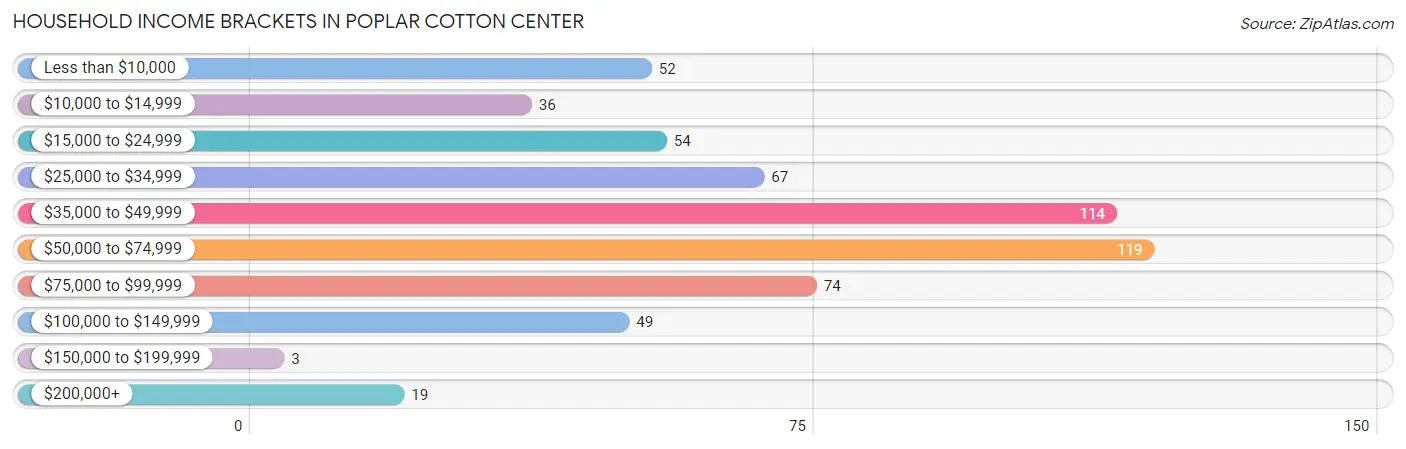
Household Income Brackets in Poplar Cotton Center
With 119 households falling in the category, the $50,000 to $74,999 income range is the most frequent in Poplar Cotton Center, accounting for 20.3% of all households. In contrast, only 3 households (0.5%) fall into the $150,000 to $199,999 income bracket, making it the least populous group.
| Income Bracket | # Households | % Households |
| Less than $10,000 | 52 | 8.9% |
| $10,000 to $14,999 | 36 | 6.1% |
| $15,000 to $24,999 | 54 | 9.2% |
| $25,000 to $34,999 | 67 | 11.4% |
| $35,000 to $49,999 | 114 | 19.4% |
| $50,000 to $74,999 | 119 | 20.3% |
| $75,000 to $99,999 | 74 | 12.6% |
| $100,000 to $149,999 | 49 | 8.3% |
| $150,000 to $199,999 | 3 | 0.5% |
| $200,000+ | 19 | 3.2% |
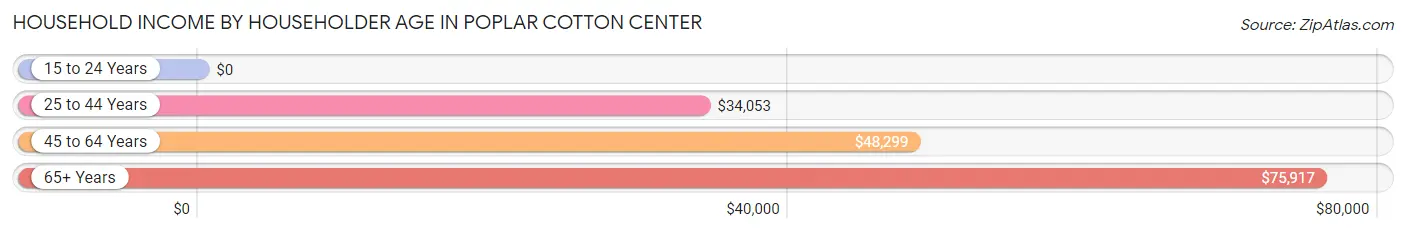
Household Income by Householder Age in Poplar Cotton Center
The median household income in Poplar Cotton Center is $47,951, with the highest median household income of $75,917 found in the 65+ years age bracket for the primary householder. A total of 73 households (12.4%) fall into this category.
| Income Bracket | # Households | Median Income |
| 15 to 24 Years | 0 (0.0%) | $0 |
| 25 to 44 Years | 219 (37.3%) | $34,053 |
| 45 to 64 Years | 295 (50.3%) | $48,299 |
| 65+ Years | 73 (12.4%) | $75,917 |
| Total | 587 (100.0%) | $47,951 |
Poverty in Poplar Cotton Center
Income Below Poverty by Sex and Age in Poplar Cotton Center
With 25.3% poverty level for males and 30.4% for females among the residents of Poplar Cotton Center, under 5 year old males and 65 to 74 year old females are the most vulnerable to poverty, with 66 males (100.0%) and 13 females (81.2%) in their respective age groups living below the poverty level.
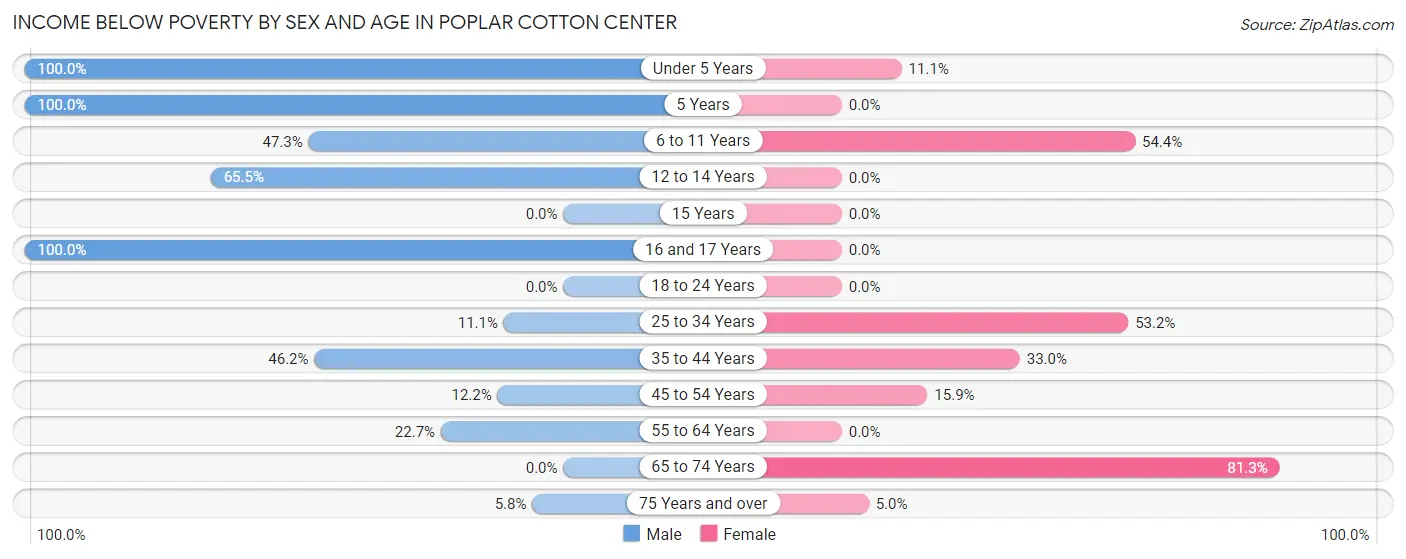
| Age Bracket | Male | Female |
| Under 5 Years | 66 (100.0%) | 8 (11.1%) |
| 5 Years | 18 (100.0%) | 0 (0.0%) |
| 6 to 11 Years | 35 (47.3%) | 43 (54.4%) |
| 12 to 14 Years | 36 (65.4%) | 0 (0.0%) |
| 15 Years | 0 (0.0%) | 0 (0.0%) |
| 16 and 17 Years | 10 (100.0%) | 0 (0.0%) |
| 18 to 24 Years | 0 (0.0%) | 0 (0.0%) |
| 25 to 34 Years | 43 (11.1%) | 101 (53.2%) |
| 35 to 44 Years | 55 (46.2%) | 37 (33.0%) |
| 45 to 54 Years | 16 (12.2%) | 17 (15.9%) |
| 55 to 64 Years | 20 (22.7%) | 0 (0.0%) |
| 65 to 74 Years | 0 (0.0%) | 13 (81.2%) |
| 75 Years and over | 3 (5.8%) | 2 (5.0%) |
| Total | 302 (25.3%) | 221 (30.4%) |
Income Above Poverty by Sex and Age in Poplar Cotton Center
According to the poverty statistics in Poplar Cotton Center, males aged 15 years and females aged 12 to 14 years are the age groups that are most secure financially, with 100.0% of males and 100.0% of females in these age groups living above the poverty line.
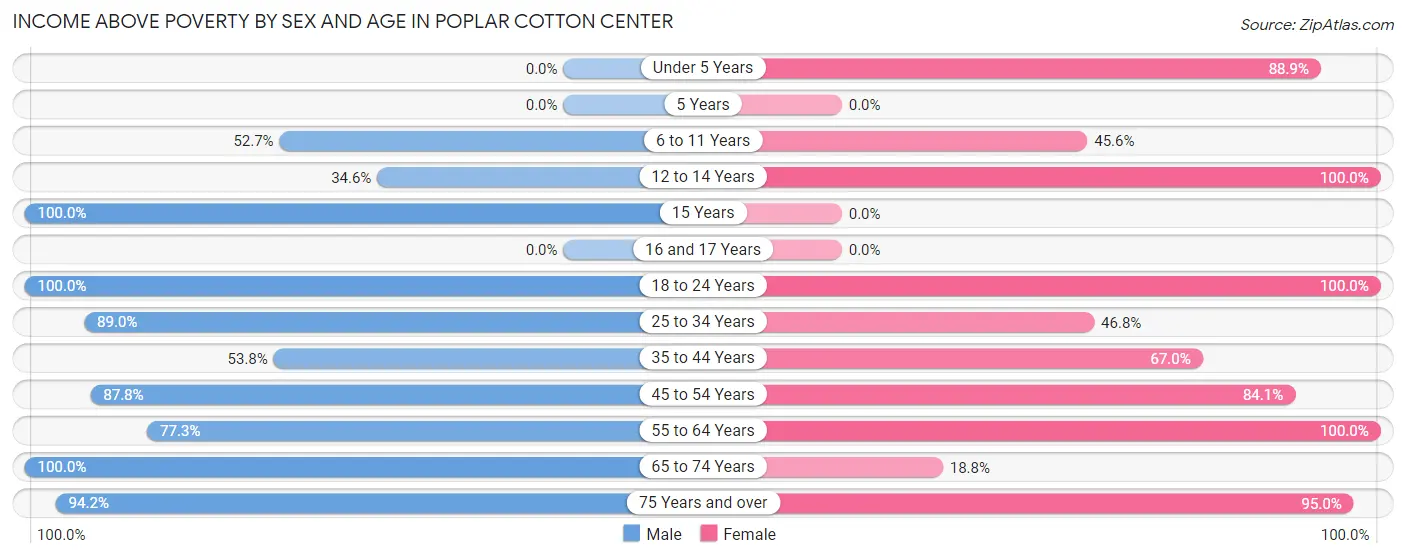
| Age Bracket | Male | Female |
| Under 5 Years | 0 (0.0%) | 64 (88.9%) |
| 5 Years | 0 (0.0%) | 0 (0.0%) |
| 6 to 11 Years | 39 (52.7%) | 36 (45.6%) |
| 12 to 14 Years | 19 (34.5%) | 4 (100.0%) |
| 15 Years | 30 (100.0%) | 0 (0.0%) |
| 16 and 17 Years | 0 (0.0%) | 0 (0.0%) |
| 18 to 24 Years | 117 (100.0%) | 27 (100.0%) |
| 25 to 34 Years | 346 (88.9%) | 89 (46.8%) |
| 35 to 44 Years | 64 (53.8%) | 75 (67.0%) |
| 45 to 54 Years | 115 (87.8%) | 90 (84.1%) |
| 55 to 64 Years | 68 (77.3%) | 79 (100.0%) |
| 65 to 74 Years | 43 (100.0%) | 3 (18.8%) |
| 75 Years and over | 49 (94.2%) | 38 (95.0%) |
| Total | 890 (74.7%) | 505 (69.6%) |
Income Below Poverty Among Married-Couple Families in Poplar Cotton Center
The poverty statistics for married-couple families in Poplar Cotton Center show that 9.4% or 18 of the total 192 families live below the poverty line. Families with 1 or 2 children have the highest poverty rate of 34.0%, comprising of 18 families. On the other hand, families with no children have the lowest poverty rate of 0.0%, which includes 0 families.
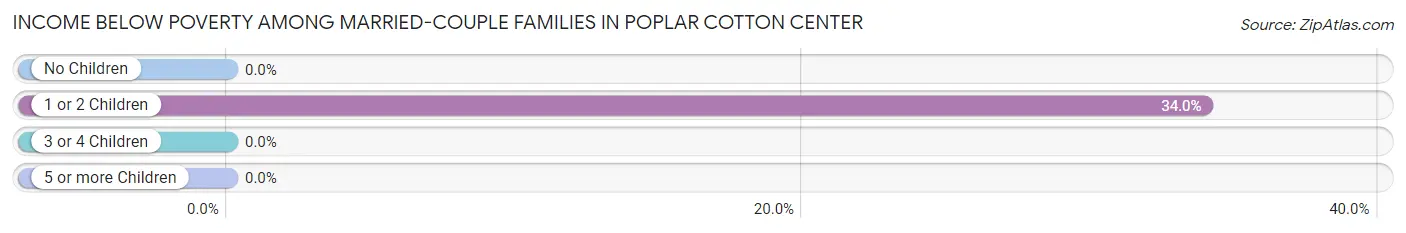
| Children | Above Poverty | Below Poverty |
| No Children | 139 (100.0%) | 0 (0.0%) |
| 1 or 2 Children | 35 (66.0%) | 18 (34.0%) |
| 3 or 4 Children | 0 (0.0%) | 0 (0.0%) |
| 5 or more Children | 0 (0.0%) | 0 (0.0%) |
| Total | 174 (90.6%) | 18 (9.4%) |
Income Below Poverty Among Single-Parent Households in Poplar Cotton Center
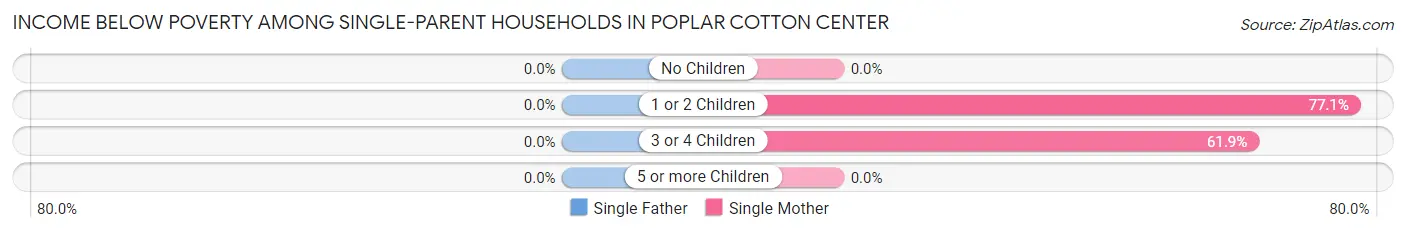
| Children | Single Father | Single Mother |
| No Children | 0 (0.0%) | 0 (0.0%) |
| 1 or 2 Children | 0 (0.0%) | 47 (77.0%) |
| 3 or 4 Children | 0 (0.0%) | 26 (61.9%) |
| 5 or more Children | 0 (0.0%) | 0 (0.0%) |
| Total | 0 (0.0%) | 73 (50.0%) |
Income Below Poverty Among Married-Couple vs Single-Parent Households in Poplar Cotton Center
The poverty data for Poplar Cotton Center shows that 18 of the married-couple family households (9.4%) and 73 of the single-parent households (34.8%) are living below the poverty level. Within the married-couple family households, those with 1 or 2 children have the highest poverty rate, with 18 households (34.0%) falling below the poverty line. Among the single-parent households, those with 3 or 4 children have the highest poverty rate, with 26 household (61.9%) living below poverty.
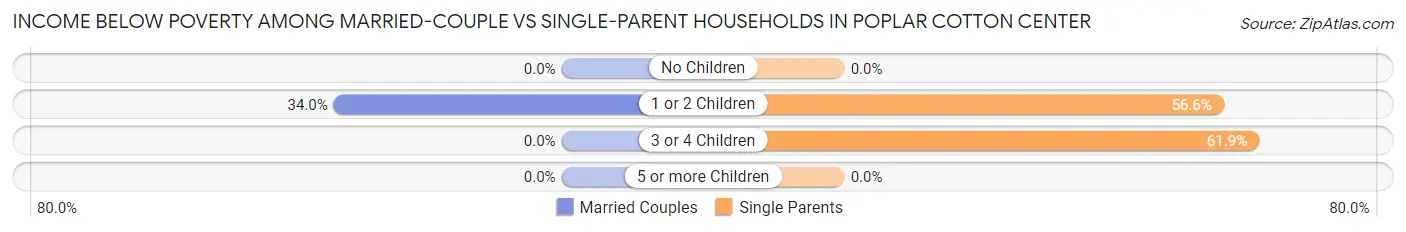
| Children | Married-Couple Families | Single-Parent Households |
| No Children | 0 (0.0%) | 0 (0.0%) |
| 1 or 2 Children | 18 (34.0%) | 47 (56.6%) |
| 3 or 4 Children | 0 (0.0%) | 26 (61.9%) |
| 5 or more Children | 0 (0.0%) | 0 (0.0%) |
| Total | 18 (9.4%) | 73 (34.8%) |
Employment Characteristics in Poplar Cotton Center
Employment by Class of Employer in Poplar Cotton Center
Among the 851 employed individuals in Poplar Cotton Center, private company employees (789 | 92.7%), self-employed (not incorporated) (48 | 5.6%), and local government employees (14 | 1.7%) make up the most common classes of employment.
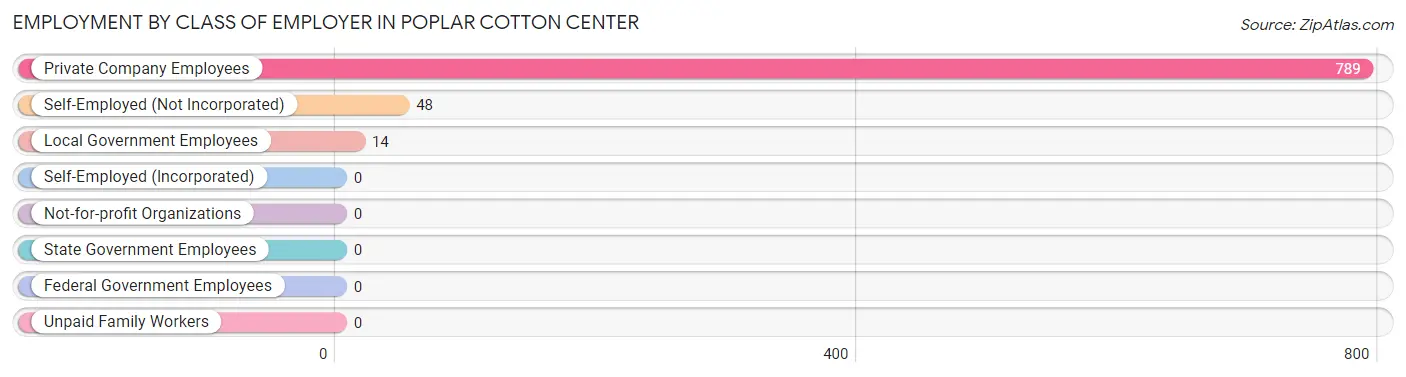
| Employer Class | # Employees | % Employees |
| Private Company Employees | 789 | 92.7% |
| Self-Employed (Incorporated) | 0 | 0.0% |
| Self-Employed (Not Incorporated) | 48 | 5.6% |
| Not-for-profit Organizations | 0 | 0.0% |
| Local Government Employees | 14 | 1.7% |
| State Government Employees | 0 | 0.0% |
| Federal Government Employees | 0 | 0.0% |
| Unpaid Family Workers | 0 | 0.0% |
| Total | 851 | 100.0% |
Employment Status by Age in Poplar Cotton Center
According to the labor force statistics for Poplar Cotton Center, out of the total population over 16 years of age (1,520), 69.2% or 1,052 individuals are in the labor force, with 19.1% or 201 of them unemployed. The age group with the highest labor force participation rate is 55 to 59 years, with 89.0% or 73 individuals in the labor force. Within the labor force, the 35 to 44 years age range has the highest percentage of unemployed individuals, with 38.8% or 71 of them being unemployed.
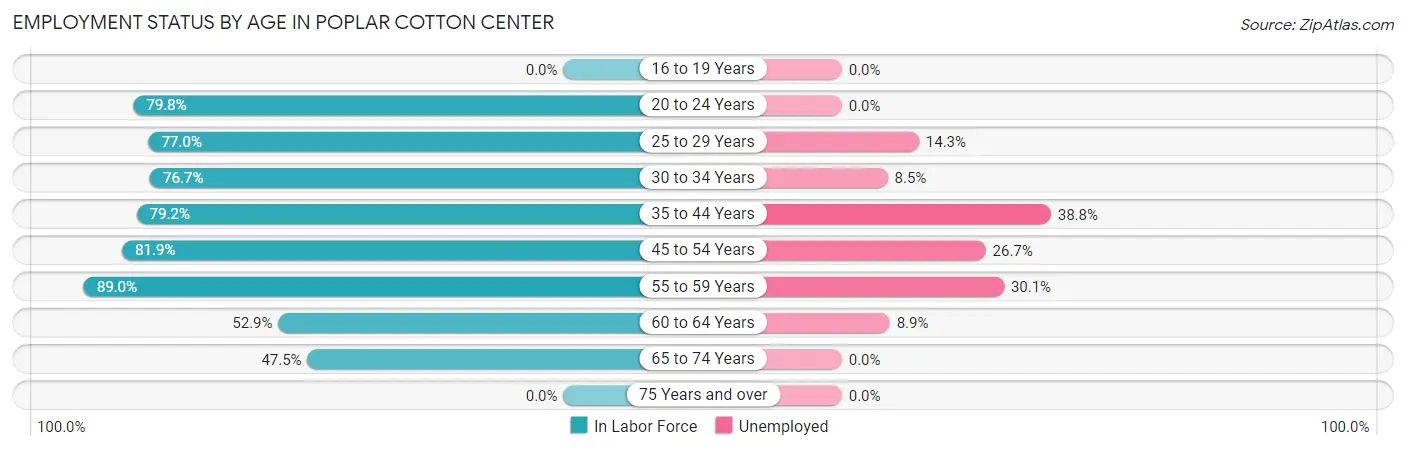
| Age Bracket | In Labor Force | Unemployed |
| 16 to 19 Years | 0 (0.0%) | 0 (0.0%) |
| 20 to 24 Years | 83 (79.8%) | 0 (0.0%) |
| 25 to 29 Years | 244 (77.0%) | 35 (14.3%) |
| 30 to 34 Years | 201 (76.7%) | 17 (8.5%) |
| 35 to 44 Years | 183 (79.2%) | 71 (38.8%) |
| 45 to 54 Years | 195 (81.9%) | 52 (26.7%) |
| 55 to 59 Years | 73 (89.0%) | 22 (30.1%) |
| 60 to 64 Years | 45 (52.9%) | 4 (8.9%) |
| 65 to 74 Years | 28 (47.5%) | 0 (0.0%) |
| 75 Years and over | 0 (0.0%) | 0 (0.0%) |
| Total | 1,052 (69.2%) | 201 (19.1%) |
Employment Status by Educational Attainment in Poplar Cotton Center
According to labor force statistics for Poplar Cotton Center, 77.4% of individuals (940) out of the total population between 25 and 64 years of age (1,215) are in the labor force, with 21.4% or 201 of them being unemployed. The group with the highest labor force participation rate are those with the educational attainment of bachelor's degree or higher, with 100.0% or 49 individuals in the labor force. Within the labor force, individuals with less than high school education have the highest percentage of unemployment, with 25.1% or 113 of them being unemployed.
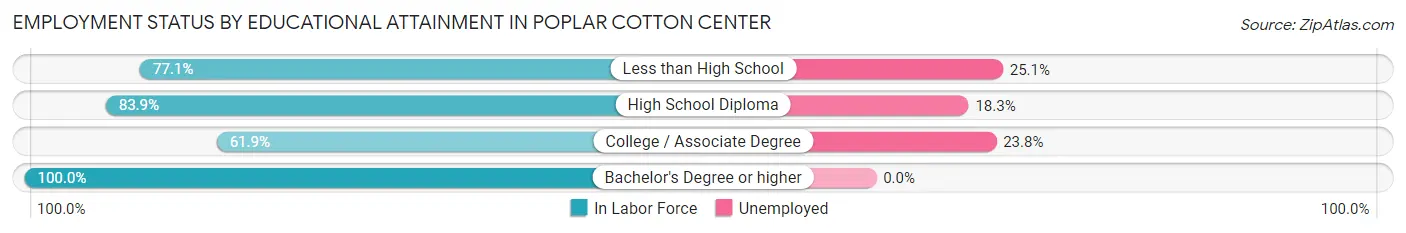
| Educational Attainment | In Labor Force | Unemployed |
| Less than High School | 450 (77.1%) | 147 (25.1%) |
| High School Diploma | 312 (83.9%) | 68 (18.3%) |
| College / Associate Degree | 130 (61.9%) | 50 (23.8%) |
| Bachelor's Degree or higher | 49 (100.0%) | 0 (0.0%) |
| Total | 940 (77.4%) | 260 (21.4%) |
Employment Occupations by Sex in Poplar Cotton Center
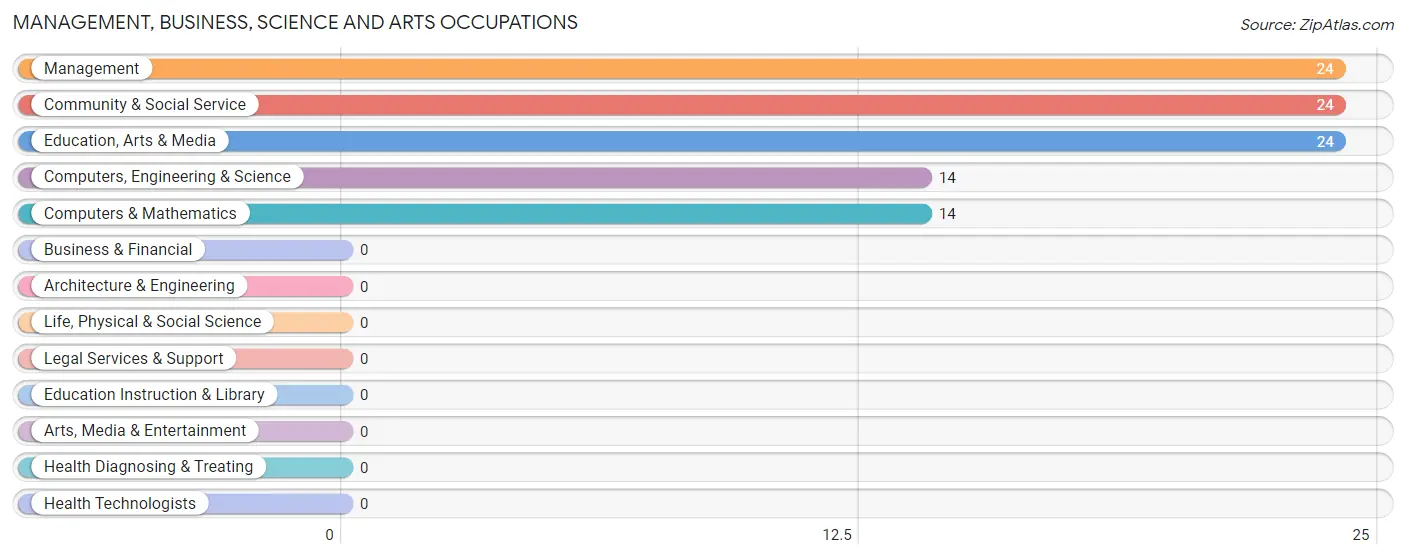
Management, Business, Science and Arts Occupations
The most common Management, Business, Science and Arts occupations in Poplar Cotton Center are Management (24 | 2.8%), Community & Social Service (24 | 2.8%), Education, Arts & Media (24 | 2.8%), Computers, Engineering & Science (14 | 1.7%), and Computers & Mathematics (14 | 1.7%).
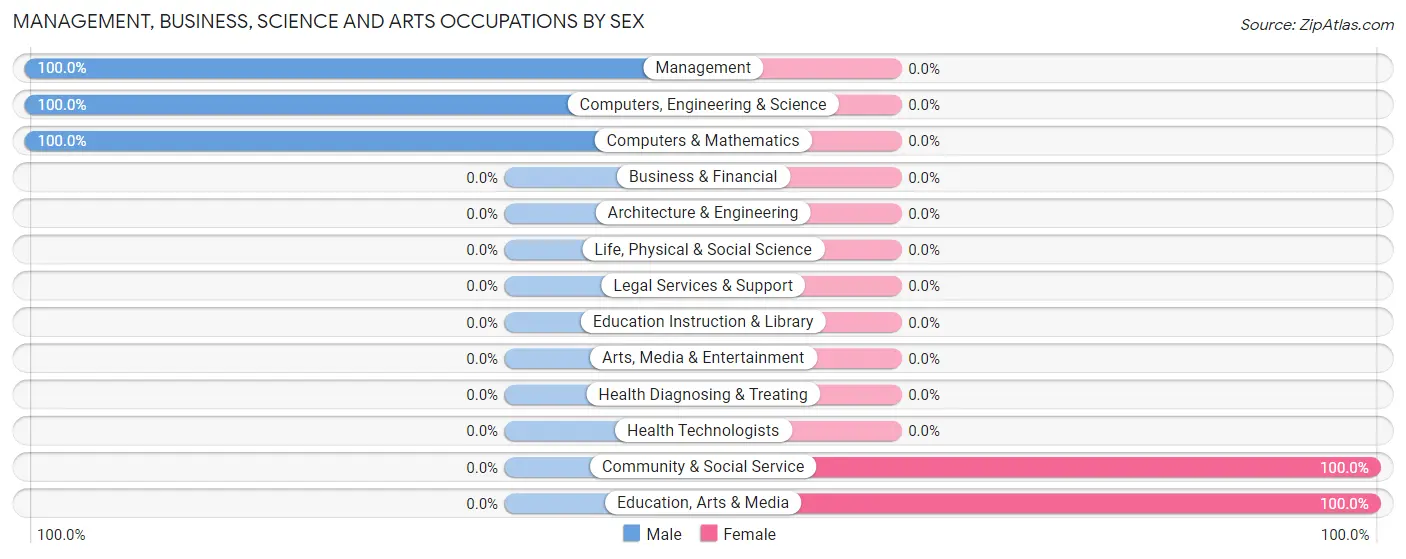
Management, Business, Science and Arts Occupations by Sex
Within the Management, Business, Science and Arts occupations in Poplar Cotton Center, the most male-oriented occupations are Management (100.0%), Computers, Engineering & Science (100.0%), and Computers & Mathematics (100.0%), while the most female-oriented occupations are Community & Social Service (100.0%), and Education, Arts & Media (100.0%).
| Occupation | Male | Female |
| Management | 24 (100.0%) | 0 (0.0%) |
| Business & Financial | 0 (0.0%) | 0 (0.0%) |
| Computers, Engineering & Science | 14 (100.0%) | 0 (0.0%) |
| Computers & Mathematics | 14 (100.0%) | 0 (0.0%) |
| Architecture & Engineering | 0 (0.0%) | 0 (0.0%) |
| Life, Physical & Social Science | 0 (0.0%) | 0 (0.0%) |
| Community & Social Service | 0 (0.0%) | 24 (100.0%) |
| Education, Arts & Media | 0 (0.0%) | 24 (100.0%) |
| Legal Services & Support | 0 (0.0%) | 0 (0.0%) |
| Education Instruction & Library | 0 (0.0%) | 0 (0.0%) |
| Arts, Media & Entertainment | 0 (0.0%) | 0 (0.0%) |
| Health Diagnosing & Treating | 0 (0.0%) | 0 (0.0%) |
| Health Technologists | 0 (0.0%) | 0 (0.0%) |
| Total (Category) | 38 (61.3%) | 24 (38.7%) |
| Total (Overall) | 667 (78.4%) | 184 (21.6%) |
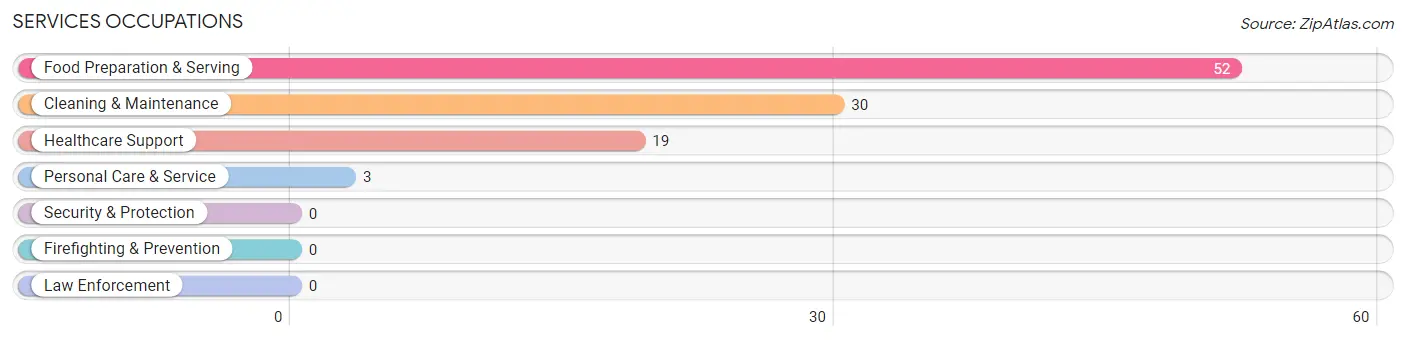
Services Occupations
The most common Services occupations in Poplar Cotton Center are Food Preparation & Serving (52 | 6.1%), Cleaning & Maintenance (30 | 3.5%), Healthcare Support (19 | 2.2%), and Personal Care & Service (3 | 0.4%).
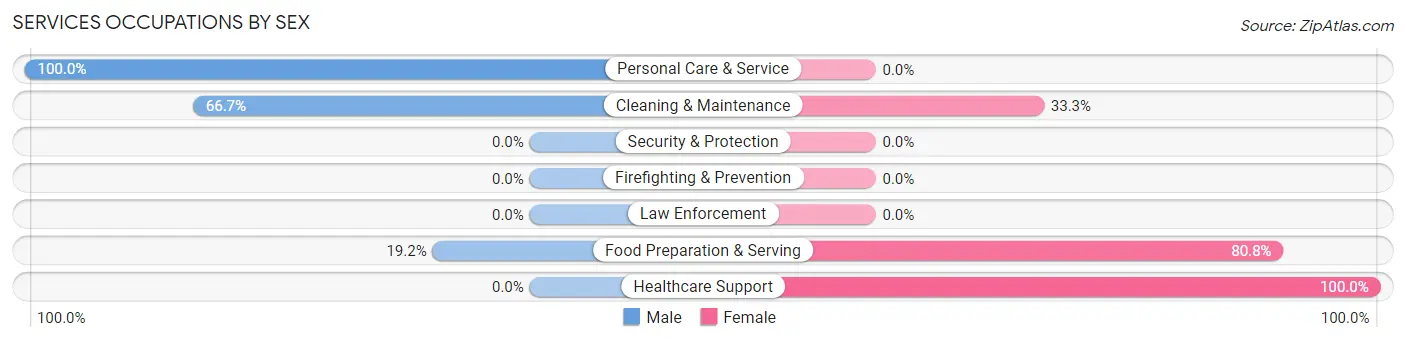
Services Occupations by Sex
Within the Services occupations in Poplar Cotton Center, the most male-oriented occupations are Personal Care & Service (100.0%), Cleaning & Maintenance (66.7%), and Food Preparation & Serving (19.2%), while the most female-oriented occupations are Healthcare Support (100.0%), Food Preparation & Serving (80.8%), and Cleaning & Maintenance (33.3%).
| Occupation | Male | Female |
| Healthcare Support | 0 (0.0%) | 19 (100.0%) |
| Security & Protection | 0 (0.0%) | 0 (0.0%) |
| Firefighting & Prevention | 0 (0.0%) | 0 (0.0%) |
| Law Enforcement | 0 (0.0%) | 0 (0.0%) |
| Food Preparation & Serving | 10 (19.2%) | 42 (80.8%) |
| Cleaning & Maintenance | 20 (66.7%) | 10 (33.3%) |
| Personal Care & Service | 3 (100.0%) | 0 (0.0%) |
| Total (Category) | 33 (31.7%) | 71 (68.3%) |
| Total (Overall) | 667 (78.4%) | 184 (21.6%) |
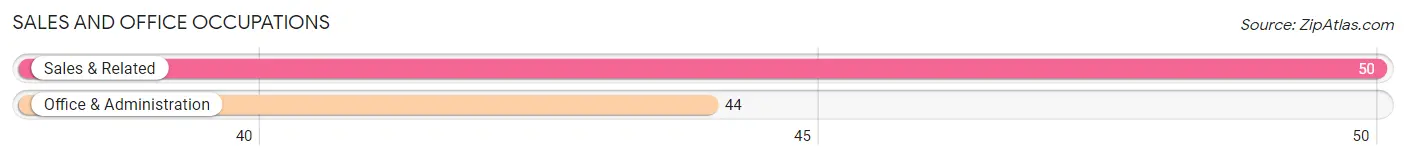
Sales and Office Occupations
The most common Sales and Office occupations in Poplar Cotton Center are Sales & Related (50 | 5.9%), and Office & Administration (44 | 5.2%).
Sales and Office Occupations by Sex
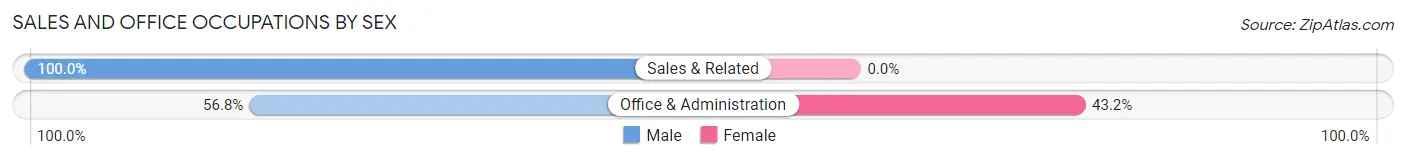
| Occupation | Male | Female |
| Sales & Related | 50 (100.0%) | 0 (0.0%) |
| Office & Administration | 25 (56.8%) | 19 (43.2%) |
| Total (Category) | 75 (79.8%) | 19 (20.2%) |
| Total (Overall) | 667 (78.4%) | 184 (21.6%) |
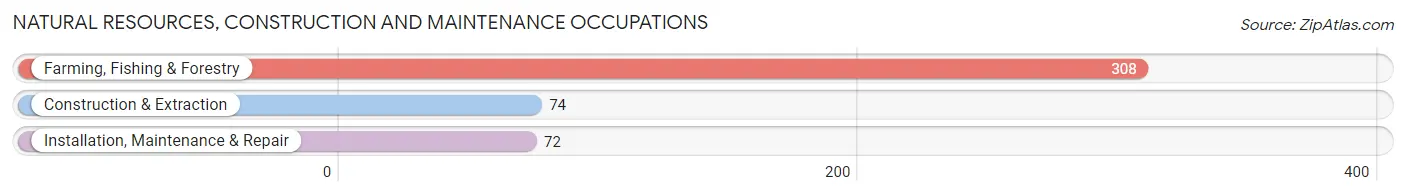
Natural Resources, Construction and Maintenance Occupations
The most common Natural Resources, Construction and Maintenance occupations in Poplar Cotton Center are Farming, Fishing & Forestry (308 | 36.2%), Construction & Extraction (74 | 8.7%), and Installation, Maintenance & Repair (72 | 8.5%).
Natural Resources, Construction and Maintenance Occupations by Sex
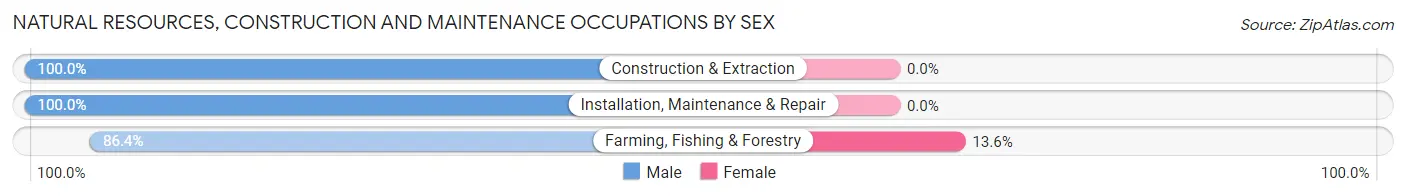
| Occupation | Male | Female |
| Farming, Fishing & Forestry | 266 (86.4%) | 42 (13.6%) |
| Construction & Extraction | 74 (100.0%) | 0 (0.0%) |
| Installation, Maintenance & Repair | 72 (100.0%) | 0 (0.0%) |
| Total (Category) | 412 (90.7%) | 42 (9.2%) |
| Total (Overall) | 667 (78.4%) | 184 (21.6%) |
Production, Transportation and Moving Occupations
The most common Production, Transportation and Moving occupations in Poplar Cotton Center are Transportation (55 | 6.5%), Material Moving (54 | 6.4%), and Production (28 | 3.3%).
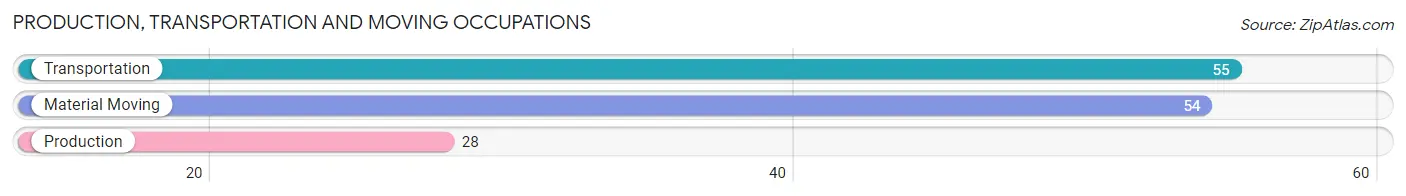
Production, Transportation and Moving Occupations by Sex
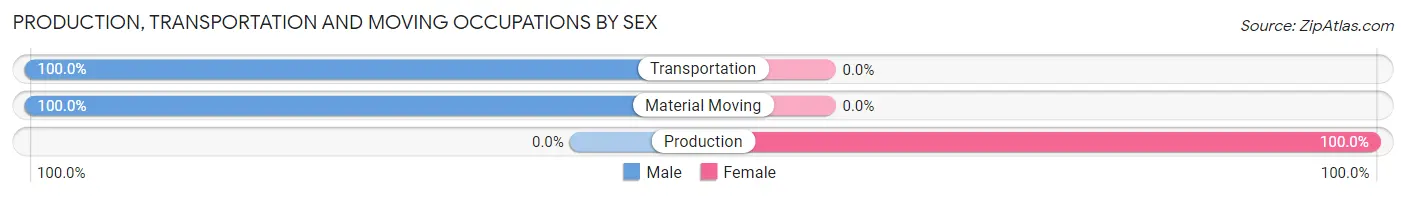
| Occupation | Male | Female |
| Production | 0 (0.0%) | 28 (100.0%) |
| Transportation | 55 (100.0%) | 0 (0.0%) |
| Material Moving | 54 (100.0%) | 0 (0.0%) |
| Total (Category) | 109 (79.6%) | 28 (20.4%) |
| Total (Overall) | 667 (78.4%) | 184 (21.6%) |
Employment Industries by Sex in Poplar Cotton Center
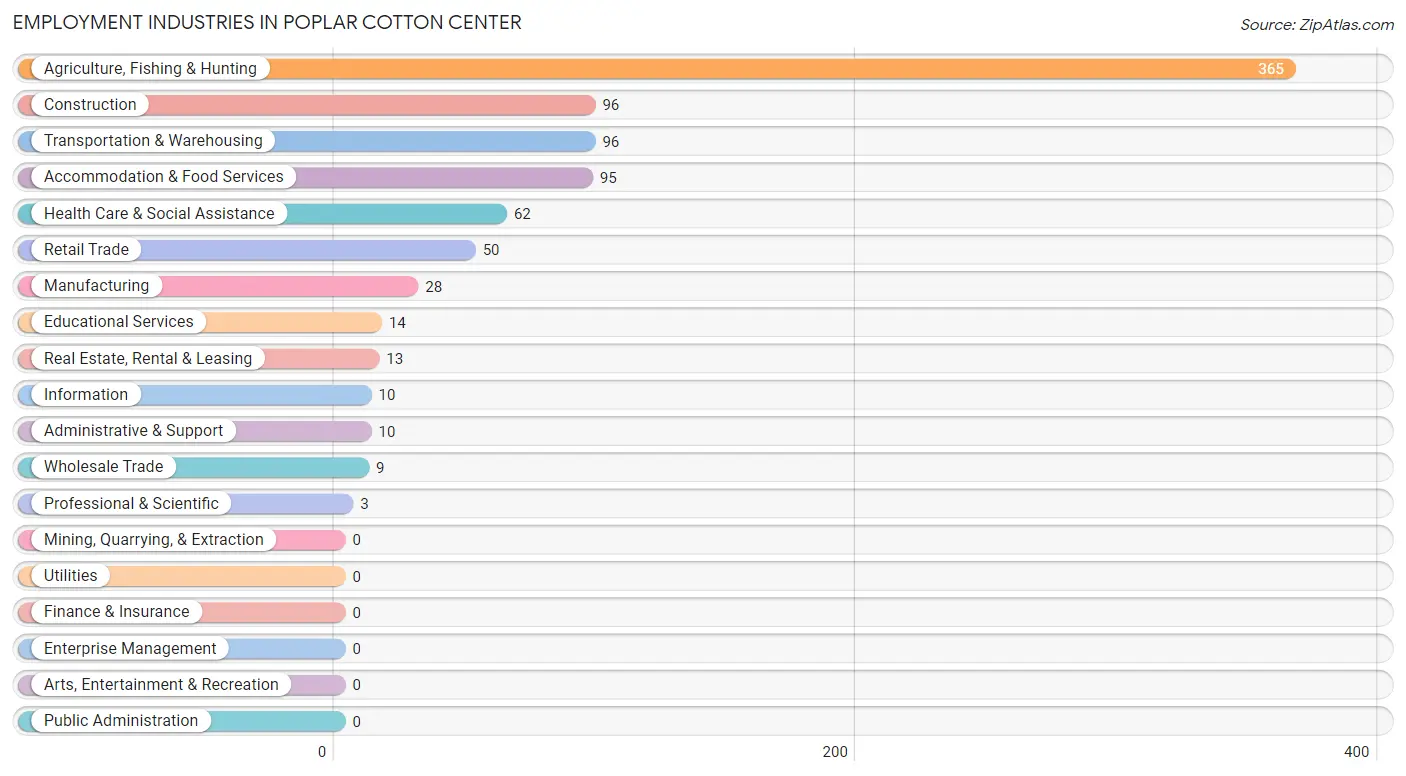
Employment Industries in Poplar Cotton Center
The major employment industries in Poplar Cotton Center include Agriculture, Fishing & Hunting (365 | 42.9%), Construction (96 | 11.3%), Transportation & Warehousing (96 | 11.3%), Accommodation & Food Services (95 | 11.2%), and Health Care & Social Assistance (62 | 7.3%).
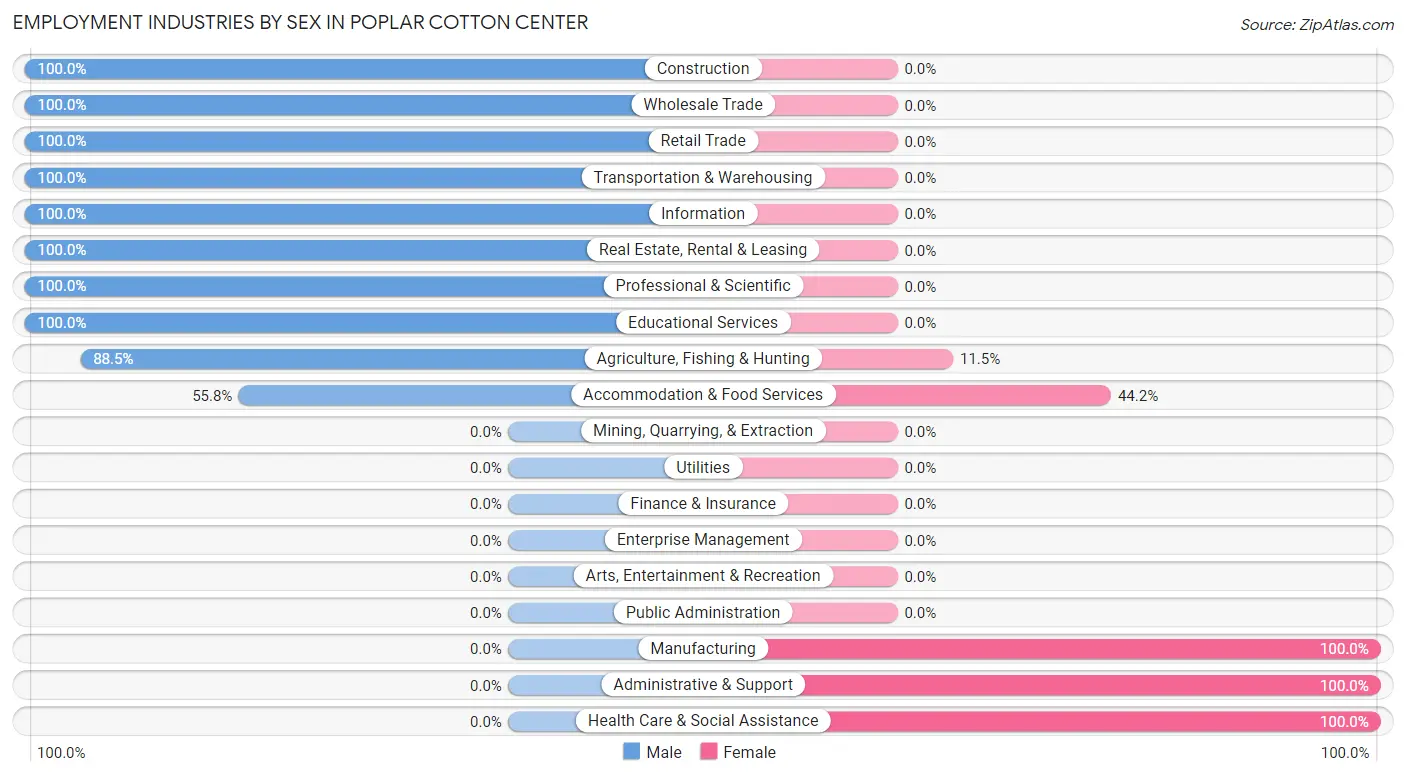
Employment Industries by Sex in Poplar Cotton Center
The Poplar Cotton Center industries that see more men than women are Construction (100.0%), Wholesale Trade (100.0%), and Retail Trade (100.0%), whereas the industries that tend to have a higher number of women are Manufacturing (100.0%), Administrative & Support (100.0%), and Health Care & Social Assistance (100.0%).
| Industry | Male | Female |
| Agriculture, Fishing & Hunting | 323 (88.5%) | 42 (11.5%) |
| Mining, Quarrying, & Extraction | 0 (0.0%) | 0 (0.0%) |
| Construction | 96 (100.0%) | 0 (0.0%) |
| Manufacturing | 0 (0.0%) | 28 (100.0%) |
| Wholesale Trade | 9 (100.0%) | 0 (0.0%) |
| Retail Trade | 50 (100.0%) | 0 (0.0%) |
| Transportation & Warehousing | 96 (100.0%) | 0 (0.0%) |
| Utilities | 0 (0.0%) | 0 (0.0%) |
| Information | 10 (100.0%) | 0 (0.0%) |
| Finance & Insurance | 0 (0.0%) | 0 (0.0%) |
| Real Estate, Rental & Leasing | 13 (100.0%) | 0 (0.0%) |
| Professional & Scientific | 3 (100.0%) | 0 (0.0%) |
| Enterprise Management | 0 (0.0%) | 0 (0.0%) |
| Administrative & Support | 0 (0.0%) | 10 (100.0%) |
| Educational Services | 14 (100.0%) | 0 (0.0%) |
| Health Care & Social Assistance | 0 (0.0%) | 62 (100.0%) |
| Arts, Entertainment & Recreation | 0 (0.0%) | 0 (0.0%) |
| Accommodation & Food Services | 53 (55.8%) | 42 (44.2%) |
| Public Administration | 0 (0.0%) | 0 (0.0%) |
| Total | 667 (78.4%) | 184 (21.6%) |
Education in Poplar Cotton Center
School Enrollment in Poplar Cotton Center
The most common levels of schooling among the 336 students in Poplar Cotton Center are elementary school (90 | 26.8%), middle school (85 | 25.3%), and high school (77 | 22.9%).
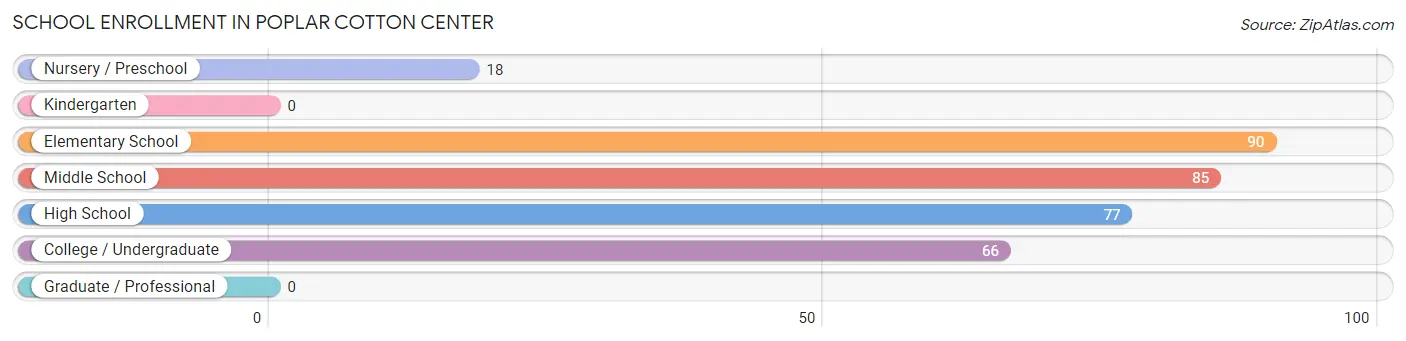
| School Level | # Students | % Students |
| Nursery / Preschool | 18 | 5.4% |
| Kindergarten | 0 | 0.0% |
| Elementary School | 90 | 26.8% |
| Middle School | 85 | 25.3% |
| High School | 77 | 22.9% |
| College / Undergraduate | 66 | 19.6% |
| Graduate / Professional | 0 | 0.0% |
| Total | 336 | 100.0% |
School Enrollment by Age by Funding Source in Poplar Cotton Center
Out of a total of 336 students who are enrolled in schools in Poplar Cotton Center, 11 (3.3%) attend a private institution, while the remaining 325 (96.7%) are enrolled in public schools. The age group of 25 to 34 year olds has the highest likelihood of being enrolled in private schools, with 11 (42.3% in the age bracket) enrolled. Conversely, the age group of 5 to 9 year old has the lowest likelihood of being enrolled in a private school, with 76 (100.0% in the age bracket) attending a public institution.
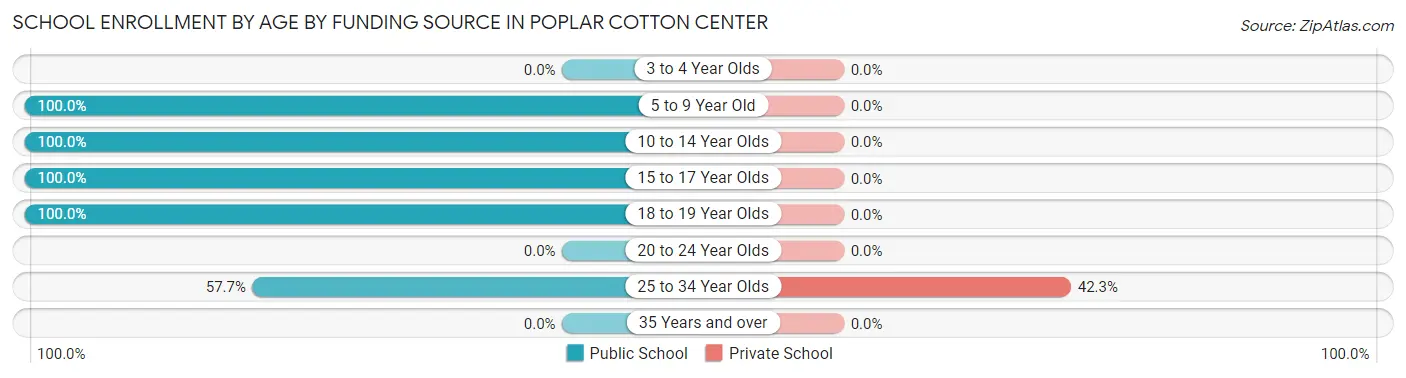
| Age Bracket | Public School | Private School |
| 3 to 4 Year Olds | 0 (0.0%) | 0 (0.0%) |
| 5 to 9 Year Old | 76 (100.0%) | 0 (0.0%) |
| 10 to 14 Year Olds | 154 (100.0%) | 0 (0.0%) |
| 15 to 17 Year Olds | 40 (100.0%) | 0 (0.0%) |
| 18 to 19 Year Olds | 40 (100.0%) | 0 (0.0%) |
| 20 to 24 Year Olds | 0 (0.0%) | 0 (0.0%) |
| 25 to 34 Year Olds | 15 (57.7%) | 11 (42.3%) |
| 35 Years and over | 0 (0.0%) | 0 (0.0%) |
| Total | 325 (96.7%) | 11 (3.3%) |
Educational Attainment by Field of Study in Poplar Cotton Center
Psychology (24 | 30.8%), social sciences (24 | 30.8%), education (15 | 19.2%), communications (10 | 12.8%), and literature & languages (3 | 3.8%) are the most common fields of study among 78 individuals in Poplar Cotton Center who have obtained a bachelor's degree or higher.
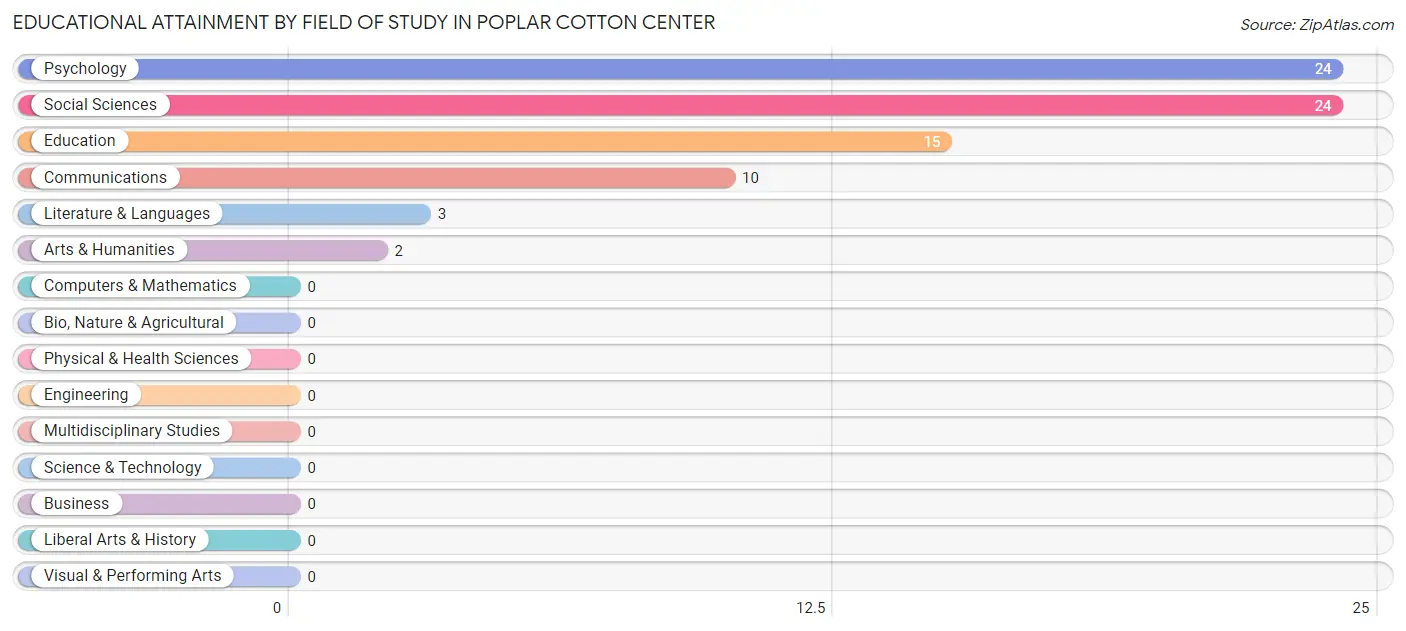
| Field of Study | # Graduates | % Graduates |
| Computers & Mathematics | 0 | 0.0% |
| Bio, Nature & Agricultural | 0 | 0.0% |
| Physical & Health Sciences | 0 | 0.0% |
| Psychology | 24 | 30.8% |
| Social Sciences | 24 | 30.8% |
| Engineering | 0 | 0.0% |
| Multidisciplinary Studies | 0 | 0.0% |
| Science & Technology | 0 | 0.0% |
| Business | 0 | 0.0% |
| Education | 15 | 19.2% |
| Literature & Languages | 3 | 3.8% |
| Liberal Arts & History | 0 | 0.0% |
| Visual & Performing Arts | 0 | 0.0% |
| Communications | 10 | 12.8% |
| Arts & Humanities | 2 | 2.6% |
| Total | 78 | 100.0% |
Transportation & Commute in Poplar Cotton Center
Vehicle Availability by Sex in Poplar Cotton Center
The most prevalent vehicle ownership categories in Poplar Cotton Center are males with 3 vehicles (192, accounting for 28.8%) and females with 3 vehicles (99, making up 104.4%).
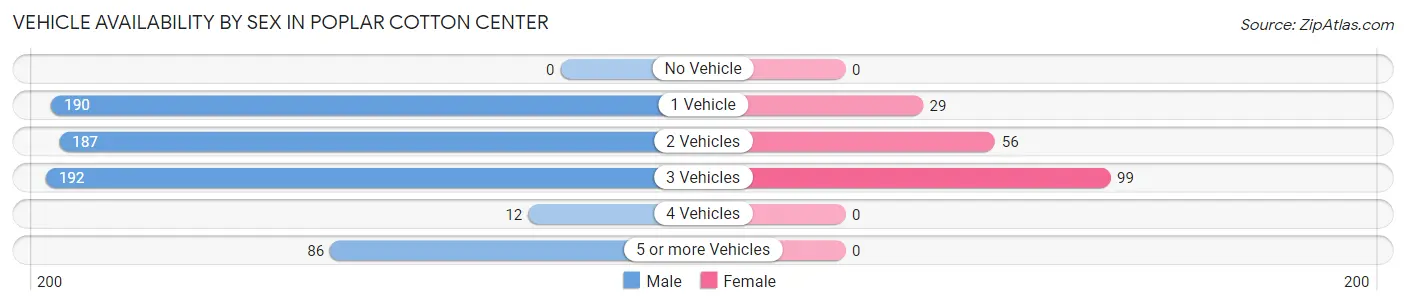
| Vehicles Available | Male | Female |
| No Vehicle | 0 (0.0%) | 0 (0.0%) |
| 1 Vehicle | 190 (28.5%) | 29 (15.8%) |
| 2 Vehicles | 187 (28.0%) | 56 (30.4%) |
| 3 Vehicles | 192 (28.8%) | 99 (53.8%) |
| 4 Vehicles | 12 (1.8%) | 0 (0.0%) |
| 5 or more Vehicles | 86 (12.9%) | 0 (0.0%) |
| Total | 667 (100.0%) | 184 (100.0%) |
Commute Time in Poplar Cotton Center
The most frequently occuring commute durations in Poplar Cotton Center are 5 to 9 minutes (134 commuters, 15.8%), 15 to 19 minutes (123 commuters, 14.4%), and 30 to 34 minutes (121 commuters, 14.2%).
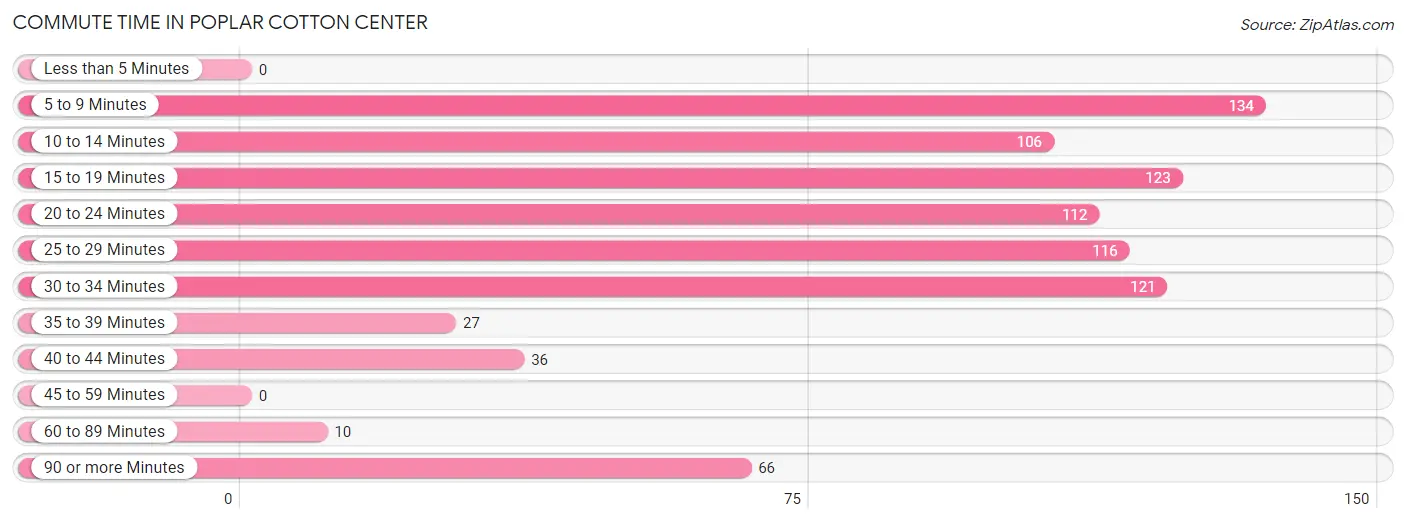
| Commute Time | # Commuters | % Commuters |
| Less than 5 Minutes | 0 | 0.0% |
| 5 to 9 Minutes | 134 | 15.8% |
| 10 to 14 Minutes | 106 | 12.5% |
| 15 to 19 Minutes | 123 | 14.4% |
| 20 to 24 Minutes | 112 | 13.2% |
| 25 to 29 Minutes | 116 | 13.6% |
| 30 to 34 Minutes | 121 | 14.2% |
| 35 to 39 Minutes | 27 | 3.2% |
| 40 to 44 Minutes | 36 | 4.2% |
| 45 to 59 Minutes | 0 | 0.0% |
| 60 to 89 Minutes | 10 | 1.2% |
| 90 or more Minutes | 66 | 7.8% |
Commute Time by Sex in Poplar Cotton Center
The most common commute times in Poplar Cotton Center are 15 to 19 minutes (108 commuters, 16.2%) for males and 20 to 24 minutes (58 commuters, 31.5%) for females.
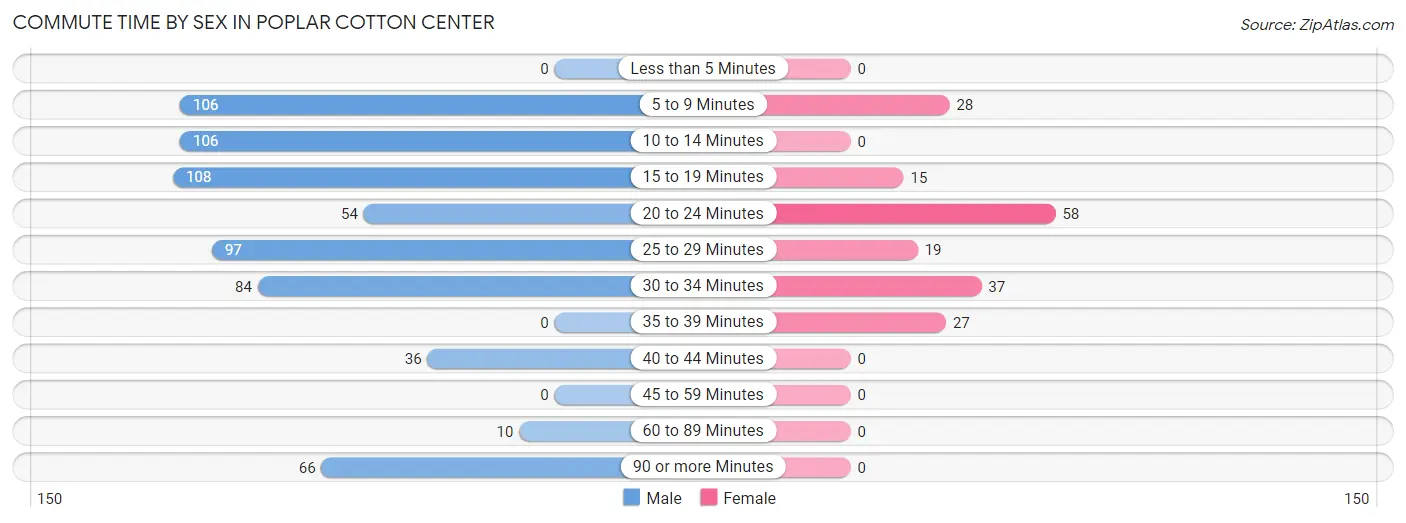
| Commute Time | Male | Female |
| Less than 5 Minutes | 0 (0.0%) | 0 (0.0%) |
| 5 to 9 Minutes | 106 (15.9%) | 28 (15.2%) |
| 10 to 14 Minutes | 106 (15.9%) | 0 (0.0%) |
| 15 to 19 Minutes | 108 (16.2%) | 15 (8.2%) |
| 20 to 24 Minutes | 54 (8.1%) | 58 (31.5%) |
| 25 to 29 Minutes | 97 (14.5%) | 19 (10.3%) |
| 30 to 34 Minutes | 84 (12.6%) | 37 (20.1%) |
| 35 to 39 Minutes | 0 (0.0%) | 27 (14.7%) |
| 40 to 44 Minutes | 36 (5.4%) | 0 (0.0%) |
| 45 to 59 Minutes | 0 (0.0%) | 0 (0.0%) |
| 60 to 89 Minutes | 10 (1.5%) | 0 (0.0%) |
| 90 or more Minutes | 66 (9.9%) | 0 (0.0%) |
Time of Departure to Work by Sex in Poplar Cotton Center
The most frequent times of departure to work in Poplar Cotton Center are 7:00 AM to 7:29 AM (137, 20.5%) for males and 7:30 AM to 7:59 AM (70, 38.0%) for females.
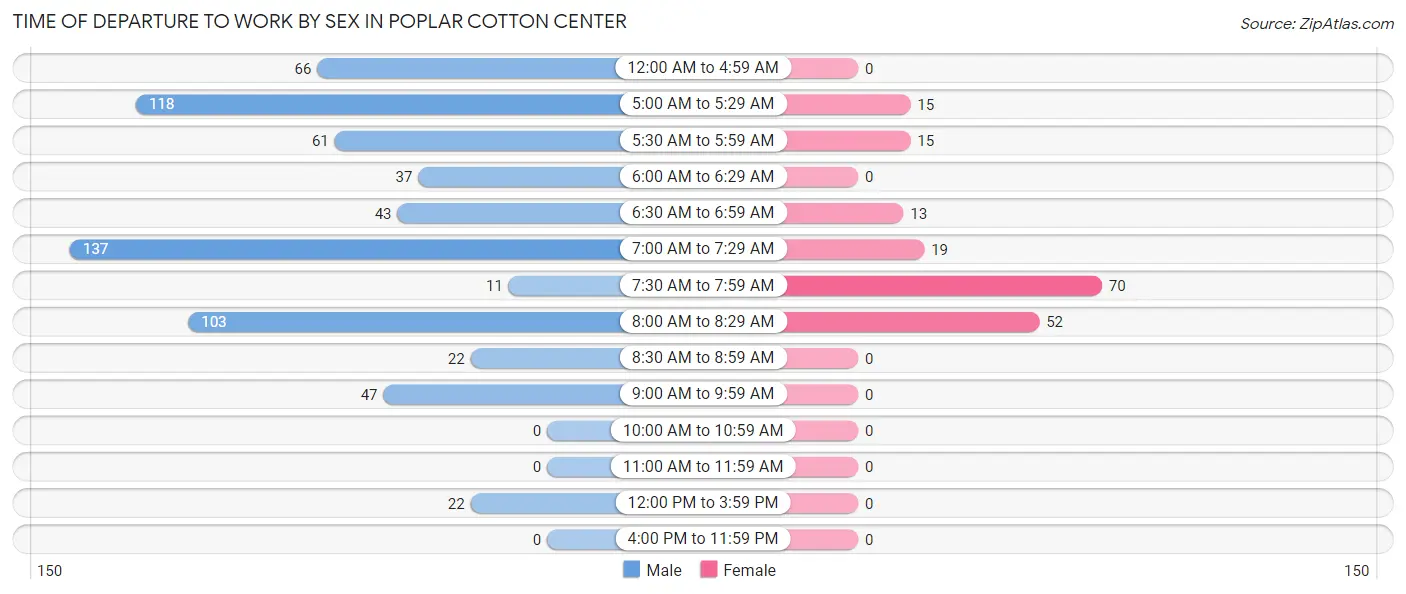
| Time of Departure | Male | Female |
| 12:00 AM to 4:59 AM | 66 (9.9%) | 0 (0.0%) |
| 5:00 AM to 5:29 AM | 118 (17.7%) | 15 (8.2%) |
| 5:30 AM to 5:59 AM | 61 (9.1%) | 15 (8.2%) |
| 6:00 AM to 6:29 AM | 37 (5.6%) | 0 (0.0%) |
| 6:30 AM to 6:59 AM | 43 (6.5%) | 13 (7.1%) |
| 7:00 AM to 7:29 AM | 137 (20.5%) | 19 (10.3%) |
| 7:30 AM to 7:59 AM | 11 (1.7%) | 70 (38.0%) |
| 8:00 AM to 8:29 AM | 103 (15.4%) | 52 (28.3%) |
| 8:30 AM to 8:59 AM | 22 (3.3%) | 0 (0.0%) |
| 9:00 AM to 9:59 AM | 47 (7.0%) | 0 (0.0%) |
| 10:00 AM to 10:59 AM | 0 (0.0%) | 0 (0.0%) |
| 11:00 AM to 11:59 AM | 0 (0.0%) | 0 (0.0%) |
| 12:00 PM to 3:59 PM | 22 (3.3%) | 0 (0.0%) |
| 4:00 PM to 11:59 PM | 0 (0.0%) | 0 (0.0%) |
| Total | 667 (100.0%) | 184 (100.0%) |
Housing Occupancy in Poplar Cotton Center
Occupancy by Ownership in Poplar Cotton Center
Of the total 587 dwellings in Poplar Cotton Center, owner-occupied units account for 201 (34.2%), while renter-occupied units make up 386 (65.8%).
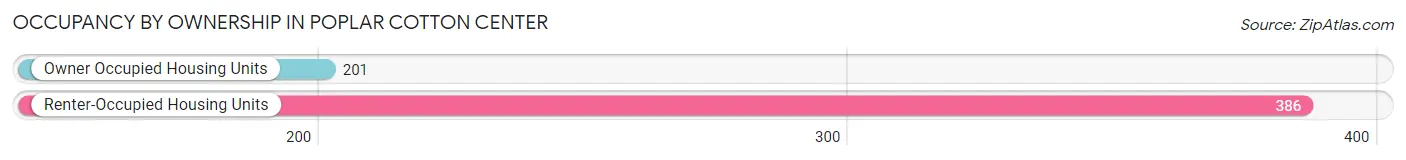
| Occupancy | # Housing Units | % Housing Units |
| Owner Occupied Housing Units | 201 | 34.2% |
| Renter-Occupied Housing Units | 386 | 65.8% |
| Total Occupied Housing Units | 587 | 100.0% |
Occupancy by Household Size in Poplar Cotton Center
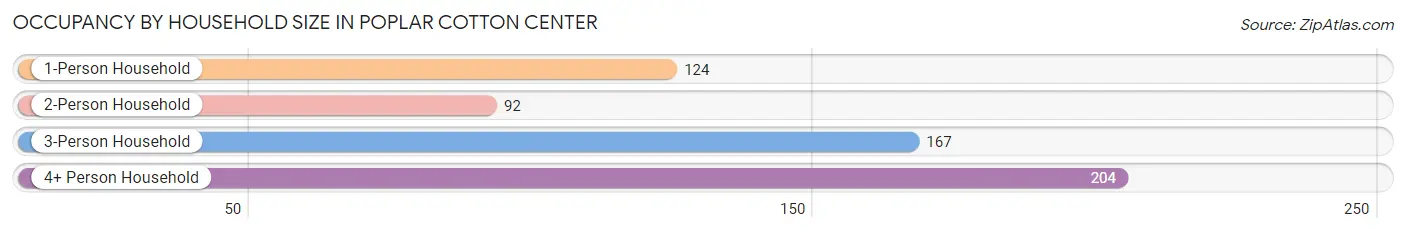
| Household Size | # Housing Units | % Housing Units |
| 1-Person Household | 124 | 21.1% |
| 2-Person Household | 92 | 15.7% |
| 3-Person Household | 167 | 28.4% |
| 4+ Person Household | 204 | 34.7% |
| Total Housing Units | 587 | 100.0% |
Occupancy by Ownership by Household Size in Poplar Cotton Center
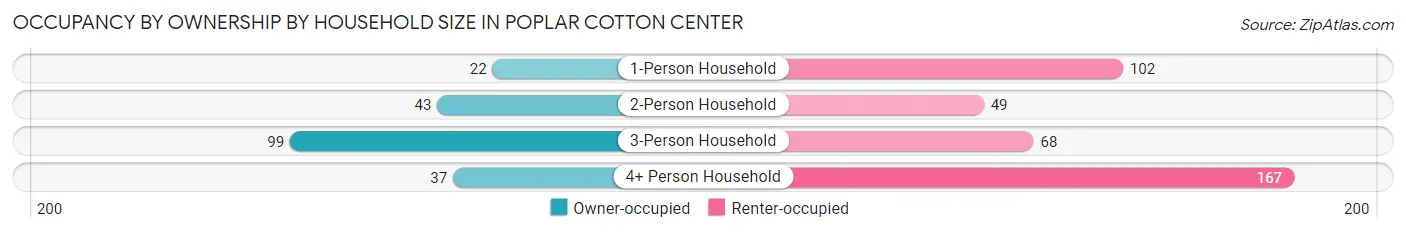
| Household Size | Owner-occupied | Renter-occupied |
| 1-Person Household | 22 (17.7%) | 102 (82.3%) |
| 2-Person Household | 43 (46.7%) | 49 (53.3%) |
| 3-Person Household | 99 (59.3%) | 68 (40.7%) |
| 4+ Person Household | 37 (18.1%) | 167 (81.9%) |
| Total Housing Units | 201 (34.2%) | 386 (65.8%) |
Occupancy by Educational Attainment in Poplar Cotton Center
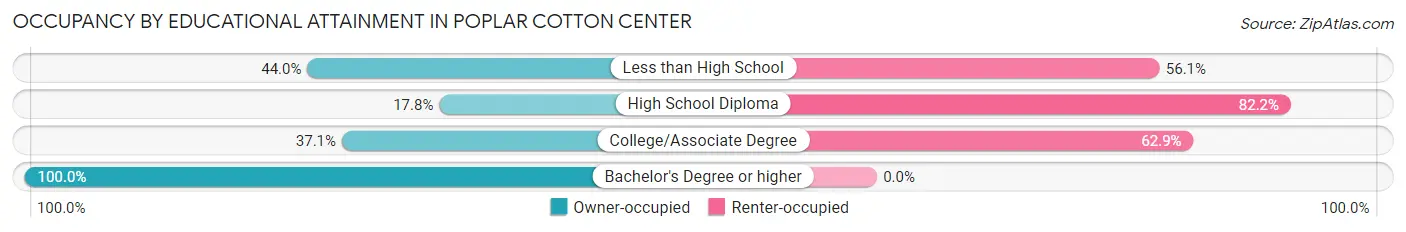
| Household Size | Owner-occupied | Renter-occupied |
| Less than High School | 138 (44.0%) | 176 (56.0%) |
| High School Diploma | 37 (17.8%) | 171 (82.2%) |
| College/Associate Degree | 23 (37.1%) | 39 (62.9%) |
| Bachelor's Degree or higher | 3 (100.0%) | 0 (0.0%) |
Occupancy by Age of Householder in Poplar Cotton Center
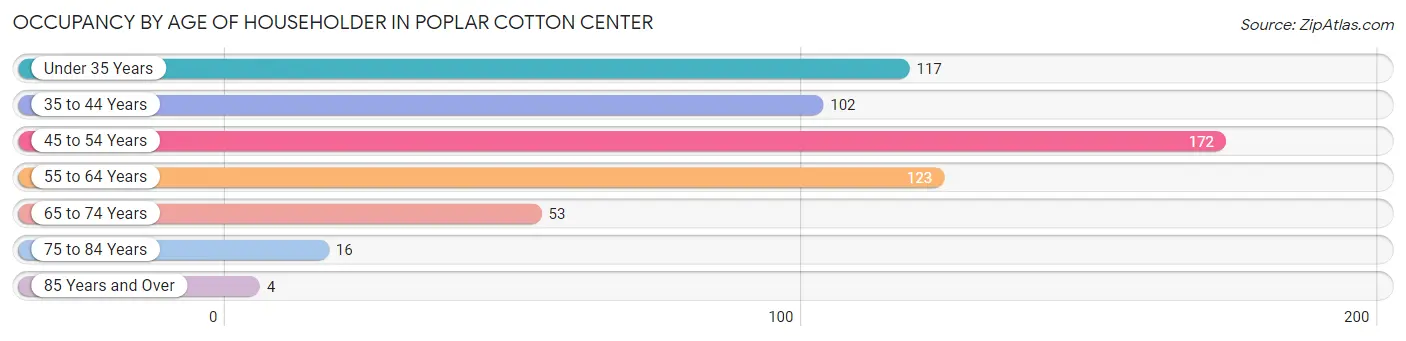
| Age Bracket | # Households | % Households |
| Under 35 Years | 117 | 19.9% |
| 35 to 44 Years | 102 | 17.4% |
| 45 to 54 Years | 172 | 29.3% |
| 55 to 64 Years | 123 | 20.9% |
| 65 to 74 Years | 53 | 9.0% |
| 75 to 84 Years | 16 | 2.7% |
| 85 Years and Over | 4 | 0.7% |
| Total | 587 | 100.0% |
Housing Finances in Poplar Cotton Center
Median Income by Occupancy in Poplar Cotton Center
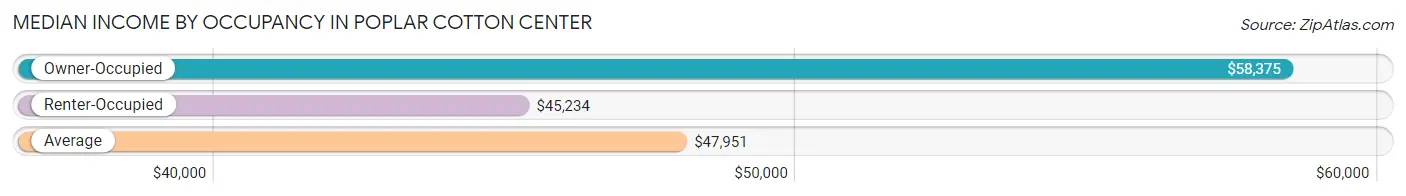
| Occupancy Type | # Households | Median Income |
| Owner-Occupied | 201 (34.2%) | $58,375 |
| Renter-Occupied | 386 (65.8%) | $45,234 |
| Average | 587 (100.0%) | $47,951 |
Occupancy by Householder Income Bracket in Poplar Cotton Center
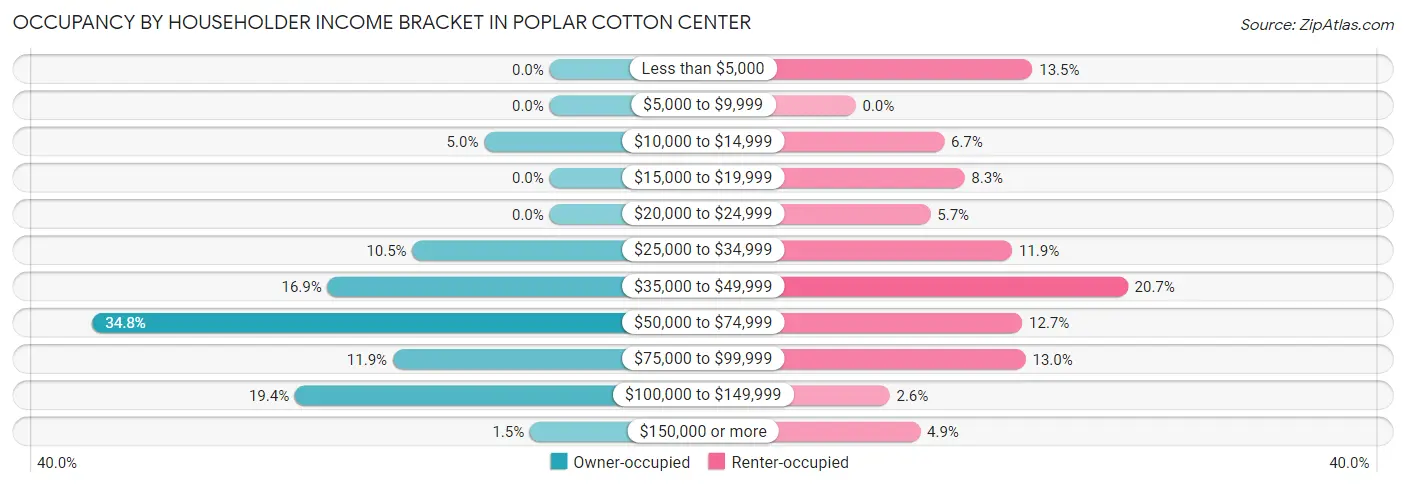
| Income Bracket | Owner-occupied | Renter-occupied |
| Less than $5,000 | 0 (0.0%) | 52 (13.5%) |
| $5,000 to $9,999 | 0 (0.0%) | 0 (0.0%) |
| $10,000 to $14,999 | 10 (5.0%) | 26 (6.7%) |
| $15,000 to $19,999 | 0 (0.0%) | 32 (8.3%) |
| $20,000 to $24,999 | 0 (0.0%) | 22 (5.7%) |
| $25,000 to $34,999 | 21 (10.4%) | 46 (11.9%) |
| $35,000 to $49,999 | 34 (16.9%) | 80 (20.7%) |
| $50,000 to $74,999 | 70 (34.8%) | 49 (12.7%) |
| $75,000 to $99,999 | 24 (11.9%) | 50 (13.0%) |
| $100,000 to $149,999 | 39 (19.4%) | 10 (2.6%) |
| $150,000 or more | 3 (1.5%) | 19 (4.9%) |
| Total | 201 (100.0%) | 386 (100.0%) |
Monthly Housing Cost Tiers in Poplar Cotton Center
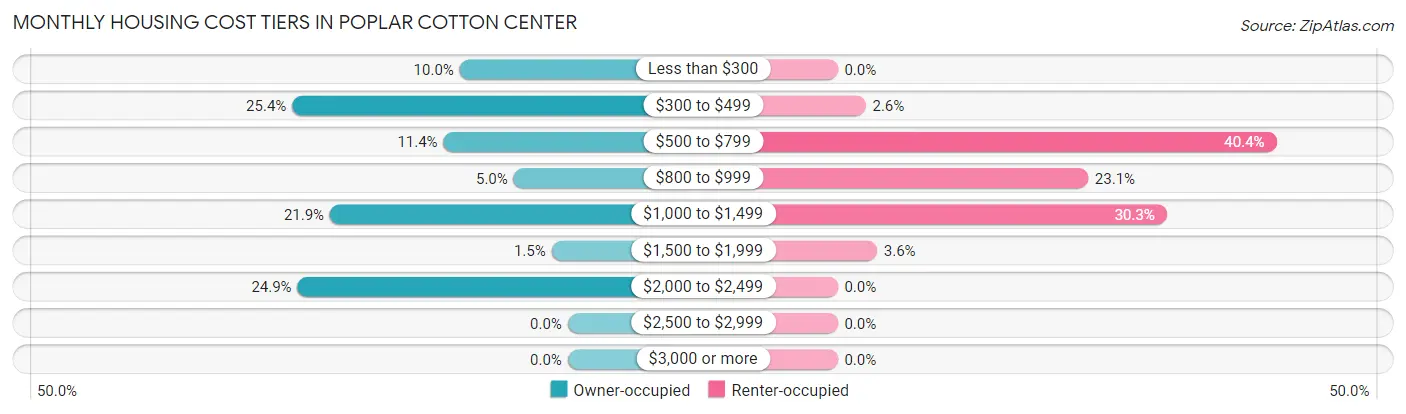
| Monthly Cost | Owner-occupied | Renter-occupied |
| Less than $300 | 20 (10.0%) | 0 (0.0%) |
| $300 to $499 | 51 (25.4%) | 10 (2.6%) |
| $500 to $799 | 23 (11.4%) | 156 (40.4%) |
| $800 to $999 | 10 (5.0%) | 89 (23.1%) |
| $1,000 to $1,499 | 44 (21.9%) | 117 (30.3%) |
| $1,500 to $1,999 | 3 (1.5%) | 14 (3.6%) |
| $2,000 to $2,499 | 50 (24.9%) | 0 (0.0%) |
| $2,500 to $2,999 | 0 (0.0%) | 0 (0.0%) |
| $3,000 or more | 0 (0.0%) | 0 (0.0%) |
| Total | 201 (100.0%) | 386 (100.0%) |
Physical Housing Characteristics in Poplar Cotton Center
Housing Structures in Poplar Cotton Center
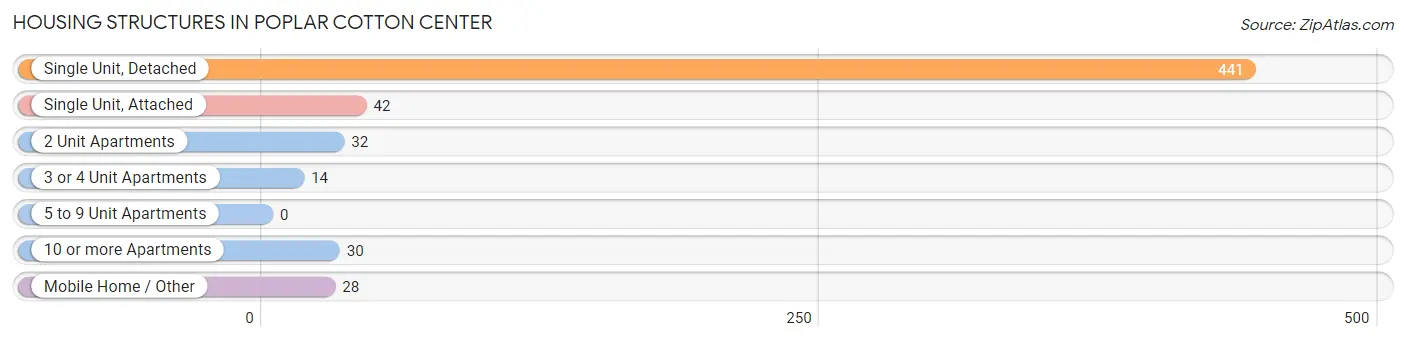
| Structure Type | # Housing Units | % Housing Units |
| Single Unit, Detached | 441 | 75.1% |
| Single Unit, Attached | 42 | 7.2% |
| 2 Unit Apartments | 32 | 5.4% |
| 3 or 4 Unit Apartments | 14 | 2.4% |
| 5 to 9 Unit Apartments | 0 | 0.0% |
| 10 or more Apartments | 30 | 5.1% |
| Mobile Home / Other | 28 | 4.8% |
| Total | 587 | 100.0% |
Housing Structures by Occupancy in Poplar Cotton Center
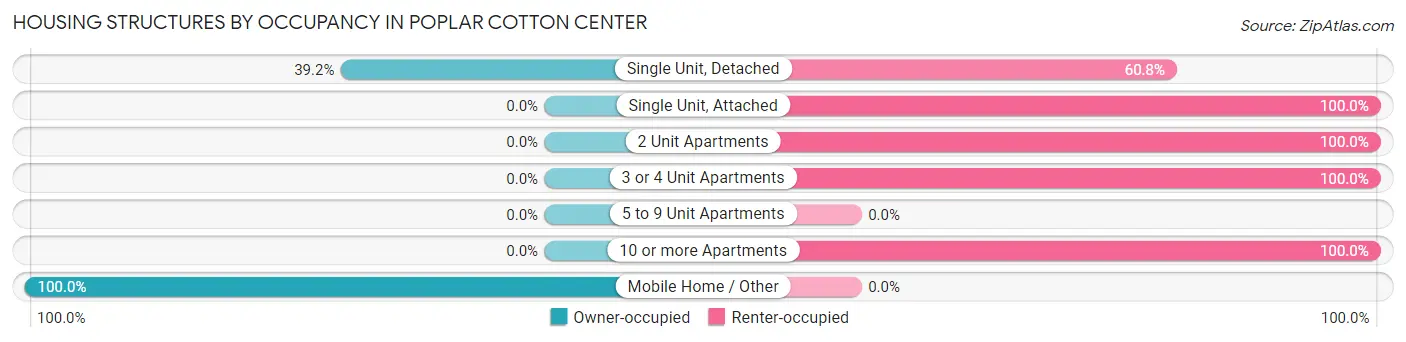
| Structure Type | Owner-occupied | Renter-occupied |
| Single Unit, Detached | 173 (39.2%) | 268 (60.8%) |
| Single Unit, Attached | 0 (0.0%) | 42 (100.0%) |
| 2 Unit Apartments | 0 (0.0%) | 32 (100.0%) |
| 3 or 4 Unit Apartments | 0 (0.0%) | 14 (100.0%) |
| 5 to 9 Unit Apartments | 0 (0.0%) | 0 (0.0%) |
| 10 or more Apartments | 0 (0.0%) | 30 (100.0%) |
| Mobile Home / Other | 28 (100.0%) | 0 (0.0%) |
| Total | 201 (34.2%) | 386 (65.8%) |
Housing Structures by Number of Rooms in Poplar Cotton Center
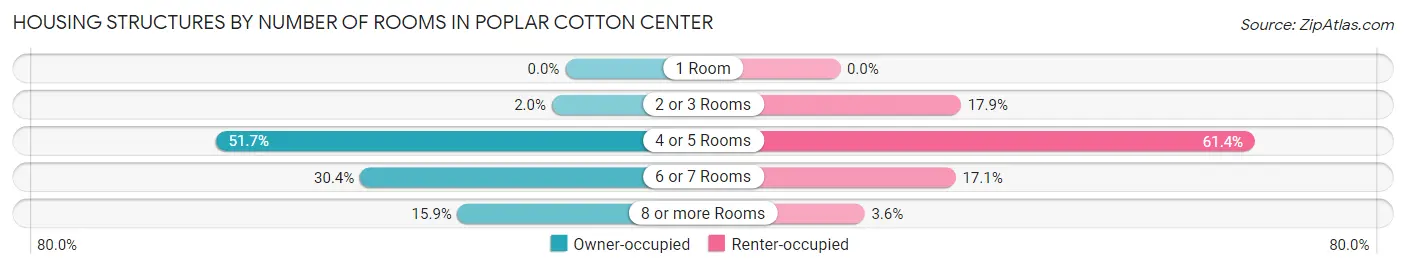
| Number of Rooms | Owner-occupied | Renter-occupied |
| 1 Room | 0 (0.0%) | 0 (0.0%) |
| 2 or 3 Rooms | 4 (2.0%) | 69 (17.9%) |
| 4 or 5 Rooms | 104 (51.7%) | 237 (61.4%) |
| 6 or 7 Rooms | 61 (30.3%) | 66 (17.1%) |
| 8 or more Rooms | 32 (15.9%) | 14 (3.6%) |
| Total | 201 (100.0%) | 386 (100.0%) |
Housing Structure by Heating Type in Poplar Cotton Center
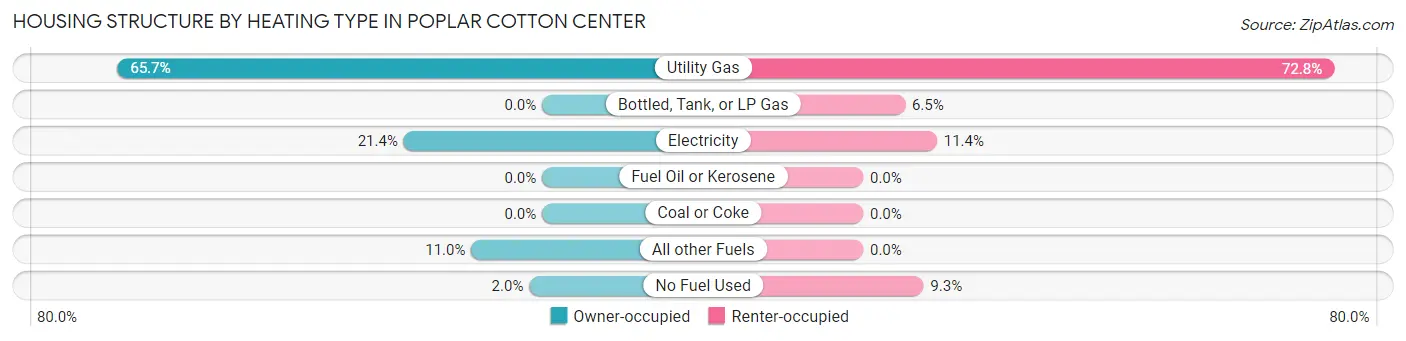
| Heating Type | Owner-occupied | Renter-occupied |
| Utility Gas | 132 (65.7%) | 281 (72.8%) |
| Bottled, Tank, or LP Gas | 0 (0.0%) | 25 (6.5%) |
| Electricity | 43 (21.4%) | 44 (11.4%) |
| Fuel Oil or Kerosene | 0 (0.0%) | 0 (0.0%) |
| Coal or Coke | 0 (0.0%) | 0 (0.0%) |
| All other Fuels | 22 (11.0%) | 0 (0.0%) |
| No Fuel Used | 4 (2.0%) | 36 (9.3%) |
| Total | 201 (100.0%) | 386 (100.0%) |
Household Vehicle Usage in Poplar Cotton Center
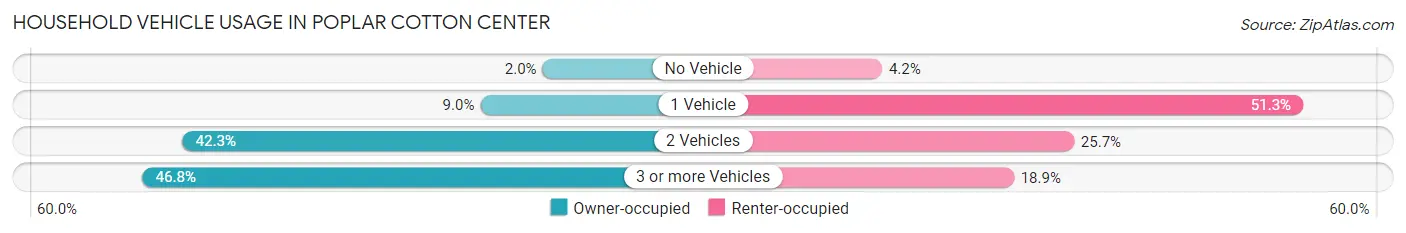
| Vehicles per Household | Owner-occupied | Renter-occupied |
| No Vehicle | 4 (2.0%) | 16 (4.2%) |
| 1 Vehicle | 18 (9.0%) | 198 (51.3%) |
| 2 Vehicles | 85 (42.3%) | 99 (25.7%) |
| 3 or more Vehicles | 94 (46.8%) | 73 (18.9%) |
| Total | 201 (100.0%) | 386 (100.0%) |
Real Estate & Mortgages in Poplar Cotton Center
Real Estate and Mortgage Overview in Poplar Cotton Center
| Characteristic | Without Mortgage | With Mortgage |
| Housing Units | 87 | 114 |
| Median Property Value | $199,300 | $203,900 |
| Median Household Income | $50,938 | $0 |
| Monthly Housing Costs | $372 | $0 |
| Real Estate Taxes | $914 | $22 |
Property Value by Mortgage Status in Poplar Cotton Center
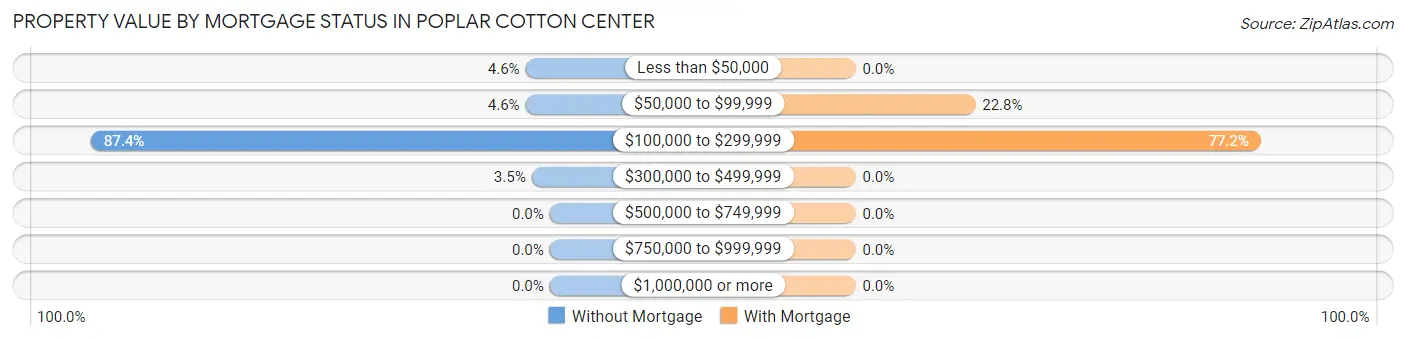
| Property Value | Without Mortgage | With Mortgage |
| Less than $50,000 | 4 (4.6%) | 0 (0.0%) |
| $50,000 to $99,999 | 4 (4.6%) | 26 (22.8%) |
| $100,000 to $299,999 | 76 (87.4%) | 88 (77.2%) |
| $300,000 to $499,999 | 3 (3.5%) | 0 (0.0%) |
| $500,000 to $749,999 | 0 (0.0%) | 0 (0.0%) |
| $750,000 to $999,999 | 0 (0.0%) | 0 (0.0%) |
| $1,000,000 or more | 0 (0.0%) | 0 (0.0%) |
| Total | 87 (100.0%) | 114 (100.0%) |
Household Income by Mortgage Status in Poplar Cotton Center
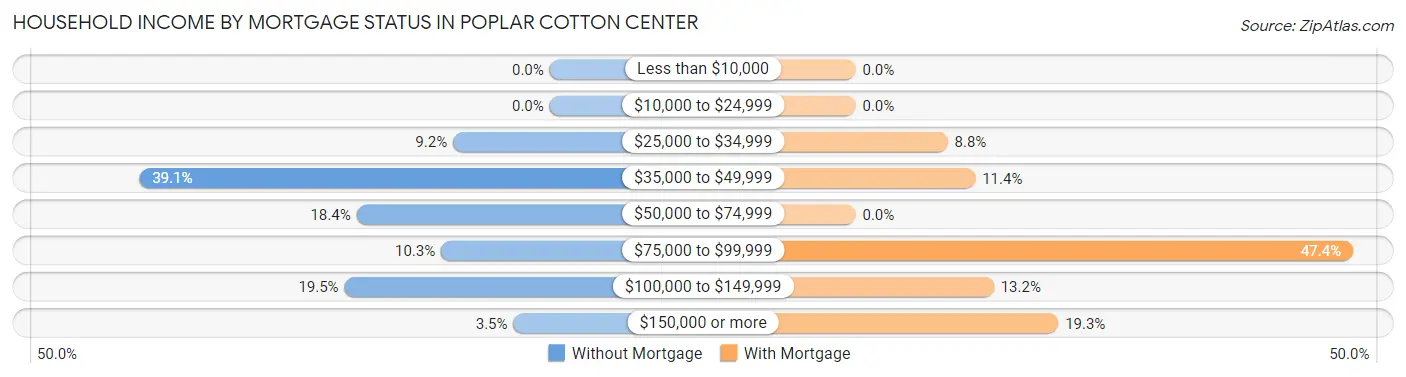
| Household Income | Without Mortgage | With Mortgage |
| Less than $10,000 | 0 (0.0%) | 0 (0.0%) |
| $10,000 to $24,999 | 0 (0.0%) | 0 (0.0%) |
| $25,000 to $34,999 | 8 (9.2%) | 10 (8.8%) |
| $35,000 to $49,999 | 34 (39.1%) | 13 (11.4%) |
| $50,000 to $74,999 | 16 (18.4%) | 0 (0.0%) |
| $75,000 to $99,999 | 9 (10.3%) | 54 (47.4%) |
| $100,000 to $149,999 | 17 (19.5%) | 15 (13.2%) |
| $150,000 or more | 3 (3.5%) | 22 (19.3%) |
| Total | 87 (100.0%) | 114 (100.0%) |
Property Value to Household Income Ratio in Poplar Cotton Center
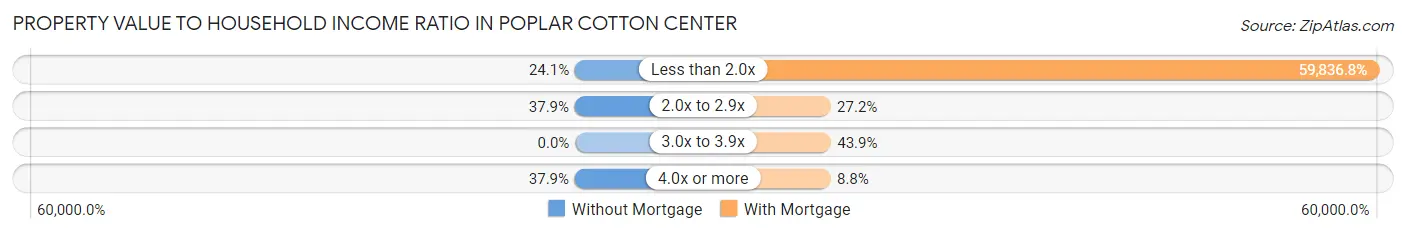
| Value-to-Income Ratio | Without Mortgage | With Mortgage |
| Less than 2.0x | 21 (24.1%) | 68,214 (59,836.8%) |
| 2.0x to 2.9x | 33 (37.9%) | 31 (27.2%) |
| 3.0x to 3.9x | 0 (0.0%) | 50 (43.9%) |
| 4.0x or more | 33 (37.9%) | 10 (8.8%) |
| Total | 87 (100.0%) | 114 (100.0%) |
Real Estate Taxes by Mortgage Status in Poplar Cotton Center
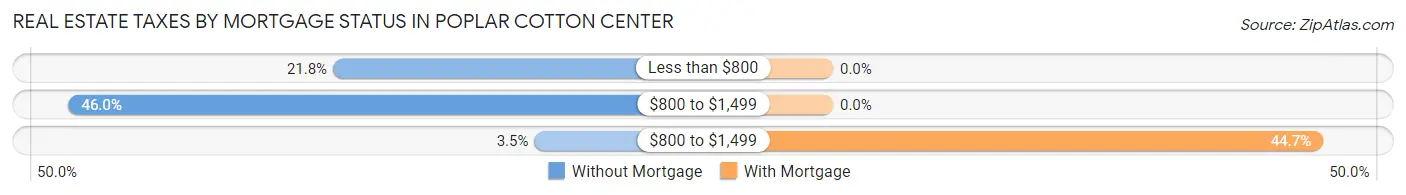
| Property Taxes | Without Mortgage | With Mortgage |
| Less than $800 | 19 (21.8%) | 0 (0.0%) |
| $800 to $1,499 | 40 (46.0%) | 0 (0.0%) |
| $800 to $1,499 | 3 (3.5%) | 51 (44.7%) |
| Total | 87 (100.0%) | 114 (100.0%) |
Health & Disability in Poplar Cotton Center
Health Insurance Coverage by Age in Poplar Cotton Center
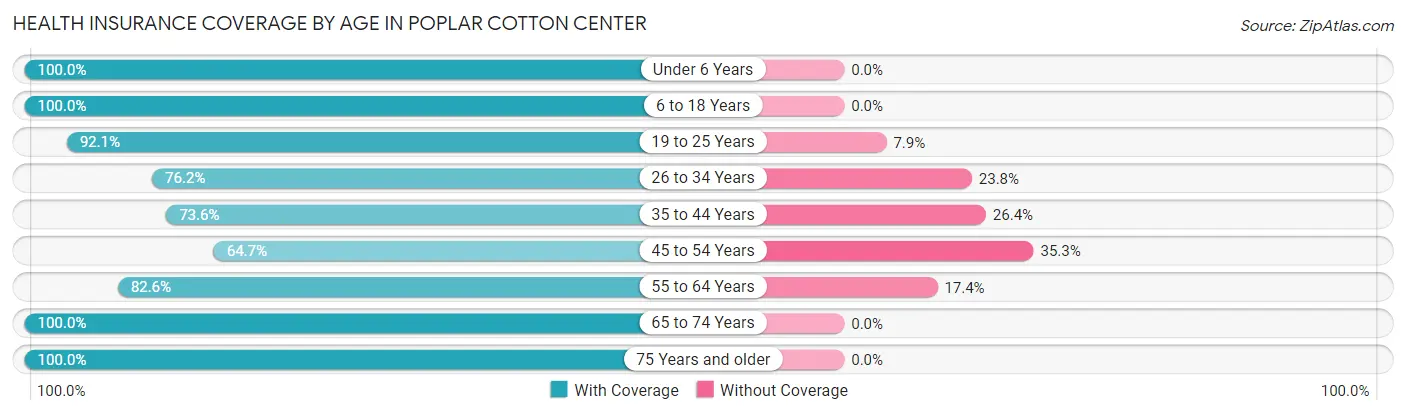
| Age Bracket | With Coverage | Without Coverage |
| Under 6 Years | 156 (100.0%) | 0 (0.0%) |
| 6 to 18 Years | 292 (100.0%) | 0 (0.0%) |
| 19 to 25 Years | 211 (92.1%) | 18 (7.9%) |
| 26 to 34 Years | 346 (76.2%) | 108 (23.8%) |
| 35 to 44 Years | 170 (73.6%) | 61 (26.4%) |
| 45 to 54 Years | 154 (64.7%) | 84 (35.3%) |
| 55 to 64 Years | 138 (82.6%) | 29 (17.4%) |
| 65 to 74 Years | 59 (100.0%) | 0 (0.0%) |
| 75 Years and older | 92 (100.0%) | 0 (0.0%) |
| Total | 1,618 (84.4%) | 300 (15.6%) |
Health Insurance Coverage by Citizenship Status in Poplar Cotton Center
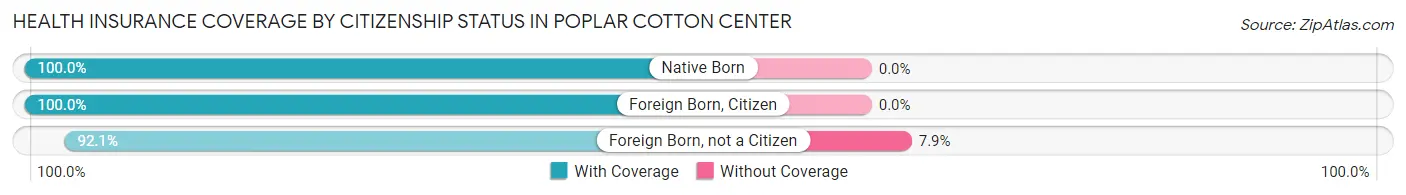
| Citizenship Status | With Coverage | Without Coverage |
| Native Born | 156 (100.0%) | 0 (0.0%) |
| Foreign Born, Citizen | 292 (100.0%) | 0 (0.0%) |
| Foreign Born, not a Citizen | 211 (92.1%) | 18 (7.9%) |
Health Insurance Coverage by Household Income in Poplar Cotton Center
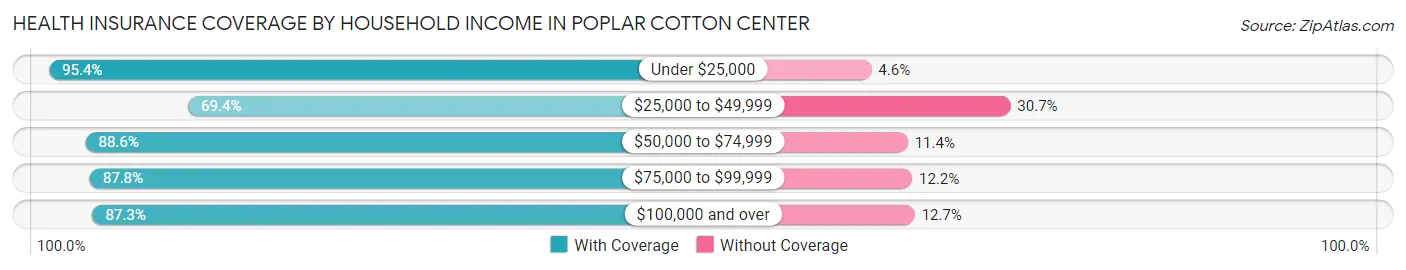
| Household Income | With Coverage | Without Coverage |
| Under $25,000 | 331 (95.4%) | 16 (4.6%) |
| $25,000 to $49,999 | 353 (69.4%) | 156 (30.6%) |
| $50,000 to $74,999 | 349 (88.6%) | 45 (11.4%) |
| $75,000 to $99,999 | 280 (87.8%) | 39 (12.2%) |
| $100,000 and over | 302 (87.3%) | 44 (12.7%) |
Public vs Private Health Insurance Coverage by Age in Poplar Cotton Center
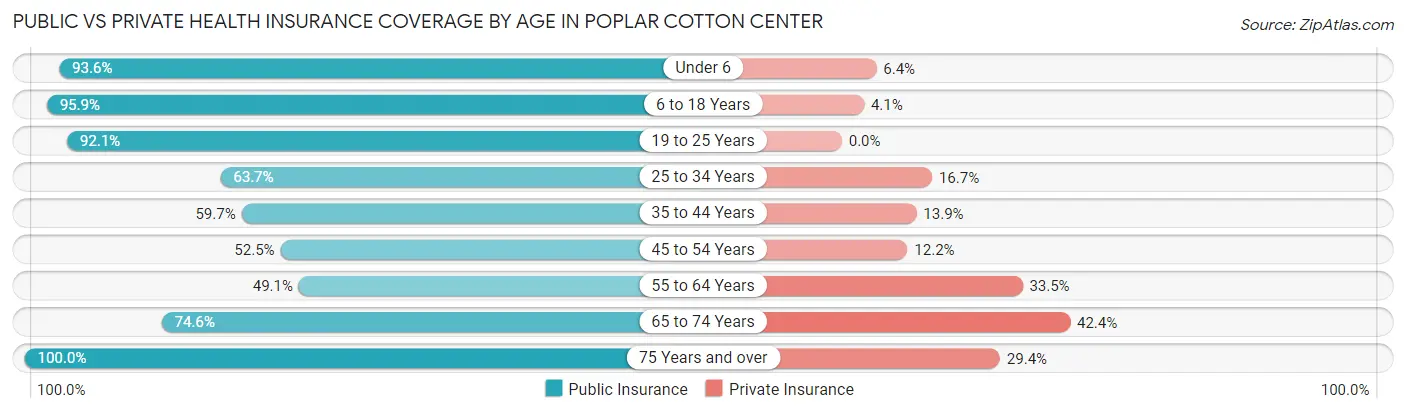
| Age Bracket | Public Insurance | Private Insurance |
| Under 6 | 146 (93.6%) | 10 (6.4%) |
| 6 to 18 Years | 280 (95.9%) | 12 (4.1%) |
| 19 to 25 Years | 211 (92.1%) | 0 (0.0%) |
| 25 to 34 Years | 289 (63.7%) | 76 (16.7%) |
| 35 to 44 Years | 138 (59.7%) | 32 (13.9%) |
| 45 to 54 Years | 125 (52.5%) | 29 (12.2%) |
| 55 to 64 Years | 82 (49.1%) | 56 (33.5%) |
| 65 to 74 Years | 44 (74.6%) | 25 (42.4%) |
| 75 Years and over | 92 (100.0%) | 27 (29.3%) |
| Total | 1,407 (73.4%) | 267 (13.9%) |
Disability Status by Sex by Age in Poplar Cotton Center
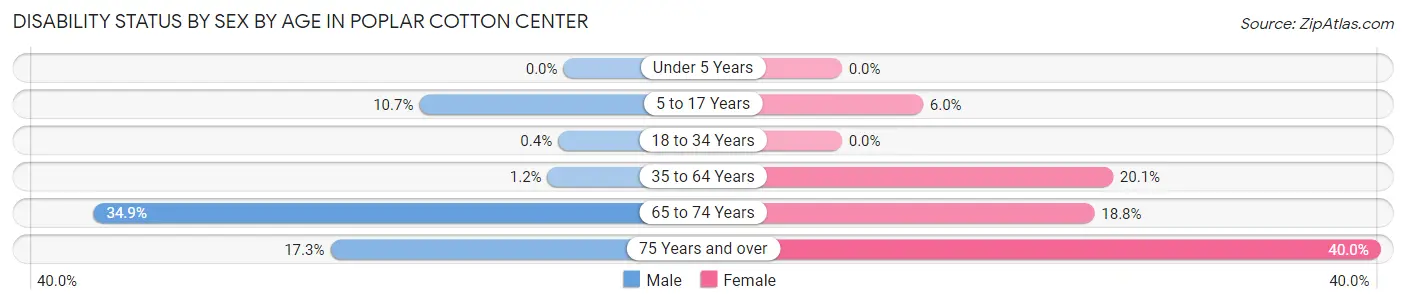
| Age Bracket | Male | Female |
| Under 5 Years | 0 (0.0%) | 0 (0.0%) |
| 5 to 17 Years | 20 (10.7%) | 5 (6.0%) |
| 18 to 34 Years | 2 (0.4%) | 0 (0.0%) |
| 35 to 64 Years | 4 (1.2%) | 60 (20.1%) |
| 65 to 74 Years | 15 (34.9%) | 3 (18.8%) |
| 75 Years and over | 9 (17.3%) | 16 (40.0%) |
Disability Class by Sex by Age in Poplar Cotton Center
Disability Class: Hearing Difficulty
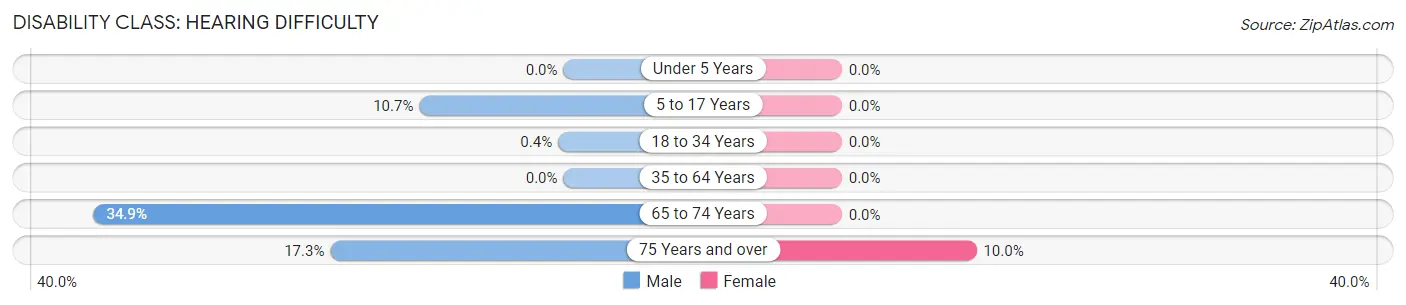
| Age Bracket | Male | Female |
| Under 5 Years | 0 (0.0%) | 0 (0.0%) |
| 5 to 17 Years | 20 (10.7%) | 0 (0.0%) |
| 18 to 34 Years | 2 (0.4%) | 0 (0.0%) |
| 35 to 64 Years | 0 (0.0%) | 0 (0.0%) |
| 65 to 74 Years | 15 (34.9%) | 0 (0.0%) |
| 75 Years and over | 9 (17.3%) | 4 (10.0%) |
Disability Class: Vision Difficulty
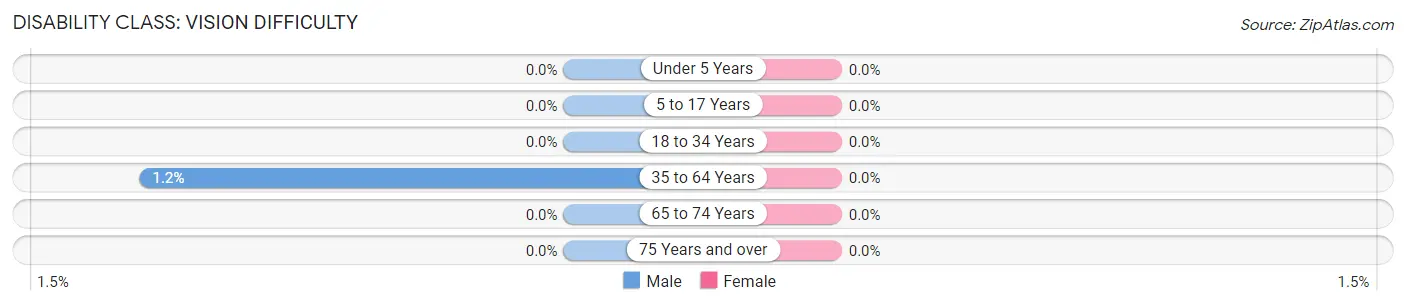
| Age Bracket | Male | Female |
| Under 5 Years | 0 (0.0%) | 0 (0.0%) |
| 5 to 17 Years | 0 (0.0%) | 0 (0.0%) |
| 18 to 34 Years | 0 (0.0%) | 0 (0.0%) |
| 35 to 64 Years | 4 (1.2%) | 0 (0.0%) |
| 65 to 74 Years | 0 (0.0%) | 0 (0.0%) |
| 75 Years and over | 0 (0.0%) | 0 (0.0%) |
Disability Class: Cognitive Difficulty
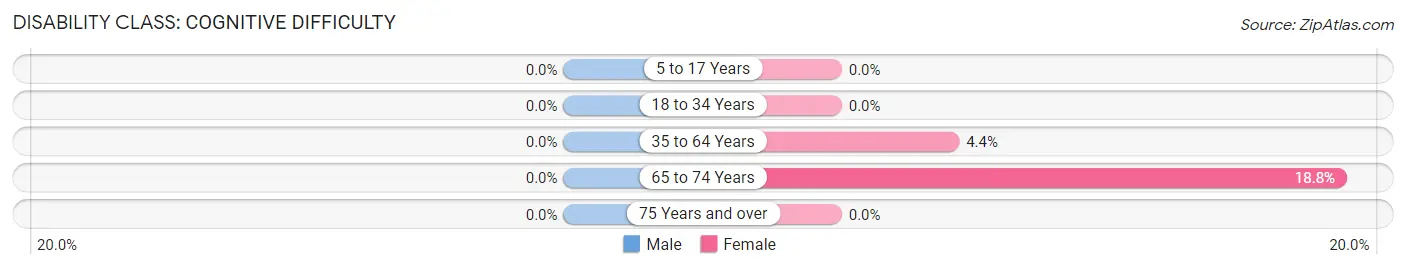
| Age Bracket | Male | Female |
| 5 to 17 Years | 0 (0.0%) | 0 (0.0%) |
| 18 to 34 Years | 0 (0.0%) | 0 (0.0%) |
| 35 to 64 Years | 0 (0.0%) | 13 (4.4%) |
| 65 to 74 Years | 0 (0.0%) | 3 (18.8%) |
| 75 Years and over | 0 (0.0%) | 0 (0.0%) |
Disability Class: Ambulatory Difficulty
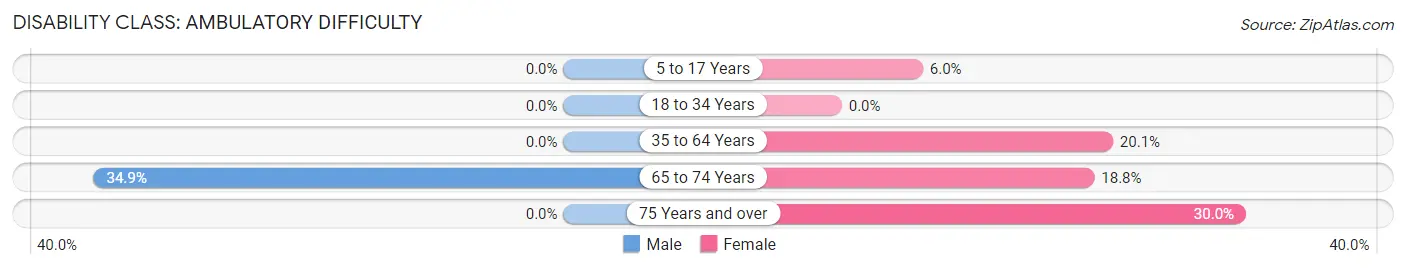
| Age Bracket | Male | Female |
| 5 to 17 Years | 0 (0.0%) | 5 (6.0%) |
| 18 to 34 Years | 0 (0.0%) | 0 (0.0%) |
| 35 to 64 Years | 0 (0.0%) | 60 (20.1%) |
| 65 to 74 Years | 15 (34.9%) | 3 (18.8%) |
| 75 Years and over | 0 (0.0%) | 12 (30.0%) |
Disability Class: Self-Care Difficulty
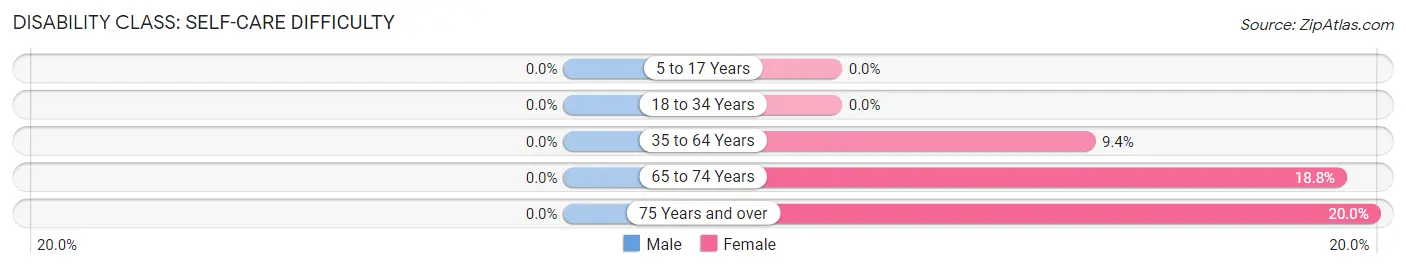
| Age Bracket | Male | Female |
| 5 to 17 Years | 0 (0.0%) | 0 (0.0%) |
| 18 to 34 Years | 0 (0.0%) | 0 (0.0%) |
| 35 to 64 Years | 0 (0.0%) | 28 (9.4%) |
| 65 to 74 Years | 0 (0.0%) | 3 (18.8%) |
| 75 Years and over | 0 (0.0%) | 8 (20.0%) |
Technology Access in Poplar Cotton Center
Computing Device Access in Poplar Cotton Center
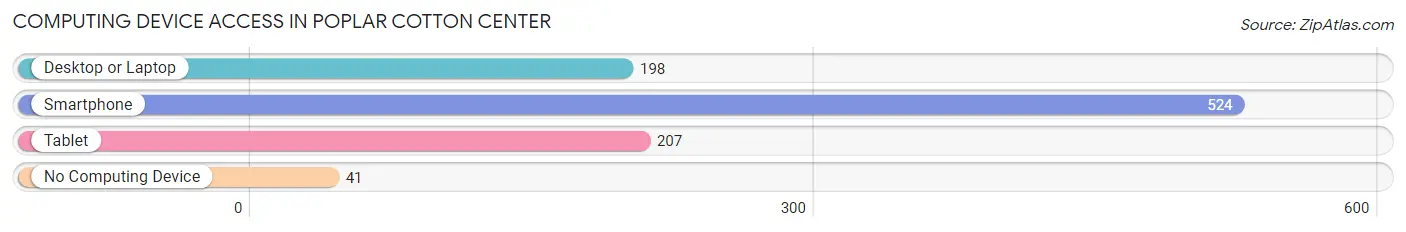
| Device Type | # Households | % Households |
| Desktop or Laptop | 198 | 33.7% |
| Smartphone | 524 | 89.3% |
| Tablet | 207 | 35.3% |
| No Computing Device | 41 | 7.0% |
| Total | 587 | 100.0% |
Internet Access in Poplar Cotton Center
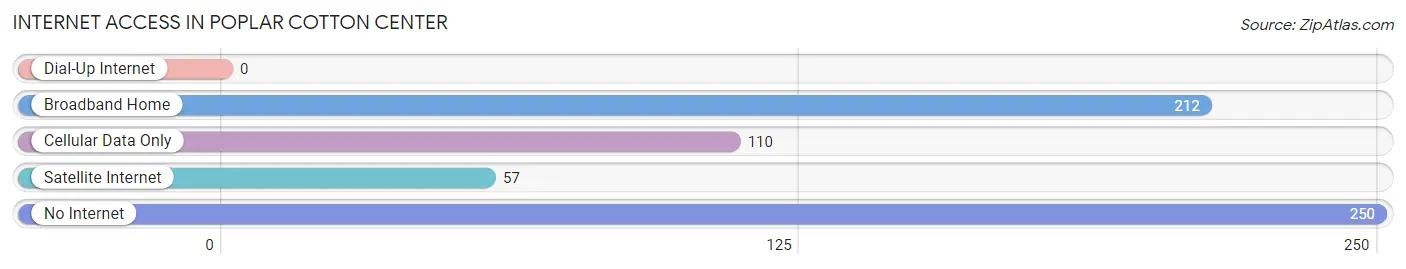
| Internet Type | # Households | % Households |
| Dial-Up Internet | 0 | 0.0% |
| Broadband Home | 212 | 36.1% |
| Cellular Data Only | 110 | 18.7% |
| Satellite Internet | 57 | 9.7% |
| No Internet | 250 | 42.6% |
| Total | 587 | 100.0% |
Poplar Cotton Center Summary
Poplar Cotton Center, California is a small unincorporated community located in the San Joaquin Valley of California. It is situated in the western part of Fresno County, approximately 20 miles south of Fresno. The population of Poplar Cotton Center was estimated to be around 1,000 people in 2020.
History
Poplar Cotton Center was founded in the late 1800s by a group of settlers from the Midwest. The settlers were looking for a place to grow cotton and other crops, and the area around Poplar Cotton Center was ideal for this purpose. The settlers named the town after the cotton crop that they were growing.
The town grew slowly over the years, and by the early 1900s, it had become a thriving agricultural community. The town was home to several cotton gins, a general store, a post office, and a few other businesses.
In the 1950s, the town began to decline as the cotton industry moved away from the area. The population of Poplar Cotton Center decreased significantly, and by the 1970s, the town was nearly abandoned.
In the late 1990s, the town began to experience a resurgence as people began to move back to the area. The population of Poplar Cotton Center has been steadily increasing since then, and the town is now home to a variety of businesses and services.
Geography
Poplar Cotton Center is located in the western part of Fresno County, approximately 20 miles south of Fresno. The town is situated in the San Joaquin Valley, which is a large agricultural region in California. The town is surrounded by farmland and is located near the Kings River.
The climate in Poplar Cotton Center is hot and dry in the summer, and mild and wet in the winter. The average temperature in the summer is around 90 degrees Fahrenheit, and the average temperature in the winter is around 50 degrees Fahrenheit.
Economy
The economy of Poplar Cotton Center is largely based on agriculture. The town is surrounded by farmland, and many of the residents are employed in the agricultural industry. The town is also home to a variety of businesses, including a general store, a post office, and a few other small businesses.
Demographics
The population of Poplar Cotton Center was estimated to be around 1,000 people in 2020. The town is predominantly white, with a small Hispanic population. The median household income in Poplar Cotton Center is around $50,000, and the median home value is around $200,000.
Conclusion
Poplar Cotton Center is a small unincorporated community located in the San Joaquin Valley of California. The town was founded in the late 1800s by a group of settlers from the Midwest, and it has since become a thriving agricultural community. The population of Poplar Cotton Center was estimated to be around 1,000 people in 2020, and the town is predominantly white, with a small Hispanic population. The economy of Poplar Cotton Center is largely based on agriculture, and the town is home to a variety of businesses and services.
Common Questions
What is the Total Population of Poplar Cotton Center?
Total Population of Poplar Cotton Center is 1,918.
What is the Total Male Population of Poplar Cotton Center?
Total Male Population of Poplar Cotton Center is 1,192.
What is the Total Female Population of Poplar Cotton Center?
Total Female Population of Poplar Cotton Center is 726.
What is the Ratio of Males per 100 Females in Poplar Cotton Center?
There are 164.19 Males per 100 Females in Poplar Cotton Center.
What is the Ratio of Females per 100 Males in Poplar Cotton Center?
There are 60.91 Females per 100 Males in Poplar Cotton Center.
What is the Median Population Age in Poplar Cotton Center?
Median Population Age in Poplar Cotton Center is 30.7 Years.
What is the Average Family Size in Poplar Cotton Center
Average Family Size in Poplar Cotton Center is 3.9 People.
What is the Average Household Size in Poplar Cotton Center
Average Household Size in Poplar Cotton Center is 3.3 People.
What is Per Capita Income in Poplar Cotton Center?
Per Capita income in Poplar Cotton Center is $17,801.
What is the Median Family Income in Poplar Cotton Center?
Median Family Income in Poplar Cotton Center is $55,391.
What is the Median Household income in Poplar Cotton Center?
Median Household Income in Poplar Cotton Center is $47,951.
What is Income or Wage Gap in Poplar Cotton Center?
Income or Wage Gap in Poplar Cotton Center is 33.8%.
Women in Poplar Cotton Center earn 66.2 cents for every dollar earned by a man.
What is Inequality or Gini Index in Poplar Cotton Center?
Inequality or Gini Index in Poplar Cotton Center is 0.39.
How Large is the Labor Force in Poplar Cotton Center?
There are 1,052 People in the Labor Forcein in Poplar Cotton Center.
What is the Percentage of People in the Labor Force in Poplar Cotton Center?
69.2% of People are in the Labor Force in Poplar Cotton Center.
What is the Unemployment Rate in Poplar Cotton Center?
Unemployment Rate in Poplar Cotton Center is 19.1%.