Plumas Lake, CA
Plumas Lake Map
Plumas Lake Overview
8,301
TOTAL POPULATION
4,235
MALE POPULATION
4,066
FEMALE POPULATION
104.16
MALES / 100 FEMALES
96.01
FEMALES / 100 MALES
31.1
MEDIAN AGE
3.5
AVG FAMILY SIZE
3.1
AVG HOUSEHOLD SIZE
$41,917
PER CAPITA INCOME
$117,726
AVG FAMILY INCOME
$109,860
AVG HOUSEHOLD INCOME
32.4%
WAGE / INCOME GAP [ % ]
67.6¢/ $1
WAGE / INCOME GAP [ $ ]
0.34
INEQUALITY / GINI INDEX
4,241
LABOR FORCE [ PEOPLE ]
74.2%
PERCENT IN LABOR FORCE
5.4%
UNEMPLOYMENT RATE
Plumas Lake Area Codes
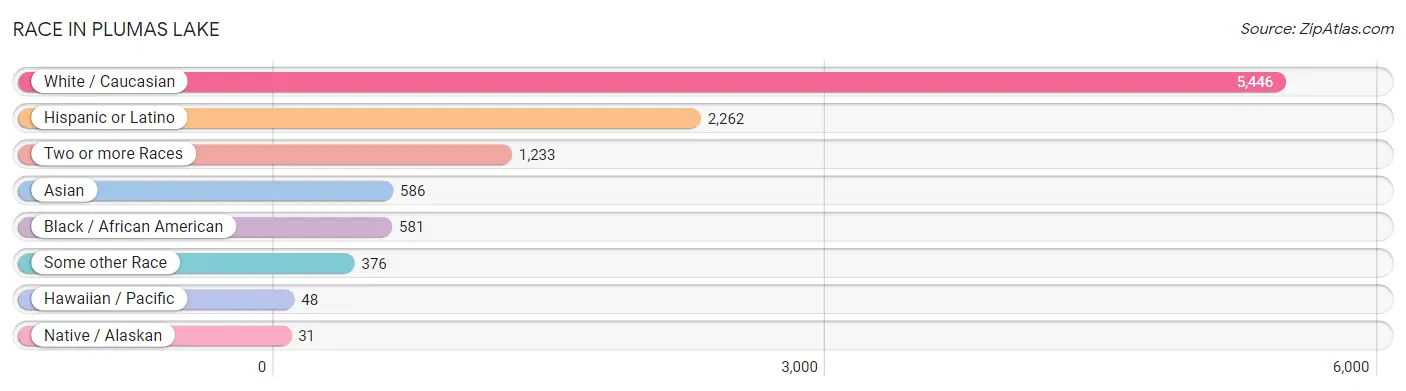
Race in Plumas Lake
The most populous races in Plumas Lake are White / Caucasian (5,446 | 65.6%), Hispanic or Latino (2,262 | 27.3%), and Two or more Races (1,233 | 14.8%).
| Race | # Population | % Population |
| Asian | 586 | 7.1% |
| Black / African American | 581 | 7.0% |
| Hawaiian / Pacific | 48 | 0.6% |
| Hispanic or Latino | 2,262 | 27.3% |
| Native / Alaskan | 31 | 0.4% |
| White / Caucasian | 5,446 | 65.6% |
| Two or more Races | 1,233 | 14.8% |
| Some other Race | 376 | 4.5% |
| Total | 8,301 | 100.0% |
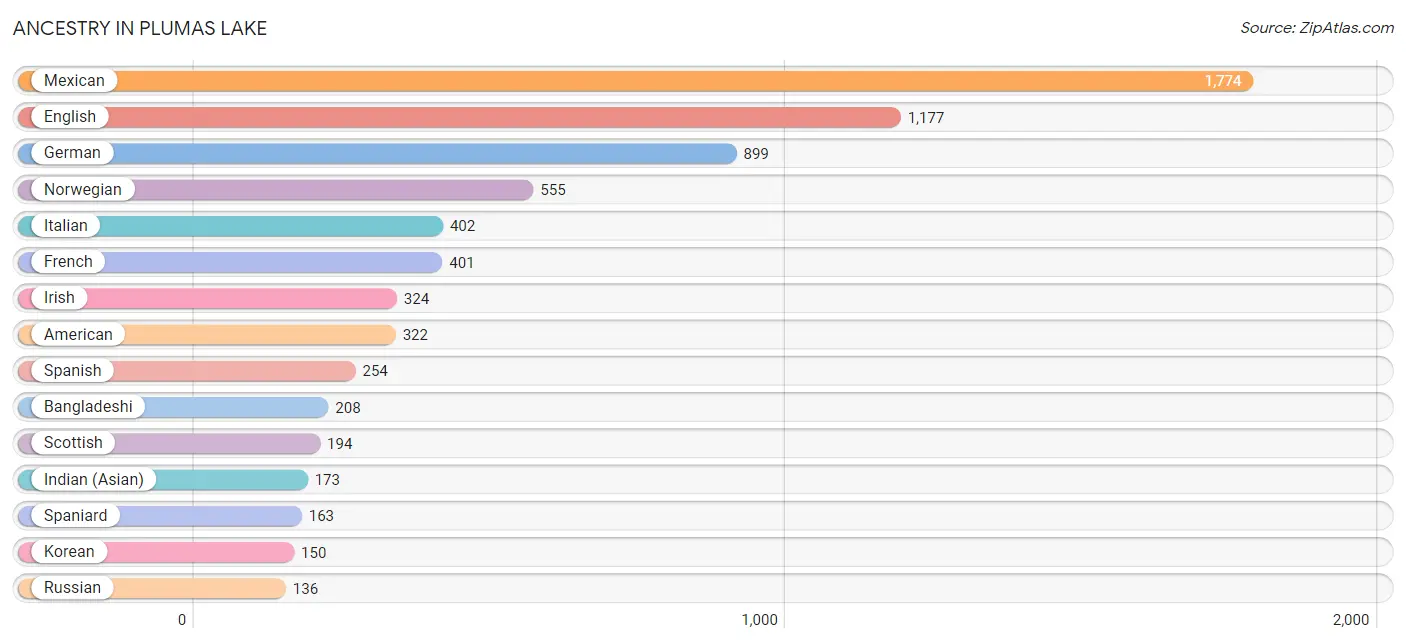
Ancestry in Plumas Lake
The most populous ancestries reported in Plumas Lake are Mexican (1,774 | 21.4%), English (1,177 | 14.2%), German (899 | 10.8%), Norwegian (555 | 6.7%), and Italian (402 | 4.8%), together accounting for 57.9% of all Plumas Lake residents.
| Ancestry | # Population | % Population |
| American | 322 | 3.9% |
| Armenian | 32 | 0.4% |
| Austrian | 74 | 0.9% |
| Bangladeshi | 208 | 2.5% |
| Bhutanese | 75 | 0.9% |
| British | 79 | 0.9% |
| British West Indian | 47 | 0.6% |
| Cherokee | 10 | 0.1% |
| Chippewa | 11 | 0.1% |
| Comanche | 14 | 0.2% |
| Creek | 10 | 0.1% |
| Croatian | 15 | 0.2% |
| Cuban | 9 | 0.1% |
| Danish | 118 | 1.4% |
| Dominican | 47 | 0.6% |
| Dutch | 90 | 1.1% |
| Eastern European | 39 | 0.5% |
| English | 1,177 | 14.2% |
| Estonian | 32 | 0.4% |
| European | 88 | 1.1% |
| French | 401 | 4.8% |
| German | 899 | 10.8% |
| Greek | 116 | 1.4% |
| Guamanian / Chamorro | 72 | 0.9% |
| Haitian | 47 | 0.6% |
| Hungarian | 8 | 0.1% |
| Indian (Asian) | 173 | 2.1% |
| Inupiat | 31 | 0.4% |
| Iranian | 19 | 0.2% |
| Irish | 324 | 3.9% |
| Italian | 402 | 4.8% |
| Jamaican | 69 | 0.8% |
| Japanese | 123 | 1.5% |
| Kenyan | 28 | 0.3% |
| Korean | 150 | 1.8% |
| Malaysian | 130 | 1.6% |
| Mexican | 1,774 | 21.4% |
| Native Hawaiian | 15 | 0.2% |
| Navajo | 6 | 0.1% |
| Norwegian | 555 | 6.7% |
| Polish | 106 | 1.3% |
| Portuguese | 30 | 0.4% |
| Romanian | 8 | 0.1% |
| Russian | 136 | 1.6% |
| Scandinavian | 71 | 0.9% |
| Scotch-Irish | 86 | 1.0% |
| Scottish | 194 | 2.3% |
| Spaniard | 163 | 2.0% |
| Spanish | 254 | 3.1% |
| Sri Lankan | 128 | 1.5% |
| Subsaharan African | 28 | 0.3% |
| Swedish | 45 | 0.5% |
| Swiss | 11 | 0.1% |
| Ukrainian | 19 | 0.2% |
| Welsh | 88 | 1.1% | View All 55 Rows |
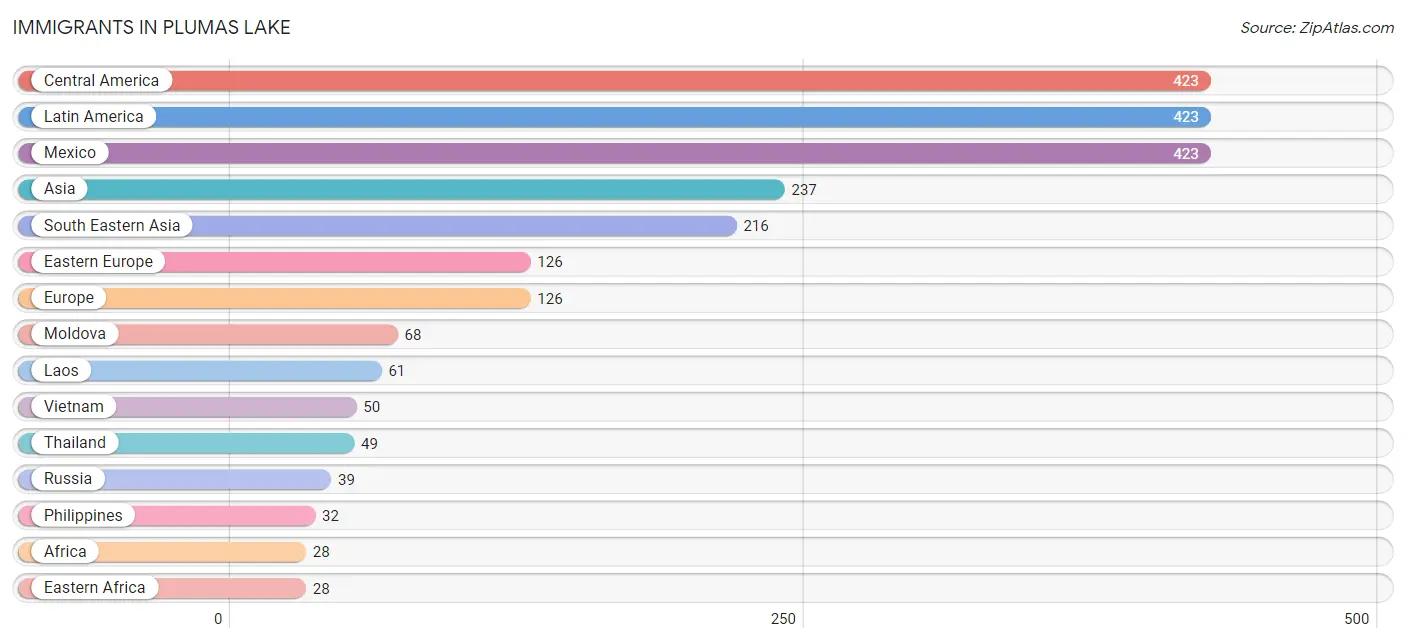
Immigrants in Plumas Lake
The most numerous immigrant groups reported in Plumas Lake came from Central America (423 | 5.1%), Latin America (423 | 5.1%), Mexico (423 | 5.1%), Asia (237 | 2.9%), and South Eastern Asia (216 | 2.6%), together accounting for 20.8% of all Plumas Lake residents.
| Immigration Origin | # Population | % Population |
| Africa | 28 | 0.3% |
| Asia | 237 | 2.9% |
| Cambodia | 24 | 0.3% |
| Central America | 423 | 5.1% |
| Eastern Africa | 28 | 0.3% |
| Eastern Europe | 126 | 1.5% |
| Europe | 126 | 1.5% |
| Kenya | 28 | 0.3% |
| Laos | 61 | 0.7% |
| Latin America | 423 | 5.1% |
| Mexico | 423 | 5.1% |
| Moldova | 68 | 0.8% |
| Philippines | 32 | 0.4% |
| Russia | 39 | 0.5% |
| South Central Asia | 21 | 0.3% |
| South Eastern Asia | 216 | 2.6% |
| Thailand | 49 | 0.6% |
| Ukraine | 19 | 0.2% |
| Vietnam | 50 | 0.6% | View All 19 Rows |
Sex and Age in Plumas Lake
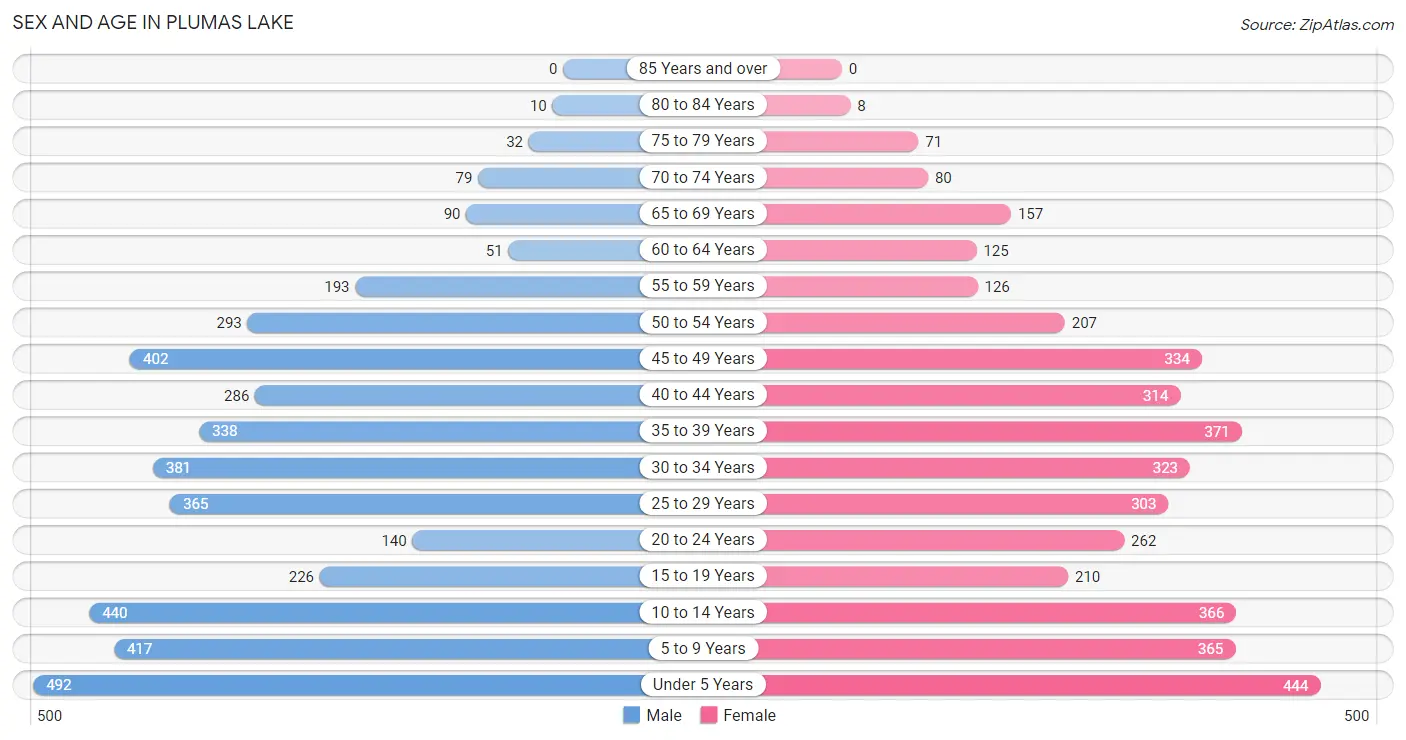
Sex and Age in Plumas Lake
The most populous age groups in Plumas Lake are Under 5 Years (492 | 11.6%) for men and Under 5 Years (444 | 10.9%) for women.
| Age Bracket | Male | Female |
| Under 5 Years | 492 (11.6%) | 444 (10.9%) |
| 5 to 9 Years | 417 (9.9%) | 365 (9.0%) |
| 10 to 14 Years | 440 (10.4%) | 366 (9.0%) |
| 15 to 19 Years | 226 (5.3%) | 210 (5.2%) |
| 20 to 24 Years | 140 (3.3%) | 262 (6.4%) |
| 25 to 29 Years | 365 (8.6%) | 303 (7.4%) |
| 30 to 34 Years | 381 (9.0%) | 323 (7.9%) |
| 35 to 39 Years | 338 (8.0%) | 371 (9.1%) |
| 40 to 44 Years | 286 (6.8%) | 314 (7.7%) |
| 45 to 49 Years | 402 (9.5%) | 334 (8.2%) |
| 50 to 54 Years | 293 (6.9%) | 207 (5.1%) |
| 55 to 59 Years | 193 (4.6%) | 126 (3.1%) |
| 60 to 64 Years | 51 (1.2%) | 125 (3.1%) |
| 65 to 69 Years | 90 (2.1%) | 157 (3.9%) |
| 70 to 74 Years | 79 (1.9%) | 80 (2.0%) |
| 75 to 79 Years | 32 (0.8%) | 71 (1.8%) |
| 80 to 84 Years | 10 (0.2%) | 8 (0.2%) |
| 85 Years and over | 0 (0.0%) | 0 (0.0%) |
| Total | 4,235 (100.0%) | 4,066 (100.0%) |
Families and Households in Plumas Lake
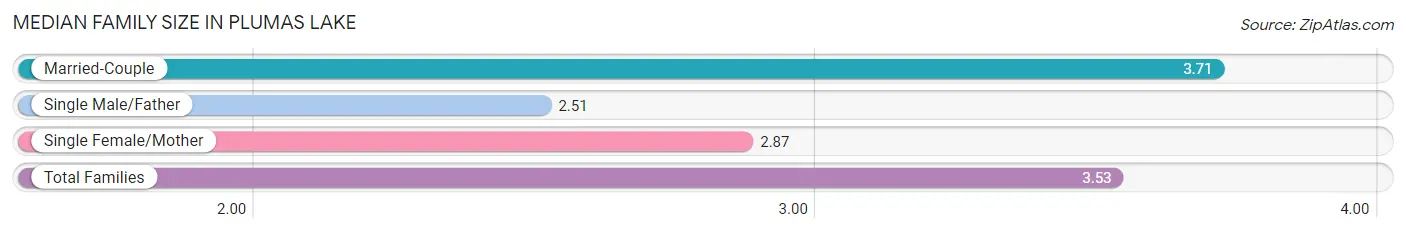
Median Family Size in Plumas Lake
The median family size in Plumas Lake is 3.53 persons per family, with married-couple families (1,692 | 81.0%) accounting for the largest median family size of 3.71 persons per family. On the other hand, single male/father families (109 | 5.2%) represent the smallest median family size with 2.51 persons per family.
| Family Type | # Families | Family Size |
| Married-Couple | 1,692 (81.0%) | 3.71 |
| Single Male/Father | 109 (5.2%) | 2.51 |
| Single Female/Mother | 288 (13.8%) | 2.87 |
| Total Families | 2,089 (100.0%) | 3.53 |
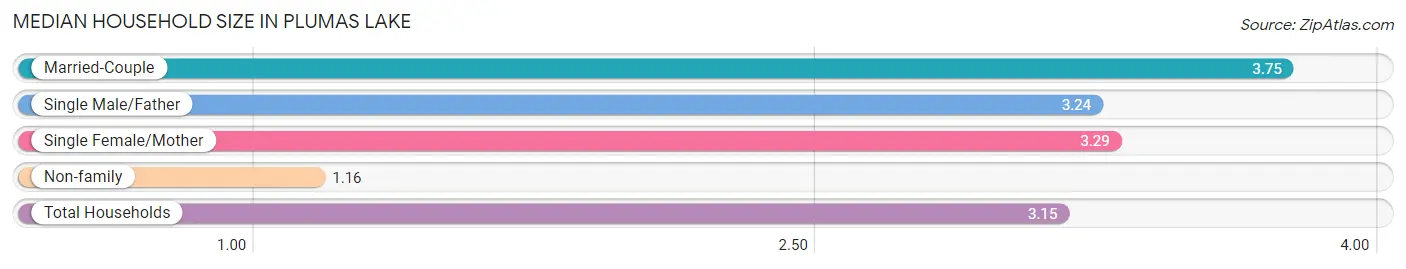
Median Household Size in Plumas Lake
The median household size in Plumas Lake is 3.15 persons per household, with married-couple households (1,692 | 64.4%) accounting for the largest median household size of 3.75 persons per household. non-family households (539 | 20.5%) represent the smallest median household size with 1.16 persons per household.
| Household Type | # Households | Household Size |
| Married-Couple | 1,692 (64.4%) | 3.75 |
| Single Male/Father | 109 (4.2%) | 3.24 |
| Single Female/Mother | 288 (11.0%) | 3.29 |
| Non-family | 539 (20.5%) | 1.16 |
| Total Households | 2,628 (100.0%) | 3.15 |
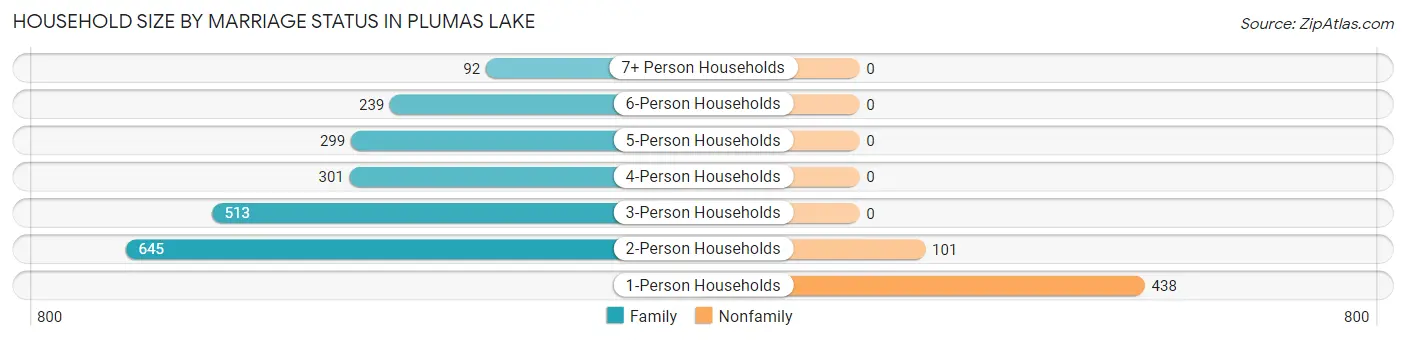
Household Size by Marriage Status in Plumas Lake
Out of a total of 2,628 households in Plumas Lake, 2,089 (79.5%) are family households, while 539 (20.5%) are nonfamily households. The most numerous type of family households are 2-person households, comprising 645, and the most common type of nonfamily households are 1-person households, comprising 438.
| Household Size | Family Households | Nonfamily Households |
| 1-Person Households | - | 438 (16.7%) |
| 2-Person Households | 645 (24.5%) | 101 (3.8%) |
| 3-Person Households | 513 (19.5%) | 0 (0.0%) |
| 4-Person Households | 301 (11.5%) | 0 (0.0%) |
| 5-Person Households | 299 (11.4%) | 0 (0.0%) |
| 6-Person Households | 239 (9.1%) | 0 (0.0%) |
| 7+ Person Households | 92 (3.5%) | 0 (0.0%) |
| Total | 2,089 (79.5%) | 539 (20.5%) |
Female Fertility in Plumas Lake
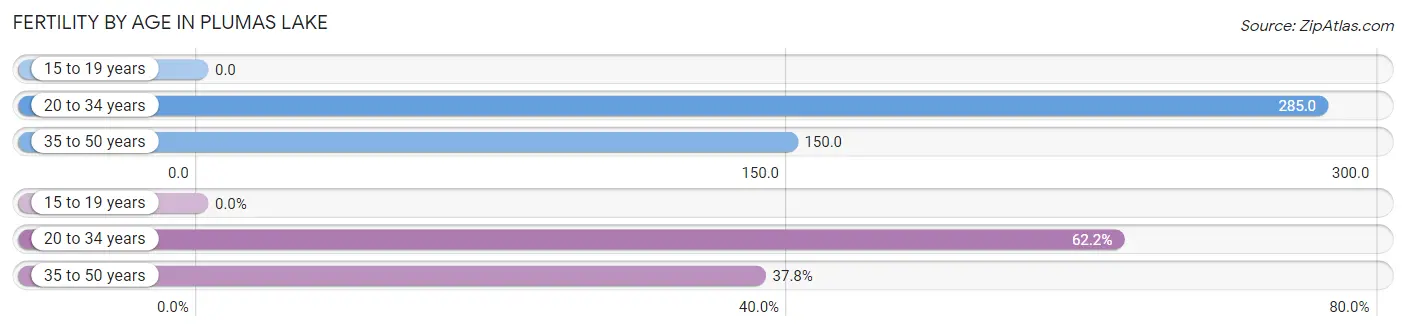
Fertility by Age in Plumas Lake
Average fertility rate in Plumas Lake is 192.0 births per 1,000 women. Women in the age bracket of 20 to 34 years have the highest fertility rate with 285.0 births per 1,000 women. Women in the age bracket of 20 to 34 years acount for 62.2% of all women with births.
| Age Bracket | Women with Births | Births / 1,000 Women |
| 15 to 19 years | 0 (0.0%) | 0.0 |
| 20 to 34 years | 253 (62.2%) | 285.0 |
| 35 to 50 years | 154 (37.8%) | 150.0 |
| Total | 407 (100.0%) | 192.0 |
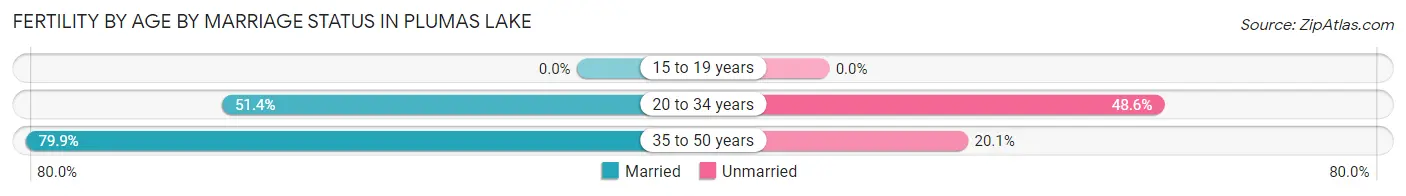
Fertility by Age by Marriage Status in Plumas Lake
62.2% of women with births (407) in Plumas Lake are married. The highest percentage of unmarried women with births falls into 20 to 34 years age bracket with 48.6% of them unmarried at the time of birth, while the lowest percentage of unmarried women with births belong to 35 to 50 years age bracket with 20.1% of them unmarried.
| Age Bracket | Married | Unmarried |
| 15 to 19 years | 0 (0.0%) | 0 (0.0%) |
| 20 to 34 years | 130 (51.4%) | 123 (48.6%) |
| 35 to 50 years | 123 (79.9%) | 31 (20.1%) |
| Total | 253 (62.2%) | 154 (37.8%) |
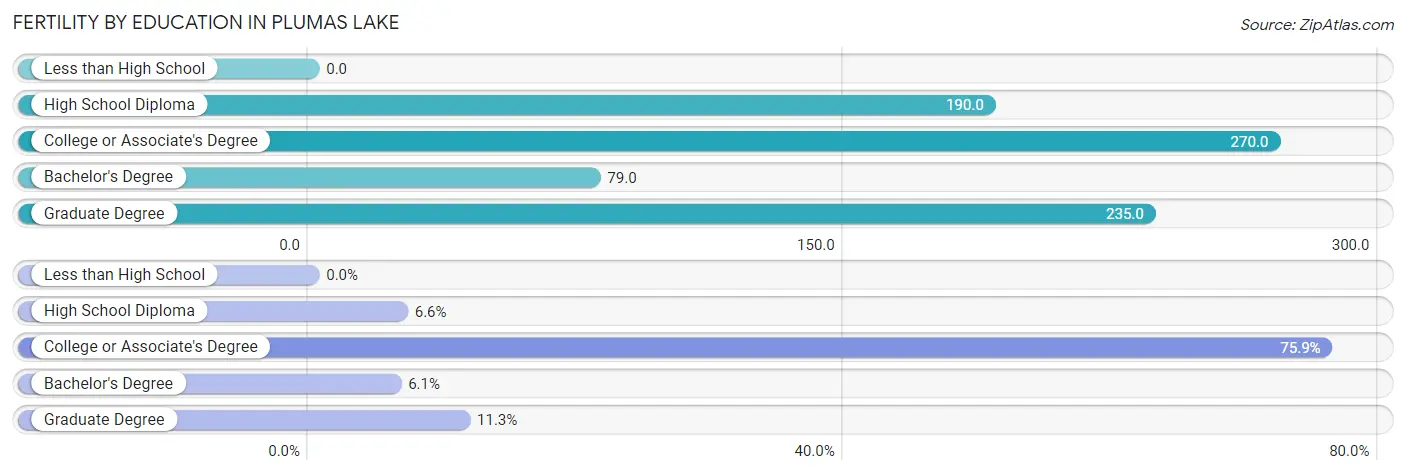
Fertility by Education in Plumas Lake
| Educational Attainment | Women with Births | Births / 1,000 Women |
| Less than High School | 0 (0.0%) | 0.0 |
| High School Diploma | 27 (6.6%) | 190.0 |
| College or Associate's Degree | 309 (75.9%) | 270.0 |
| Bachelor's Degree | 25 (6.1%) | 79.0 |
| Graduate Degree | 46 (11.3%) | 235.0 |
| Total | 407 (100.0%) | 192.0 |
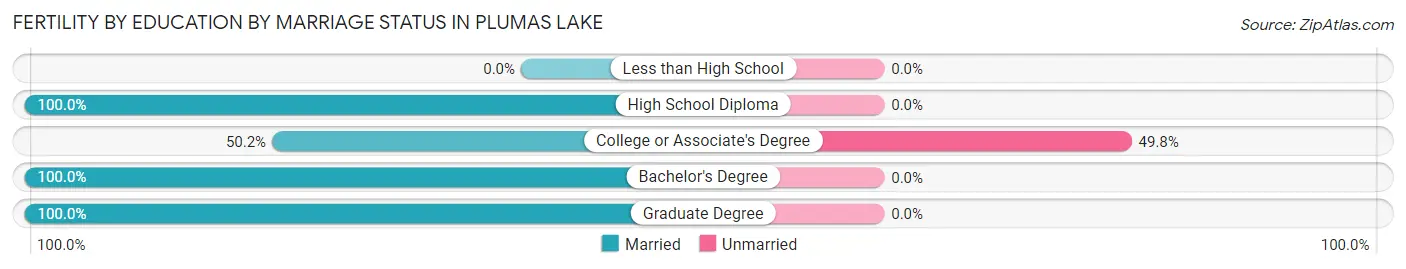
Fertility by Education by Marriage Status in Plumas Lake
37.8% of women with births in Plumas Lake are unmarried. Women with the educational attainment of high school diploma are most likely to be married with 100.0% of them married at childbirth, while women with the educational attainment of college or associate's degree are least likely to be married with 49.8% of them unmarried at childbirth.
| Educational Attainment | Married | Unmarried |
| Less than High School | 0 (0.0%) | 0 (0.0%) |
| High School Diploma | 27 (100.0%) | 0 (0.0%) |
| College or Associate's Degree | 155 (50.2%) | 154 (49.8%) |
| Bachelor's Degree | 25 (100.0%) | 0 (0.0%) |
| Graduate Degree | 46 (100.0%) | 0 (0.0%) |
| Total | 253 (62.2%) | 154 (37.8%) |
Income in Plumas Lake
Income Overview in Plumas Lake
Per Capita Income in Plumas Lake is $41,917, while median incomes of families and households are $117,726 and $109,860 respectively.
| Characteristic | Number | Measure |
| Per Capita Income | 8,301 | $41,917 |
| Median Family Income | 2,089 | $117,726 |
| Mean Family Income | 2,089 | $138,677 |
| Median Household Income | 2,628 | $109,860 |
| Mean Household Income | 2,628 | $132,720 |
| Income Deficit | 2,089 | $0 |
| Wage / Income Gap (%) | 8,301 | 32.43% |
| Wage / Income Gap ($) | 8,301 | 67.57¢ per $1 |
| Gini / Inequality Index | 8,301 | 0.34 |
Earnings by Sex in Plumas Lake
Average Earnings in Plumas Lake are $64,527, $70,930 for men and $47,930 for women, a difference of 32.4%.
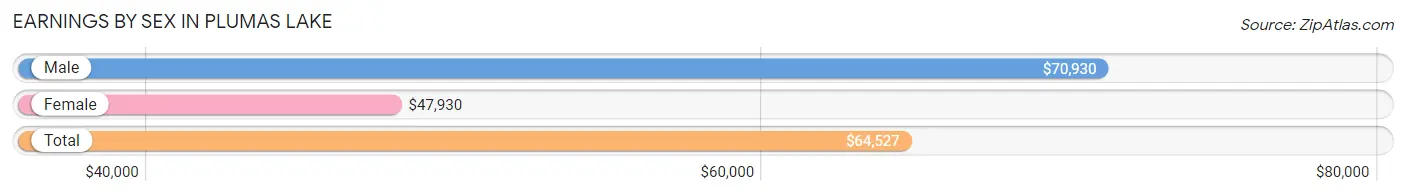
| Sex | Number | Average Earnings |
| Male | 2,316 (54.7%) | $70,930 |
| Female | 1,916 (45.3%) | $47,930 |
| Total | 4,232 (100.0%) | $64,527 |
Earnings by Sex by Income Bracket in Plumas Lake
The most common earnings brackets in Plumas Lake are $100,000+ for men (630 | 27.2%) and $100,000+ for women (296 | 15.4%).
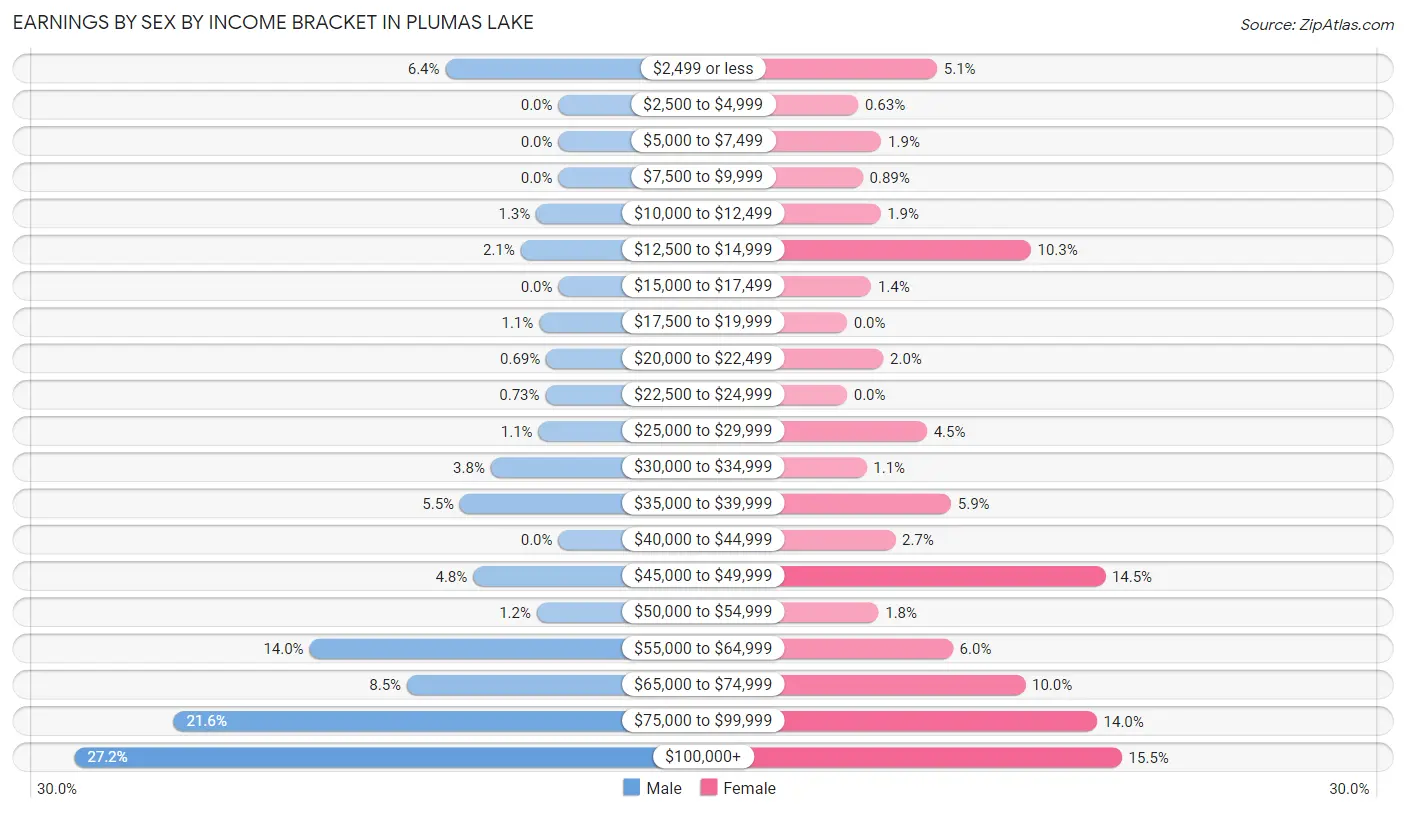
| Income | Male | Female |
| $2,499 or less | 147 (6.4%) | 97 (5.1%) |
| $2,500 to $4,999 | 0 (0.0%) | 12 (0.6%) |
| $5,000 to $7,499 | 0 (0.0%) | 37 (1.9%) |
| $7,500 to $9,999 | 0 (0.0%) | 17 (0.9%) |
| $10,000 to $12,499 | 29 (1.3%) | 36 (1.9%) |
| $12,500 to $14,999 | 49 (2.1%) | 198 (10.3%) |
| $15,000 to $17,499 | 0 (0.0%) | 26 (1.4%) |
| $17,500 to $19,999 | 25 (1.1%) | 0 (0.0%) |
| $20,000 to $22,499 | 16 (0.7%) | 39 (2.0%) |
| $22,500 to $24,999 | 17 (0.7%) | 0 (0.0%) |
| $25,000 to $29,999 | 26 (1.1%) | 86 (4.5%) |
| $30,000 to $34,999 | 88 (3.8%) | 21 (1.1%) |
| $35,000 to $39,999 | 128 (5.5%) | 112 (5.9%) |
| $40,000 to $44,999 | 0 (0.0%) | 52 (2.7%) |
| $45,000 to $49,999 | 111 (4.8%) | 278 (14.5%) |
| $50,000 to $54,999 | 28 (1.2%) | 34 (1.8%) |
| $55,000 to $64,999 | 324 (14.0%) | 114 (5.9%) |
| $65,000 to $74,999 | 197 (8.5%) | 192 (10.0%) |
| $75,000 to $99,999 | 501 (21.6%) | 269 (14.0%) |
| $100,000+ | 630 (27.2%) | 296 (15.4%) |
| Total | 2,316 (100.0%) | 1,916 (100.0%) |
Earnings by Sex by Educational Attainment in Plumas Lake
Average earnings in Plumas Lake are $80,174 for men and $51,875 for women, a difference of 35.3%. Men with an educational attainment of graduate degree enjoy the highest average annual earnings of $100,020, while those with college or associate's degree education earn the least with $64,988. Women with an educational attainment of graduate degree earn the most with the average annual earnings of $75,882, while those with high school diploma education have the smallest earnings of $46,094.
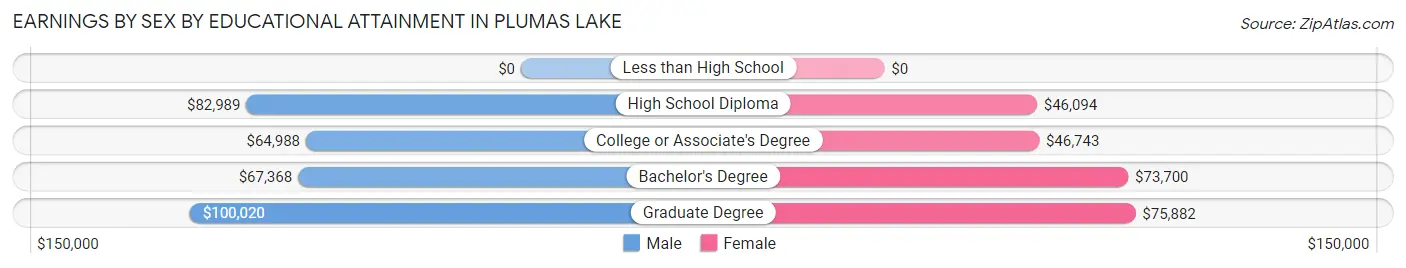
| Educational Attainment | Male Income | Female Income |
| Less than High School | - | - |
| High School Diploma | $82,989 | $46,094 |
| College or Associate's Degree | $64,988 | $46,743 |
| Bachelor's Degree | $67,368 | $73,700 |
| Graduate Degree | $100,020 | $75,882 |
| Total | $80,174 | $51,875 |
Family Income in Plumas Lake
Family Income Brackets in Plumas Lake
According to the Plumas Lake family income data, there are 639 families falling into the $100,000 to $149,999 income range, which is the most common income bracket and makes up 30.6% of all families.
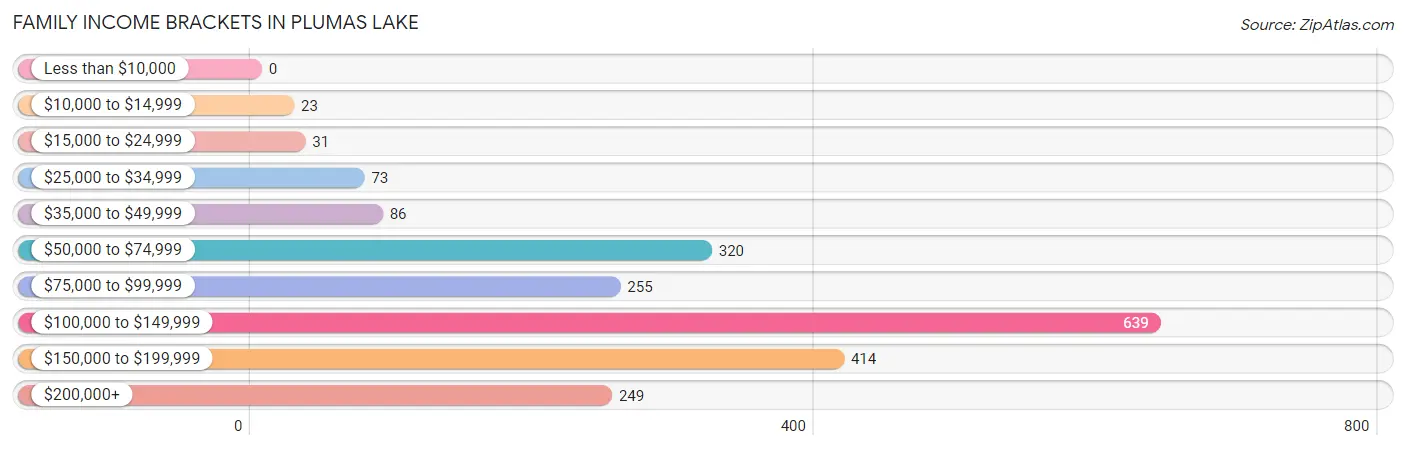
| Income Bracket | # Families | % Families |
| Less than $10,000 | 0 | 0.0% |
| $10,000 to $14,999 | 23 | 1.1% |
| $15,000 to $24,999 | 31 | 1.5% |
| $25,000 to $34,999 | 73 | 3.5% |
| $35,000 to $49,999 | 86 | 4.1% |
| $50,000 to $74,999 | 320 | 15.3% |
| $75,000 to $99,999 | 255 | 12.2% |
| $100,000 to $149,999 | 639 | 30.6% |
| $150,000 to $199,999 | 414 | 19.8% |
| $200,000+ | 249 | 11.9% |
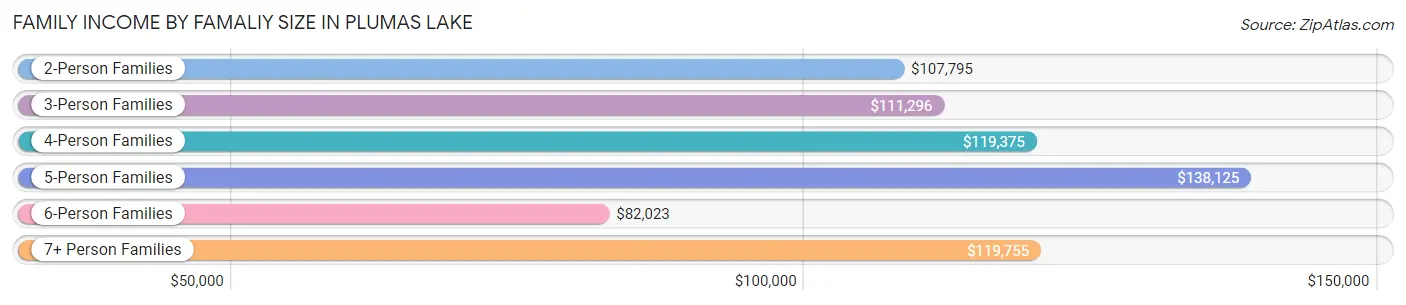
Family Income by Famaliy Size in Plumas Lake
5-person families (347 | 16.6%) account for the highest median family income in Plumas Lake with $138,125 per family, while 2-person families (786 | 37.6%) have the highest median income of $53,898 per family member.
| Income Bracket | # Families | Median Income |
| 2-Person Families | 786 (37.6%) | $107,795 |
| 3-Person Families | 426 (20.4%) | $111,296 |
| 4-Person Families | 259 (12.4%) | $119,375 |
| 5-Person Families | 347 (16.6%) | $138,125 |
| 6-Person Families | 179 (8.6%) | $82,023 |
| 7+ Person Families | 92 (4.4%) | $119,755 |
| Total | 2,089 (100.0%) | $117,726 |
Family Income by Number of Earners in Plumas Lake
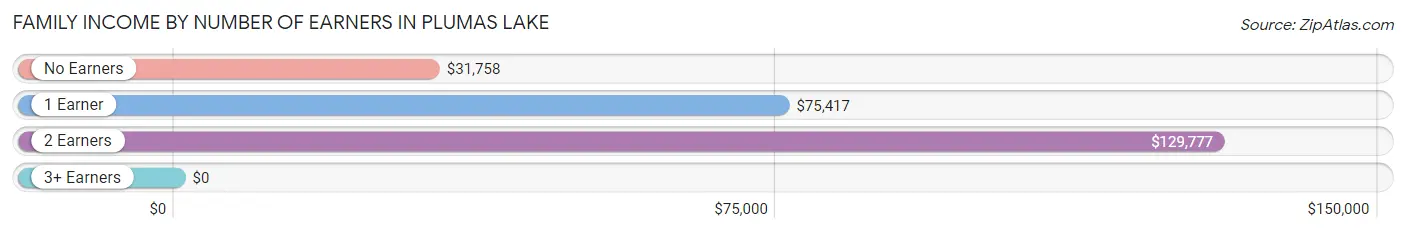
| Number of Earners | # Families | Median Income |
| No Earners | 129 (6.2%) | $31,758 |
| 1 Earner | 504 (24.1%) | $75,417 |
| 2 Earners | 1,329 (63.6%) | $129,777 |
| 3+ Earners | 127 (6.1%) | $0 |
| Total | 2,089 (100.0%) | $117,726 |
Household Income in Plumas Lake
Household Income Brackets in Plumas Lake
With 699 households falling in the category, the $100,000 to $149,999 income range is the most frequent in Plumas Lake, accounting for 26.6% of all households.
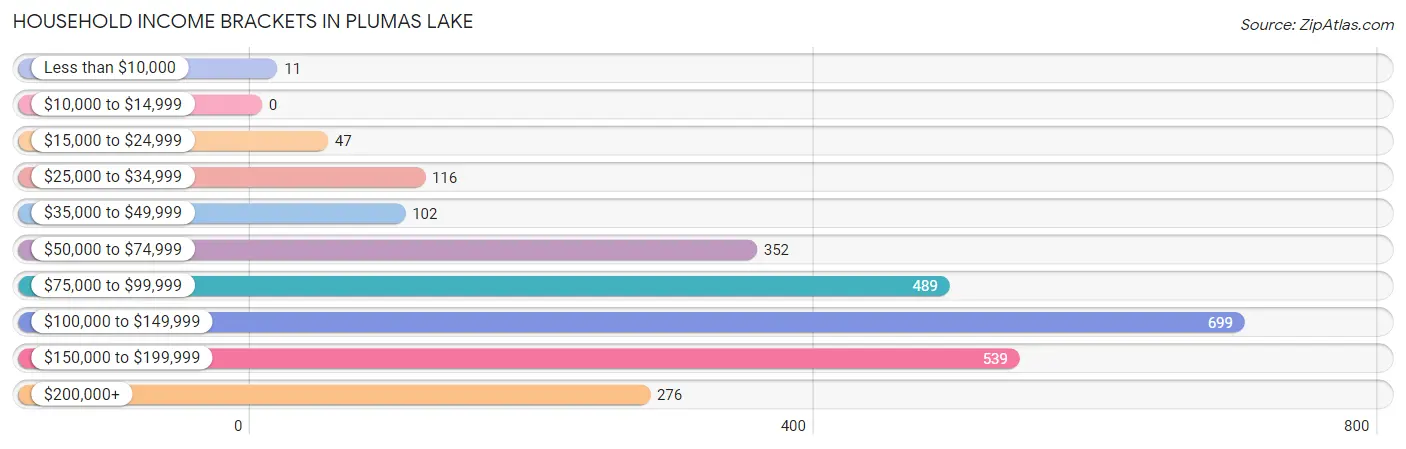
| Income Bracket | # Households | % Households |
| Less than $10,000 | 11 | 0.4% |
| $10,000 to $14,999 | 0 | 0.0% |
| $15,000 to $24,999 | 47 | 1.8% |
| $25,000 to $34,999 | 116 | 4.4% |
| $35,000 to $49,999 | 102 | 3.9% |
| $50,000 to $74,999 | 352 | 13.4% |
| $75,000 to $99,999 | 489 | 18.6% |
| $100,000 to $149,999 | 699 | 26.6% |
| $150,000 to $199,999 | 539 | 20.5% |
| $200,000+ | 276 | 10.5% |
Household Income by Householder Age in Plumas Lake
The median household income in Plumas Lake is $109,860, with the highest median household income of $128,438 found in the 25 to 44 years age bracket for the primary householder. A total of 1,264 households (48.1%) fall into this category. Meanwhile, the 65+ years age bracket for the primary householder has the lowest median household income of $49,286, with 340 households (12.9%) in this group.
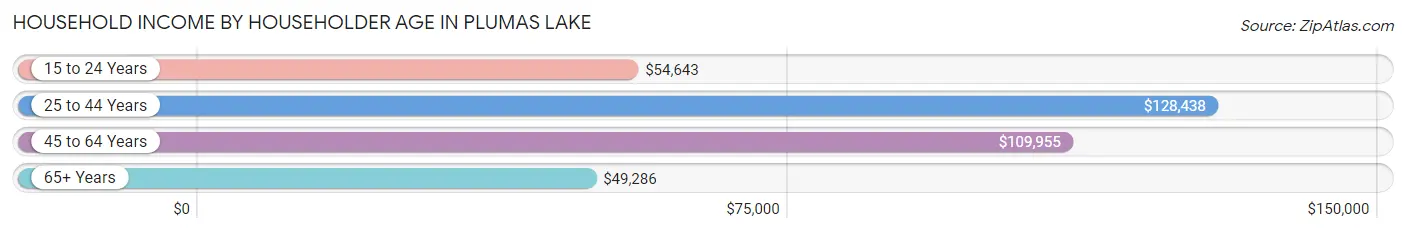
| Income Bracket | # Households | Median Income |
| 15 to 24 Years | 110 (4.2%) | $54,643 |
| 25 to 44 Years | 1,264 (48.1%) | $128,438 |
| 45 to 64 Years | 914 (34.8%) | $109,955 |
| 65+ Years | 340 (12.9%) | $49,286 |
| Total | 2,628 (100.0%) | $109,860 |
Poverty in Plumas Lake
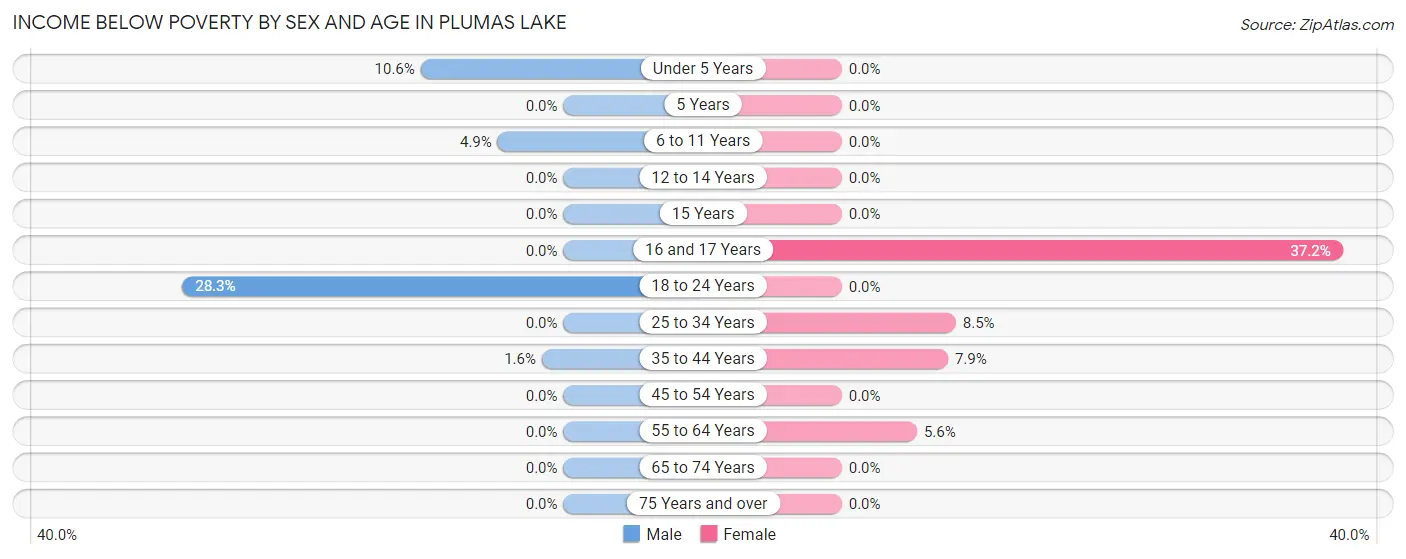
Income Below Poverty by Sex and Age in Plumas Lake
With 3.3% poverty level for males and 3.7% for females among the residents of Plumas Lake, 18 to 24 year old males and 16 and 17 year old females are the most vulnerable to poverty, with 58 males (28.3%) and 29 females (37.2%) in their respective age groups living below the poverty level.
| Age Bracket | Male | Female |
| Under 5 Years | 48 (10.6%) | 0 (0.0%) |
| 5 Years | 0 (0.0%) | 0 (0.0%) |
| 6 to 11 Years | 24 (4.9%) | 0 (0.0%) |
| 12 to 14 Years | 0 (0.0%) | 0 (0.0%) |
| 15 Years | 0 (0.0%) | 0 (0.0%) |
| 16 and 17 Years | 0 (0.0%) | 29 (37.2%) |
| 18 to 24 Years | 58 (28.3%) | 0 (0.0%) |
| 25 to 34 Years | 0 (0.0%) | 53 (8.5%) |
| 35 to 44 Years | 10 (1.6%) | 54 (7.9%) |
| 45 to 54 Years | 0 (0.0%) | 0 (0.0%) |
| 55 to 64 Years | 0 (0.0%) | 14 (5.6%) |
| 65 to 74 Years | 0 (0.0%) | 0 (0.0%) |
| 75 Years and over | 0 (0.0%) | 0 (0.0%) |
| Total | 140 (3.3%) | 150 (3.7%) |
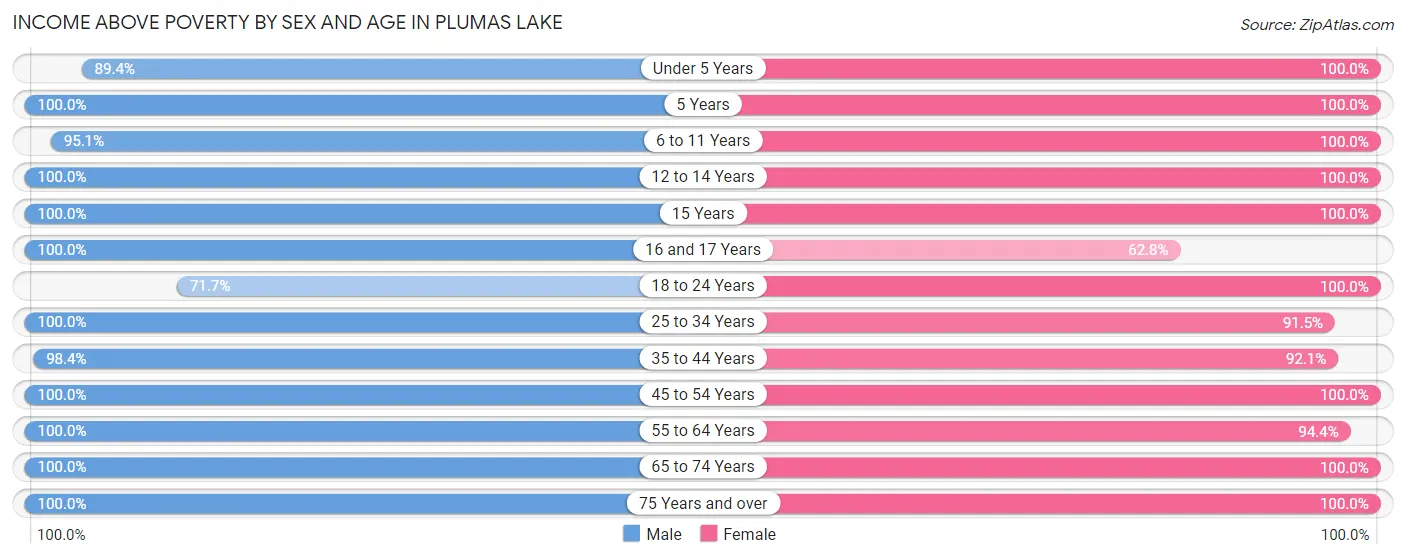
Income Above Poverty by Sex and Age in Plumas Lake
According to the poverty statistics in Plumas Lake, males aged 5 years and females aged under 5 years are the age groups that are most secure financially, with 100.0% of males and 100.0% of females in these age groups living above the poverty line.
| Age Bracket | Male | Female |
| Under 5 Years | 405 (89.4%) | 444 (100.0%) |
| 5 Years | 162 (100.0%) | 96 (100.0%) |
| 6 to 11 Years | 468 (95.1%) | 383 (100.0%) |
| 12 to 14 Years | 203 (100.0%) | 252 (100.0%) |
| 15 Years | 9 (100.0%) | 53 (100.0%) |
| 16 and 17 Years | 152 (100.0%) | 49 (62.8%) |
| 18 to 24 Years | 147 (71.7%) | 341 (100.0%) |
| 25 to 34 Years | 746 (100.0%) | 573 (91.5%) |
| 35 to 44 Years | 614 (98.4%) | 631 (92.1%) |
| 45 to 54 Years | 695 (100.0%) | 541 (100.0%) |
| 55 to 64 Years | 244 (100.0%) | 237 (94.4%) |
| 65 to 74 Years | 169 (100.0%) | 237 (100.0%) |
| 75 Years and over | 42 (100.0%) | 79 (100.0%) |
| Total | 4,056 (96.7%) | 3,916 (96.3%) |
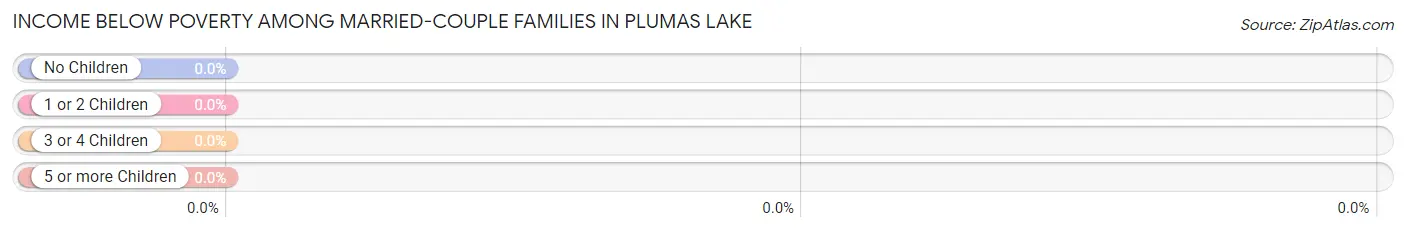
Income Below Poverty Among Married-Couple Families in Plumas Lake
| Children | Above Poverty | Below Poverty |
| No Children | 776 (100.0%) | 0 (0.0%) |
| 1 or 2 Children | 469 (100.0%) | 0 (0.0%) |
| 3 or 4 Children | 378 (100.0%) | 0 (0.0%) |
| 5 or more Children | 69 (100.0%) | 0 (0.0%) |
| Total | 1,692 (100.0%) | 0 (0.0%) |
Income Below Poverty Among Single-Parent Households in Plumas Lake
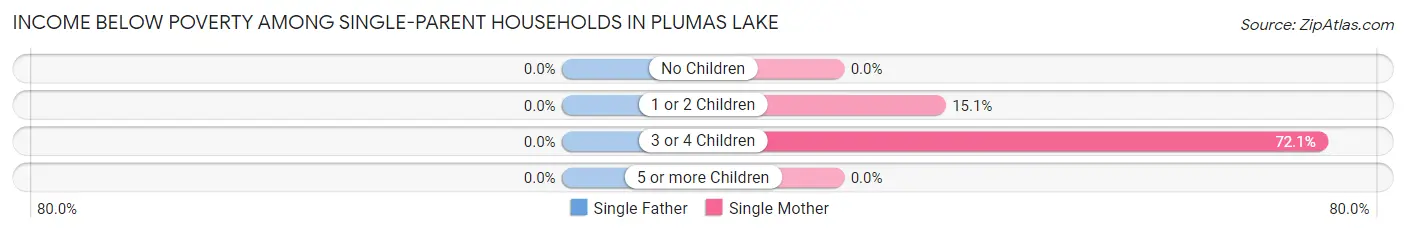
| Children | Single Father | Single Mother |
| No Children | 0 (0.0%) | 0 (0.0%) |
| 1 or 2 Children | 0 (0.0%) | 23 (15.1%) |
| 3 or 4 Children | 0 (0.0%) | 31 (72.1%) |
| 5 or more Children | 0 (0.0%) | 0 (0.0%) |
| Total | 0 (0.0%) | 54 (18.8%) |
Income Below Poverty Among Married-Couple vs Single-Parent Households in Plumas Lake
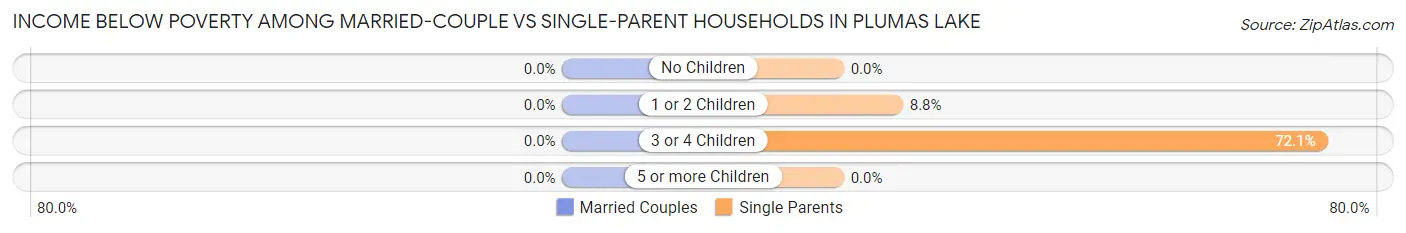
| Children | Married-Couple Families | Single-Parent Households |
| No Children | 0 (0.0%) | 0 (0.0%) |
| 1 or 2 Children | 0 (0.0%) | 23 (8.8%) |
| 3 or 4 Children | 0 (0.0%) | 31 (72.1%) |
| 5 or more Children | 0 (0.0%) | 0 (0.0%) |
| Total | 0 (0.0%) | 54 (13.6%) |
Employment Characteristics in Plumas Lake
Employment by Class of Employer in Plumas Lake
Among the 3,937 employed individuals in Plumas Lake, private company employees (2,068 | 52.5%), federal government employees (496 | 12.6%), and local government employees (463 | 11.8%) make up the most common classes of employment.
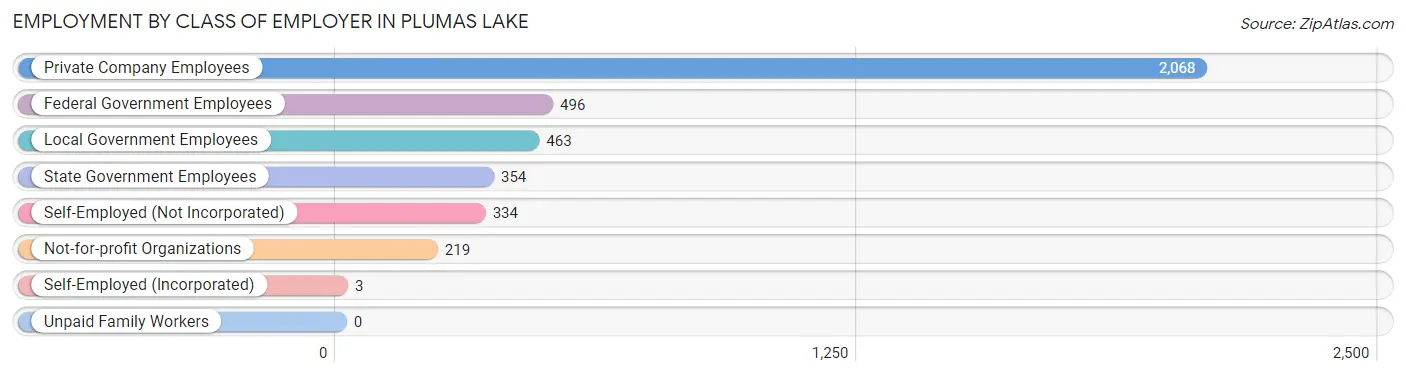
| Employer Class | # Employees | % Employees |
| Private Company Employees | 2,068 | 52.5% |
| Self-Employed (Incorporated) | 3 | 0.1% |
| Self-Employed (Not Incorporated) | 334 | 8.5% |
| Not-for-profit Organizations | 219 | 5.6% |
| Local Government Employees | 463 | 11.8% |
| State Government Employees | 354 | 9.0% |
| Federal Government Employees | 496 | 12.6% |
| Unpaid Family Workers | 0 | 0.0% |
| Total | 3,937 | 100.0% |
Employment Status by Age in Plumas Lake
According to the labor force statistics for Plumas Lake, out of the total population over 16 years of age (5,715), 74.2% or 4,241 individuals are in the labor force, with 5.4% or 229 of them unemployed. The age group with the highest labor force participation rate is 30 to 34 years, with 93.9% or 661 individuals in the labor force. Within the labor force, the 16 to 19 years age range has the highest percentage of unemployed individuals, with 44.1% or 52 of them being unemployed.
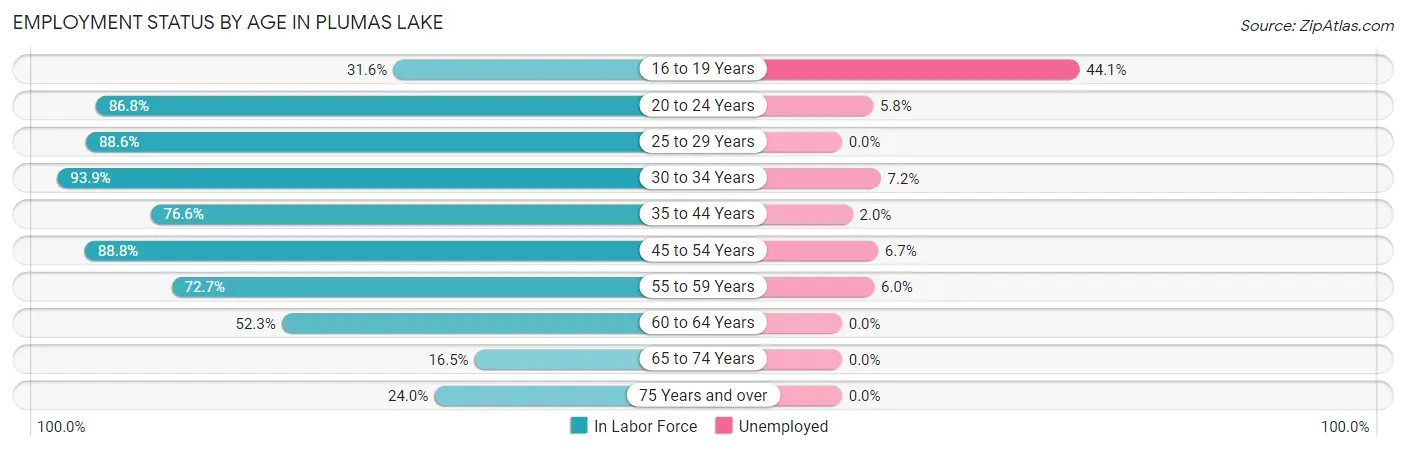
| Age Bracket | In Labor Force | Unemployed |
| 16 to 19 Years | 118 (31.6%) | 52 (44.1%) |
| 20 to 24 Years | 349 (86.8%) | 20 (5.8%) |
| 25 to 29 Years | 592 (88.6%) | 0 (0.0%) |
| 30 to 34 Years | 661 (93.9%) | 48 (7.2%) |
| 35 to 44 Years | 1,003 (76.6%) | 20 (2.0%) |
| 45 to 54 Years | 1,098 (88.8%) | 74 (6.7%) |
| 55 to 59 Years | 232 (72.7%) | 14 (6.0%) |
| 60 to 64 Years | 92 (52.3%) | 0 (0.0%) |
| 65 to 74 Years | 67 (16.5%) | 0 (0.0%) |
| 75 Years and over | 29 (24.0%) | 0 (0.0%) |
| Total | 4,241 (74.2%) | 229 (5.4%) |
Employment Status by Educational Attainment in Plumas Lake
According to labor force statistics for Plumas Lake, 83.3% of individuals (3,675) out of the total population between 25 and 64 years of age (4,412) are in the labor force, with 4.2% or 154 of them being unemployed. The group with the highest labor force participation rate are those with the educational attainment of bachelor's degree or higher, with 97.8% or 1,194 individuals in the labor force. Within the labor force, individuals with less than high school education have the highest percentage of unemployment, with 17.9% or 14 of them being unemployed.
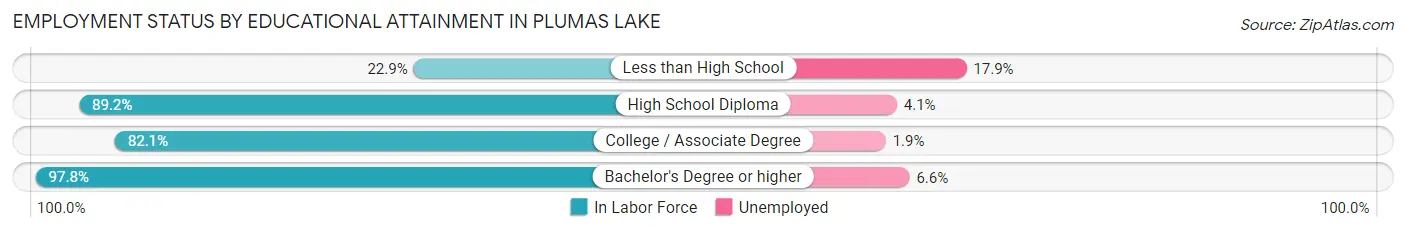
| Educational Attainment | In Labor Force | Unemployed |
| Less than High School | 77 (22.9%) | 60 (17.9%) |
| High School Diploma | 782 (89.2%) | 36 (4.1%) |
| College / Associate Degree | 1,624 (82.1%) | 38 (1.9%) |
| Bachelor's Degree or higher | 1,194 (97.8%) | 81 (6.6%) |
| Total | 3,675 (83.3%) | 185 (4.2%) |
Employment Occupations by Sex in Plumas Lake
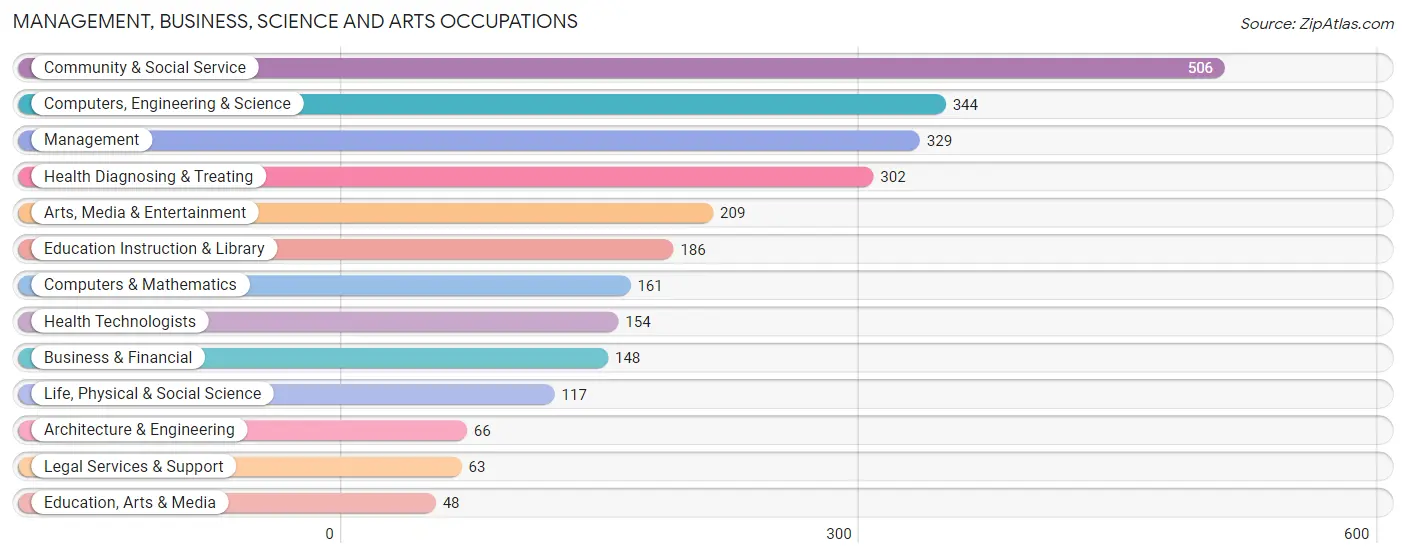
Management, Business, Science and Arts Occupations
The most common Management, Business, Science and Arts occupations in Plumas Lake are Community & Social Service (506 | 13.6%), Computers, Engineering & Science (344 | 9.3%), Management (329 | 8.9%), Health Diagnosing & Treating (302 | 8.1%), and Arts, Media & Entertainment (209 | 5.6%).
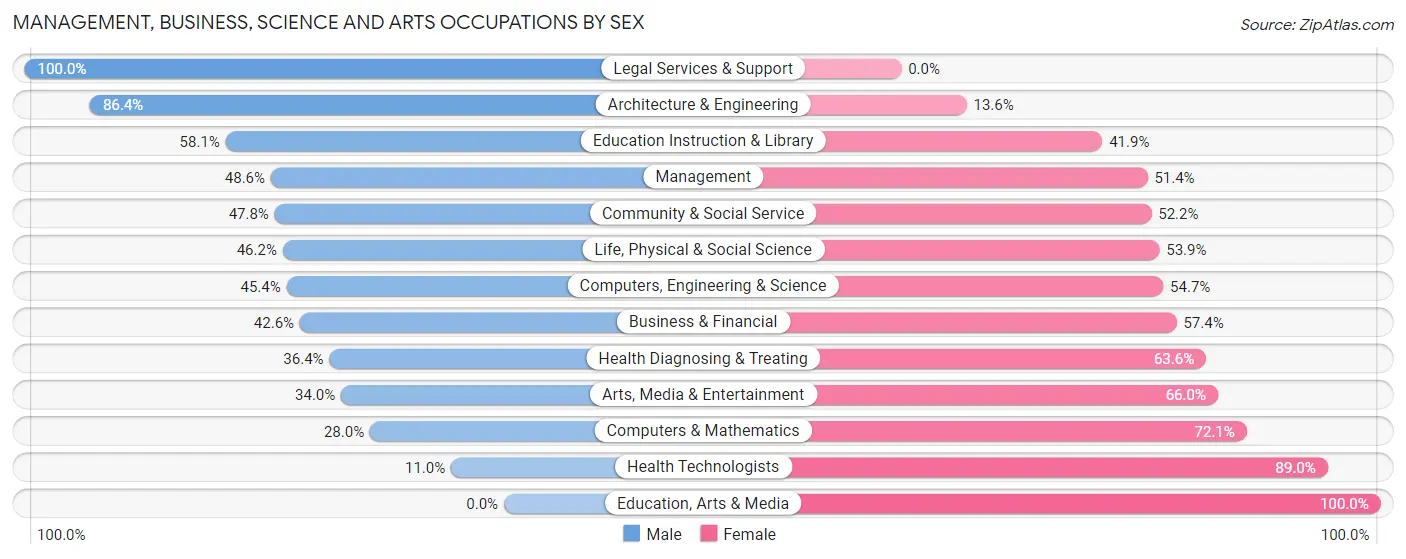
Management, Business, Science and Arts Occupations by Sex
Within the Management, Business, Science and Arts occupations in Plumas Lake, the most male-oriented occupations are Legal Services & Support (100.0%), Architecture & Engineering (86.4%), and Education Instruction & Library (58.1%), while the most female-oriented occupations are Education, Arts & Media (100.0%), Health Technologists (89.0%), and Computers & Mathematics (72.1%).
| Occupation | Male | Female |
| Management | 160 (48.6%) | 169 (51.4%) |
| Business & Financial | 63 (42.6%) | 85 (57.4%) |
| Computers, Engineering & Science | 156 (45.4%) | 188 (54.6%) |
| Computers & Mathematics | 45 (28.0%) | 116 (72.1%) |
| Architecture & Engineering | 57 (86.4%) | 9 (13.6%) |
| Life, Physical & Social Science | 54 (46.2%) | 63 (53.8%) |
| Community & Social Service | 242 (47.8%) | 264 (52.2%) |
| Education, Arts & Media | 0 (0.0%) | 48 (100.0%) |
| Legal Services & Support | 63 (100.0%) | 0 (0.0%) |
| Education Instruction & Library | 108 (58.1%) | 78 (41.9%) |
| Arts, Media & Entertainment | 71 (34.0%) | 138 (66.0%) |
| Health Diagnosing & Treating | 110 (36.4%) | 192 (63.6%) |
| Health Technologists | 17 (11.0%) | 137 (89.0%) |
| Total (Category) | 731 (44.9%) | 898 (55.1%) |
| Total (Overall) | 1,989 (53.5%) | 1,726 (46.5%) |
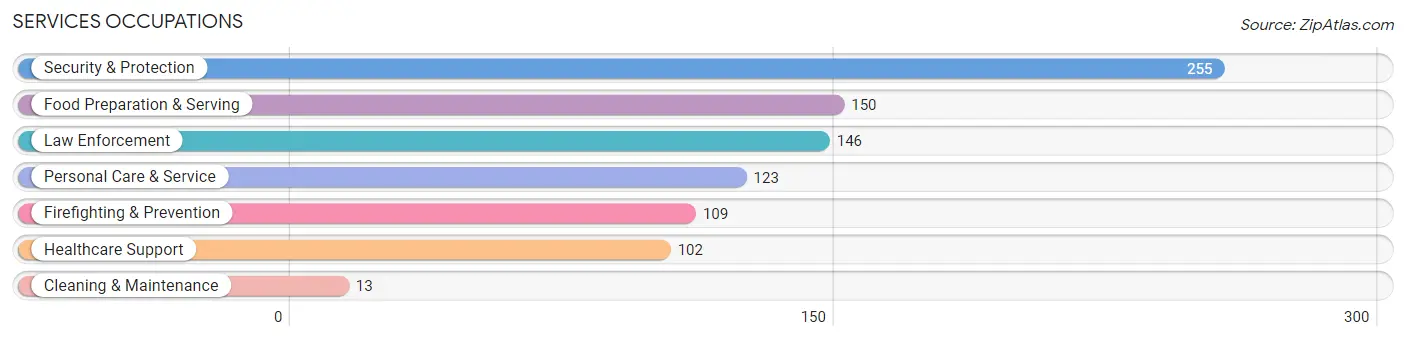
Services Occupations
The most common Services occupations in Plumas Lake are Security & Protection (255 | 6.9%), Food Preparation & Serving (150 | 4.0%), Law Enforcement (146 | 3.9%), Personal Care & Service (123 | 3.3%), and Firefighting & Prevention (109 | 2.9%).
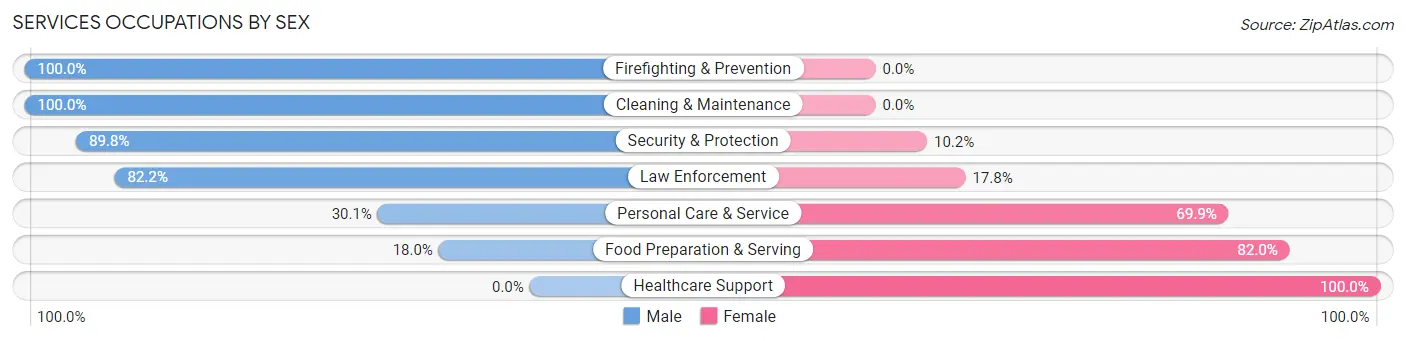
Services Occupations by Sex
Within the Services occupations in Plumas Lake, the most male-oriented occupations are Firefighting & Prevention (100.0%), Cleaning & Maintenance (100.0%), and Security & Protection (89.8%), while the most female-oriented occupations are Healthcare Support (100.0%), Food Preparation & Serving (82.0%), and Personal Care & Service (69.9%).
| Occupation | Male | Female |
| Healthcare Support | 0 (0.0%) | 102 (100.0%) |
| Security & Protection | 229 (89.8%) | 26 (10.2%) |
| Firefighting & Prevention | 109 (100.0%) | 0 (0.0%) |
| Law Enforcement | 120 (82.2%) | 26 (17.8%) |
| Food Preparation & Serving | 27 (18.0%) | 123 (82.0%) |
| Cleaning & Maintenance | 13 (100.0%) | 0 (0.0%) |
| Personal Care & Service | 37 (30.1%) | 86 (69.9%) |
| Total (Category) | 306 (47.6%) | 337 (52.4%) |
| Total (Overall) | 1,989 (53.5%) | 1,726 (46.5%) |
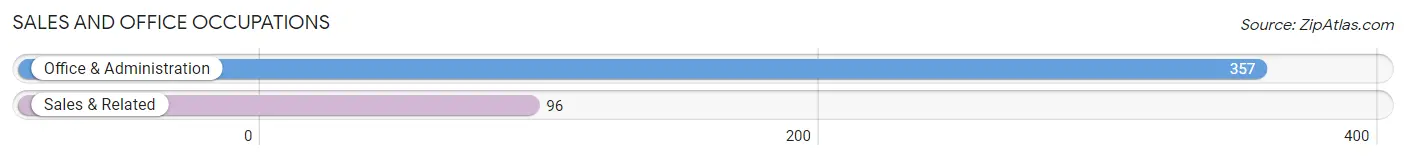
Sales and Office Occupations
The most common Sales and Office occupations in Plumas Lake are Office & Administration (357 | 9.6%), and Sales & Related (96 | 2.6%).
Sales and Office Occupations by Sex
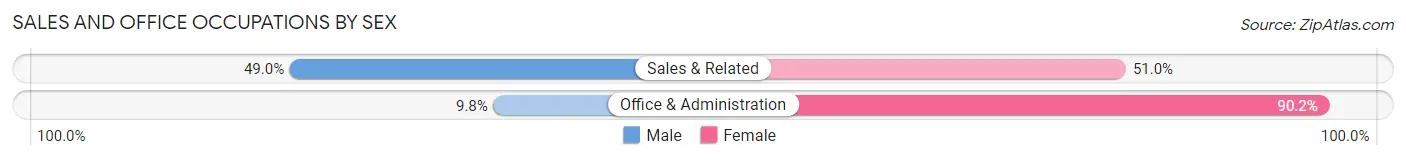
| Occupation | Male | Female |
| Sales & Related | 47 (49.0%) | 49 (51.0%) |
| Office & Administration | 35 (9.8%) | 322 (90.2%) |
| Total (Category) | 82 (18.1%) | 371 (81.9%) |
| Total (Overall) | 1,989 (53.5%) | 1,726 (46.5%) |
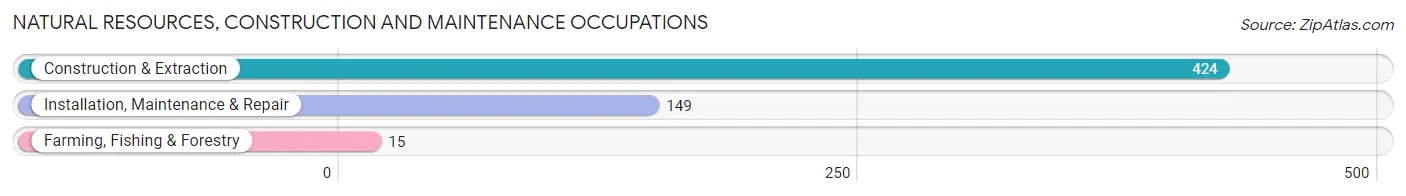
Natural Resources, Construction and Maintenance Occupations
The most common Natural Resources, Construction and Maintenance occupations in Plumas Lake are Construction & Extraction (424 | 11.4%), Installation, Maintenance & Repair (149 | 4.0%), and Farming, Fishing & Forestry (15 | 0.4%).
Natural Resources, Construction and Maintenance Occupations by Sex
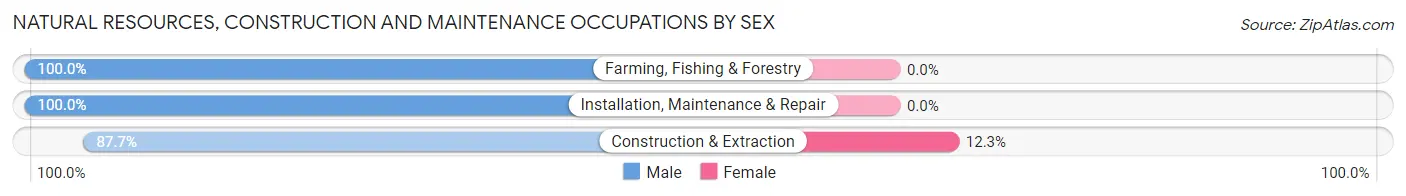
| Occupation | Male | Female |
| Farming, Fishing & Forestry | 15 (100.0%) | 0 (0.0%) |
| Construction & Extraction | 372 (87.7%) | 52 (12.3%) |
| Installation, Maintenance & Repair | 149 (100.0%) | 0 (0.0%) |
| Total (Category) | 536 (91.2%) | 52 (8.8%) |
| Total (Overall) | 1,989 (53.5%) | 1,726 (46.5%) |
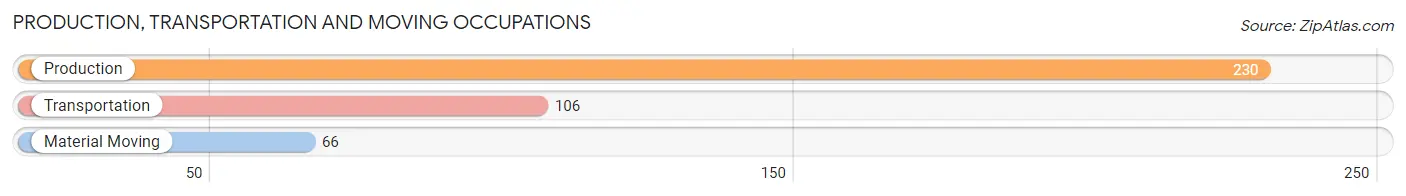
Production, Transportation and Moving Occupations
The most common Production, Transportation and Moving occupations in Plumas Lake are Production (230 | 6.2%), Transportation (106 | 2.9%), and Material Moving (66 | 1.8%).
Production, Transportation and Moving Occupations by Sex
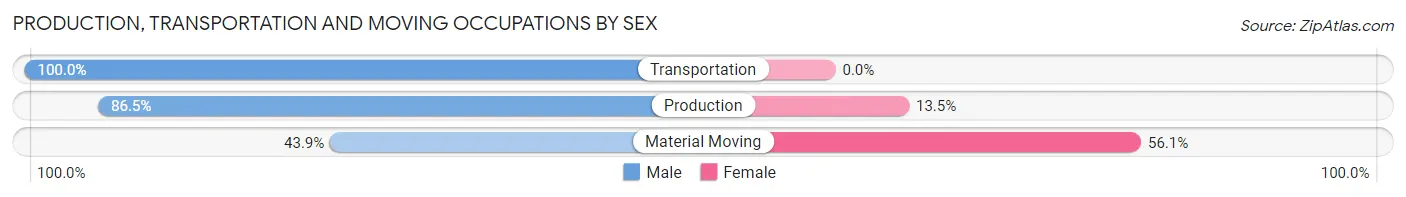
| Occupation | Male | Female |
| Production | 199 (86.5%) | 31 (13.5%) |
| Transportation | 106 (100.0%) | 0 (0.0%) |
| Material Moving | 29 (43.9%) | 37 (56.1%) |
| Total (Category) | 334 (83.1%) | 68 (16.9%) |
| Total (Overall) | 1,989 (53.5%) | 1,726 (46.5%) |
Employment Industries by Sex in Plumas Lake
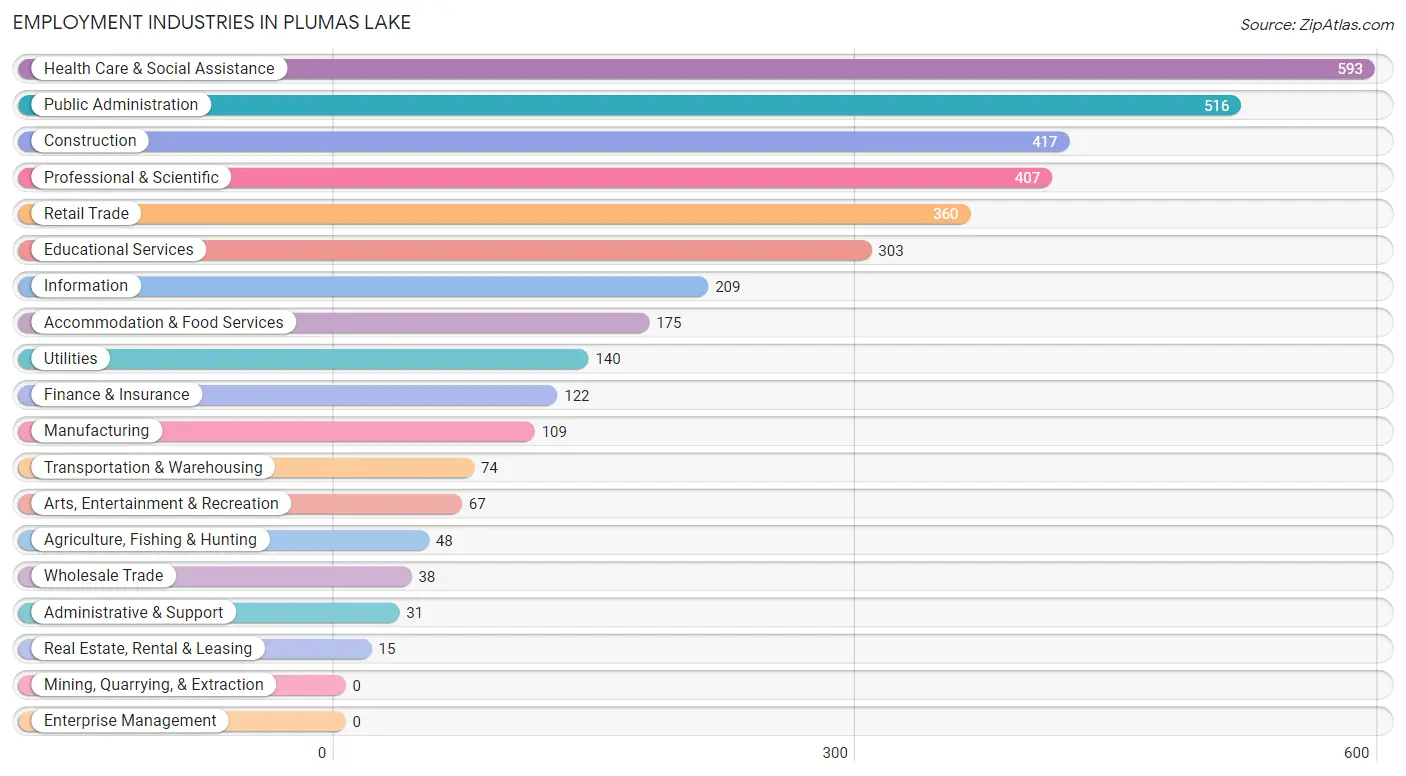
Employment Industries in Plumas Lake
The major employment industries in Plumas Lake include Health Care & Social Assistance (593 | 16.0%), Public Administration (516 | 13.9%), Construction (417 | 11.2%), Professional & Scientific (407 | 11.0%), and Retail Trade (360 | 9.7%).
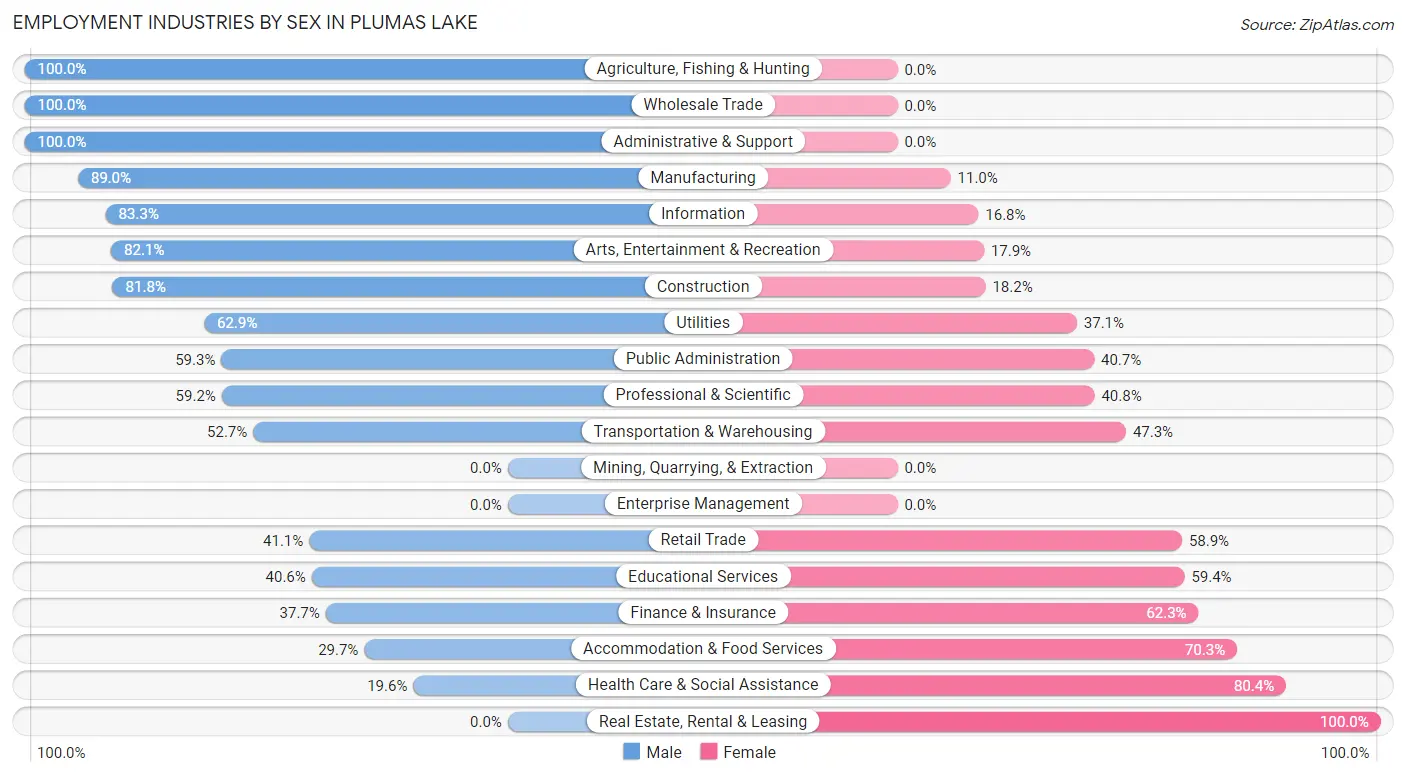
Employment Industries by Sex in Plumas Lake
The Plumas Lake industries that see more men than women are Agriculture, Fishing & Hunting (100.0%), Wholesale Trade (100.0%), and Administrative & Support (100.0%), whereas the industries that tend to have a higher number of women are Real Estate, Rental & Leasing (100.0%), Health Care & Social Assistance (80.4%), and Accommodation & Food Services (70.3%).
| Industry | Male | Female |
| Agriculture, Fishing & Hunting | 48 (100.0%) | 0 (0.0%) |
| Mining, Quarrying, & Extraction | 0 (0.0%) | 0 (0.0%) |
| Construction | 341 (81.8%) | 76 (18.2%) |
| Manufacturing | 97 (89.0%) | 12 (11.0%) |
| Wholesale Trade | 38 (100.0%) | 0 (0.0%) |
| Retail Trade | 148 (41.1%) | 212 (58.9%) |
| Transportation & Warehousing | 39 (52.7%) | 35 (47.3%) |
| Utilities | 88 (62.9%) | 52 (37.1%) |
| Information | 174 (83.3%) | 35 (16.8%) |
| Finance & Insurance | 46 (37.7%) | 76 (62.3%) |
| Real Estate, Rental & Leasing | 0 (0.0%) | 15 (100.0%) |
| Professional & Scientific | 241 (59.2%) | 166 (40.8%) |
| Enterprise Management | 0 (0.0%) | 0 (0.0%) |
| Administrative & Support | 31 (100.0%) | 0 (0.0%) |
| Educational Services | 123 (40.6%) | 180 (59.4%) |
| Health Care & Social Assistance | 116 (19.6%) | 477 (80.4%) |
| Arts, Entertainment & Recreation | 55 (82.1%) | 12 (17.9%) |
| Accommodation & Food Services | 52 (29.7%) | 123 (70.3%) |
| Public Administration | 306 (59.3%) | 210 (40.7%) |
| Total | 1,989 (53.5%) | 1,726 (46.5%) |
Education in Plumas Lake
School Enrollment in Plumas Lake
The most common levels of schooling among the 2,484 students in Plumas Lake are middle school (600 | 24.1%), high school (509 | 20.5%), and elementary school (493 | 19.9%).
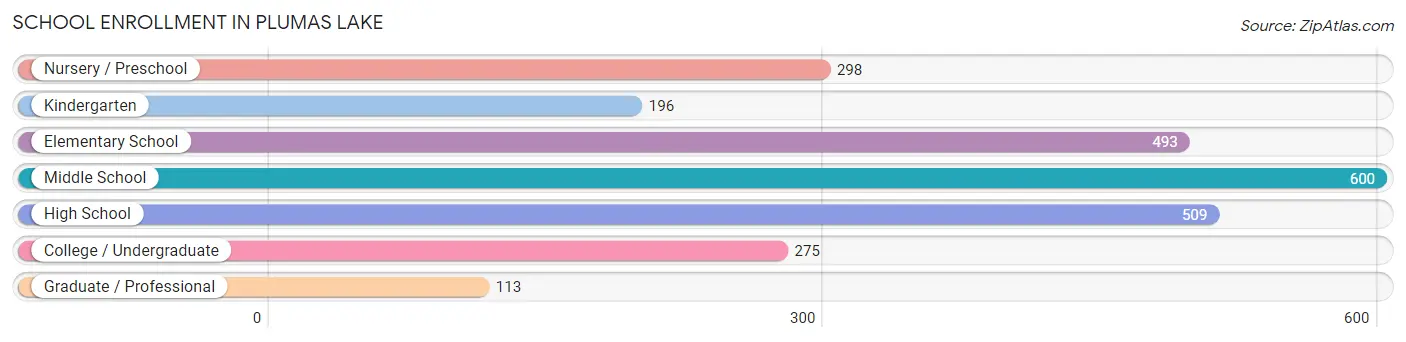
| School Level | # Students | % Students |
| Nursery / Preschool | 298 | 12.0% |
| Kindergarten | 196 | 7.9% |
| Elementary School | 493 | 19.9% |
| Middle School | 600 | 24.1% |
| High School | 509 | 20.5% |
| College / Undergraduate | 275 | 11.1% |
| Graduate / Professional | 113 | 4.5% |
| Total | 2,484 | 100.0% |
School Enrollment by Age by Funding Source in Plumas Lake
Out of a total of 2,484 students who are enrolled in schools in Plumas Lake, 410 (16.5%) attend a private institution, while the remaining 2,074 (83.5%) are enrolled in public schools. The age group of 35 years and over has the highest likelihood of being enrolled in private schools, with 37 (68.5% in the age bracket) enrolled. Conversely, the age group of 18 to 19 year olds has the lowest likelihood of being enrolled in a private school, with 117 (100.0% in the age bracket) attending a public institution.
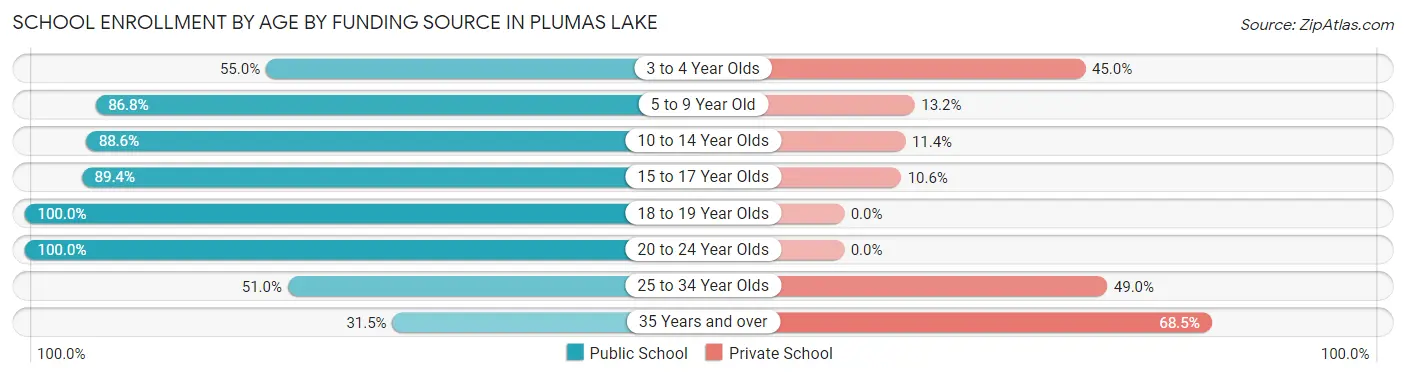
| Age Bracket | Public School | Private School |
| 3 to 4 Year Olds | 131 (55.0%) | 107 (45.0%) |
| 5 to 9 Year Old | 607 (86.8%) | 92 (13.2%) |
| 10 to 14 Year Olds | 714 (88.6%) | 92 (11.4%) |
| 15 to 17 Year Olds | 261 (89.4%) | 31 (10.6%) |
| 18 to 19 Year Olds | 117 (100.0%) | 0 (0.0%) |
| 20 to 24 Year Olds | 176 (100.0%) | 0 (0.0%) |
| 25 to 34 Year Olds | 52 (51.0%) | 50 (49.0%) |
| 35 Years and over | 17 (31.5%) | 37 (68.5%) |
| Total | 2,074 (83.5%) | 410 (16.5%) |
Educational Attainment by Field of Study in Plumas Lake
Business (356 | 26.6%), social sciences (223 | 16.7%), bio, nature & agricultural (166 | 12.4%), science & technology (123 | 9.2%), and education (99 | 7.4%) are the most common fields of study among 1,339 individuals in Plumas Lake who have obtained a bachelor's degree or higher.
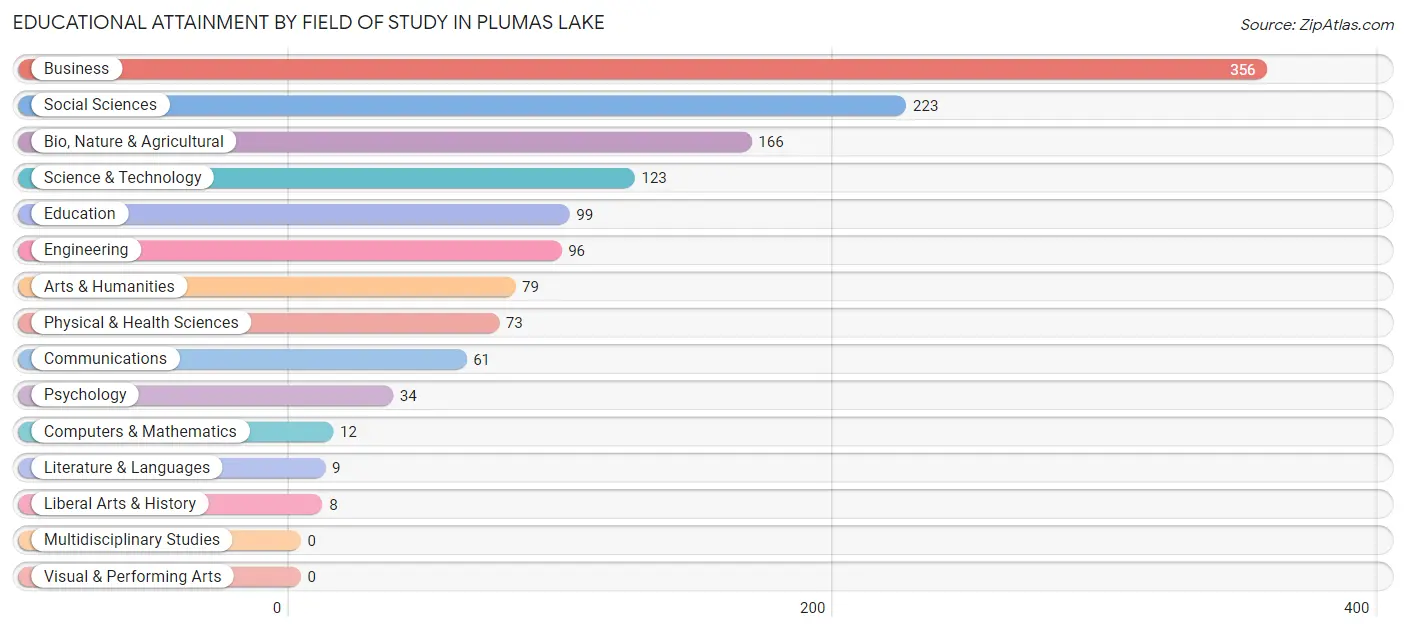
| Field of Study | # Graduates | % Graduates |
| Computers & Mathematics | 12 | 0.9% |
| Bio, Nature & Agricultural | 166 | 12.4% |
| Physical & Health Sciences | 73 | 5.4% |
| Psychology | 34 | 2.5% |
| Social Sciences | 223 | 16.7% |
| Engineering | 96 | 7.2% |
| Multidisciplinary Studies | 0 | 0.0% |
| Science & Technology | 123 | 9.2% |
| Business | 356 | 26.6% |
| Education | 99 | 7.4% |
| Literature & Languages | 9 | 0.7% |
| Liberal Arts & History | 8 | 0.6% |
| Visual & Performing Arts | 0 | 0.0% |
| Communications | 61 | 4.6% |
| Arts & Humanities | 79 | 5.9% |
| Total | 1,339 | 100.0% |
Transportation & Commute in Plumas Lake
Vehicle Availability by Sex in Plumas Lake
The most prevalent vehicle ownership categories in Plumas Lake are males with 2 vehicles (822, accounting for 37.8%) and females with 2 vehicles (699, making up 46.7%).
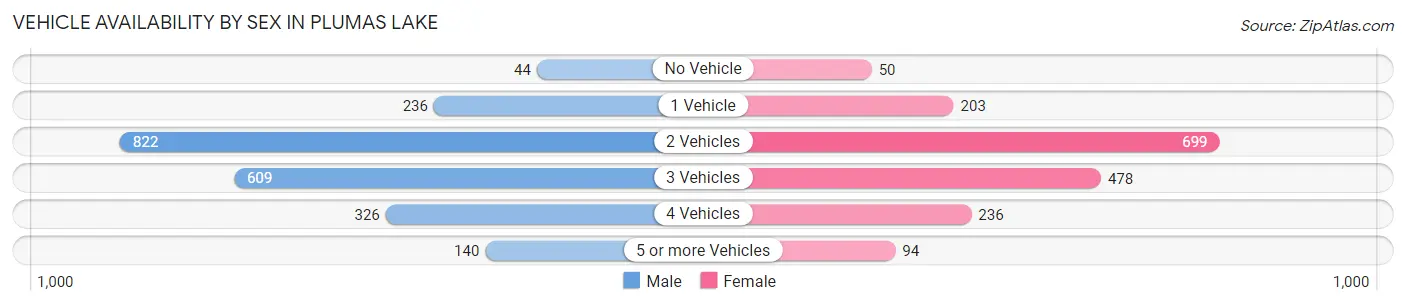
| Vehicles Available | Male | Female |
| No Vehicle | 44 (2.0%) | 50 (2.8%) |
| 1 Vehicle | 236 (10.8%) | 203 (11.5%) |
| 2 Vehicles | 822 (37.8%) | 699 (39.7%) |
| 3 Vehicles | 609 (28.0%) | 478 (27.2%) |
| 4 Vehicles | 326 (15.0%) | 236 (13.4%) |
| 5 or more Vehicles | 140 (6.4%) | 94 (5.3%) |
| Total | 2,177 (100.0%) | 1,760 (100.0%) |
Commute Time in Plumas Lake
The most frequently occuring commute durations in Plumas Lake are 45 to 59 minutes (611 commuters, 16.4%), 60 to 89 minutes (532 commuters, 14.3%), and 40 to 44 minutes (515 commuters, 13.8%).
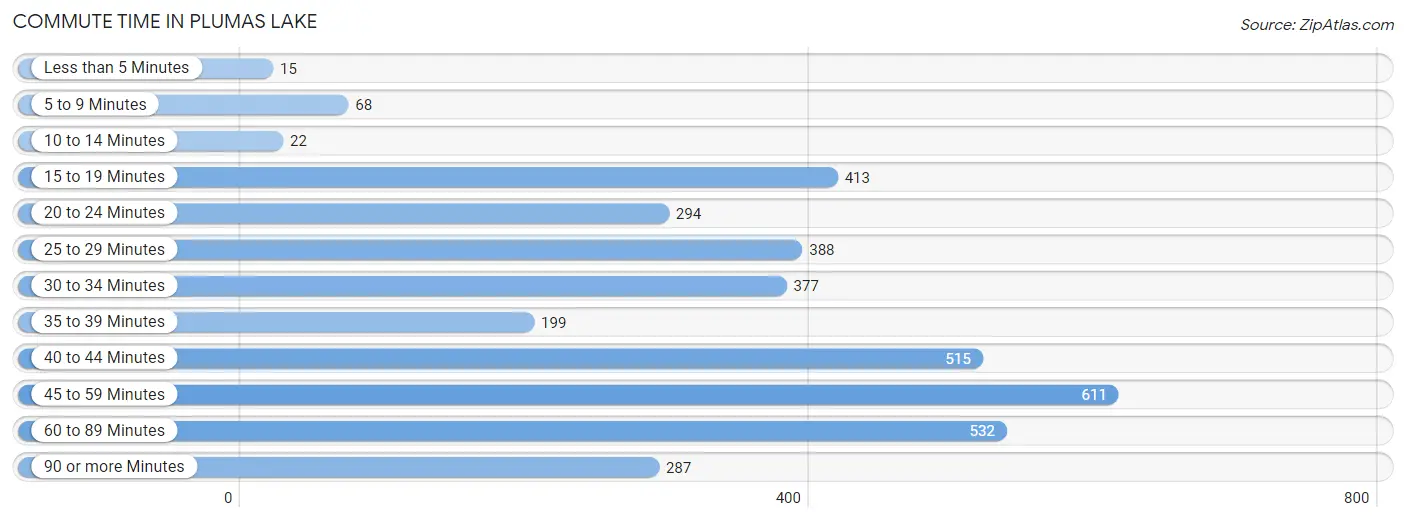
| Commute Time | # Commuters | % Commuters |
| Less than 5 Minutes | 15 | 0.4% |
| 5 to 9 Minutes | 68 | 1.8% |
| 10 to 14 Minutes | 22 | 0.6% |
| 15 to 19 Minutes | 413 | 11.1% |
| 20 to 24 Minutes | 294 | 7.9% |
| 25 to 29 Minutes | 388 | 10.4% |
| 30 to 34 Minutes | 377 | 10.1% |
| 35 to 39 Minutes | 199 | 5.3% |
| 40 to 44 Minutes | 515 | 13.8% |
| 45 to 59 Minutes | 611 | 16.4% |
| 60 to 89 Minutes | 532 | 14.3% |
| 90 or more Minutes | 287 | 7.7% |
Commute Time by Sex in Plumas Lake
The most common commute times in Plumas Lake are 60 to 89 minutes (364 commuters, 17.3%) for males and 45 to 59 minutes (374 commuters, 23.2%) for females.
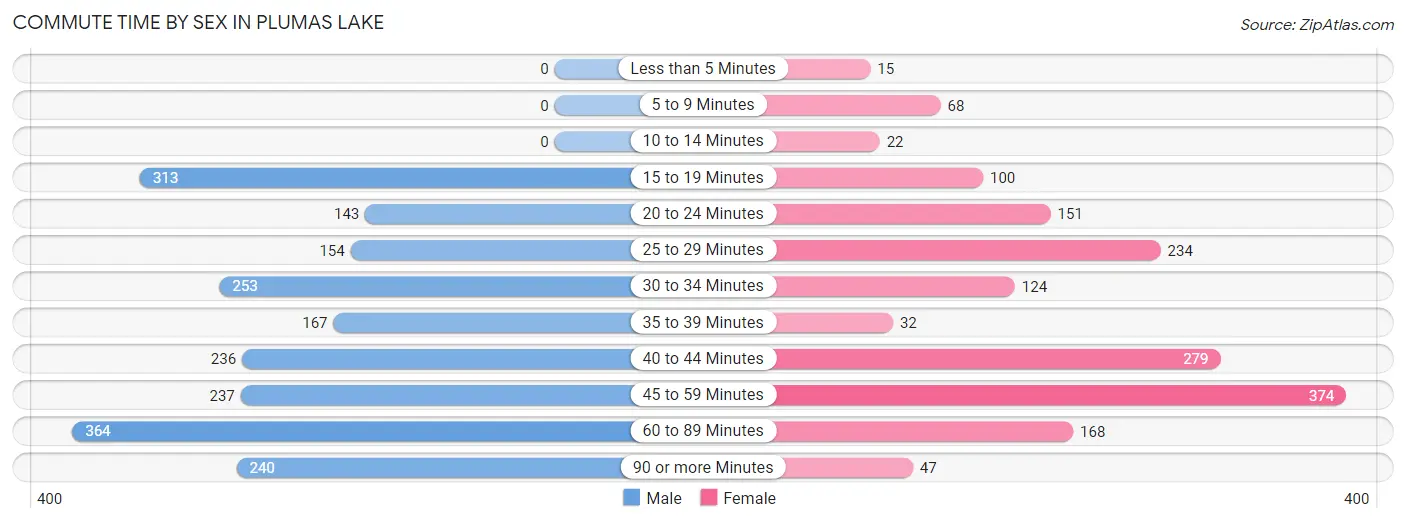
| Commute Time | Male | Female |
| Less than 5 Minutes | 0 (0.0%) | 15 (0.9%) |
| 5 to 9 Minutes | 0 (0.0%) | 68 (4.2%) |
| 10 to 14 Minutes | 0 (0.0%) | 22 (1.4%) |
| 15 to 19 Minutes | 313 (14.9%) | 100 (6.2%) |
| 20 to 24 Minutes | 143 (6.8%) | 151 (9.4%) |
| 25 to 29 Minutes | 154 (7.3%) | 234 (14.5%) |
| 30 to 34 Minutes | 253 (12.0%) | 124 (7.7%) |
| 35 to 39 Minutes | 167 (7.9%) | 32 (2.0%) |
| 40 to 44 Minutes | 236 (11.2%) | 279 (17.3%) |
| 45 to 59 Minutes | 237 (11.3%) | 374 (23.2%) |
| 60 to 89 Minutes | 364 (17.3%) | 168 (10.4%) |
| 90 or more Minutes | 240 (11.4%) | 47 (2.9%) |
Time of Departure to Work by Sex in Plumas Lake
The most frequent times of departure to work in Plumas Lake are 5:00 AM to 5:29 AM (412, 19.6%) for males and 6:00 AM to 6:29 AM (285, 17.7%) for females.
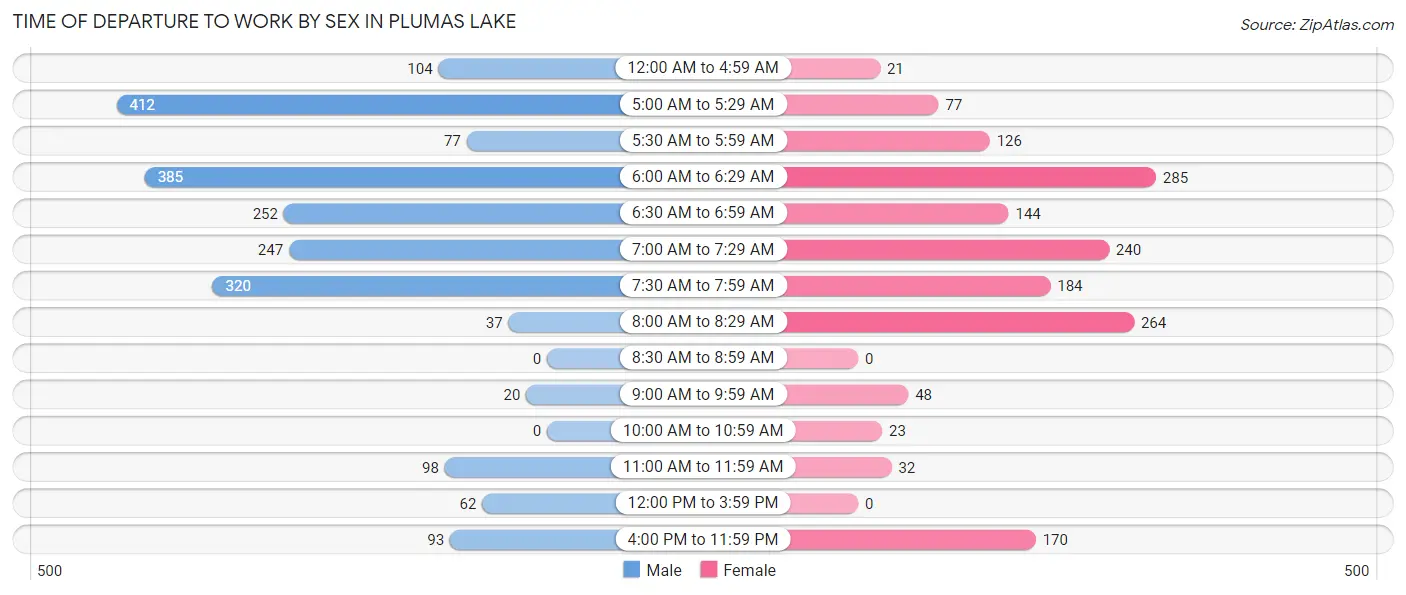
| Time of Departure | Male | Female |
| 12:00 AM to 4:59 AM | 104 (4.9%) | 21 (1.3%) |
| 5:00 AM to 5:29 AM | 412 (19.6%) | 77 (4.8%) |
| 5:30 AM to 5:59 AM | 77 (3.6%) | 126 (7.8%) |
| 6:00 AM to 6:29 AM | 385 (18.3%) | 285 (17.7%) |
| 6:30 AM to 6:59 AM | 252 (12.0%) | 144 (8.9%) |
| 7:00 AM to 7:29 AM | 247 (11.7%) | 240 (14.9%) |
| 7:30 AM to 7:59 AM | 320 (15.2%) | 184 (11.4%) |
| 8:00 AM to 8:29 AM | 37 (1.8%) | 264 (16.4%) |
| 8:30 AM to 8:59 AM | 0 (0.0%) | 0 (0.0%) |
| 9:00 AM to 9:59 AM | 20 (0.9%) | 48 (3.0%) |
| 10:00 AM to 10:59 AM | 0 (0.0%) | 23 (1.4%) |
| 11:00 AM to 11:59 AM | 98 (4.6%) | 32 (2.0%) |
| 12:00 PM to 3:59 PM | 62 (2.9%) | 0 (0.0%) |
| 4:00 PM to 11:59 PM | 93 (4.4%) | 170 (10.5%) |
| Total | 2,107 (100.0%) | 1,614 (100.0%) |
Housing Occupancy in Plumas Lake
Occupancy by Ownership in Plumas Lake
Of the total 2,628 dwellings in Plumas Lake, owner-occupied units account for 2,166 (82.4%), while renter-occupied units make up 462 (17.6%).
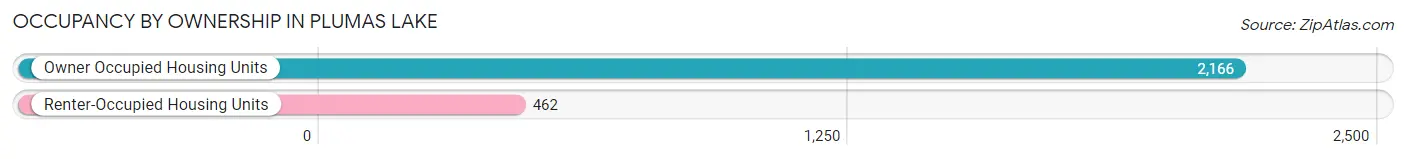
| Occupancy | # Housing Units | % Housing Units |
| Owner Occupied Housing Units | 2,166 | 82.4% |
| Renter-Occupied Housing Units | 462 | 17.6% |
| Total Occupied Housing Units | 2,628 | 100.0% |
Occupancy by Household Size in Plumas Lake
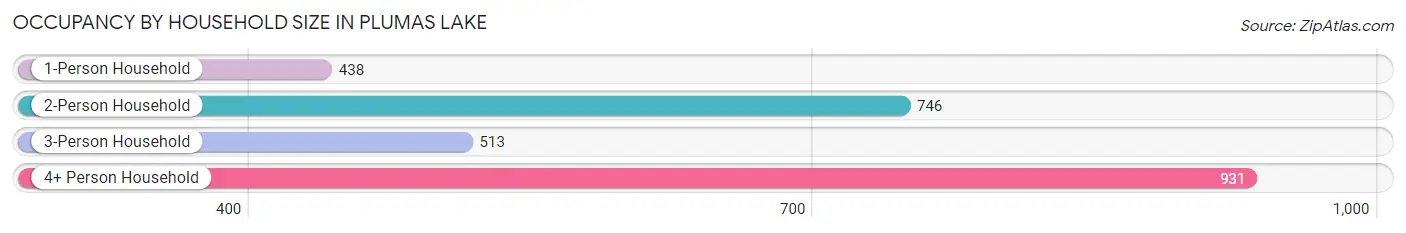
| Household Size | # Housing Units | % Housing Units |
| 1-Person Household | 438 | 16.7% |
| 2-Person Household | 746 | 28.4% |
| 3-Person Household | 513 | 19.5% |
| 4+ Person Household | 931 | 35.4% |
| Total Housing Units | 2,628 | 100.0% |
Occupancy by Ownership by Household Size in Plumas Lake
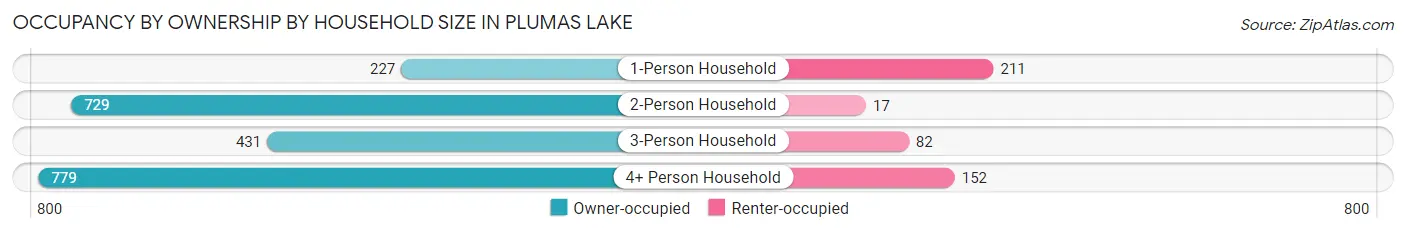
| Household Size | Owner-occupied | Renter-occupied |
| 1-Person Household | 227 (51.8%) | 211 (48.2%) |
| 2-Person Household | 729 (97.7%) | 17 (2.3%) |
| 3-Person Household | 431 (84.0%) | 82 (16.0%) |
| 4+ Person Household | 779 (83.7%) | 152 (16.3%) |
| Total Housing Units | 2,166 (82.4%) | 462 (17.6%) |
Occupancy by Educational Attainment in Plumas Lake
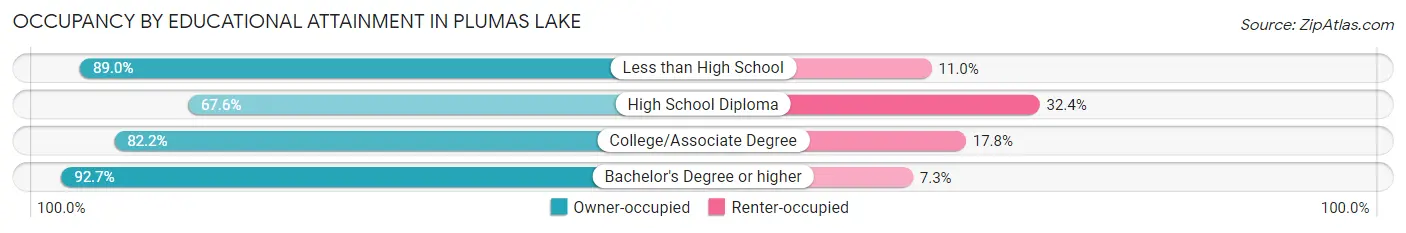
| Household Size | Owner-occupied | Renter-occupied |
| Less than High School | 170 (89.0%) | 21 (11.0%) |
| High School Diploma | 363 (67.6%) | 174 (32.4%) |
| College/Associate Degree | 1,009 (82.2%) | 218 (17.8%) |
| Bachelor's Degree or higher | 624 (92.7%) | 49 (7.3%) |
Occupancy by Age of Householder in Plumas Lake
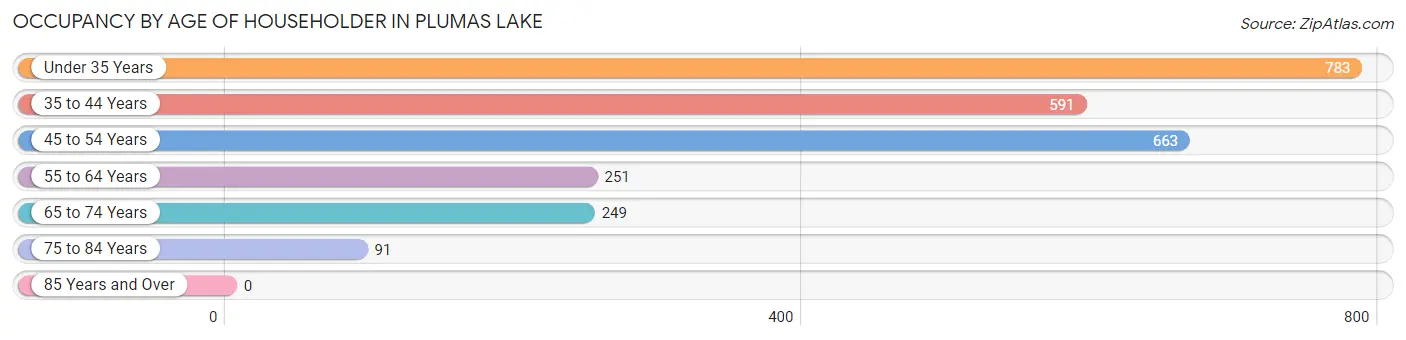
| Age Bracket | # Households | % Households |
| Under 35 Years | 783 | 29.8% |
| 35 to 44 Years | 591 | 22.5% |
| 45 to 54 Years | 663 | 25.2% |
| 55 to 64 Years | 251 | 9.6% |
| 65 to 74 Years | 249 | 9.5% |
| 75 to 84 Years | 91 | 3.5% |
| 85 Years and Over | 0 | 0.0% |
| Total | 2,628 | 100.0% |
Housing Finances in Plumas Lake
Median Income by Occupancy in Plumas Lake
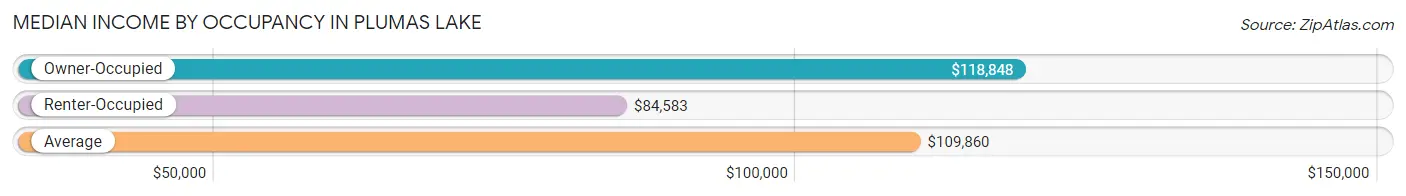
| Occupancy Type | # Households | Median Income |
| Owner-Occupied | 2,166 (82.4%) | $118,848 |
| Renter-Occupied | 462 (17.6%) | $84,583 |
| Average | 2,628 (100.0%) | $109,860 |
Occupancy by Householder Income Bracket in Plumas Lake
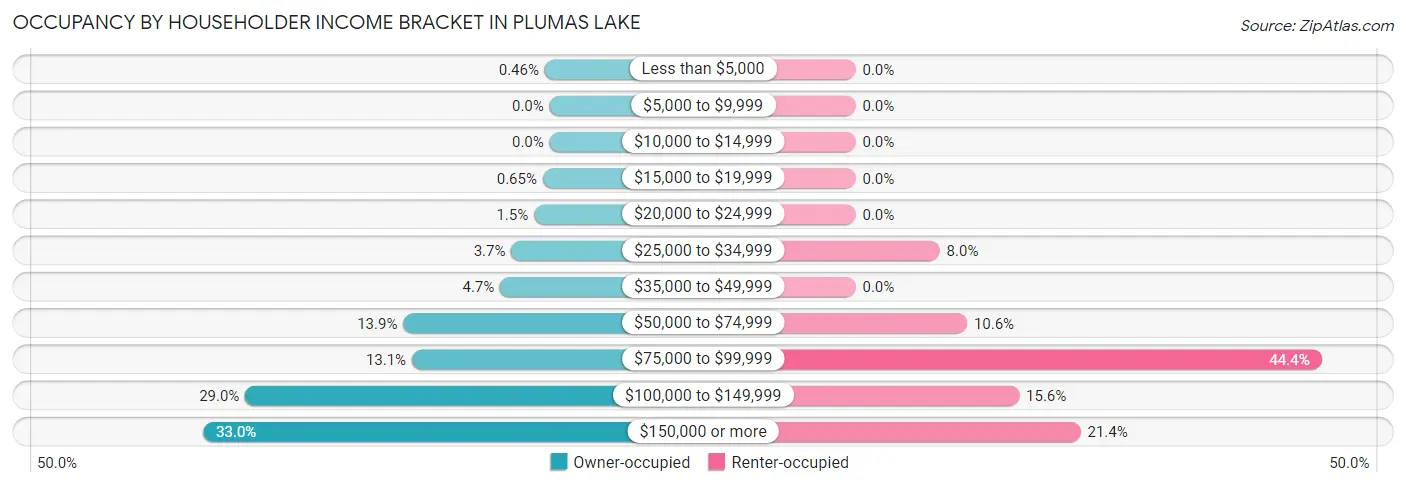
| Income Bracket | Owner-occupied | Renter-occupied |
| Less than $5,000 | 10 (0.5%) | 0 (0.0%) |
| $5,000 to $9,999 | 0 (0.0%) | 0 (0.0%) |
| $10,000 to $14,999 | 0 (0.0%) | 0 (0.0%) |
| $15,000 to $19,999 | 14 (0.6%) | 0 (0.0%) |
| $20,000 to $24,999 | 32 (1.5%) | 0 (0.0%) |
| $25,000 to $34,999 | 79 (3.6%) | 37 (8.0%) |
| $35,000 to $49,999 | 102 (4.7%) | 0 (0.0%) |
| $50,000 to $74,999 | 302 (13.9%) | 49 (10.6%) |
| $75,000 to $99,999 | 284 (13.1%) | 205 (44.4%) |
| $100,000 to $149,999 | 628 (29.0%) | 72 (15.6%) |
| $150,000 or more | 715 (33.0%) | 99 (21.4%) |
| Total | 2,166 (100.0%) | 462 (100.0%) |
Monthly Housing Cost Tiers in Plumas Lake
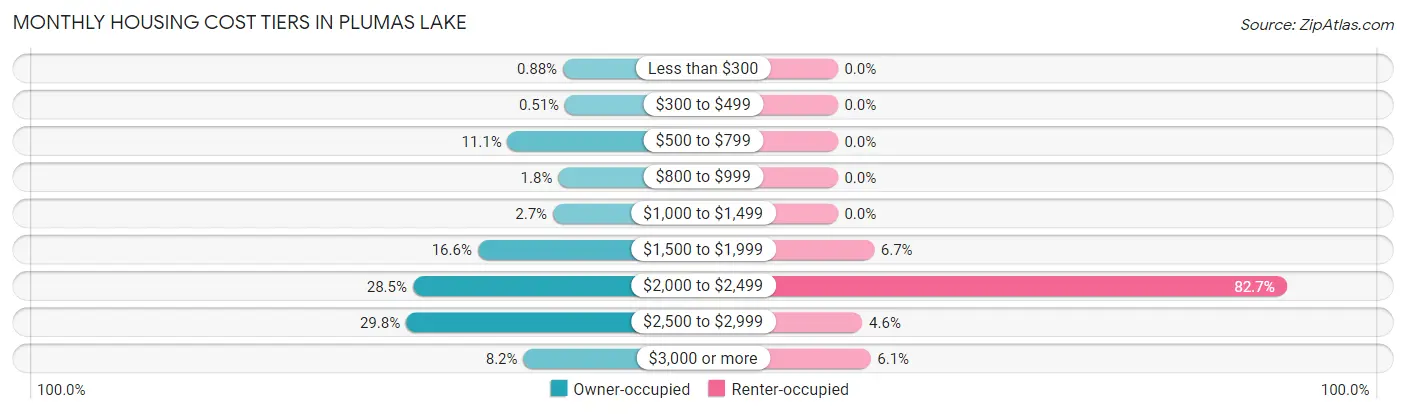
| Monthly Cost | Owner-occupied | Renter-occupied |
| Less than $300 | 19 (0.9%) | 0 (0.0%) |
| $300 to $499 | 11 (0.5%) | 0 (0.0%) |
| $500 to $799 | 240 (11.1%) | 0 (0.0%) |
| $800 to $999 | 38 (1.8%) | 0 (0.0%) |
| $1,000 to $1,499 | 59 (2.7%) | 0 (0.0%) |
| $1,500 to $1,999 | 359 (16.6%) | 31 (6.7%) |
| $2,000 to $2,499 | 618 (28.5%) | 382 (82.7%) |
| $2,500 to $2,999 | 645 (29.8%) | 21 (4.5%) |
| $3,000 or more | 177 (8.2%) | 28 (6.1%) |
| Total | 2,166 (100.0%) | 462 (100.0%) |
Physical Housing Characteristics in Plumas Lake
Housing Structures in Plumas Lake
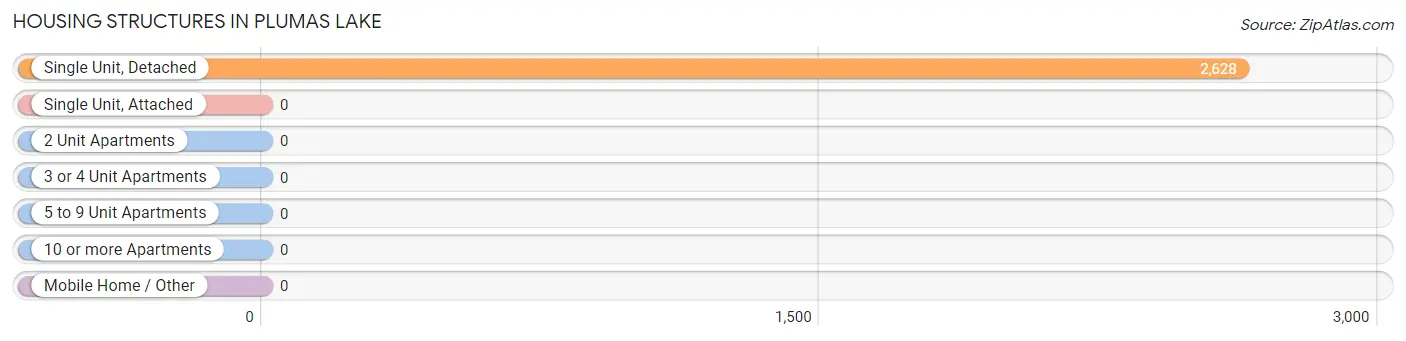
| Structure Type | # Housing Units | % Housing Units |
| Single Unit, Detached | 2,628 | 100.0% |
| Single Unit, Attached | 0 | 0.0% |
| 2 Unit Apartments | 0 | 0.0% |
| 3 or 4 Unit Apartments | 0 | 0.0% |
| 5 to 9 Unit Apartments | 0 | 0.0% |
| 10 or more Apartments | 0 | 0.0% |
| Mobile Home / Other | 0 | 0.0% |
| Total | 2,628 | 100.0% |
Housing Structures by Occupancy in Plumas Lake
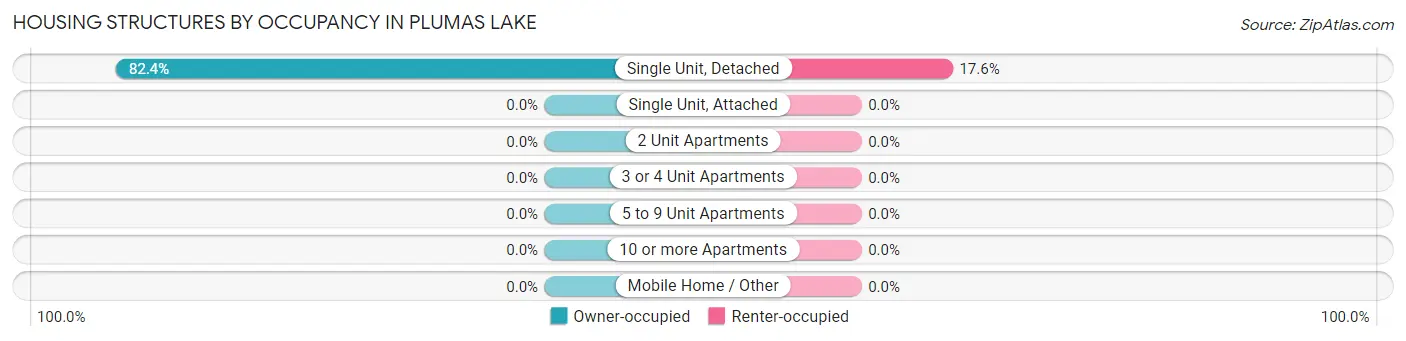
| Structure Type | Owner-occupied | Renter-occupied |
| Single Unit, Detached | 2,166 (82.4%) | 462 (17.6%) |
| Single Unit, Attached | 0 (0.0%) | 0 (0.0%) |
| 2 Unit Apartments | 0 (0.0%) | 0 (0.0%) |
| 3 or 4 Unit Apartments | 0 (0.0%) | 0 (0.0%) |
| 5 to 9 Unit Apartments | 0 (0.0%) | 0 (0.0%) |
| 10 or more Apartments | 0 (0.0%) | 0 (0.0%) |
| Mobile Home / Other | 0 (0.0%) | 0 (0.0%) |
| Total | 2,166 (82.4%) | 462 (17.6%) |
Housing Structures by Number of Rooms in Plumas Lake
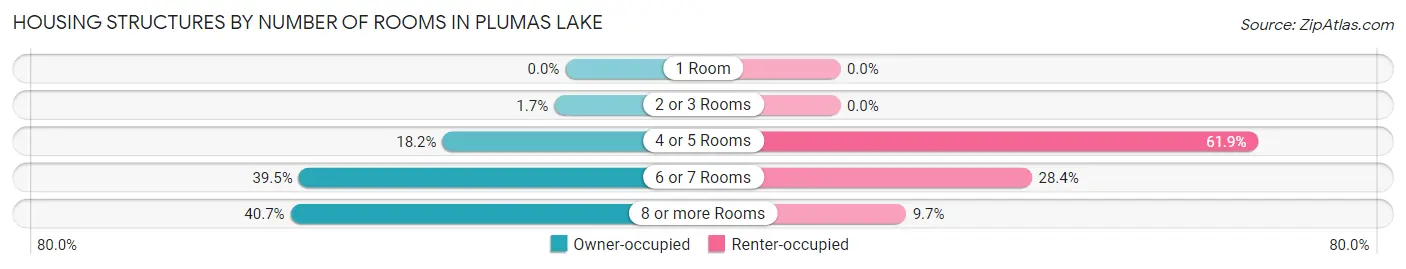
| Number of Rooms | Owner-occupied | Renter-occupied |
| 1 Room | 0 (0.0%) | 0 (0.0%) |
| 2 or 3 Rooms | 36 (1.7%) | 0 (0.0%) |
| 4 or 5 Rooms | 394 (18.2%) | 286 (61.9%) |
| 6 or 7 Rooms | 855 (39.5%) | 131 (28.3%) |
| 8 or more Rooms | 881 (40.7%) | 45 (9.7%) |
| Total | 2,166 (100.0%) | 462 (100.0%) |
Housing Structure by Heating Type in Plumas Lake
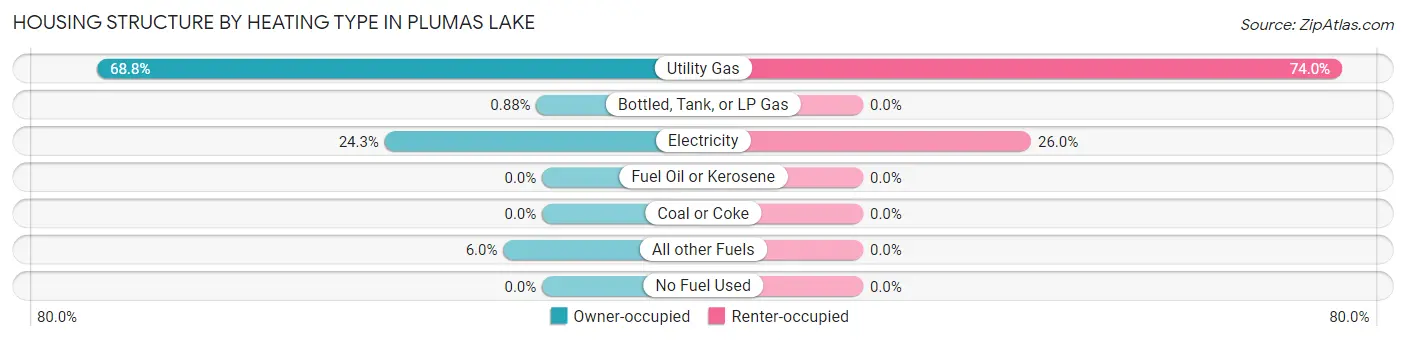
| Heating Type | Owner-occupied | Renter-occupied |
| Utility Gas | 1,490 (68.8%) | 342 (74.0%) |
| Bottled, Tank, or LP Gas | 19 (0.9%) | 0 (0.0%) |
| Electricity | 527 (24.3%) | 120 (26.0%) |
| Fuel Oil or Kerosene | 0 (0.0%) | 0 (0.0%) |
| Coal or Coke | 0 (0.0%) | 0 (0.0%) |
| All other Fuels | 130 (6.0%) | 0 (0.0%) |
| No Fuel Used | 0 (0.0%) | 0 (0.0%) |
| Total | 2,166 (100.0%) | 462 (100.0%) |
Household Vehicle Usage in Plumas Lake
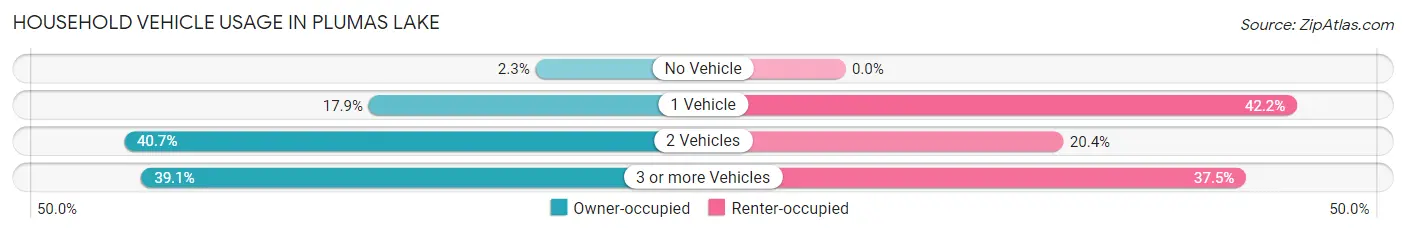
| Vehicles per Household | Owner-occupied | Renter-occupied |
| No Vehicle | 50 (2.3%) | 0 (0.0%) |
| 1 Vehicle | 387 (17.9%) | 195 (42.2%) |
| 2 Vehicles | 882 (40.7%) | 94 (20.3%) |
| 3 or more Vehicles | 847 (39.1%) | 173 (37.4%) |
| Total | 2,166 (100.0%) | 462 (100.0%) |
Real Estate & Mortgages in Plumas Lake
Real Estate and Mortgage Overview in Plumas Lake
| Characteristic | Without Mortgage | With Mortgage |
| Housing Units | 330 | 1,836 |
| Median Property Value | $442,200 | $477,100 |
| Median Household Income | $75,658 | $643 |
| Monthly Housing Costs | $683 | $177 |
| Real Estate Taxes | $4,586 | $0 |
Property Value by Mortgage Status in Plumas Lake
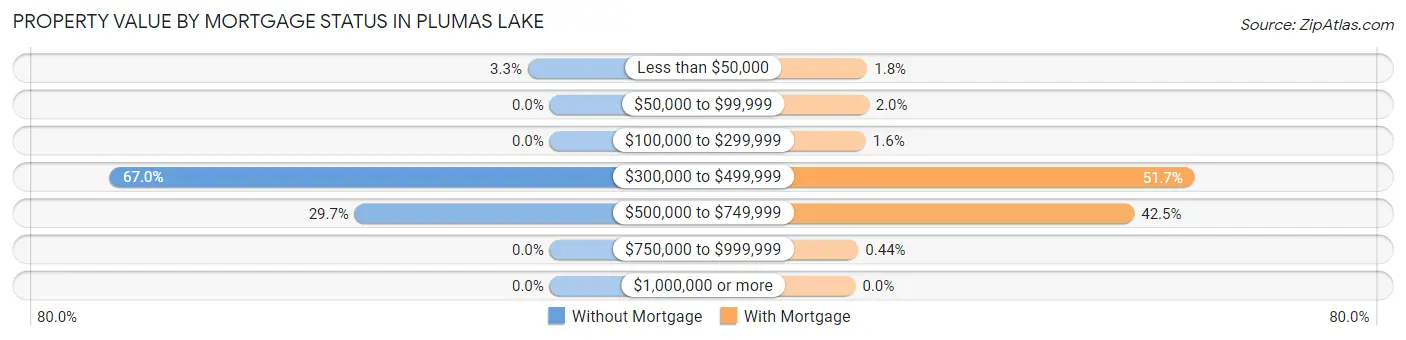
| Property Value | Without Mortgage | With Mortgage |
| Less than $50,000 | 11 (3.3%) | 33 (1.8%) |
| $50,000 to $99,999 | 0 (0.0%) | 37 (2.0%) |
| $100,000 to $299,999 | 0 (0.0%) | 29 (1.6%) |
| $300,000 to $499,999 | 221 (67.0%) | 949 (51.7%) |
| $500,000 to $749,999 | 98 (29.7%) | 780 (42.5%) |
| $750,000 to $999,999 | 0 (0.0%) | 8 (0.4%) |
| $1,000,000 or more | 0 (0.0%) | 0 (0.0%) |
| Total | 330 (100.0%) | 1,836 (100.0%) |
Household Income by Mortgage Status in Plumas Lake
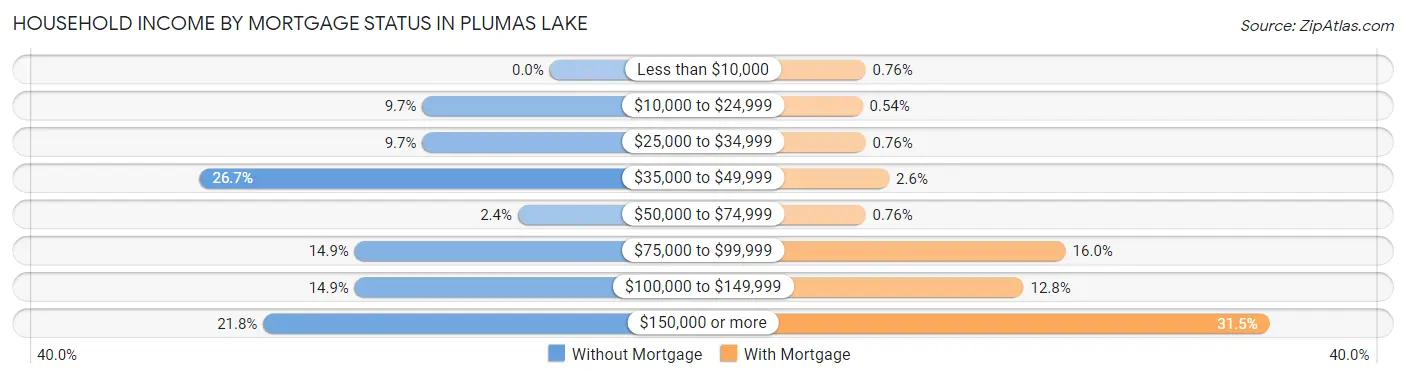
| Household Income | Without Mortgage | With Mortgage |
| Less than $10,000 | 0 (0.0%) | 14 (0.8%) |
| $10,000 to $24,999 | 32 (9.7%) | 10 (0.5%) |
| $25,000 to $34,999 | 32 (9.7%) | 14 (0.8%) |
| $35,000 to $49,999 | 88 (26.7%) | 47 (2.6%) |
| $50,000 to $74,999 | 8 (2.4%) | 14 (0.8%) |
| $75,000 to $99,999 | 49 (14.8%) | 294 (16.0%) |
| $100,000 to $149,999 | 49 (14.8%) | 235 (12.8%) |
| $150,000 or more | 72 (21.8%) | 579 (31.5%) |
| Total | 330 (100.0%) | 1,836 (100.0%) |
Property Value to Household Income Ratio in Plumas Lake
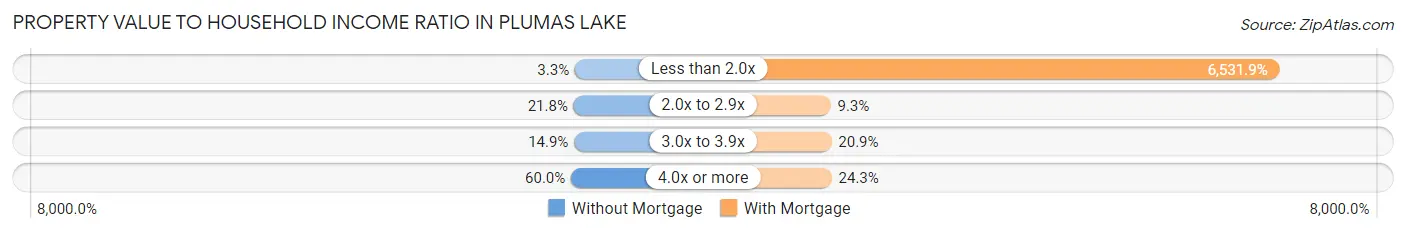
| Value-to-Income Ratio | Without Mortgage | With Mortgage |
| Less than 2.0x | 11 (3.3%) | 119,926 (6,531.9%) |
| 2.0x to 2.9x | 72 (21.8%) | 171 (9.3%) |
| 3.0x to 3.9x | 49 (14.8%) | 384 (20.9%) |
| 4.0x or more | 198 (60.0%) | 446 (24.3%) |
| Total | 330 (100.0%) | 1,836 (100.0%) |
Real Estate Taxes by Mortgage Status in Plumas Lake
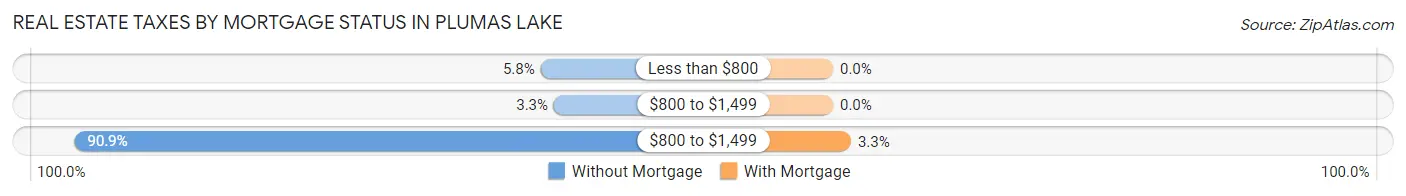
| Property Taxes | Without Mortgage | With Mortgage |
| Less than $800 | 19 (5.8%) | 0 (0.0%) |
| $800 to $1,499 | 11 (3.3%) | 0 (0.0%) |
| $800 to $1,499 | 300 (90.9%) | 60 (3.3%) |
| Total | 330 (100.0%) | 1,836 (100.0%) |
Health & Disability in Plumas Lake
Health Insurance Coverage by Age in Plumas Lake
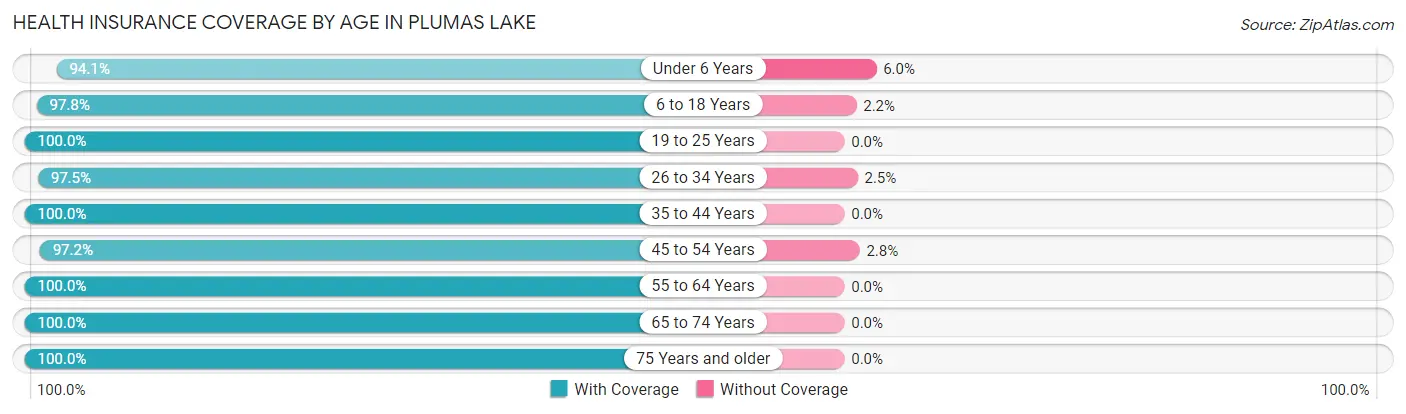
| Age Bracket | With Coverage | Without Coverage |
| Under 6 Years | 1,123 (94.1%) | 71 (5.9%) |
| 6 to 18 Years | 1,707 (97.8%) | 39 (2.2%) |
| 19 to 25 Years | 435 (100.0%) | 0 (0.0%) |
| 26 to 34 Years | 1,146 (97.5%) | 29 (2.5%) |
| 35 to 44 Years | 1,287 (100.0%) | 0 (0.0%) |
| 45 to 54 Years | 1,098 (97.2%) | 32 (2.8%) |
| 55 to 64 Years | 495 (100.0%) | 0 (0.0%) |
| 65 to 74 Years | 406 (100.0%) | 0 (0.0%) |
| 75 Years and older | 121 (100.0%) | 0 (0.0%) |
| Total | 7,818 (97.9%) | 171 (2.1%) |
Health Insurance Coverage by Citizenship Status in Plumas Lake
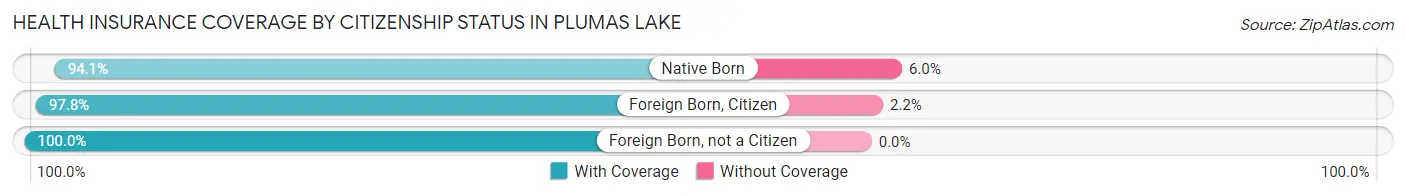
| Citizenship Status | With Coverage | Without Coverage |
| Native Born | 1,123 (94.1%) | 71 (5.9%) |
| Foreign Born, Citizen | 1,707 (97.8%) | 39 (2.2%) |
| Foreign Born, not a Citizen | 435 (100.0%) | 0 (0.0%) |
Health Insurance Coverage by Household Income in Plumas Lake
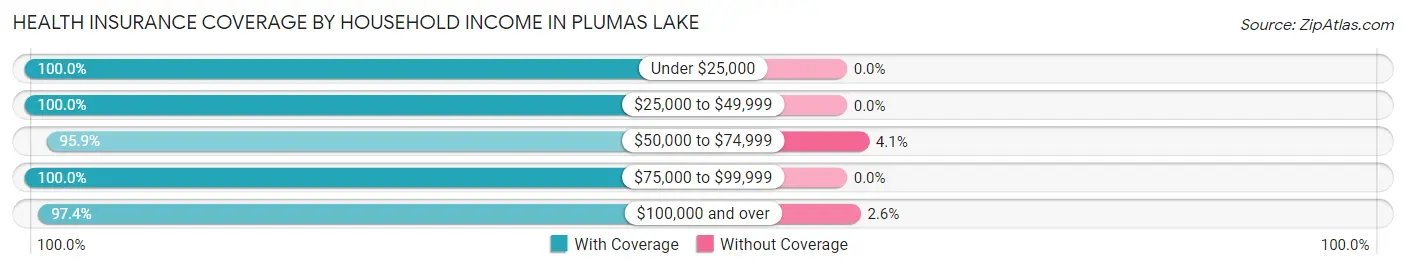
| Household Income | With Coverage | Without Coverage |
| Under $25,000 | 78 (100.0%) | 0 (0.0%) |
| $25,000 to $49,999 | 364 (100.0%) | 0 (0.0%) |
| $50,000 to $74,999 | 903 (95.9%) | 39 (4.1%) |
| $75,000 to $99,999 | 1,424 (100.0%) | 0 (0.0%) |
| $100,000 and over | 5,017 (97.4%) | 132 (2.6%) |
Public vs Private Health Insurance Coverage by Age in Plumas Lake
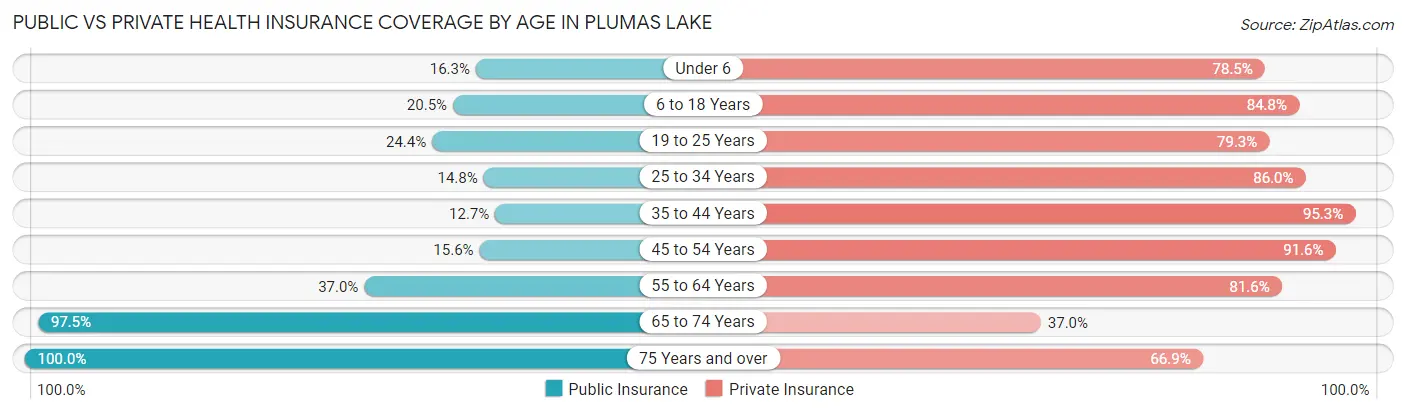
| Age Bracket | Public Insurance | Private Insurance |
| Under 6 | 194 (16.3%) | 937 (78.5%) |
| 6 to 18 Years | 358 (20.5%) | 1,481 (84.8%) |
| 19 to 25 Years | 106 (24.4%) | 345 (79.3%) |
| 25 to 34 Years | 174 (14.8%) | 1,011 (86.0%) |
| 35 to 44 Years | 163 (12.7%) | 1,226 (95.3%) |
| 45 to 54 Years | 176 (15.6%) | 1,035 (91.6%) |
| 55 to 64 Years | 183 (37.0%) | 404 (81.6%) |
| 65 to 74 Years | 396 (97.5%) | 150 (36.9%) |
| 75 Years and over | 121 (100.0%) | 81 (66.9%) |
| Total | 1,871 (23.4%) | 6,670 (83.5%) |
Disability Status by Sex by Age in Plumas Lake
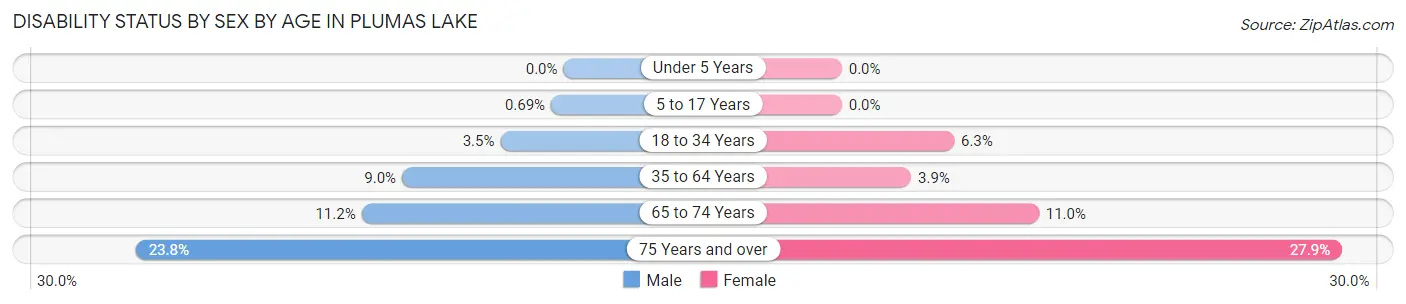
| Age Bracket | Male | Female |
| Under 5 Years | 0 (0.0%) | 0 (0.0%) |
| 5 to 17 Years | 7 (0.7%) | 0 (0.0%) |
| 18 to 34 Years | 30 (3.5%) | 55 (6.2%) |
| 35 to 64 Years | 129 (9.0%) | 57 (3.9%) |
| 65 to 74 Years | 19 (11.2%) | 26 (11.0%) |
| 75 Years and over | 10 (23.8%) | 22 (27.9%) |
Disability Class by Sex by Age in Plumas Lake
Disability Class: Hearing Difficulty
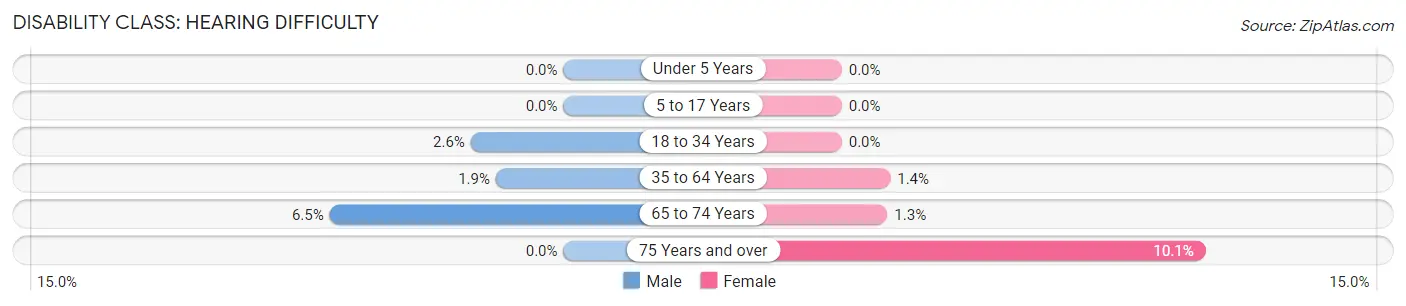
| Age Bracket | Male | Female |
| Under 5 Years | 0 (0.0%) | 0 (0.0%) |
| 5 to 17 Years | 0 (0.0%) | 0 (0.0%) |
| 18 to 34 Years | 22 (2.6%) | 0 (0.0%) |
| 35 to 64 Years | 27 (1.9%) | 20 (1.3%) |
| 65 to 74 Years | 11 (6.5%) | 3 (1.3%) |
| 75 Years and over | 0 (0.0%) | 8 (10.1%) |
Disability Class: Vision Difficulty
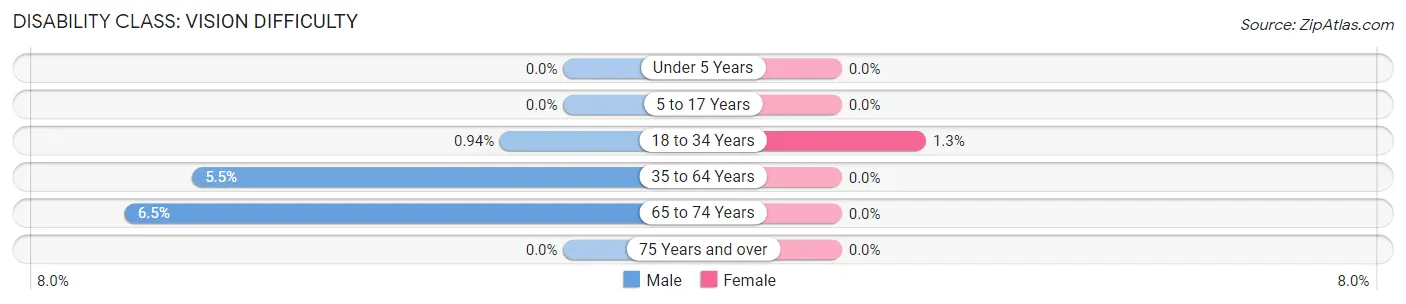
| Age Bracket | Male | Female |
| Under 5 Years | 0 (0.0%) | 0 (0.0%) |
| 5 to 17 Years | 0 (0.0%) | 0 (0.0%) |
| 18 to 34 Years | 8 (0.9%) | 11 (1.3%) |
| 35 to 64 Years | 79 (5.5%) | 0 (0.0%) |
| 65 to 74 Years | 11 (6.5%) | 0 (0.0%) |
| 75 Years and over | 0 (0.0%) | 0 (0.0%) |
Disability Class: Cognitive Difficulty
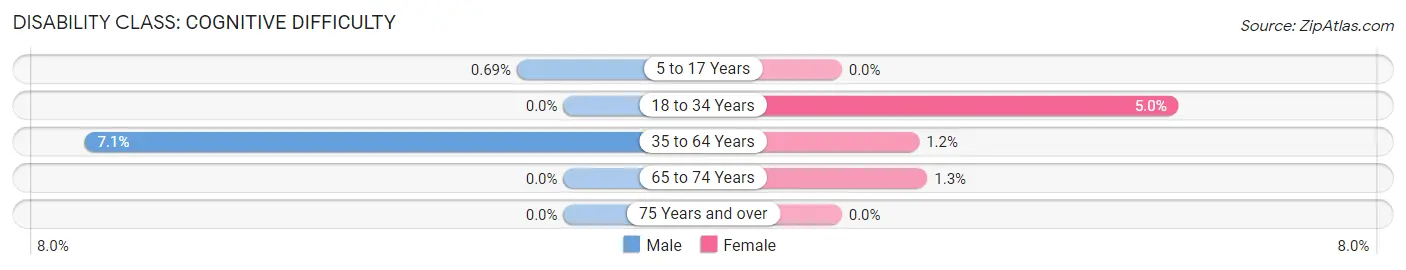
| Age Bracket | Male | Female |
| 5 to 17 Years | 7 (0.7%) | 0 (0.0%) |
| 18 to 34 Years | 0 (0.0%) | 44 (5.0%) |
| 35 to 64 Years | 102 (7.1%) | 17 (1.1%) |
| 65 to 74 Years | 0 (0.0%) | 3 (1.3%) |
| 75 Years and over | 0 (0.0%) | 0 (0.0%) |
Disability Class: Ambulatory Difficulty
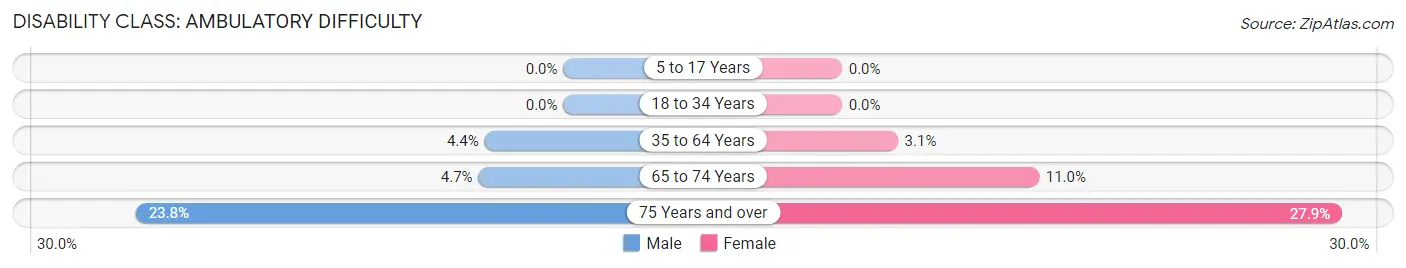
| Age Bracket | Male | Female |
| 5 to 17 Years | 0 (0.0%) | 0 (0.0%) |
| 18 to 34 Years | 0 (0.0%) | 0 (0.0%) |
| 35 to 64 Years | 63 (4.4%) | 46 (3.1%) |
| 65 to 74 Years | 8 (4.7%) | 26 (11.0%) |
| 75 Years and over | 10 (23.8%) | 22 (27.9%) |
Disability Class: Self-Care Difficulty
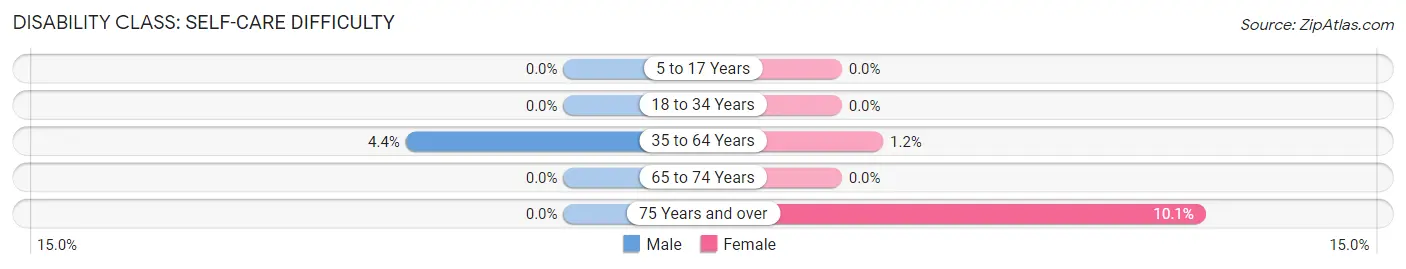
| Age Bracket | Male | Female |
| 5 to 17 Years | 0 (0.0%) | 0 (0.0%) |
| 18 to 34 Years | 0 (0.0%) | 0 (0.0%) |
| 35 to 64 Years | 63 (4.4%) | 17 (1.1%) |
| 65 to 74 Years | 0 (0.0%) | 0 (0.0%) |
| 75 Years and over | 0 (0.0%) | 8 (10.1%) |
Technology Access in Plumas Lake
Computing Device Access in Plumas Lake
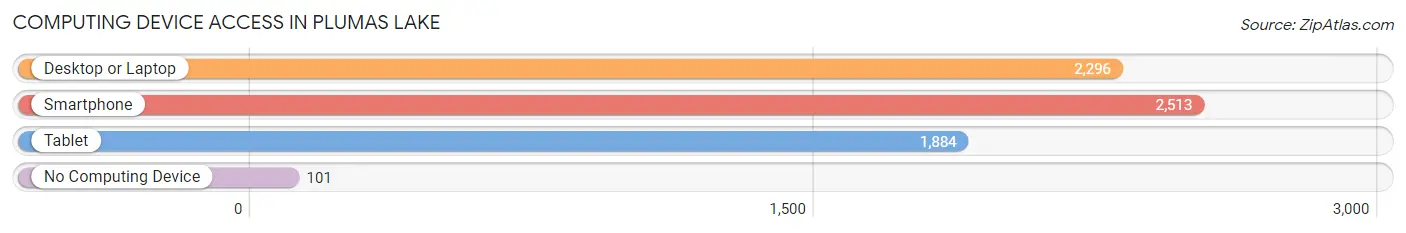
| Device Type | # Households | % Households |
| Desktop or Laptop | 2,296 | 87.4% |
| Smartphone | 2,513 | 95.6% |
| Tablet | 1,884 | 71.7% |
| No Computing Device | 101 | 3.8% |
| Total | 2,628 | 100.0% |
Internet Access in Plumas Lake
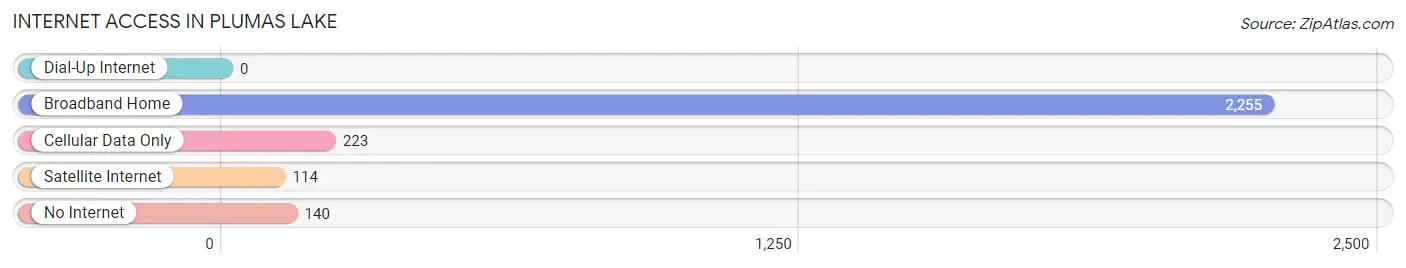
| Internet Type | # Households | % Households |
| Dial-Up Internet | 0 | 0.0% |
| Broadband Home | 2,255 | 85.8% |
| Cellular Data Only | 223 | 8.5% |
| Satellite Internet | 114 | 4.3% |
| No Internet | 140 | 5.3% |
| Total | 2,628 | 100.0% |
Plumas Lake Summary
Plumas Lake is a small town located in Yuba County, California, United States. It is situated in the Sacramento Valley, approximately 20 miles north of the city of Marysville. The population of Plumas Lake was 6,945 at the 2010 census, up from 5,919 at the 2000 census.
History
The area that is now Plumas Lake was originally inhabited by the Maidu and Konkow Native American tribes. The first European settlers arrived in the area in the 1850s, and the town was officially founded in 1856. The town was named after the nearby Plumas Lake, which was named after the Plumas River.
The town grew slowly over the years, and by the early 1900s, it had become a popular destination for duck hunters. In the 1950s, the town began to experience rapid growth due to the construction of the nearby Beale Air Force Base. The base brought many new jobs to the area, and the population of Plumas Lake increased significantly.
Geography
Plumas Lake is located at 39°7′17″N 121°35′17″W (39.1214, -121.5881). It is situated in the Sacramento Valley, approximately 20 miles north of the city of Marysville. The town is surrounded by agricultural land, and the nearby Plumas Lake is a popular destination for fishing and boating.
The climate in Plumas Lake is hot and dry in the summer, and mild and wet in the winter. The average annual temperature is 61°F (16°C), and the average annual precipitation is 18.5 inches (470 mm).
Economy
The economy of Plumas Lake is largely based on agriculture. The town is surrounded by agricultural land, and the nearby Beale Air Force Base is a major employer in the area. Other major employers include the Plumas Lake Elementary School District, the Plumas Lake Fire Department, and the Plumas Lake Medical Center.
Demographics
As of the 2010 census, the population of Plumas Lake was 6,945. The racial makeup of the town was 73.3% White, 0.7% African American, 1.2% Native American, 0.7% Asian, 0.1% Pacific Islander, 20.2% from other races, and 3.9% from two or more races. Hispanic or Latino of any race were 33.2% of the population.
The median household income in Plumas Lake was $50,945, and the median family income was $58,906. The per capita income was $20,945. About 16.2% of the population was below the poverty line.
Common Questions
What is the Total Population of Plumas Lake?
Total Population of Plumas Lake is 8,301.
What is the Total Male Population of Plumas Lake?
Total Male Population of Plumas Lake is 4,235.
What is the Total Female Population of Plumas Lake?
Total Female Population of Plumas Lake is 4,066.
What is the Ratio of Males per 100 Females in Plumas Lake?
There are 104.16 Males per 100 Females in Plumas Lake.
What is the Ratio of Females per 100 Males in Plumas Lake?
There are 96.01 Females per 100 Males in Plumas Lake.
What is the Median Population Age in Plumas Lake?
Median Population Age in Plumas Lake is 31.1 Years.
What is the Average Family Size in Plumas Lake
Average Family Size in Plumas Lake is 3.5 People.
What is the Average Household Size in Plumas Lake
Average Household Size in Plumas Lake is 3.1 People.
What is Per Capita Income in Plumas Lake?
Per Capita income in Plumas Lake is $41,917.
What is the Median Family Income in Plumas Lake?
Median Family Income in Plumas Lake is $117,726.
What is the Median Household income in Plumas Lake?
Median Household Income in Plumas Lake is $109,860.
What is Income or Wage Gap in Plumas Lake?
Income or Wage Gap in Plumas Lake is 32.4%.
Women in Plumas Lake earn 67.6 cents for every dollar earned by a man.
What is Inequality or Gini Index in Plumas Lake?
Inequality or Gini Index in Plumas Lake is 0.34.
How Large is the Labor Force in Plumas Lake?
There are 4,241 People in the Labor Forcein in Plumas Lake.
What is the Percentage of People in the Labor Force in Plumas Lake?
74.2% of People are in the Labor Force in Plumas Lake.
What is the Unemployment Rate in Plumas Lake?
Unemployment Rate in Plumas Lake is 5.4%.