Plumas Eureka, CA
Plumas Eureka Map
Plumas Eureka Overview
444
TOTAL POPULATION
211
MALE POPULATION
233
FEMALE POPULATION
90.56
MALES / 100 FEMALES
110.43
FEMALES / 100 MALES
65.2
MEDIAN AGE
2.4
AVG FAMILY SIZE
2.0
AVG HOUSEHOLD SIZE
$63,073
PER CAPITA INCOME
$111,667
AVG FAMILY INCOME
$86,250
AVG HOUSEHOLD INCOME
0.43
INEQUALITY / GINI INDEX
152
LABOR FORCE [ PEOPLE ]
38.0%
PERCENT IN LABOR FORCE
5.9%
UNEMPLOYMENT RATE
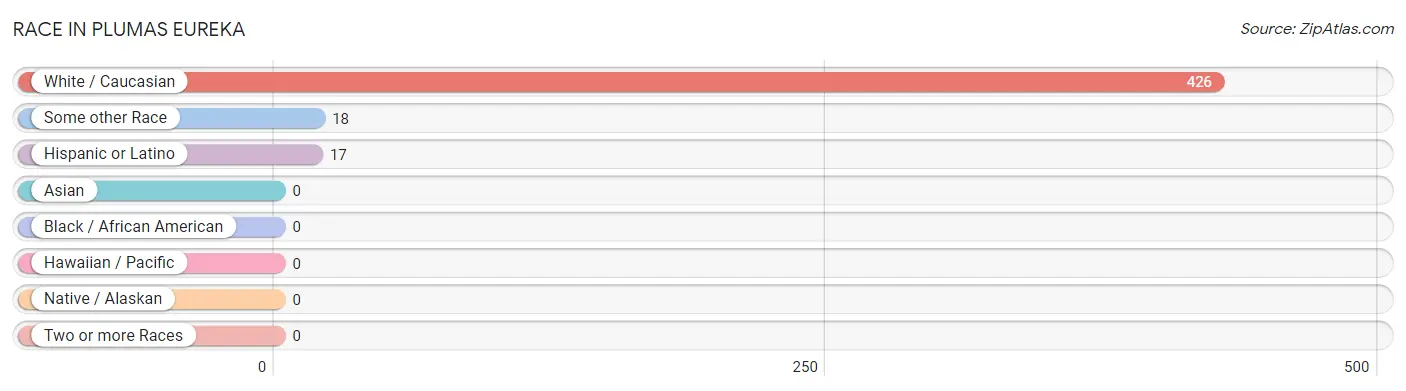
Race in Plumas Eureka
The most populous races in Plumas Eureka are White / Caucasian (426 | 96.0%), Some other Race (18 | 4.1%), and Hispanic or Latino (17 | 3.8%).
| Race | # Population | % Population |
| Asian | 0 | 0.0% |
| Black / African American | 0 | 0.0% |
| Hawaiian / Pacific | 0 | 0.0% |
| Hispanic or Latino | 17 | 3.8% |
| Native / Alaskan | 0 | 0.0% |
| White / Caucasian | 426 | 96.0% |
| Two or more Races | 0 | 0.0% |
| Some other Race | 18 | 4.1% |
| Total | 444 | 100.0% |
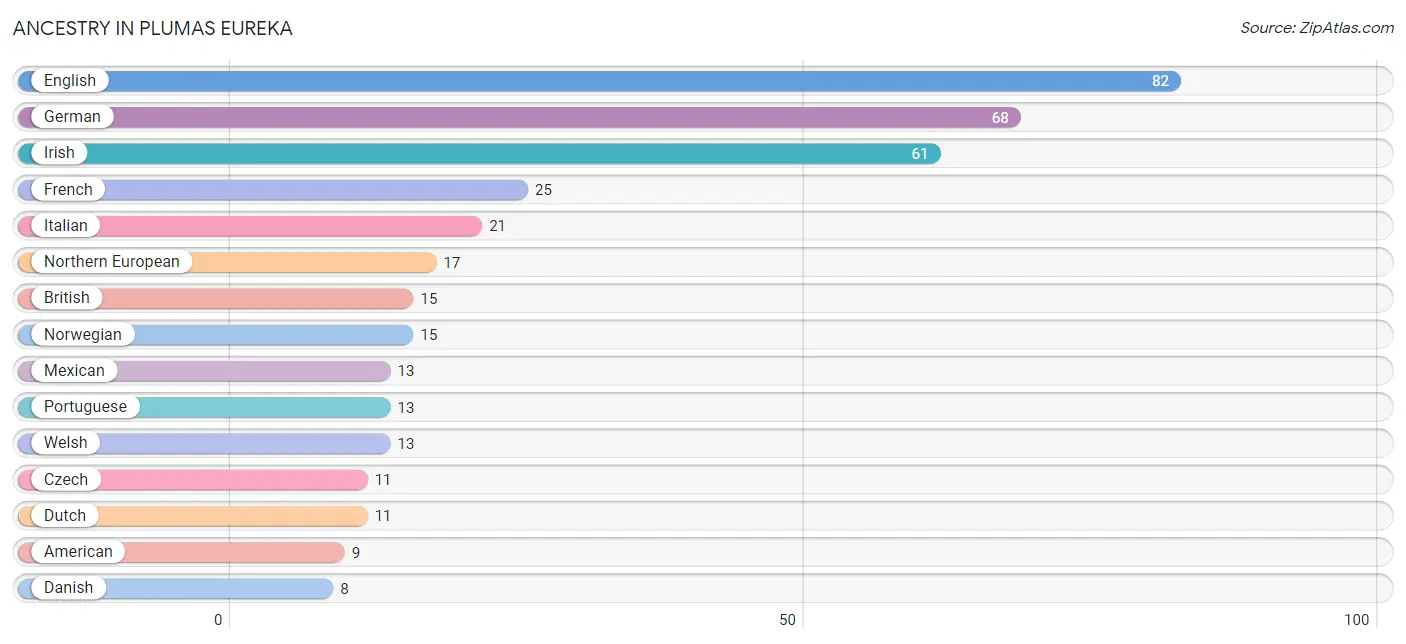
Ancestry in Plumas Eureka
The most populous ancestries reported in Plumas Eureka are English (82 | 18.5%), German (68 | 15.3%), Irish (61 | 13.7%), French (25 | 5.6%), and Italian (21 | 4.7%), together accounting for 57.9% of all Plumas Eureka residents.
| Ancestry | # Population | % Population |
| American | 9 | 2.0% |
| British | 15 | 3.4% |
| Czech | 11 | 2.5% |
| Danish | 8 | 1.8% |
| Dutch | 11 | 2.5% |
| English | 82 | 18.5% |
| European | 3 | 0.7% |
| French | 25 | 5.6% |
| French Canadian | 2 | 0.4% |
| German | 68 | 15.3% |
| Irish | 61 | 13.7% |
| Italian | 21 | 4.7% |
| Mexican | 13 | 2.9% |
| Northern European | 17 | 3.8% |
| Norwegian | 15 | 3.4% |
| Peruvian | 4 | 0.9% |
| Portuguese | 13 | 2.9% |
| Scottish | 7 | 1.6% |
| Slovene | 3 | 0.7% |
| South American | 4 | 0.9% |
| Swedish | 4 | 0.9% |
| Swiss | 4 | 0.9% |
| Welsh | 13 | 2.9% | View All 23 Rows |
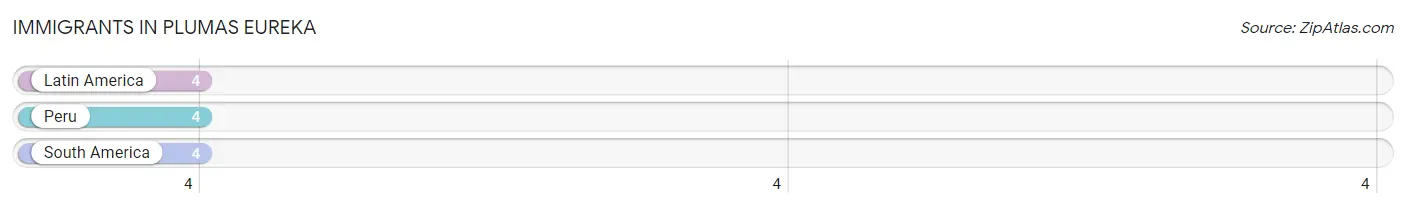
Immigrants in Plumas Eureka
The most numerous immigrant groups reported in Plumas Eureka came from Latin America (4 | 0.9%), Peru (4 | 0.9%), and South America (4 | 0.9%), together accounting for 2.7% of all Plumas Eureka residents.
| Immigration Origin | # Population | % Population |
| Latin America | 4 | 0.9% |
| Peru | 4 | 0.9% |
| South America | 4 | 0.9% | View All 3 Rows |
Sex and Age in Plumas Eureka
Sex and Age in Plumas Eureka
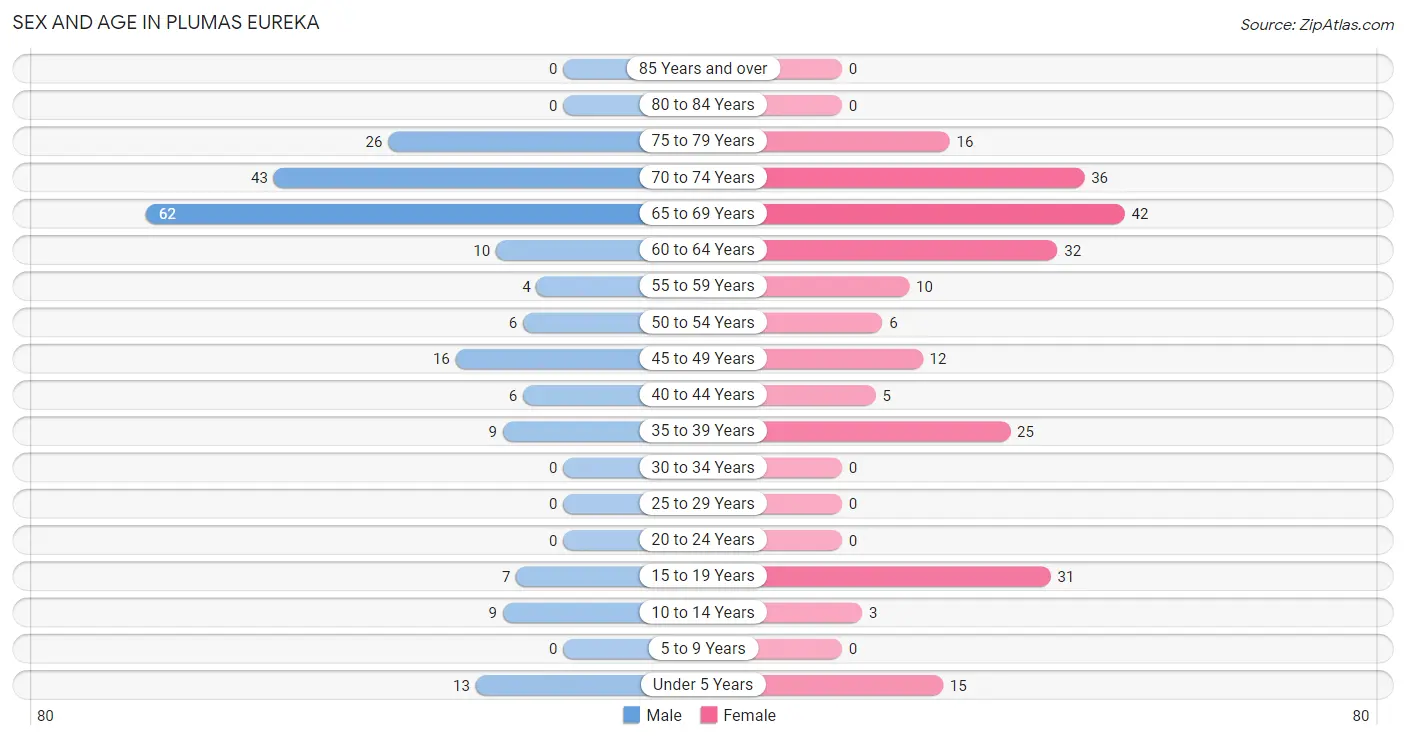
The most populous age groups in Plumas Eureka are 65 to 69 Years (62 | 29.4%) for men and 65 to 69 Years (42 | 18.0%) for women.
| Age Bracket | Male | Female |
| Under 5 Years | 13 (6.2%) | 15 (6.4%) |
| 5 to 9 Years | 0 (0.0%) | 0 (0.0%) |
| 10 to 14 Years | 9 (4.3%) | 3 (1.3%) |
| 15 to 19 Years | 7 (3.3%) | 31 (13.3%) |
| 20 to 24 Years | 0 (0.0%) | 0 (0.0%) |
| 25 to 29 Years | 0 (0.0%) | 0 (0.0%) |
| 30 to 34 Years | 0 (0.0%) | 0 (0.0%) |
| 35 to 39 Years | 9 (4.3%) | 25 (10.7%) |
| 40 to 44 Years | 6 (2.8%) | 5 (2.1%) |
| 45 to 49 Years | 16 (7.6%) | 12 (5.1%) |
| 50 to 54 Years | 6 (2.8%) | 6 (2.6%) |
| 55 to 59 Years | 4 (1.9%) | 10 (4.3%) |
| 60 to 64 Years | 10 (4.7%) | 32 (13.7%) |
| 65 to 69 Years | 62 (29.4%) | 42 (18.0%) |
| 70 to 74 Years | 43 (20.4%) | 36 (15.4%) |
| 75 to 79 Years | 26 (12.3%) | 16 (6.9%) |
| 80 to 84 Years | 0 (0.0%) | 0 (0.0%) |
| 85 Years and over | 0 (0.0%) | 0 (0.0%) |
| Total | 211 (100.0%) | 233 (100.0%) |
Families and Households in Plumas Eureka
Median Family Size in Plumas Eureka
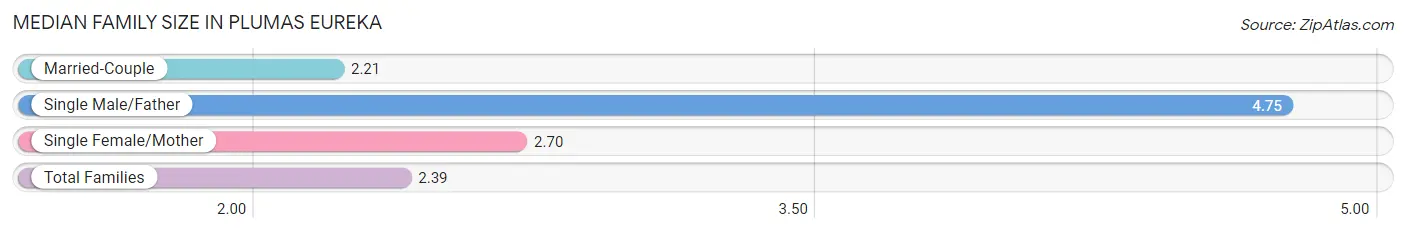
The median family size in Plumas Eureka is 2.39 persons per family, with single male/father families (4 | 3.1%) accounting for the largest median family size of 4.75 persons per family. On the other hand, married-couple families (99 | 76.1%) represent the smallest median family size with 2.21 persons per family.
| Family Type | # Families | Family Size |
| Married-Couple | 99 (76.1%) | 2.21 |
| Single Male/Father | 4 (3.1%) | 4.75 |
| Single Female/Mother | 27 (20.8%) | 2.70 |
| Total Families | 130 (100.0%) | 2.39 |
Median Household Size in Plumas Eureka
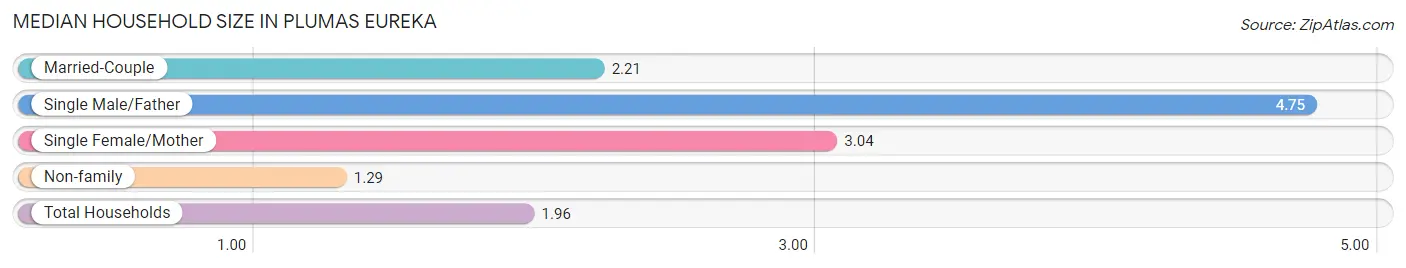
The median household size in Plumas Eureka is 1.96 persons per household, with single male/father households (4 | 1.8%) accounting for the largest median household size of 4.75 persons per household. non-family households (96 | 42.5%) represent the smallest median household size with 1.29 persons per household.
| Household Type | # Households | Household Size |
| Married-Couple | 99 (43.8%) | 2.21 |
| Single Male/Father | 4 (1.8%) | 4.75 |
| Single Female/Mother | 27 (11.9%) | 3.04 |
| Non-family | 96 (42.5%) | 1.29 |
| Total Households | 226 (100.0%) | 1.96 |
Household Size by Marriage Status in Plumas Eureka
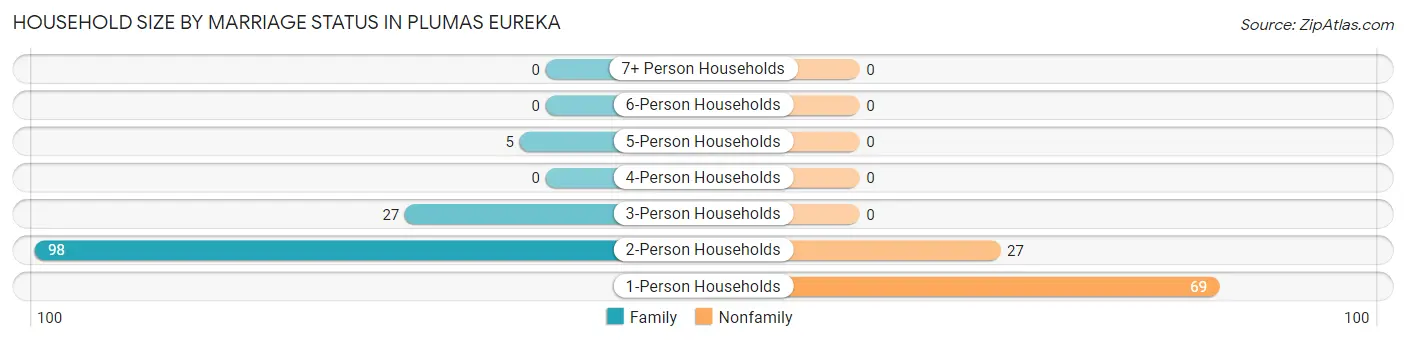
Out of a total of 226 households in Plumas Eureka, 130 (57.5%) are family households, while 96 (42.5%) are nonfamily households. The most numerous type of family households are 2-person households, comprising 98, and the most common type of nonfamily households are 1-person households, comprising 69.
| Household Size | Family Households | Nonfamily Households |
| 1-Person Households | - | 69 (30.5%) |
| 2-Person Households | 98 (43.4%) | 27 (11.9%) |
| 3-Person Households | 27 (11.9%) | 0 (0.0%) |
| 4-Person Households | 0 (0.0%) | 0 (0.0%) |
| 5-Person Households | 5 (2.2%) | 0 (0.0%) |
| 6-Person Households | 0 (0.0%) | 0 (0.0%) |
| 7+ Person Households | 0 (0.0%) | 0 (0.0%) |
| Total | 130 (57.5%) | 96 (42.5%) |
Female Fertility in Plumas Eureka
Fertility by Age in Plumas Eureka
Average fertility rate in Plumas Eureka is 137.0 births per 1,000 women. Women in the age bracket of 35 to 50 years have the highest fertility rate with 238.0 births per 1,000 women. Women in the age bracket of 35 to 50 years acount for 100.0% of all women with births.
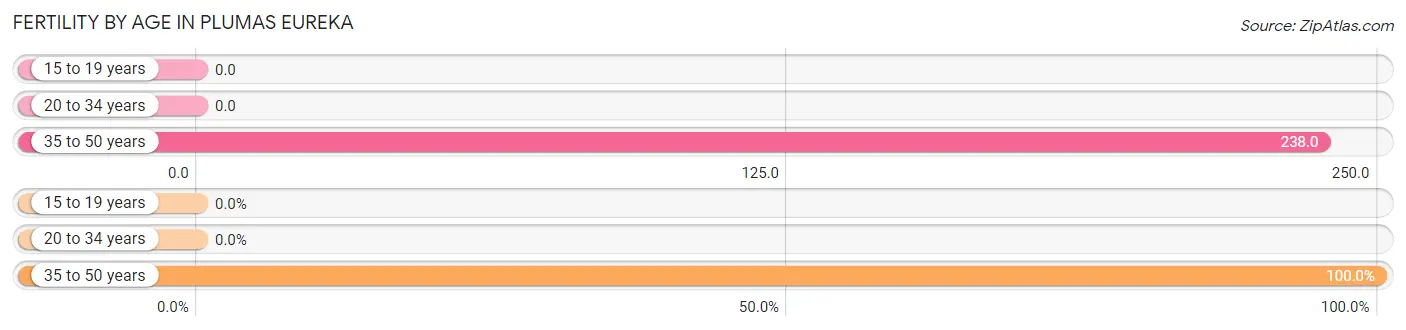
| Age Bracket | Women with Births | Births / 1,000 Women |
| 15 to 19 years | 0 (0.0%) | 0.0 |
| 20 to 34 years | 0 (0.0%) | 0.0 |
| 35 to 50 years | 10 (100.0%) | 238.0 |
| Total | 10 (100.0%) | 137.0 |
Fertility by Age by Marriage Status in Plumas Eureka
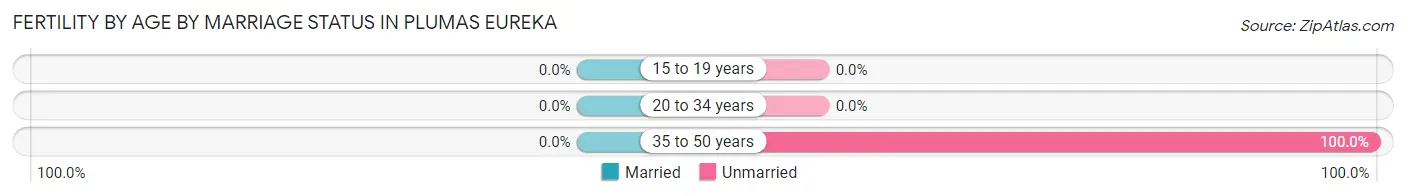
| Age Bracket | Married | Unmarried |
| 15 to 19 years | 0 (0.0%) | 0 (0.0%) |
| 20 to 34 years | 0 (0.0%) | 0 (0.0%) |
| 35 to 50 years | 0 (0.0%) | 10 (100.0%) |
| Total | 0 (0.0%) | 10 (100.0%) |
Fertility by Education in Plumas Eureka
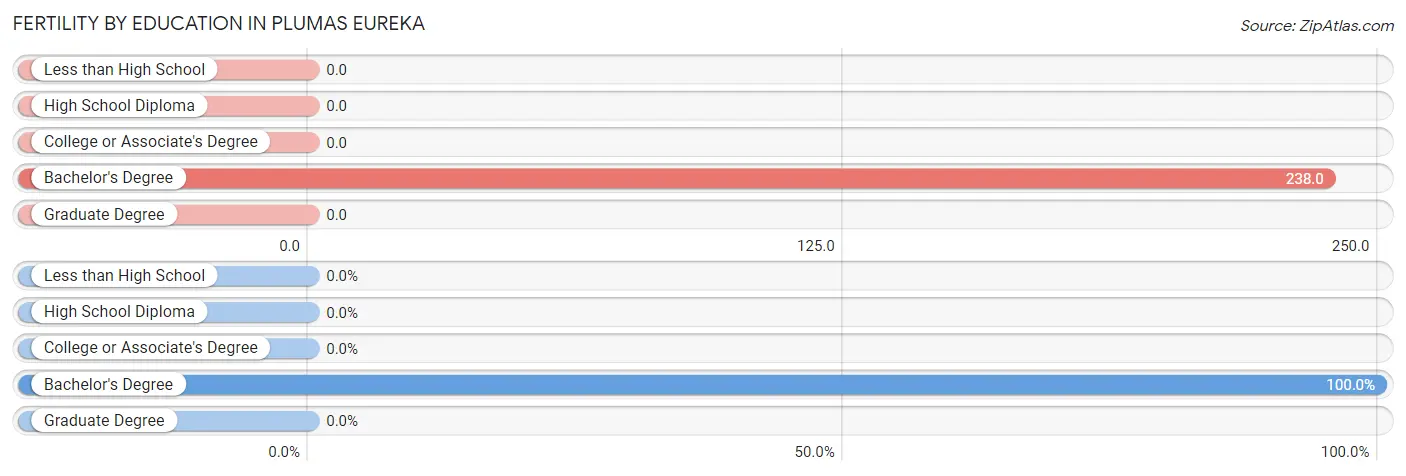
| Educational Attainment | Women with Births | Births / 1,000 Women |
| Less than High School | 0 (0.0%) | 0.0 |
| High School Diploma | 0 (0.0%) | 0.0 |
| College or Associate's Degree | 0 (0.0%) | 0.0 |
| Bachelor's Degree | 10 (100.0%) | 238.0 |
| Graduate Degree | 0 (0.0%) | 0.0 |
| Total | 10 (100.0%) | 137.0 |
Fertility by Education by Marriage Status in Plumas Eureka
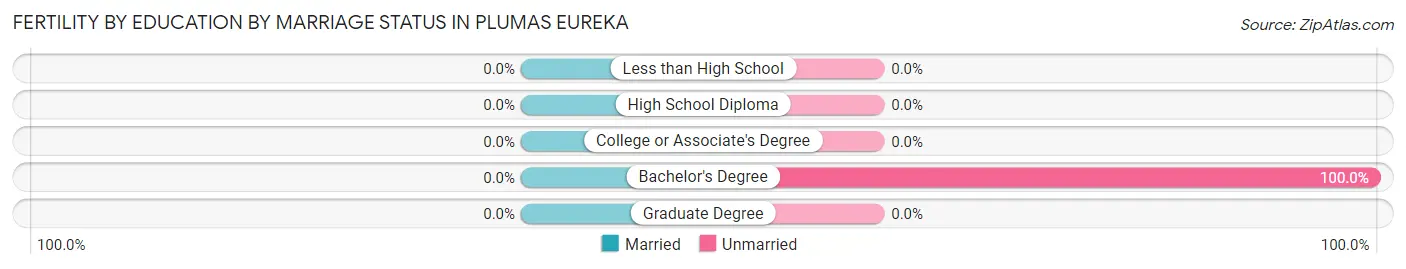
| Educational Attainment | Married | Unmarried |
| Less than High School | 0 (0.0%) | 0 (0.0%) |
| High School Diploma | 0 (0.0%) | 0 (0.0%) |
| College or Associate's Degree | 0 (0.0%) | 0 (0.0%) |
| Bachelor's Degree | 0 (0.0%) | 10 (100.0%) |
| Graduate Degree | 0 (0.0%) | 0 (0.0%) |
| Total | 0 (0.0%) | 10 (100.0%) |
Income in Plumas Eureka
Income Overview in Plumas Eureka
Per Capita Income in Plumas Eureka is $63,073, while median incomes of families and households are $111,667 and $86,250 respectively.
| Characteristic | Number | Measure |
| Per Capita Income | 444 | $63,073 |
| Median Family Income | 130 | $111,667 |
| Mean Family Income | 130 | $152,101 |
| Median Household Income | 226 | $86,250 |
| Mean Household Income | 226 | $121,241 |
| Income Deficit | 130 | $0 |
| Wage / Income Gap (%) | 444 | 0.00% |
| Wage / Income Gap ($) | 444 | 100.00¢ per $1 |
| Gini / Inequality Index | 444 | 0.43 |
Earnings by Sex in Plumas Eureka
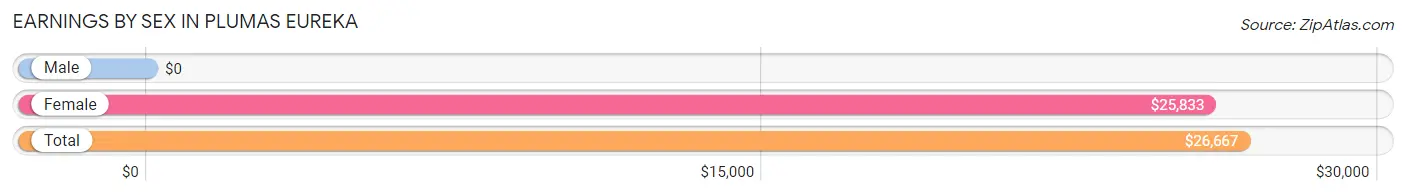
| Sex | Number | Average Earnings |
| Male | 86 (46.2%) | $0 |
| Female | 100 (53.8%) | $25,833 |
| Total | 186 (100.0%) | $26,667 |
Earnings by Sex by Income Bracket in Plumas Eureka
The most common earnings brackets in Plumas Eureka are $100,000+ for men (25 | 29.1%) and $17,500 to $19,999 for women (16 | 16.0%).
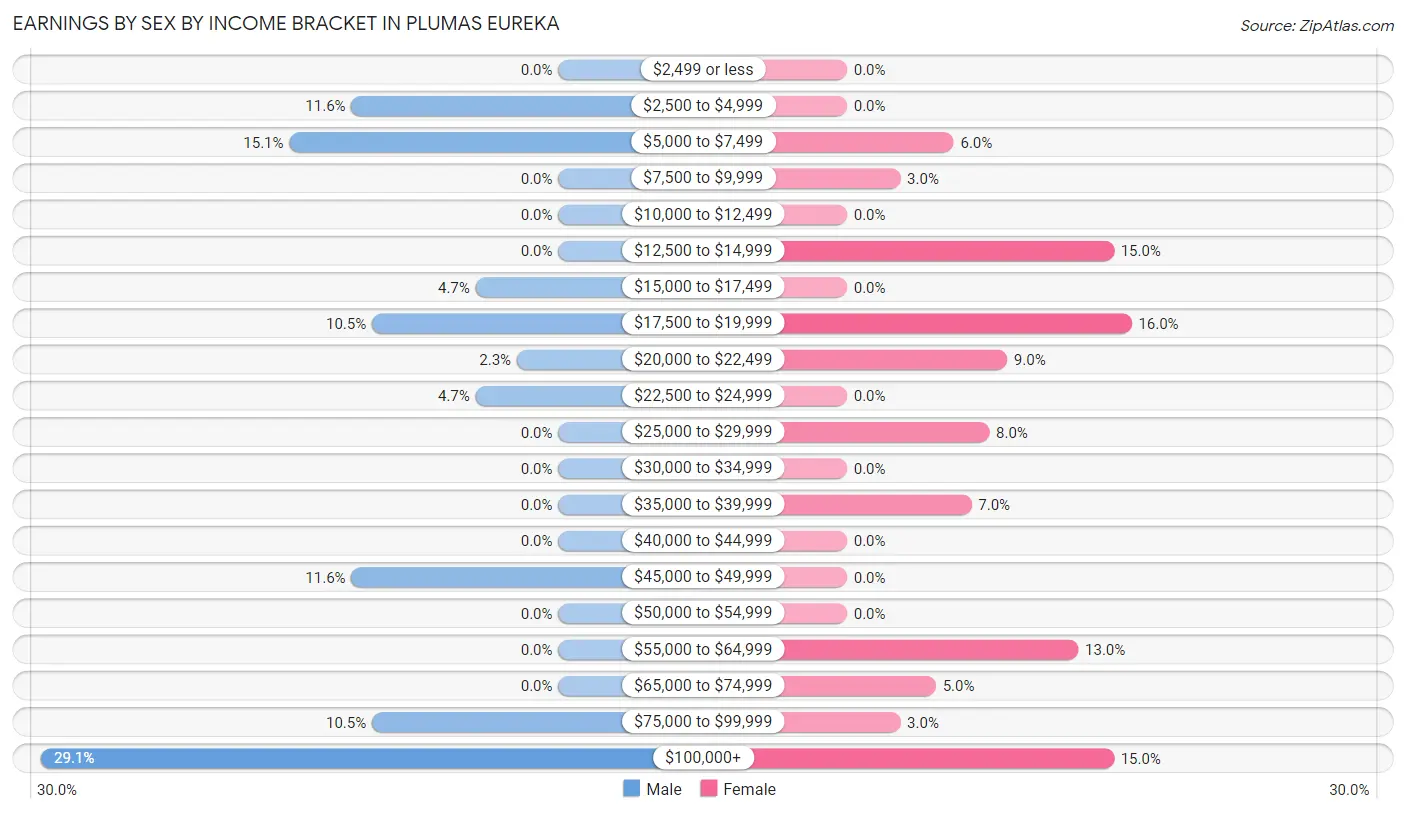
| Income | Male | Female |
| $2,499 or less | 0 (0.0%) | 0 (0.0%) |
| $2,500 to $4,999 | 10 (11.6%) | 0 (0.0%) |
| $5,000 to $7,499 | 13 (15.1%) | 6 (6.0%) |
| $7,500 to $9,999 | 0 (0.0%) | 3 (3.0%) |
| $10,000 to $12,499 | 0 (0.0%) | 0 (0.0%) |
| $12,500 to $14,999 | 0 (0.0%) | 15 (15.0%) |
| $15,000 to $17,499 | 4 (4.6%) | 0 (0.0%) |
| $17,500 to $19,999 | 9 (10.5%) | 16 (16.0%) |
| $20,000 to $22,499 | 2 (2.3%) | 9 (9.0%) |
| $22,500 to $24,999 | 4 (4.6%) | 0 (0.0%) |
| $25,000 to $29,999 | 0 (0.0%) | 8 (8.0%) |
| $30,000 to $34,999 | 0 (0.0%) | 0 (0.0%) |
| $35,000 to $39,999 | 0 (0.0%) | 7 (7.0%) |
| $40,000 to $44,999 | 0 (0.0%) | 0 (0.0%) |
| $45,000 to $49,999 | 10 (11.6%) | 0 (0.0%) |
| $50,000 to $54,999 | 0 (0.0%) | 0 (0.0%) |
| $55,000 to $64,999 | 0 (0.0%) | 13 (13.0%) |
| $65,000 to $74,999 | 0 (0.0%) | 5 (5.0%) |
| $75,000 to $99,999 | 9 (10.5%) | 3 (3.0%) |
| $100,000+ | 25 (29.1%) | 15 (15.0%) |
| Total | 86 (100.0%) | 100 (100.0%) |
Earnings by Sex by Educational Attainment in Plumas Eureka
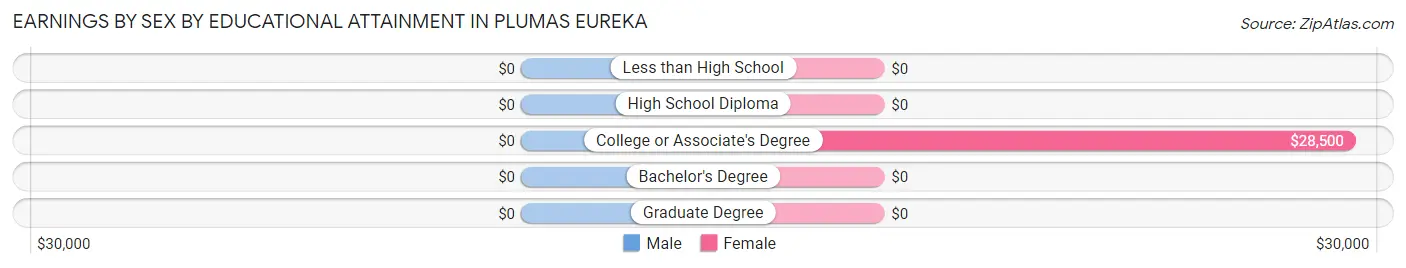
| Educational Attainment | Male Income | Female Income |
| Less than High School | - | - |
| High School Diploma | - | - |
| College or Associate's Degree | - | - |
| Bachelor's Degree | - | - |
| Graduate Degree | - | - |
| Total | - | - |
Family Income in Plumas Eureka
Family Income Brackets in Plumas Eureka
According to the Plumas Eureka family income data, there are 28 families falling into the $150,000 to $199,999 income range, which is the most common income bracket and makes up 21.5% of all families.
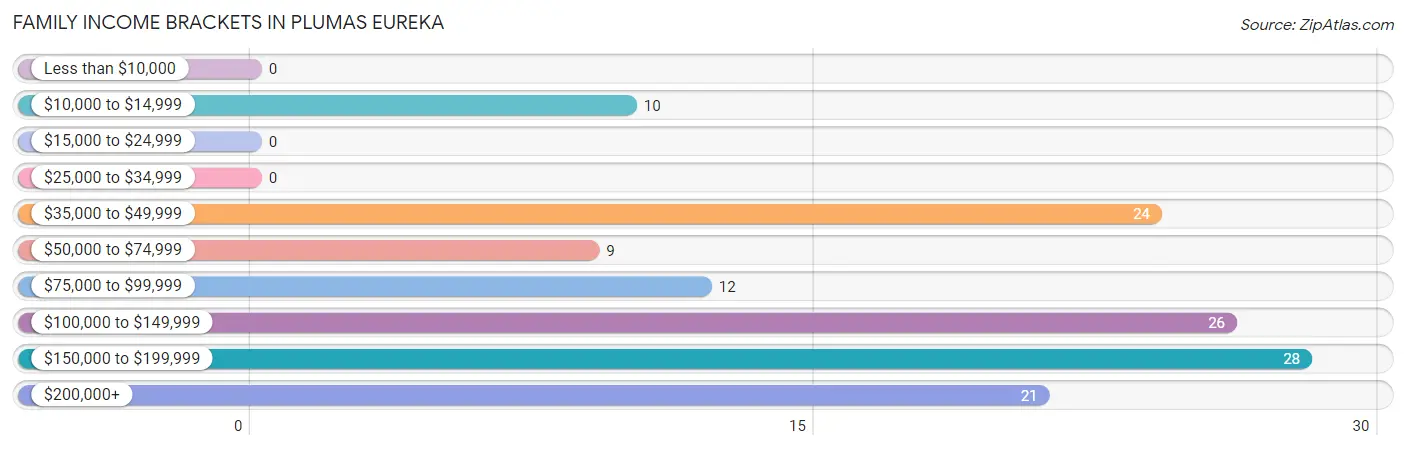
| Income Bracket | # Families | % Families |
| Less than $10,000 | 0 | 0.0% |
| $10,000 to $14,999 | 10 | 7.7% |
| $15,000 to $24,999 | 0 | 0.0% |
| $25,000 to $34,999 | 0 | 0.0% |
| $35,000 to $49,999 | 24 | 18.5% |
| $50,000 to $74,999 | 9 | 6.9% |
| $75,000 to $99,999 | 12 | 9.2% |
| $100,000 to $149,999 | 26 | 20.0% |
| $150,000 to $199,999 | 28 | 21.5% |
| $200,000+ | 21 | 16.2% |
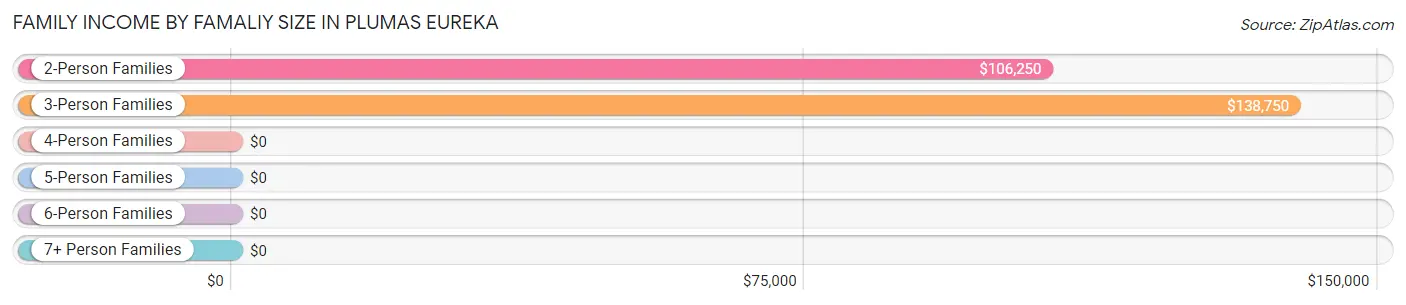
Family Income by Famaliy Size in Plumas Eureka
3-person families (12 | 9.2%) account for the highest median family income in Plumas Eureka with $138,750 per family, while 2-person families (113 | 86.9%) have the highest median income of $53,125 per family member.
| Income Bracket | # Families | Median Income |
| 2-Person Families | 113 (86.9%) | $106,250 |
| 3-Person Families | 12 (9.2%) | $138,750 |
| 4-Person Families | 0 (0.0%) | $0 |
| 5-Person Families | 5 (3.8%) | $0 |
| 6-Person Families | 0 (0.0%) | $0 |
| 7+ Person Families | 0 (0.0%) | $0 |
| Total | 130 (100.0%) | $111,667 |
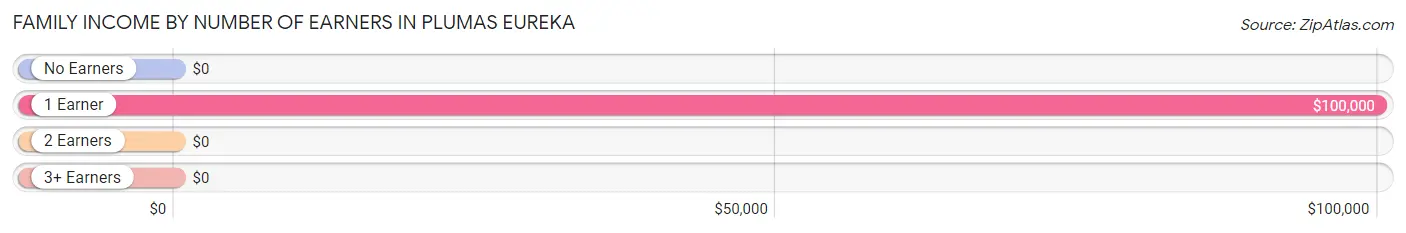
Family Income by Number of Earners in Plumas Eureka
| Number of Earners | # Families | Median Income |
| No Earners | 46 (35.4%) | $0 |
| 1 Earner | 56 (43.1%) | $100,000 |
| 2 Earners | 22 (16.9%) | $0 |
| 3+ Earners | 6 (4.6%) | $0 |
| Total | 130 (100.0%) | $111,667 |
Household Income in Plumas Eureka
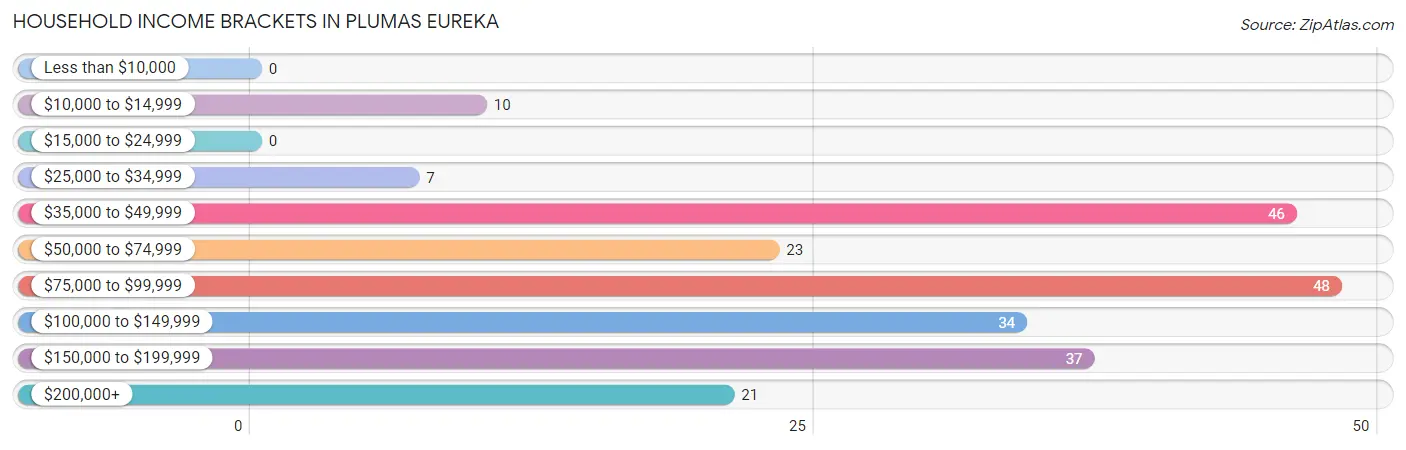
Household Income Brackets in Plumas Eureka
With 48 households falling in the category, the $75,000 to $99,999 income range is the most frequent in Plumas Eureka, accounting for 21.2% of all households.
| Income Bracket | # Households | % Households |
| Less than $10,000 | 0 | 0.0% |
| $10,000 to $14,999 | 10 | 4.4% |
| $15,000 to $24,999 | 0 | 0.0% |
| $25,000 to $34,999 | 7 | 3.1% |
| $35,000 to $49,999 | 46 | 20.4% |
| $50,000 to $74,999 | 23 | 10.2% |
| $75,000 to $99,999 | 48 | 21.2% |
| $100,000 to $149,999 | 34 | 15.0% |
| $150,000 to $199,999 | 37 | 16.4% |
| $200,000+ | 21 | 9.3% |
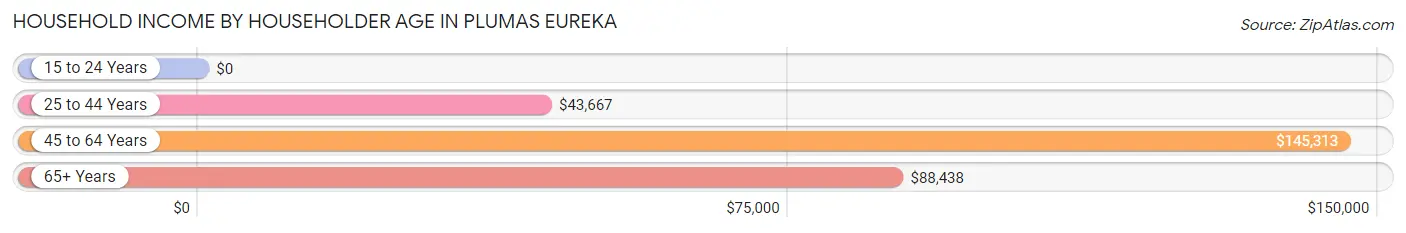
Household Income by Householder Age in Plumas Eureka
The median household income in Plumas Eureka is $86,250, with the highest median household income of $145,313 found in the 45 to 64 years age bracket for the primary householder. A total of 47 households (20.8%) fall into this category.
| Income Bracket | # Households | Median Income |
| 15 to 24 Years | 0 (0.0%) | $0 |
| 25 to 44 Years | 34 (15.0%) | $43,667 |
| 45 to 64 Years | 47 (20.8%) | $145,313 |
| 65+ Years | 145 (64.2%) | $88,438 |
| Total | 226 (100.0%) | $86,250 |
Poverty in Plumas Eureka
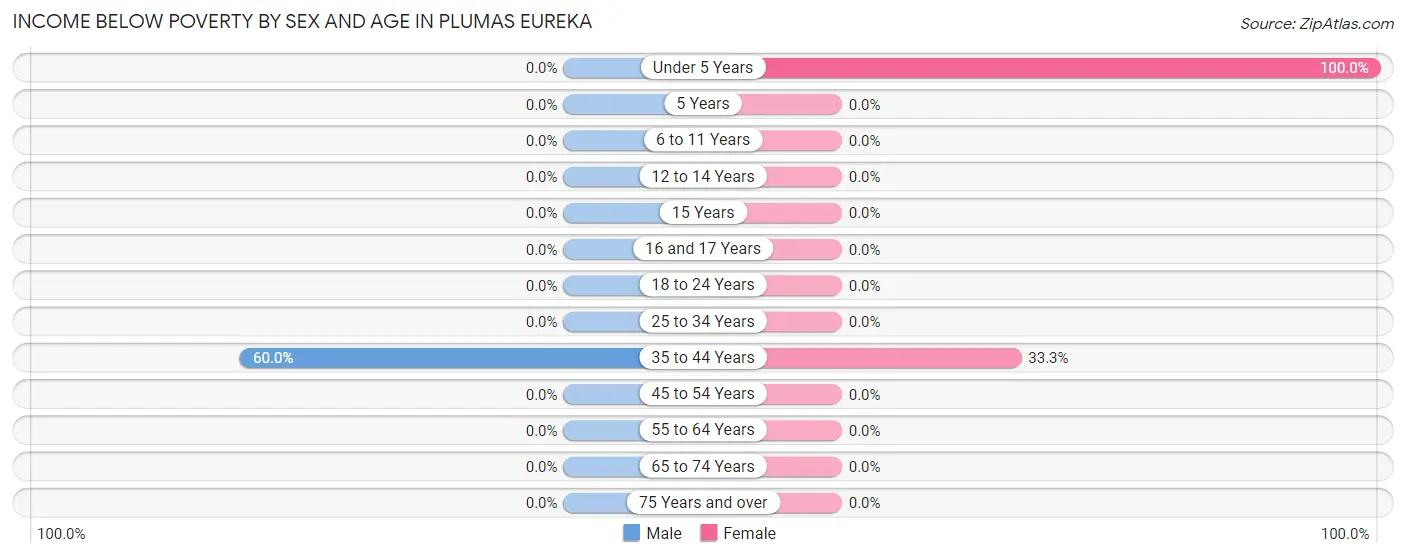
Income Below Poverty by Sex and Age in Plumas Eureka
With 4.3% poverty level for males and 10.7% for females among the residents of Plumas Eureka, 35 to 44 year old males and under 5 year old females are the most vulnerable to poverty, with 9 males (60.0%) and 15 females (100.0%) in their respective age groups living below the poverty level.
| Age Bracket | Male | Female |
| Under 5 Years | 0 (0.0%) | 15 (100.0%) |
| 5 Years | 0 (0.0%) | 0 (0.0%) |
| 6 to 11 Years | 0 (0.0%) | 0 (0.0%) |
| 12 to 14 Years | 0 (0.0%) | 0 (0.0%) |
| 15 Years | 0 (0.0%) | 0 (0.0%) |
| 16 and 17 Years | 0 (0.0%) | 0 (0.0%) |
| 18 to 24 Years | 0 (0.0%) | 0 (0.0%) |
| 25 to 34 Years | 0 (0.0%) | 0 (0.0%) |
| 35 to 44 Years | 9 (60.0%) | 10 (33.3%) |
| 45 to 54 Years | 0 (0.0%) | 0 (0.0%) |
| 55 to 64 Years | 0 (0.0%) | 0 (0.0%) |
| 65 to 74 Years | 0 (0.0%) | 0 (0.0%) |
| 75 Years and over | 0 (0.0%) | 0 (0.0%) |
| Total | 9 (4.3%) | 25 (10.7%) |
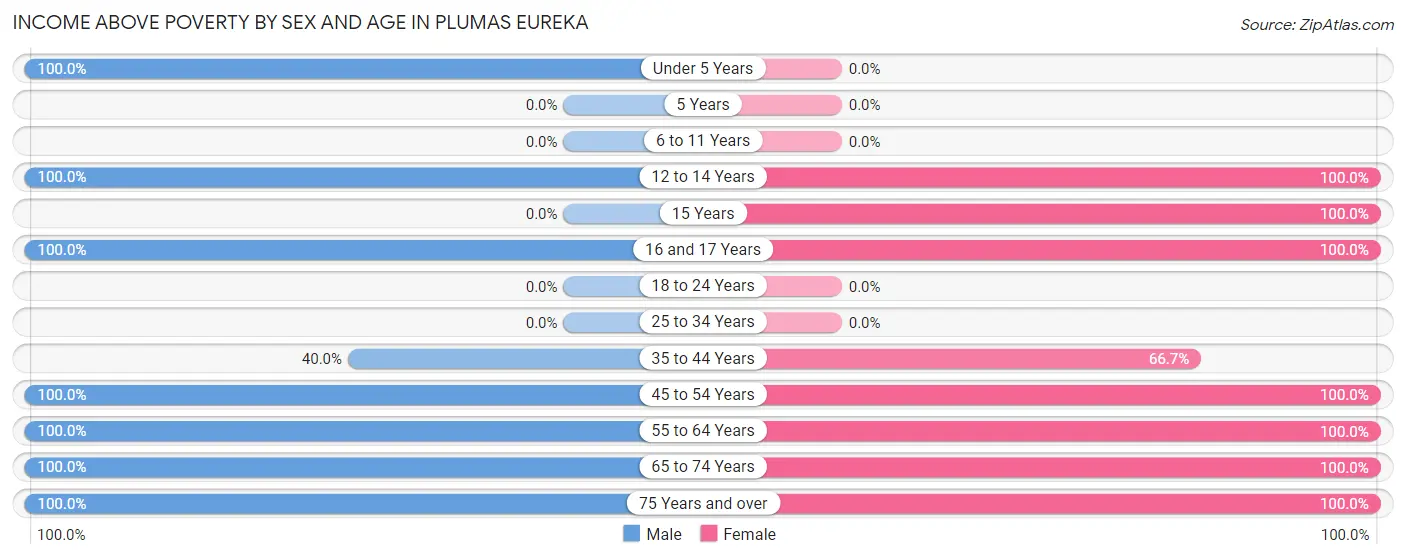
Income Above Poverty by Sex and Age in Plumas Eureka
According to the poverty statistics in Plumas Eureka, males aged under 5 years and females aged 12 to 14 years are the age groups that are most secure financially, with 100.0% of males and 100.0% of females in these age groups living above the poverty line.
| Age Bracket | Male | Female |
| Under 5 Years | 13 (100.0%) | 0 (0.0%) |
| 5 Years | 0 (0.0%) | 0 (0.0%) |
| 6 to 11 Years | 0 (0.0%) | 0 (0.0%) |
| 12 to 14 Years | 9 (100.0%) | 3 (100.0%) |
| 15 Years | 0 (0.0%) | 4 (100.0%) |
| 16 and 17 Years | 7 (100.0%) | 27 (100.0%) |
| 18 to 24 Years | 0 (0.0%) | 0 (0.0%) |
| 25 to 34 Years | 0 (0.0%) | 0 (0.0%) |
| 35 to 44 Years | 6 (40.0%) | 20 (66.7%) |
| 45 to 54 Years | 22 (100.0%) | 18 (100.0%) |
| 55 to 64 Years | 14 (100.0%) | 42 (100.0%) |
| 65 to 74 Years | 105 (100.0%) | 78 (100.0%) |
| 75 Years and over | 26 (100.0%) | 16 (100.0%) |
| Total | 202 (95.7%) | 208 (89.3%) |
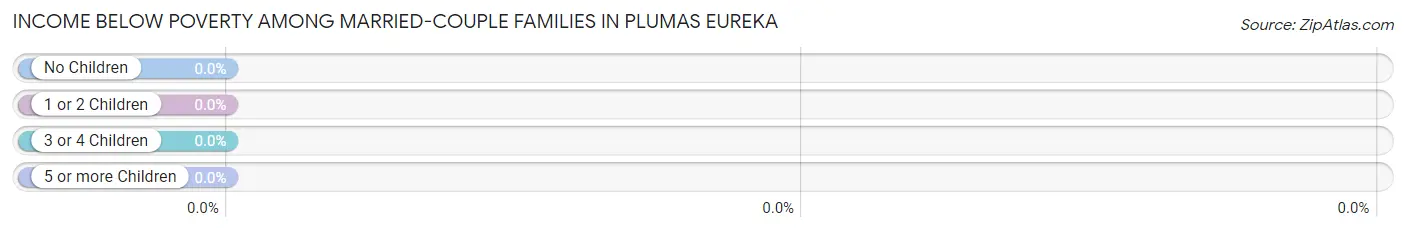
Income Below Poverty Among Married-Couple Families in Plumas Eureka
| Children | Above Poverty | Below Poverty |
| No Children | 88 (100.0%) | 0 (0.0%) |
| 1 or 2 Children | 6 (100.0%) | 0 (0.0%) |
| 3 or 4 Children | 5 (100.0%) | 0 (0.0%) |
| 5 or more Children | 0 (0.0%) | 0 (0.0%) |
| Total | 99 (100.0%) | 0 (0.0%) |
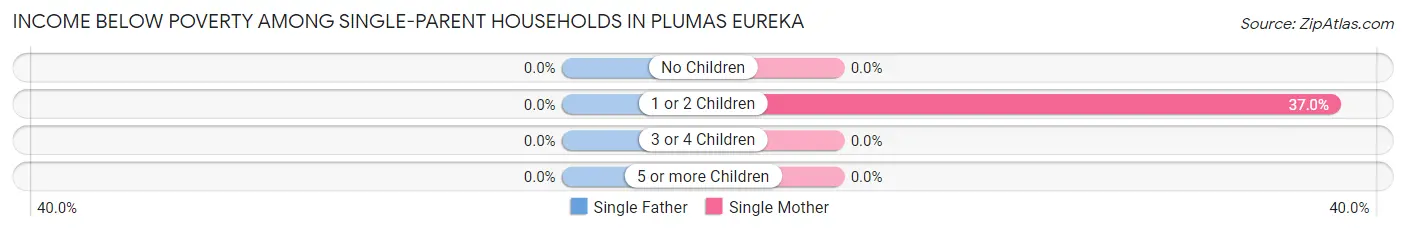
Income Below Poverty Among Single-Parent Households in Plumas Eureka
| Children | Single Father | Single Mother |
| No Children | 0 (0.0%) | 0 (0.0%) |
| 1 or 2 Children | 0 (0.0%) | 10 (37.0%) |
| 3 or 4 Children | 0 (0.0%) | 0 (0.0%) |
| 5 or more Children | 0 (0.0%) | 0 (0.0%) |
| Total | 0 (0.0%) | 10 (37.0%) |
Income Below Poverty Among Married-Couple vs Single-Parent Households in Plumas Eureka
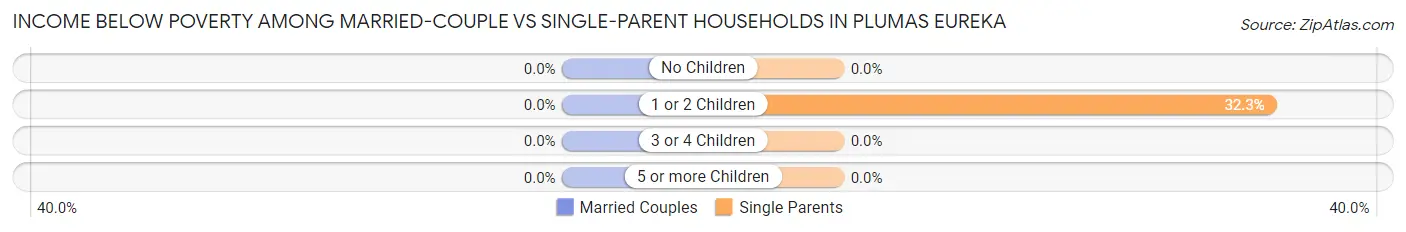
| Children | Married-Couple Families | Single-Parent Households |
| No Children | 0 (0.0%) | 0 (0.0%) |
| 1 or 2 Children | 0 (0.0%) | 10 (32.3%) |
| 3 or 4 Children | 0 (0.0%) | 0 (0.0%) |
| 5 or more Children | 0 (0.0%) | 0 (0.0%) |
| Total | 0 (0.0%) | 10 (32.3%) |
Employment Characteristics in Plumas Eureka
Employment by Class of Employer in Plumas Eureka
Among the 143 employed individuals in Plumas Eureka, private company employees (49 | 34.3%), not-for-profit organizations (41 | 28.7%), and self-employed (not incorporated) (24 | 16.8%) make up the most common classes of employment.
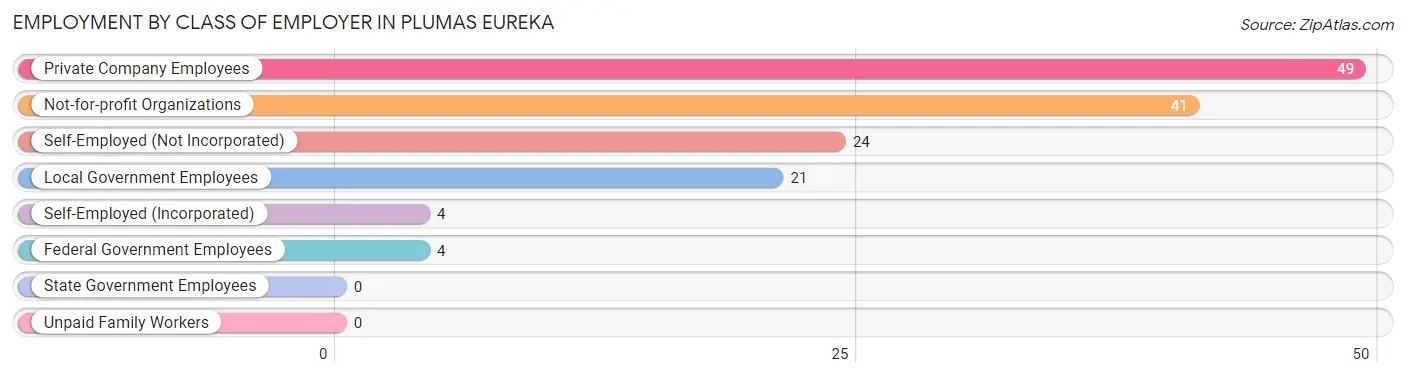
| Employer Class | # Employees | % Employees |
| Private Company Employees | 49 | 34.3% |
| Self-Employed (Incorporated) | 4 | 2.8% |
| Self-Employed (Not Incorporated) | 24 | 16.8% |
| Not-for-profit Organizations | 41 | 28.7% |
| Local Government Employees | 21 | 14.7% |
| State Government Employees | 0 | 0.0% |
| Federal Government Employees | 4 | 2.8% |
| Unpaid Family Workers | 0 | 0.0% |
| Total | 143 | 100.0% |
Employment Status by Age in Plumas Eureka
According to the labor force statistics for Plumas Eureka, out of the total population over 16 years of age (400), 38.0% or 152 individuals are in the labor force, with 5.9% or 9 of them unemployed. The age group with the highest labor force participation rate is 55 to 59 years, with 85.7% or 12 individuals in the labor force. Within the labor force, the 60 to 64 years age range has the highest percentage of unemployed individuals, with 23.3% or 7 of them being unemployed.
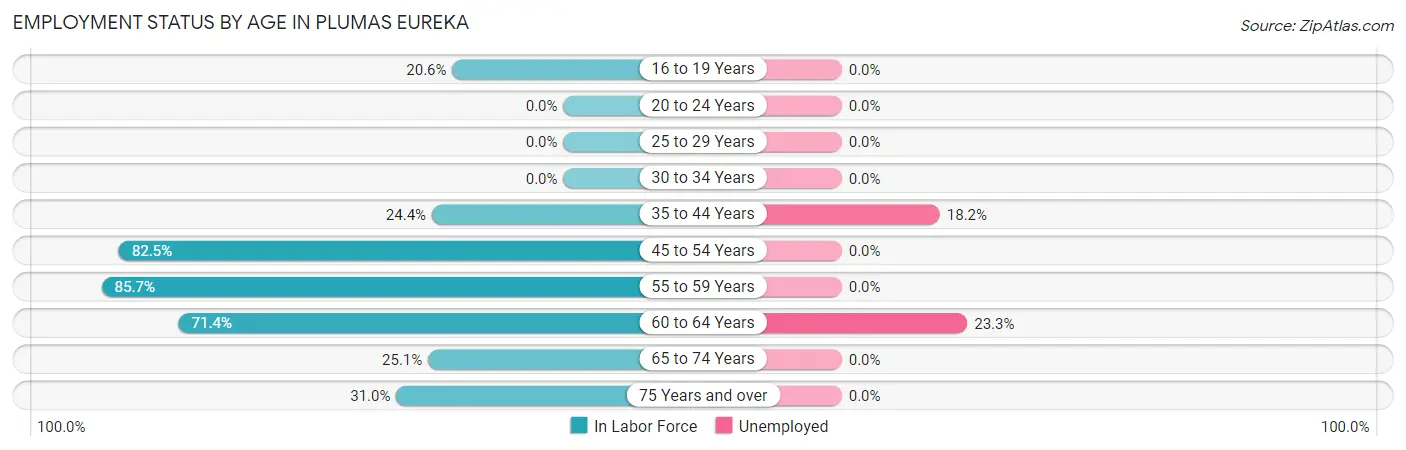
| Age Bracket | In Labor Force | Unemployed |
| 16 to 19 Years | 7 (20.6%) | 0 (0.0%) |
| 20 to 24 Years | 0 (0.0%) | 0 (0.0%) |
| 25 to 29 Years | 0 (0.0%) | 0 (0.0%) |
| 30 to 34 Years | 0 (0.0%) | 0 (0.0%) |
| 35 to 44 Years | 11 (24.4%) | 2 (18.2%) |
| 45 to 54 Years | 33 (82.5%) | 0 (0.0%) |
| 55 to 59 Years | 12 (85.7%) | 0 (0.0%) |
| 60 to 64 Years | 30 (71.4%) | 7 (23.3%) |
| 65 to 74 Years | 46 (25.1%) | 0 (0.0%) |
| 75 Years and over | 13 (31.0%) | 0 (0.0%) |
| Total | 152 (38.0%) | 9 (5.9%) |
Employment Status by Educational Attainment in Plumas Eureka
According to labor force statistics for Plumas Eureka, 61.0% of individuals (86) out of the total population between 25 and 64 years of age (141) are in the labor force, with 10.5% or 9 of them being unemployed. The group with the highest labor force participation rate are those with the educational attainment of college / associate degree, with 80.0% or 28 individuals in the labor force. Within the labor force, individuals with bachelor's degree or higher education have the highest percentage of unemployment, with 14.6% or 7 of them being unemployed.
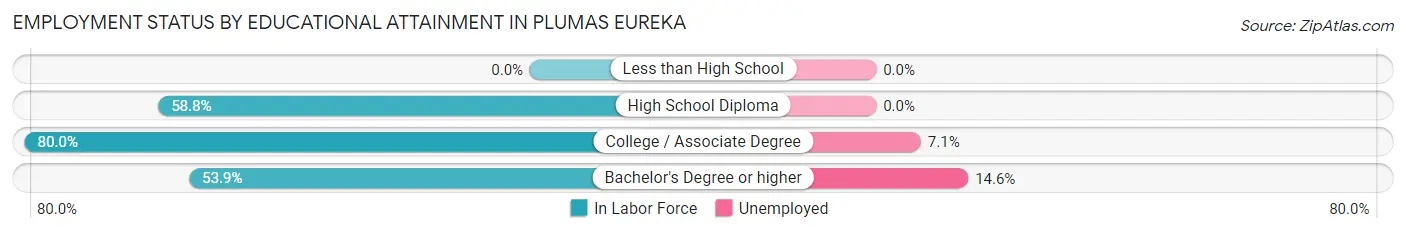
| Educational Attainment | In Labor Force | Unemployed |
| Less than High School | 0 (0.0%) | 0 (0.0%) |
| High School Diploma | 10 (58.8%) | 0 (0.0%) |
| College / Associate Degree | 28 (80.0%) | 2 (7.1%) |
| Bachelor's Degree or higher | 48 (53.9%) | 13 (14.6%) |
| Total | 86 (61.0%) | 15 (10.5%) |
Employment Occupations by Sex in Plumas Eureka
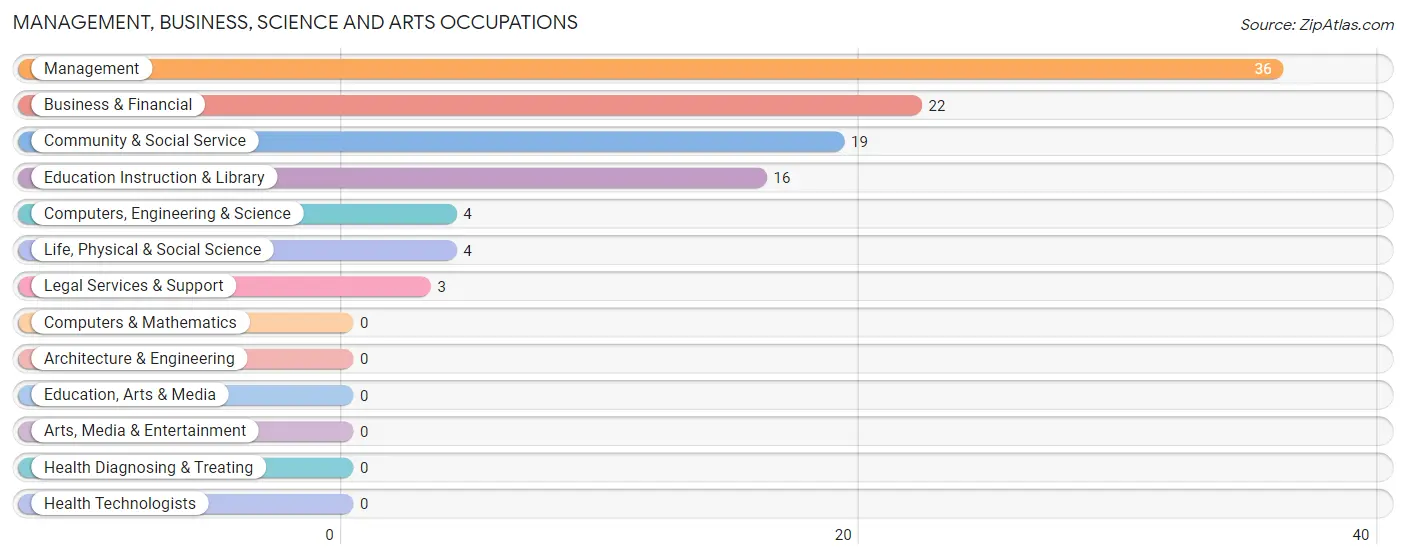
Management, Business, Science and Arts Occupations
The most common Management, Business, Science and Arts occupations in Plumas Eureka are Management (36 | 25.2%), Business & Financial (22 | 15.4%), Community & Social Service (19 | 13.3%), Education Instruction & Library (16 | 11.2%), and Computers, Engineering & Science (4 | 2.8%).
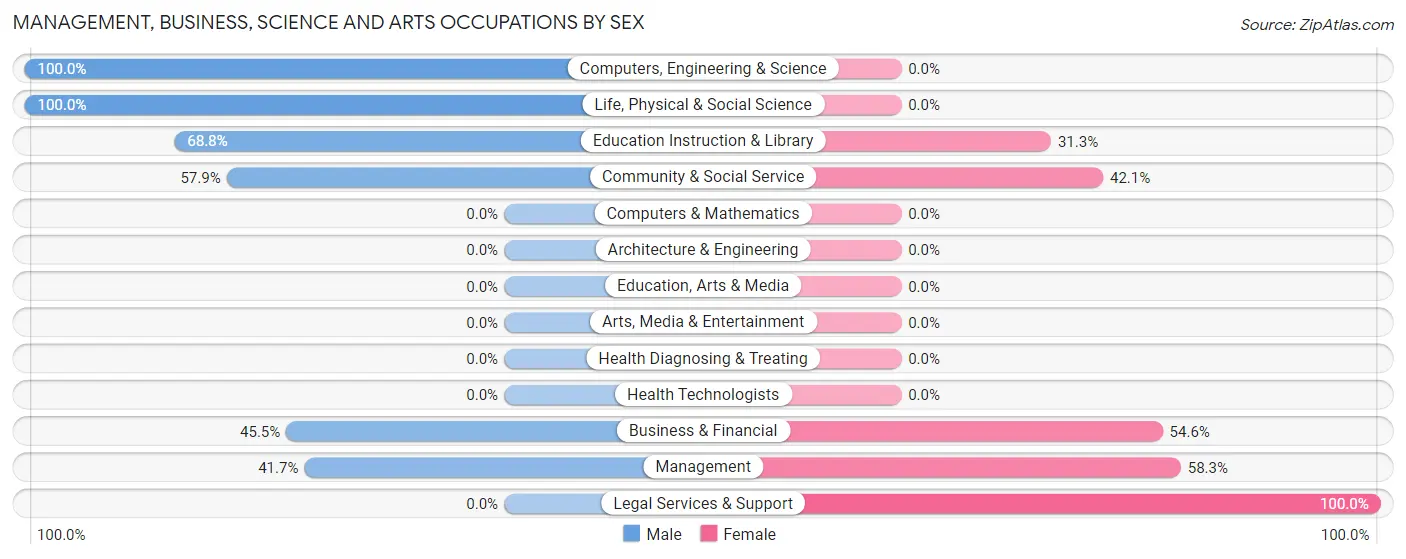
Management, Business, Science and Arts Occupations by Sex
Within the Management, Business, Science and Arts occupations in Plumas Eureka, the most male-oriented occupations are Computers, Engineering & Science (100.0%), Life, Physical & Social Science (100.0%), and Education Instruction & Library (68.8%), while the most female-oriented occupations are Legal Services & Support (100.0%), Management (58.3%), and Business & Financial (54.5%).
| Occupation | Male | Female |
| Management | 15 (41.7%) | 21 (58.3%) |
| Business & Financial | 10 (45.5%) | 12 (54.5%) |
| Computers, Engineering & Science | 4 (100.0%) | 0 (0.0%) |
| Computers & Mathematics | 0 (0.0%) | 0 (0.0%) |
| Architecture & Engineering | 0 (0.0%) | 0 (0.0%) |
| Life, Physical & Social Science | 4 (100.0%) | 0 (0.0%) |
| Community & Social Service | 11 (57.9%) | 8 (42.1%) |
| Education, Arts & Media | 0 (0.0%) | 0 (0.0%) |
| Legal Services & Support | 0 (0.0%) | 3 (100.0%) |
| Education Instruction & Library | 11 (68.8%) | 5 (31.2%) |
| Arts, Media & Entertainment | 0 (0.0%) | 0 (0.0%) |
| Health Diagnosing & Treating | 0 (0.0%) | 0 (0.0%) |
| Health Technologists | 0 (0.0%) | 0 (0.0%) |
| Total (Category) | 40 (49.4%) | 41 (50.6%) |
| Total (Overall) | 74 (51.7%) | 69 (48.2%) |
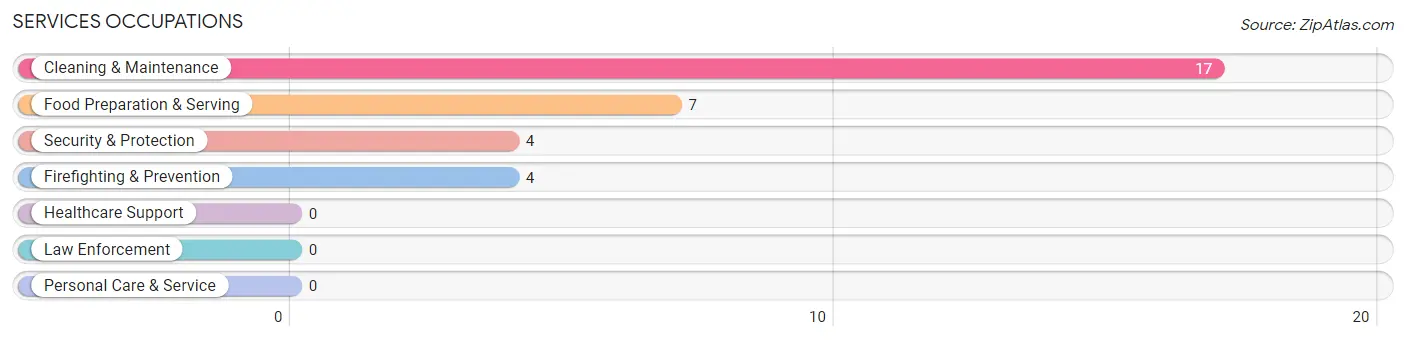
Services Occupations
The most common Services occupations in Plumas Eureka are Cleaning & Maintenance (17 | 11.9%), Food Preparation & Serving (7 | 4.9%), Security & Protection (4 | 2.8%), and Firefighting & Prevention (4 | 2.8%).
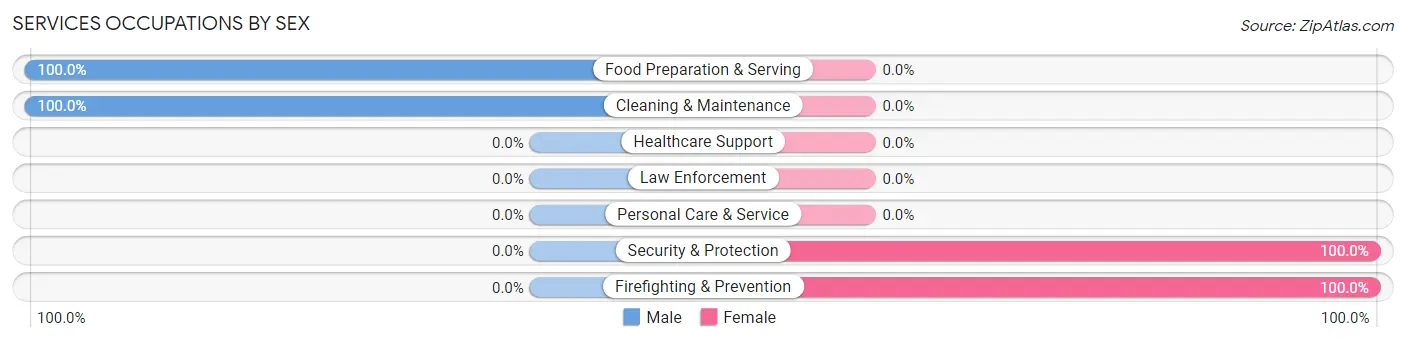
Services Occupations by Sex
Within the Services occupations in Plumas Eureka, the most male-oriented occupations are Food Preparation & Serving (100.0%), and Cleaning & Maintenance (100.0%), while the most female-oriented occupations are Security & Protection (100.0%), and Firefighting & Prevention (100.0%).
| Occupation | Male | Female |
| Healthcare Support | 0 (0.0%) | 0 (0.0%) |
| Security & Protection | 0 (0.0%) | 4 (100.0%) |
| Firefighting & Prevention | 0 (0.0%) | 4 (100.0%) |
| Law Enforcement | 0 (0.0%) | 0 (0.0%) |
| Food Preparation & Serving | 7 (100.0%) | 0 (0.0%) |
| Cleaning & Maintenance | 17 (100.0%) | 0 (0.0%) |
| Personal Care & Service | 0 (0.0%) | 0 (0.0%) |
| Total (Category) | 24 (85.7%) | 4 (14.3%) |
| Total (Overall) | 74 (51.7%) | 69 (48.2%) |
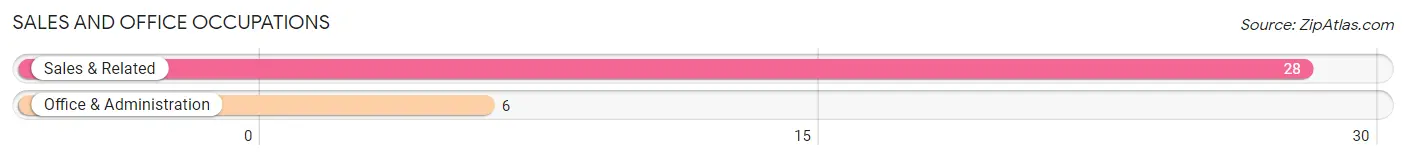
Sales and Office Occupations
The most common Sales and Office occupations in Plumas Eureka are Sales & Related (28 | 19.6%), and Office & Administration (6 | 4.2%).
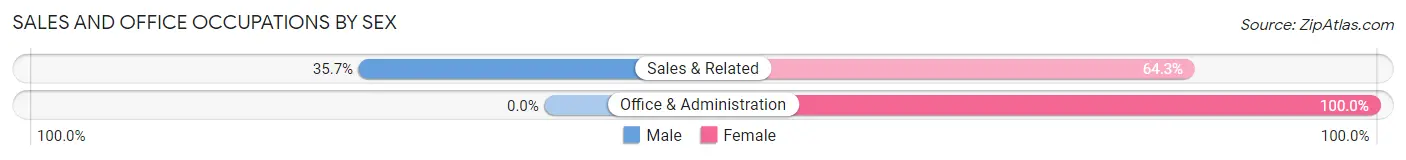
Sales and Office Occupations by Sex
| Occupation | Male | Female |
| Sales & Related | 10 (35.7%) | 18 (64.3%) |
| Office & Administration | 0 (0.0%) | 6 (100.0%) |
| Total (Category) | 10 (29.4%) | 24 (70.6%) |
| Total (Overall) | 74 (51.7%) | 69 (48.2%) |
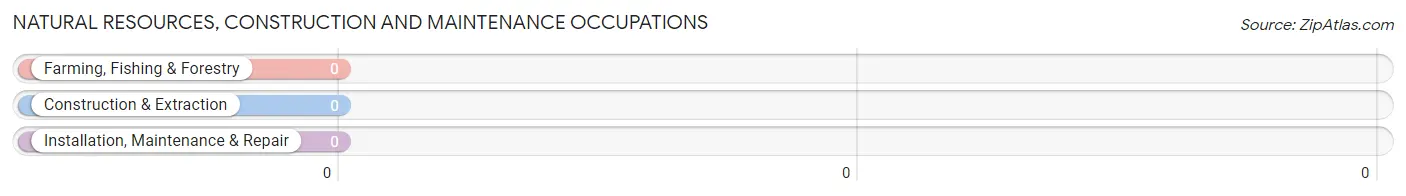
Natural Resources, Construction and Maintenance Occupations
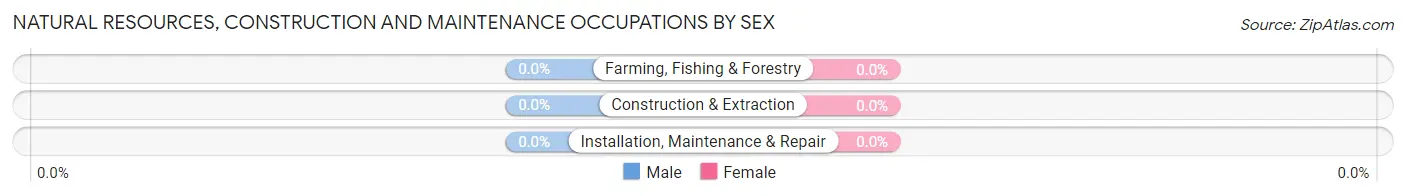
Natural Resources, Construction and Maintenance Occupations by Sex
| Occupation | Male | Female |
| Farming, Fishing & Forestry | 0 (0.0%) | 0 (0.0%) |
| Construction & Extraction | 0 (0.0%) | 0 (0.0%) |
| Installation, Maintenance & Repair | 0 (0.0%) | 0 (0.0%) |
| Total (Category) | 0 (0.0%) | 0 (0.0%) |
| Total (Overall) | 74 (51.7%) | 69 (48.2%) |
Production, Transportation and Moving Occupations
Production, Transportation and Moving Occupations by Sex
| Occupation | Male | Female |
| Production | 0 (0.0%) | 0 (0.0%) |
| Transportation | 0 (0.0%) | 0 (0.0%) |
| Material Moving | 0 (0.0%) | 0 (0.0%) |
| Total (Category) | 0 (0.0%) | 0 (0.0%) |
| Total (Overall) | 74 (51.7%) | 69 (48.2%) |
Employment Industries by Sex in Plumas Eureka
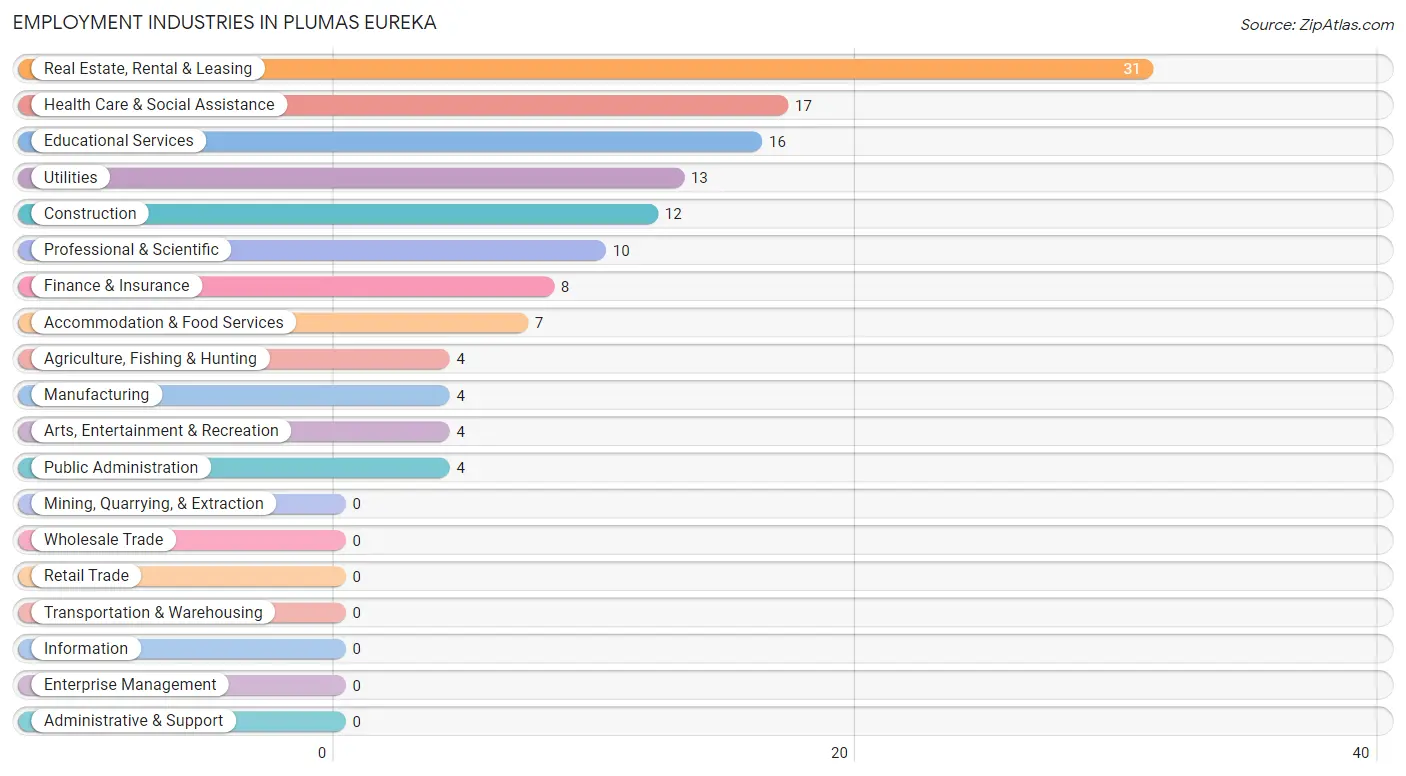
Employment Industries in Plumas Eureka
The major employment industries in Plumas Eureka include Real Estate, Rental & Leasing (31 | 21.7%), Health Care & Social Assistance (17 | 11.9%), Educational Services (16 | 11.2%), Utilities (13 | 9.1%), and Construction (12 | 8.4%).
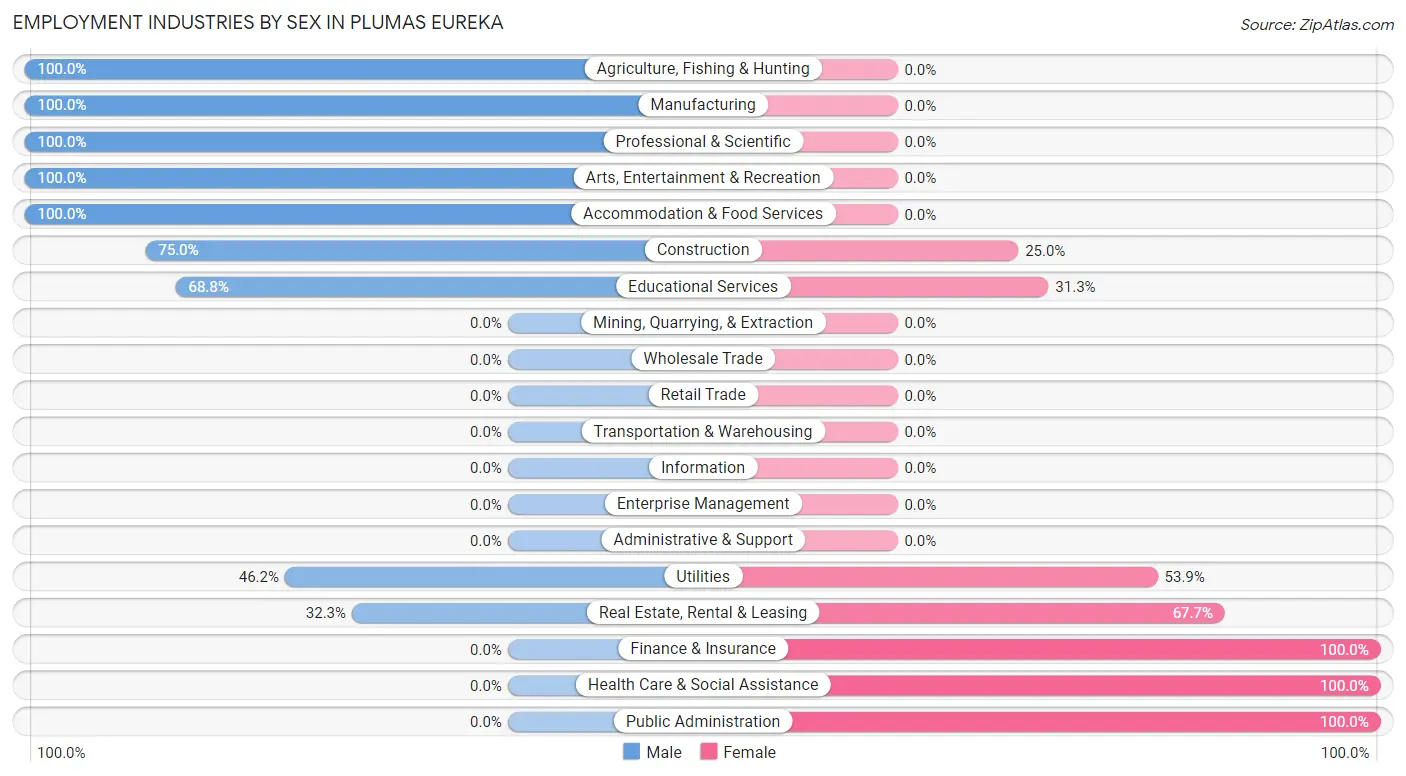
Employment Industries by Sex in Plumas Eureka
The Plumas Eureka industries that see more men than women are Agriculture, Fishing & Hunting (100.0%), Manufacturing (100.0%), and Professional & Scientific (100.0%), whereas the industries that tend to have a higher number of women are Finance & Insurance (100.0%), Health Care & Social Assistance (100.0%), and Public Administration (100.0%).
| Industry | Male | Female |
| Agriculture, Fishing & Hunting | 4 (100.0%) | 0 (0.0%) |
| Mining, Quarrying, & Extraction | 0 (0.0%) | 0 (0.0%) |
| Construction | 9 (75.0%) | 3 (25.0%) |
| Manufacturing | 4 (100.0%) | 0 (0.0%) |
| Wholesale Trade | 0 (0.0%) | 0 (0.0%) |
| Retail Trade | 0 (0.0%) | 0 (0.0%) |
| Transportation & Warehousing | 0 (0.0%) | 0 (0.0%) |
| Utilities | 6 (46.2%) | 7 (53.8%) |
| Information | 0 (0.0%) | 0 (0.0%) |
| Finance & Insurance | 0 (0.0%) | 8 (100.0%) |
| Real Estate, Rental & Leasing | 10 (32.3%) | 21 (67.7%) |
| Professional & Scientific | 10 (100.0%) | 0 (0.0%) |
| Enterprise Management | 0 (0.0%) | 0 (0.0%) |
| Administrative & Support | 0 (0.0%) | 0 (0.0%) |
| Educational Services | 11 (68.8%) | 5 (31.2%) |
| Health Care & Social Assistance | 0 (0.0%) | 17 (100.0%) |
| Arts, Entertainment & Recreation | 4 (100.0%) | 0 (0.0%) |
| Accommodation & Food Services | 7 (100.0%) | 0 (0.0%) |
| Public Administration | 0 (0.0%) | 4 (100.0%) |
| Total | 74 (51.7%) | 69 (48.2%) |
Education in Plumas Eureka
School Enrollment in Plumas Eureka
The most common levels of schooling among the 50 students in Plumas Eureka are high school (38 | 76.0%), and middle school (12 | 24.0%).
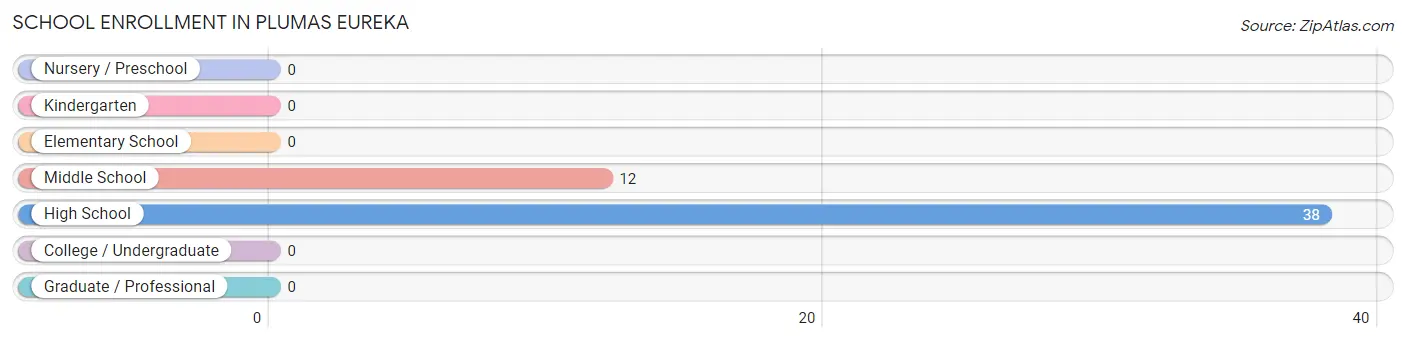
| School Level | # Students | % Students |
| Nursery / Preschool | 0 | 0.0% |
| Kindergarten | 0 | 0.0% |
| Elementary School | 0 | 0.0% |
| Middle School | 12 | 24.0% |
| High School | 38 | 76.0% |
| College / Undergraduate | 0 | 0.0% |
| Graduate / Professional | 0 | 0.0% |
| Total | 50 | 100.0% |
School Enrollment by Age by Funding Source in Plumas Eureka
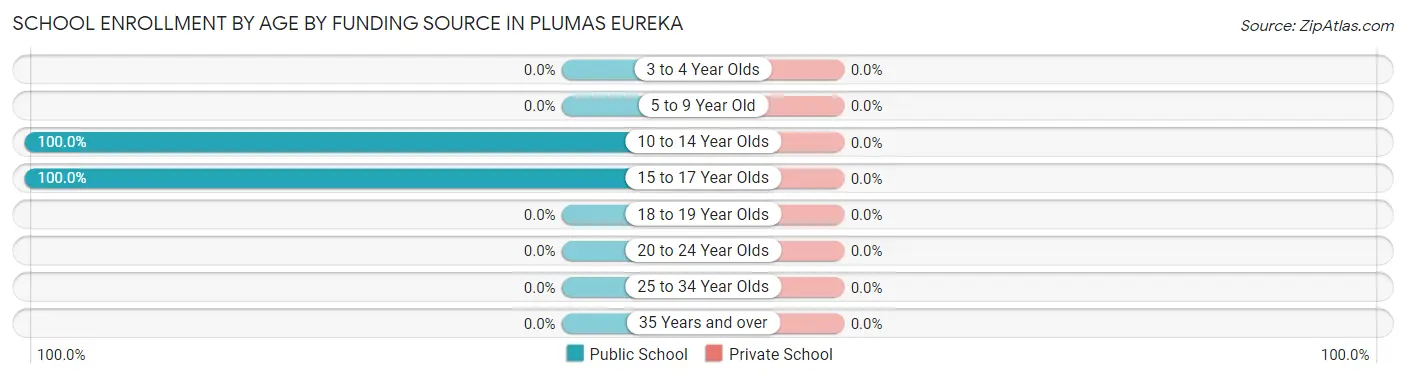
| Age Bracket | Public School | Private School |
| 3 to 4 Year Olds | 0 (0.0%) | 0 (0.0%) |
| 5 to 9 Year Old | 0 (0.0%) | 0 (0.0%) |
| 10 to 14 Year Olds | 12 (100.0%) | 0 (0.0%) |
| 15 to 17 Year Olds | 38 (100.0%) | 0 (0.0%) |
| 18 to 19 Year Olds | 0 (0.0%) | 0 (0.0%) |
| 20 to 24 Year Olds | 0 (0.0%) | 0 (0.0%) |
| 25 to 34 Year Olds | 0 (0.0%) | 0 (0.0%) |
| 35 Years and over | 0 (0.0%) | 0 (0.0%) |
| Total | 50 (100.0%) | 0 (0.0%) |
Educational Attainment by Field of Study in Plumas Eureka
Business (48 | 26.1%), science & technology (28 | 15.2%), bio, nature & agricultural (27 | 14.7%), literature & languages (17 | 9.2%), and liberal arts & history (17 | 9.2%) are the most common fields of study among 184 individuals in Plumas Eureka who have obtained a bachelor's degree or higher.
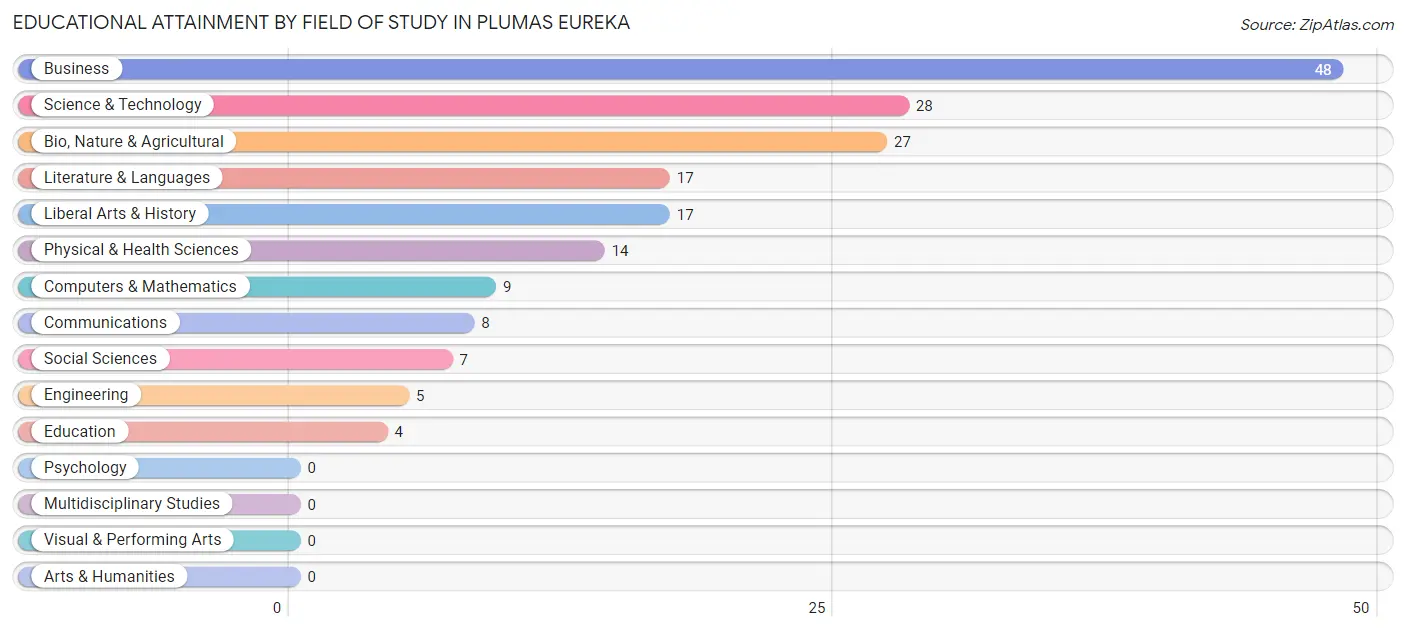
| Field of Study | # Graduates | % Graduates |
| Computers & Mathematics | 9 | 4.9% |
| Bio, Nature & Agricultural | 27 | 14.7% |
| Physical & Health Sciences | 14 | 7.6% |
| Psychology | 0 | 0.0% |
| Social Sciences | 7 | 3.8% |
| Engineering | 5 | 2.7% |
| Multidisciplinary Studies | 0 | 0.0% |
| Science & Technology | 28 | 15.2% |
| Business | 48 | 26.1% |
| Education | 4 | 2.2% |
| Literature & Languages | 17 | 9.2% |
| Liberal Arts & History | 17 | 9.2% |
| Visual & Performing Arts | 0 | 0.0% |
| Communications | 8 | 4.3% |
| Arts & Humanities | 0 | 0.0% |
| Total | 184 | 100.0% |
Transportation & Commute in Plumas Eureka
Vehicle Availability by Sex in Plumas Eureka
The most prevalent vehicle ownership categories in Plumas Eureka are males with 2 vehicles (40, accounting for 54.0%) and females with 2 vehicles (55, making up 58.0%).
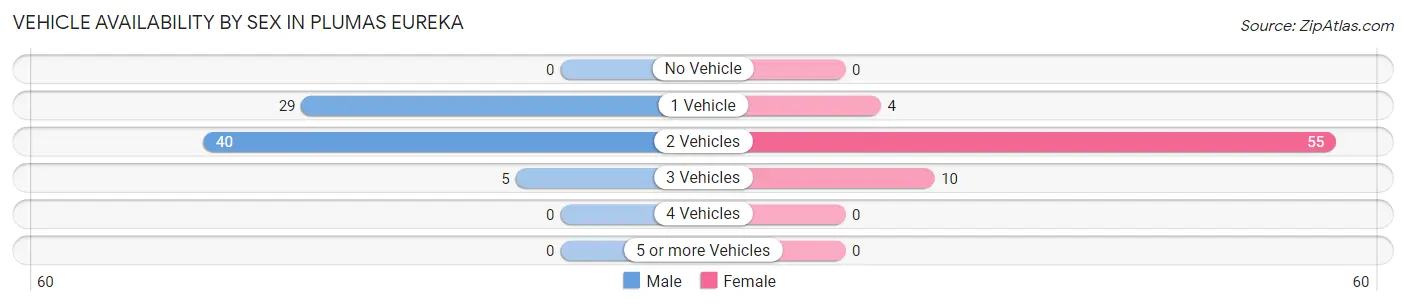
| Vehicles Available | Male | Female |
| No Vehicle | 0 (0.0%) | 0 (0.0%) |
| 1 Vehicle | 29 (39.2%) | 4 (5.8%) |
| 2 Vehicles | 40 (54.0%) | 55 (79.7%) |
| 3 Vehicles | 5 (6.8%) | 10 (14.5%) |
| 4 Vehicles | 0 (0.0%) | 0 (0.0%) |
| 5 or more Vehicles | 0 (0.0%) | 0 (0.0%) |
| Total | 74 (100.0%) | 69 (100.0%) |
Commute Time in Plumas Eureka
The most frequently occuring commute durations in Plumas Eureka are 5 to 9 minutes (31 commuters, 33.0%), 15 to 19 minutes (18 commuters, 19.2%), and 10 to 14 minutes (15 commuters, 16.0%).
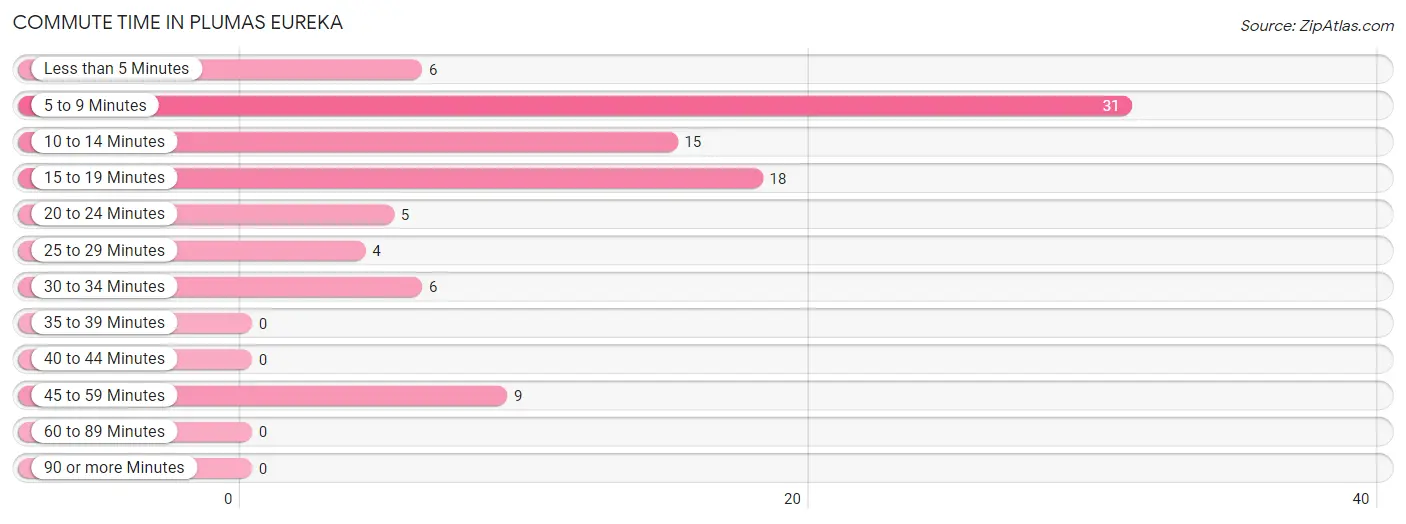
| Commute Time | # Commuters | % Commuters |
| Less than 5 Minutes | 6 | 6.4% |
| 5 to 9 Minutes | 31 | 33.0% |
| 10 to 14 Minutes | 15 | 16.0% |
| 15 to 19 Minutes | 18 | 19.2% |
| 20 to 24 Minutes | 5 | 5.3% |
| 25 to 29 Minutes | 4 | 4.3% |
| 30 to 34 Minutes | 6 | 6.4% |
| 35 to 39 Minutes | 0 | 0.0% |
| 40 to 44 Minutes | 0 | 0.0% |
| 45 to 59 Minutes | 9 | 9.6% |
| 60 to 89 Minutes | 0 | 0.0% |
| 90 or more Minutes | 0 | 0.0% |
Commute Time by Sex in Plumas Eureka
The most common commute times in Plumas Eureka are 5 to 9 minutes (19 commuters, 34.5%) for males and 5 to 9 minutes (12 commuters, 30.8%) for females.
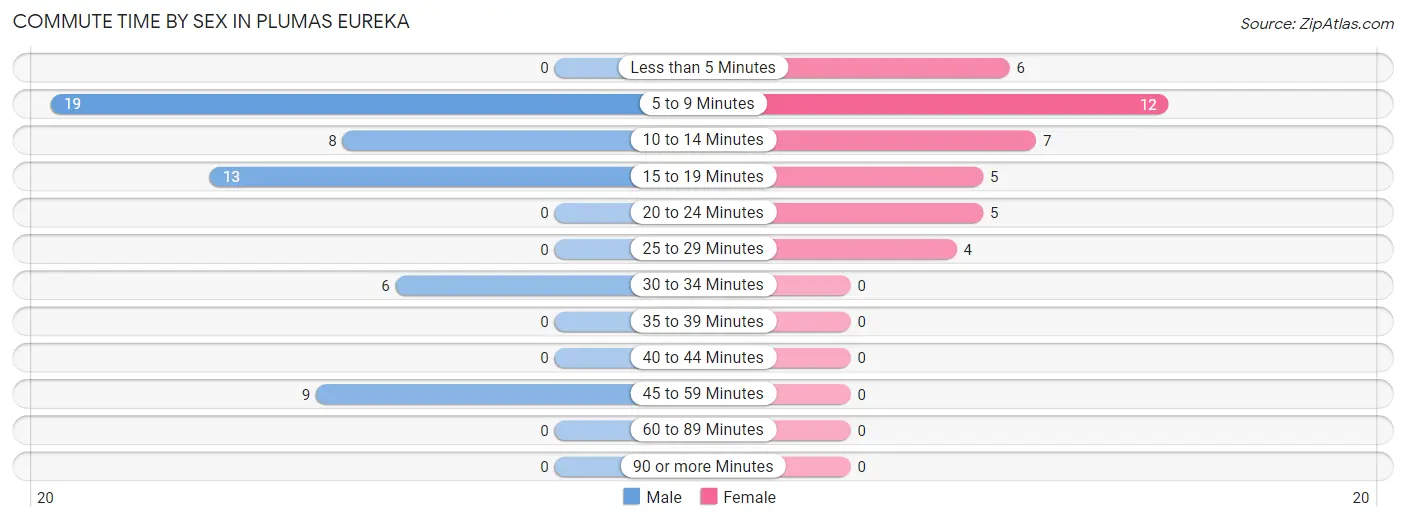
| Commute Time | Male | Female |
| Less than 5 Minutes | 0 (0.0%) | 6 (15.4%) |
| 5 to 9 Minutes | 19 (34.5%) | 12 (30.8%) |
| 10 to 14 Minutes | 8 (14.5%) | 7 (17.9%) |
| 15 to 19 Minutes | 13 (23.6%) | 5 (12.8%) |
| 20 to 24 Minutes | 0 (0.0%) | 5 (12.8%) |
| 25 to 29 Minutes | 0 (0.0%) | 4 (10.3%) |
| 30 to 34 Minutes | 6 (10.9%) | 0 (0.0%) |
| 35 to 39 Minutes | 0 (0.0%) | 0 (0.0%) |
| 40 to 44 Minutes | 0 (0.0%) | 0 (0.0%) |
| 45 to 59 Minutes | 9 (16.4%) | 0 (0.0%) |
| 60 to 89 Minutes | 0 (0.0%) | 0 (0.0%) |
| 90 or more Minutes | 0 (0.0%) | 0 (0.0%) |
Time of Departure to Work by Sex in Plumas Eureka
The most frequent times of departure to work in Plumas Eureka are 7:00 AM to 7:29 AM (13, 23.6%) for males and 7:30 AM to 7:59 AM (24, 61.5%) for females.
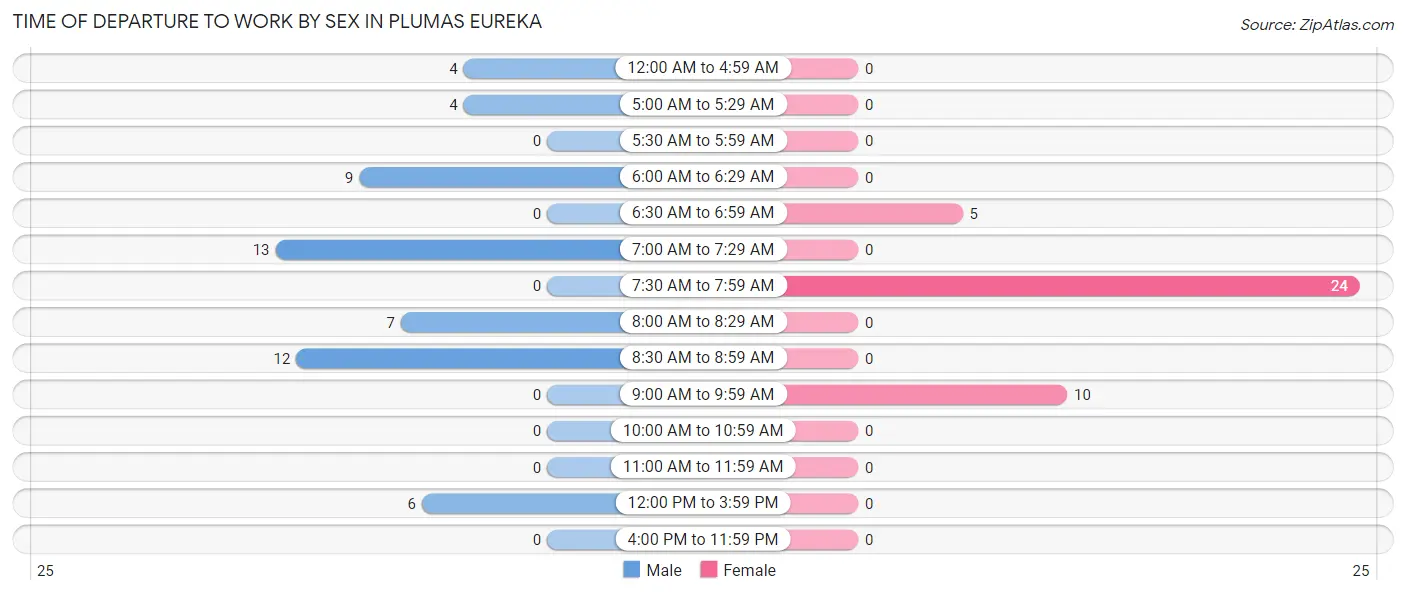
| Time of Departure | Male | Female |
| 12:00 AM to 4:59 AM | 4 (7.3%) | 0 (0.0%) |
| 5:00 AM to 5:29 AM | 4 (7.3%) | 0 (0.0%) |
| 5:30 AM to 5:59 AM | 0 (0.0%) | 0 (0.0%) |
| 6:00 AM to 6:29 AM | 9 (16.4%) | 0 (0.0%) |
| 6:30 AM to 6:59 AM | 0 (0.0%) | 5 (12.8%) |
| 7:00 AM to 7:29 AM | 13 (23.6%) | 0 (0.0%) |
| 7:30 AM to 7:59 AM | 0 (0.0%) | 24 (61.5%) |
| 8:00 AM to 8:29 AM | 7 (12.7%) | 0 (0.0%) |
| 8:30 AM to 8:59 AM | 12 (21.8%) | 0 (0.0%) |
| 9:00 AM to 9:59 AM | 0 (0.0%) | 10 (25.6%) |
| 10:00 AM to 10:59 AM | 0 (0.0%) | 0 (0.0%) |
| 11:00 AM to 11:59 AM | 0 (0.0%) | 0 (0.0%) |
| 12:00 PM to 3:59 PM | 6 (10.9%) | 0 (0.0%) |
| 4:00 PM to 11:59 PM | 0 (0.0%) | 0 (0.0%) |
| Total | 55 (100.0%) | 39 (100.0%) |
Housing Occupancy in Plumas Eureka
Occupancy by Ownership in Plumas Eureka
Of the total 226 dwellings in Plumas Eureka, owner-occupied units account for 185 (81.9%), while renter-occupied units make up 41 (18.1%).
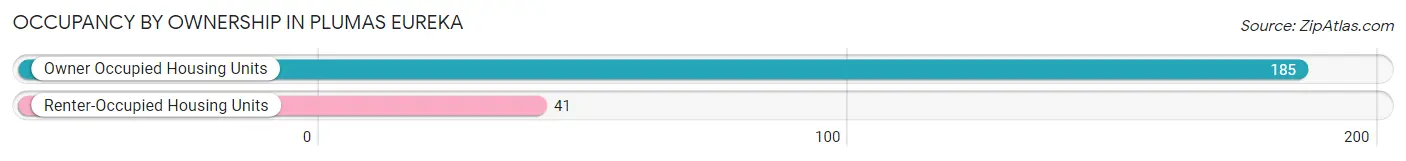
| Occupancy | # Housing Units | % Housing Units |
| Owner Occupied Housing Units | 185 | 81.9% |
| Renter-Occupied Housing Units | 41 | 18.1% |
| Total Occupied Housing Units | 226 | 100.0% |
Occupancy by Household Size in Plumas Eureka
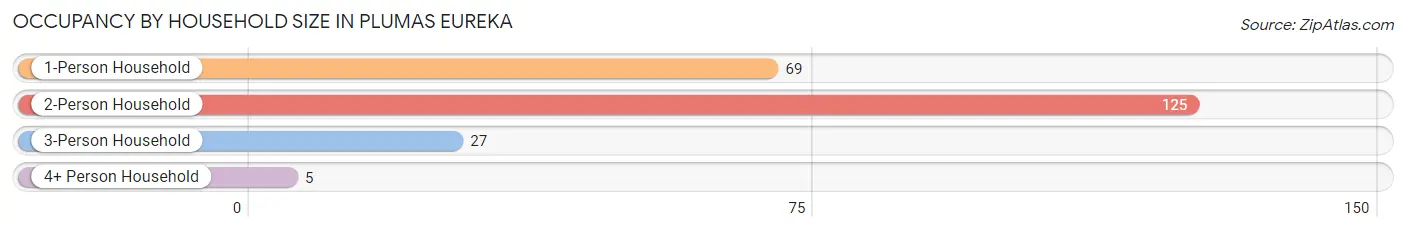
| Household Size | # Housing Units | % Housing Units |
| 1-Person Household | 69 | 30.5% |
| 2-Person Household | 125 | 55.3% |
| 3-Person Household | 27 | 11.9% |
| 4+ Person Household | 5 | 2.2% |
| Total Housing Units | 226 | 100.0% |
Occupancy by Ownership by Household Size in Plumas Eureka
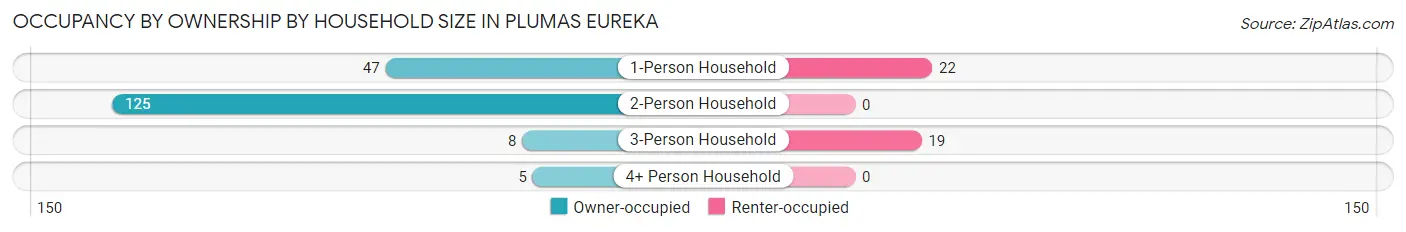
| Household Size | Owner-occupied | Renter-occupied |
| 1-Person Household | 47 (68.1%) | 22 (31.9%) |
| 2-Person Household | 125 (100.0%) | 0 (0.0%) |
| 3-Person Household | 8 (29.6%) | 19 (70.4%) |
| 4+ Person Household | 5 (100.0%) | 0 (0.0%) |
| Total Housing Units | 185 (81.9%) | 41 (18.1%) |
Occupancy by Educational Attainment in Plumas Eureka
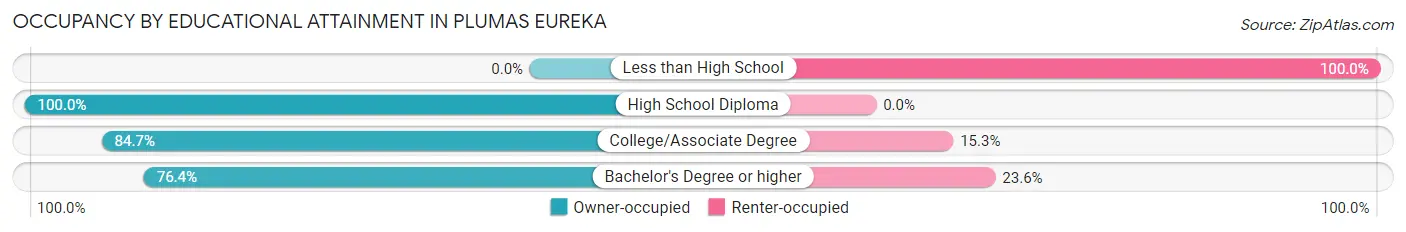
| Household Size | Owner-occupied | Renter-occupied |
| Less than High School | 0 (0.0%) | 4 (100.0%) |
| High School Diploma | 40 (100.0%) | 0 (0.0%) |
| College/Associate Degree | 61 (84.7%) | 11 (15.3%) |
| Bachelor's Degree or higher | 84 (76.4%) | 26 (23.6%) |
Occupancy by Age of Householder in Plumas Eureka
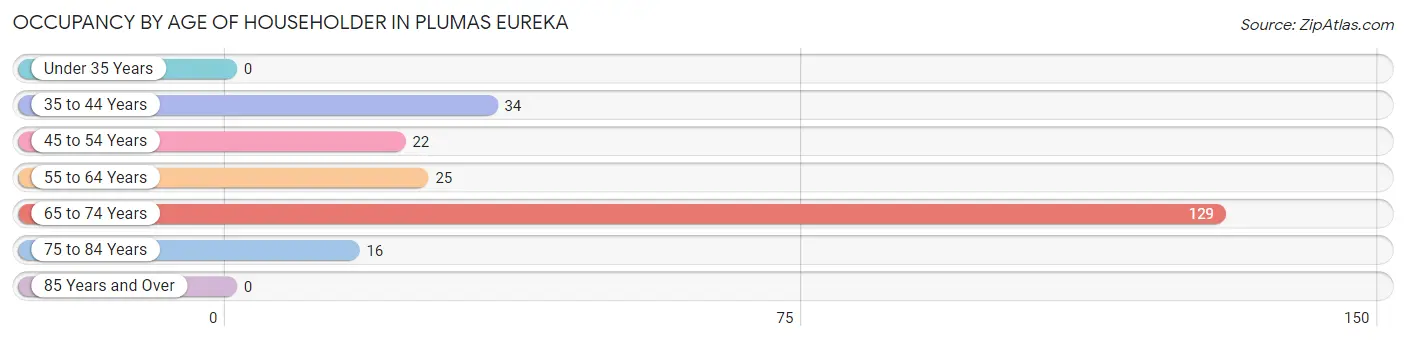
| Age Bracket | # Households | % Households |
| Under 35 Years | 0 | 0.0% |
| 35 to 44 Years | 34 | 15.0% |
| 45 to 54 Years | 22 | 9.7% |
| 55 to 64 Years | 25 | 11.1% |
| 65 to 74 Years | 129 | 57.1% |
| 75 to 84 Years | 16 | 7.1% |
| 85 Years and Over | 0 | 0.0% |
| Total | 226 | 100.0% |
Housing Finances in Plumas Eureka
Median Income by Occupancy in Plumas Eureka
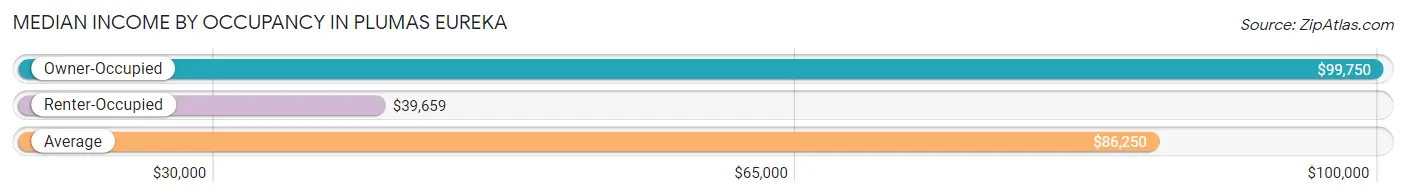
| Occupancy Type | # Households | Median Income |
| Owner-Occupied | 185 (81.9%) | $99,750 |
| Renter-Occupied | 41 (18.1%) | $39,659 |
| Average | 226 (100.0%) | $86,250 |
Occupancy by Householder Income Bracket in Plumas Eureka
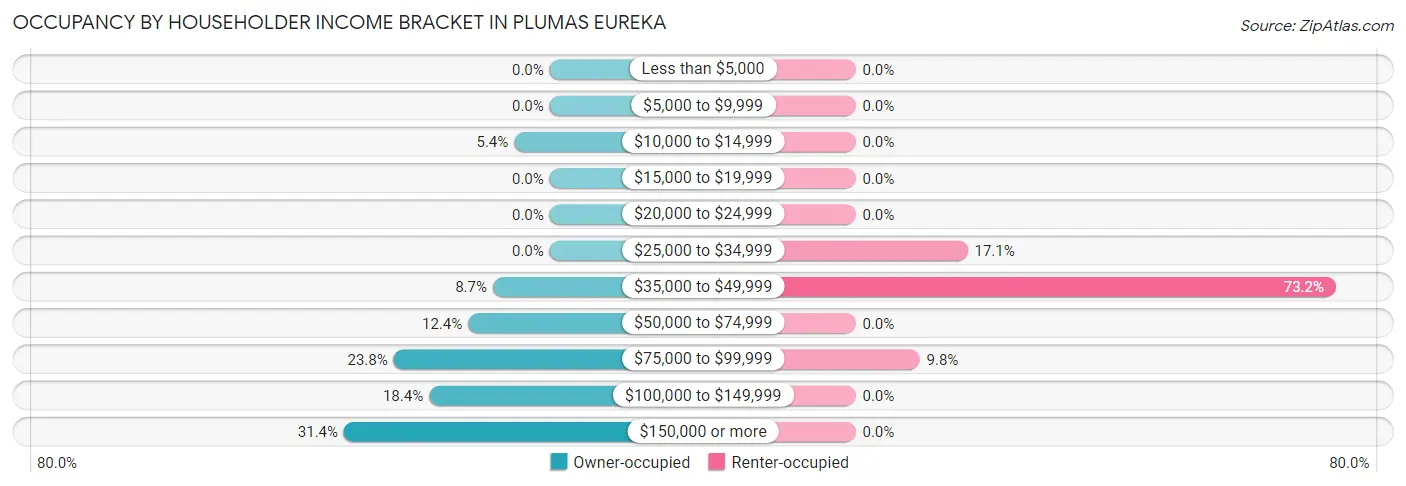
| Income Bracket | Owner-occupied | Renter-occupied |
| Less than $5,000 | 0 (0.0%) | 0 (0.0%) |
| $5,000 to $9,999 | 0 (0.0%) | 0 (0.0%) |
| $10,000 to $14,999 | 10 (5.4%) | 0 (0.0%) |
| $15,000 to $19,999 | 0 (0.0%) | 0 (0.0%) |
| $20,000 to $24,999 | 0 (0.0%) | 0 (0.0%) |
| $25,000 to $34,999 | 0 (0.0%) | 7 (17.1%) |
| $35,000 to $49,999 | 16 (8.6%) | 30 (73.2%) |
| $50,000 to $74,999 | 23 (12.4%) | 0 (0.0%) |
| $75,000 to $99,999 | 44 (23.8%) | 4 (9.8%) |
| $100,000 to $149,999 | 34 (18.4%) | 0 (0.0%) |
| $150,000 or more | 58 (31.4%) | 0 (0.0%) |
| Total | 185 (100.0%) | 41 (100.0%) |
Monthly Housing Cost Tiers in Plumas Eureka
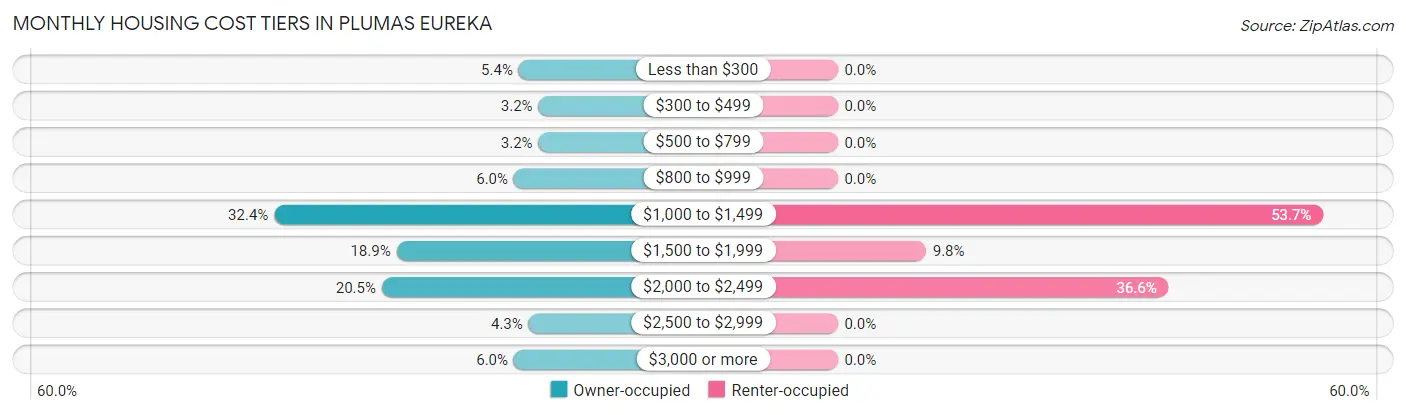
| Monthly Cost | Owner-occupied | Renter-occupied |
| Less than $300 | 10 (5.4%) | 0 (0.0%) |
| $300 to $499 | 6 (3.2%) | 0 (0.0%) |
| $500 to $799 | 6 (3.2%) | 0 (0.0%) |
| $800 to $999 | 11 (5.9%) | 0 (0.0%) |
| $1,000 to $1,499 | 60 (32.4%) | 22 (53.7%) |
| $1,500 to $1,999 | 35 (18.9%) | 4 (9.8%) |
| $2,000 to $2,499 | 38 (20.5%) | 15 (36.6%) |
| $2,500 to $2,999 | 8 (4.3%) | 0 (0.0%) |
| $3,000 or more | 11 (5.9%) | 0 (0.0%) |
| Total | 185 (100.0%) | 41 (100.0%) |
Physical Housing Characteristics in Plumas Eureka
Housing Structures in Plumas Eureka
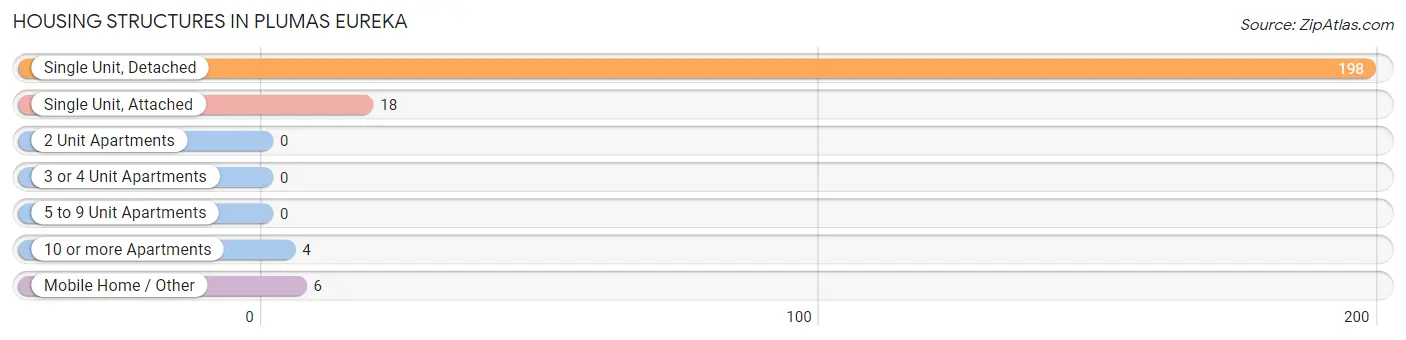
| Structure Type | # Housing Units | % Housing Units |
| Single Unit, Detached | 198 | 87.6% |
| Single Unit, Attached | 18 | 8.0% |
| 2 Unit Apartments | 0 | 0.0% |
| 3 or 4 Unit Apartments | 0 | 0.0% |
| 5 to 9 Unit Apartments | 0 | 0.0% |
| 10 or more Apartments | 4 | 1.8% |
| Mobile Home / Other | 6 | 2.6% |
| Total | 226 | 100.0% |
Housing Structures by Occupancy in Plumas Eureka
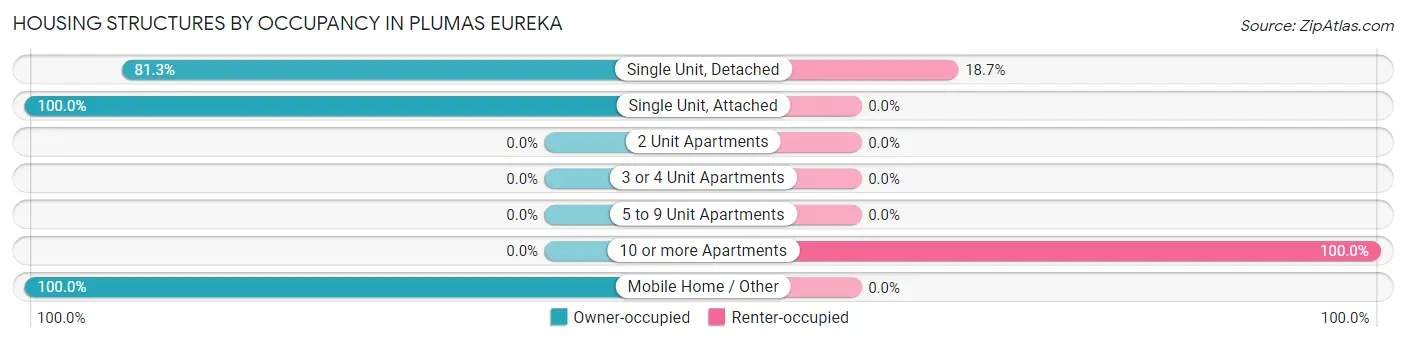
| Structure Type | Owner-occupied | Renter-occupied |
| Single Unit, Detached | 161 (81.3%) | 37 (18.7%) |
| Single Unit, Attached | 18 (100.0%) | 0 (0.0%) |
| 2 Unit Apartments | 0 (0.0%) | 0 (0.0%) |
| 3 or 4 Unit Apartments | 0 (0.0%) | 0 (0.0%) |
| 5 to 9 Unit Apartments | 0 (0.0%) | 0 (0.0%) |
| 10 or more Apartments | 0 (0.0%) | 4 (100.0%) |
| Mobile Home / Other | 6 (100.0%) | 0 (0.0%) |
| Total | 185 (81.9%) | 41 (18.1%) |
Housing Structures by Number of Rooms in Plumas Eureka
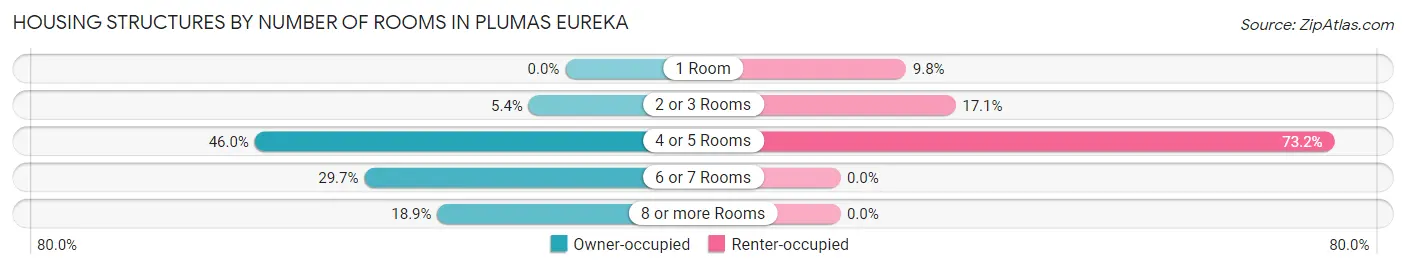
| Number of Rooms | Owner-occupied | Renter-occupied |
| 1 Room | 0 (0.0%) | 4 (9.8%) |
| 2 or 3 Rooms | 10 (5.4%) | 7 (17.1%) |
| 4 or 5 Rooms | 85 (46.0%) | 30 (73.2%) |
| 6 or 7 Rooms | 55 (29.7%) | 0 (0.0%) |
| 8 or more Rooms | 35 (18.9%) | 0 (0.0%) |
| Total | 185 (100.0%) | 41 (100.0%) |
Housing Structure by Heating Type in Plumas Eureka
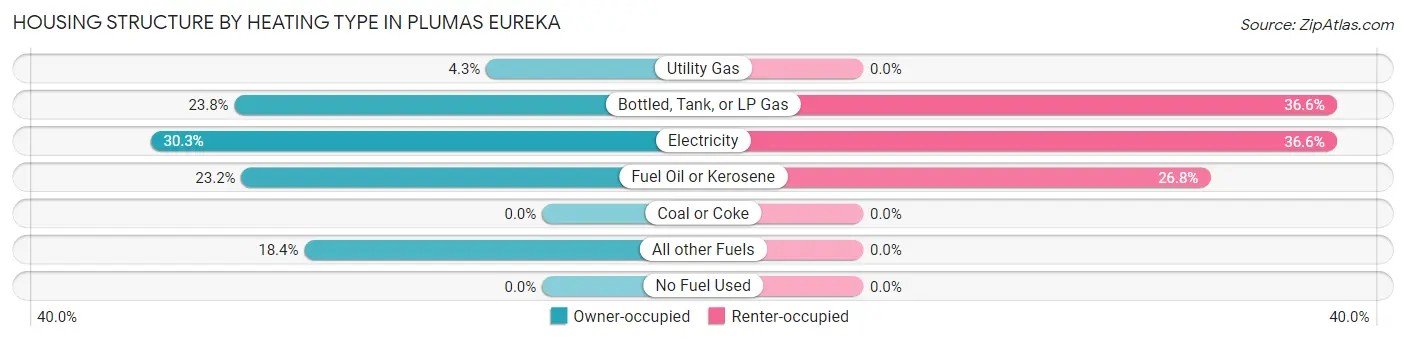
| Heating Type | Owner-occupied | Renter-occupied |
| Utility Gas | 8 (4.3%) | 0 (0.0%) |
| Bottled, Tank, or LP Gas | 44 (23.8%) | 15 (36.6%) |
| Electricity | 56 (30.3%) | 15 (36.6%) |
| Fuel Oil or Kerosene | 43 (23.2%) | 11 (26.8%) |
| Coal or Coke | 0 (0.0%) | 0 (0.0%) |
| All other Fuels | 34 (18.4%) | 0 (0.0%) |
| No Fuel Used | 0 (0.0%) | 0 (0.0%) |
| Total | 185 (100.0%) | 41 (100.0%) |
Household Vehicle Usage in Plumas Eureka
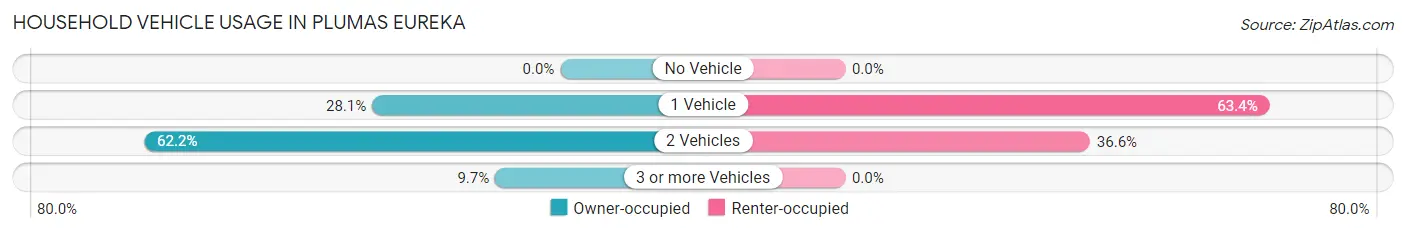
| Vehicles per Household | Owner-occupied | Renter-occupied |
| No Vehicle | 0 (0.0%) | 0 (0.0%) |
| 1 Vehicle | 52 (28.1%) | 26 (63.4%) |
| 2 Vehicles | 115 (62.2%) | 15 (36.6%) |
| 3 or more Vehicles | 18 (9.7%) | 0 (0.0%) |
| Total | 185 (100.0%) | 41 (100.0%) |
Real Estate & Mortgages in Plumas Eureka
Real Estate and Mortgage Overview in Plumas Eureka
| Characteristic | Without Mortgage | With Mortgage |
| Housing Units | 69 | 116 |
| Median Property Value | $450,000 | $451,500 |
| Median Household Income | $101,250 | $41 |
| Monthly Housing Costs | $1,050 | $11 |
| Real Estate Taxes | $2,883 | $0 |
Property Value by Mortgage Status in Plumas Eureka
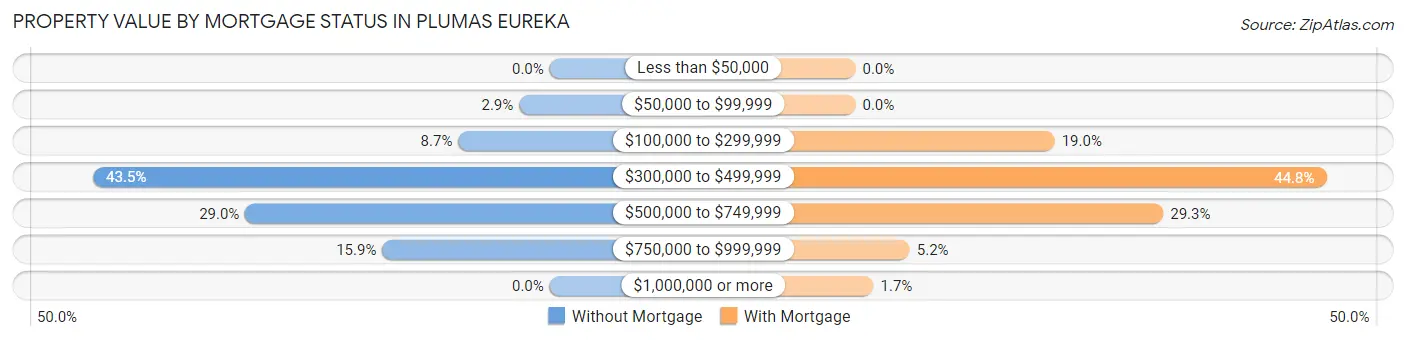
| Property Value | Without Mortgage | With Mortgage |
| Less than $50,000 | 0 (0.0%) | 0 (0.0%) |
| $50,000 to $99,999 | 2 (2.9%) | 0 (0.0%) |
| $100,000 to $299,999 | 6 (8.7%) | 22 (19.0%) |
| $300,000 to $499,999 | 30 (43.5%) | 52 (44.8%) |
| $500,000 to $749,999 | 20 (29.0%) | 34 (29.3%) |
| $750,000 to $999,999 | 11 (15.9%) | 6 (5.2%) |
| $1,000,000 or more | 0 (0.0%) | 2 (1.7%) |
| Total | 69 (100.0%) | 116 (100.0%) |
Household Income by Mortgage Status in Plumas Eureka
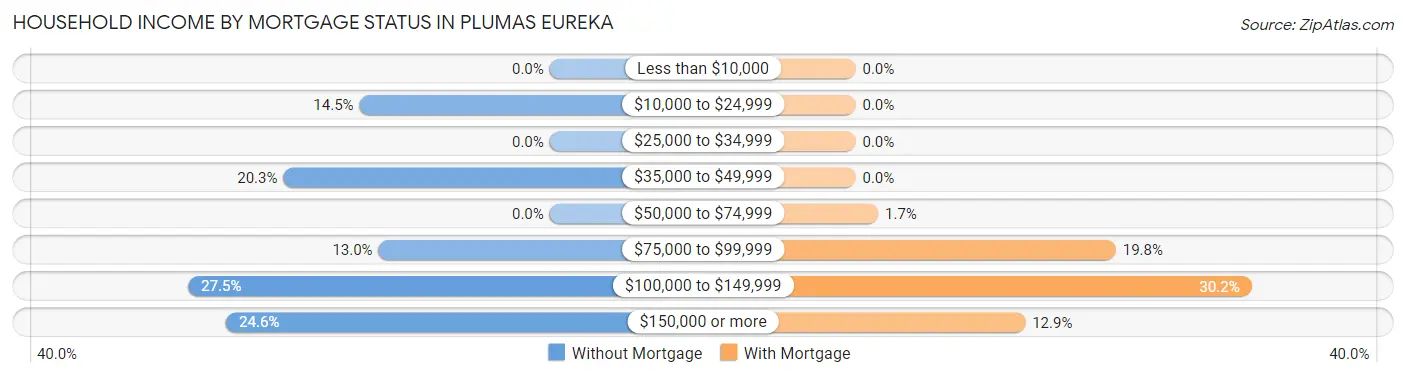
| Household Income | Without Mortgage | With Mortgage |
| Less than $10,000 | 0 (0.0%) | 0 (0.0%) |
| $10,000 to $24,999 | 10 (14.5%) | 0 (0.0%) |
| $25,000 to $34,999 | 0 (0.0%) | 0 (0.0%) |
| $35,000 to $49,999 | 14 (20.3%) | 0 (0.0%) |
| $50,000 to $74,999 | 0 (0.0%) | 2 (1.7%) |
| $75,000 to $99,999 | 9 (13.0%) | 23 (19.8%) |
| $100,000 to $149,999 | 19 (27.5%) | 35 (30.2%) |
| $150,000 or more | 17 (24.6%) | 15 (12.9%) |
| Total | 69 (100.0%) | 116 (100.0%) |
Property Value to Household Income Ratio in Plumas Eureka
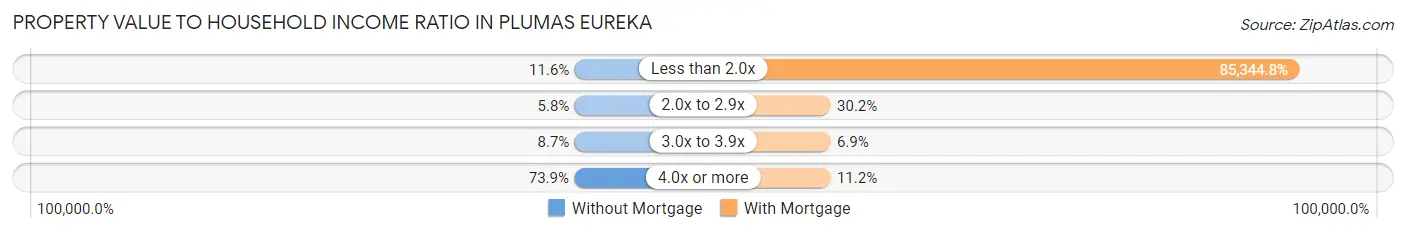
| Value-to-Income Ratio | Without Mortgage | With Mortgage |
| Less than 2.0x | 8 (11.6%) | 99,000 (85,344.8%) |
| 2.0x to 2.9x | 4 (5.8%) | 35 (30.2%) |
| 3.0x to 3.9x | 6 (8.7%) | 8 (6.9%) |
| 4.0x or more | 51 (73.9%) | 13 (11.2%) |
| Total | 69 (100.0%) | 116 (100.0%) |
Real Estate Taxes by Mortgage Status in Plumas Eureka
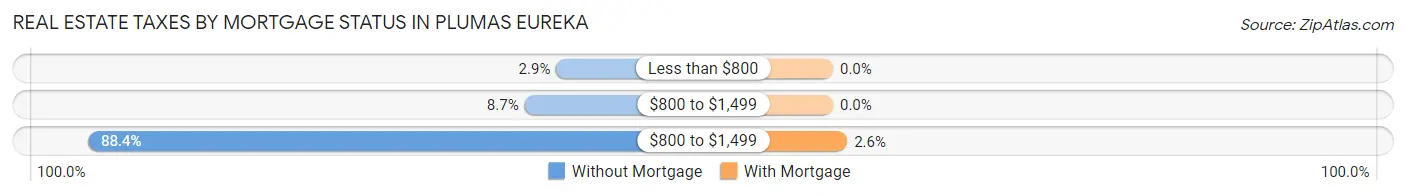
| Property Taxes | Without Mortgage | With Mortgage |
| Less than $800 | 2 (2.9%) | 0 (0.0%) |
| $800 to $1,499 | 6 (8.7%) | 0 (0.0%) |
| $800 to $1,499 | 61 (88.4%) | 3 (2.6%) |
| Total | 69 (100.0%) | 116 (100.0%) |
Health & Disability in Plumas Eureka
Health Insurance Coverage by Age in Plumas Eureka
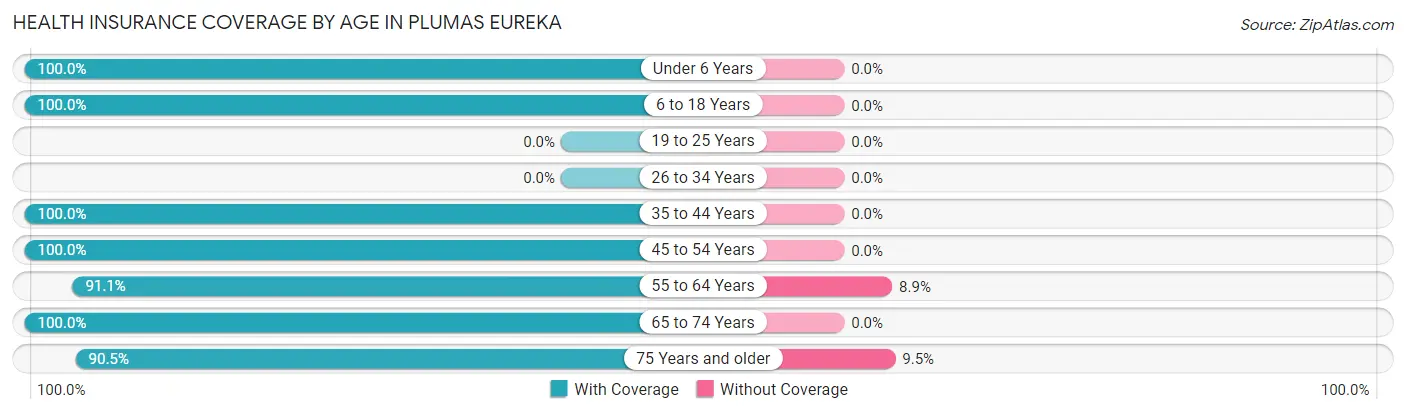
| Age Bracket | With Coverage | Without Coverage |
| Under 6 Years | 28 (100.0%) | 0 (0.0%) |
| 6 to 18 Years | 50 (100.0%) | 0 (0.0%) |
| 19 to 25 Years | 0 (0.0%) | 0 (0.0%) |
| 26 to 34 Years | 0 (0.0%) | 0 (0.0%) |
| 35 to 44 Years | 45 (100.0%) | 0 (0.0%) |
| 45 to 54 Years | 40 (100.0%) | 0 (0.0%) |
| 55 to 64 Years | 51 (91.1%) | 5 (8.9%) |
| 65 to 74 Years | 183 (100.0%) | 0 (0.0%) |
| 75 Years and older | 38 (90.5%) | 4 (9.5%) |
| Total | 435 (98.0%) | 9 (2.0%) |
Health Insurance Coverage by Citizenship Status in Plumas Eureka

| Citizenship Status | With Coverage | Without Coverage |
| Native Born | 28 (100.0%) | 0 (0.0%) |
| Foreign Born, Citizen | 50 (100.0%) | 0 (0.0%) |
| Foreign Born, not a Citizen | 0 (0.0%) | 0 (0.0%) |
Health Insurance Coverage by Household Income in Plumas Eureka
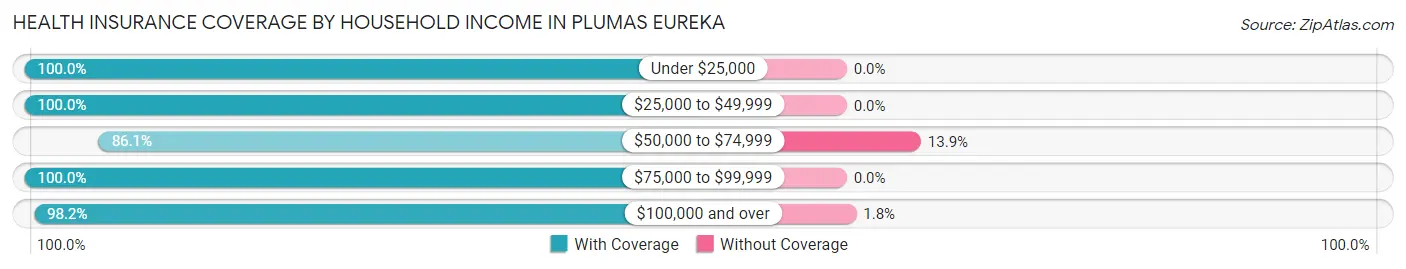
| Household Income | With Coverage | Without Coverage |
| Under $25,000 | 25 (100.0%) | 0 (0.0%) |
| $25,000 to $49,999 | 79 (100.0%) | 0 (0.0%) |
| $50,000 to $74,999 | 31 (86.1%) | 5 (13.9%) |
| $75,000 to $99,999 | 80 (100.0%) | 0 (0.0%) |
| $100,000 and over | 220 (98.2%) | 4 (1.8%) |
Public vs Private Health Insurance Coverage by Age in Plumas Eureka
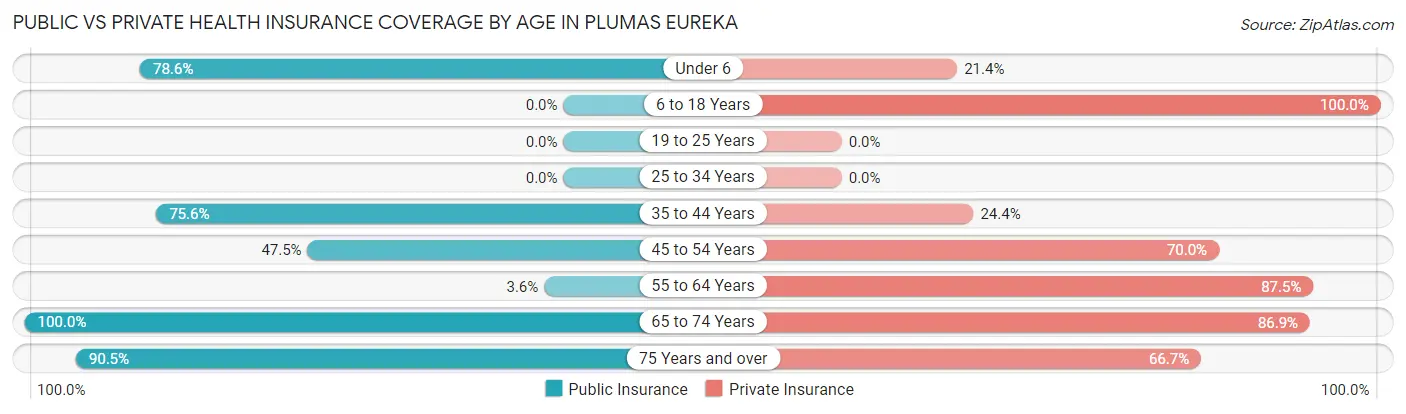
| Age Bracket | Public Insurance | Private Insurance |
| Under 6 | 22 (78.6%) | 6 (21.4%) |
| 6 to 18 Years | 0 (0.0%) | 50 (100.0%) |
| 19 to 25 Years | 0 (0.0%) | 0 (0.0%) |
| 25 to 34 Years | 0 (0.0%) | 0 (0.0%) |
| 35 to 44 Years | 34 (75.6%) | 11 (24.4%) |
| 45 to 54 Years | 19 (47.5%) | 28 (70.0%) |
| 55 to 64 Years | 2 (3.6%) | 49 (87.5%) |
| 65 to 74 Years | 183 (100.0%) | 159 (86.9%) |
| 75 Years and over | 38 (90.5%) | 28 (66.7%) |
| Total | 298 (67.1%) | 331 (74.6%) |
Disability Status by Sex by Age in Plumas Eureka
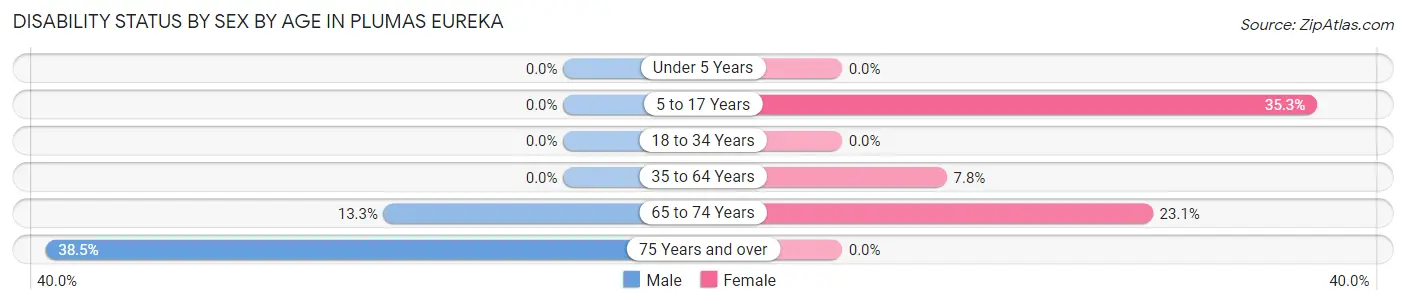
| Age Bracket | Male | Female |
| Under 5 Years | 0 (0.0%) | 0 (0.0%) |
| 5 to 17 Years | 0 (0.0%) | 12 (35.3%) |
| 18 to 34 Years | 0 (0.0%) | 0 (0.0%) |
| 35 to 64 Years | 0 (0.0%) | 7 (7.8%) |
| 65 to 74 Years | 14 (13.3%) | 18 (23.1%) |
| 75 Years and over | 10 (38.5%) | 0 (0.0%) |
Disability Class by Sex by Age in Plumas Eureka
Disability Class: Hearing Difficulty
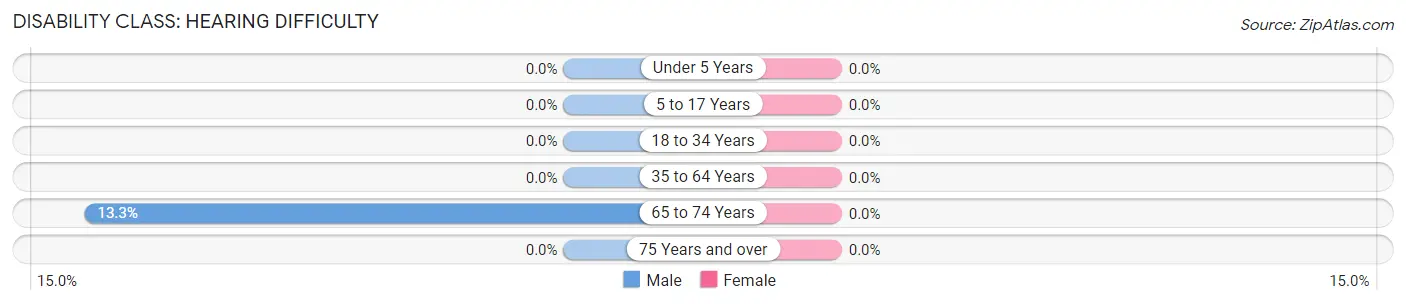
| Age Bracket | Male | Female |
| Under 5 Years | 0 (0.0%) | 0 (0.0%) |
| 5 to 17 Years | 0 (0.0%) | 0 (0.0%) |
| 18 to 34 Years | 0 (0.0%) | 0 (0.0%) |
| 35 to 64 Years | 0 (0.0%) | 0 (0.0%) |
| 65 to 74 Years | 14 (13.3%) | 0 (0.0%) |
| 75 Years and over | 0 (0.0%) | 0 (0.0%) |
Disability Class: Vision Difficulty
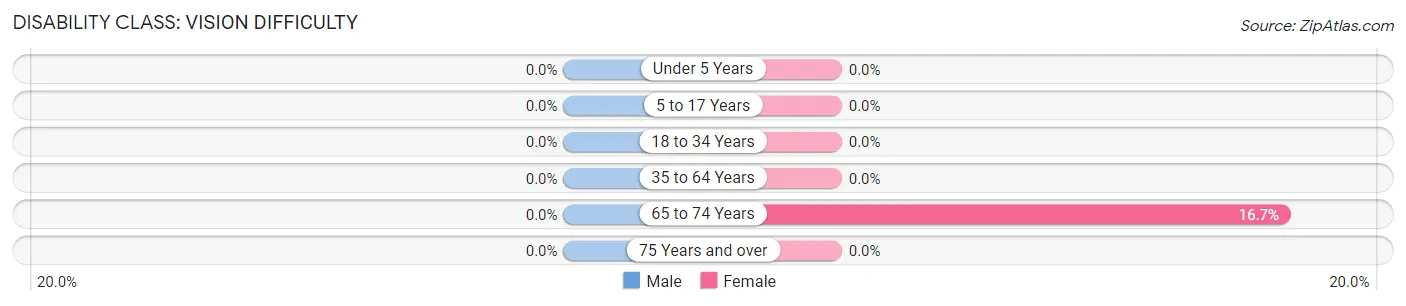
| Age Bracket | Male | Female |
| Under 5 Years | 0 (0.0%) | 0 (0.0%) |
| 5 to 17 Years | 0 (0.0%) | 0 (0.0%) |
| 18 to 34 Years | 0 (0.0%) | 0 (0.0%) |
| 35 to 64 Years | 0 (0.0%) | 0 (0.0%) |
| 65 to 74 Years | 0 (0.0%) | 13 (16.7%) |
| 75 Years and over | 0 (0.0%) | 0 (0.0%) |
Disability Class: Cognitive Difficulty
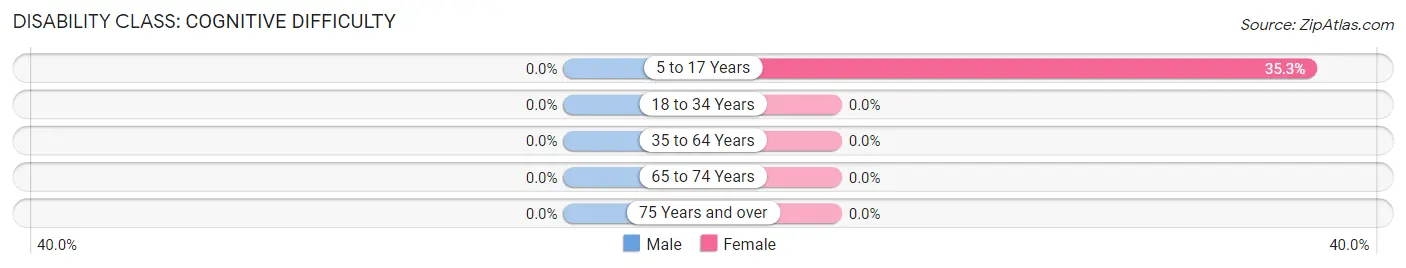
| Age Bracket | Male | Female |
| 5 to 17 Years | 0 (0.0%) | 12 (35.3%) |
| 18 to 34 Years | 0 (0.0%) | 0 (0.0%) |
| 35 to 64 Years | 0 (0.0%) | 0 (0.0%) |
| 65 to 74 Years | 0 (0.0%) | 0 (0.0%) |
| 75 Years and over | 0 (0.0%) | 0 (0.0%) |
Disability Class: Ambulatory Difficulty
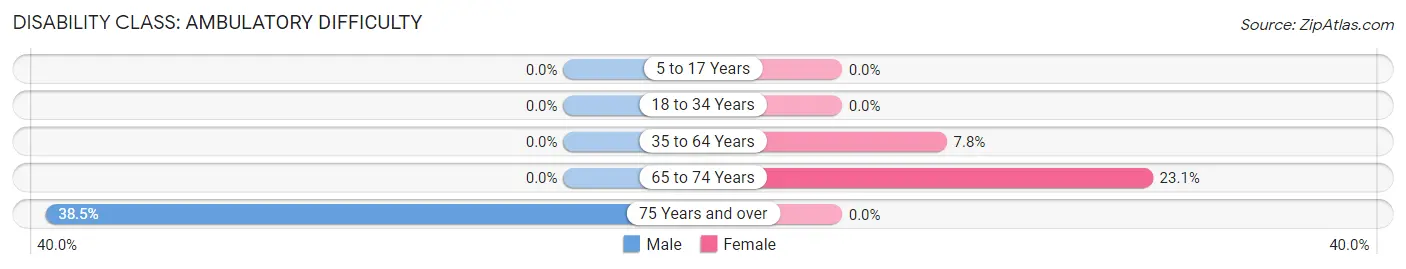
| Age Bracket | Male | Female |
| 5 to 17 Years | 0 (0.0%) | 0 (0.0%) |
| 18 to 34 Years | 0 (0.0%) | 0 (0.0%) |
| 35 to 64 Years | 0 (0.0%) | 7 (7.8%) |
| 65 to 74 Years | 0 (0.0%) | 18 (23.1%) |
| 75 Years and over | 10 (38.5%) | 0 (0.0%) |
Disability Class: Self-Care Difficulty
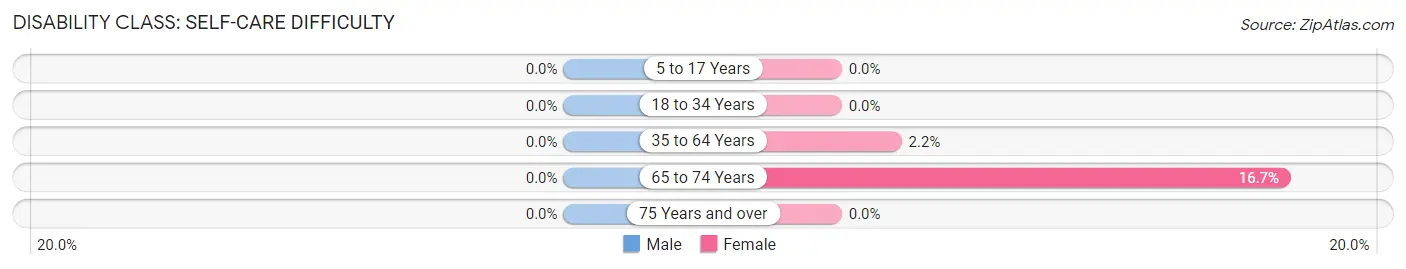
| Age Bracket | Male | Female |
| 5 to 17 Years | 0 (0.0%) | 0 (0.0%) |
| 18 to 34 Years | 0 (0.0%) | 0 (0.0%) |
| 35 to 64 Years | 0 (0.0%) | 2 (2.2%) |
| 65 to 74 Years | 0 (0.0%) | 13 (16.7%) |
| 75 Years and over | 0 (0.0%) | 0 (0.0%) |
Technology Access in Plumas Eureka
Computing Device Access in Plumas Eureka
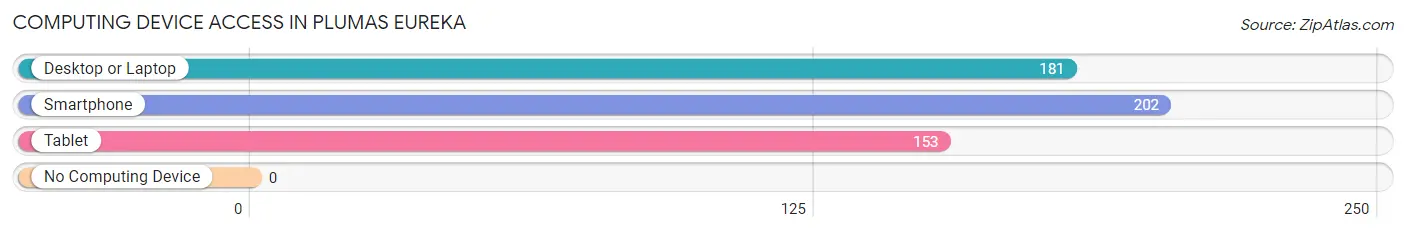
| Device Type | # Households | % Households |
| Desktop or Laptop | 181 | 80.1% |
| Smartphone | 202 | 89.4% |
| Tablet | 153 | 67.7% |
| No Computing Device | 0 | 0.0% |
| Total | 226 | 100.0% |
Internet Access in Plumas Eureka
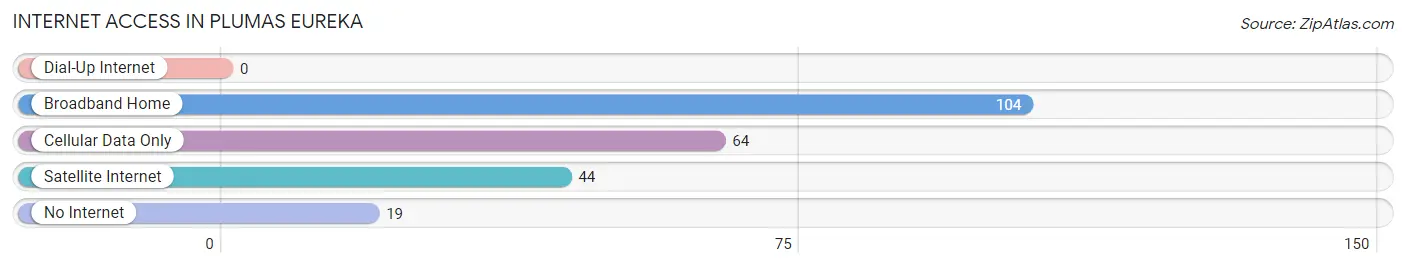
| Internet Type | # Households | % Households |
| Dial-Up Internet | 0 | 0.0% |
| Broadband Home | 104 | 46.0% |
| Cellular Data Only | 64 | 28.3% |
| Satellite Internet | 44 | 19.5% |
| No Internet | 19 | 8.4% |
| Total | 226 | 100.0% |
Plumas Eureka Summary
Plumas Eureka is a small unincorporated community located in the Sierra Nevada mountain range in Plumas County, California. It is situated at an elevation of 5,945 feet (1,812 m) and is located approximately 20 miles (32 km) east of Quincy, the county seat. The community is surrounded by the Plumas National Forest and is home to the Plumas Eureka State Park, which is a popular destination for outdoor recreation.
History
The area around Plumas Eureka has a long and rich history. The first inhabitants of the area were the Maidu and Washoe Native American tribes, who lived in the area for thousands of years before the arrival of European settlers. The first recorded European to visit the area was John C. Fremont, who passed through in 1844.
In 1851, a group of miners led by John Eureka discovered gold in the area and established the town of Eureka. The town quickly grew and by 1854, it had a population of over 1,000 people. The town was named after the Greek word for “discovery” and was the first incorporated town in Plumas County.
In 1855, the town was renamed Plumas Eureka and the post office was established. The town continued to grow and by 1860, it had a population of over 2,000 people. The town was home to several businesses, including a hotel, saloon, blacksmith shop, and several stores.
In 1864, the town was destroyed by a fire and many of the buildings were never rebuilt. The town slowly declined and by the early 1900s, the population had dropped to just over 100 people.
Geography
Plumas Eureka is located in the Sierra Nevada mountain range in Plumas County, California. It is situated at an elevation of 5,945 feet (1,812 m) and is located approximately 20 miles (32 km) east of Quincy, the county seat. The community is surrounded by the Plumas National Forest and is home to the Plumas Eureka State Park, which is a popular destination for outdoor recreation.
The climate in Plumas Eureka is classified as a humid continental climate, with warm summers and cold winters. The average annual temperature is 45°F (7°C) and the average annual precipitation is 28 inches (71 cm).
Economy
The economy of Plumas Eureka is largely based on tourism and outdoor recreation. The Plumas Eureka State Park is a popular destination for camping, hiking, fishing, and other outdoor activities. The park is also home to the Plumas Eureka Ski Area, which offers skiing and snowboarding in the winter months.
In addition to tourism, the town is also home to several small businesses, including a general store, a restaurant, and a gas station. The town is also home to a small sawmill, which provides lumber for the local area.
Demographics
As of the 2010 census, the population of Plumas Eureka was 545 people. The racial makeup of the town was 95.3% White, 0.2% African American, 0.7% Native American, 0.4% Asian, 0.2% Pacific Islander, and 2.2% from other races. The median household income was $37,500 and the median family income was $41,250. The per capita income was $19,890.
Conclusion
Plumas Eureka is a small unincorporated community located in the Sierra Nevada mountain range in Plumas County, California. It is situated at an elevation of 5,945 feet (1,812 m) and is located approximately 20 miles (32 km) east of Quincy, the county seat. The community is surrounded by the Plumas National Forest and is home to the Plumas Eureka State Park, which is a popular destination for outdoor recreation. The economy of Plumas Eureka is largely based on tourism and outdoor recreation, and the town is home to a population of 545 people.
Common Questions
What is the Total Population of Plumas Eureka?
Total Population of Plumas Eureka is 444.
What is the Total Male Population of Plumas Eureka?
Total Male Population of Plumas Eureka is 211.
What is the Total Female Population of Plumas Eureka?
Total Female Population of Plumas Eureka is 233.
What is the Ratio of Males per 100 Females in Plumas Eureka?
There are 90.56 Males per 100 Females in Plumas Eureka.
What is the Ratio of Females per 100 Males in Plumas Eureka?
There are 110.43 Females per 100 Males in Plumas Eureka.
What is the Median Population Age in Plumas Eureka?
Median Population Age in Plumas Eureka is 65.2 Years.
What is the Average Family Size in Plumas Eureka
Average Family Size in Plumas Eureka is 2.4 People.
What is the Average Household Size in Plumas Eureka
Average Household Size in Plumas Eureka is 2.0 People.
What is Per Capita Income in Plumas Eureka?
Per Capita income in Plumas Eureka is $63,073.
What is the Median Family Income in Plumas Eureka?
Median Family Income in Plumas Eureka is $111,667.
What is the Median Household income in Plumas Eureka?
Median Household Income in Plumas Eureka is $86,250.
What is Inequality or Gini Index in Plumas Eureka?
Inequality or Gini Index in Plumas Eureka is 0.43.
How Large is the Labor Force in Plumas Eureka?
There are 152 People in the Labor Forcein in Plumas Eureka.
What is the Percentage of People in the Labor Force in Plumas Eureka?
38.0% of People are in the Labor Force in Plumas Eureka.
What is the Unemployment Rate in Plumas Eureka?
Unemployment Rate in Plumas Eureka is 5.9%.