Monterey Park Tract, CA
Monterey Park Tract Map
Monterey Park Tract Overview
138
TOTAL POPULATION
64
MALE POPULATION
74
FEMALE POPULATION
86.49
MALES / 100 FEMALES
115.62
FEMALES / 100 MALES
21.7
MEDIAN AGE
5.2
AVG FAMILY SIZE
5.1
AVG HOUSEHOLD SIZE
$21,683
PER CAPITA INCOME
63.7%
WAGE / INCOME GAP [ % ]
36.3¢/ $1
WAGE / INCOME GAP [ $ ]
0.24
INEQUALITY / GINI INDEX
82
LABOR FORCE [ PEOPLE ]
71.3%
PERCENT IN LABOR FORCE
23.2%
UNEMPLOYMENT RATE
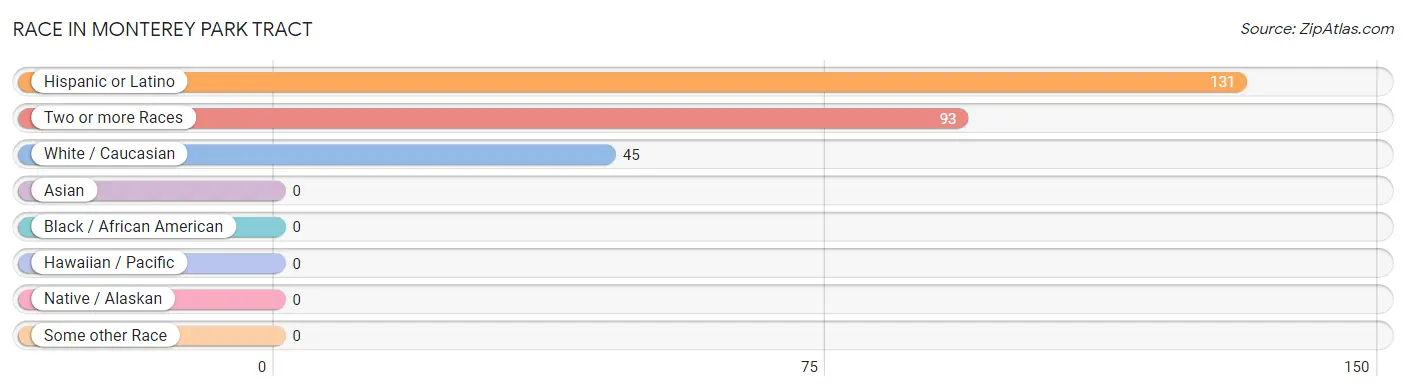
Race in Monterey Park Tract
The most populous races in Monterey Park Tract are Hispanic or Latino (131 | 94.9%), Two or more Races (93 | 67.4%), and White / Caucasian (45 | 32.6%).
| Race | # Population | % Population |
| Asian | 0 | 0.0% |
| Black / African American | 0 | 0.0% |
| Hawaiian / Pacific | 0 | 0.0% |
| Hispanic or Latino | 131 | 94.9% |
| Native / Alaskan | 0 | 0.0% |
| White / Caucasian | 45 | 32.6% |
| Two or more Races | 93 | 67.4% |
| Some other Race | 0 | 0.0% |
| Total | 138 | 100.0% |
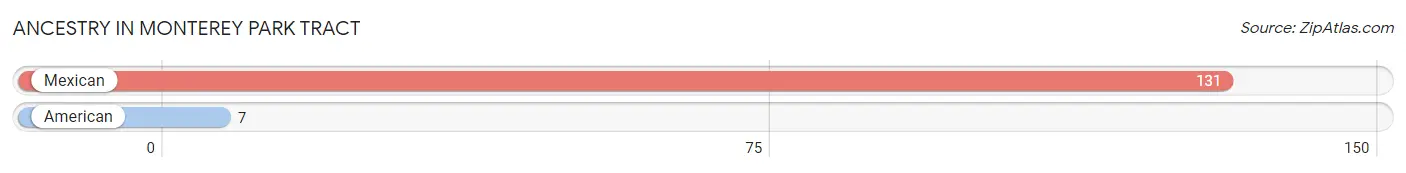
Ancestry in Monterey Park Tract
The most populous ancestries reported in Monterey Park Tract are Mexican (131 | 94.9%), and American (7 | 5.1%), together accounting for 100.0% of all Monterey Park Tract residents.
| Ancestry | # Population | % Population |
| American | 7 | 5.1% |
| Mexican | 131 | 94.9% | View All 2 Rows |
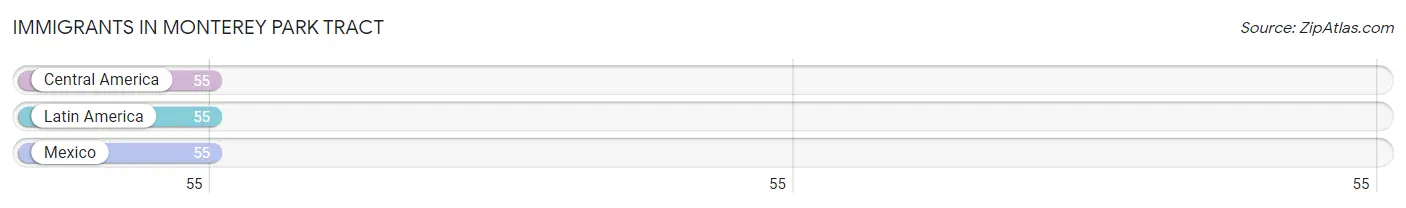
Immigrants in Monterey Park Tract
The most numerous immigrant groups reported in Monterey Park Tract came from Central America (55 | 39.9%), Latin America (55 | 39.9%), and Mexico (55 | 39.9%), together accounting for 119.6% of all Monterey Park Tract residents.
| Immigration Origin | # Population | % Population |
| Central America | 55 | 39.9% |
| Latin America | 55 | 39.9% |
| Mexico | 55 | 39.9% | View All 3 Rows |
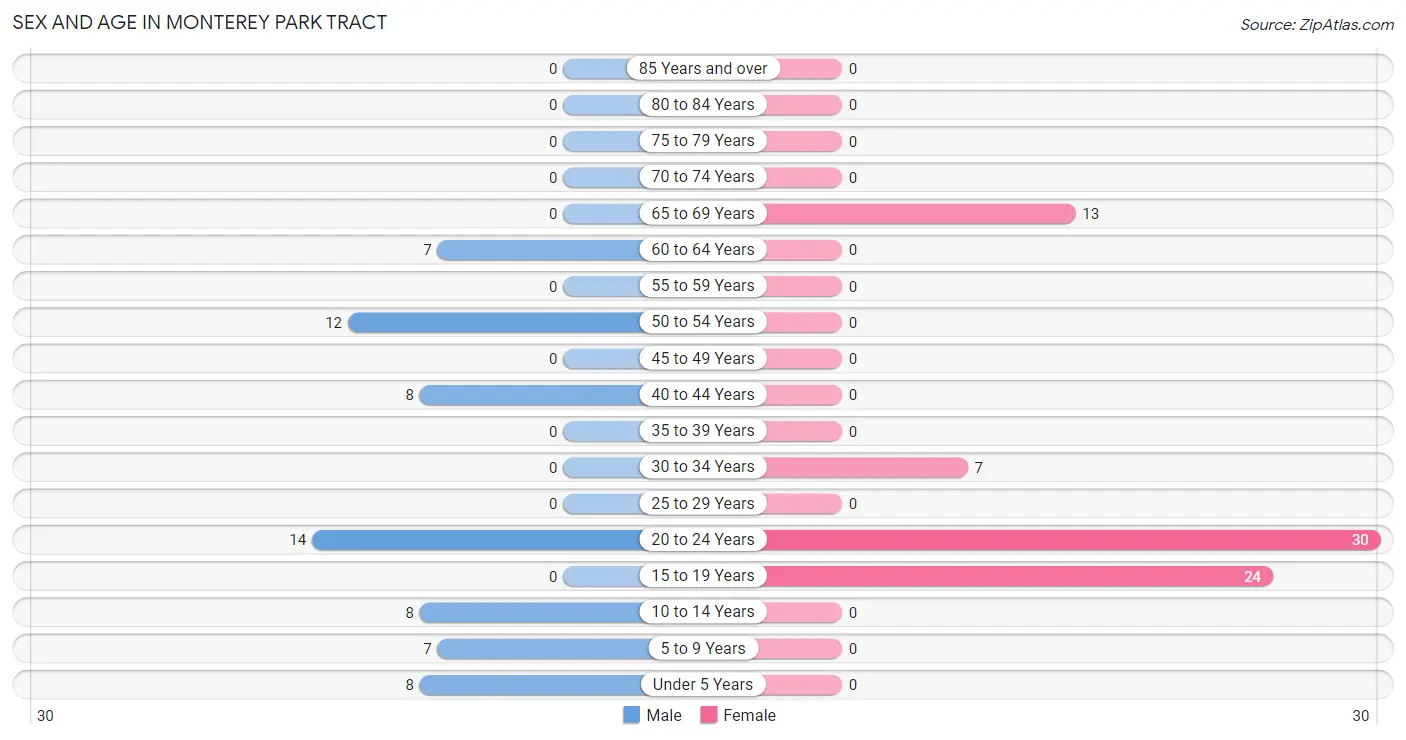
Sex and Age in Monterey Park Tract
Sex and Age in Monterey Park Tract
The most populous age groups in Monterey Park Tract are 20 to 24 Years (14 | 21.9%) for men and 20 to 24 Years (30 | 40.5%) for women.
| Age Bracket | Male | Female |
| Under 5 Years | 8 (12.5%) | 0 (0.0%) |
| 5 to 9 Years | 7 (10.9%) | 0 (0.0%) |
| 10 to 14 Years | 8 (12.5%) | 0 (0.0%) |
| 15 to 19 Years | 0 (0.0%) | 24 (32.4%) |
| 20 to 24 Years | 14 (21.9%) | 30 (40.5%) |
| 25 to 29 Years | 0 (0.0%) | 0 (0.0%) |
| 30 to 34 Years | 0 (0.0%) | 7 (9.5%) |
| 35 to 39 Years | 0 (0.0%) | 0 (0.0%) |
| 40 to 44 Years | 8 (12.5%) | 0 (0.0%) |
| 45 to 49 Years | 0 (0.0%) | 0 (0.0%) |
| 50 to 54 Years | 12 (18.8%) | 0 (0.0%) |
| 55 to 59 Years | 0 (0.0%) | 0 (0.0%) |
| 60 to 64 Years | 7 (10.9%) | 0 (0.0%) |
| 65 to 69 Years | 0 (0.0%) | 13 (17.6%) |
| 70 to 74 Years | 0 (0.0%) | 0 (0.0%) |
| 75 to 79 Years | 0 (0.0%) | 0 (0.0%) |
| 80 to 84 Years | 0 (0.0%) | 0 (0.0%) |
| 85 Years and over | 0 (0.0%) | 0 (0.0%) |
| Total | 64 (100.0%) | 74 (100.0%) |
Families and Households in Monterey Park Tract
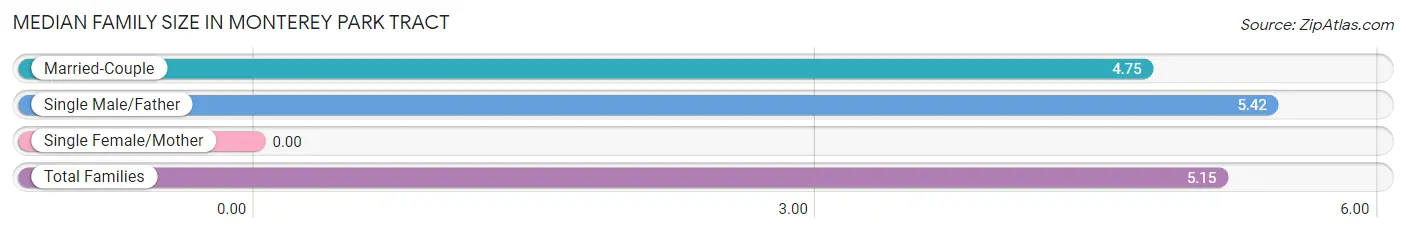
Median Family Size in Monterey Park Tract
| Family Type | # Families | Family Size |
| Married-Couple | 8 (40.0%) | 4.75 |
| Single Male/Father | 12 (60.0%) | 5.42 |
| Single Female/Mother | 0 (0.0%) | - |
| Total Families | 20 (100.0%) | 5.15 |
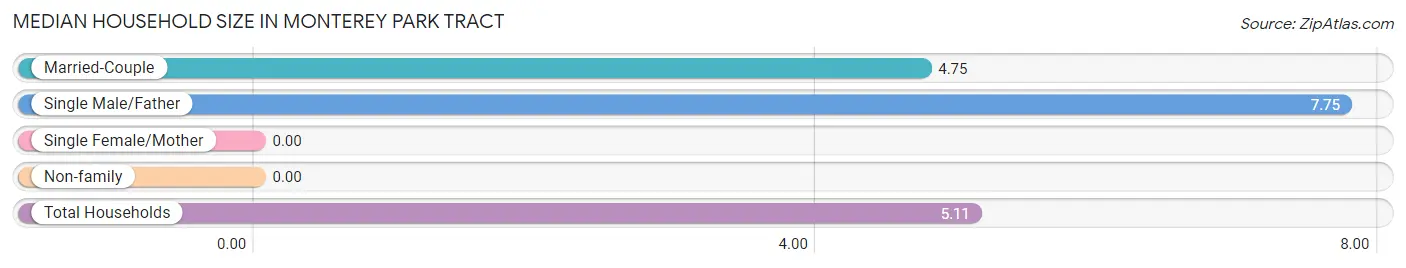
Median Household Size in Monterey Park Tract
| Household Type | # Households | Household Size |
| Married-Couple | 8 (29.6%) | 4.75 |
| Single Male/Father | 12 (44.4%) | 7.75 |
| Single Female/Mother | 0 (0.0%) | - |
| Non-family | 7 (25.9%) | - |
| Total Households | 27 (100.0%) | 5.11 |
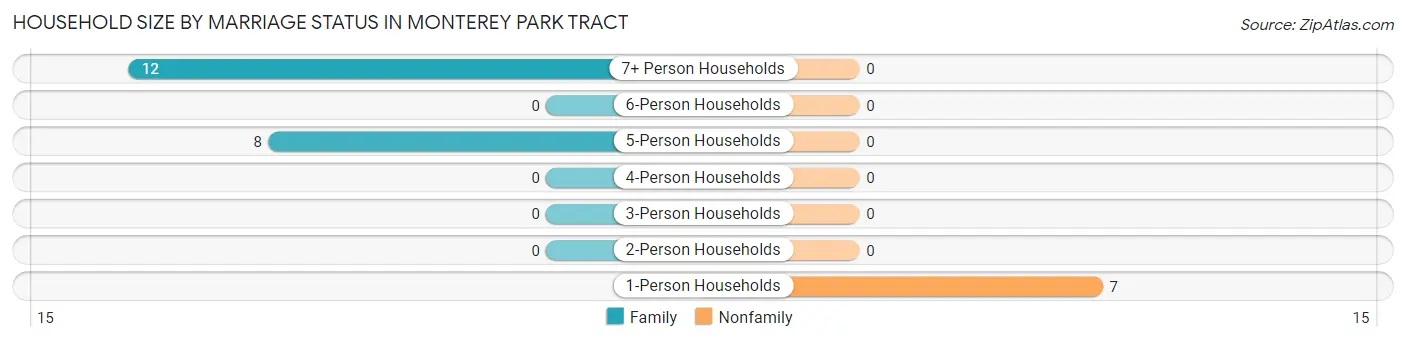
Household Size by Marriage Status in Monterey Park Tract
Out of a total of 27 households in Monterey Park Tract, 20 (74.1%) are family households, while 7 (25.9%) are nonfamily households. The most numerous type of family households are 7+ person households, comprising 12, and the most common type of nonfamily households are 1-person households, comprising 7.
| Household Size | Family Households | Nonfamily Households |
| 1-Person Households | - | 7 (25.9%) |
| 2-Person Households | 0 (0.0%) | 0 (0.0%) |
| 3-Person Households | 0 (0.0%) | 0 (0.0%) |
| 4-Person Households | 0 (0.0%) | 0 (0.0%) |
| 5-Person Households | 8 (29.6%) | 0 (0.0%) |
| 6-Person Households | 0 (0.0%) | 0 (0.0%) |
| 7+ Person Households | 12 (44.4%) | 0 (0.0%) |
| Total | 20 (74.1%) | 7 (25.9%) |
Female Fertility in Monterey Park Tract
Fertility by Age in Monterey Park Tract
| Age Bracket | Women with Births | Births / 1,000 Women |
| 15 to 19 years | 0 (0.0%) | 0.0 |
| 20 to 34 years | 0 (0.0%) | 0.0 |
| 35 to 50 years | 0 (0.0%) | 0.0 |
| Total | 0 (0.0%) | 0.0 |
Fertility by Age by Marriage Status in Monterey Park Tract
| Age Bracket | Married | Unmarried |
| 15 to 19 years | 0 (0.0%) | 0 (0.0%) |
| 20 to 34 years | 0 (0.0%) | 0 (0.0%) |
| 35 to 50 years | 0 (0.0%) | 0 (0.0%) |
| Total | 0 (0.0%) | 0 (0.0%) |
Fertility by Education in Monterey Park Tract
| Educational Attainment | Women with Births | Births / 1,000 Women |
| Less than High School | 0 (0.0%) | 0.0 |
| High School Diploma | 0 (0.0%) | 0.0 |
| College or Associate's Degree | 0 (0.0%) | 0.0 |
| Bachelor's Degree | 0 (0.0%) | 0.0 |
| Graduate Degree | 0 (0.0%) | 0.0 |
| Total | 0 (0.0%) | 0.0 |
Fertility by Education by Marriage Status in Monterey Park Tract
| Educational Attainment | Married | Unmarried |
| Less than High School | 0 (0.0%) | 0 (0.0%) |
| High School Diploma | 0 (0.0%) | 0 (0.0%) |
| College or Associate's Degree | 0 (0.0%) | 0 (0.0%) |
| Bachelor's Degree | 0 (0.0%) | 0 (0.0%) |
| Graduate Degree | 0 (0.0%) | 0 (0.0%) |
| Total | 0 (0.0%) | 0 (0.0%) |
Income in Monterey Park Tract
Income Overview in Monterey Park Tract
| Characteristic | Number | Measure |
| Per Capita Income | 138 | $21,683 |
| Median Family Income | 20 | $0 |
| Mean Family Income | 20 | $0 |
| Median Household Income | 27 | $0 |
| Mean Household Income | 27 | $104,722 |
| Income Deficit | 20 | $0 |
| Wage / Income Gap (%) | 138 | 63.71% |
| Wage / Income Gap ($) | 138 | 36.29¢ per $1 |
| Gini / Inequality Index | 138 | 0.24 |
Earnings by Sex in Monterey Park Tract
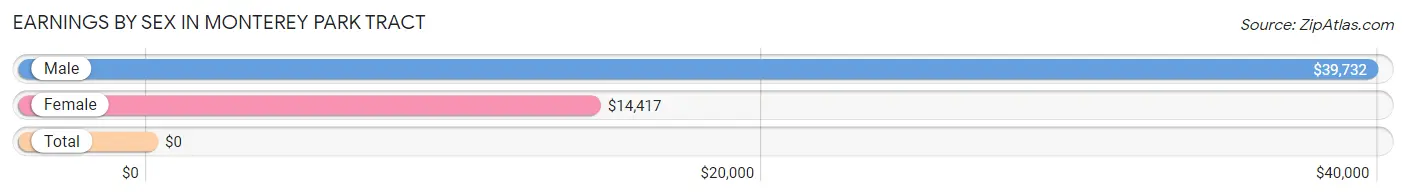
| Sex | Number | Average Earnings |
| Male | 41 (52.6%) | $39,732 |
| Female | 37 (47.4%) | $14,417 |
| Total | 78 (100.0%) | $0 |
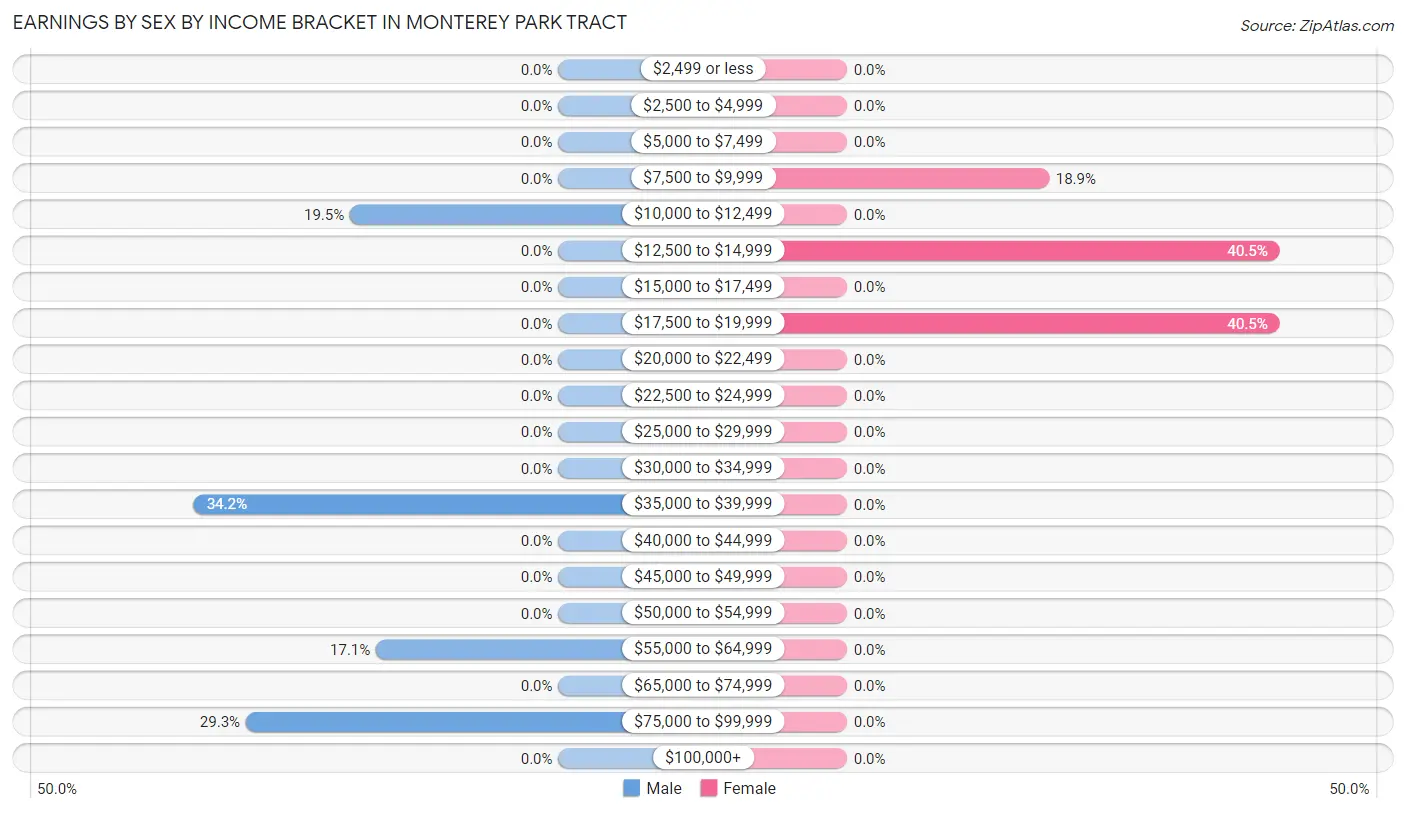
Earnings by Sex by Income Bracket in Monterey Park Tract
The most common earnings brackets in Monterey Park Tract are $35,000 to $39,999 for men (14 | 34.2%) and $12,500 to $14,999 for women (15 | 40.5%).
| Income | Male | Female |
| $2,499 or less | 0 (0.0%) | 0 (0.0%) |
| $2,500 to $4,999 | 0 (0.0%) | 0 (0.0%) |
| $5,000 to $7,499 | 0 (0.0%) | 0 (0.0%) |
| $7,500 to $9,999 | 0 (0.0%) | 7 (18.9%) |
| $10,000 to $12,499 | 8 (19.5%) | 0 (0.0%) |
| $12,500 to $14,999 | 0 (0.0%) | 15 (40.5%) |
| $15,000 to $17,499 | 0 (0.0%) | 0 (0.0%) |
| $17,500 to $19,999 | 0 (0.0%) | 15 (40.5%) |
| $20,000 to $22,499 | 0 (0.0%) | 0 (0.0%) |
| $22,500 to $24,999 | 0 (0.0%) | 0 (0.0%) |
| $25,000 to $29,999 | 0 (0.0%) | 0 (0.0%) |
| $30,000 to $34,999 | 0 (0.0%) | 0 (0.0%) |
| $35,000 to $39,999 | 14 (34.2%) | 0 (0.0%) |
| $40,000 to $44,999 | 0 (0.0%) | 0 (0.0%) |
| $45,000 to $49,999 | 0 (0.0%) | 0 (0.0%) |
| $50,000 to $54,999 | 0 (0.0%) | 0 (0.0%) |
| $55,000 to $64,999 | 7 (17.1%) | 0 (0.0%) |
| $65,000 to $74,999 | 0 (0.0%) | 0 (0.0%) |
| $75,000 to $99,999 | 12 (29.3%) | 0 (0.0%) |
| $100,000+ | 0 (0.0%) | 0 (0.0%) |
| Total | 41 (100.0%) | 37 (100.0%) |
Earnings by Sex by Educational Attainment in Monterey Park Tract
| Educational Attainment | Male Income | Female Income |
| Less than High School | - | - |
| High School Diploma | - | - |
| College or Associate's Degree | - | - |
| Bachelor's Degree | - | - |
| Graduate Degree | - | - |
| Total | - | - |
Family Income in Monterey Park Tract
Family Income Brackets in Monterey Park Tract
According to the Monterey Park Tract family income data, there are 12 families falling into the $100,000 to $149,999 income range, which is the most common income bracket and makes up 60.0% of all families.
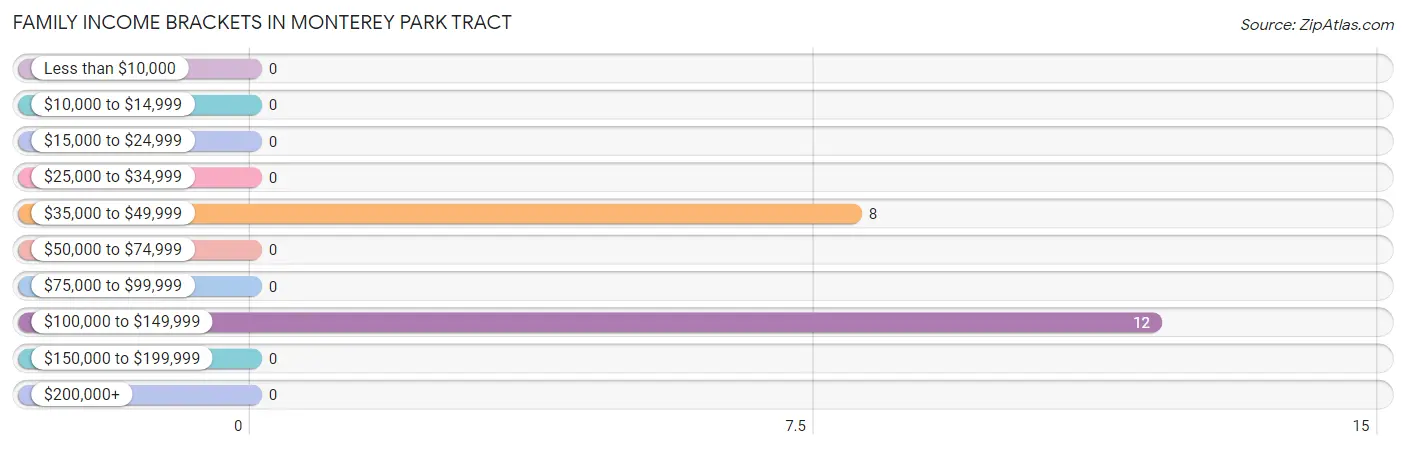
| Income Bracket | # Families | % Families |
| Less than $10,000 | 0 | 0.0% |
| $10,000 to $14,999 | 0 | 0.0% |
| $15,000 to $24,999 | 0 | 0.0% |
| $25,000 to $34,999 | 0 | 0.0% |
| $35,000 to $49,999 | 8 | 40.0% |
| $50,000 to $74,999 | 0 | 0.0% |
| $75,000 to $99,999 | 0 | 0.0% |
| $100,000 to $149,999 | 12 | 60.0% |
| $150,000 to $199,999 | 0 | 0.0% |
| $200,000+ | 0 | 0.0% |
Family Income by Famaliy Size in Monterey Park Tract
| Income Bracket | # Families | Median Income |
| 2-Person Families | 0 (0.0%) | $0 |
| 3-Person Families | 0 (0.0%) | $0 |
| 4-Person Families | 0 (0.0%) | $0 |
| 5-Person Families | 20 (100.0%) | $0 |
| 6-Person Families | 0 (0.0%) | $0 |
| 7+ Person Families | 0 (0.0%) | $0 |
| Total | 20 (100.0%) | $0 |
Family Income by Number of Earners in Monterey Park Tract
| Number of Earners | # Families | Median Income |
| No Earners | 0 (0.0%) | $0 |
| 1 Earner | 0 (0.0%) | $0 |
| 2 Earners | 8 (40.0%) | $0 |
| 3+ Earners | 12 (60.0%) | $0 |
| Total | 20 (100.0%) | $0 |
Household Income in Monterey Park Tract
Household Income Brackets in Monterey Park Tract
With 12 households falling in the category, the $150,000 to $199,999 income range is the most frequent in Monterey Park Tract, accounting for 44.4% of all households.
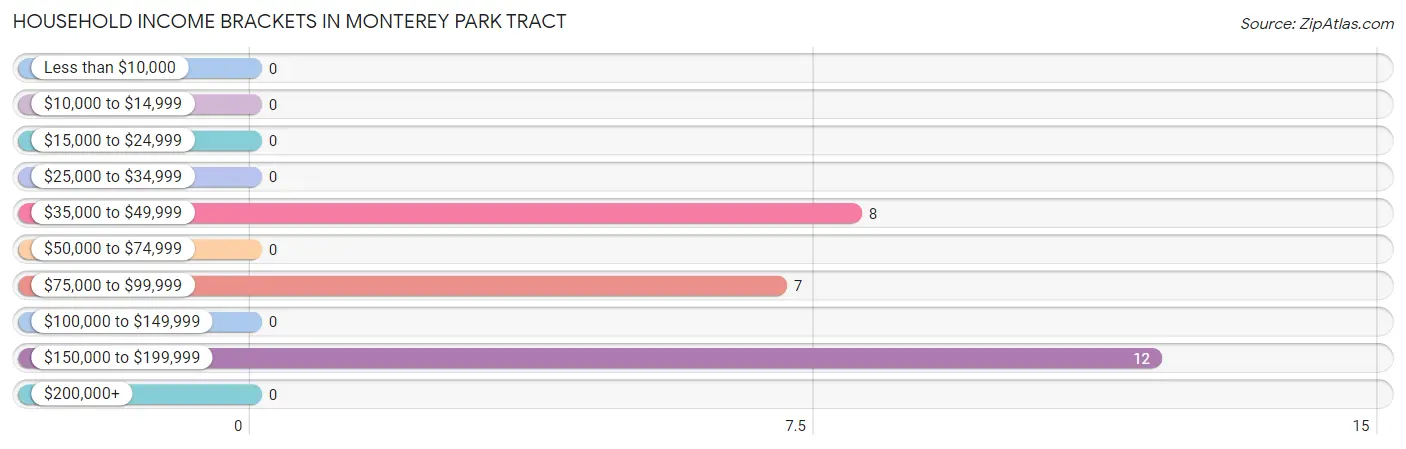
| Income Bracket | # Households | % Households |
| Less than $10,000 | 0 | 0.0% |
| $10,000 to $14,999 | 0 | 0.0% |
| $15,000 to $24,999 | 0 | 0.0% |
| $25,000 to $34,999 | 0 | 0.0% |
| $35,000 to $49,999 | 8 | 29.6% |
| $50,000 to $74,999 | 0 | 0.0% |
| $75,000 to $99,999 | 7 | 25.9% |
| $100,000 to $149,999 | 0 | 0.0% |
| $150,000 to $199,999 | 12 | 44.4% |
| $200,000+ | 0 | 0.0% |
Household Income by Householder Age in Monterey Park Tract
| Income Bracket | # Households | Median Income |
| 15 to 24 Years | 0 (0.0%) | $0 |
| 25 to 44 Years | 8 (29.6%) | $0 |
| 45 to 64 Years | 19 (70.4%) | $0 |
| 65+ Years | 0 (0.0%) | $0 |
| Total | 27 (100.0%) | $0 |
Poverty in Monterey Park Tract
Income Below Poverty by Sex and Age in Monterey Park Tract
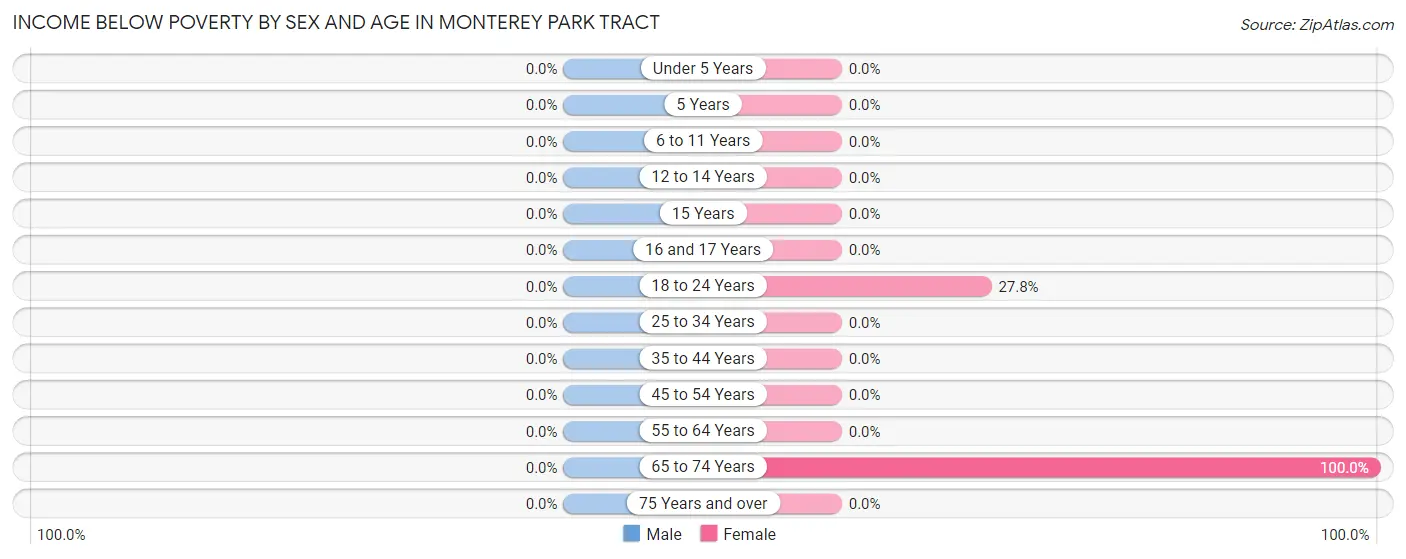
| Age Bracket | Male | Female |
| Under 5 Years | 0 (0.0%) | 0 (0.0%) |
| 5 Years | 0 (0.0%) | 0 (0.0%) |
| 6 to 11 Years | 0 (0.0%) | 0 (0.0%) |
| 12 to 14 Years | 0 (0.0%) | 0 (0.0%) |
| 15 Years | 0 (0.0%) | 0 (0.0%) |
| 16 and 17 Years | 0 (0.0%) | 0 (0.0%) |
| 18 to 24 Years | 0 (0.0%) | 15 (27.8%) |
| 25 to 34 Years | 0 (0.0%) | 0 (0.0%) |
| 35 to 44 Years | 0 (0.0%) | 0 (0.0%) |
| 45 to 54 Years | 0 (0.0%) | 0 (0.0%) |
| 55 to 64 Years | 0 (0.0%) | 0 (0.0%) |
| 65 to 74 Years | 0 (0.0%) | 13 (100.0%) |
| 75 Years and over | 0 (0.0%) | 0 (0.0%) |
| Total | 0 (0.0%) | 28 (37.8%) |
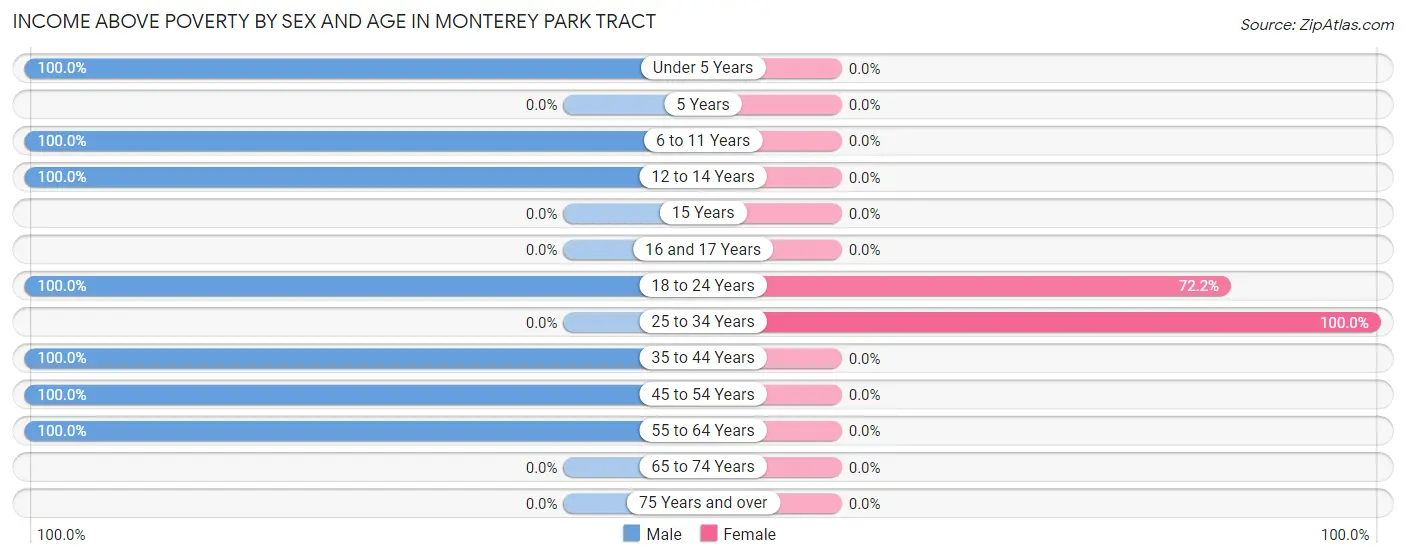
Income Above Poverty by Sex and Age in Monterey Park Tract
According to the poverty statistics in Monterey Park Tract, males aged under 5 years and females aged 25 to 34 years are the age groups that are most secure financially, with 100.0% of males and 100.0% of females in these age groups living above the poverty line.
| Age Bracket | Male | Female |
| Under 5 Years | 8 (100.0%) | 0 (0.0%) |
| 5 Years | 0 (0.0%) | 0 (0.0%) |
| 6 to 11 Years | 7 (100.0%) | 0 (0.0%) |
| 12 to 14 Years | 8 (100.0%) | 0 (0.0%) |
| 15 Years | 0 (0.0%) | 0 (0.0%) |
| 16 and 17 Years | 0 (0.0%) | 0 (0.0%) |
| 18 to 24 Years | 14 (100.0%) | 39 (72.2%) |
| 25 to 34 Years | 0 (0.0%) | 7 (100.0%) |
| 35 to 44 Years | 8 (100.0%) | 0 (0.0%) |
| 45 to 54 Years | 12 (100.0%) | 0 (0.0%) |
| 55 to 64 Years | 7 (100.0%) | 0 (0.0%) |
| 65 to 74 Years | 0 (0.0%) | 0 (0.0%) |
| 75 Years and over | 0 (0.0%) | 0 (0.0%) |
| Total | 64 (100.0%) | 46 (62.2%) |
Income Below Poverty Among Married-Couple Families in Monterey Park Tract
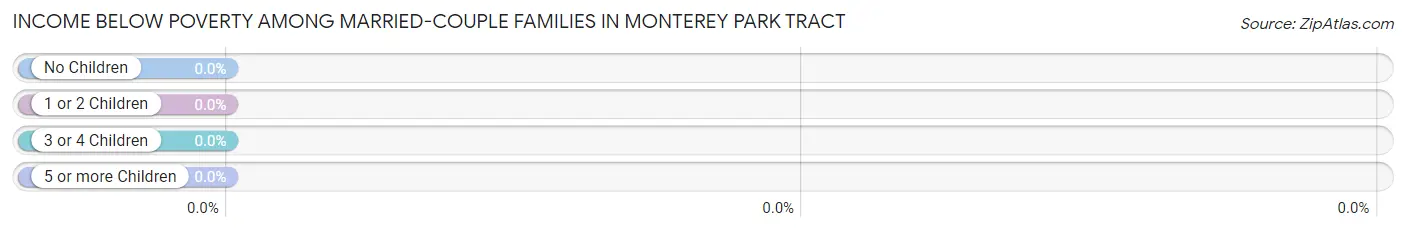
| Children | Above Poverty | Below Poverty |
| No Children | 0 (0.0%) | 0 (0.0%) |
| 1 or 2 Children | 0 (0.0%) | 0 (0.0%) |
| 3 or 4 Children | 8 (100.0%) | 0 (0.0%) |
| 5 or more Children | 0 (0.0%) | 0 (0.0%) |
| Total | 8 (100.0%) | 0 (0.0%) |
Income Below Poverty Among Single-Parent Households in Monterey Park Tract
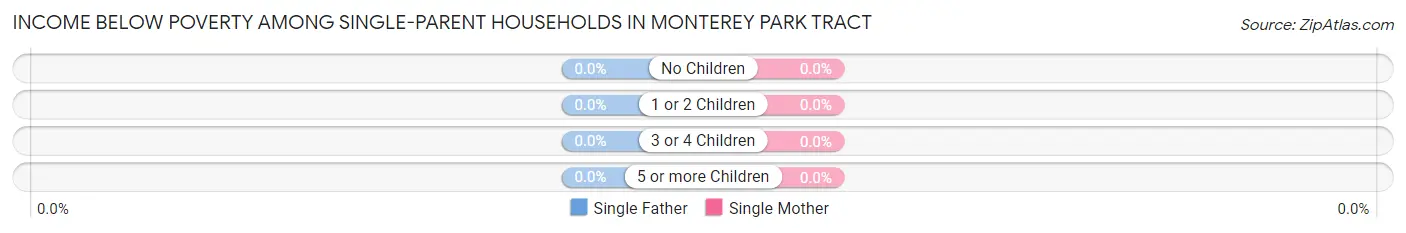
| Children | Single Father | Single Mother |
| No Children | 0 (0.0%) | 0 (0.0%) |
| 1 or 2 Children | 0 (0.0%) | 0 (0.0%) |
| 3 or 4 Children | 0 (0.0%) | 0 (0.0%) |
| 5 or more Children | 0 (0.0%) | 0 (0.0%) |
| Total | 0 (0.0%) | 0 (0.0%) |
Income Below Poverty Among Married-Couple vs Single-Parent Households in Monterey Park Tract
| Children | Married-Couple Families | Single-Parent Households |
| No Children | 0 (0.0%) | 0 (0.0%) |
| 1 or 2 Children | 0 (0.0%) | 0 (0.0%) |
| 3 or 4 Children | 0 (0.0%) | 0 (0.0%) |
| 5 or more Children | 0 (0.0%) | 0 (0.0%) |
| Total | 0 (0.0%) | 0 (0.0%) |
Employment Characteristics in Monterey Park Tract
Employment by Class of Employer in Monterey Park Tract
Among the 63 employed individuals in Monterey Park Tract, private company employees (48 | 76.2%), and self-employed (not incorporated) (15 | 23.8%) make up the most common classes of employment.
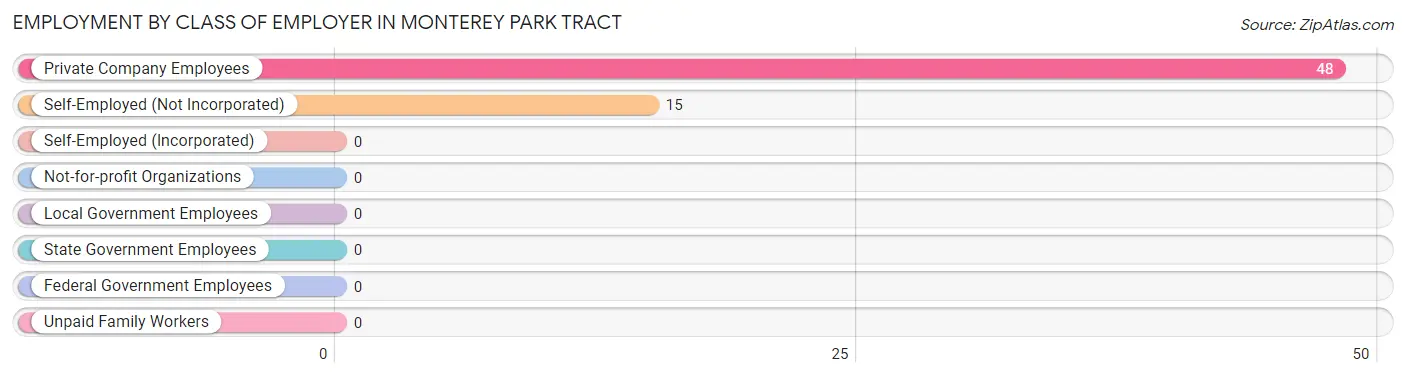
| Employer Class | # Employees | % Employees |
| Private Company Employees | 48 | 76.2% |
| Self-Employed (Incorporated) | 0 | 0.0% |
| Self-Employed (Not Incorporated) | 15 | 23.8% |
| Not-for-profit Organizations | 0 | 0.0% |
| Local Government Employees | 0 | 0.0% |
| State Government Employees | 0 | 0.0% |
| Federal Government Employees | 0 | 0.0% |
| Unpaid Family Workers | 0 | 0.0% |
| Total | 63 | 100.0% |
Employment Status by Age in Monterey Park Tract
According to the labor force statistics for Monterey Park Tract, out of the total population over 16 years of age (115), 71.3% or 82 individuals are in the labor force, with 23.2% or 19 of them unemployed. The age group with the highest labor force participation rate is 20 to 24 years, with 100.0% or 44 individuals in the labor force. Within the labor force, the 16 to 19 years age range has the highest percentage of unemployed individuals, with 100.0% or 12 of them being unemployed.
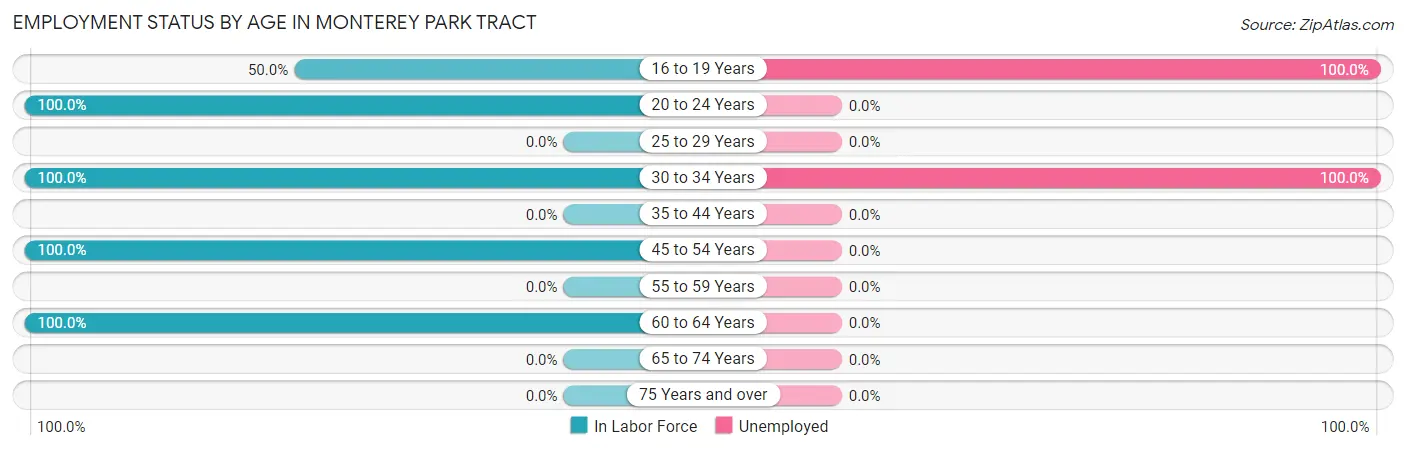
| Age Bracket | In Labor Force | Unemployed |
| 16 to 19 Years | 12 (50.0%) | 12 (100.0%) |
| 20 to 24 Years | 44 (100.0%) | 0 (0.0%) |
| 25 to 29 Years | 0 (0.0%) | 0 (0.0%) |
| 30 to 34 Years | 7 (100.0%) | 7 (100.0%) |
| 35 to 44 Years | 0 (0.0%) | 0 (0.0%) |
| 45 to 54 Years | 12 (100.0%) | 0 (0.0%) |
| 55 to 59 Years | 0 (0.0%) | 0 (0.0%) |
| 60 to 64 Years | 7 (100.0%) | 0 (0.0%) |
| 65 to 74 Years | 0 (0.0%) | 0 (0.0%) |
| 75 Years and over | 0 (0.0%) | 0 (0.0%) |
| Total | 82 (71.3%) | 19 (23.2%) |
Employment Status by Educational Attainment in Monterey Park Tract
According to labor force statistics for Monterey Park Tract, 76.5% of individuals (26) out of the total population between 25 and 64 years of age (34) are in the labor force, with 26.9% or 7 of them being unemployed. The group with the highest labor force participation rate are those with the educational attainment of less than high school, with 100.0% or 12 individuals in the labor force. Within the labor force, individuals with high school diploma education have the highest percentage of unemployment, with 100.0% or 7 of them being unemployed.
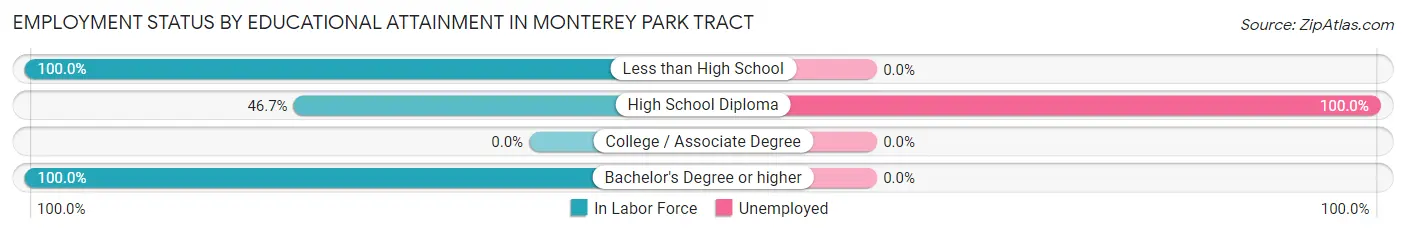
| Educational Attainment | In Labor Force | Unemployed |
| Less than High School | 12 (100.0%) | 0 (0.0%) |
| High School Diploma | 7 (46.7%) | 15 (100.0%) |
| College / Associate Degree | 0 (0.0%) | 0 (0.0%) |
| Bachelor's Degree or higher | 7 (100.0%) | 0 (0.0%) |
| Total | 26 (76.5%) | 9 (26.9%) |
Employment Occupations by Sex in Monterey Park Tract
Management, Business, Science and Arts Occupations
The most common Management, Business, Science and Arts occupations in Monterey Park Tract are Computers, Engineering & Science (7 | 11.1%), and Computers & Mathematics (7 | 11.1%).
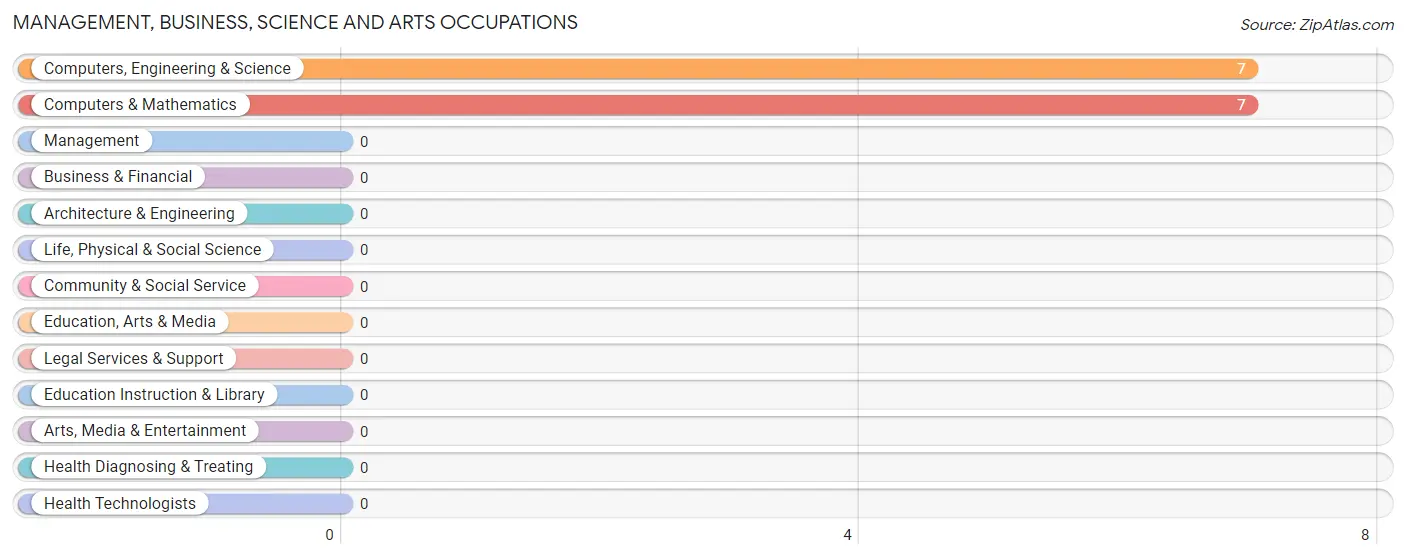
Management, Business, Science and Arts Occupations by Sex
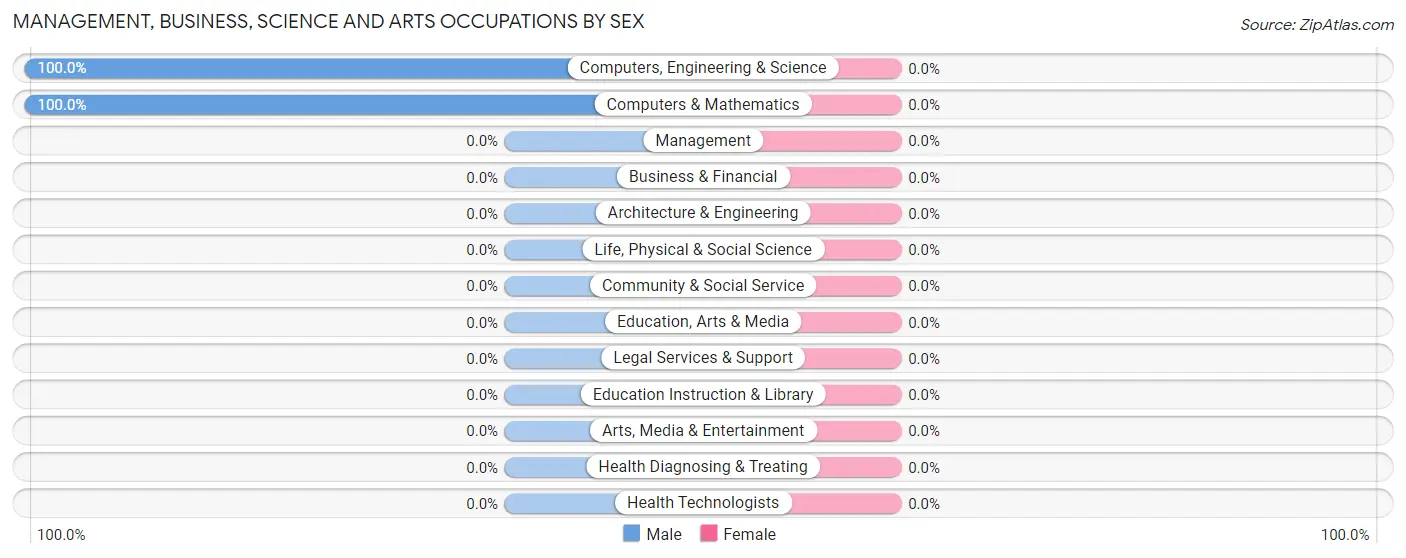
| Occupation | Male | Female |
| Management | 0 (0.0%) | 0 (0.0%) |
| Business & Financial | 0 (0.0%) | 0 (0.0%) |
| Computers, Engineering & Science | 7 (100.0%) | 0 (0.0%) |
| Computers & Mathematics | 7 (100.0%) | 0 (0.0%) |
| Architecture & Engineering | 0 (0.0%) | 0 (0.0%) |
| Life, Physical & Social Science | 0 (0.0%) | 0 (0.0%) |
| Community & Social Service | 0 (0.0%) | 0 (0.0%) |
| Education, Arts & Media | 0 (0.0%) | 0 (0.0%) |
| Legal Services & Support | 0 (0.0%) | 0 (0.0%) |
| Education Instruction & Library | 0 (0.0%) | 0 (0.0%) |
| Arts, Media & Entertainment | 0 (0.0%) | 0 (0.0%) |
| Health Diagnosing & Treating | 0 (0.0%) | 0 (0.0%) |
| Health Technologists | 0 (0.0%) | 0 (0.0%) |
| Total (Category) | 7 (100.0%) | 0 (0.0%) |
| Total (Overall) | 33 (52.4%) | 30 (47.6%) |
Services Occupations
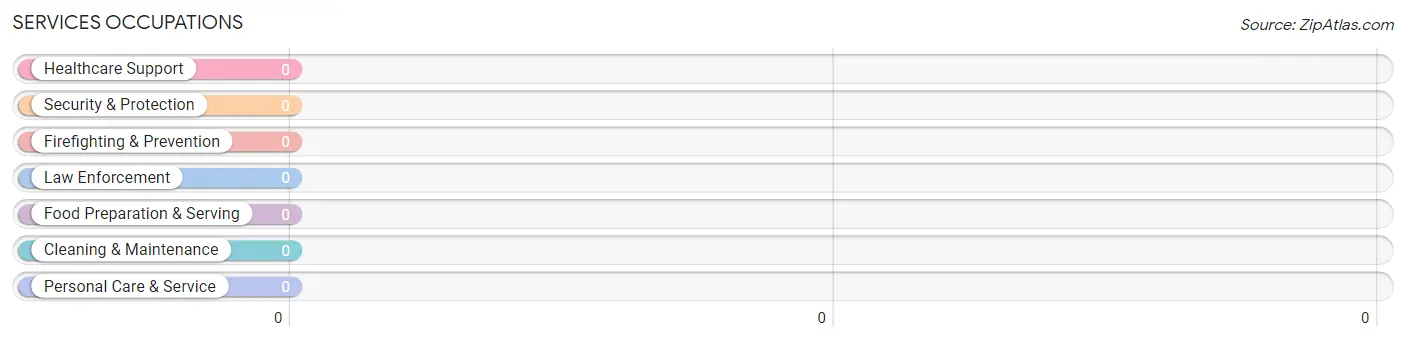
Services Occupations by Sex
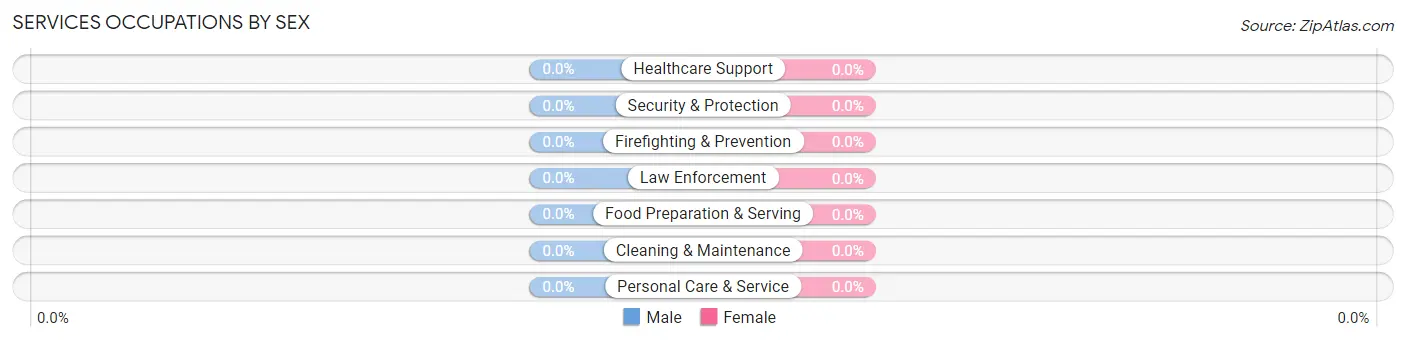
| Occupation | Male | Female |
| Healthcare Support | 0 (0.0%) | 0 (0.0%) |
| Security & Protection | 0 (0.0%) | 0 (0.0%) |
| Firefighting & Prevention | 0 (0.0%) | 0 (0.0%) |
| Law Enforcement | 0 (0.0%) | 0 (0.0%) |
| Food Preparation & Serving | 0 (0.0%) | 0 (0.0%) |
| Cleaning & Maintenance | 0 (0.0%) | 0 (0.0%) |
| Personal Care & Service | 0 (0.0%) | 0 (0.0%) |
| Total (Category) | 0 (0.0%) | 0 (0.0%) |
| Total (Overall) | 33 (52.4%) | 30 (47.6%) |
Sales and Office Occupations
The most common Sales and Office occupations in Monterey Park Tract are , and Sales & Related (44 | 69.8%).
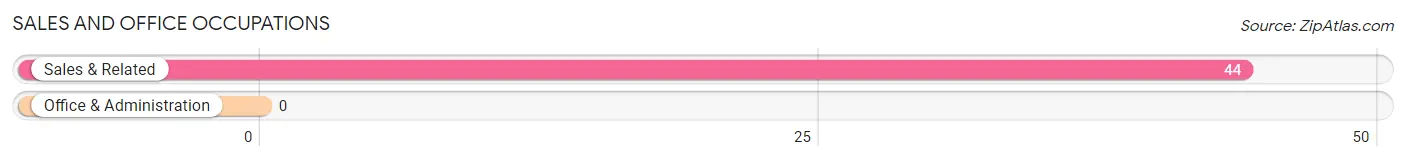
Sales and Office Occupations by Sex
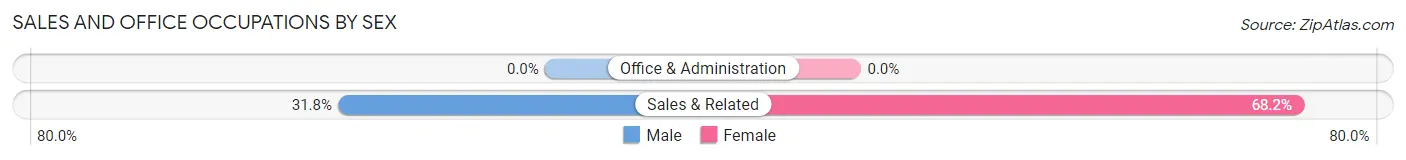
| Occupation | Male | Female |
| Sales & Related | 14 (31.8%) | 30 (68.2%) |
| Office & Administration | 0 (0.0%) | 0 (0.0%) |
| Total (Category) | 14 (31.8%) | 30 (68.2%) |
| Total (Overall) | 33 (52.4%) | 30 (47.6%) |
Natural Resources, Construction and Maintenance Occupations
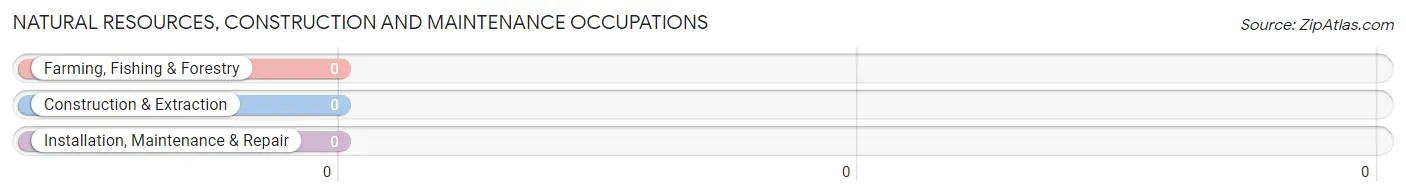
Natural Resources, Construction and Maintenance Occupations by Sex
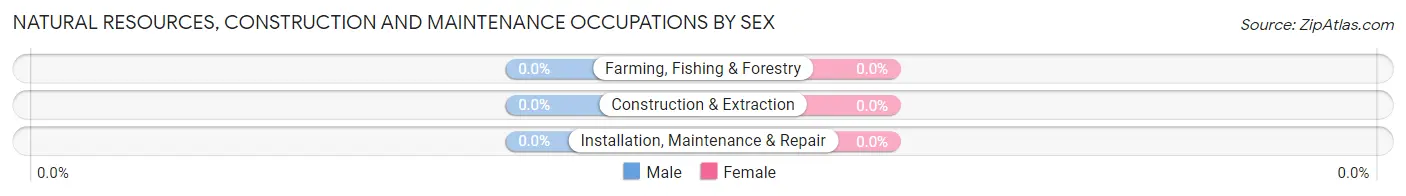
| Occupation | Male | Female |
| Farming, Fishing & Forestry | 0 (0.0%) | 0 (0.0%) |
| Construction & Extraction | 0 (0.0%) | 0 (0.0%) |
| Installation, Maintenance & Repair | 0 (0.0%) | 0 (0.0%) |
| Total (Category) | 0 (0.0%) | 0 (0.0%) |
| Total (Overall) | 33 (52.4%) | 30 (47.6%) |
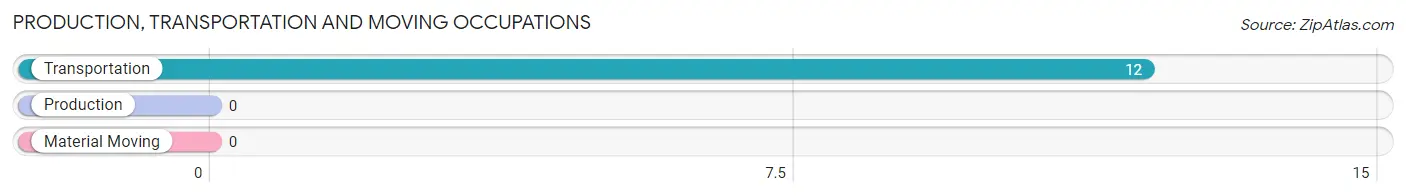
Production, Transportation and Moving Occupations
The most common Production, Transportation and Moving occupations in Monterey Park Tract are , and Transportation (12 | 19.1%).
Production, Transportation and Moving Occupations by Sex
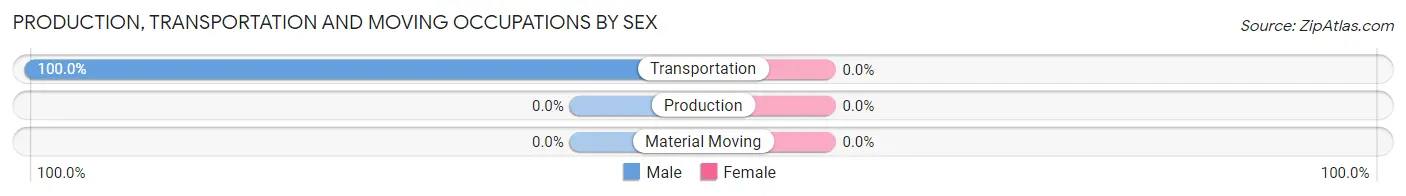
| Occupation | Male | Female |
| Production | 0 (0.0%) | 0 (0.0%) |
| Transportation | 12 (100.0%) | 0 (0.0%) |
| Material Moving | 0 (0.0%) | 0 (0.0%) |
| Total (Category) | 12 (100.0%) | 0 (0.0%) |
| Total (Overall) | 33 (52.4%) | 30 (47.6%) |
Employment Industries by Sex in Monterey Park Tract
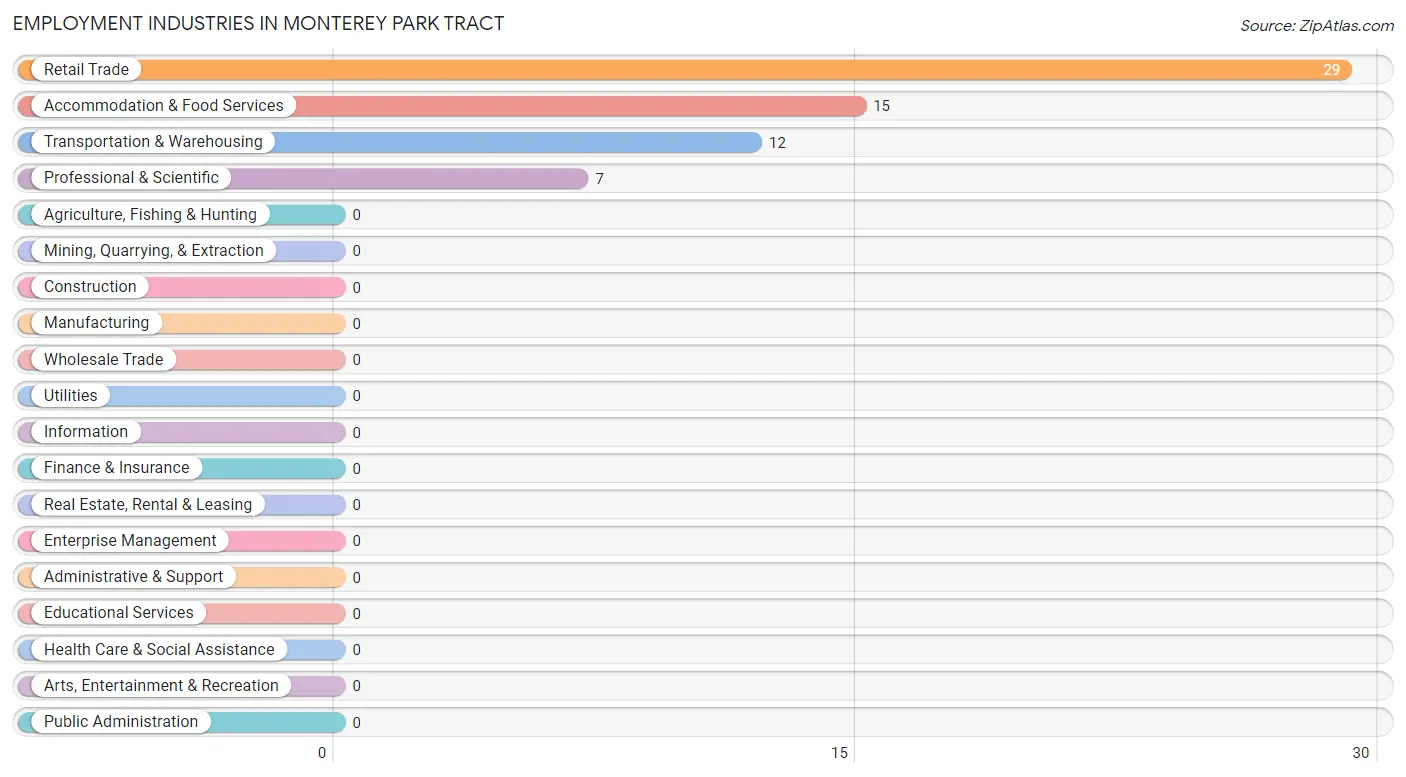
Employment Industries in Monterey Park Tract
The major employment industries in Monterey Park Tract include Retail Trade (29 | 46.0%), Accommodation & Food Services (15 | 23.8%), Transportation & Warehousing (12 | 19.1%), and Professional & Scientific (7 | 11.1%).
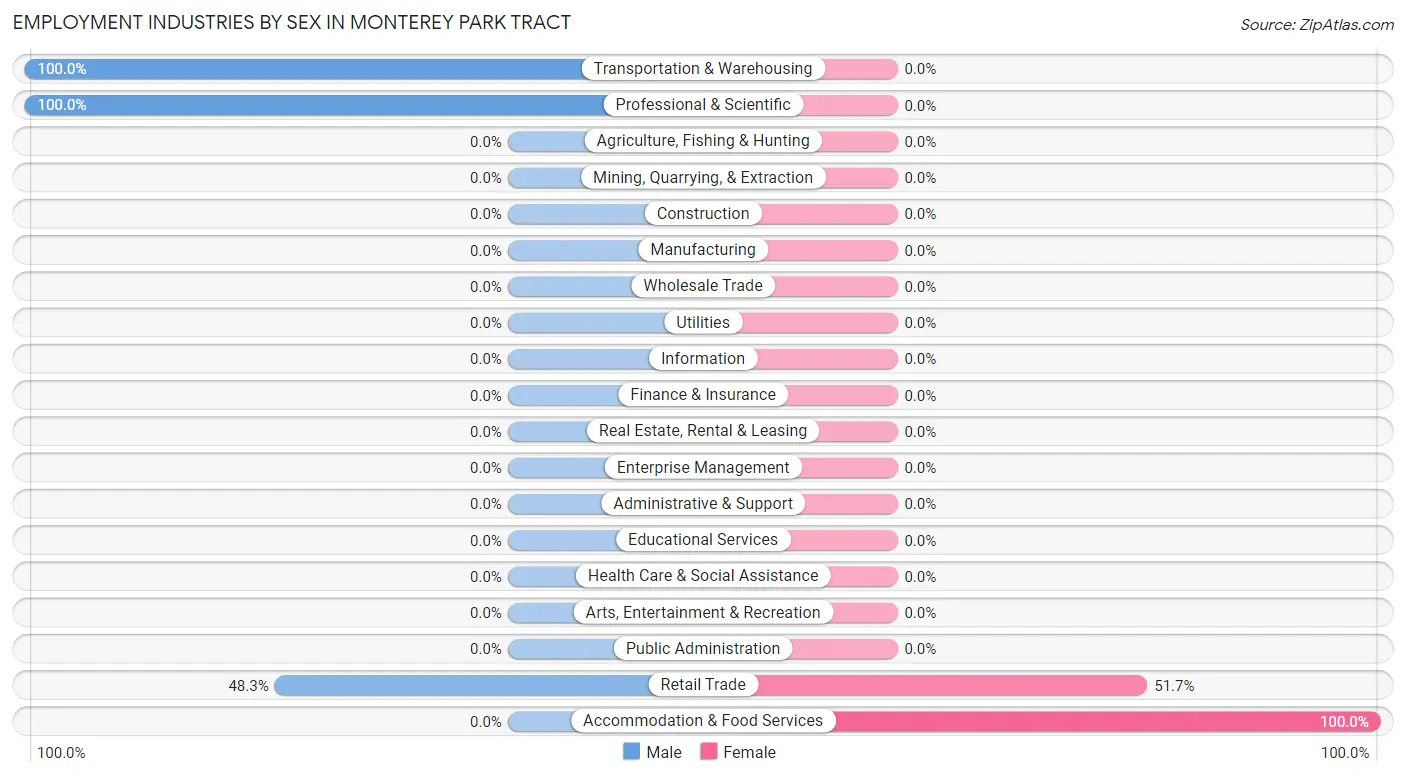
Employment Industries by Sex in Monterey Park Tract
The Monterey Park Tract industries that see more men than women are Transportation & Warehousing (100.0%), Professional & Scientific (100.0%), and Retail Trade (48.3%), whereas the industries that tend to have a higher number of women are Accommodation & Food Services (100.0%), and Retail Trade (51.7%).
| Industry | Male | Female |
| Agriculture, Fishing & Hunting | 0 (0.0%) | 0 (0.0%) |
| Mining, Quarrying, & Extraction | 0 (0.0%) | 0 (0.0%) |
| Construction | 0 (0.0%) | 0 (0.0%) |
| Manufacturing | 0 (0.0%) | 0 (0.0%) |
| Wholesale Trade | 0 (0.0%) | 0 (0.0%) |
| Retail Trade | 14 (48.3%) | 15 (51.7%) |
| Transportation & Warehousing | 12 (100.0%) | 0 (0.0%) |
| Utilities | 0 (0.0%) | 0 (0.0%) |
| Information | 0 (0.0%) | 0 (0.0%) |
| Finance & Insurance | 0 (0.0%) | 0 (0.0%) |
| Real Estate, Rental & Leasing | 0 (0.0%) | 0 (0.0%) |
| Professional & Scientific | 7 (100.0%) | 0 (0.0%) |
| Enterprise Management | 0 (0.0%) | 0 (0.0%) |
| Administrative & Support | 0 (0.0%) | 0 (0.0%) |
| Educational Services | 0 (0.0%) | 0 (0.0%) |
| Health Care & Social Assistance | 0 (0.0%) | 0 (0.0%) |
| Arts, Entertainment & Recreation | 0 (0.0%) | 0 (0.0%) |
| Accommodation & Food Services | 0 (0.0%) | 15 (100.0%) |
| Public Administration | 0 (0.0%) | 0 (0.0%) |
| Total | 33 (52.4%) | 30 (47.6%) |
Education in Monterey Park Tract
School Enrollment in Monterey Park Tract
The most common levels of schooling among the 30 students in Monterey Park Tract are college / undergraduate (15 | 50.0%), middle school (8 | 26.7%), and elementary school (7 | 23.3%).
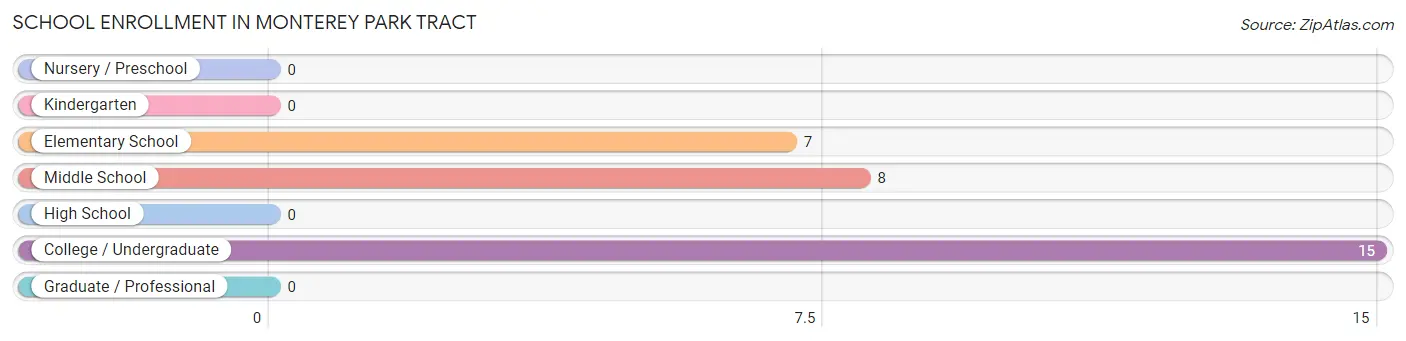
| School Level | # Students | % Students |
| Nursery / Preschool | 0 | 0.0% |
| Kindergarten | 0 | 0.0% |
| Elementary School | 7 | 23.3% |
| Middle School | 8 | 26.7% |
| High School | 0 | 0.0% |
| College / Undergraduate | 15 | 50.0% |
| Graduate / Professional | 0 | 0.0% |
| Total | 30 | 100.0% |
School Enrollment by Age by Funding Source in Monterey Park Tract
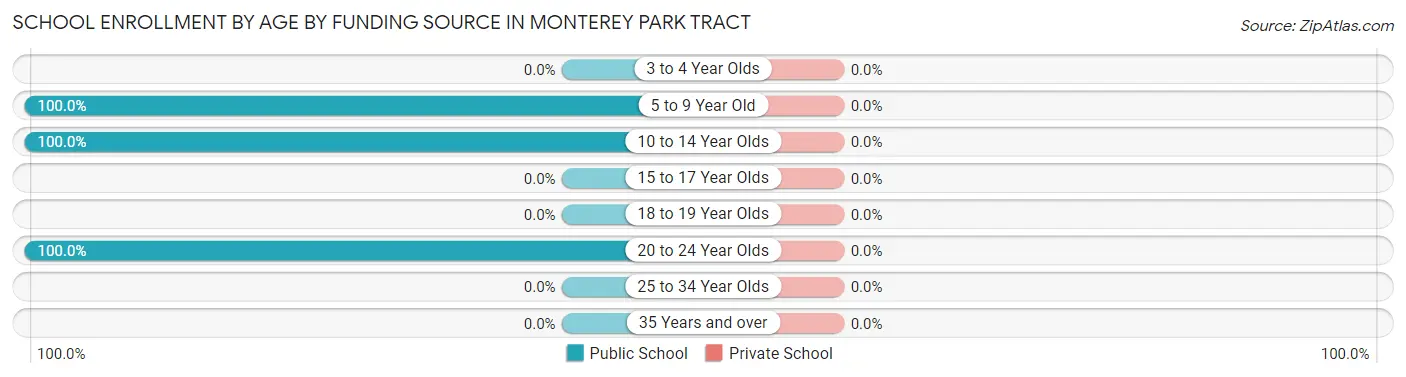
| Age Bracket | Public School | Private School |
| 3 to 4 Year Olds | 0 (0.0%) | 0 (0.0%) |
| 5 to 9 Year Old | 7 (100.0%) | 0 (0.0%) |
| 10 to 14 Year Olds | 8 (100.0%) | 0 (0.0%) |
| 15 to 17 Year Olds | 0 (0.0%) | 0 (0.0%) |
| 18 to 19 Year Olds | 0 (0.0%) | 0 (0.0%) |
| 20 to 24 Year Olds | 15 (100.0%) | 0 (0.0%) |
| 25 to 34 Year Olds | 0 (0.0%) | 0 (0.0%) |
| 35 Years and over | 0 (0.0%) | 0 (0.0%) |
| Total | 30 (100.0%) | 0 (0.0%) |
Educational Attainment by Field of Study in Monterey Park Tract
, and liberal arts & history (7 | 100.0%) are the most common fields of study among 7 individuals in Monterey Park Tract who have obtained a bachelor's degree or higher.
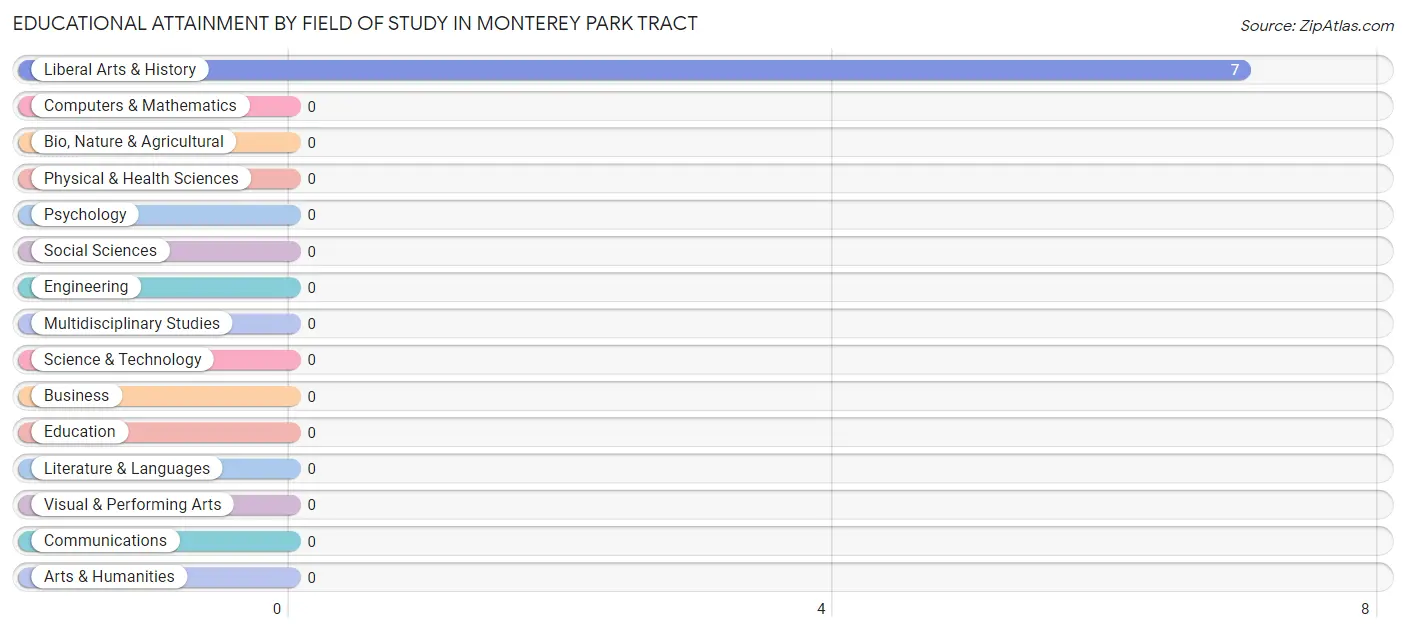
| Field of Study | # Graduates | % Graduates |
| Computers & Mathematics | 0 | 0.0% |
| Bio, Nature & Agricultural | 0 | 0.0% |
| Physical & Health Sciences | 0 | 0.0% |
| Psychology | 0 | 0.0% |
| Social Sciences | 0 | 0.0% |
| Engineering | 0 | 0.0% |
| Multidisciplinary Studies | 0 | 0.0% |
| Science & Technology | 0 | 0.0% |
| Business | 0 | 0.0% |
| Education | 0 | 0.0% |
| Literature & Languages | 0 | 0.0% |
| Liberal Arts & History | 7 | 100.0% |
| Visual & Performing Arts | 0 | 0.0% |
| Communications | 0 | 0.0% |
| Arts & Humanities | 0 | 0.0% |
| Total | 7 | 100.0% |
Transportation & Commute in Monterey Park Tract
Vehicle Availability by Sex in Monterey Park Tract
The most prevalent vehicle ownership categories in Monterey Park Tract are males with 3 vehicles (26, accounting for 78.8%) and females with 3 vehicles (30, making up 86.7%).
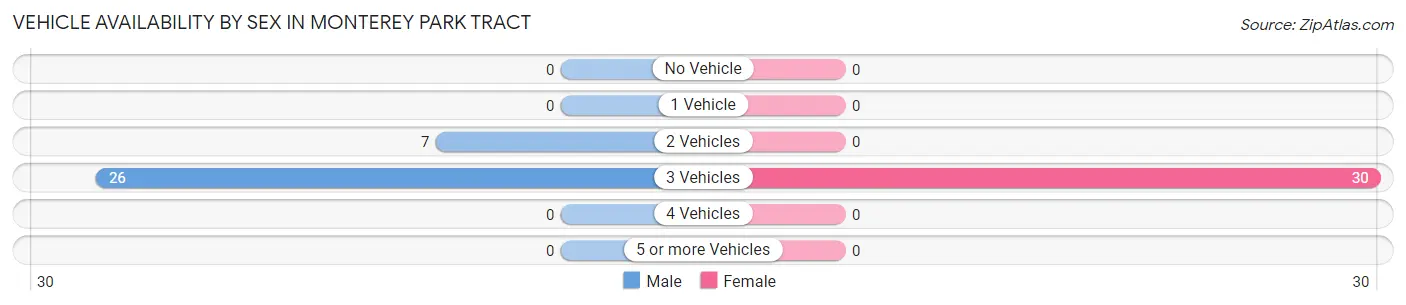
| Vehicles Available | Male | Female |
| No Vehicle | 0 (0.0%) | 0 (0.0%) |
| 1 Vehicle | 0 (0.0%) | 0 (0.0%) |
| 2 Vehicles | 7 (21.2%) | 0 (0.0%) |
| 3 Vehicles | 26 (78.8%) | 30 (100.0%) |
| 4 Vehicles | 0 (0.0%) | 0 (0.0%) |
| 5 or more Vehicles | 0 (0.0%) | 0 (0.0%) |
| Total | 33 (100.0%) | 30 (100.0%) |
Commute Time in Monterey Park Tract
The most frequently occuring commute durations in Monterey Park Tract are 90 or more minutes (26 commuters, 41.3%), 30 to 34 minutes (22 commuters, 34.9%), and 20 to 24 minutes (15 commuters, 23.8%).
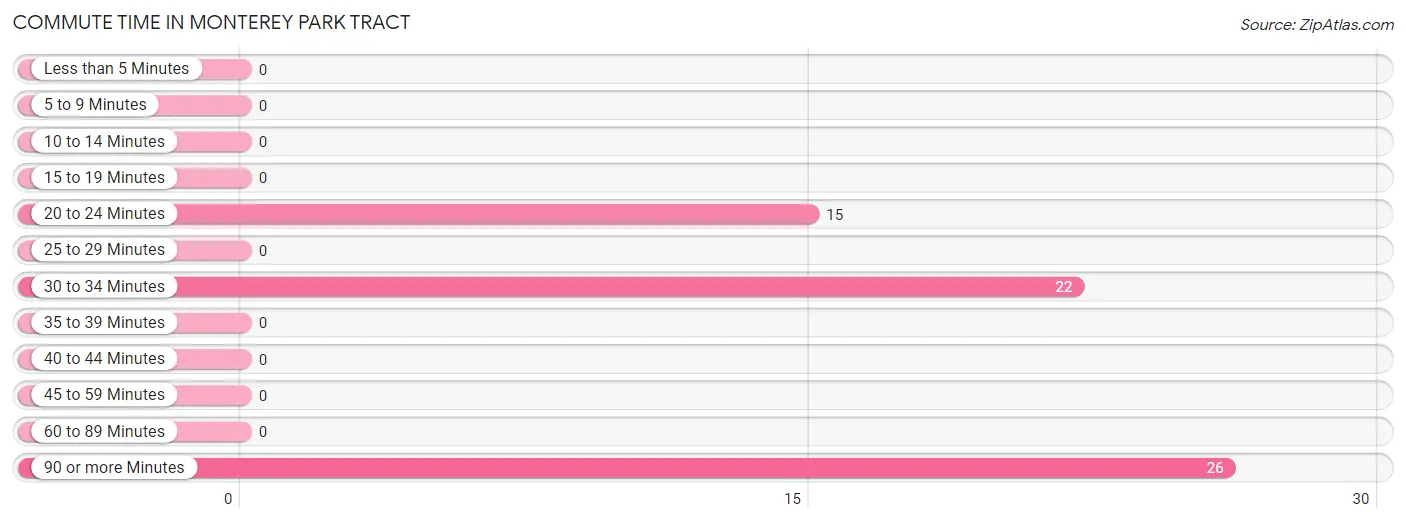
| Commute Time | # Commuters | % Commuters |
| Less than 5 Minutes | 0 | 0.0% |
| 5 to 9 Minutes | 0 | 0.0% |
| 10 to 14 Minutes | 0 | 0.0% |
| 15 to 19 Minutes | 0 | 0.0% |
| 20 to 24 Minutes | 15 | 23.8% |
| 25 to 29 Minutes | 0 | 0.0% |
| 30 to 34 Minutes | 22 | 34.9% |
| 35 to 39 Minutes | 0 | 0.0% |
| 40 to 44 Minutes | 0 | 0.0% |
| 45 to 59 Minutes | 0 | 0.0% |
| 60 to 89 Minutes | 0 | 0.0% |
| 90 or more Minutes | 26 | 41.3% |
Commute Time by Sex in Monterey Park Tract
The most common commute times in Monterey Park Tract are 90 or more minutes (26 commuters, 78.8%) for males and 20 to 24 minutes (15 commuters, 50.0%) for females.
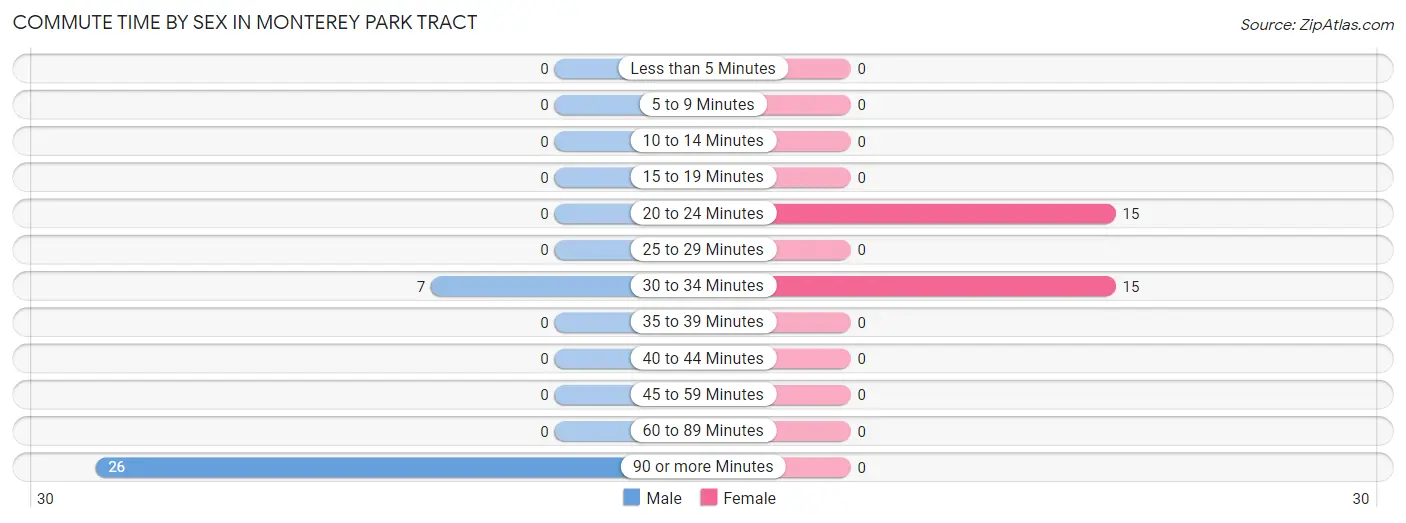
| Commute Time | Male | Female |
| Less than 5 Minutes | 0 (0.0%) | 0 (0.0%) |
| 5 to 9 Minutes | 0 (0.0%) | 0 (0.0%) |
| 10 to 14 Minutes | 0 (0.0%) | 0 (0.0%) |
| 15 to 19 Minutes | 0 (0.0%) | 0 (0.0%) |
| 20 to 24 Minutes | 0 (0.0%) | 15 (50.0%) |
| 25 to 29 Minutes | 0 (0.0%) | 0 (0.0%) |
| 30 to 34 Minutes | 7 (21.2%) | 15 (50.0%) |
| 35 to 39 Minutes | 0 (0.0%) | 0 (0.0%) |
| 40 to 44 Minutes | 0 (0.0%) | 0 (0.0%) |
| 45 to 59 Minutes | 0 (0.0%) | 0 (0.0%) |
| 60 to 89 Minutes | 0 (0.0%) | 0 (0.0%) |
| 90 or more Minutes | 26 (78.8%) | 0 (0.0%) |
Time of Departure to Work by Sex in Monterey Park Tract
The most frequent times of departure to work in Monterey Park Tract are 12:00 AM to 4:59 AM (14, 42.4%) for males and 5:30 AM to 5:59 AM (15, 50.0%) for females.
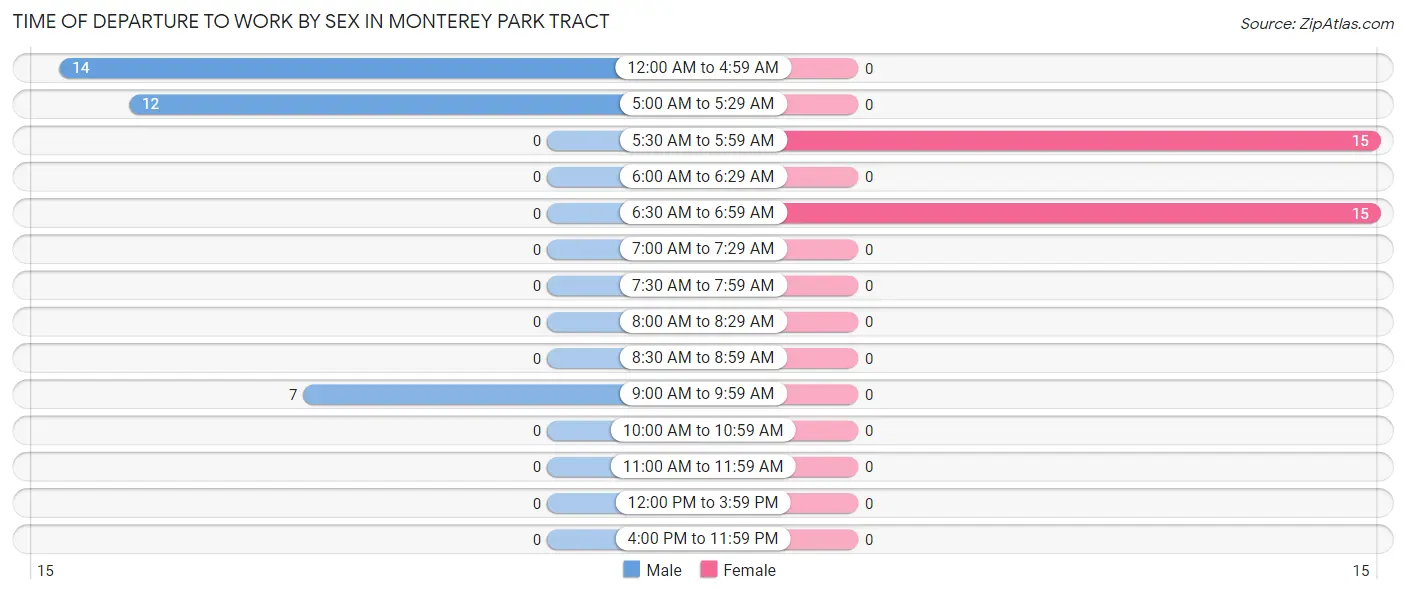
| Time of Departure | Male | Female |
| 12:00 AM to 4:59 AM | 14 (42.4%) | 0 (0.0%) |
| 5:00 AM to 5:29 AM | 12 (36.4%) | 0 (0.0%) |
| 5:30 AM to 5:59 AM | 0 (0.0%) | 15 (50.0%) |
| 6:00 AM to 6:29 AM | 0 (0.0%) | 0 (0.0%) |
| 6:30 AM to 6:59 AM | 0 (0.0%) | 15 (50.0%) |
| 7:00 AM to 7:29 AM | 0 (0.0%) | 0 (0.0%) |
| 7:30 AM to 7:59 AM | 0 (0.0%) | 0 (0.0%) |
| 8:00 AM to 8:29 AM | 0 (0.0%) | 0 (0.0%) |
| 8:30 AM to 8:59 AM | 0 (0.0%) | 0 (0.0%) |
| 9:00 AM to 9:59 AM | 7 (21.2%) | 0 (0.0%) |
| 10:00 AM to 10:59 AM | 0 (0.0%) | 0 (0.0%) |
| 11:00 AM to 11:59 AM | 0 (0.0%) | 0 (0.0%) |
| 12:00 PM to 3:59 PM | 0 (0.0%) | 0 (0.0%) |
| 4:00 PM to 11:59 PM | 0 (0.0%) | 0 (0.0%) |
| Total | 33 (100.0%) | 30 (100.0%) |
Housing Occupancy in Monterey Park Tract
Occupancy by Ownership in Monterey Park Tract
Of the total 27 dwellings in Monterey Park Tract, owner-occupied units account for 27 (100.0%), while renter-occupied units make up 0 (0.0%).
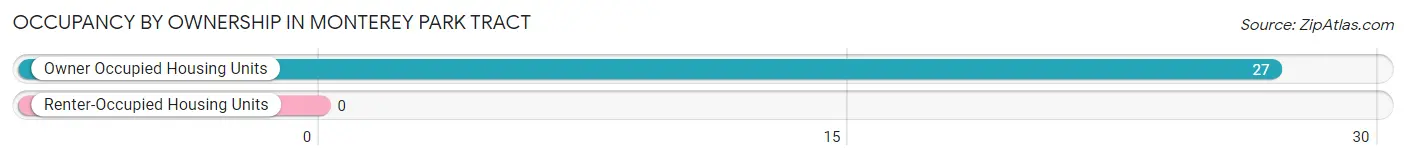
| Occupancy | # Housing Units | % Housing Units |
| Owner Occupied Housing Units | 27 | 100.0% |
| Renter-Occupied Housing Units | 0 | 0.0% |
| Total Occupied Housing Units | 27 | 100.0% |
Occupancy by Household Size in Monterey Park Tract
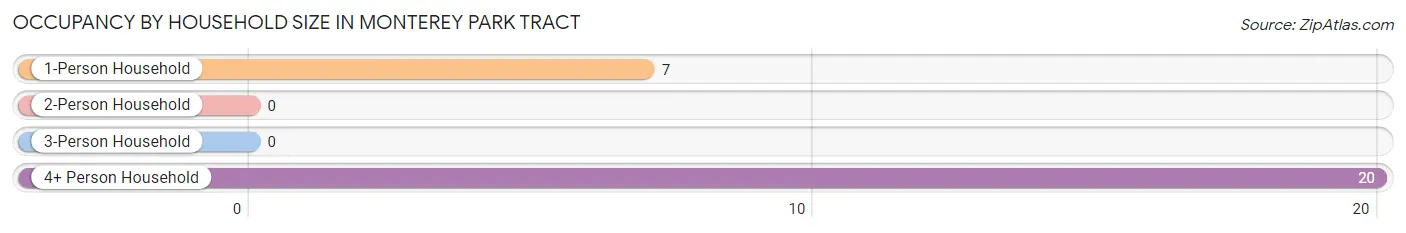
| Household Size | # Housing Units | % Housing Units |
| 1-Person Household | 7 | 25.9% |
| 2-Person Household | 0 | 0.0% |
| 3-Person Household | 0 | 0.0% |
| 4+ Person Household | 20 | 74.1% |
| Total Housing Units | 27 | 100.0% |
Occupancy by Ownership by Household Size in Monterey Park Tract
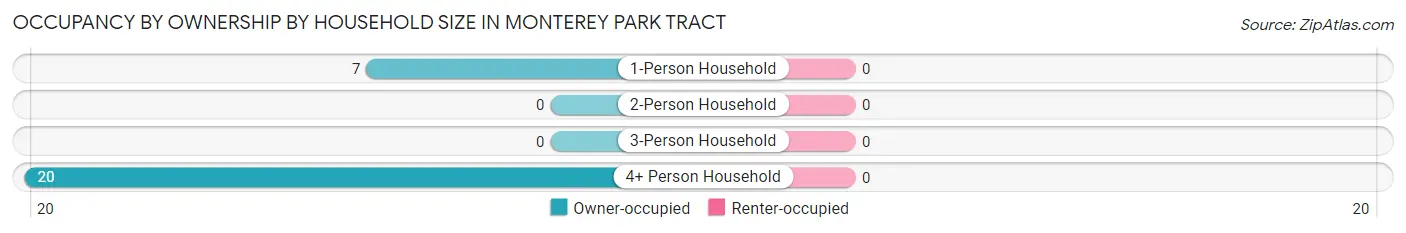
| Household Size | Owner-occupied | Renter-occupied |
| 1-Person Household | 7 (100.0%) | 0 (0.0%) |
| 2-Person Household | 0 (0.0%) | 0 (0.0%) |
| 3-Person Household | 0 (0.0%) | 0 (0.0%) |
| 4+ Person Household | 20 (100.0%) | 0 (0.0%) |
| Total Housing Units | 27 (100.0%) | 0 (0.0%) |
Occupancy by Educational Attainment in Monterey Park Tract
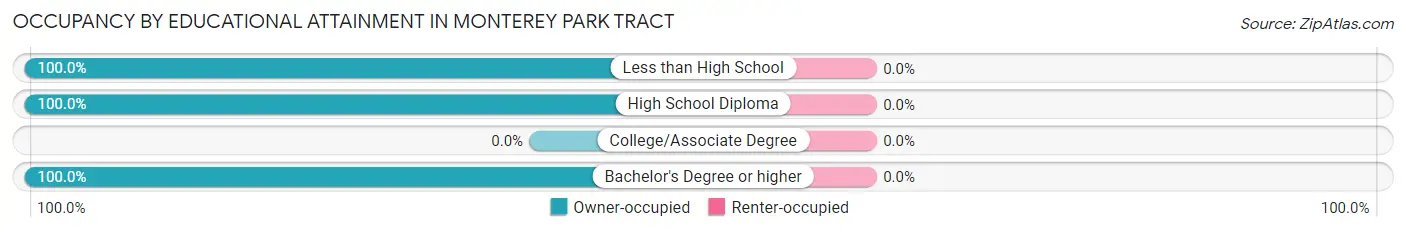
| Household Size | Owner-occupied | Renter-occupied |
| Less than High School | 12 (100.0%) | 0 (0.0%) |
| High School Diploma | 8 (100.0%) | 0 (0.0%) |
| College/Associate Degree | 0 (0.0%) | 0 (0.0%) |
| Bachelor's Degree or higher | 7 (100.0%) | 0 (0.0%) |
Occupancy by Age of Householder in Monterey Park Tract
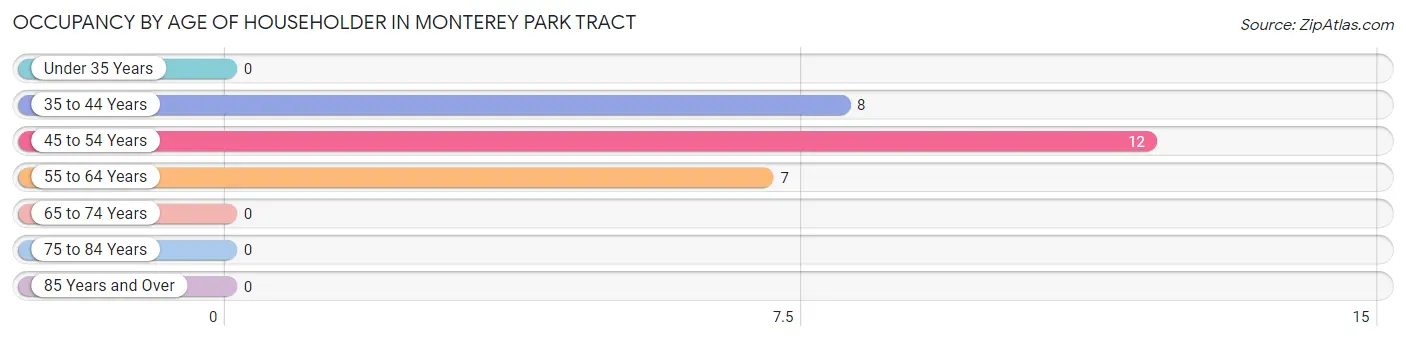
| Age Bracket | # Households | % Households |
| Under 35 Years | 0 | 0.0% |
| 35 to 44 Years | 8 | 29.6% |
| 45 to 54 Years | 12 | 44.4% |
| 55 to 64 Years | 7 | 25.9% |
| 65 to 74 Years | 0 | 0.0% |
| 75 to 84 Years | 0 | 0.0% |
| 85 Years and Over | 0 | 0.0% |
| Total | 27 | 100.0% |
Housing Finances in Monterey Park Tract
Median Income by Occupancy in Monterey Park Tract
| Occupancy Type | # Households | Median Income |
| Owner-Occupied | 27 (100.0%) | $0 |
| Renter-Occupied | 0 (0.0%) | $0 |
| Average | 27 (100.0%) | $0 |
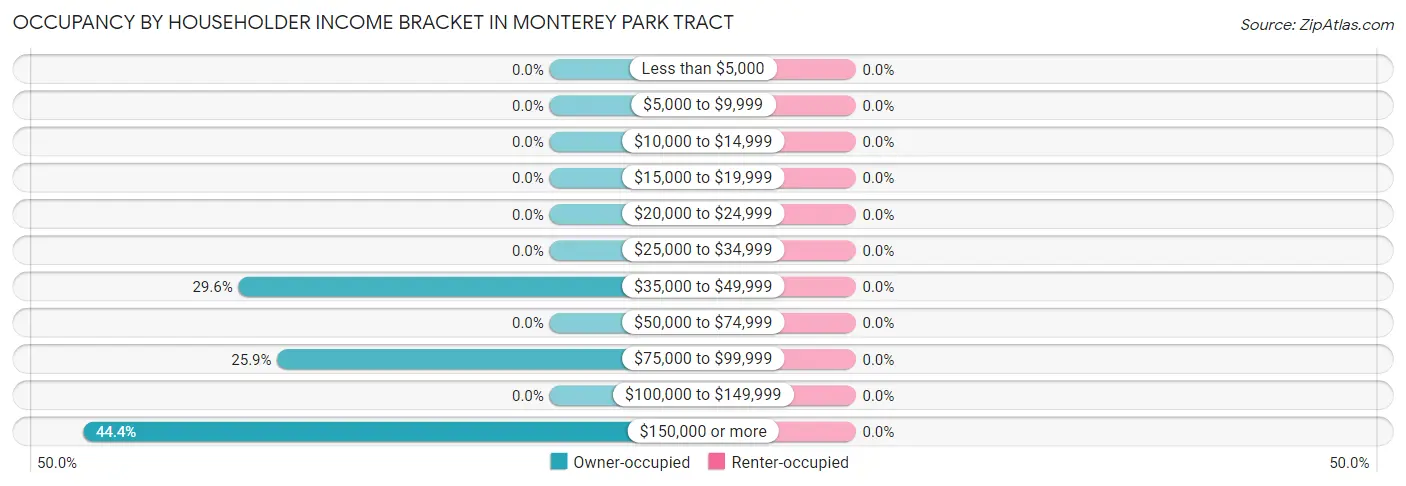
Occupancy by Householder Income Bracket in Monterey Park Tract
| Income Bracket | Owner-occupied | Renter-occupied |
| Less than $5,000 | 0 (0.0%) | 0 (0.0%) |
| $5,000 to $9,999 | 0 (0.0%) | 0 (0.0%) |
| $10,000 to $14,999 | 0 (0.0%) | 0 (0.0%) |
| $15,000 to $19,999 | 0 (0.0%) | 0 (0.0%) |
| $20,000 to $24,999 | 0 (0.0%) | 0 (0.0%) |
| $25,000 to $34,999 | 0 (0.0%) | 0 (0.0%) |
| $35,000 to $49,999 | 8 (29.6%) | 0 (0.0%) |
| $50,000 to $74,999 | 0 (0.0%) | 0 (0.0%) |
| $75,000 to $99,999 | 7 (25.9%) | 0 (0.0%) |
| $100,000 to $149,999 | 0 (0.0%) | 0 (0.0%) |
| $150,000 or more | 12 (44.4%) | 0 (0.0%) |
| Total | 27 (100.0%) | 0 (0.0%) |
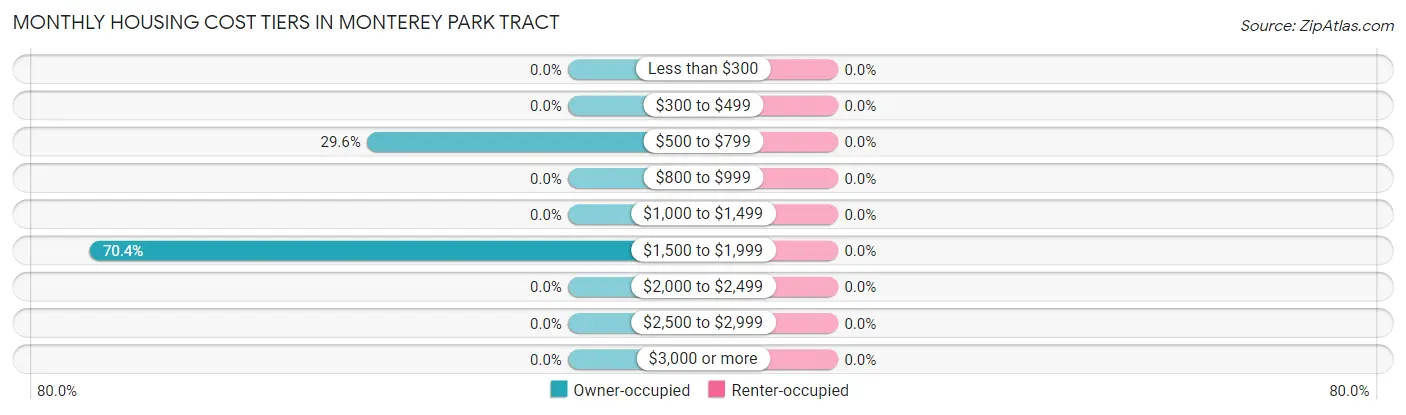
Monthly Housing Cost Tiers in Monterey Park Tract
| Monthly Cost | Owner-occupied | Renter-occupied |
| Less than $300 | 0 (0.0%) | 0 (0.0%) |
| $300 to $499 | 0 (0.0%) | 0 (0.0%) |
| $500 to $799 | 8 (29.6%) | 0 (0.0%) |
| $800 to $999 | 0 (0.0%) | 0 (0.0%) |
| $1,000 to $1,499 | 0 (0.0%) | 0 (0.0%) |
| $1,500 to $1,999 | 19 (70.4%) | 0 (0.0%) |
| $2,000 to $2,499 | 0 (0.0%) | 0 (0.0%) |
| $2,500 to $2,999 | 0 (0.0%) | 0 (0.0%) |
| $3,000 or more | 0 (0.0%) | 0 (0.0%) |
| Total | 27 (100.0%) | 0 (0.0%) |
Physical Housing Characteristics in Monterey Park Tract
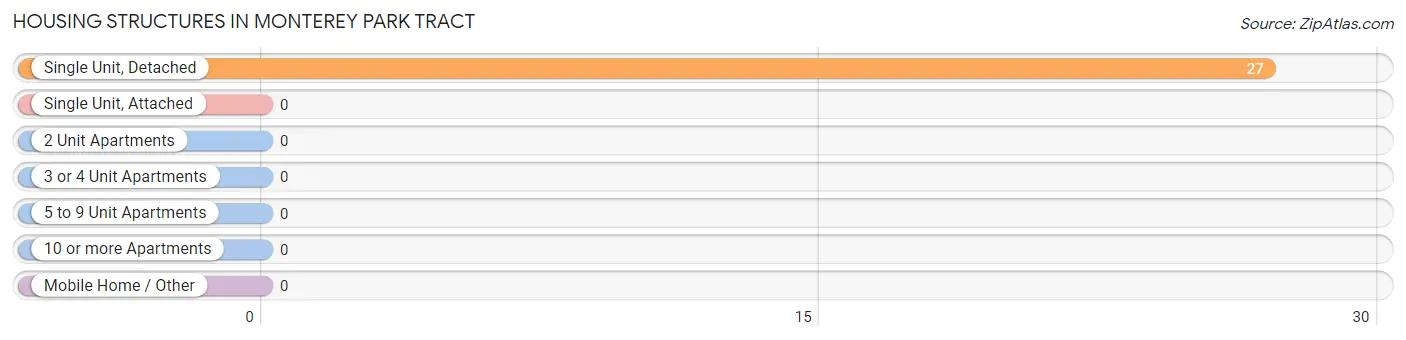
Housing Structures in Monterey Park Tract
| Structure Type | # Housing Units | % Housing Units |
| Single Unit, Detached | 27 | 100.0% |
| Single Unit, Attached | 0 | 0.0% |
| 2 Unit Apartments | 0 | 0.0% |
| 3 or 4 Unit Apartments | 0 | 0.0% |
| 5 to 9 Unit Apartments | 0 | 0.0% |
| 10 or more Apartments | 0 | 0.0% |
| Mobile Home / Other | 0 | 0.0% |
| Total | 27 | 100.0% |
Housing Structures by Occupancy in Monterey Park Tract
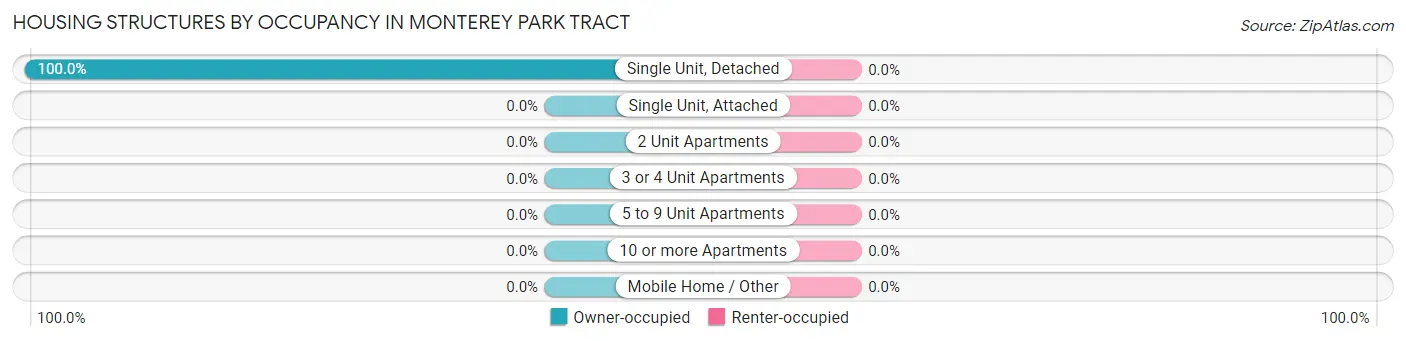
| Structure Type | Owner-occupied | Renter-occupied |
| Single Unit, Detached | 27 (100.0%) | 0 (0.0%) |
| Single Unit, Attached | 0 (0.0%) | 0 (0.0%) |
| 2 Unit Apartments | 0 (0.0%) | 0 (0.0%) |
| 3 or 4 Unit Apartments | 0 (0.0%) | 0 (0.0%) |
| 5 to 9 Unit Apartments | 0 (0.0%) | 0 (0.0%) |
| 10 or more Apartments | 0 (0.0%) | 0 (0.0%) |
| Mobile Home / Other | 0 (0.0%) | 0 (0.0%) |
| Total | 27 (100.0%) | 0 (0.0%) |
Housing Structures by Number of Rooms in Monterey Park Tract
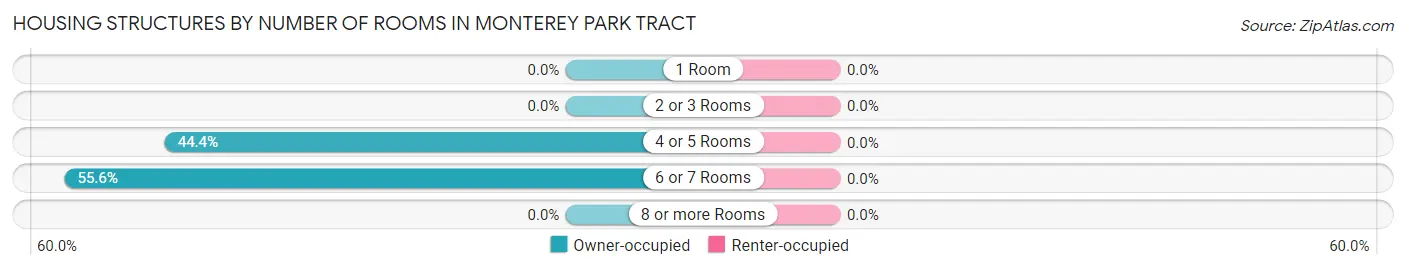
| Number of Rooms | Owner-occupied | Renter-occupied |
| 1 Room | 0 (0.0%) | 0 (0.0%) |
| 2 or 3 Rooms | 0 (0.0%) | 0 (0.0%) |
| 4 or 5 Rooms | 12 (44.4%) | 0 (0.0%) |
| 6 or 7 Rooms | 15 (55.6%) | 0 (0.0%) |
| 8 or more Rooms | 0 (0.0%) | 0 (0.0%) |
| Total | 27 (100.0%) | 0 (0.0%) |
Housing Structure by Heating Type in Monterey Park Tract
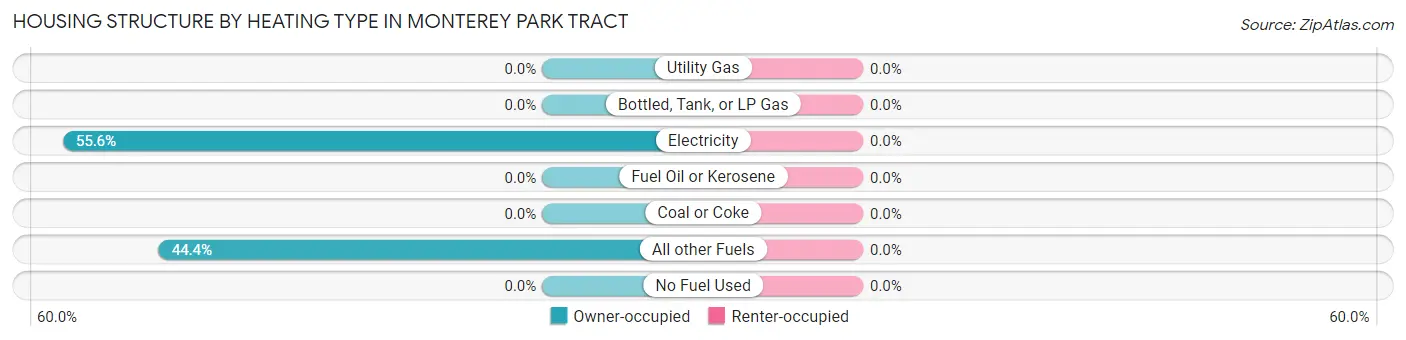
| Heating Type | Owner-occupied | Renter-occupied |
| Utility Gas | 0 (0.0%) | 0 (0.0%) |
| Bottled, Tank, or LP Gas | 0 (0.0%) | 0 (0.0%) |
| Electricity | 15 (55.6%) | 0 (0.0%) |
| Fuel Oil or Kerosene | 0 (0.0%) | 0 (0.0%) |
| Coal or Coke | 0 (0.0%) | 0 (0.0%) |
| All other Fuels | 12 (44.4%) | 0 (0.0%) |
| No Fuel Used | 0 (0.0%) | 0 (0.0%) |
| Total | 27 (100.0%) | 0 (0.0%) |
Household Vehicle Usage in Monterey Park Tract
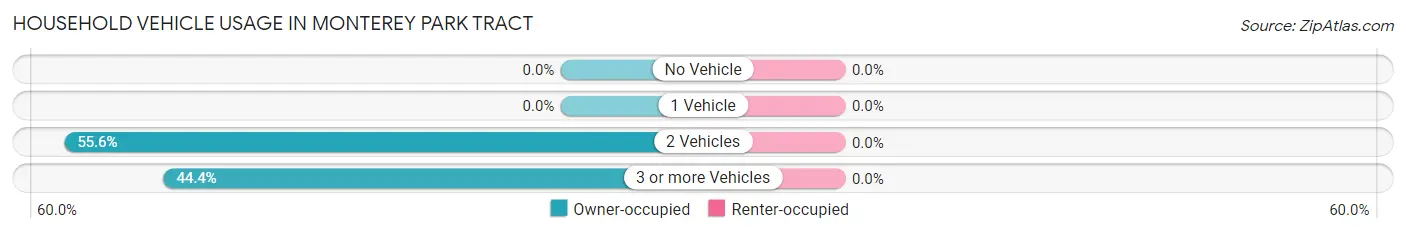
| Vehicles per Household | Owner-occupied | Renter-occupied |
| No Vehicle | 0 (0.0%) | 0 (0.0%) |
| 1 Vehicle | 0 (0.0%) | 0 (0.0%) |
| 2 Vehicles | 15 (55.6%) | 0 (0.0%) |
| 3 or more Vehicles | 12 (44.4%) | 0 (0.0%) |
| Total | 27 (100.0%) | 0 (0.0%) |
Real Estate & Mortgages in Monterey Park Tract
Real Estate and Mortgage Overview in Monterey Park Tract
| Characteristic | Without Mortgage | With Mortgage |
| Housing Units | 0 | 27 |
| Median Property Value | - | - |
| Median Household Income | - | - |
| Monthly Housing Costs | - | - |
| Real Estate Taxes | - | - |
Property Value by Mortgage Status in Monterey Park Tract
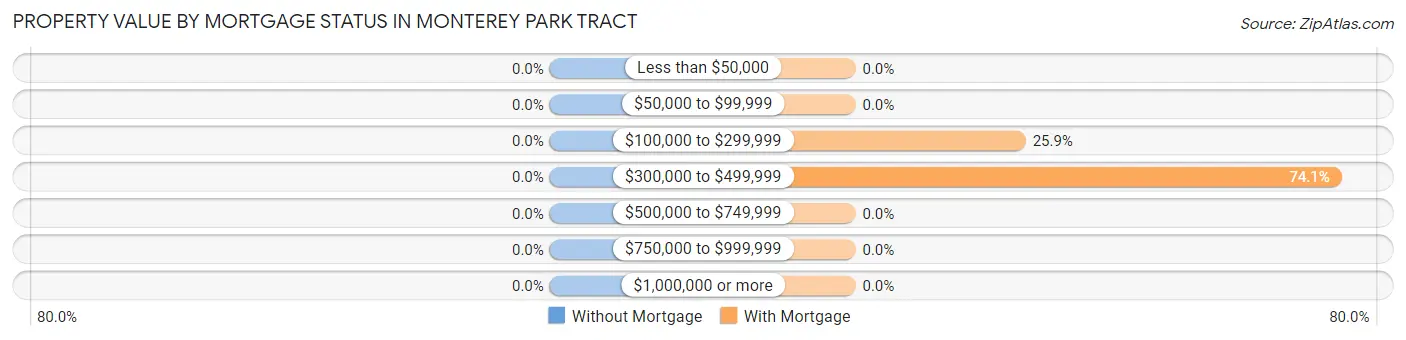
| Property Value | Without Mortgage | With Mortgage |
| Less than $50,000 | 0 (0.0%) | 0 (0.0%) |
| $50,000 to $99,999 | 0 (0.0%) | 0 (0.0%) |
| $100,000 to $299,999 | 0 (0.0%) | 7 (25.9%) |
| $300,000 to $499,999 | 0 (0.0%) | 20 (74.1%) |
| $500,000 to $749,999 | 0 (0.0%) | 0 (0.0%) |
| $750,000 to $999,999 | 0 (0.0%) | 0 (0.0%) |
| $1,000,000 or more | 0 (0.0%) | 0 (0.0%) |
| Total | 0 (0.0%) | 27 (100.0%) |
Household Income by Mortgage Status in Monterey Park Tract
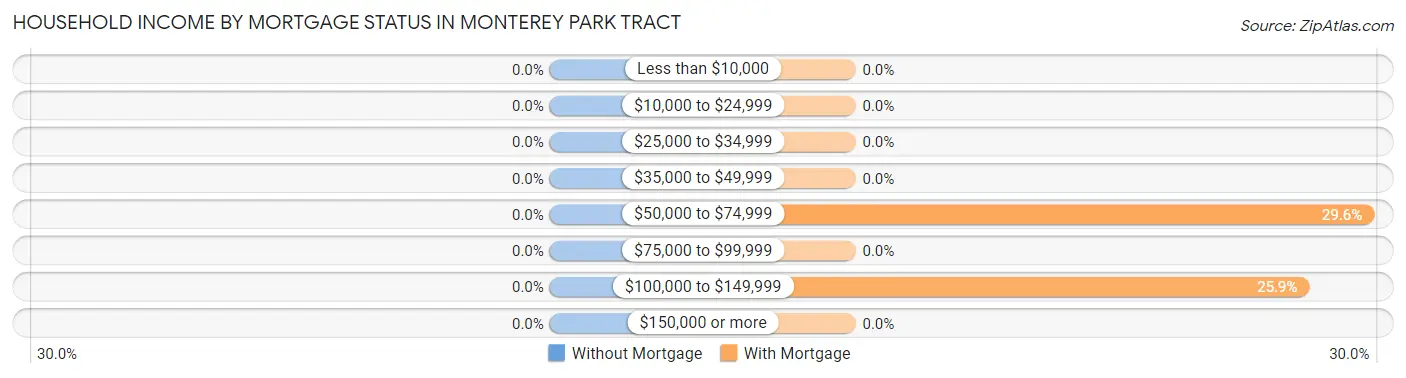
| Household Income | Without Mortgage | With Mortgage |
| Less than $10,000 | 0 (0.0%) | 0 (0.0%) |
| $10,000 to $24,999 | 0 (0.0%) | 0 (0.0%) |
| $25,000 to $34,999 | 0 (0.0%) | 0 (0.0%) |
| $35,000 to $49,999 | 0 (0.0%) | 0 (0.0%) |
| $50,000 to $74,999 | 0 (0.0%) | 8 (29.6%) |
| $75,000 to $99,999 | 0 (0.0%) | 0 (0.0%) |
| $100,000 to $149,999 | 0 (0.0%) | 7 (25.9%) |
| $150,000 or more | 0 (0.0%) | 0 (0.0%) |
| Total | 0 (0.0%) | 27 (100.0%) |
Property Value to Household Income Ratio in Monterey Park Tract
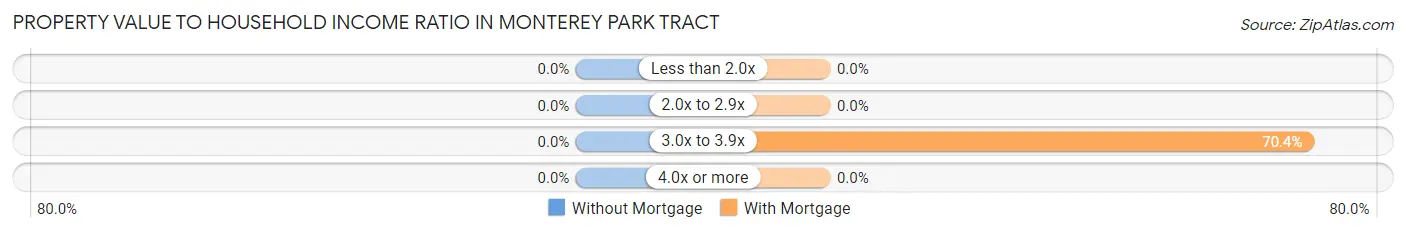
| Value-to-Income Ratio | Without Mortgage | With Mortgage |
| Less than 2.0x | 0 (0.0%) | 0 (0.0%) |
| 2.0x to 2.9x | 0 (0.0%) | 0 (0.0%) |
| 3.0x to 3.9x | 0 (0.0%) | 19 (70.4%) |
| 4.0x or more | 0 (0.0%) | 0 (0.0%) |
| Total | 0 (0.0%) | 27 (100.0%) |
Real Estate Taxes by Mortgage Status in Monterey Park Tract
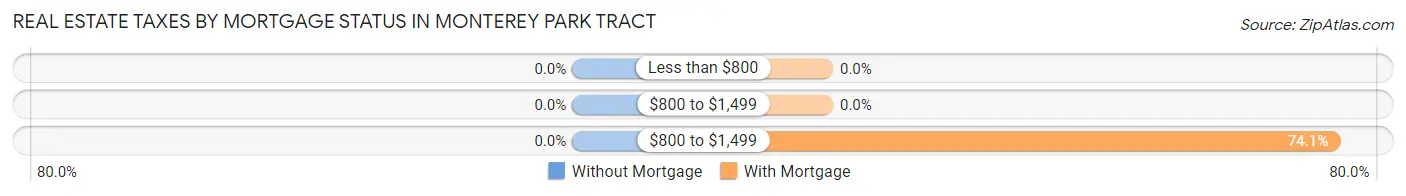
| Property Taxes | Without Mortgage | With Mortgage |
| Less than $800 | 0 (0.0%) | 0 (0.0%) |
| $800 to $1,499 | 0 (0.0%) | 0 (0.0%) |
| $800 to $1,499 | 0 (0.0%) | 20 (74.1%) |
| Total | 0 (0.0%) | 27 (100.0%) |
Health & Disability in Monterey Park Tract
Health Insurance Coverage by Age in Monterey Park Tract
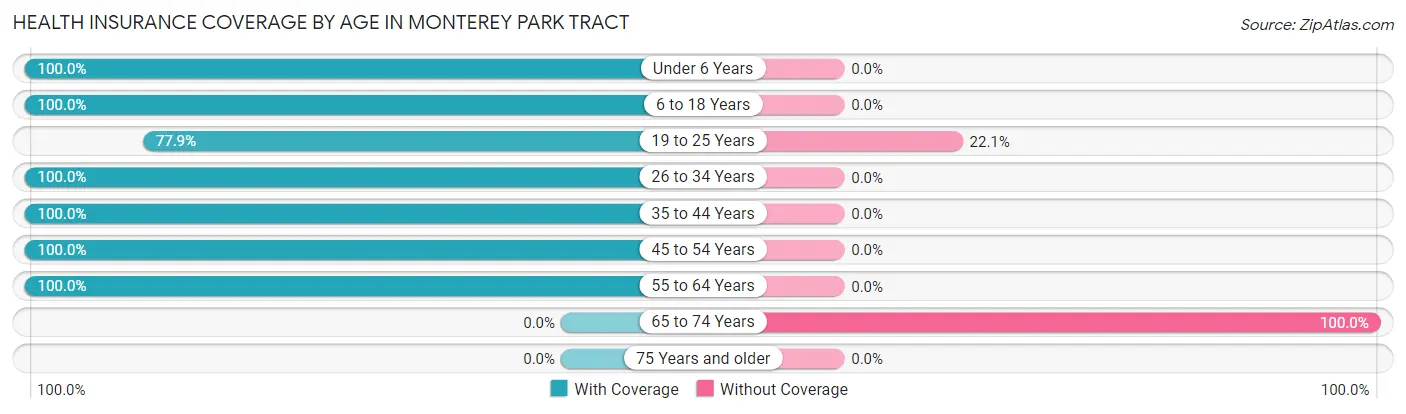
| Age Bracket | With Coverage | Without Coverage |
| Under 6 Years | 8 (100.0%) | 0 (0.0%) |
| 6 to 18 Years | 15 (100.0%) | 0 (0.0%) |
| 19 to 25 Years | 53 (77.9%) | 15 (22.1%) |
| 26 to 34 Years | 7 (100.0%) | 0 (0.0%) |
| 35 to 44 Years | 8 (100.0%) | 0 (0.0%) |
| 45 to 54 Years | 12 (100.0%) | 0 (0.0%) |
| 55 to 64 Years | 7 (100.0%) | 0 (0.0%) |
| 65 to 74 Years | 0 (0.0%) | 13 (100.0%) |
| 75 Years and older | 0 (0.0%) | 0 (0.0%) |
| Total | 110 (79.7%) | 28 (20.3%) |
Health Insurance Coverage by Citizenship Status in Monterey Park Tract
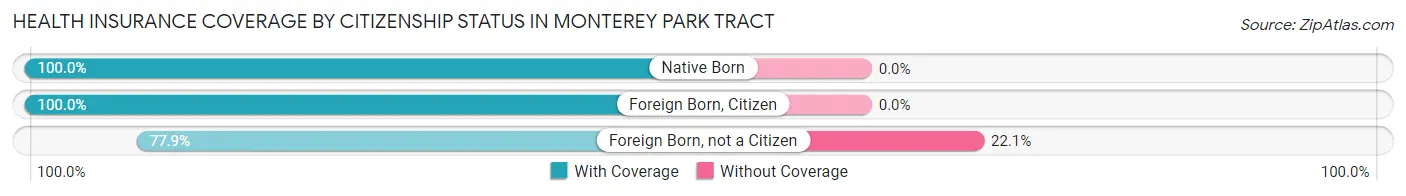
| Citizenship Status | With Coverage | Without Coverage |
| Native Born | 8 (100.0%) | 0 (0.0%) |
| Foreign Born, Citizen | 15 (100.0%) | 0 (0.0%) |
| Foreign Born, not a Citizen | 53 (77.9%) | 15 (22.1%) |
Health Insurance Coverage by Household Income in Monterey Park Tract
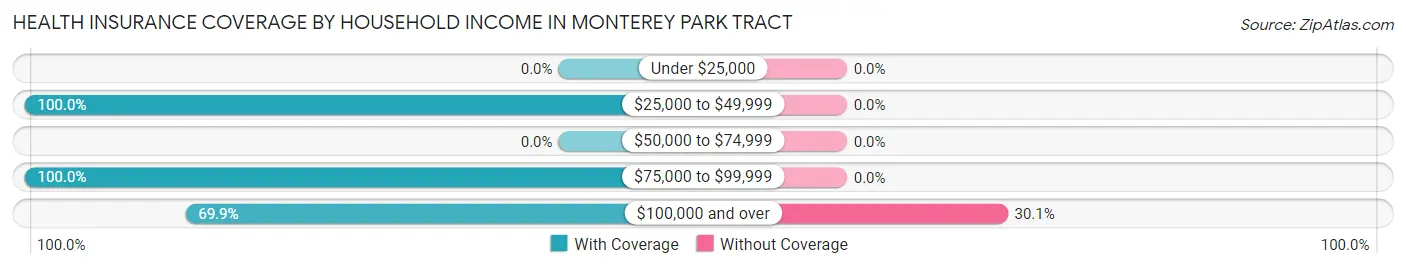
| Household Income | With Coverage | Without Coverage |
| Under $25,000 | 0 (0.0%) | 0 (0.0%) |
| $25,000 to $49,999 | 38 (100.0%) | 0 (0.0%) |
| $50,000 to $74,999 | 0 (0.0%) | 0 (0.0%) |
| $75,000 to $99,999 | 7 (100.0%) | 0 (0.0%) |
| $100,000 and over | 65 (69.9%) | 28 (30.1%) |
Public vs Private Health Insurance Coverage by Age in Monterey Park Tract
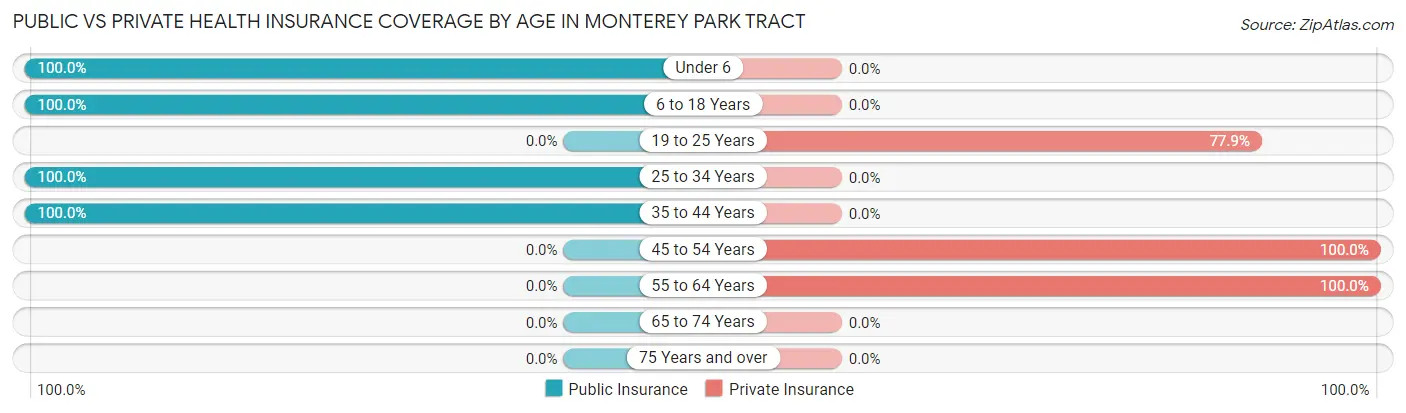
| Age Bracket | Public Insurance | Private Insurance |
| Under 6 | 8 (100.0%) | 0 (0.0%) |
| 6 to 18 Years | 15 (100.0%) | 0 (0.0%) |
| 19 to 25 Years | 0 (0.0%) | 53 (77.9%) |
| 25 to 34 Years | 7 (100.0%) | 0 (0.0%) |
| 35 to 44 Years | 8 (100.0%) | 0 (0.0%) |
| 45 to 54 Years | 0 (0.0%) | 12 (100.0%) |
| 55 to 64 Years | 0 (0.0%) | 7 (100.0%) |
| 65 to 74 Years | 0 (0.0%) | 0 (0.0%) |
| 75 Years and over | 0 (0.0%) | 0 (0.0%) |
| Total | 38 (27.5%) | 72 (52.2%) |
Disability Status by Sex by Age in Monterey Park Tract
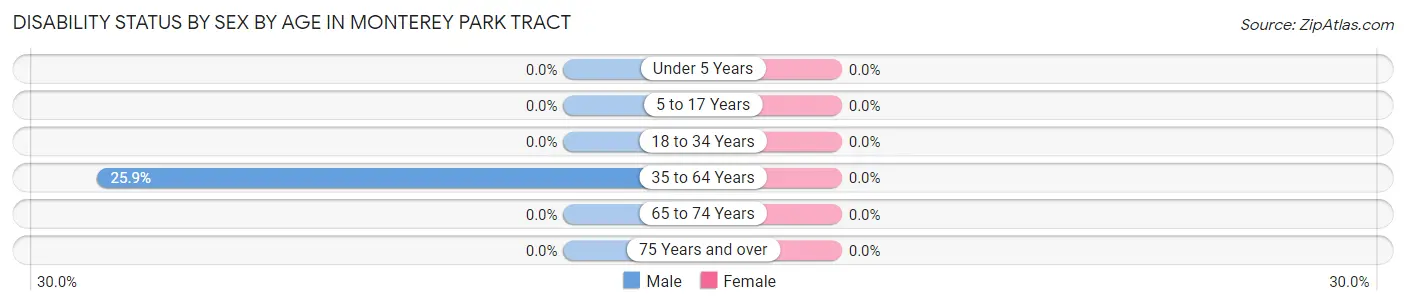
| Age Bracket | Male | Female |
| Under 5 Years | 0 (0.0%) | 0 (0.0%) |
| 5 to 17 Years | 0 (0.0%) | 0 (0.0%) |
| 18 to 34 Years | 0 (0.0%) | 0 (0.0%) |
| 35 to 64 Years | 7 (25.9%) | 0 (0.0%) |
| 65 to 74 Years | 0 (0.0%) | 0 (0.0%) |
| 75 Years and over | 0 (0.0%) | 0 (0.0%) |
Disability Class by Sex by Age in Monterey Park Tract
Disability Class: Hearing Difficulty
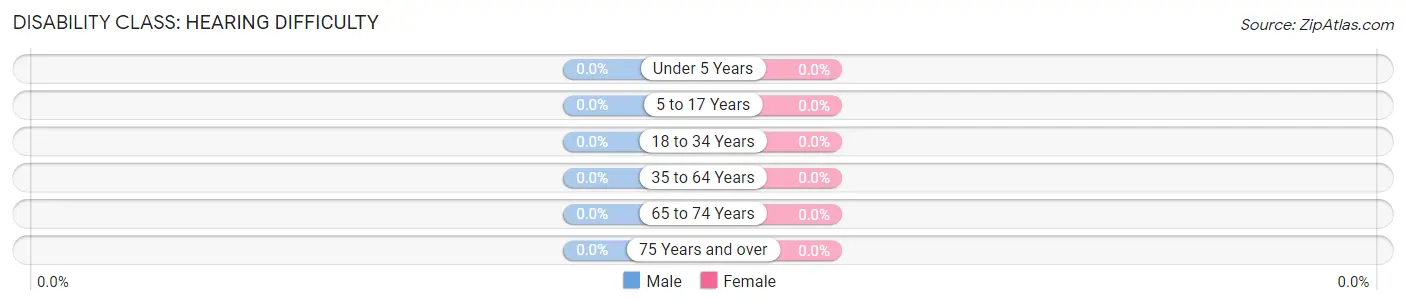
| Age Bracket | Male | Female |
| Under 5 Years | 0 (0.0%) | 0 (0.0%) |
| 5 to 17 Years | 0 (0.0%) | 0 (0.0%) |
| 18 to 34 Years | 0 (0.0%) | 0 (0.0%) |
| 35 to 64 Years | 0 (0.0%) | 0 (0.0%) |
| 65 to 74 Years | 0 (0.0%) | 0 (0.0%) |
| 75 Years and over | 0 (0.0%) | 0 (0.0%) |
Disability Class: Vision Difficulty
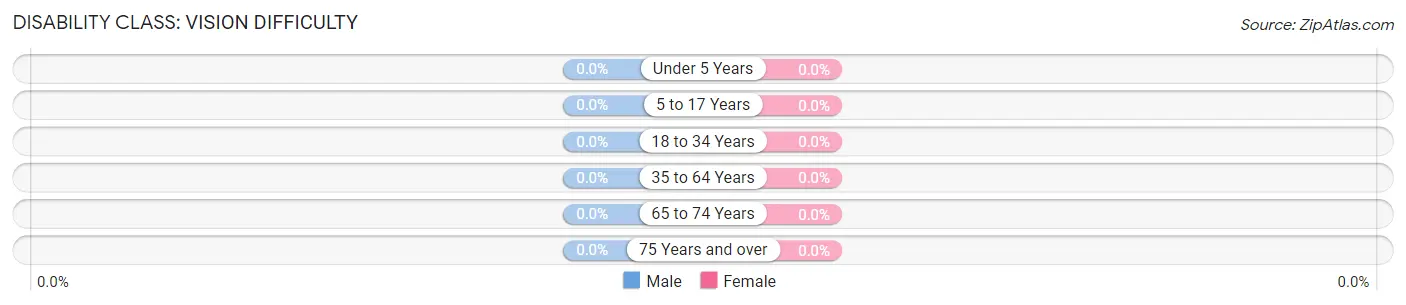
| Age Bracket | Male | Female |
| Under 5 Years | 0 (0.0%) | 0 (0.0%) |
| 5 to 17 Years | 0 (0.0%) | 0 (0.0%) |
| 18 to 34 Years | 0 (0.0%) | 0 (0.0%) |
| 35 to 64 Years | 0 (0.0%) | 0 (0.0%) |
| 65 to 74 Years | 0 (0.0%) | 0 (0.0%) |
| 75 Years and over | 0 (0.0%) | 0 (0.0%) |
Disability Class: Cognitive Difficulty
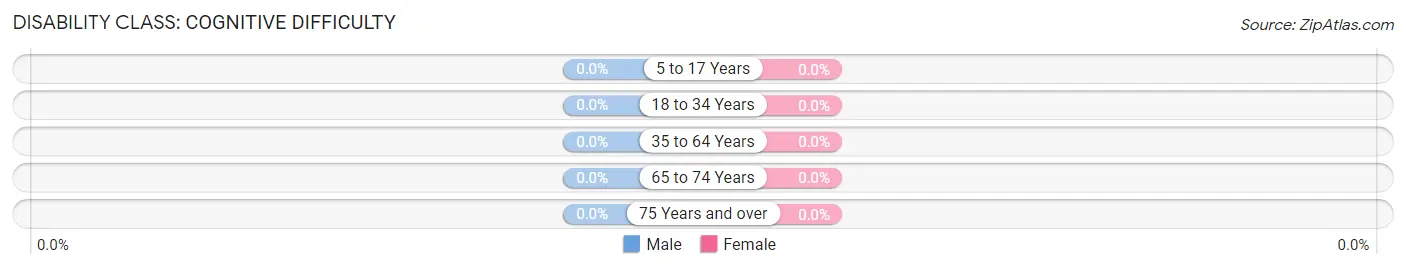
| Age Bracket | Male | Female |
| 5 to 17 Years | 0 (0.0%) | 0 (0.0%) |
| 18 to 34 Years | 0 (0.0%) | 0 (0.0%) |
| 35 to 64 Years | 0 (0.0%) | 0 (0.0%) |
| 65 to 74 Years | 0 (0.0%) | 0 (0.0%) |
| 75 Years and over | 0 (0.0%) | 0 (0.0%) |
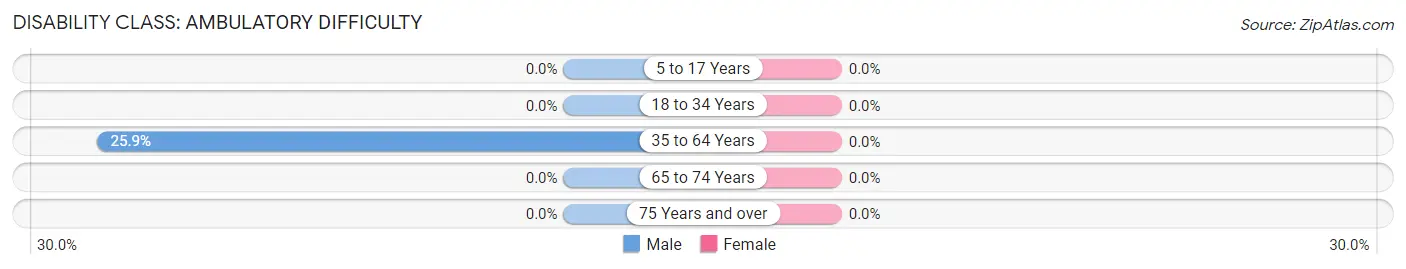
Disability Class: Ambulatory Difficulty
| Age Bracket | Male | Female |
| 5 to 17 Years | 0 (0.0%) | 0 (0.0%) |
| 18 to 34 Years | 0 (0.0%) | 0 (0.0%) |
| 35 to 64 Years | 7 (25.9%) | 0 (0.0%) |
| 65 to 74 Years | 0 (0.0%) | 0 (0.0%) |
| 75 Years and over | 0 (0.0%) | 0 (0.0%) |
Disability Class: Self-Care Difficulty

| Age Bracket | Male | Female |
| 5 to 17 Years | 0 (0.0%) | 0 (0.0%) |
| 18 to 34 Years | 0 (0.0%) | 0 (0.0%) |
| 35 to 64 Years | 0 (0.0%) | 0 (0.0%) |
| 65 to 74 Years | 0 (0.0%) | 0 (0.0%) |
| 75 Years and over | 0 (0.0%) | 0 (0.0%) |
Technology Access in Monterey Park Tract
Computing Device Access in Monterey Park Tract
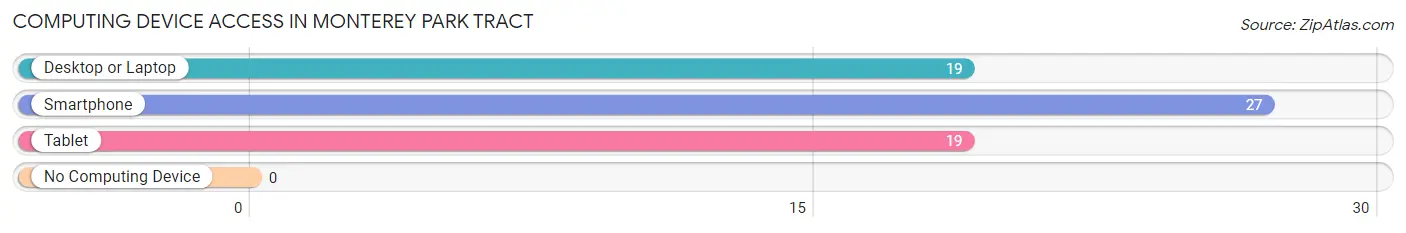
| Device Type | # Households | % Households |
| Desktop or Laptop | 19 | 70.4% |
| Smartphone | 27 | 100.0% |
| Tablet | 19 | 70.4% |
| No Computing Device | 0 | 0.0% |
| Total | 27 | 100.0% |
Internet Access in Monterey Park Tract
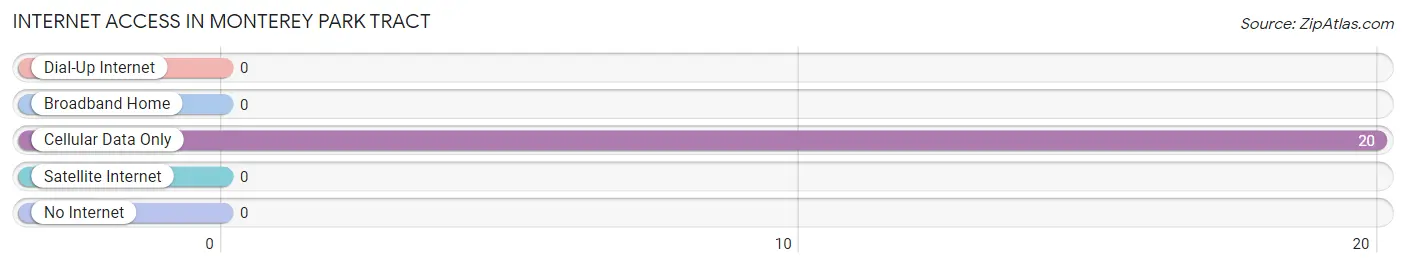
| Internet Type | # Households | % Households |
| Dial-Up Internet | 0 | 0.0% |
| Broadband Home | 0 | 0.0% |
| Cellular Data Only | 20 | 74.1% |
| Satellite Internet | 0 | 0.0% |
| No Internet | 0 | 0.0% |
| Total | 27 | 100.0% |
Monterey Park Tract Summary
Monterey Park Tract is a census-designated place (CDP) located in Los Angeles County, California. It is located in the San Gabriel Valley, just east of the city of Los Angeles. The population of Monterey Park Tract was 8,919 at the 2010 census.
History
Monterey Park Tract was originally part of the Rancho San Antonio land grant, which was granted to Antonio Maria Lugo in 1839. The land was later subdivided and sold to various individuals, including the Monterey Park Tract. The tract was developed in the early 1900s as a residential area for middle-class families. The area was annexed to the city of Monterey Park in the 1950s.
Geography
Monterey Park Tract is located at 34°3'7" North, 118°7'45" West (34.0519, -118.1293). It is bordered by the cities of Monterey Park to the west, Alhambra to the north, and South Pasadena to the east. The San Gabriel River forms the southern boundary of the CDP.
The total area of Monterey Park Tract is 0.9 square miles, all of which is land. The terrain is mostly flat, with some hills in the northern part of the CDP.
Demographics
As of the 2010 census, there were 8,919 people, 2,945 households, and 2,072 families residing in Monterey Park Tract. The population density was 9,945.7 people per square mile. The racial makeup of the CDP was 44.3% White, 1.2% African American, 0.7% Native American, 33.2% Asian, 0.2% Pacific Islander, 15.2% from other races, and 5.2% from two or more races. Hispanic or Latino of any race were 44.3% of the population.
The median age in Monterey Park Tract was 39.2 years. 24.2% of residents were under the age of 18; 8.7% were between the ages of 18 and 24; 24.2% were from 25 to 44; 28.2% were from 45 to 64; and 14.7% were 65 years of age or older. The gender makeup of the CDP was 48.2% male and 51.8% female.
Economy
The economy of Monterey Park Tract is largely based on service industries. The largest employers in the CDP are the Monterey Park Unified School District, the City of Monterey Park, and the Los Angeles County Fire Department. Other major employers include retail stores, restaurants, and medical offices.
The median household income in Monterey Park Tract was $50,945 in 2010. The per capita income was $25,945. About 11.2% of families and 14.2% of the population were below the poverty line, including 18.2% of those under age 18 and 8.2% of those age 65 or over.
Common Questions
What is the Total Population of Monterey Park Tract?
Total Population of Monterey Park Tract is 138.
What is the Total Male Population of Monterey Park Tract?
Total Male Population of Monterey Park Tract is 64.
What is the Total Female Population of Monterey Park Tract?
Total Female Population of Monterey Park Tract is 74.
What is the Ratio of Males per 100 Females in Monterey Park Tract?
There are 86.49 Males per 100 Females in Monterey Park Tract.
What is the Ratio of Females per 100 Males in Monterey Park Tract?
There are 115.62 Females per 100 Males in Monterey Park Tract.
What is the Median Population Age in Monterey Park Tract?
Median Population Age in Monterey Park Tract is 21.7 Years.
What is the Average Family Size in Monterey Park Tract
Average Family Size in Monterey Park Tract is 5.2 People.
What is the Average Household Size in Monterey Park Tract
Average Household Size in Monterey Park Tract is 5.1 People.
What is Per Capita Income in Monterey Park Tract?
Per Capita income in Monterey Park Tract is $21,683.
What is Income or Wage Gap in Monterey Park Tract?
Income or Wage Gap in Monterey Park Tract is 63.7%.
Women in Monterey Park Tract earn 36.3 cents for every dollar earned by a man.
What is Inequality or Gini Index in Monterey Park Tract?
Inequality or Gini Index in Monterey Park Tract is 0.24.
How Large is the Labor Force in Monterey Park Tract?
There are 82 People in the Labor Forcein in Monterey Park Tract.
What is the Percentage of People in the Labor Force in Monterey Park Tract?
71.3% of People are in the Labor Force in Monterey Park Tract.
What is the Unemployment Rate in Monterey Park Tract?
Unemployment Rate in Monterey Park Tract is 23.2%.