Mesa, CA
Mesa Map
Mesa Overview
374
TOTAL POPULATION
170
MALE POPULATION
204
FEMALE POPULATION
83.33
MALES / 100 FEMALES
120.00
FEMALES / 100 MALES
48.0
MEDIAN AGE
2.5
AVG FAMILY SIZE
2.4
AVG HOUSEHOLD SIZE
$50,421
PER CAPITA INCOME
$131,912
AVG FAMILY INCOME
$130,882
AVG HOUSEHOLD INCOME
83.2%
WAGE / INCOME GAP [ % ]
16.8¢/ $1
WAGE / INCOME GAP [ $ ]
0.40
INEQUALITY / GINI INDEX
174
LABOR FORCE [ PEOPLE ]
57.2%
PERCENT IN LABOR FORCE
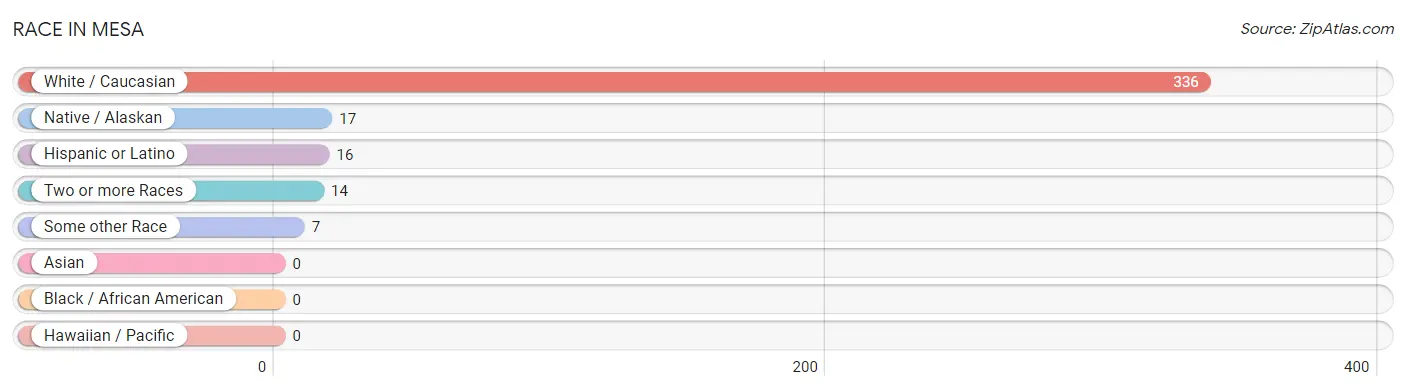
Race in Mesa
The most populous races in Mesa are White / Caucasian (336 | 89.8%), Native / Alaskan (17 | 4.5%), and Hispanic or Latino (16 | 4.3%).
| Race | # Population | % Population |
| Asian | 0 | 0.0% |
| Black / African American | 0 | 0.0% |
| Hawaiian / Pacific | 0 | 0.0% |
| Hispanic or Latino | 16 | 4.3% |
| Native / Alaskan | 17 | 4.5% |
| White / Caucasian | 336 | 89.8% |
| Two or more Races | 14 | 3.7% |
| Some other Race | 7 | 1.9% |
| Total | 374 | 100.0% |
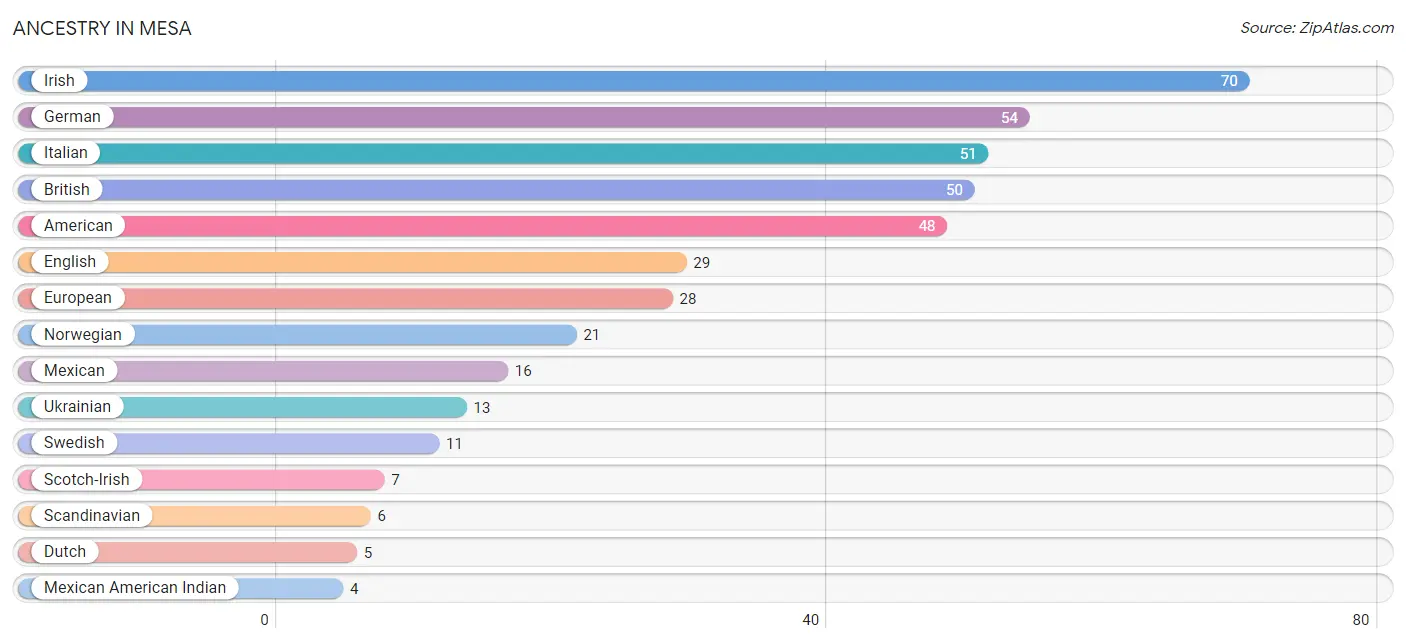
Ancestry in Mesa
The most populous ancestries reported in Mesa are Irish (70 | 18.7%), German (54 | 14.4%), Italian (51 | 13.6%), British (50 | 13.4%), and American (48 | 12.8%), together accounting for 73.0% of all Mesa residents.
| Ancestry | # Population | % Population |
| American | 48 | 12.8% |
| British | 50 | 13.4% |
| Dutch | 5 | 1.3% |
| English | 29 | 7.7% |
| European | 28 | 7.5% |
| French | 1 | 0.3% |
| German | 54 | 14.4% |
| Irish | 70 | 18.7% |
| Italian | 51 | 13.6% |
| Mexican | 16 | 4.3% |
| Mexican American Indian | 4 | 1.1% |
| Norwegian | 21 | 5.6% |
| Portuguese | 1 | 0.3% |
| Scandinavian | 6 | 1.6% |
| Scotch-Irish | 7 | 1.9% |
| Scottish | 1 | 0.3% |
| Swedish | 11 | 2.9% |
| Ukrainian | 13 | 3.5% | View All 18 Rows |
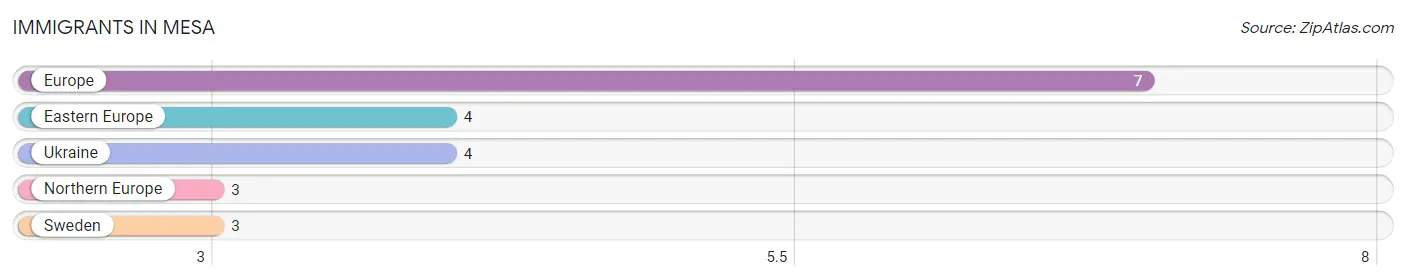
Immigrants in Mesa
The most numerous immigrant groups reported in Mesa came from Europe (7 | 1.9%), Eastern Europe (4 | 1.1%), Ukraine (4 | 1.1%), Northern Europe (3 | 0.8%), and Sweden (3 | 0.8%), together accounting for 5.6% of all Mesa residents.
| Immigration Origin | # Population | % Population |
| Eastern Europe | 4 | 1.1% |
| Europe | 7 | 1.9% |
| Northern Europe | 3 | 0.8% |
| Sweden | 3 | 0.8% |
| Ukraine | 4 | 1.1% | View All 5 Rows |
Sex and Age in Mesa
Sex and Age in Mesa
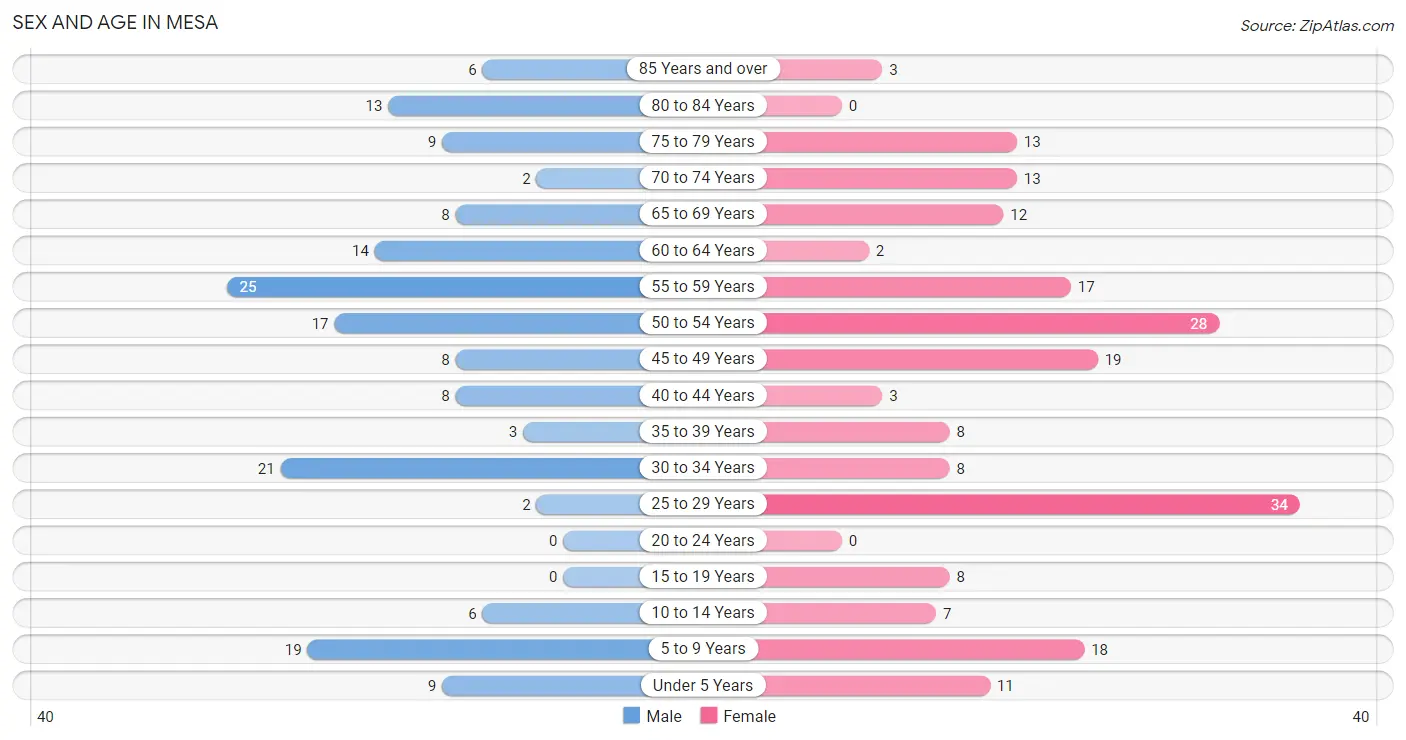
The most populous age groups in Mesa are 55 to 59 Years (25 | 14.7%) for men and 25 to 29 Years (34 | 16.7%) for women.
| Age Bracket | Male | Female |
| Under 5 Years | 9 (5.3%) | 11 (5.4%) |
| 5 to 9 Years | 19 (11.2%) | 18 (8.8%) |
| 10 to 14 Years | 6 (3.5%) | 7 (3.4%) |
| 15 to 19 Years | 0 (0.0%) | 8 (3.9%) |
| 20 to 24 Years | 0 (0.0%) | 0 (0.0%) |
| 25 to 29 Years | 2 (1.2%) | 34 (16.7%) |
| 30 to 34 Years | 21 (12.3%) | 8 (3.9%) |
| 35 to 39 Years | 3 (1.8%) | 8 (3.9%) |
| 40 to 44 Years | 8 (4.7%) | 3 (1.5%) |
| 45 to 49 Years | 8 (4.7%) | 19 (9.3%) |
| 50 to 54 Years | 17 (10.0%) | 28 (13.7%) |
| 55 to 59 Years | 25 (14.7%) | 17 (8.3%) |
| 60 to 64 Years | 14 (8.2%) | 2 (1.0%) |
| 65 to 69 Years | 8 (4.7%) | 12 (5.9%) |
| 70 to 74 Years | 2 (1.2%) | 13 (6.4%) |
| 75 to 79 Years | 9 (5.3%) | 13 (6.4%) |
| 80 to 84 Years | 13 (7.6%) | 0 (0.0%) |
| 85 Years and over | 6 (3.5%) | 3 (1.5%) |
| Total | 170 (100.0%) | 204 (100.0%) |
Families and Households in Mesa
Median Family Size in Mesa
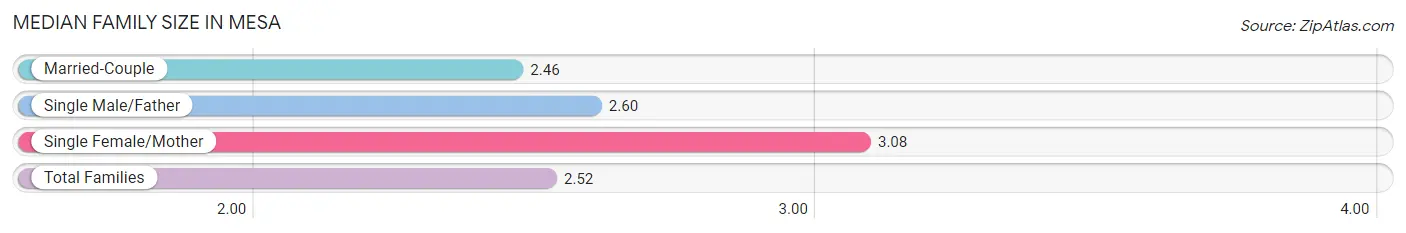
The median family size in Mesa is 2.52 persons per family, with single female/mother families (13 | 9.6%) accounting for the largest median family size of 3.08 persons per family. On the other hand, married-couple families (118 | 86.8%) represent the smallest median family size with 2.46 persons per family.
| Family Type | # Families | Family Size |
| Married-Couple | 118 (86.8%) | 2.46 |
| Single Male/Father | 5 (3.7%) | 2.60 |
| Single Female/Mother | 13 (9.6%) | 3.08 |
| Total Families | 136 (100.0%) | 2.52 |
Median Household Size in Mesa
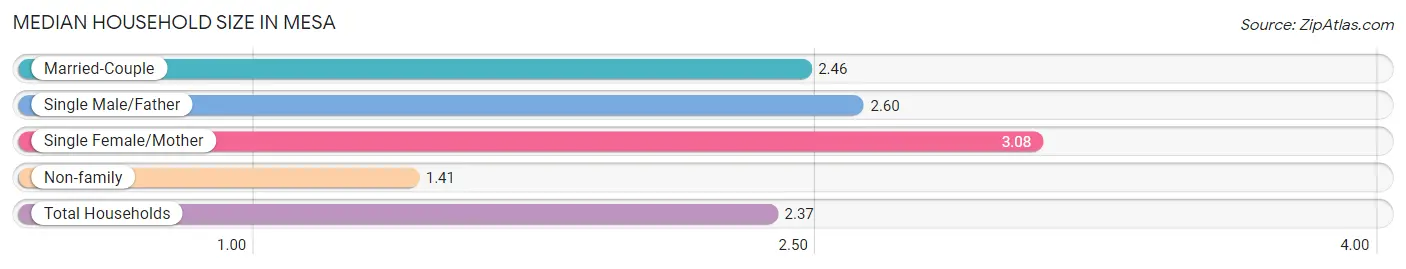
The median household size in Mesa is 2.37 persons per household, with single female/mother households (13 | 8.2%) accounting for the largest median household size of 3.08 persons per household. non-family households (22 | 13.9%) represent the smallest median household size with 1.41 persons per household.
| Household Type | # Households | Household Size |
| Married-Couple | 118 (74.7%) | 2.46 |
| Single Male/Father | 5 (3.2%) | 2.60 |
| Single Female/Mother | 13 (8.2%) | 3.08 |
| Non-family | 22 (13.9%) | 1.41 |
| Total Households | 158 (100.0%) | 2.37 |
Household Size by Marriage Status in Mesa
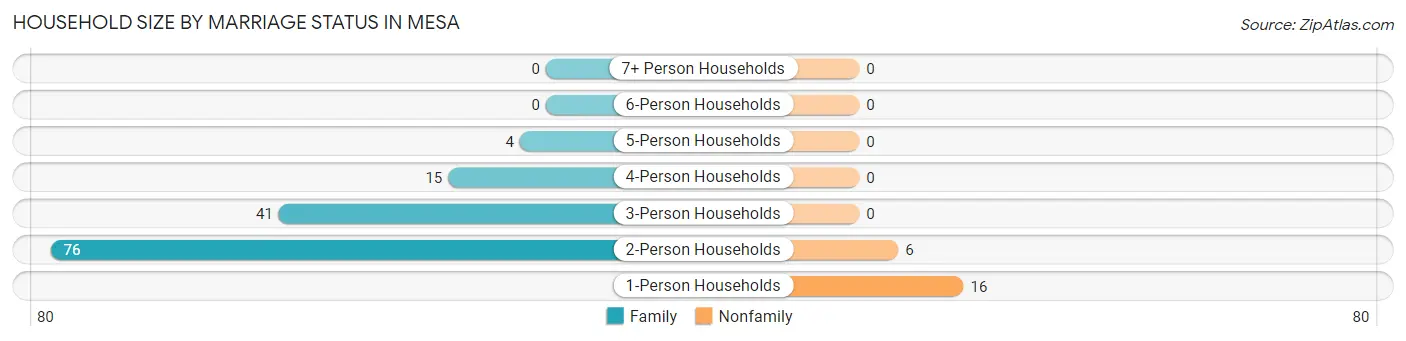
Out of a total of 158 households in Mesa, 136 (86.1%) are family households, while 22 (13.9%) are nonfamily households. The most numerous type of family households are 2-person households, comprising 76, and the most common type of nonfamily households are 1-person households, comprising 16.
| Household Size | Family Households | Nonfamily Households |
| 1-Person Households | - | 16 (10.1%) |
| 2-Person Households | 76 (48.1%) | 6 (3.8%) |
| 3-Person Households | 41 (26.0%) | 0 (0.0%) |
| 4-Person Households | 15 (9.5%) | 0 (0.0%) |
| 5-Person Households | 4 (2.5%) | 0 (0.0%) |
| 6-Person Households | 0 (0.0%) | 0 (0.0%) |
| 7+ Person Households | 0 (0.0%) | 0 (0.0%) |
| Total | 136 (86.1%) | 22 (13.9%) |
Female Fertility in Mesa
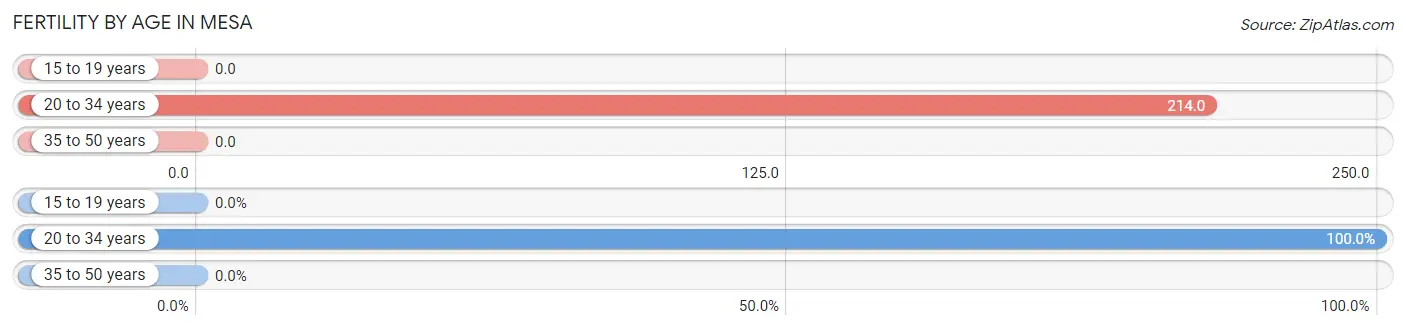
Fertility by Age in Mesa
Average fertility rate in Mesa is 113.0 births per 1,000 women. Women in the age bracket of 20 to 34 years have the highest fertility rate with 214.0 births per 1,000 women. Women in the age bracket of 20 to 34 years acount for 100.0% of all women with births.
| Age Bracket | Women with Births | Births / 1,000 Women |
| 15 to 19 years | 0 (0.0%) | 0.0 |
| 20 to 34 years | 9 (100.0%) | 214.0 |
| 35 to 50 years | 0 (0.0%) | 0.0 |
| Total | 9 (100.0%) | 113.0 |
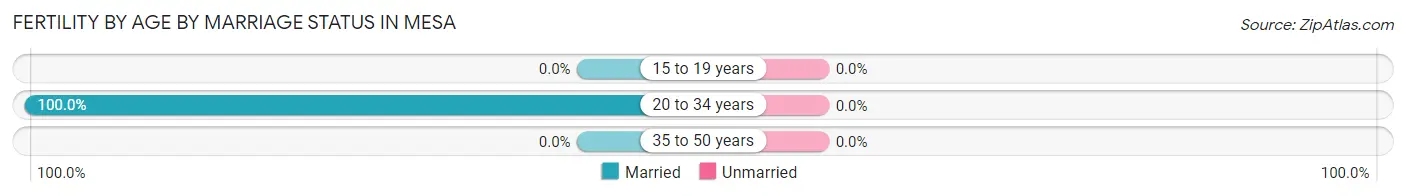
Fertility by Age by Marriage Status in Mesa
| Age Bracket | Married | Unmarried |
| 15 to 19 years | 0 (0.0%) | 0 (0.0%) |
| 20 to 34 years | 9 (100.0%) | 0 (0.0%) |
| 35 to 50 years | 0 (0.0%) | 0 (0.0%) |
| Total | 9 (100.0%) | 0 (0.0%) |
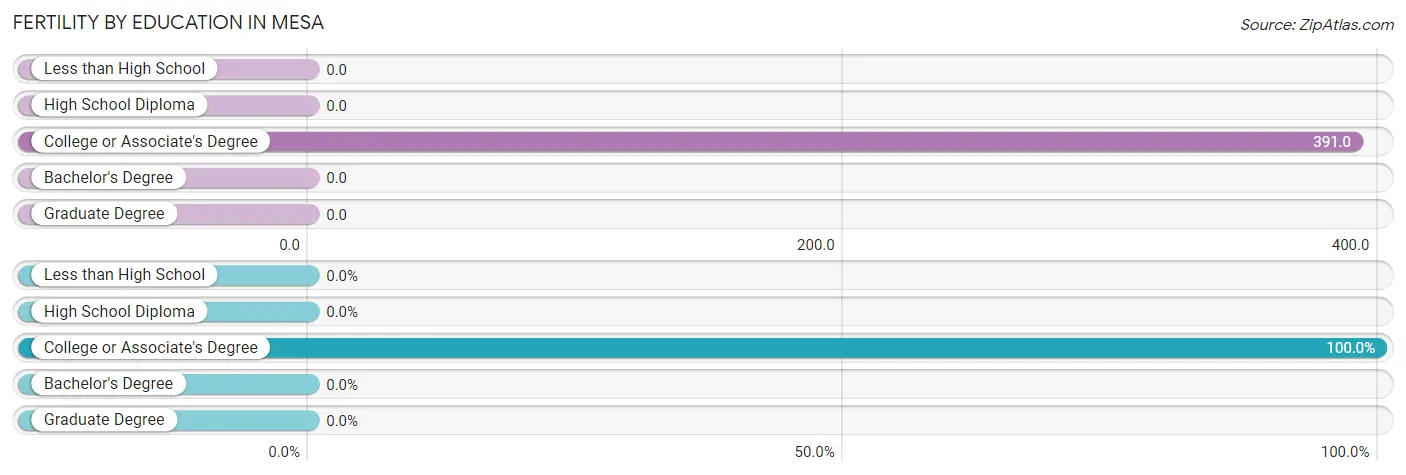
Fertility by Education in Mesa
| Educational Attainment | Women with Births | Births / 1,000 Women |
| Less than High School | 0 (0.0%) | 0.0 |
| High School Diploma | 0 (0.0%) | 0.0 |
| College or Associate's Degree | 9 (100.0%) | 391.0 |
| Bachelor's Degree | 0 (0.0%) | 0.0 |
| Graduate Degree | 0 (0.0%) | 0.0 |
| Total | 9 (100.0%) | 113.0 |
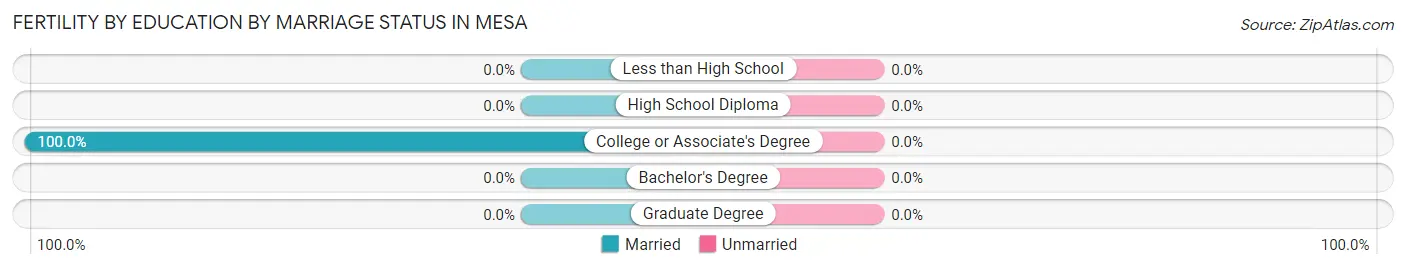
Fertility by Education by Marriage Status in Mesa
| Educational Attainment | Married | Unmarried |
| Less than High School | 0 (0.0%) | 0 (0.0%) |
| High School Diploma | 0 (0.0%) | 0 (0.0%) |
| College or Associate's Degree | 9 (100.0%) | 0 (0.0%) |
| Bachelor's Degree | 0 (0.0%) | 0 (0.0%) |
| Graduate Degree | 0 (0.0%) | 0 (0.0%) |
| Total | 9 (100.0%) | 0 (0.0%) |
Income in Mesa
Income Overview in Mesa
Per Capita Income in Mesa is $50,421, while median incomes of families and households are $131,912 and $130,882 respectively.
| Characteristic | Number | Measure |
| Per Capita Income | 374 | $50,421 |
| Median Family Income | 136 | $131,912 |
| Mean Family Income | 136 | $124,882 |
| Median Household Income | 158 | $130,882 |
| Mean Household Income | 158 | $119,025 |
| Income Deficit | 136 | $0 |
| Wage / Income Gap (%) | 374 | 83.16% |
| Wage / Income Gap ($) | 374 | 16.84¢ per $1 |
| Gini / Inequality Index | 374 | 0.40 |
Earnings by Sex in Mesa
Average Earnings in Mesa are $56,696, $138,214 for men and $23,269 for women, a difference of 83.2%.
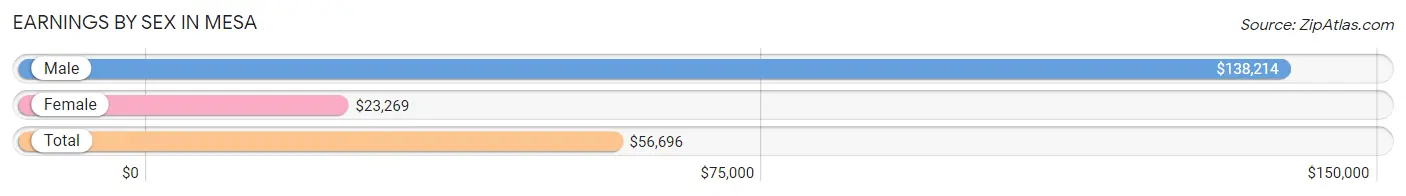
| Sex | Number | Average Earnings |
| Male | 88 (48.3%) | $138,214 |
| Female | 94 (51.6%) | $23,269 |
| Total | 182 (100.0%) | $56,696 |
Earnings by Sex by Income Bracket in Mesa
The most common earnings brackets in Mesa are $100,000+ for men (55 | 62.5%) and $22,500 to $24,999 for women (26 | 27.7%).
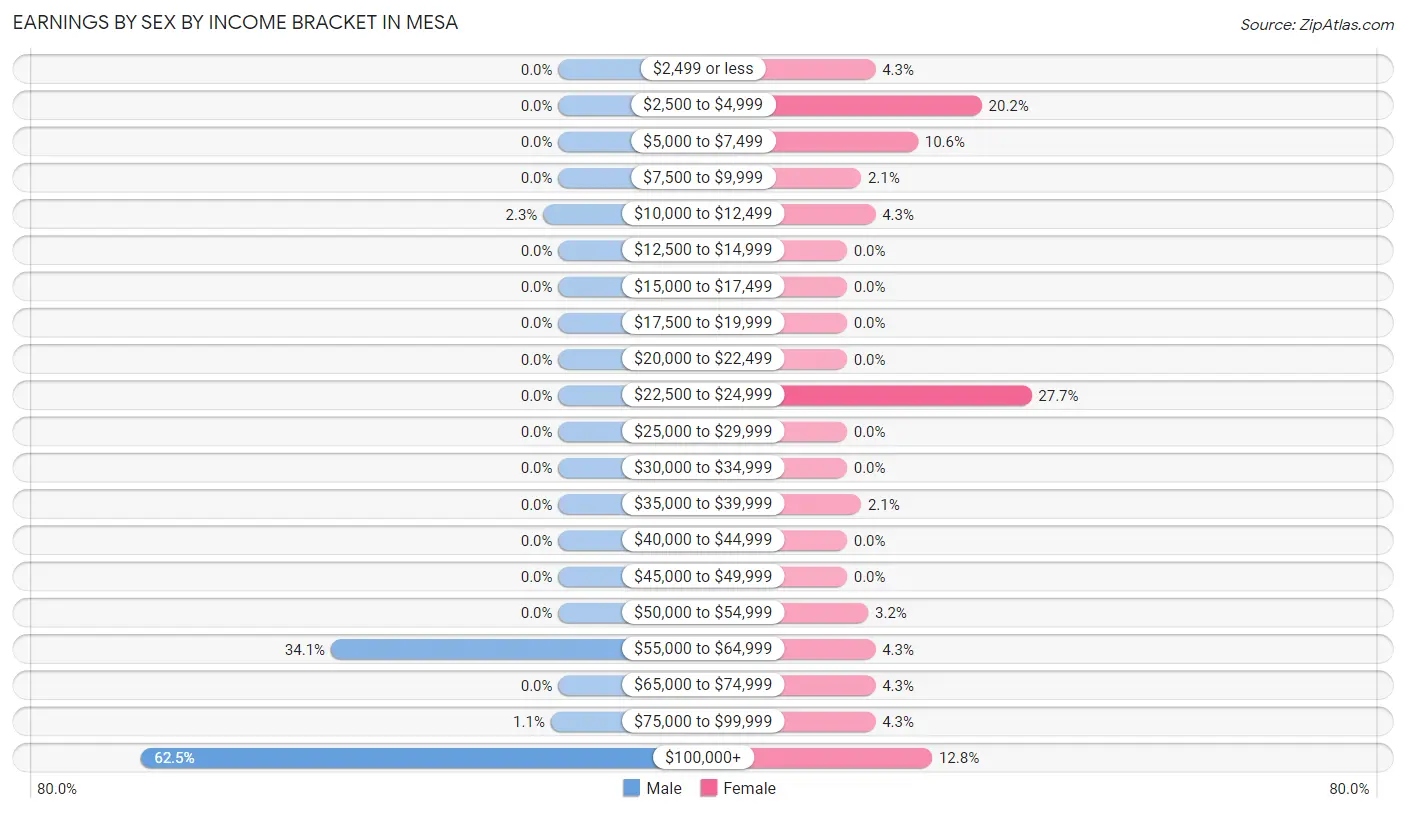
| Income | Male | Female |
| $2,499 or less | 0 (0.0%) | 4 (4.3%) |
| $2,500 to $4,999 | 0 (0.0%) | 19 (20.2%) |
| $5,000 to $7,499 | 0 (0.0%) | 10 (10.6%) |
| $7,500 to $9,999 | 0 (0.0%) | 2 (2.1%) |
| $10,000 to $12,499 | 2 (2.3%) | 4 (4.3%) |
| $12,500 to $14,999 | 0 (0.0%) | 0 (0.0%) |
| $15,000 to $17,499 | 0 (0.0%) | 0 (0.0%) |
| $17,500 to $19,999 | 0 (0.0%) | 0 (0.0%) |
| $20,000 to $22,499 | 0 (0.0%) | 0 (0.0%) |
| $22,500 to $24,999 | 0 (0.0%) | 26 (27.7%) |
| $25,000 to $29,999 | 0 (0.0%) | 0 (0.0%) |
| $30,000 to $34,999 | 0 (0.0%) | 0 (0.0%) |
| $35,000 to $39,999 | 0 (0.0%) | 2 (2.1%) |
| $40,000 to $44,999 | 0 (0.0%) | 0 (0.0%) |
| $45,000 to $49,999 | 0 (0.0%) | 0 (0.0%) |
| $50,000 to $54,999 | 0 (0.0%) | 3 (3.2%) |
| $55,000 to $64,999 | 30 (34.1%) | 4 (4.3%) |
| $65,000 to $74,999 | 0 (0.0%) | 4 (4.3%) |
| $75,000 to $99,999 | 1 (1.1%) | 4 (4.3%) |
| $100,000+ | 55 (62.5%) | 12 (12.8%) |
| Total | 88 (100.0%) | 94 (100.0%) |
Earnings by Sex by Educational Attainment in Mesa
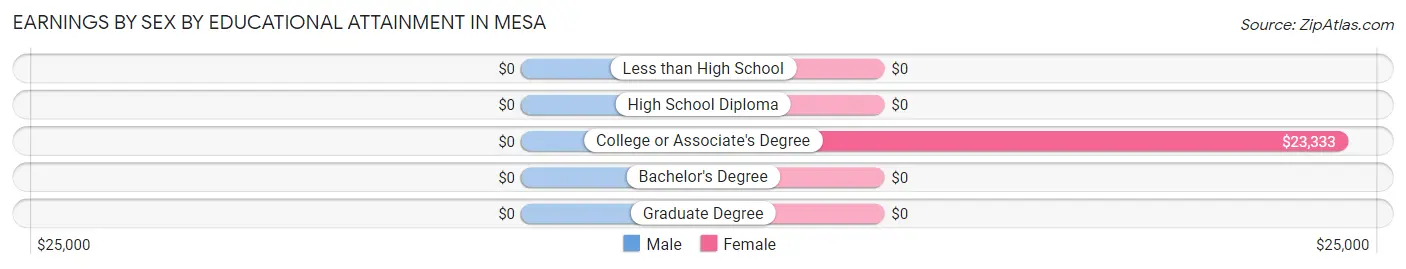
| Educational Attainment | Male Income | Female Income |
| Less than High School | - | - |
| High School Diploma | - | - |
| College or Associate's Degree | - | - |
| Bachelor's Degree | - | - |
| Graduate Degree | - | - |
| Total | $138,214 | $23,269 |
Family Income in Mesa
Family Income Brackets in Mesa
According to the Mesa family income data, there are 41 families falling into the $100,000 to $149,999 income range, which is the most common income bracket and makes up 30.1% of all families.
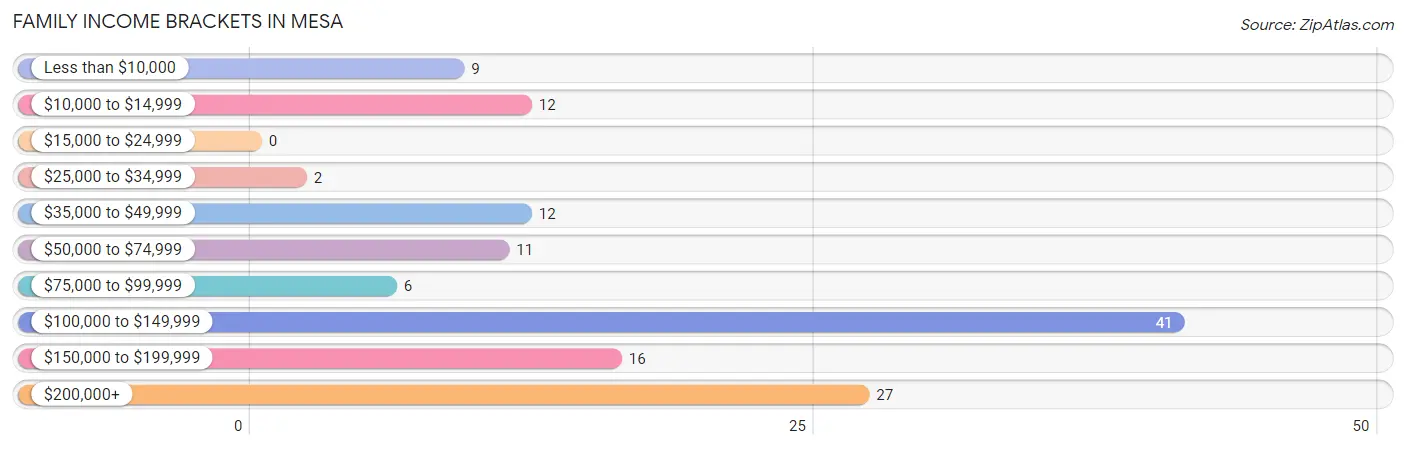
| Income Bracket | # Families | % Families |
| Less than $10,000 | 9 | 6.6% |
| $10,000 to $14,999 | 12 | 8.8% |
| $15,000 to $24,999 | 0 | 0.0% |
| $25,000 to $34,999 | 2 | 1.5% |
| $35,000 to $49,999 | 12 | 8.8% |
| $50,000 to $74,999 | 11 | 8.1% |
| $75,000 to $99,999 | 6 | 4.4% |
| $100,000 to $149,999 | 41 | 30.1% |
| $150,000 to $199,999 | 16 | 11.8% |
| $200,000+ | 27 | 19.9% |
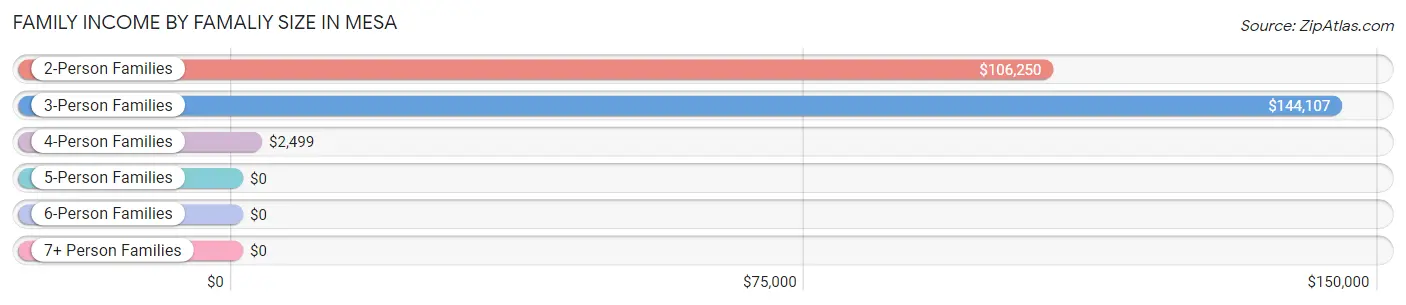
Family Income by Famaliy Size in Mesa
3-person families (41 | 30.1%) account for the highest median family income in Mesa with $144,107 per family, while 2-person families (76 | 55.9%) have the highest median income of $53,125 per family member.
| Income Bracket | # Families | Median Income |
| 2-Person Families | 76 (55.9%) | $106,250 |
| 3-Person Families | 41 (30.1%) | $144,107 |
| 4-Person Families | 15 (11.0%) | $2,499 |
| 5-Person Families | 4 (2.9%) | $0 |
| 6-Person Families | 0 (0.0%) | $0 |
| 7+ Person Families | 0 (0.0%) | $0 |
| Total | 136 (100.0%) | $131,912 |
Family Income by Number of Earners in Mesa
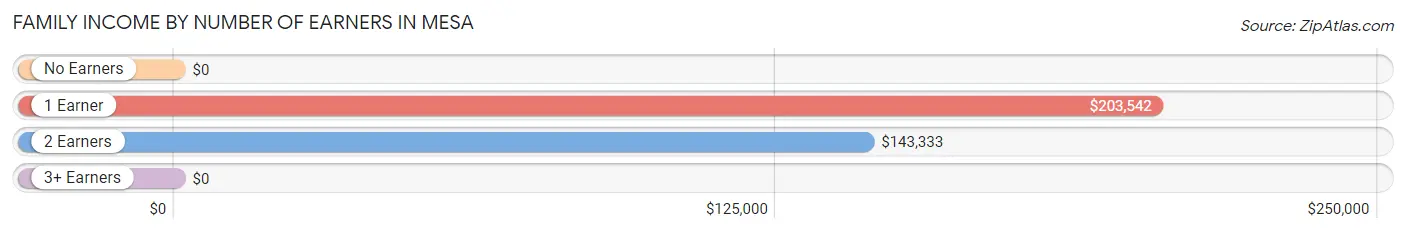
| Number of Earners | # Families | Median Income |
| No Earners | 41 (30.1%) | $0 |
| 1 Earner | 30 (22.1%) | $203,542 |
| 2 Earners | 56 (41.2%) | $143,333 |
| 3+ Earners | 9 (6.6%) | $0 |
| Total | 136 (100.0%) | $131,912 |
Household Income in Mesa
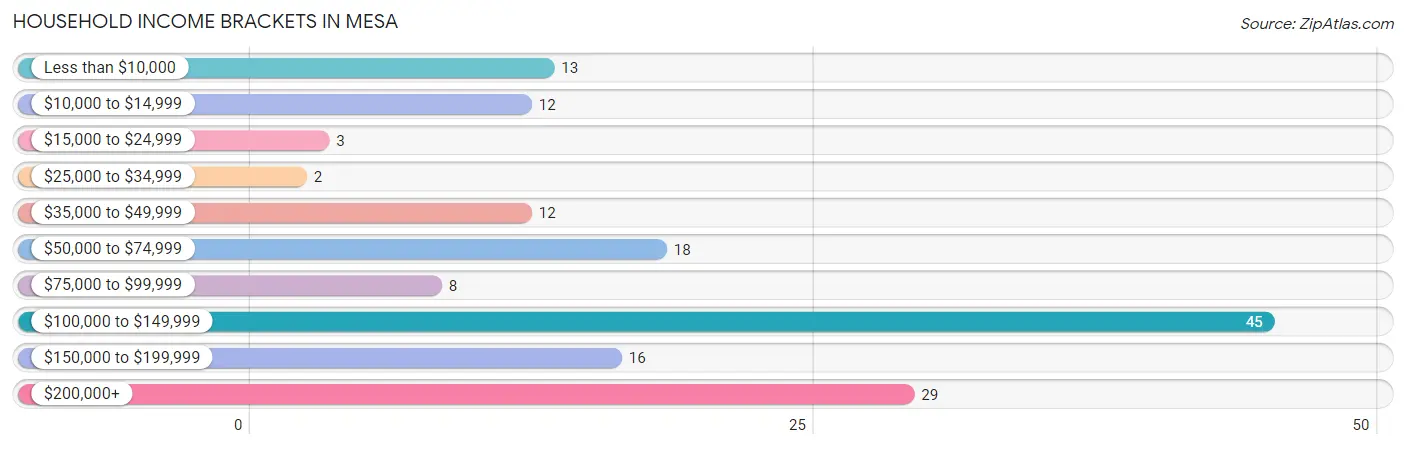
Household Income Brackets in Mesa
With 45 households falling in the category, the $100,000 to $149,999 income range is the most frequent in Mesa, accounting for 28.5% of all households. In contrast, only 2 households (1.3%) fall into the $25,000 to $34,999 income bracket, making it the least populous group.
| Income Bracket | # Households | % Households |
| Less than $10,000 | 13 | 8.2% |
| $10,000 to $14,999 | 12 | 7.6% |
| $15,000 to $24,999 | 3 | 1.9% |
| $25,000 to $34,999 | 2 | 1.3% |
| $35,000 to $49,999 | 12 | 7.6% |
| $50,000 to $74,999 | 18 | 11.4% |
| $75,000 to $99,999 | 8 | 5.1% |
| $100,000 to $149,999 | 45 | 28.5% |
| $150,000 to $199,999 | 16 | 10.1% |
| $200,000+ | 29 | 18.4% |
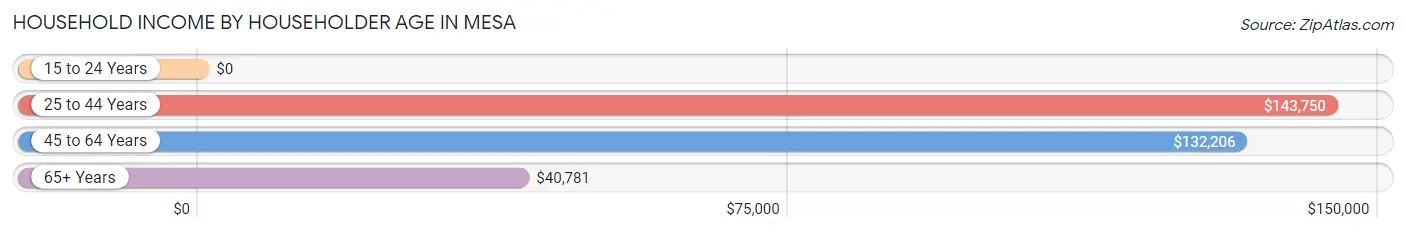
Household Income by Householder Age in Mesa
The median household income in Mesa is $130,882, with the highest median household income of $143,750 found in the 25 to 44 years age bracket for the primary householder. A total of 47 households (29.7%) fall into this category.
| Income Bracket | # Households | Median Income |
| 15 to 24 Years | 0 (0.0%) | $0 |
| 25 to 44 Years | 47 (29.7%) | $143,750 |
| 45 to 64 Years | 68 (43.0%) | $132,206 |
| 65+ Years | 43 (27.2%) | $40,781 |
| Total | 158 (100.0%) | $130,882 |
Poverty in Mesa
Income Below Poverty by Sex and Age in Mesa
With 13.5% poverty level for males and 13.7% for females among the residents of Mesa, under 5 year old males and 6 to 11 year old females are the most vulnerable to poverty, with 9 males (100.0%) and 6 females (46.2%) in their respective age groups living below the poverty level.
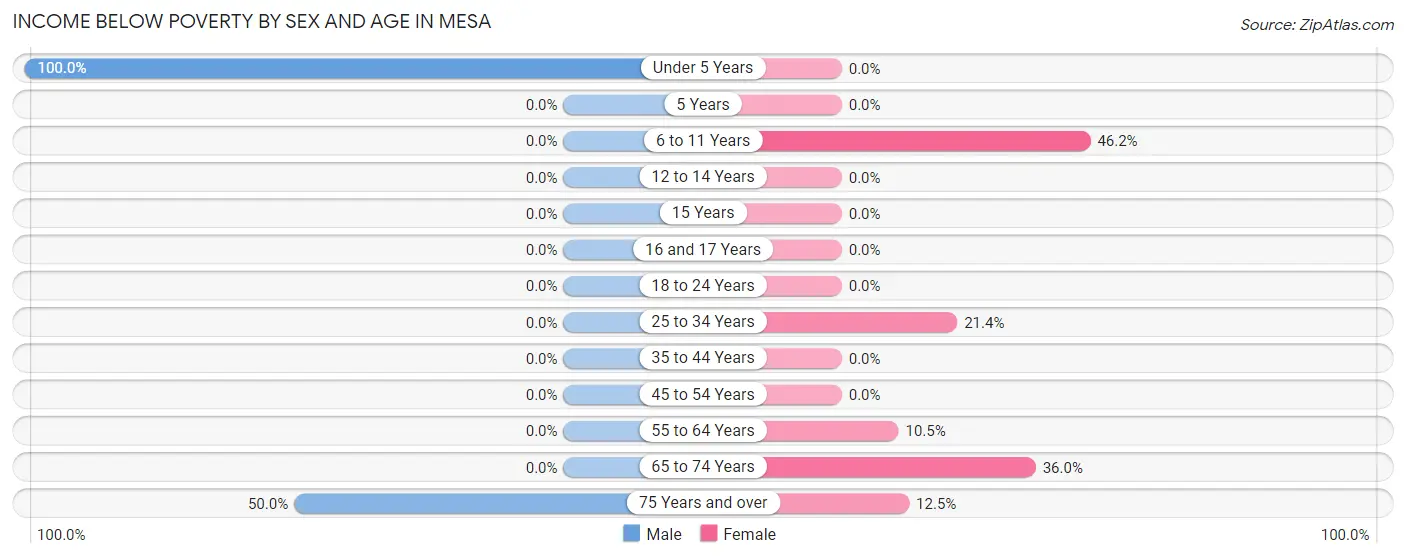
| Age Bracket | Male | Female |
| Under 5 Years | 9 (100.0%) | 0 (0.0%) |
| 5 Years | 0 (0.0%) | 0 (0.0%) |
| 6 to 11 Years | 0 (0.0%) | 6 (46.2%) |
| 12 to 14 Years | 0 (0.0%) | 0 (0.0%) |
| 15 Years | 0 (0.0%) | 0 (0.0%) |
| 16 and 17 Years | 0 (0.0%) | 0 (0.0%) |
| 18 to 24 Years | 0 (0.0%) | 0 (0.0%) |
| 25 to 34 Years | 0 (0.0%) | 9 (21.4%) |
| 35 to 44 Years | 0 (0.0%) | 0 (0.0%) |
| 45 to 54 Years | 0 (0.0%) | 0 (0.0%) |
| 55 to 64 Years | 0 (0.0%) | 2 (10.5%) |
| 65 to 74 Years | 0 (0.0%) | 9 (36.0%) |
| 75 Years and over | 14 (50.0%) | 2 (12.5%) |
| Total | 23 (13.5%) | 28 (13.7%) |
Income Above Poverty by Sex and Age in Mesa
According to the poverty statistics in Mesa, males aged 5 years and females aged under 5 years are the age groups that are most secure financially, with 100.0% of males and 100.0% of females in these age groups living above the poverty line.
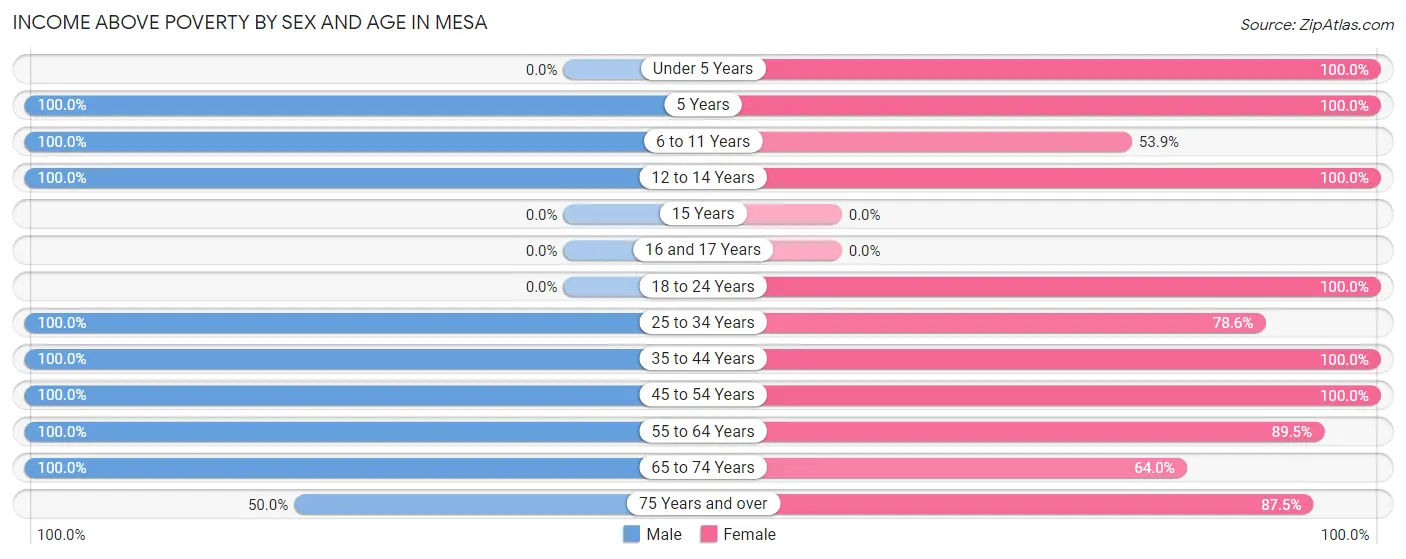
| Age Bracket | Male | Female |
| Under 5 Years | 0 (0.0%) | 11 (100.0%) |
| 5 Years | 4 (100.0%) | 10 (100.0%) |
| 6 to 11 Years | 19 (100.0%) | 7 (53.8%) |
| 12 to 14 Years | 2 (100.0%) | 2 (100.0%) |
| 15 Years | 0 (0.0%) | 0 (0.0%) |
| 16 and 17 Years | 0 (0.0%) | 0 (0.0%) |
| 18 to 24 Years | 0 (0.0%) | 8 (100.0%) |
| 25 to 34 Years | 23 (100.0%) | 33 (78.6%) |
| 35 to 44 Years | 11 (100.0%) | 11 (100.0%) |
| 45 to 54 Years | 25 (100.0%) | 47 (100.0%) |
| 55 to 64 Years | 39 (100.0%) | 17 (89.5%) |
| 65 to 74 Years | 10 (100.0%) | 16 (64.0%) |
| 75 Years and over | 14 (50.0%) | 14 (87.5%) |
| Total | 147 (86.5%) | 176 (86.3%) |
Income Below Poverty Among Married-Couple Families in Mesa
The poverty statistics for married-couple families in Mesa show that 10.2% or 12 of the total 118 families live below the poverty line. Families with no children have the highest poverty rate of 14.3%, comprising of 12 families. On the other hand, families with 1 or 2 children have the lowest poverty rate of 0.0%, which includes 0 families.
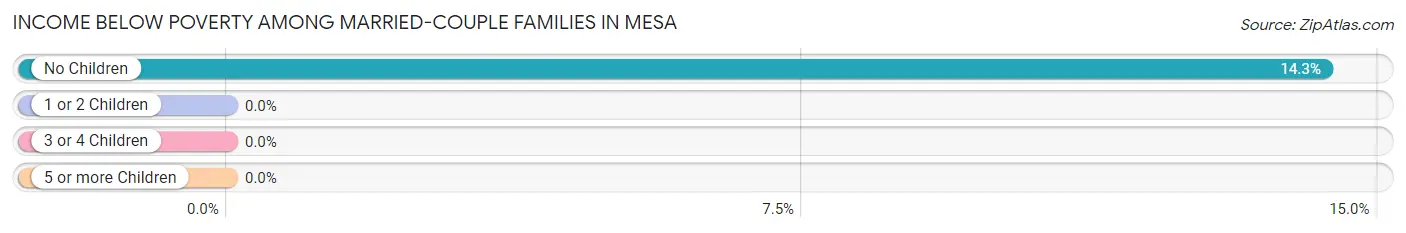
| Children | Above Poverty | Below Poverty |
| No Children | 72 (85.7%) | 12 (14.3%) |
| 1 or 2 Children | 30 (100.0%) | 0 (0.0%) |
| 3 or 4 Children | 4 (100.0%) | 0 (0.0%) |
| 5 or more Children | 0 (0.0%) | 0 (0.0%) |
| Total | 106 (89.8%) | 12 (10.2%) |
Income Below Poverty Among Single-Parent Households in Mesa
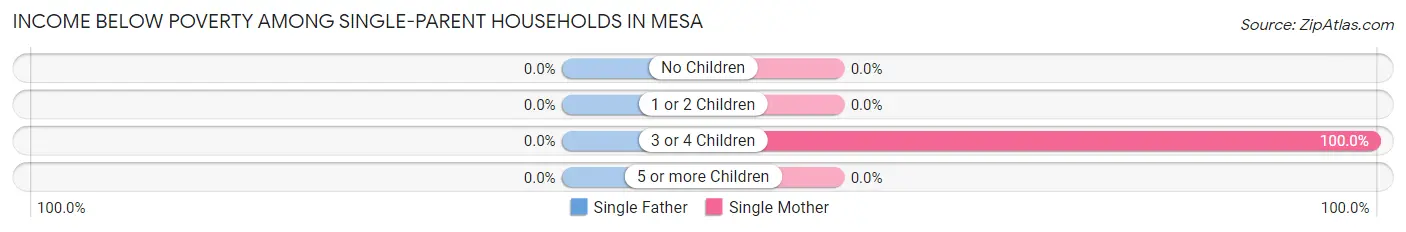
| Children | Single Father | Single Mother |
| No Children | 0 (0.0%) | 0 (0.0%) |
| 1 or 2 Children | 0 (0.0%) | 0 (0.0%) |
| 3 or 4 Children | 0 (0.0%) | 9 (100.0%) |
| 5 or more Children | 0 (0.0%) | 0 (0.0%) |
| Total | 0 (0.0%) | 9 (69.2%) |
Income Below Poverty Among Married-Couple vs Single-Parent Households in Mesa
The poverty data for Mesa shows that 12 of the married-couple family households (10.2%) and 9 of the single-parent households (50.0%) are living below the poverty level. Within the married-couple family households, those with no children have the highest poverty rate, with 12 households (14.3%) falling below the poverty line. Among the single-parent households, those with 3 or 4 children have the highest poverty rate, with 9 household (100.0%) living below poverty.
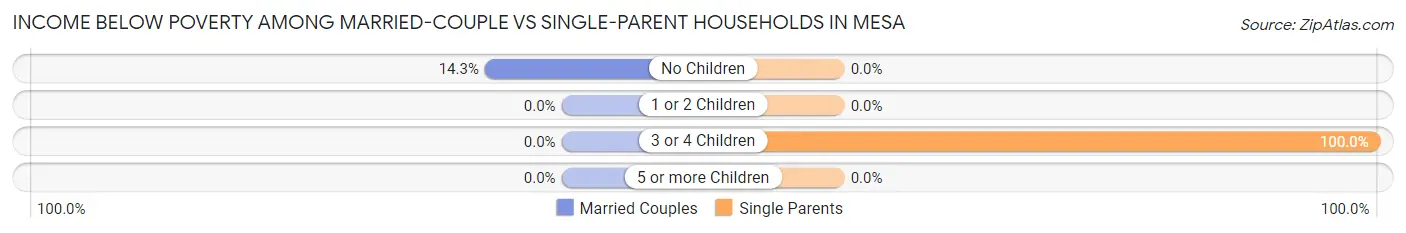
| Children | Married-Couple Families | Single-Parent Households |
| No Children | 12 (14.3%) | 0 (0.0%) |
| 1 or 2 Children | 0 (0.0%) | 0 (0.0%) |
| 3 or 4 Children | 0 (0.0%) | 9 (100.0%) |
| 5 or more Children | 0 (0.0%) | 0 (0.0%) |
| Total | 12 (10.2%) | 9 (50.0%) |
Employment Characteristics in Mesa
Employment by Class of Employer in Mesa
Among the 174 employed individuals in Mesa, private company employees (63 | 36.2%), self-employed (not incorporated) (41 | 23.6%), and local government employees (38 | 21.8%) make up the most common classes of employment.
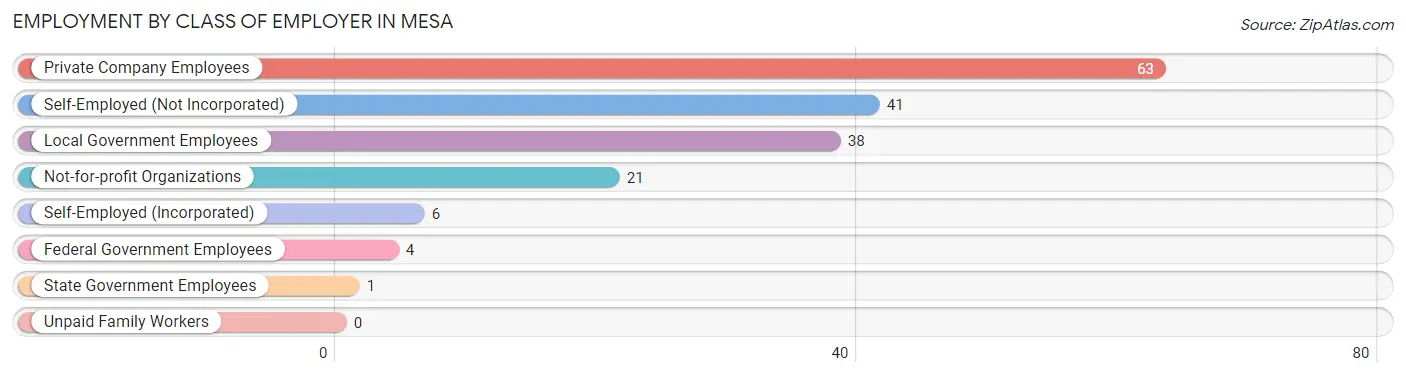
| Employer Class | # Employees | % Employees |
| Private Company Employees | 63 | 36.2% |
| Self-Employed (Incorporated) | 6 | 3.5% |
| Self-Employed (Not Incorporated) | 41 | 23.6% |
| Not-for-profit Organizations | 21 | 12.1% |
| Local Government Employees | 38 | 21.8% |
| State Government Employees | 1 | 0.6% |
| Federal Government Employees | 4 | 2.3% |
| Unpaid Family Workers | 0 | 0.0% |
| Total | 174 | 100.0% |
Employment Status by Age in Mesa
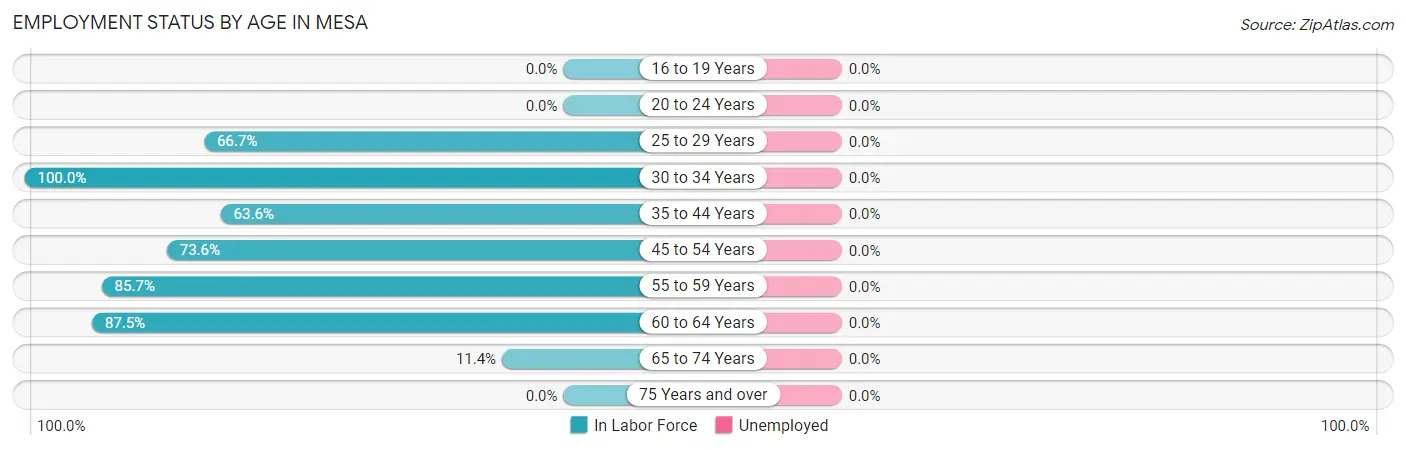
| Age Bracket | In Labor Force | Unemployed |
| 16 to 19 Years | 0 (0.0%) | 0 (0.0%) |
| 20 to 24 Years | 0 (0.0%) | 0 (0.0%) |
| 25 to 29 Years | 24 (66.7%) | 0 (0.0%) |
| 30 to 34 Years | 29 (100.0%) | 0 (0.0%) |
| 35 to 44 Years | 14 (63.6%) | 0 (0.0%) |
| 45 to 54 Years | 53 (73.6%) | 0 (0.0%) |
| 55 to 59 Years | 36 (85.7%) | 0 (0.0%) |
| 60 to 64 Years | 14 (87.5%) | 0 (0.0%) |
| 65 to 74 Years | 4 (11.4%) | 0 (0.0%) |
| 75 Years and over | 0 (0.0%) | 0 (0.0%) |
| Total | 174 (57.2%) | 0 (0.0%) |
Employment Status by Educational Attainment in Mesa
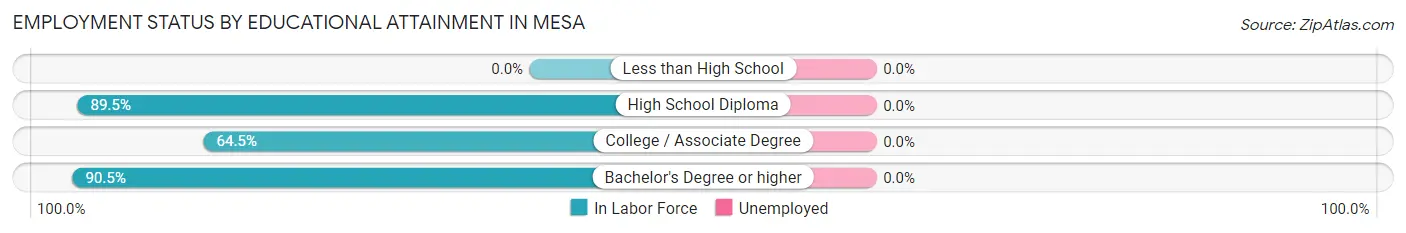
| Educational Attainment | In Labor Force | Unemployed |
| Less than High School | 0 (0.0%) | 0 (0.0%) |
| High School Diploma | 34 (89.5%) | 0 (0.0%) |
| College / Associate Degree | 60 (64.5%) | 0 (0.0%) |
| Bachelor's Degree or higher | 76 (90.5%) | 0 (0.0%) |
| Total | 170 (78.3%) | 0 (0.0%) |
Employment Occupations by Sex in Mesa
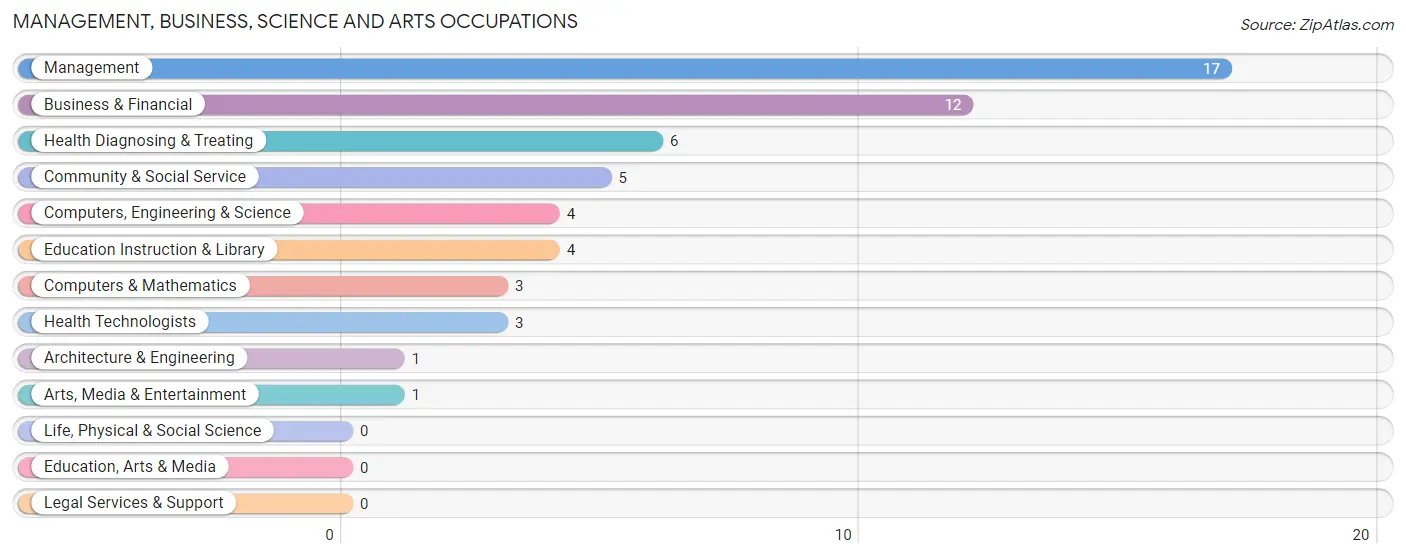
Management, Business, Science and Arts Occupations
The most common Management, Business, Science and Arts occupations in Mesa are Management (17 | 9.8%), Business & Financial (12 | 6.9%), Health Diagnosing & Treating (6 | 3.5%), Community & Social Service (5 | 2.9%), and Computers, Engineering & Science (4 | 2.3%).
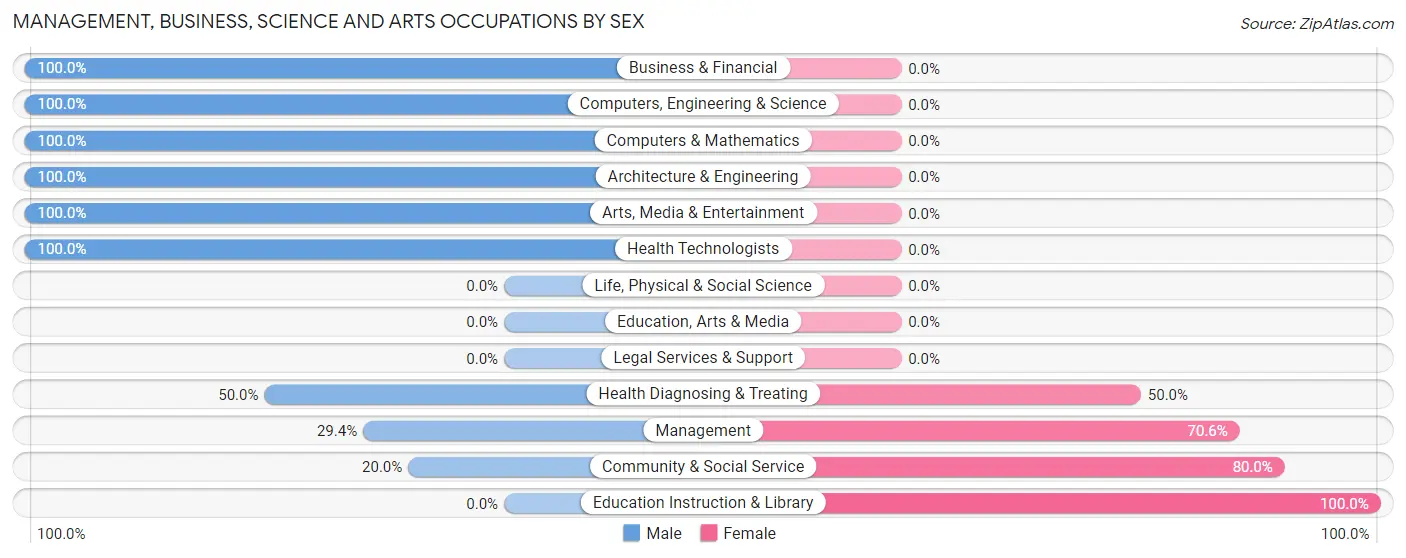
Management, Business, Science and Arts Occupations by Sex
Within the Management, Business, Science and Arts occupations in Mesa, the most male-oriented occupations are Business & Financial (100.0%), Computers, Engineering & Science (100.0%), and Computers & Mathematics (100.0%), while the most female-oriented occupations are Education Instruction & Library (100.0%), Community & Social Service (80.0%), and Management (70.6%).
| Occupation | Male | Female |
| Management | 5 (29.4%) | 12 (70.6%) |
| Business & Financial | 12 (100.0%) | 0 (0.0%) |
| Computers, Engineering & Science | 4 (100.0%) | 0 (0.0%) |
| Computers & Mathematics | 3 (100.0%) | 0 (0.0%) |
| Architecture & Engineering | 1 (100.0%) | 0 (0.0%) |
| Life, Physical & Social Science | 0 (0.0%) | 0 (0.0%) |
| Community & Social Service | 1 (20.0%) | 4 (80.0%) |
| Education, Arts & Media | 0 (0.0%) | 0 (0.0%) |
| Legal Services & Support | 0 (0.0%) | 0 (0.0%) |
| Education Instruction & Library | 0 (0.0%) | 4 (100.0%) |
| Arts, Media & Entertainment | 1 (100.0%) | 0 (0.0%) |
| Health Diagnosing & Treating | 3 (50.0%) | 3 (50.0%) |
| Health Technologists | 3 (100.0%) | 0 (0.0%) |
| Total (Category) | 25 (56.8%) | 19 (43.2%) |
| Total (Overall) | 88 (50.6%) | 86 (49.4%) |
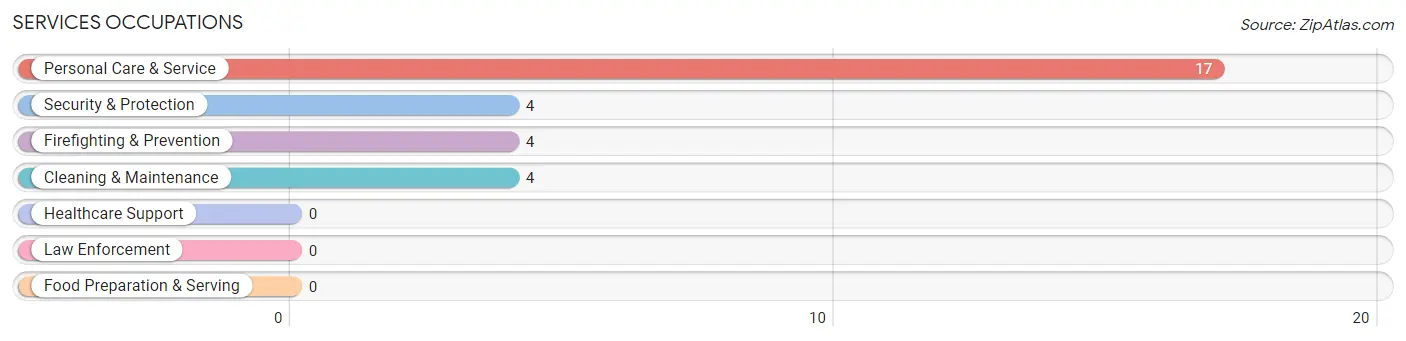
Services Occupations
The most common Services occupations in Mesa are Personal Care & Service (17 | 9.8%), Security & Protection (4 | 2.3%), Firefighting & Prevention (4 | 2.3%), and Cleaning & Maintenance (4 | 2.3%).
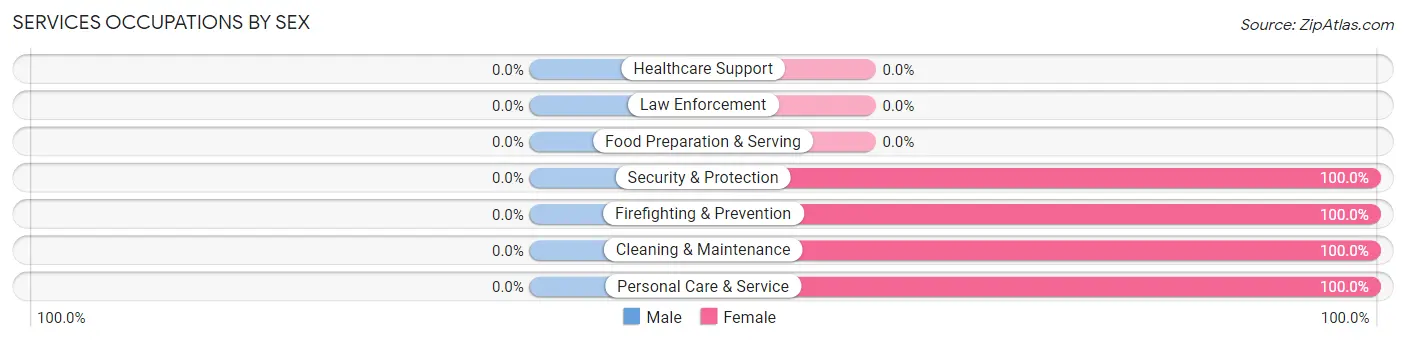
Services Occupations by Sex
| Occupation | Male | Female |
| Healthcare Support | 0 (0.0%) | 0 (0.0%) |
| Security & Protection | 0 (0.0%) | 4 (100.0%) |
| Firefighting & Prevention | 0 (0.0%) | 4 (100.0%) |
| Law Enforcement | 0 (0.0%) | 0 (0.0%) |
| Food Preparation & Serving | 0 (0.0%) | 0 (0.0%) |
| Cleaning & Maintenance | 0 (0.0%) | 4 (100.0%) |
| Personal Care & Service | 0 (0.0%) | 17 (100.0%) |
| Total (Category) | 0 (0.0%) | 25 (100.0%) |
| Total (Overall) | 88 (50.6%) | 86 (49.4%) |
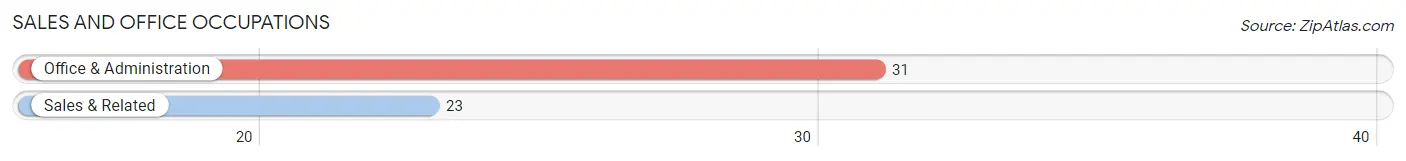
Sales and Office Occupations
The most common Sales and Office occupations in Mesa are Office & Administration (31 | 17.8%), and Sales & Related (23 | 13.2%).
Sales and Office Occupations by Sex
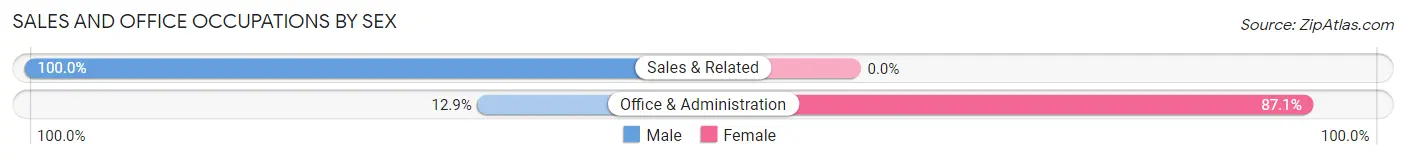
| Occupation | Male | Female |
| Sales & Related | 23 (100.0%) | 0 (0.0%) |
| Office & Administration | 4 (12.9%) | 27 (87.1%) |
| Total (Category) | 27 (50.0%) | 27 (50.0%) |
| Total (Overall) | 88 (50.6%) | 86 (49.4%) |
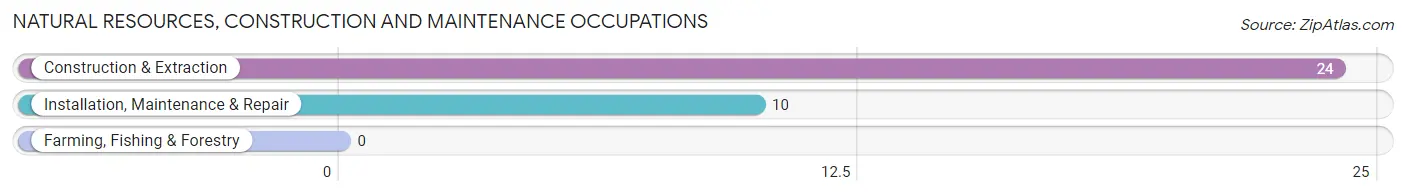
Natural Resources, Construction and Maintenance Occupations
The most common Natural Resources, Construction and Maintenance occupations in Mesa are Construction & Extraction (24 | 13.8%), and Installation, Maintenance & Repair (10 | 5.8%).
Natural Resources, Construction and Maintenance Occupations by Sex
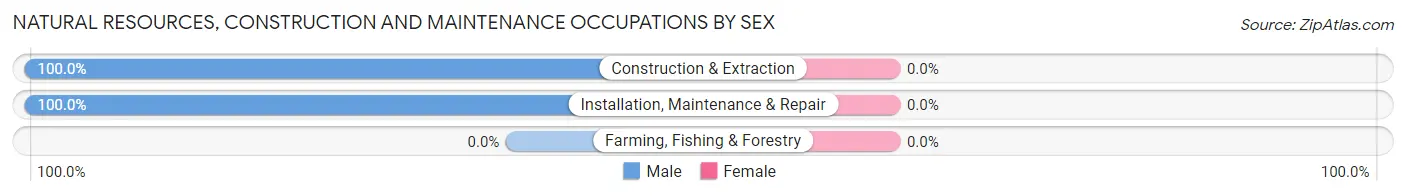
| Occupation | Male | Female |
| Farming, Fishing & Forestry | 0 (0.0%) | 0 (0.0%) |
| Construction & Extraction | 24 (100.0%) | 0 (0.0%) |
| Installation, Maintenance & Repair | 10 (100.0%) | 0 (0.0%) |
| Total (Category) | 34 (100.0%) | 0 (0.0%) |
| Total (Overall) | 88 (50.6%) | 86 (49.4%) |
Production, Transportation and Moving Occupations
The most common Production, Transportation and Moving occupations in Mesa are Production (15 | 8.6%), and Transportation (2 | 1.1%).
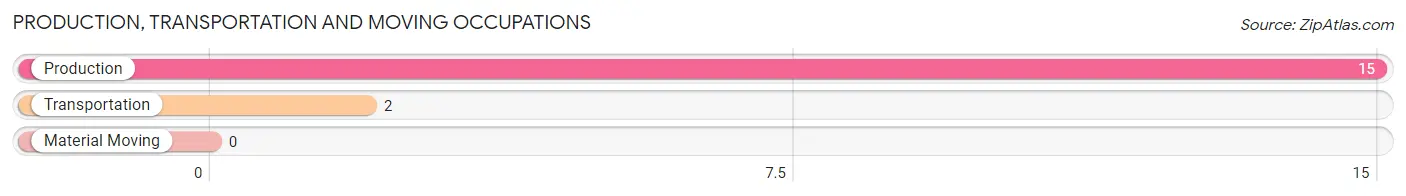
Production, Transportation and Moving Occupations by Sex
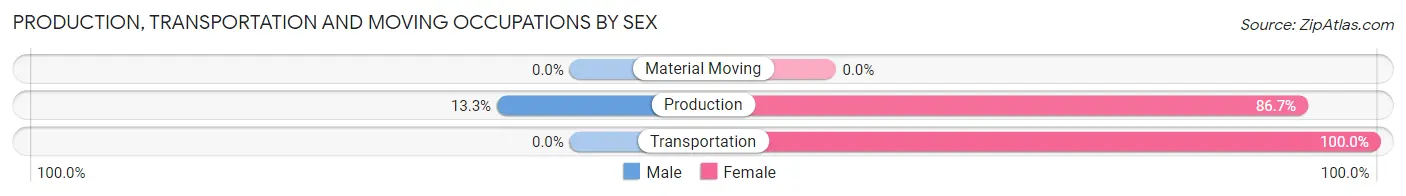
| Occupation | Male | Female |
| Production | 2 (13.3%) | 13 (86.7%) |
| Transportation | 0 (0.0%) | 2 (100.0%) |
| Material Moving | 0 (0.0%) | 0 (0.0%) |
| Total (Category) | 2 (11.8%) | 15 (88.2%) |
| Total (Overall) | 88 (50.6%) | 86 (49.4%) |
Employment Industries by Sex in Mesa
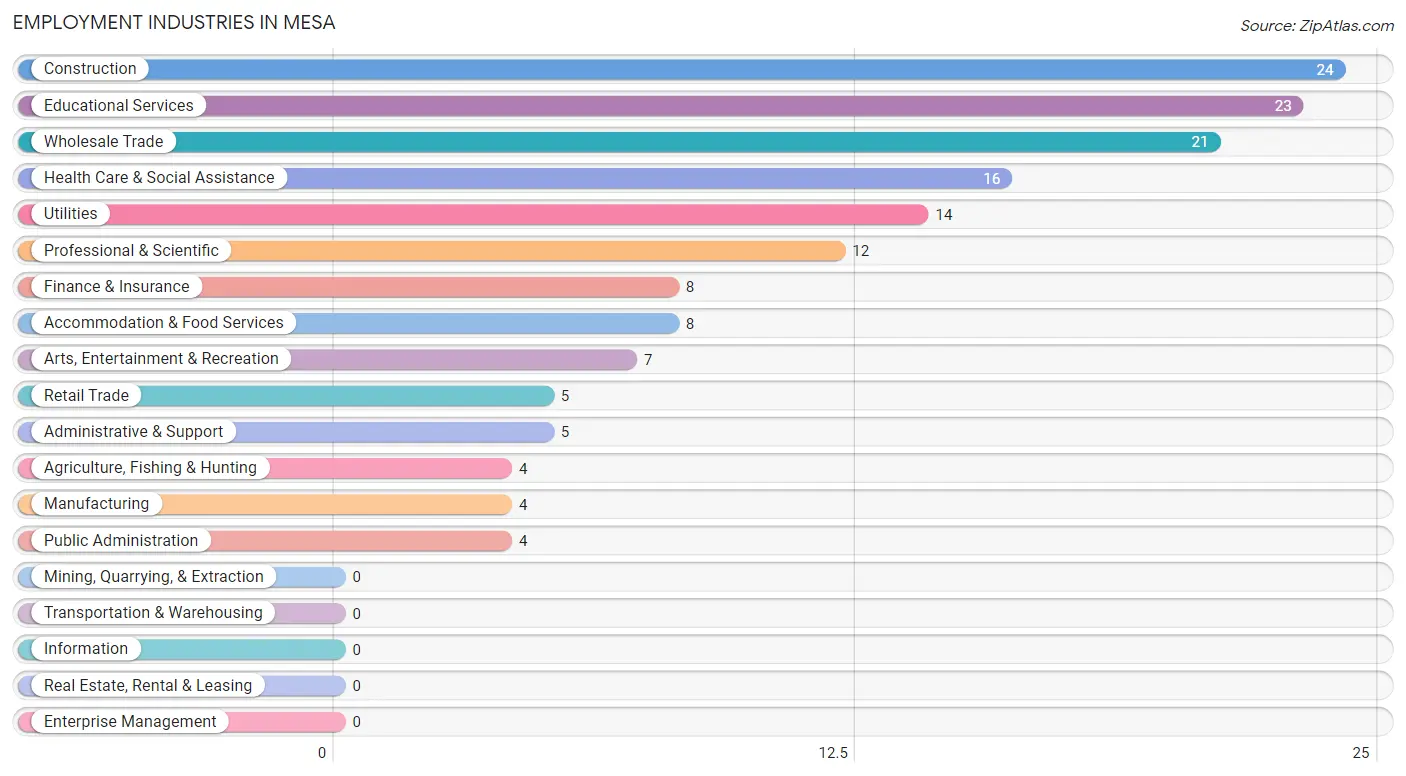
Employment Industries in Mesa
The major employment industries in Mesa include Construction (24 | 13.8%), Educational Services (23 | 13.2%), Wholesale Trade (21 | 12.1%), Health Care & Social Assistance (16 | 9.2%), and Utilities (14 | 8.1%).
Employment Industries by Sex in Mesa
The Mesa industries that see more men than women are Construction (100.0%), Wholesale Trade (100.0%), and Utilities (100.0%), whereas the industries that tend to have a higher number of women are Agriculture, Fishing & Hunting (100.0%), Manufacturing (100.0%), and Finance & Insurance (100.0%).
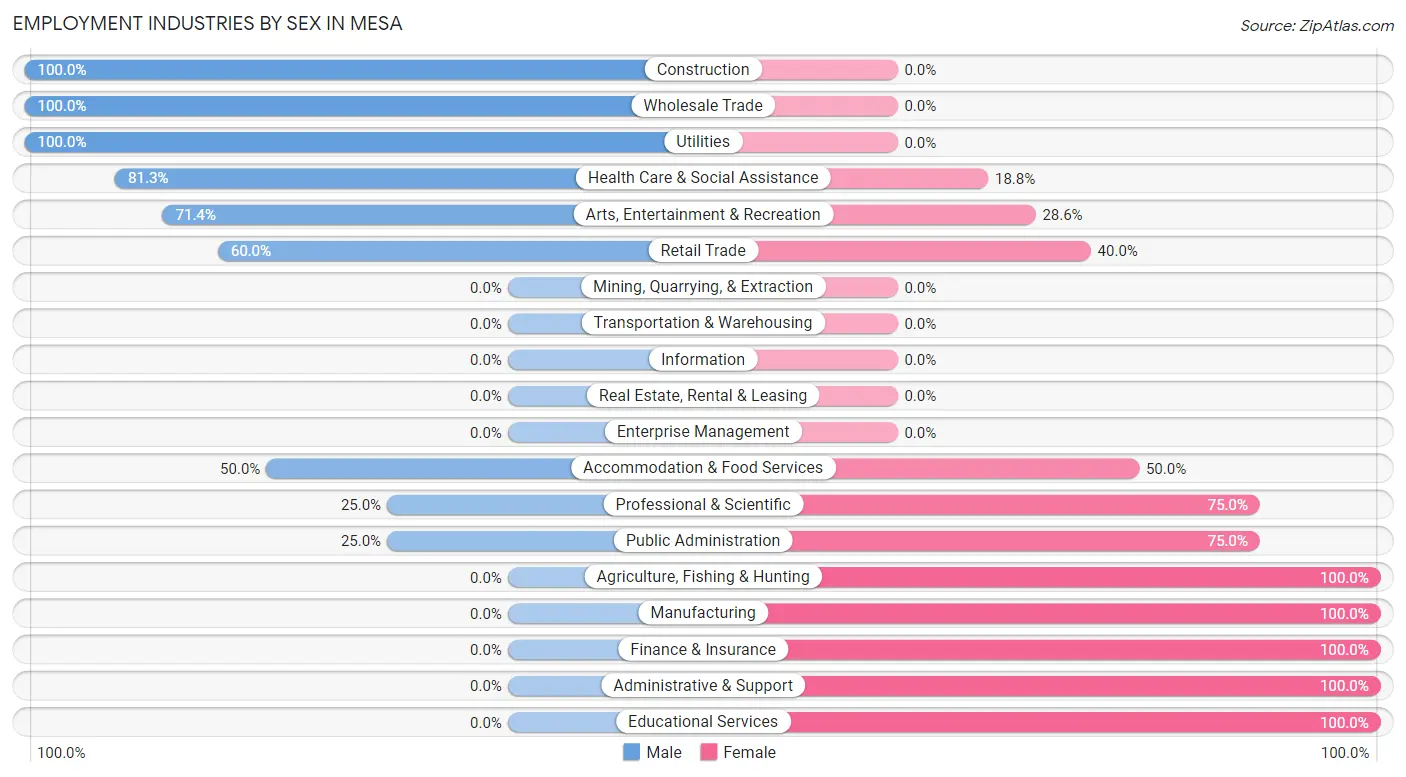
| Industry | Male | Female |
| Agriculture, Fishing & Hunting | 0 (0.0%) | 4 (100.0%) |
| Mining, Quarrying, & Extraction | 0 (0.0%) | 0 (0.0%) |
| Construction | 24 (100.0%) | 0 (0.0%) |
| Manufacturing | 0 (0.0%) | 4 (100.0%) |
| Wholesale Trade | 21 (100.0%) | 0 (0.0%) |
| Retail Trade | 3 (60.0%) | 2 (40.0%) |
| Transportation & Warehousing | 0 (0.0%) | 0 (0.0%) |
| Utilities | 14 (100.0%) | 0 (0.0%) |
| Information | 0 (0.0%) | 0 (0.0%) |
| Finance & Insurance | 0 (0.0%) | 8 (100.0%) |
| Real Estate, Rental & Leasing | 0 (0.0%) | 0 (0.0%) |
| Professional & Scientific | 3 (25.0%) | 9 (75.0%) |
| Enterprise Management | 0 (0.0%) | 0 (0.0%) |
| Administrative & Support | 0 (0.0%) | 5 (100.0%) |
| Educational Services | 0 (0.0%) | 23 (100.0%) |
| Health Care & Social Assistance | 13 (81.2%) | 3 (18.8%) |
| Arts, Entertainment & Recreation | 5 (71.4%) | 2 (28.6%) |
| Accommodation & Food Services | 4 (50.0%) | 4 (50.0%) |
| Public Administration | 1 (25.0%) | 3 (75.0%) |
| Total | 88 (50.6%) | 86 (49.4%) |
Education in Mesa
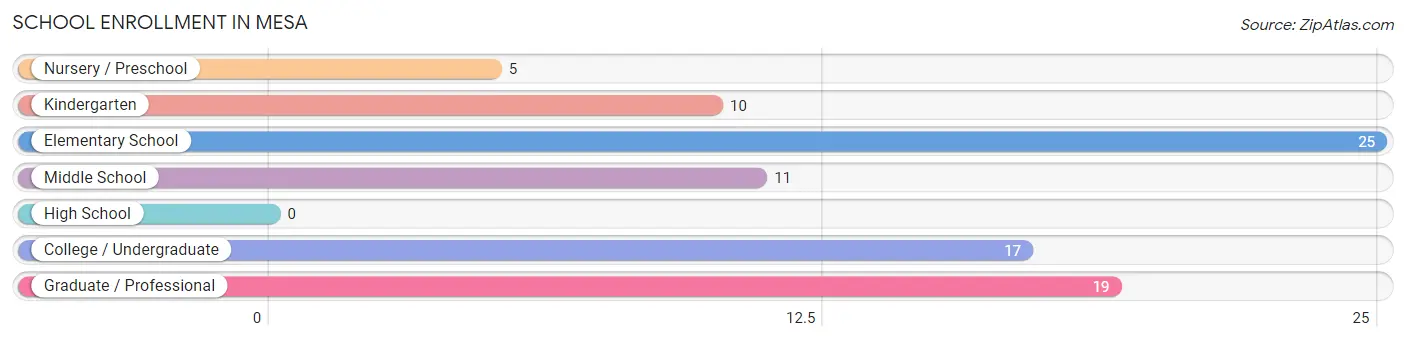
School Enrollment in Mesa
The most common levels of schooling among the 87 students in Mesa are elementary school (25 | 28.7%), graduate / professional (19 | 21.8%), and college / undergraduate (17 | 19.5%).
| School Level | # Students | % Students |
| Nursery / Preschool | 5 | 5.8% |
| Kindergarten | 10 | 11.5% |
| Elementary School | 25 | 28.7% |
| Middle School | 11 | 12.6% |
| High School | 0 | 0.0% |
| College / Undergraduate | 17 | 19.5% |
| Graduate / Professional | 19 | 21.8% |
| Total | 87 | 100.0% |
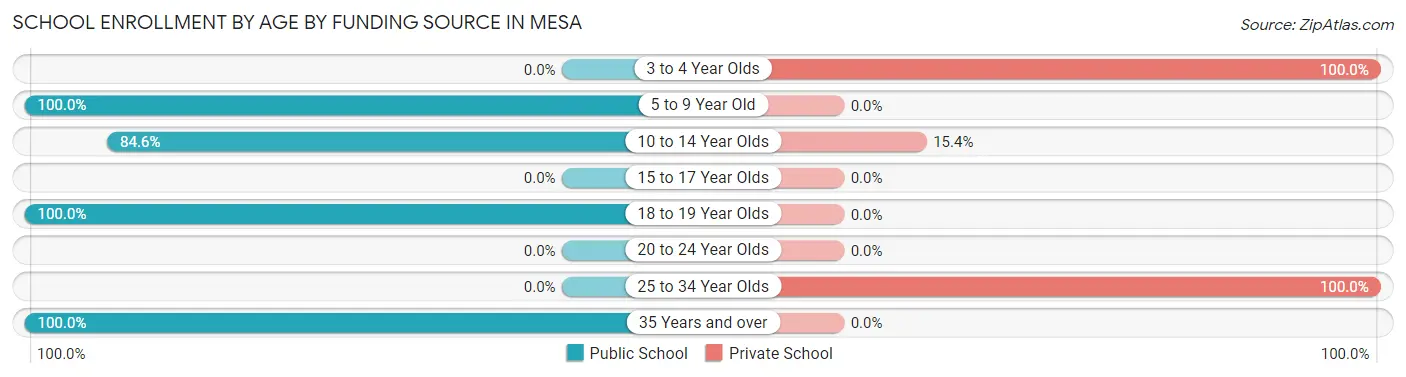
School Enrollment by Age by Funding Source in Mesa
Out of a total of 87 students who are enrolled in schools in Mesa, 26 (29.9%) attend a private institution, while the remaining 61 (70.1%) are enrolled in public schools. The age group of 3 to 4 year olds has the highest likelihood of being enrolled in private schools, with 5 (100.0% in the age bracket) enrolled. Conversely, the age group of 5 to 9 year old has the lowest likelihood of being enrolled in a private school, with 33 (100.0% in the age bracket) attending a public institution.
| Age Bracket | Public School | Private School |
| 3 to 4 Year Olds | 0 (0.0%) | 5 (100.0%) |
| 5 to 9 Year Old | 33 (100.0%) | 0 (0.0%) |
| 10 to 14 Year Olds | 11 (84.6%) | 2 (15.4%) |
| 15 to 17 Year Olds | 0 (0.0%) | 0 (0.0%) |
| 18 to 19 Year Olds | 8 (100.0%) | 0 (0.0%) |
| 20 to 24 Year Olds | 0 (0.0%) | 0 (0.0%) |
| 25 to 34 Year Olds | 0 (0.0%) | 19 (100.0%) |
| 35 Years and over | 9 (100.0%) | 0 (0.0%) |
| Total | 61 (70.1%) | 26 (29.9%) |
Educational Attainment by Field of Study in Mesa
Visual & performing arts (32 | 25.4%), social sciences (23 | 18.2%), science & technology (13 | 10.3%), arts & humanities (10 | 7.9%), and bio, nature & agricultural (9 | 7.1%) are the most common fields of study among 126 individuals in Mesa who have obtained a bachelor's degree or higher.
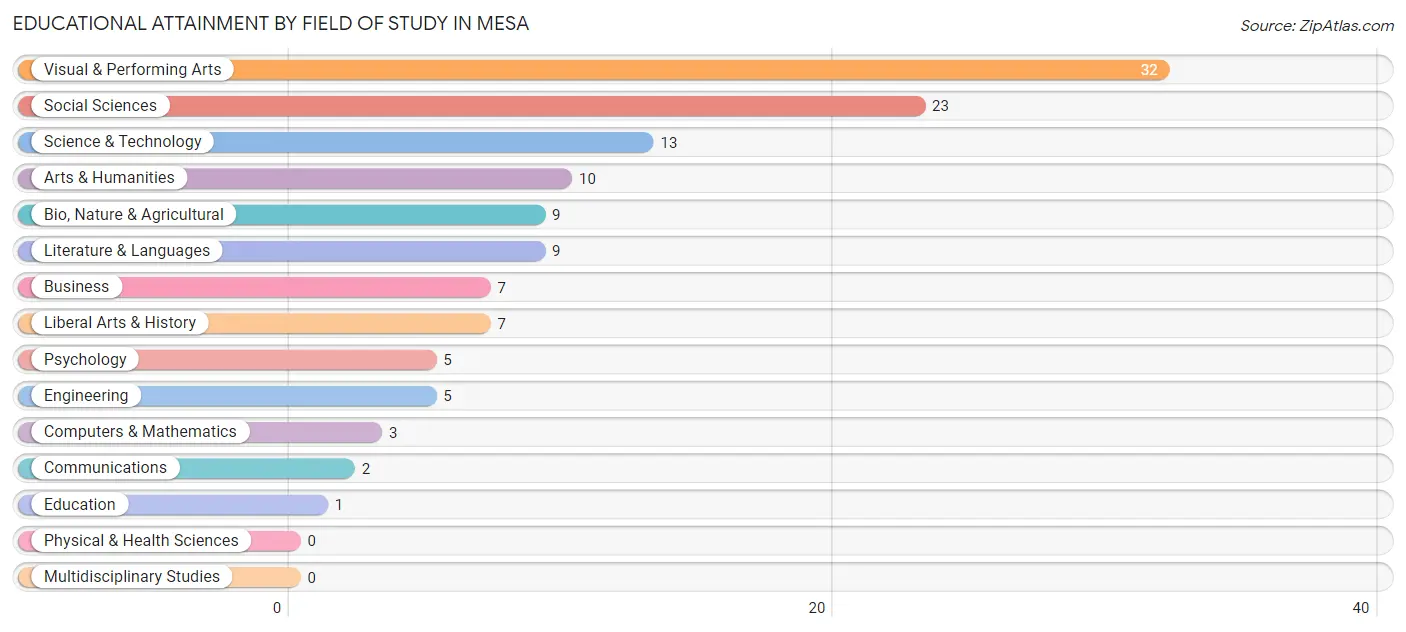
| Field of Study | # Graduates | % Graduates |
| Computers & Mathematics | 3 | 2.4% |
| Bio, Nature & Agricultural | 9 | 7.1% |
| Physical & Health Sciences | 0 | 0.0% |
| Psychology | 5 | 4.0% |
| Social Sciences | 23 | 18.2% |
| Engineering | 5 | 4.0% |
| Multidisciplinary Studies | 0 | 0.0% |
| Science & Technology | 13 | 10.3% |
| Business | 7 | 5.6% |
| Education | 1 | 0.8% |
| Literature & Languages | 9 | 7.1% |
| Liberal Arts & History | 7 | 5.6% |
| Visual & Performing Arts | 32 | 25.4% |
| Communications | 2 | 1.6% |
| Arts & Humanities | 10 | 7.9% |
| Total | 126 | 100.0% |
Transportation & Commute in Mesa
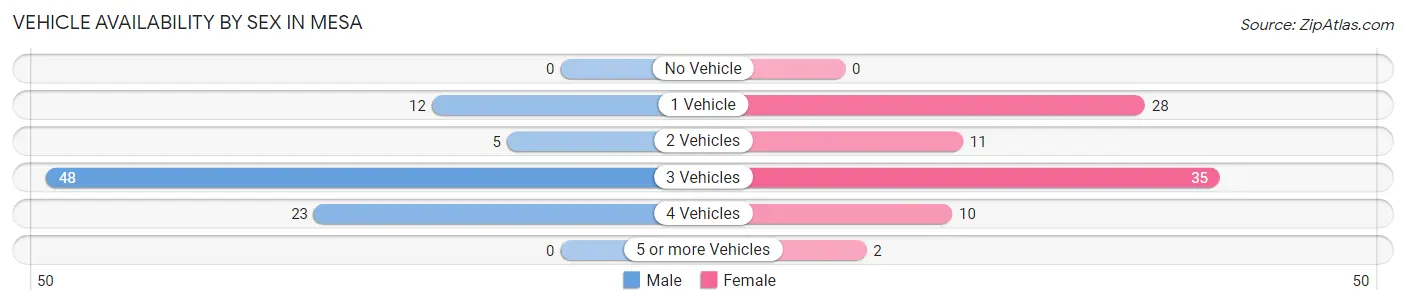
Vehicle Availability by Sex in Mesa
The most prevalent vehicle ownership categories in Mesa are males with 3 vehicles (48, accounting for 54.5%) and females with 3 vehicles (35, making up 55.8%).
| Vehicles Available | Male | Female |
| No Vehicle | 0 (0.0%) | 0 (0.0%) |
| 1 Vehicle | 12 (13.6%) | 28 (32.6%) |
| 2 Vehicles | 5 (5.7%) | 11 (12.8%) |
| 3 Vehicles | 48 (54.5%) | 35 (40.7%) |
| 4 Vehicles | 23 (26.1%) | 10 (11.6%) |
| 5 or more Vehicles | 0 (0.0%) | 2 (2.3%) |
| Total | 88 (100.0%) | 86 (100.0%) |
Commute Time in Mesa
The most frequently occuring commute durations in Mesa are 10 to 14 minutes (33 commuters, 24.4%), 60 to 89 minutes (28 commuters, 20.7%), and 20 to 24 minutes (25 commuters, 18.5%).
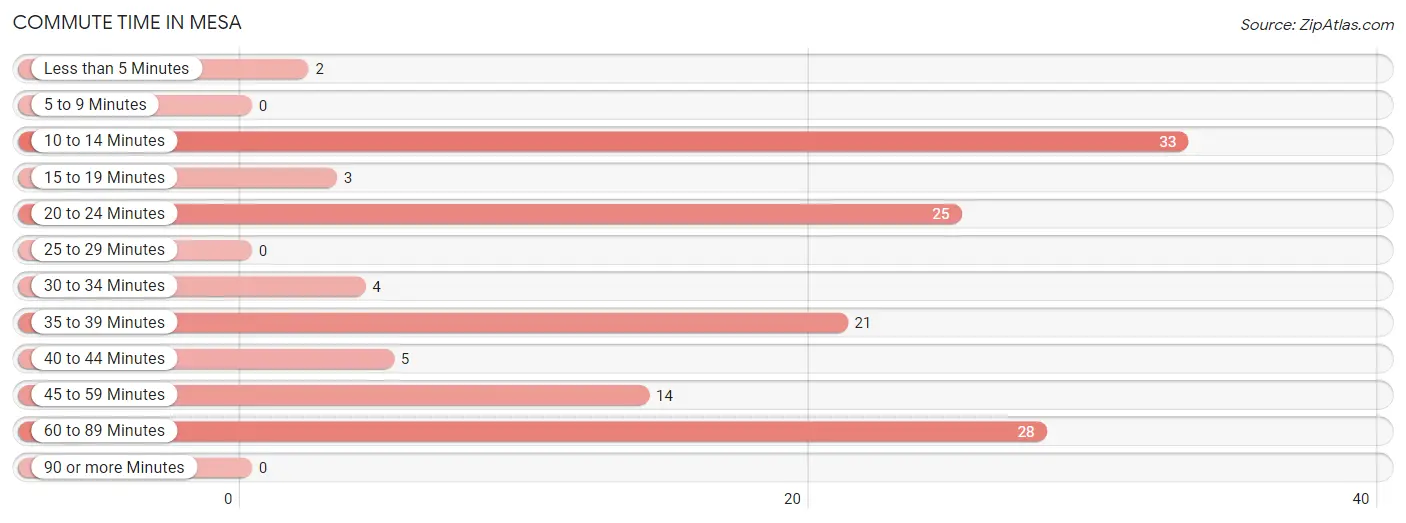
| Commute Time | # Commuters | % Commuters |
| Less than 5 Minutes | 2 | 1.5% |
| 5 to 9 Minutes | 0 | 0.0% |
| 10 to 14 Minutes | 33 | 24.4% |
| 15 to 19 Minutes | 3 | 2.2% |
| 20 to 24 Minutes | 25 | 18.5% |
| 25 to 29 Minutes | 0 | 0.0% |
| 30 to 34 Minutes | 4 | 3.0% |
| 35 to 39 Minutes | 21 | 15.6% |
| 40 to 44 Minutes | 5 | 3.7% |
| 45 to 59 Minutes | 14 | 10.4% |
| 60 to 89 Minutes | 28 | 20.7% |
| 90 or more Minutes | 0 | 0.0% |
Commute Time by Sex in Mesa
The most common commute times in Mesa are 10 to 14 minutes (33 commuters, 44.6%) for males and 20 to 24 minutes (22 commuters, 36.1%) for females.
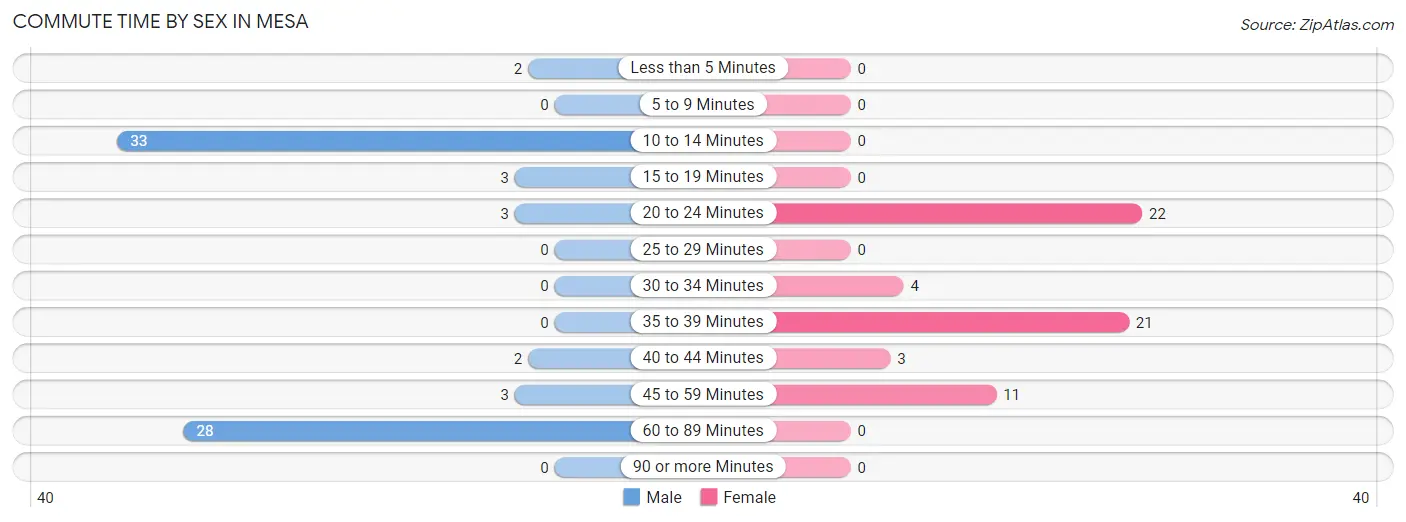
| Commute Time | Male | Female |
| Less than 5 Minutes | 2 (2.7%) | 0 (0.0%) |
| 5 to 9 Minutes | 0 (0.0%) | 0 (0.0%) |
| 10 to 14 Minutes | 33 (44.6%) | 0 (0.0%) |
| 15 to 19 Minutes | 3 (4.1%) | 0 (0.0%) |
| 20 to 24 Minutes | 3 (4.1%) | 22 (36.1%) |
| 25 to 29 Minutes | 0 (0.0%) | 0 (0.0%) |
| 30 to 34 Minutes | 0 (0.0%) | 4 (6.6%) |
| 35 to 39 Minutes | 0 (0.0%) | 21 (34.4%) |
| 40 to 44 Minutes | 2 (2.7%) | 3 (4.9%) |
| 45 to 59 Minutes | 3 (4.1%) | 11 (18.0%) |
| 60 to 89 Minutes | 28 (37.8%) | 0 (0.0%) |
| 90 or more Minutes | 0 (0.0%) | 0 (0.0%) |
Time of Departure to Work by Sex in Mesa
The most frequent times of departure to work in Mesa are 12:00 AM to 4:59 AM (26, 35.1%) for males and 11:00 AM to 11:59 AM (19, 31.1%) for females.
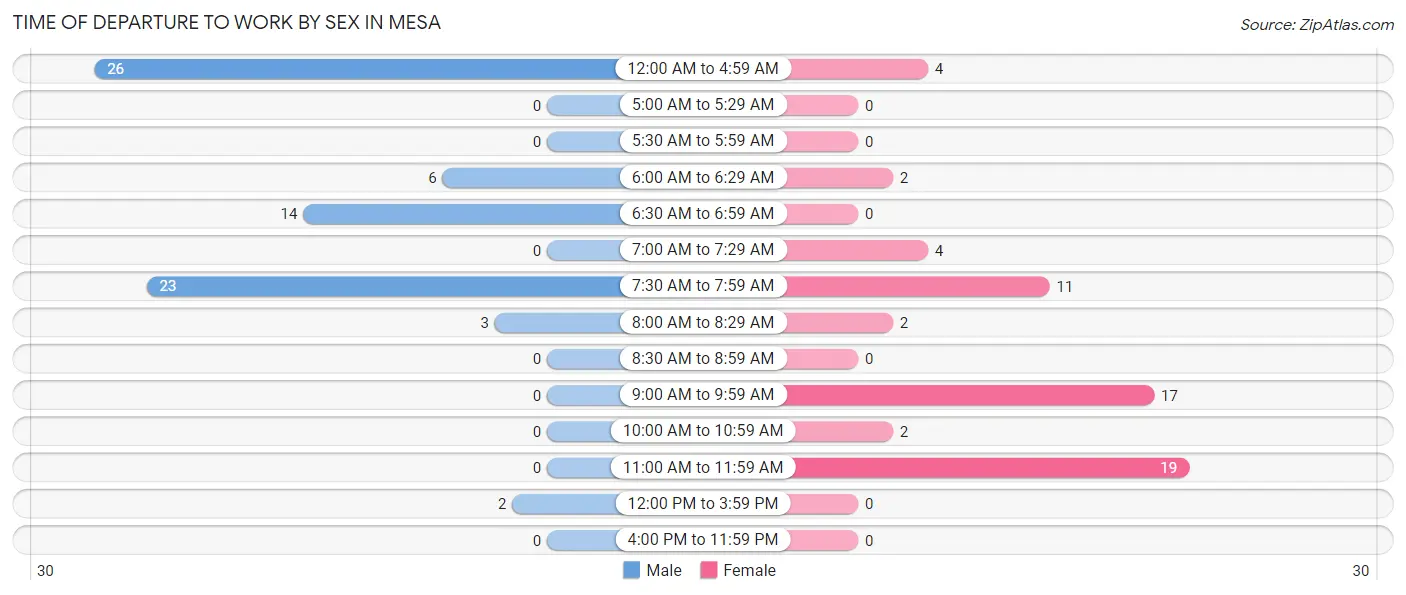
| Time of Departure | Male | Female |
| 12:00 AM to 4:59 AM | 26 (35.1%) | 4 (6.6%) |
| 5:00 AM to 5:29 AM | 0 (0.0%) | 0 (0.0%) |
| 5:30 AM to 5:59 AM | 0 (0.0%) | 0 (0.0%) |
| 6:00 AM to 6:29 AM | 6 (8.1%) | 2 (3.3%) |
| 6:30 AM to 6:59 AM | 14 (18.9%) | 0 (0.0%) |
| 7:00 AM to 7:29 AM | 0 (0.0%) | 4 (6.6%) |
| 7:30 AM to 7:59 AM | 23 (31.1%) | 11 (18.0%) |
| 8:00 AM to 8:29 AM | 3 (4.1%) | 2 (3.3%) |
| 8:30 AM to 8:59 AM | 0 (0.0%) | 0 (0.0%) |
| 9:00 AM to 9:59 AM | 0 (0.0%) | 17 (27.9%) |
| 10:00 AM to 10:59 AM | 0 (0.0%) | 2 (3.3%) |
| 11:00 AM to 11:59 AM | 0 (0.0%) | 19 (31.1%) |
| 12:00 PM to 3:59 PM | 2 (2.7%) | 0 (0.0%) |
| 4:00 PM to 11:59 PM | 0 (0.0%) | 0 (0.0%) |
| Total | 74 (100.0%) | 61 (100.0%) |
Housing Occupancy in Mesa
Occupancy by Ownership in Mesa
Of the total 158 dwellings in Mesa, owner-occupied units account for 146 (92.4%), while renter-occupied units make up 12 (7.6%).
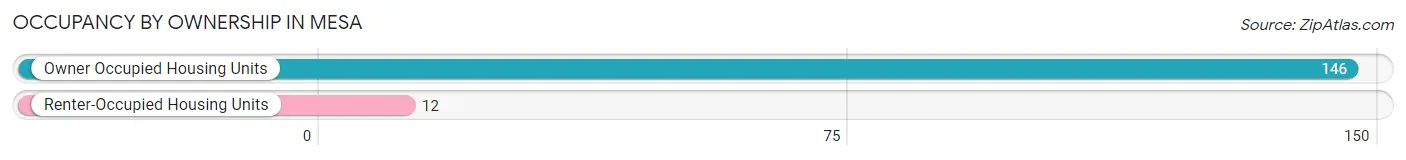
| Occupancy | # Housing Units | % Housing Units |
| Owner Occupied Housing Units | 146 | 92.4% |
| Renter-Occupied Housing Units | 12 | 7.6% |
| Total Occupied Housing Units | 158 | 100.0% |
Occupancy by Household Size in Mesa
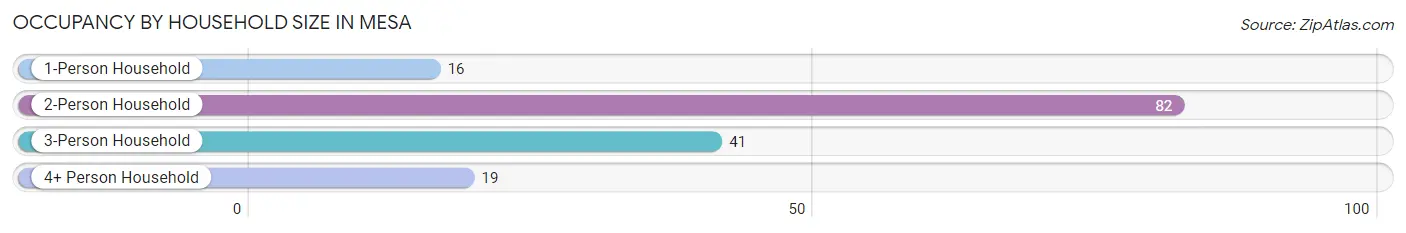
| Household Size | # Housing Units | % Housing Units |
| 1-Person Household | 16 | 10.1% |
| 2-Person Household | 82 | 51.9% |
| 3-Person Household | 41 | 26.0% |
| 4+ Person Household | 19 | 12.0% |
| Total Housing Units | 158 | 100.0% |
Occupancy by Ownership by Household Size in Mesa
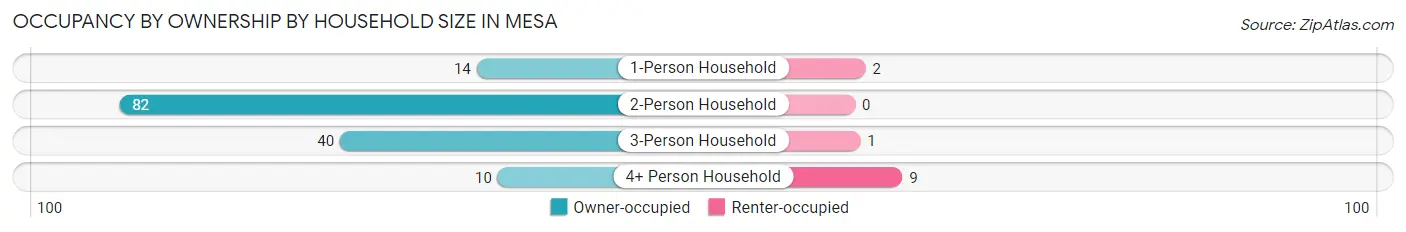
| Household Size | Owner-occupied | Renter-occupied |
| 1-Person Household | 14 (87.5%) | 2 (12.5%) |
| 2-Person Household | 82 (100.0%) | 0 (0.0%) |
| 3-Person Household | 40 (97.6%) | 1 (2.4%) |
| 4+ Person Household | 10 (52.6%) | 9 (47.4%) |
| Total Housing Units | 146 (92.4%) | 12 (7.6%) |
Occupancy by Educational Attainment in Mesa
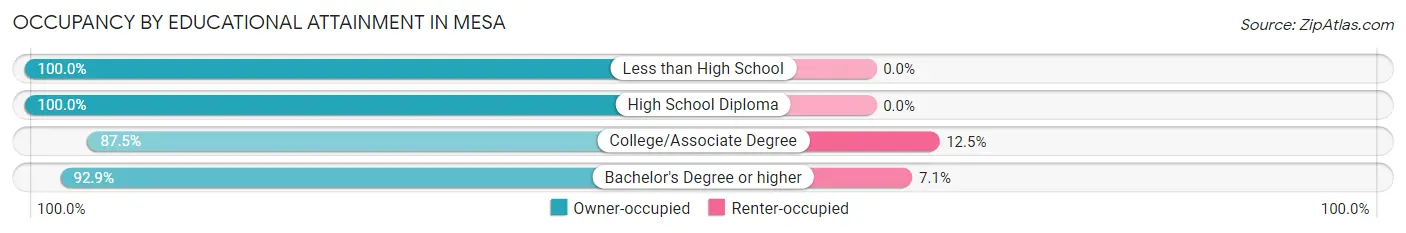
| Household Size | Owner-occupied | Renter-occupied |
| Less than High School | 5 (100.0%) | 0 (0.0%) |
| High School Diploma | 39 (100.0%) | 0 (0.0%) |
| College/Associate Degree | 63 (87.5%) | 9 (12.5%) |
| Bachelor's Degree or higher | 39 (92.9%) | 3 (7.1%) |
Occupancy by Age of Householder in Mesa
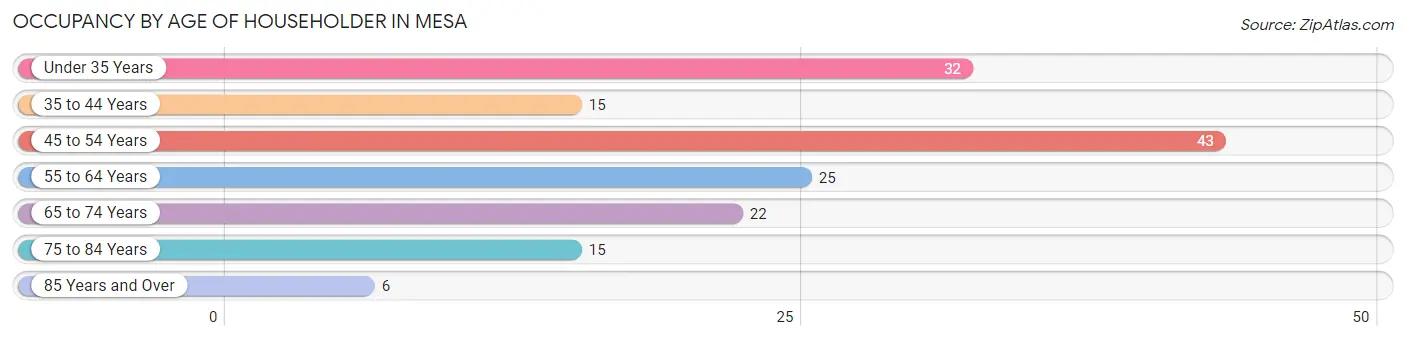
| Age Bracket | # Households | % Households |
| Under 35 Years | 32 | 20.3% |
| 35 to 44 Years | 15 | 9.5% |
| 45 to 54 Years | 43 | 27.2% |
| 55 to 64 Years | 25 | 15.8% |
| 65 to 74 Years | 22 | 13.9% |
| 75 to 84 Years | 15 | 9.5% |
| 85 Years and Over | 6 | 3.8% |
| Total | 158 | 100.0% |
Housing Finances in Mesa
Median Income by Occupancy in Mesa
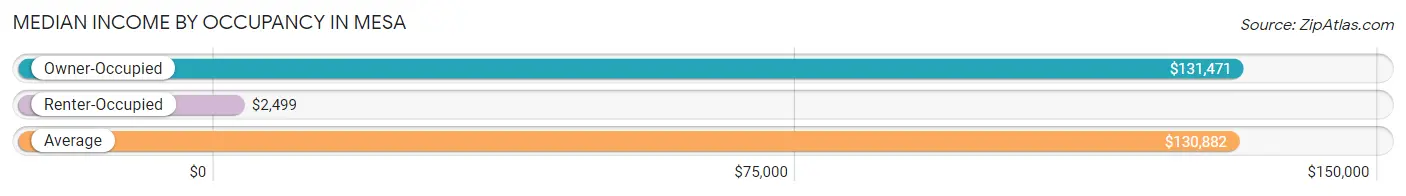
| Occupancy Type | # Households | Median Income |
| Owner-Occupied | 146 (92.4%) | $131,471 |
| Renter-Occupied | 12 (7.6%) | $2,499 |
| Average | 158 (100.0%) | $130,882 |
Occupancy by Householder Income Bracket in Mesa
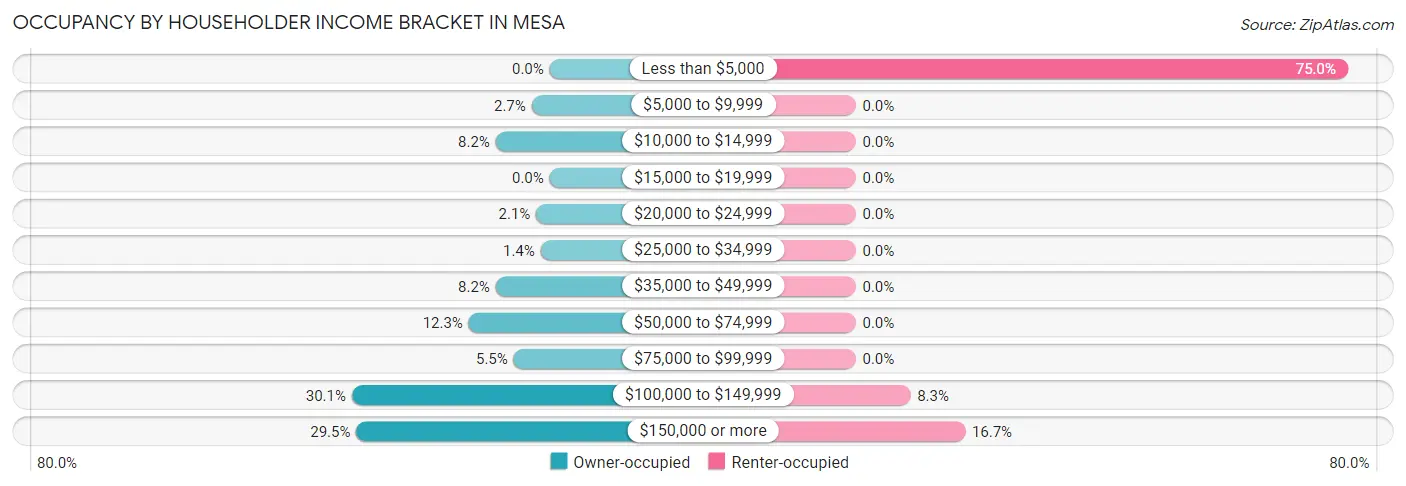
| Income Bracket | Owner-occupied | Renter-occupied |
| Less than $5,000 | 0 (0.0%) | 9 (75.0%) |
| $5,000 to $9,999 | 4 (2.7%) | 0 (0.0%) |
| $10,000 to $14,999 | 12 (8.2%) | 0 (0.0%) |
| $15,000 to $19,999 | 0 (0.0%) | 0 (0.0%) |
| $20,000 to $24,999 | 3 (2.1%) | 0 (0.0%) |
| $25,000 to $34,999 | 2 (1.4%) | 0 (0.0%) |
| $35,000 to $49,999 | 12 (8.2%) | 0 (0.0%) |
| $50,000 to $74,999 | 18 (12.3%) | 0 (0.0%) |
| $75,000 to $99,999 | 8 (5.5%) | 0 (0.0%) |
| $100,000 to $149,999 | 44 (30.1%) | 1 (8.3%) |
| $150,000 or more | 43 (29.4%) | 2 (16.7%) |
| Total | 146 (100.0%) | 12 (100.0%) |
Monthly Housing Cost Tiers in Mesa
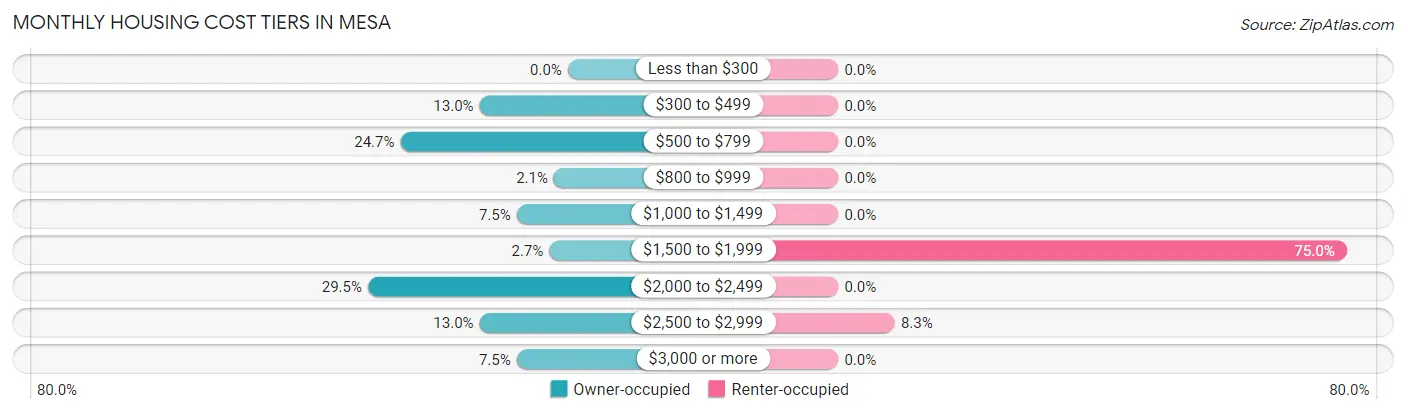
| Monthly Cost | Owner-occupied | Renter-occupied |
| Less than $300 | 0 (0.0%) | 0 (0.0%) |
| $300 to $499 | 19 (13.0%) | 0 (0.0%) |
| $500 to $799 | 36 (24.7%) | 0 (0.0%) |
| $800 to $999 | 3 (2.1%) | 0 (0.0%) |
| $1,000 to $1,499 | 11 (7.5%) | 0 (0.0%) |
| $1,500 to $1,999 | 4 (2.7%) | 9 (75.0%) |
| $2,000 to $2,499 | 43 (29.4%) | 0 (0.0%) |
| $2,500 to $2,999 | 19 (13.0%) | 1 (8.3%) |
| $3,000 or more | 11 (7.5%) | 0 (0.0%) |
| Total | 146 (100.0%) | 12 (100.0%) |
Physical Housing Characteristics in Mesa
Housing Structures in Mesa
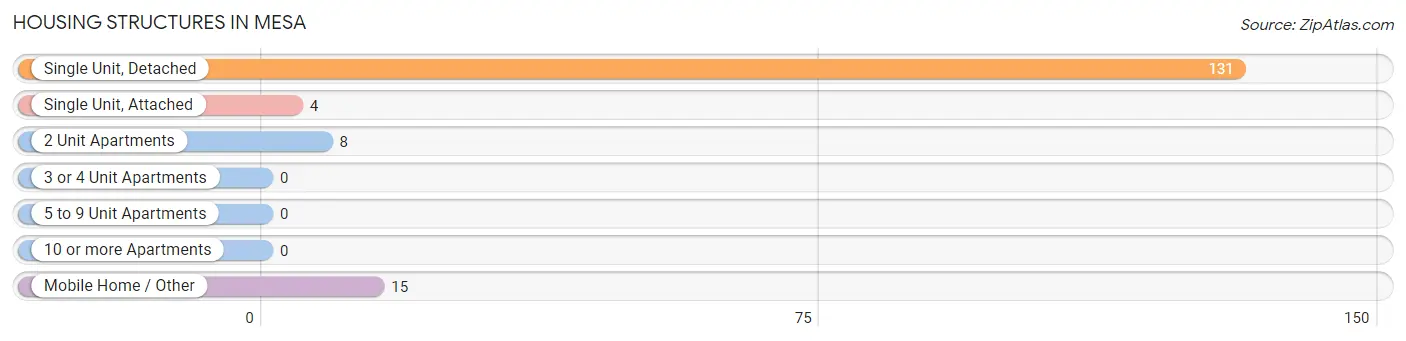
| Structure Type | # Housing Units | % Housing Units |
| Single Unit, Detached | 131 | 82.9% |
| Single Unit, Attached | 4 | 2.5% |
| 2 Unit Apartments | 8 | 5.1% |
| 3 or 4 Unit Apartments | 0 | 0.0% |
| 5 to 9 Unit Apartments | 0 | 0.0% |
| 10 or more Apartments | 0 | 0.0% |
| Mobile Home / Other | 15 | 9.5% |
| Total | 158 | 100.0% |
Housing Structures by Occupancy in Mesa
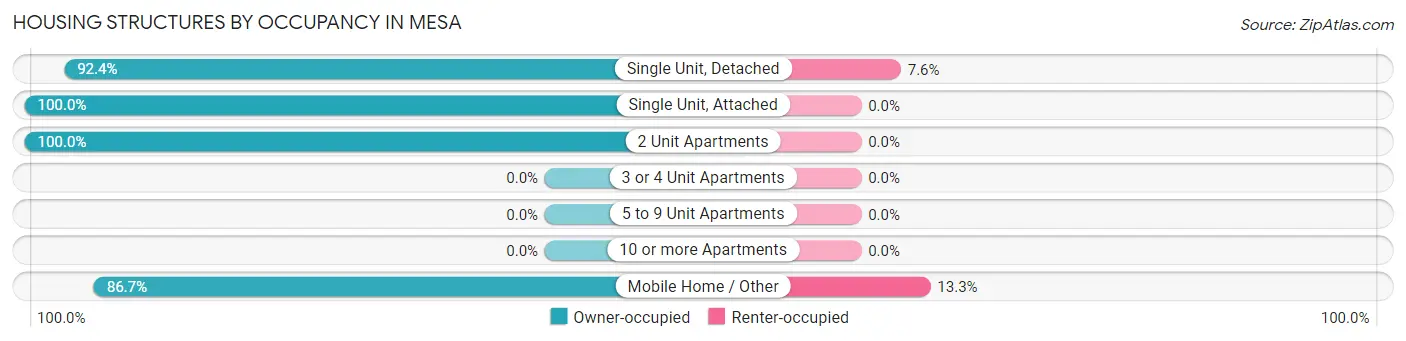
| Structure Type | Owner-occupied | Renter-occupied |
| Single Unit, Detached | 121 (92.4%) | 10 (7.6%) |
| Single Unit, Attached | 4 (100.0%) | 0 (0.0%) |
| 2 Unit Apartments | 8 (100.0%) | 0 (0.0%) |
| 3 or 4 Unit Apartments | 0 (0.0%) | 0 (0.0%) |
| 5 to 9 Unit Apartments | 0 (0.0%) | 0 (0.0%) |
| 10 or more Apartments | 0 (0.0%) | 0 (0.0%) |
| Mobile Home / Other | 13 (86.7%) | 2 (13.3%) |
| Total | 146 (92.4%) | 12 (7.6%) |
Housing Structures by Number of Rooms in Mesa
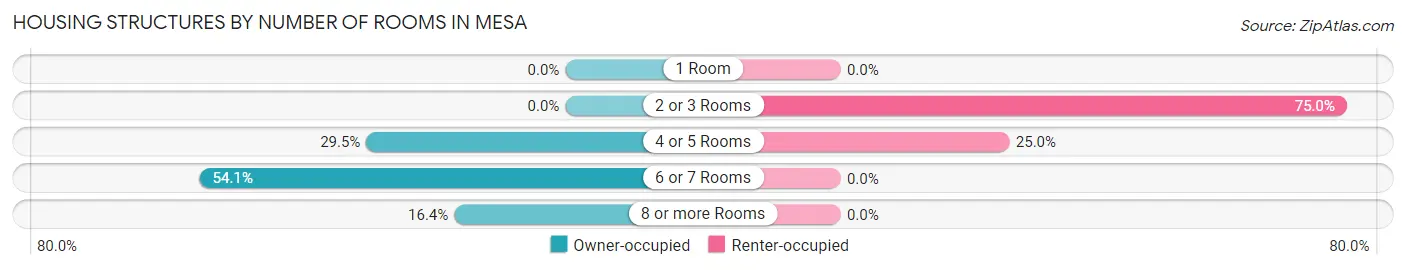
| Number of Rooms | Owner-occupied | Renter-occupied |
| 1 Room | 0 (0.0%) | 0 (0.0%) |
| 2 or 3 Rooms | 0 (0.0%) | 9 (75.0%) |
| 4 or 5 Rooms | 43 (29.4%) | 3 (25.0%) |
| 6 or 7 Rooms | 79 (54.1%) | 0 (0.0%) |
| 8 or more Rooms | 24 (16.4%) | 0 (0.0%) |
| Total | 146 (100.0%) | 12 (100.0%) |
Housing Structure by Heating Type in Mesa
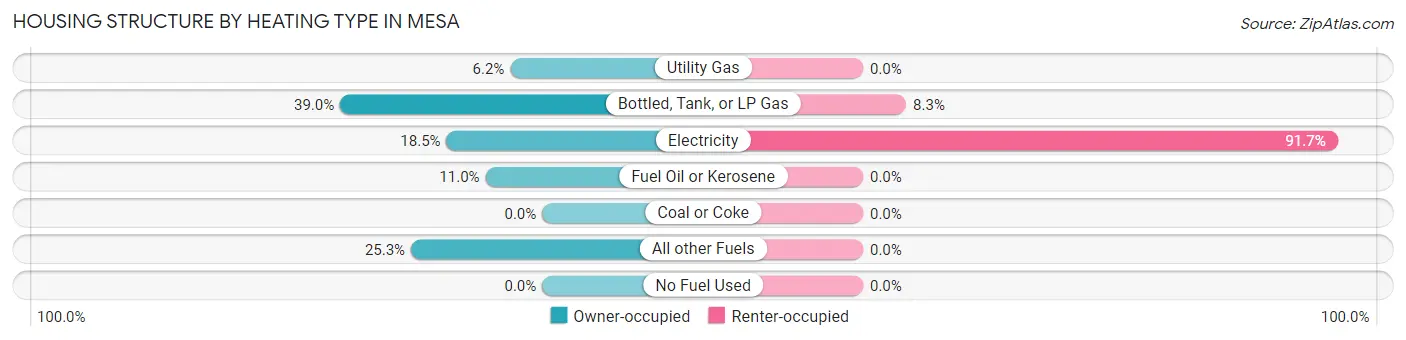
| Heating Type | Owner-occupied | Renter-occupied |
| Utility Gas | 9 (6.2%) | 0 (0.0%) |
| Bottled, Tank, or LP Gas | 57 (39.0%) | 1 (8.3%) |
| Electricity | 27 (18.5%) | 11 (91.7%) |
| Fuel Oil or Kerosene | 16 (11.0%) | 0 (0.0%) |
| Coal or Coke | 0 (0.0%) | 0 (0.0%) |
| All other Fuels | 37 (25.3%) | 0 (0.0%) |
| No Fuel Used | 0 (0.0%) | 0 (0.0%) |
| Total | 146 (100.0%) | 12 (100.0%) |
Household Vehicle Usage in Mesa
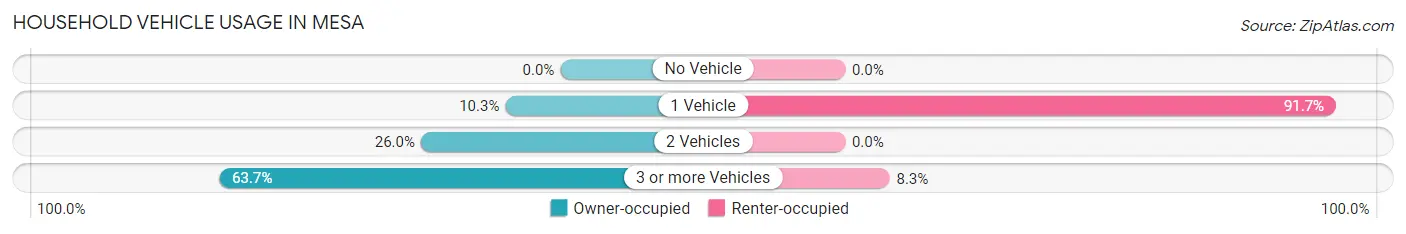
| Vehicles per Household | Owner-occupied | Renter-occupied |
| No Vehicle | 0 (0.0%) | 0 (0.0%) |
| 1 Vehicle | 15 (10.3%) | 11 (91.7%) |
| 2 Vehicles | 38 (26.0%) | 0 (0.0%) |
| 3 or more Vehicles | 93 (63.7%) | 1 (8.3%) |
| Total | 146 (100.0%) | 12 (100.0%) |
Real Estate & Mortgages in Mesa
Real Estate and Mortgage Overview in Mesa
| Characteristic | Without Mortgage | With Mortgage |
| Housing Units | 64 | 82 |
| Median Property Value | $507,600 | $461,100 |
| Median Household Income | - | - |
| Monthly Housing Costs | $562 | $11 |
| Real Estate Taxes | $2,808 | $0 |
Property Value by Mortgage Status in Mesa
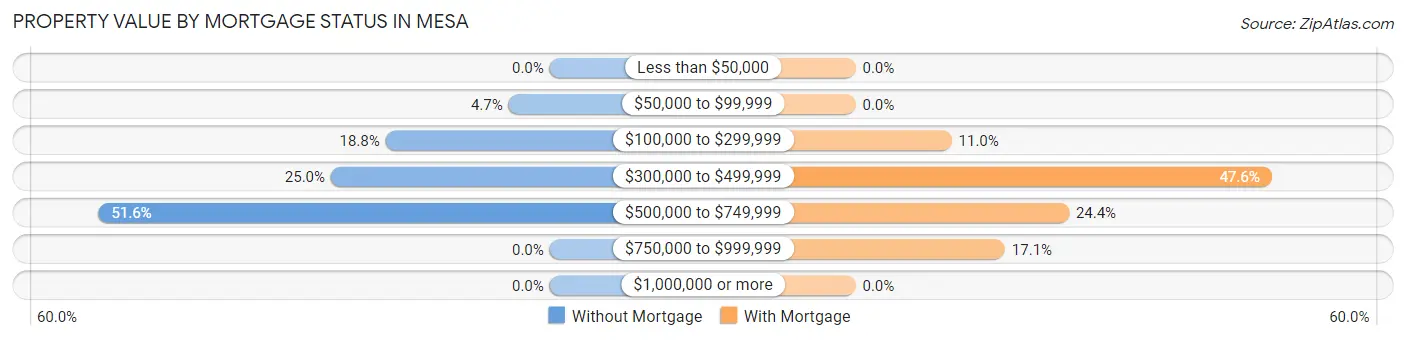
| Property Value | Without Mortgage | With Mortgage |
| Less than $50,000 | 0 (0.0%) | 0 (0.0%) |
| $50,000 to $99,999 | 3 (4.7%) | 0 (0.0%) |
| $100,000 to $299,999 | 12 (18.8%) | 9 (11.0%) |
| $300,000 to $499,999 | 16 (25.0%) | 39 (47.6%) |
| $500,000 to $749,999 | 33 (51.6%) | 20 (24.4%) |
| $750,000 to $999,999 | 0 (0.0%) | 14 (17.1%) |
| $1,000,000 or more | 0 (0.0%) | 0 (0.0%) |
| Total | 64 (100.0%) | 82 (100.0%) |
Household Income by Mortgage Status in Mesa
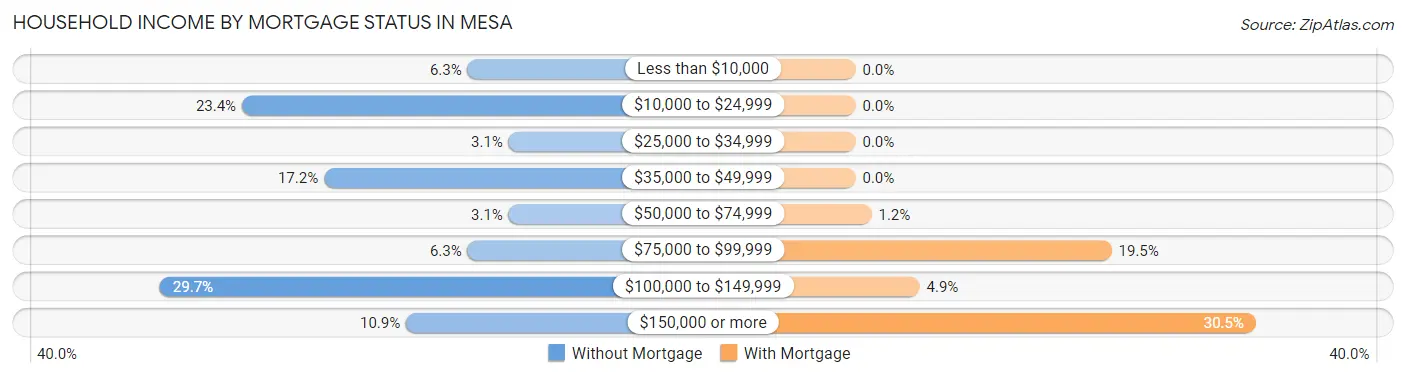
| Household Income | Without Mortgage | With Mortgage |
| Less than $10,000 | 4 (6.2%) | 0 (0.0%) |
| $10,000 to $24,999 | 15 (23.4%) | 0 (0.0%) |
| $25,000 to $34,999 | 2 (3.1%) | 0 (0.0%) |
| $35,000 to $49,999 | 11 (17.2%) | 0 (0.0%) |
| $50,000 to $74,999 | 2 (3.1%) | 1 (1.2%) |
| $75,000 to $99,999 | 4 (6.2%) | 16 (19.5%) |
| $100,000 to $149,999 | 19 (29.7%) | 4 (4.9%) |
| $150,000 or more | 7 (10.9%) | 25 (30.5%) |
| Total | 64 (100.0%) | 82 (100.0%) |
Property Value to Household Income Ratio in Mesa
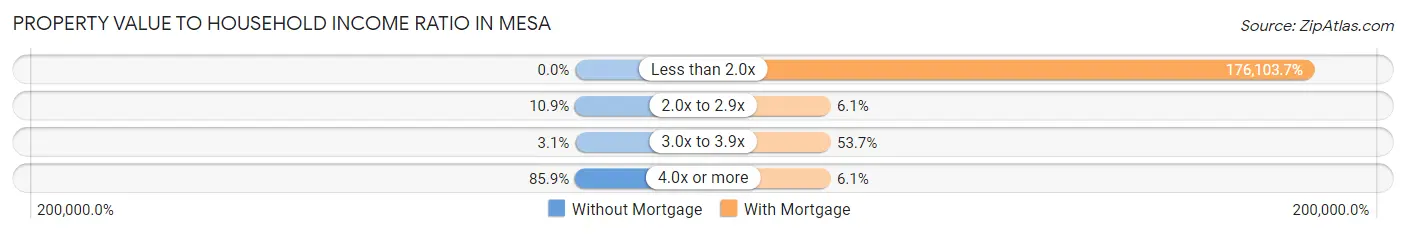
| Value-to-Income Ratio | Without Mortgage | With Mortgage |
| Less than 2.0x | 0 (0.0%) | 144,405 (176,103.7%) |
| 2.0x to 2.9x | 7 (10.9%) | 5 (6.1%) |
| 3.0x to 3.9x | 2 (3.1%) | 44 (53.7%) |
| 4.0x or more | 55 (85.9%) | 5 (6.1%) |
| Total | 64 (100.0%) | 82 (100.0%) |
Real Estate Taxes by Mortgage Status in Mesa
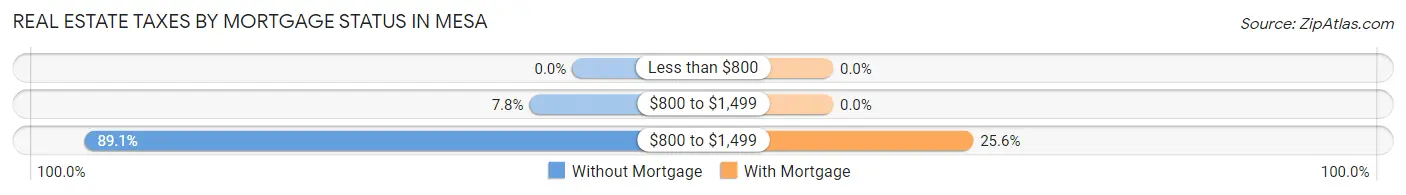
| Property Taxes | Without Mortgage | With Mortgage |
| Less than $800 | 0 (0.0%) | 0 (0.0%) |
| $800 to $1,499 | 5 (7.8%) | 0 (0.0%) |
| $800 to $1,499 | 57 (89.1%) | 21 (25.6%) |
| Total | 64 (100.0%) | 82 (100.0%) |
Health & Disability in Mesa
Health Insurance Coverage by Age in Mesa
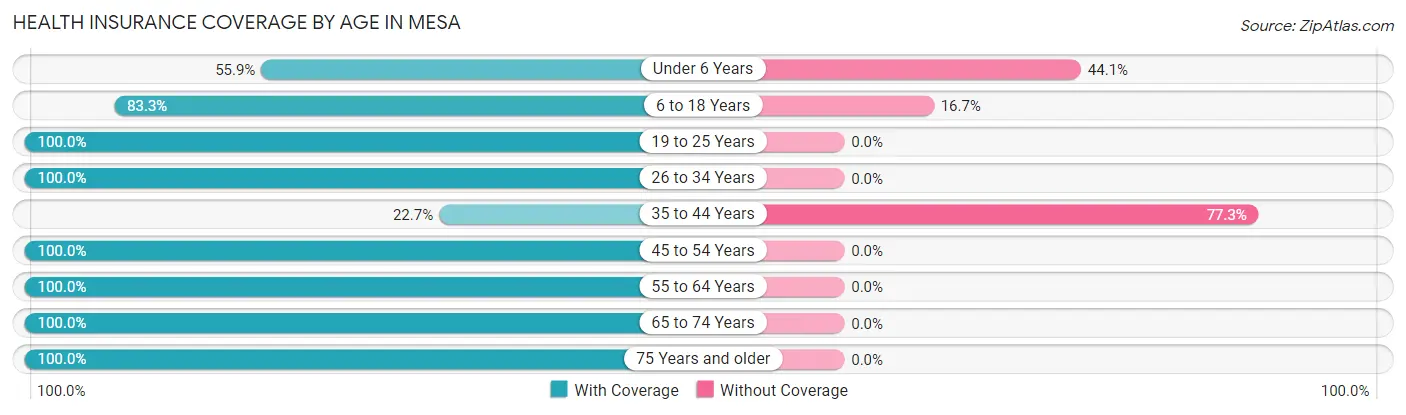
| Age Bracket | With Coverage | Without Coverage |
| Under 6 Years | 19 (55.9%) | 15 (44.1%) |
| 6 to 18 Years | 30 (83.3%) | 6 (16.7%) |
| 19 to 25 Years | 27 (100.0%) | 0 (0.0%) |
| 26 to 34 Years | 46 (100.0%) | 0 (0.0%) |
| 35 to 44 Years | 5 (22.7%) | 17 (77.3%) |
| 45 to 54 Years | 72 (100.0%) | 0 (0.0%) |
| 55 to 64 Years | 58 (100.0%) | 0 (0.0%) |
| 65 to 74 Years | 35 (100.0%) | 0 (0.0%) |
| 75 Years and older | 44 (100.0%) | 0 (0.0%) |
| Total | 336 (89.8%) | 38 (10.2%) |
Health Insurance Coverage by Citizenship Status in Mesa
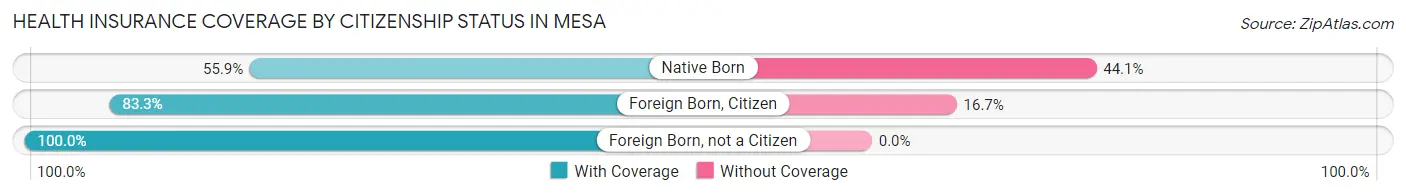
| Citizenship Status | With Coverage | Without Coverage |
| Native Born | 19 (55.9%) | 15 (44.1%) |
| Foreign Born, Citizen | 30 (83.3%) | 6 (16.7%) |
| Foreign Born, not a Citizen | 27 (100.0%) | 0 (0.0%) |
Health Insurance Coverage by Household Income in Mesa
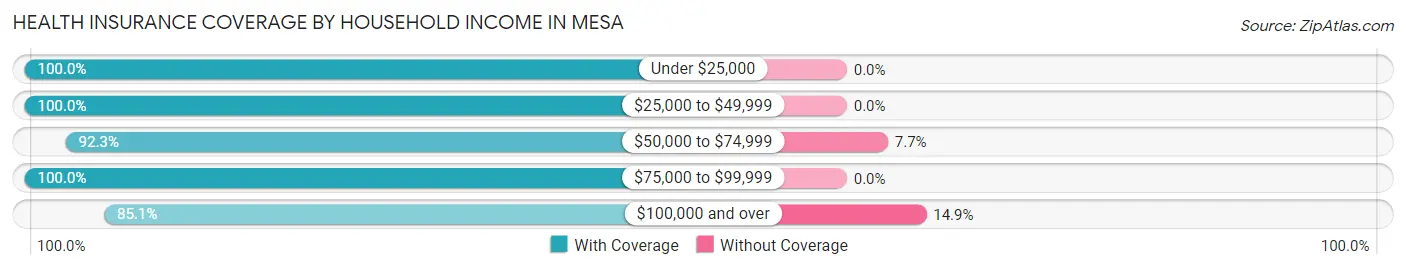
| Household Income | With Coverage | Without Coverage |
| Under $25,000 | 54 (100.0%) | 0 (0.0%) |
| $25,000 to $49,999 | 29 (100.0%) | 0 (0.0%) |
| $50,000 to $74,999 | 36 (92.3%) | 3 (7.7%) |
| $75,000 to $99,999 | 17 (100.0%) | 0 (0.0%) |
| $100,000 and over | 200 (85.1%) | 35 (14.9%) |
Public vs Private Health Insurance Coverage by Age in Mesa
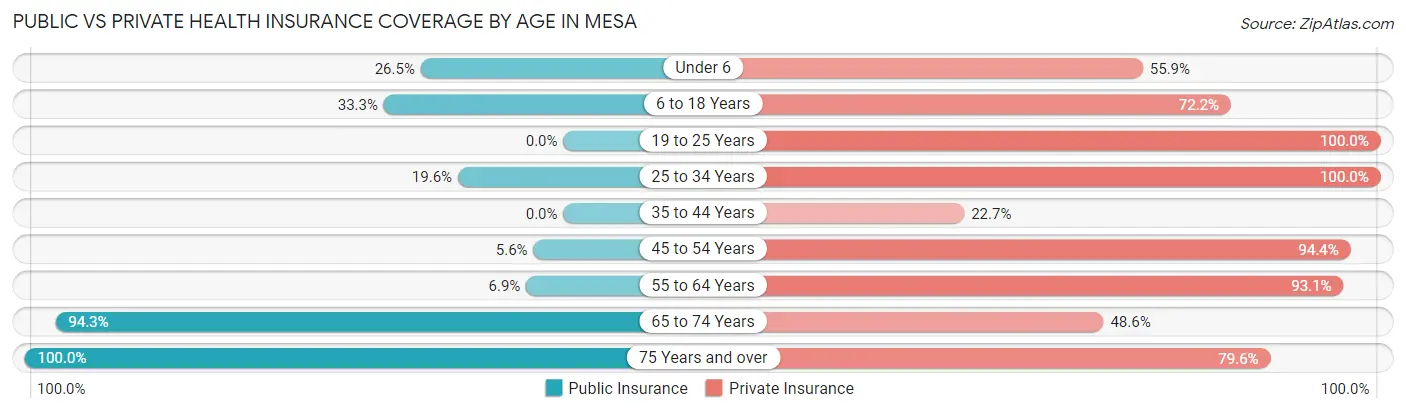
| Age Bracket | Public Insurance | Private Insurance |
| Under 6 | 9 (26.5%) | 19 (55.9%) |
| 6 to 18 Years | 12 (33.3%) | 26 (72.2%) |
| 19 to 25 Years | 0 (0.0%) | 27 (100.0%) |
| 25 to 34 Years | 9 (19.6%) | 46 (100.0%) |
| 35 to 44 Years | 0 (0.0%) | 5 (22.7%) |
| 45 to 54 Years | 4 (5.6%) | 68 (94.4%) |
| 55 to 64 Years | 4 (6.9%) | 54 (93.1%) |
| 65 to 74 Years | 33 (94.3%) | 17 (48.6%) |
| 75 Years and over | 44 (100.0%) | 35 (79.5%) |
| Total | 115 (30.7%) | 297 (79.4%) |
Disability Status by Sex by Age in Mesa
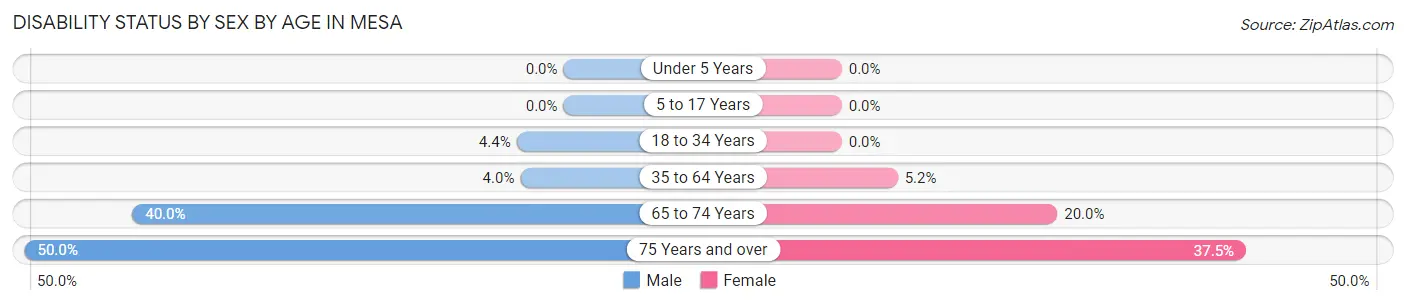
| Age Bracket | Male | Female |
| Under 5 Years | 0 (0.0%) | 0 (0.0%) |
| 5 to 17 Years | 0 (0.0%) | 0 (0.0%) |
| 18 to 34 Years | 1 (4.3%) | 0 (0.0%) |
| 35 to 64 Years | 3 (4.0%) | 4 (5.2%) |
| 65 to 74 Years | 4 (40.0%) | 5 (20.0%) |
| 75 Years and over | 14 (50.0%) | 6 (37.5%) |
Disability Class by Sex by Age in Mesa
Disability Class: Hearing Difficulty
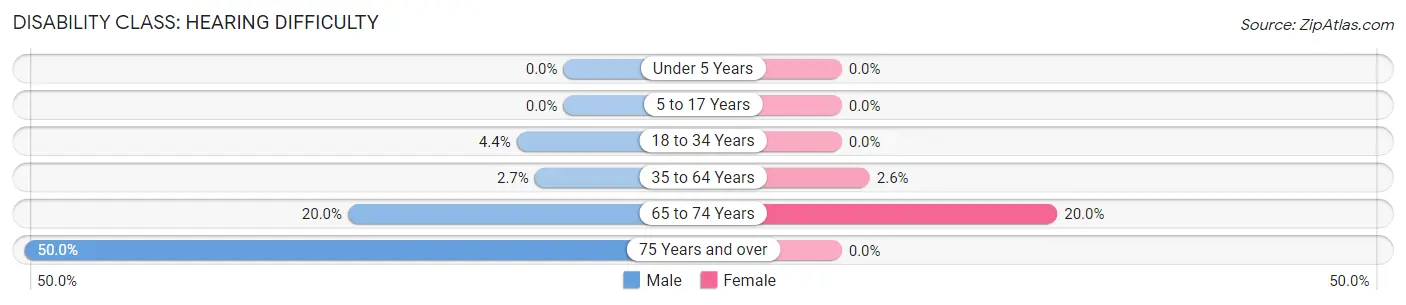
| Age Bracket | Male | Female |
| Under 5 Years | 0 (0.0%) | 0 (0.0%) |
| 5 to 17 Years | 0 (0.0%) | 0 (0.0%) |
| 18 to 34 Years | 1 (4.3%) | 0 (0.0%) |
| 35 to 64 Years | 2 (2.7%) | 2 (2.6%) |
| 65 to 74 Years | 2 (20.0%) | 5 (20.0%) |
| 75 Years and over | 14 (50.0%) | 0 (0.0%) |
Disability Class: Vision Difficulty
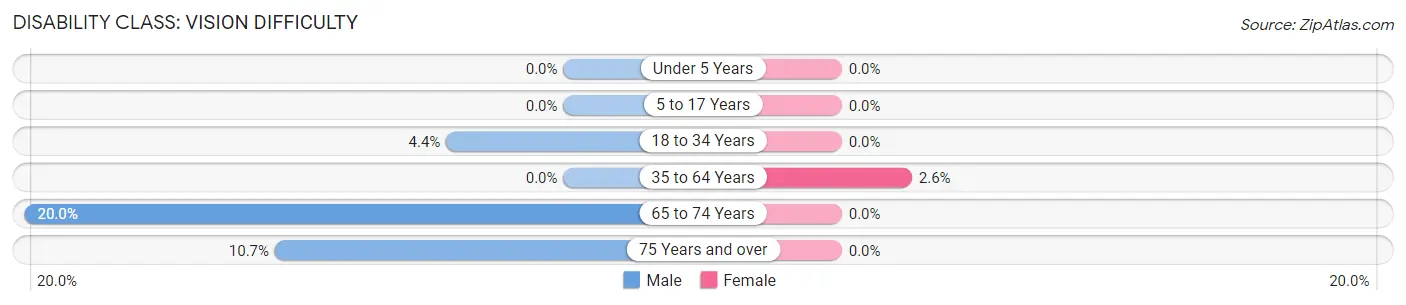
| Age Bracket | Male | Female |
| Under 5 Years | 0 (0.0%) | 0 (0.0%) |
| 5 to 17 Years | 0 (0.0%) | 0 (0.0%) |
| 18 to 34 Years | 1 (4.3%) | 0 (0.0%) |
| 35 to 64 Years | 0 (0.0%) | 2 (2.6%) |
| 65 to 74 Years | 2 (20.0%) | 0 (0.0%) |
| 75 Years and over | 3 (10.7%) | 0 (0.0%) |
Disability Class: Cognitive Difficulty
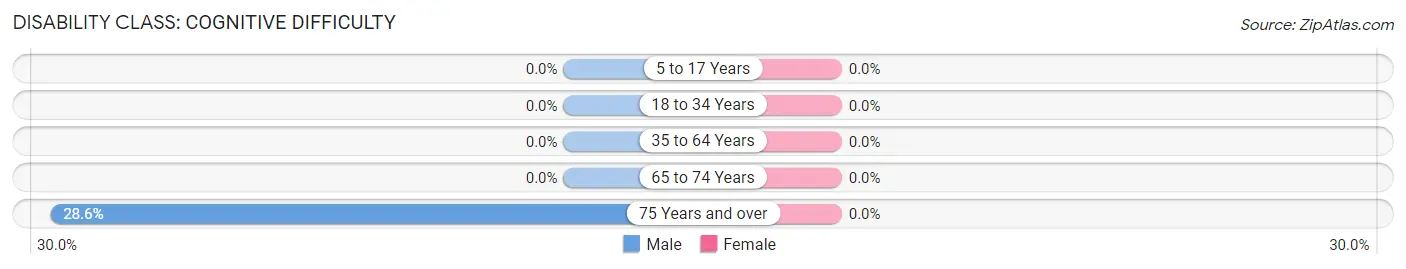
| Age Bracket | Male | Female |
| 5 to 17 Years | 0 (0.0%) | 0 (0.0%) |
| 18 to 34 Years | 0 (0.0%) | 0 (0.0%) |
| 35 to 64 Years | 0 (0.0%) | 0 (0.0%) |
| 65 to 74 Years | 0 (0.0%) | 0 (0.0%) |
| 75 Years and over | 8 (28.6%) | 0 (0.0%) |
Disability Class: Ambulatory Difficulty
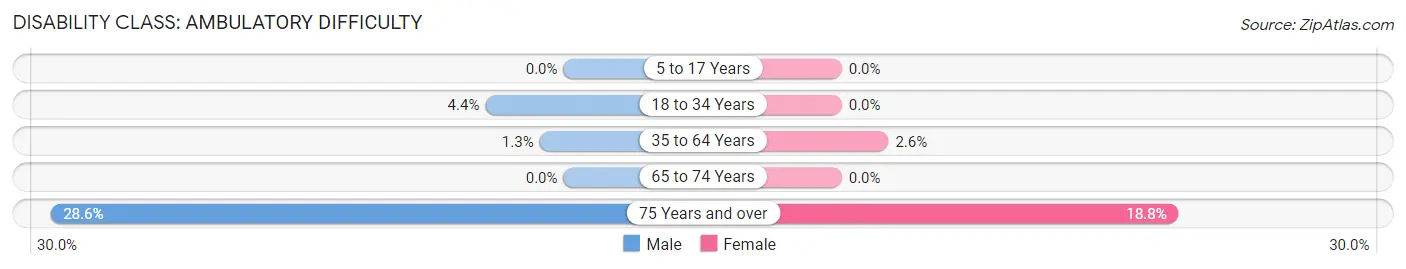
| Age Bracket | Male | Female |
| 5 to 17 Years | 0 (0.0%) | 0 (0.0%) |
| 18 to 34 Years | 1 (4.3%) | 0 (0.0%) |
| 35 to 64 Years | 1 (1.3%) | 2 (2.6%) |
| 65 to 74 Years | 0 (0.0%) | 0 (0.0%) |
| 75 Years and over | 8 (28.6%) | 3 (18.8%) |
Disability Class: Self-Care Difficulty
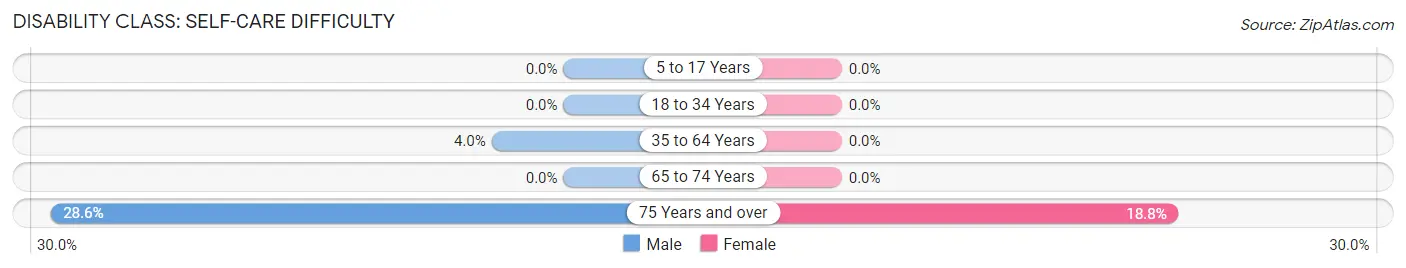
| Age Bracket | Male | Female |
| 5 to 17 Years | 0 (0.0%) | 0 (0.0%) |
| 18 to 34 Years | 0 (0.0%) | 0 (0.0%) |
| 35 to 64 Years | 3 (4.0%) | 0 (0.0%) |
| 65 to 74 Years | 0 (0.0%) | 0 (0.0%) |
| 75 Years and over | 8 (28.6%) | 3 (18.8%) |
Technology Access in Mesa
Computing Device Access in Mesa
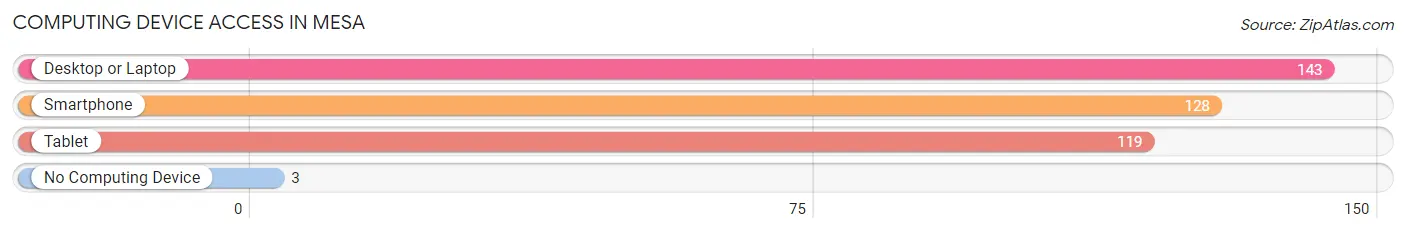
| Device Type | # Households | % Households |
| Desktop or Laptop | 143 | 90.5% |
| Smartphone | 128 | 81.0% |
| Tablet | 119 | 75.3% |
| No Computing Device | 3 | 1.9% |
| Total | 158 | 100.0% |
Internet Access in Mesa
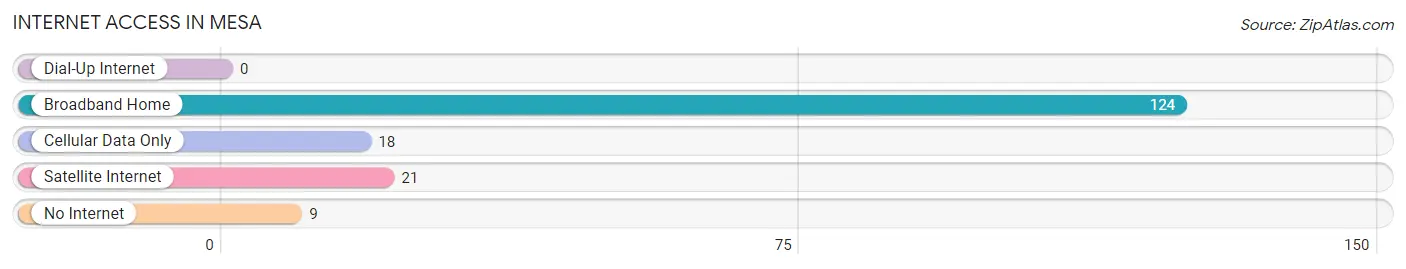
| Internet Type | # Households | % Households |
| Dial-Up Internet | 0 | 0.0% |
| Broadband Home | 124 | 78.5% |
| Cellular Data Only | 18 | 11.4% |
| Satellite Internet | 21 | 13.3% |
| No Internet | 9 | 5.7% |
| Total | 158 | 100.0% |
Mesa Summary
Mesa, California is a small city located in the San Joaquin Valley of California, about 30 miles east of Fresno. It is part of Fresno County and has a population of approximately 8,000 people. The city is known for its agricultural production, which includes grapes, almonds, and other crops.
Geography
Mesa is located in the San Joaquin Valley of California, about 30 miles east of Fresno. The city is situated in the foothills of the Sierra Nevada Mountains, and is surrounded by rolling hills and farmland. The city is located at an elevation of about 1,000 feet above sea level. The climate in Mesa is semi-arid, with hot summers and mild winters.
Economy
Mesa’s economy is largely based on agriculture. The city is known for its production of grapes, almonds, and other crops. The city also has a number of small businesses, including restaurants, retail stores, and service providers.
Demographics
As of the 2010 census, the population of Mesa was 8,000. The racial makeup of the city was 75.3% White, 0.7% African American, 0.7% Native American, 0.7% Asian, 0.3% Pacific Islander, and 21.7% from other races. The median household income in Mesa was $37,000, and the median family income was $41,000.
History
Mesa was founded in 1876 by a group of settlers from the Midwest. The city was originally called “Mesa City”, but the name was changed to “Mesa” in 1883. The city was incorporated in 1891.
In the early 1900s, Mesa was a thriving agricultural center, producing grapes, almonds, and other crops. The city was also home to a number of small businesses, including restaurants, retail stores, and service providers.
In the 1950s, Mesa began to experience a population boom, as people moved to the city from other parts of California and the Midwest. This population growth continued into the 1960s and 1970s, and the city’s population reached 8,000 by the 1980s.
Today, Mesa is a small city with a population of 8,000. The city is known for its agricultural production, and is home to a number of small businesses. The city is also home to a number of parks and recreational areas, making it a popular destination for visitors and residents alike.
Common Questions
What is the Total Population of Mesa?
Total Population of Mesa is 374.
What is the Total Male Population of Mesa?
Total Male Population of Mesa is 170.
What is the Total Female Population of Mesa?
Total Female Population of Mesa is 204.
What is the Ratio of Males per 100 Females in Mesa?
There are 83.33 Males per 100 Females in Mesa.
What is the Ratio of Females per 100 Males in Mesa?
There are 120.00 Females per 100 Males in Mesa.
What is the Median Population Age in Mesa?
Median Population Age in Mesa is 48.0 Years.
What is the Average Family Size in Mesa
Average Family Size in Mesa is 2.5 People.
What is the Average Household Size in Mesa
Average Household Size in Mesa is 2.4 People.
What is Per Capita Income in Mesa?
Per Capita income in Mesa is $50,421.
What is the Median Family Income in Mesa?
Median Family Income in Mesa is $131,912.
What is the Median Household income in Mesa?
Median Household Income in Mesa is $130,882.
What is Income or Wage Gap in Mesa?
Income or Wage Gap in Mesa is 83.2%.
Women in Mesa earn 16.8 cents for every dollar earned by a man.
What is Inequality or Gini Index in Mesa?
Inequality or Gini Index in Mesa is 0.40.
How Large is the Labor Force in Mesa?
There are 174 People in the Labor Forcein in Mesa.
What is the Percentage of People in the Labor Force in Mesa?
57.2% of People are in the Labor Force in Mesa.