Lake Los Angeles, CA
Lake Los Angeles Map
Lake Los Angeles Overview
13,097
TOTAL POPULATION
6,461
MALE POPULATION
6,636
FEMALE POPULATION
97.36
MALES / 100 FEMALES
102.71
FEMALES / 100 MALES
32.8
MEDIAN AGE
4.1
AVG FAMILY SIZE
3.7
AVG HOUSEHOLD SIZE
$19,724
PER CAPITA INCOME
$59,886
AVG FAMILY INCOME
$58,512
AVG HOUSEHOLD INCOME
29.6%
WAGE / INCOME GAP [ % ]
70.4¢/ $1
WAGE / INCOME GAP [ $ ]
$15,336
FAMILY INCOME DEFICIT
0.40
INEQUALITY / GINI INDEX
4,275
LABOR FORCE [ PEOPLE ]
45.9%
PERCENT IN LABOR FORCE
8.0%
UNEMPLOYMENT RATE
Lake Los Angeles Area Codes
Race in Lake Los Angeles
The most populous races in Lake Los Angeles are Hispanic or Latino (8,643 | 66.0%), White / Caucasian (6,979 | 53.3%), and Two or more Races (3,422 | 26.1%).
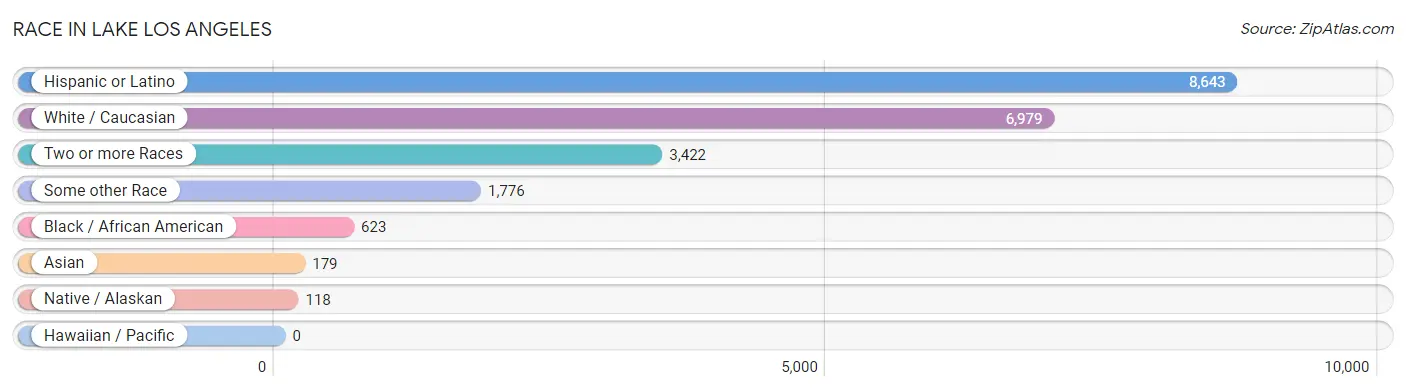
| Race | # Population | % Population |
| Asian | 179 | 1.4% |
| Black / African American | 623 | 4.8% |
| Hawaiian / Pacific | 0 | 0.0% |
| Hispanic or Latino | 8,643 | 66.0% |
| Native / Alaskan | 118 | 0.9% |
| White / Caucasian | 6,979 | 53.3% |
| Two or more Races | 3,422 | 26.1% |
| Some other Race | 1,776 | 13.6% |
| Total | 13,097 | 100.0% |
Ancestry in Lake Los Angeles
The most populous ancestries reported in Lake Los Angeles are Mexican (7,599 | 58.0%), German (913 | 7.0%), Central American (823 | 6.3%), Salvadoran (490 | 3.7%), and Irish (346 | 2.6%), together accounting for 77.6% of all Lake Los Angeles residents.
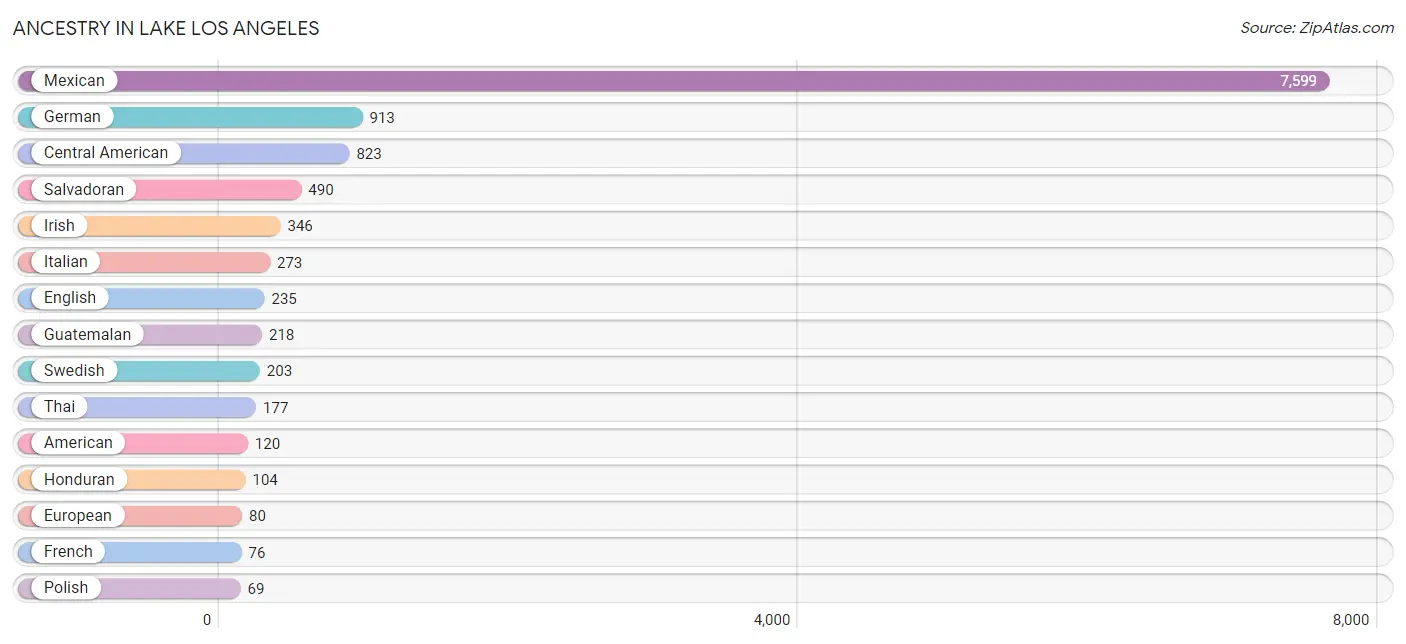
| Ancestry | # Population | % Population |
| American | 120 | 0.9% |
| Apache | 49 | 0.4% |
| Armenian | 56 | 0.4% |
| Austrian | 9 | 0.1% |
| Bhutanese | 13 | 0.1% |
| Blackfeet | 54 | 0.4% |
| British | 34 | 0.3% |
| Burmese | 18 | 0.1% |
| Canadian | 19 | 0.2% |
| Central American | 823 | 6.3% |
| Central American Indian | 20 | 0.2% |
| Cherokee | 60 | 0.5% |
| Choctaw | 19 | 0.2% |
| Colombian | 16 | 0.1% |
| Costa Rican | 11 | 0.1% |
| Cuban | 30 | 0.2% |
| Czech | 11 | 0.1% |
| Czechoslovakian | 10 | 0.1% |
| Danish | 7 | 0.1% |
| Dutch | 17 | 0.1% |
| English | 235 | 1.8% |
| European | 80 | 0.6% |
| Finnish | 11 | 0.1% |
| French | 76 | 0.6% |
| German | 913 | 7.0% |
| German Russian | 6 | 0.1% |
| Guamanian / Chamorro | 7 | 0.1% |
| Guatemalan | 218 | 1.7% |
| Honduran | 104 | 0.8% |
| Hungarian | 34 | 0.3% |
| Indian (Asian) | 7 | 0.1% |
| Irish | 346 | 2.6% |
| Italian | 273 | 2.1% |
| Korean | 25 | 0.2% |
| Mexican | 7,599 | 58.0% |
| Mexican American Indian | 48 | 0.4% |
| Norwegian | 50 | 0.4% |
| Peruvian | 7 | 0.1% |
| Polish | 69 | 0.5% |
| Portuguese | 16 | 0.1% |
| Russian | 14 | 0.1% |
| Salvadoran | 490 | 3.7% |
| Scandinavian | 11 | 0.1% |
| Scotch-Irish | 47 | 0.4% |
| Scottish | 52 | 0.4% |
| Slavic | 59 | 0.4% |
| Slovak | 13 | 0.1% |
| South American | 23 | 0.2% |
| Spanish | 49 | 0.4% |
| Swedish | 203 | 1.5% |
| Swiss | 21 | 0.2% |
| Thai | 177 | 1.3% |
| Ukrainian | 10 | 0.1% |
| Yaqui | 11 | 0.1% | View All 54 Rows |
Immigrants in Lake Los Angeles
The most numerous immigrant groups reported in Lake Los Angeles came from Latin America (1,294 | 9.9%), Central America (1,286 | 9.8%), Mexico (943 | 7.2%), El Salvador (169 | 1.3%), and Guatemala (152 | 1.2%), together accounting for 29.4% of all Lake Los Angeles residents.
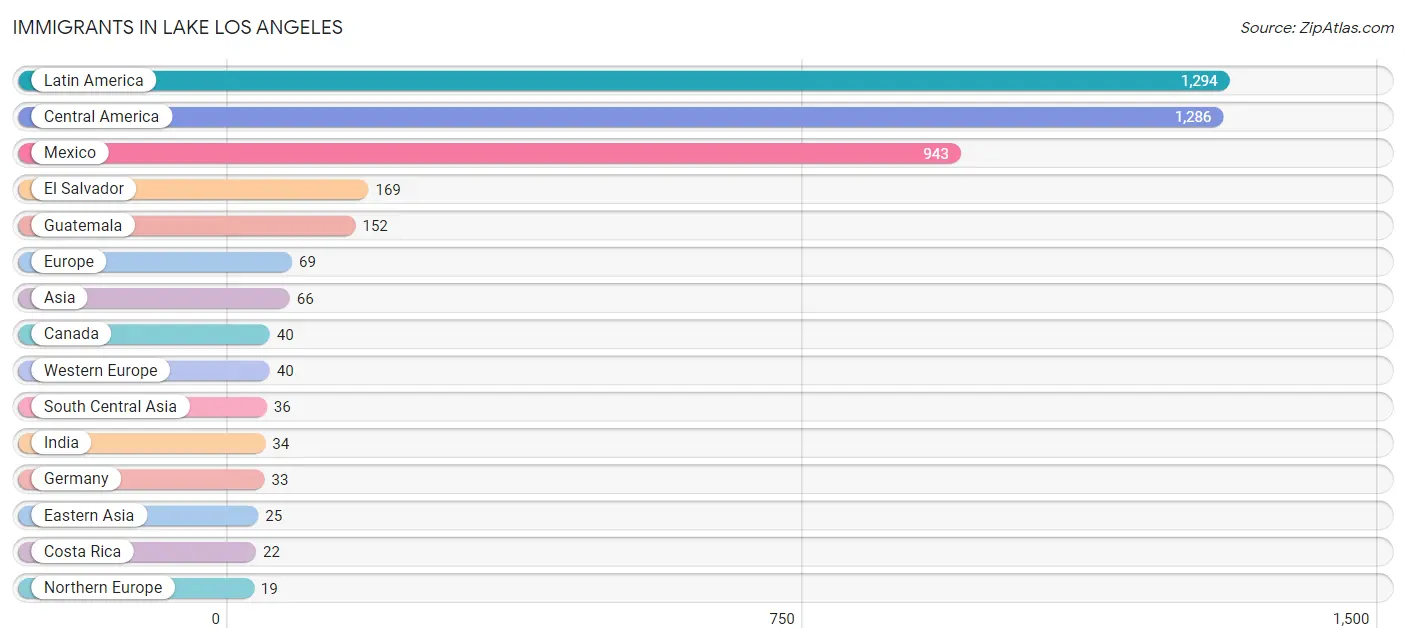
| Immigration Origin | # Population | % Population |
| Armenia | 5 | 0.0% |
| Asia | 66 | 0.5% |
| Canada | 40 | 0.3% |
| Central America | 1,286 | 9.8% |
| China | 7 | 0.1% |
| Costa Rica | 22 | 0.2% |
| Eastern Asia | 25 | 0.2% |
| Eastern Europe | 10 | 0.1% |
| El Salvador | 169 | 1.3% |
| England | 8 | 0.1% |
| Europe | 69 | 0.5% |
| Germany | 33 | 0.3% |
| Guatemala | 152 | 1.2% |
| India | 34 | 0.3% |
| Iran | 2 | 0.0% |
| Korea | 18 | 0.1% |
| Latin America | 1,294 | 9.9% |
| Mexico | 943 | 7.2% |
| Netherlands | 7 | 0.1% |
| Northern Europe | 19 | 0.2% |
| Peru | 8 | 0.1% |
| Russia | 10 | 0.1% |
| South America | 8 | 0.1% |
| South Central Asia | 36 | 0.3% |
| Western Asia | 5 | 0.0% |
| Western Europe | 40 | 0.3% | View All 26 Rows |
Sex and Age in Lake Los Angeles
Sex and Age in Lake Los Angeles
The most populous age groups in Lake Los Angeles are 15 to 19 Years (666 | 10.3%) for men and 10 to 14 Years (1,015 | 15.3%) for women.
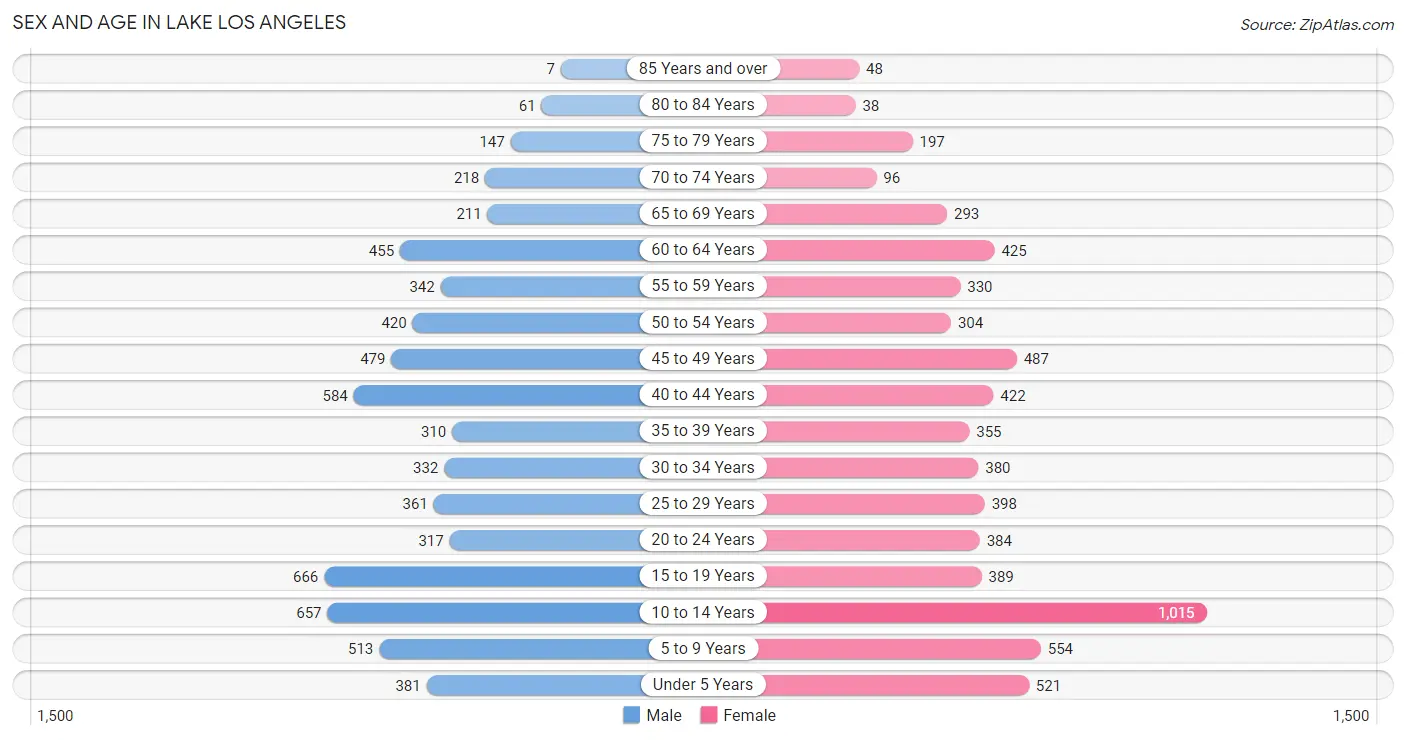
| Age Bracket | Male | Female |
| Under 5 Years | 381 (5.9%) | 521 (7.9%) |
| 5 to 9 Years | 513 (7.9%) | 554 (8.4%) |
| 10 to 14 Years | 657 (10.2%) | 1,015 (15.3%) |
| 15 to 19 Years | 666 (10.3%) | 389 (5.9%) |
| 20 to 24 Years | 317 (4.9%) | 384 (5.8%) |
| 25 to 29 Years | 361 (5.6%) | 398 (6.0%) |
| 30 to 34 Years | 332 (5.1%) | 380 (5.7%) |
| 35 to 39 Years | 310 (4.8%) | 355 (5.3%) |
| 40 to 44 Years | 584 (9.0%) | 422 (6.4%) |
| 45 to 49 Years | 479 (7.4%) | 487 (7.3%) |
| 50 to 54 Years | 420 (6.5%) | 304 (4.6%) |
| 55 to 59 Years | 342 (5.3%) | 330 (5.0%) |
| 60 to 64 Years | 455 (7.0%) | 425 (6.4%) |
| 65 to 69 Years | 211 (3.3%) | 293 (4.4%) |
| 70 to 74 Years | 218 (3.4%) | 96 (1.5%) |
| 75 to 79 Years | 147 (2.3%) | 197 (3.0%) |
| 80 to 84 Years | 61 (0.9%) | 38 (0.6%) |
| 85 Years and over | 7 (0.1%) | 48 (0.7%) |
| Total | 6,461 (100.0%) | 6,636 (100.0%) |
Families and Households in Lake Los Angeles
Median Family Size in Lake Los Angeles
The median family size in Lake Los Angeles is 4.13 persons per family, with married-couple families (1,751 | 62.0%) accounting for the largest median family size of 4.29 persons per family. On the other hand, single male/father families (473 | 16.8%) represent the smallest median family size with 3.71 persons per family.
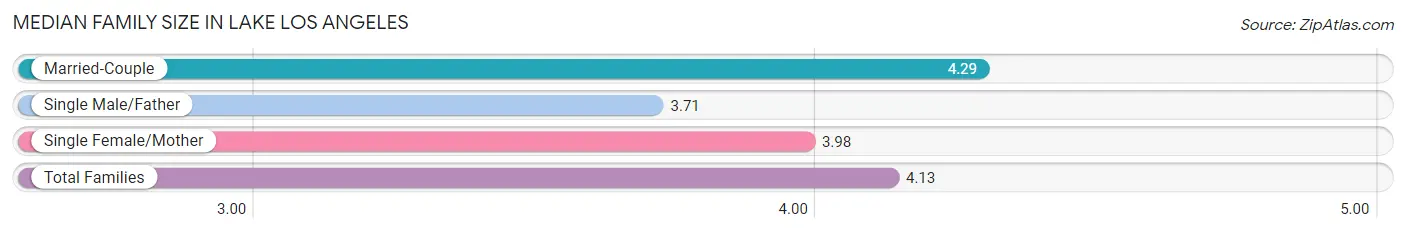
| Family Type | # Families | Family Size |
| Married-Couple | 1,751 (62.0%) | 4.29 |
| Single Male/Father | 473 (16.8%) | 3.71 |
| Single Female/Mother | 599 (21.2%) | 3.98 |
| Total Families | 2,823 (100.0%) | 4.13 |
Median Household Size in Lake Los Angeles
The median household size in Lake Los Angeles is 3.72 persons per household, with married-couple households (1,751 | 49.9%) accounting for the largest median household size of 4.34 persons per household. non-family households (688 | 19.6%) represent the smallest median household size with 1.33 persons per household.
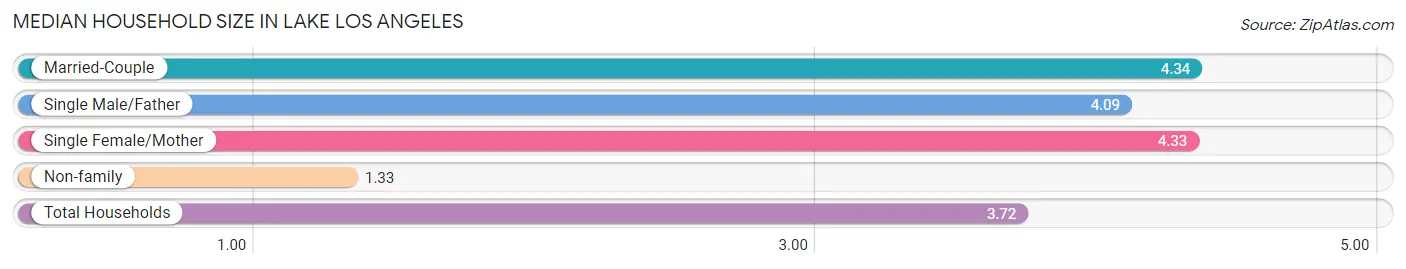
| Household Type | # Households | Household Size |
| Married-Couple | 1,751 (49.9%) | 4.34 |
| Single Male/Father | 473 (13.5%) | 4.09 |
| Single Female/Mother | 599 (17.1%) | 4.33 |
| Non-family | 688 (19.6%) | 1.33 |
| Total Households | 3,511 (100.0%) | 3.72 |
Household Size by Marriage Status in Lake Los Angeles
Out of a total of 3,511 households in Lake Los Angeles, 2,823 (80.4%) are family households, while 688 (19.6%) are nonfamily households. The most numerous type of family households are 5-person households, comprising 719, and the most common type of nonfamily households are 1-person households, comprising 565.
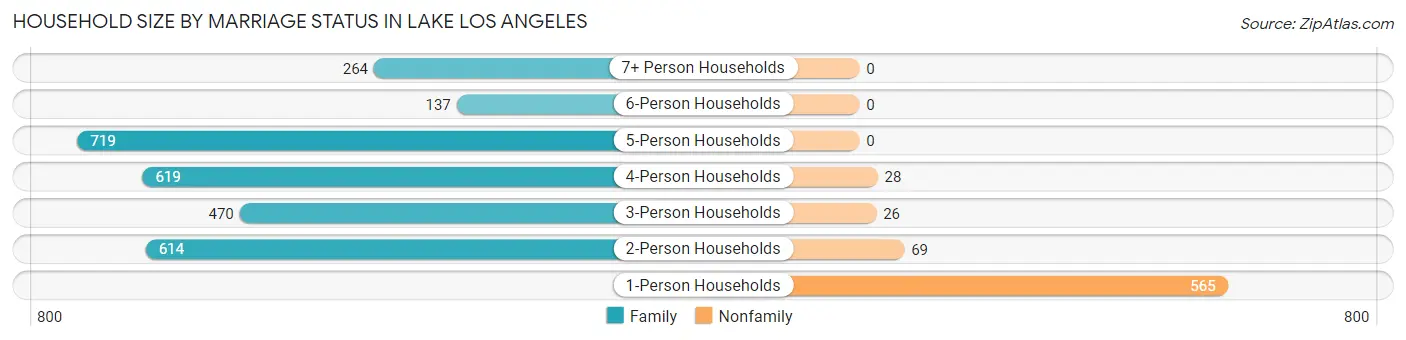
| Household Size | Family Households | Nonfamily Households |
| 1-Person Households | - | 565 (16.1%) |
| 2-Person Households | 614 (17.5%) | 69 (2.0%) |
| 3-Person Households | 470 (13.4%) | 26 (0.7%) |
| 4-Person Households | 619 (17.6%) | 28 (0.8%) |
| 5-Person Households | 719 (20.5%) | 0 (0.0%) |
| 6-Person Households | 137 (3.9%) | 0 (0.0%) |
| 7+ Person Households | 264 (7.5%) | 0 (0.0%) |
| Total | 2,823 (80.4%) | 688 (19.6%) |
Female Fertility in Lake Los Angeles
Fertility by Age in Lake Los Angeles
Average fertility rate in Lake Los Angeles is 48.0 births per 1,000 women. Women in the age bracket of 20 to 34 years have the highest fertility rate with 98.0 births per 1,000 women. Women in the age bracket of 20 to 34 years acount for 83.2% of all women with births.
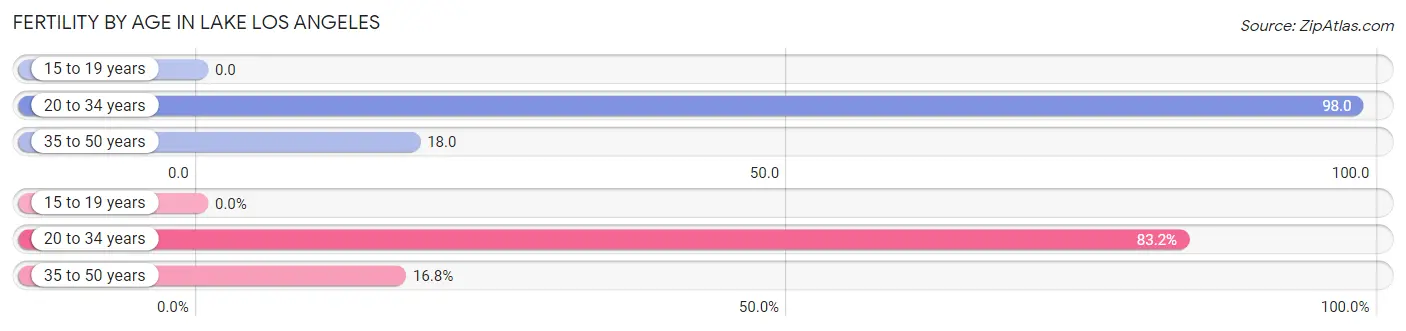
| Age Bracket | Women with Births | Births / 1,000 Women |
| 15 to 19 years | 0 (0.0%) | 0.0 |
| 20 to 34 years | 114 (83.2%) | 98.0 |
| 35 to 50 years | 23 (16.8%) | 18.0 |
| Total | 137 (100.0%) | 48.0 |
Fertility by Age by Marriage Status in Lake Los Angeles
31.4% of women with births (137) in Lake Los Angeles are married. The highest percentage of unmarried women with births falls into 20 to 34 years age bracket with 82.5% of them unmarried at the time of birth, while the lowest percentage of unmarried women with births belong to 35 to 50 years age bracket with 0.0% of them unmarried.
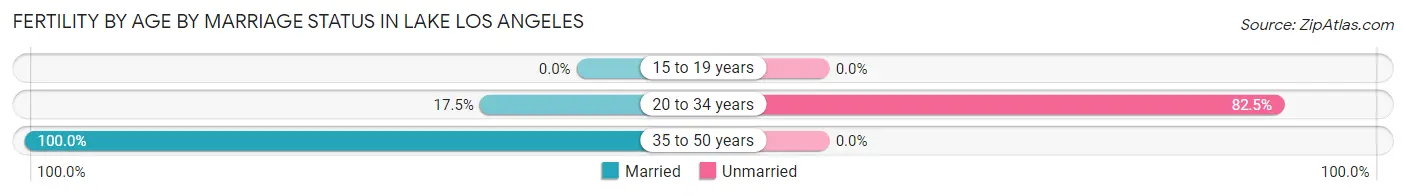
| Age Bracket | Married | Unmarried |
| 15 to 19 years | 0 (0.0%) | 0 (0.0%) |
| 20 to 34 years | 20 (17.5%) | 94 (82.5%) |
| 35 to 50 years | 23 (100.0%) | 0 (0.0%) |
| Total | 43 (31.4%) | 94 (68.6%) |
Fertility by Education in Lake Los Angeles
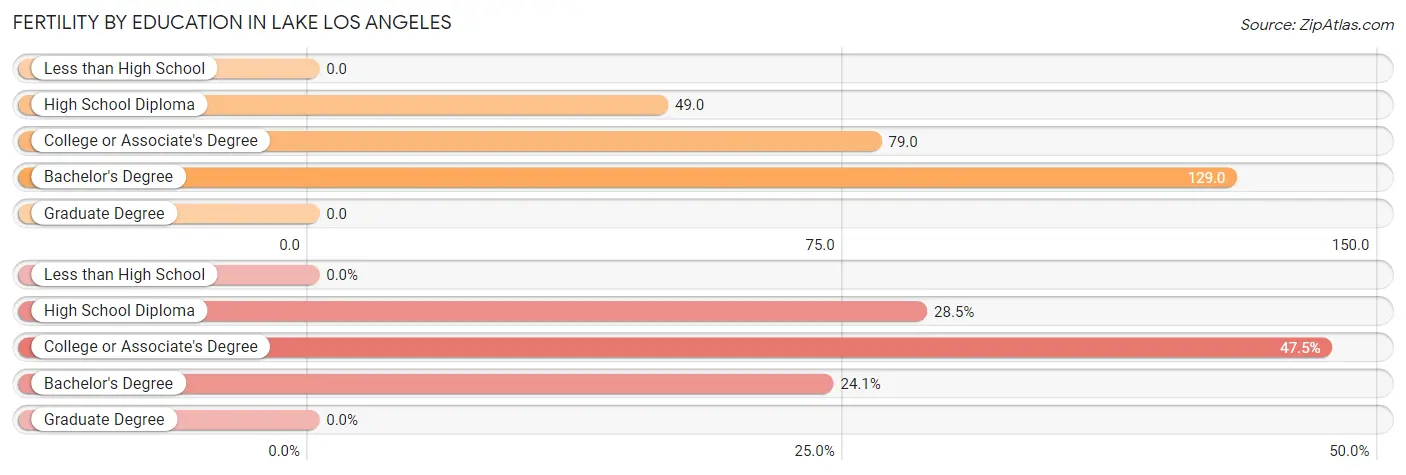
| Educational Attainment | Women with Births | Births / 1,000 Women |
| Less than High School | 0 (0.0%) | 0.0 |
| High School Diploma | 39 (28.5%) | 49.0 |
| College or Associate's Degree | 65 (47.4%) | 79.0 |
| Bachelor's Degree | 33 (24.1%) | 129.0 |
| Graduate Degree | 0 (0.0%) | 0.0 |
| Total | 137 (100.0%) | 48.0 |
Fertility by Education by Marriage Status in Lake Los Angeles
68.6% of women with births in Lake Los Angeles are unmarried. Women with the educational attainment of high school diploma are most likely to be married with 51.3% of them married at childbirth, while women with the educational attainment of bachelor's degree are least likely to be married with 100.0% of them unmarried at childbirth.

| Educational Attainment | Married | Unmarried |
| Less than High School | 0 (0.0%) | 0 (0.0%) |
| High School Diploma | 20 (51.3%) | 19 (48.7%) |
| College or Associate's Degree | 23 (35.4%) | 42 (64.6%) |
| Bachelor's Degree | 0 (0.0%) | 33 (100.0%) |
| Graduate Degree | 0 (0.0%) | 0 (0.0%) |
| Total | 43 (31.4%) | 94 (68.6%) |
Income in Lake Los Angeles
Income Overview in Lake Los Angeles
Per Capita Income in Lake Los Angeles is $19,724, while median incomes of families and households are $59,886 and $58,512 respectively.
| Characteristic | Number | Measure |
| Per Capita Income | 13,097 | $19,724 |
| Median Family Income | 2,823 | $59,886 |
| Mean Family Income | 2,823 | $74,296 |
| Median Household Income | 3,511 | $58,512 |
| Mean Household Income | 3,511 | $71,513 |
| Income Deficit | 2,823 | $15,336 |
| Wage / Income Gap (%) | 13,097 | 29.61% |
| Wage / Income Gap ($) | 13,097 | 70.39¢ per $1 |
| Gini / Inequality Index | 13,097 | 0.40 |
Earnings by Sex in Lake Los Angeles
Average Earnings in Lake Los Angeles are $39,845, $47,222 for men and $33,239 for women, a difference of 29.6%.
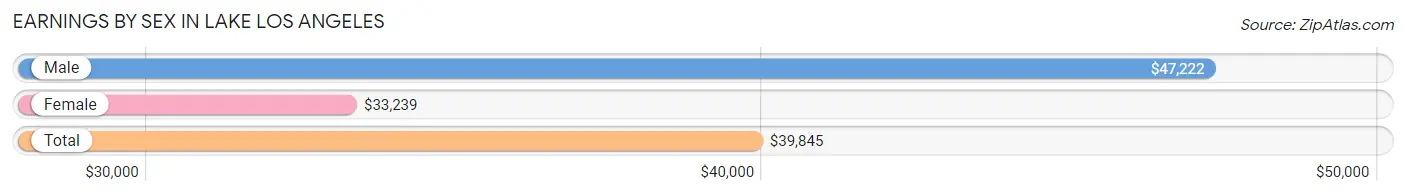
| Sex | Number | Average Earnings |
| Male | 2,532 (59.4%) | $47,222 |
| Female | 1,729 (40.6%) | $33,239 |
| Total | 4,261 (100.0%) | $39,845 |
Earnings by Sex by Income Bracket in Lake Los Angeles
The most common earnings brackets in Lake Los Angeles are $75,000 to $99,999 for men (374 | 14.8%) and $30,000 to $34,999 for women (244 | 14.1%).
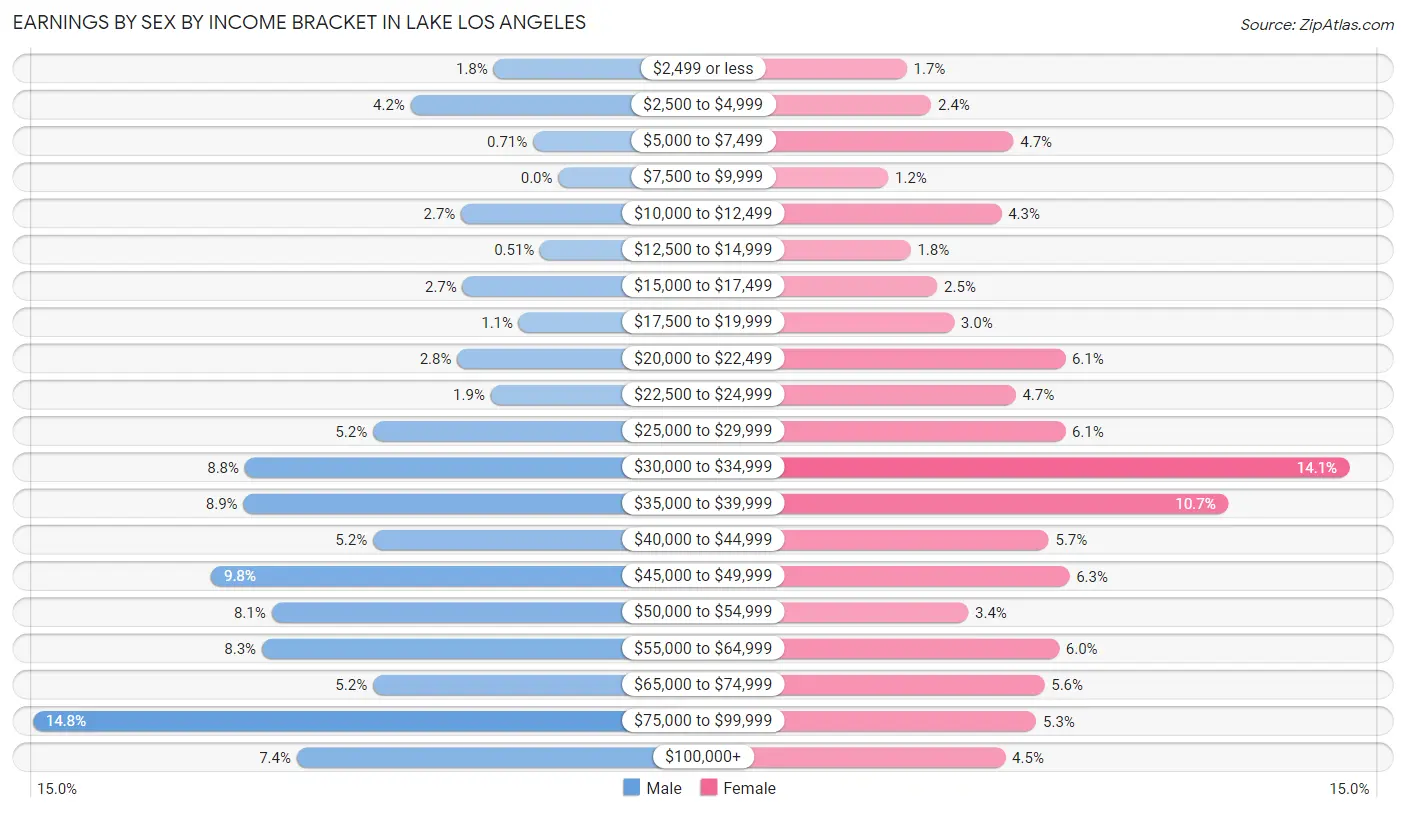
| Income | Male | Female |
| $2,499 or less | 46 (1.8%) | 29 (1.7%) |
| $2,500 to $4,999 | 105 (4.2%) | 41 (2.4%) |
| $5,000 to $7,499 | 18 (0.7%) | 81 (4.7%) |
| $7,500 to $9,999 | 0 (0.0%) | 20 (1.2%) |
| $10,000 to $12,499 | 69 (2.7%) | 75 (4.3%) |
| $12,500 to $14,999 | 13 (0.5%) | 31 (1.8%) |
| $15,000 to $17,499 | 68 (2.7%) | 44 (2.5%) |
| $17,500 to $19,999 | 28 (1.1%) | 52 (3.0%) |
| $20,000 to $22,499 | 72 (2.8%) | 106 (6.1%) |
| $22,500 to $24,999 | 48 (1.9%) | 82 (4.7%) |
| $25,000 to $29,999 | 132 (5.2%) | 106 (6.1%) |
| $30,000 to $34,999 | 223 (8.8%) | 244 (14.1%) |
| $35,000 to $39,999 | 224 (8.8%) | 185 (10.7%) |
| $40,000 to $44,999 | 132 (5.2%) | 98 (5.7%) |
| $45,000 to $49,999 | 247 (9.8%) | 108 (6.2%) |
| $50,000 to $54,999 | 204 (8.1%) | 59 (3.4%) |
| $55,000 to $64,999 | 211 (8.3%) | 103 (6.0%) |
| $65,000 to $74,999 | 132 (5.2%) | 96 (5.6%) |
| $75,000 to $99,999 | 374 (14.8%) | 92 (5.3%) |
| $100,000+ | 186 (7.3%) | 77 (4.4%) |
| Total | 2,532 (100.0%) | 1,729 (100.0%) |
Earnings by Sex by Educational Attainment in Lake Los Angeles
Average earnings in Lake Los Angeles are $49,037 for men and $35,361 for women, a difference of 27.9%. Men with an educational attainment of graduate degree enjoy the highest average annual earnings of $90,500, while those with less than high school education earn the least with $45,239. Women with an educational attainment of graduate degree earn the most with the average annual earnings of $76,250, while those with college or associate's degree education have the smallest earnings of $30,366.
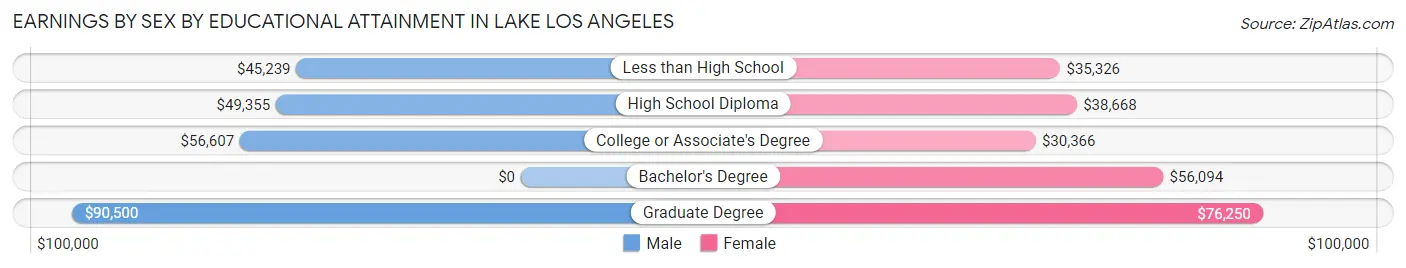
| Educational Attainment | Male Income | Female Income |
| Less than High School | $45,239 | $35,326 |
| High School Diploma | $49,355 | $38,668 |
| College or Associate's Degree | $56,607 | $30,366 |
| Bachelor's Degree | - | - |
| Graduate Degree | $90,500 | $76,250 |
| Total | $49,037 | $35,361 |
Family Income in Lake Los Angeles
Family Income Brackets in Lake Los Angeles
According to the Lake Los Angeles family income data, there are 844 families falling into the $50,000 to $74,999 income range, which is the most common income bracket and makes up 29.9% of all families. Conversely, the $10,000 to $14,999 income bracket is the least frequent group with only 25 families (0.9%) belonging to this category.
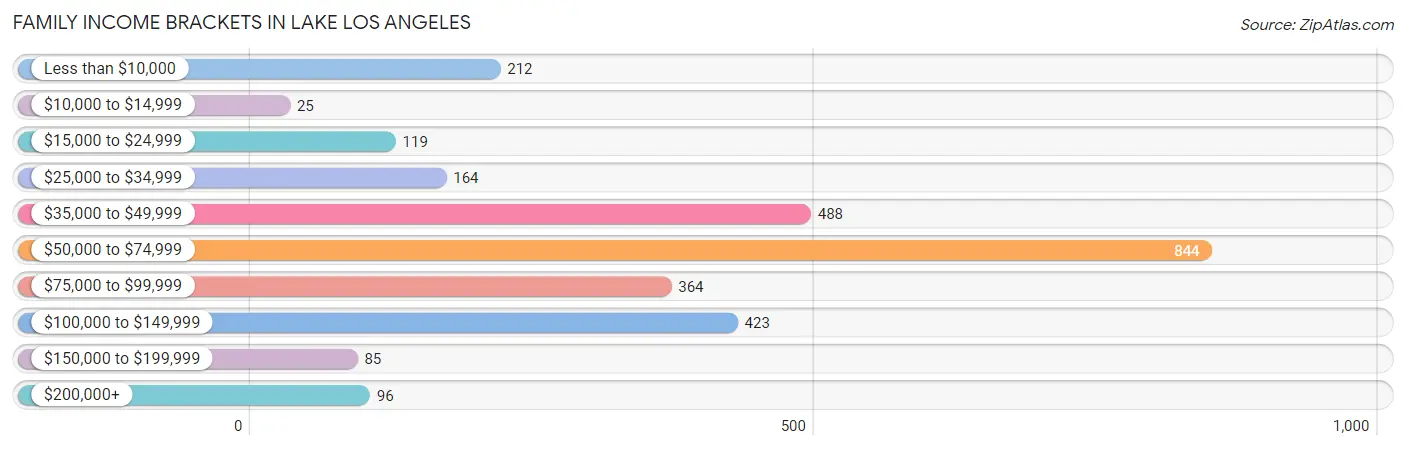
| Income Bracket | # Families | % Families |
| Less than $10,000 | 212 | 7.5% |
| $10,000 to $14,999 | 25 | 0.9% |
| $15,000 to $24,999 | 119 | 4.2% |
| $25,000 to $34,999 | 164 | 5.8% |
| $35,000 to $49,999 | 488 | 17.3% |
| $50,000 to $74,999 | 844 | 29.9% |
| $75,000 to $99,999 | 364 | 12.9% |
| $100,000 to $149,999 | 423 | 15.0% |
| $150,000 to $199,999 | 85 | 3.0% |
| $200,000+ | 96 | 3.4% |
Family Income by Famaliy Size in Lake Los Angeles
7+ person families (192 | 6.8%) account for the highest median family income in Lake Los Angeles with $105,234 per family, while 2-person families (727 | 25.8%) have the highest median income of $28,832 per family member.
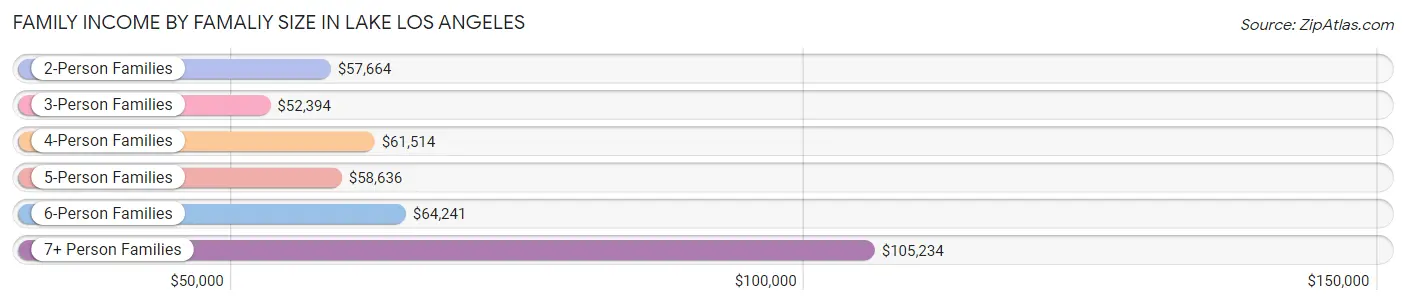
| Income Bracket | # Families | Median Income |
| 2-Person Families | 727 (25.8%) | $57,664 |
| 3-Person Families | 386 (13.7%) | $52,394 |
| 4-Person Families | 743 (26.3%) | $61,514 |
| 5-Person Families | 602 (21.3%) | $58,636 |
| 6-Person Families | 173 (6.1%) | $64,241 |
| 7+ Person Families | 192 (6.8%) | $105,234 |
| Total | 2,823 (100.0%) | $59,886 |
Family Income by Number of Earners in Lake Los Angeles
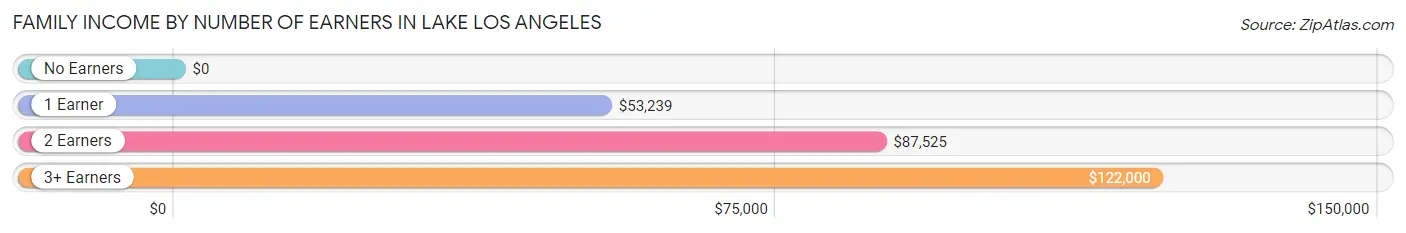
| Number of Earners | # Families | Median Income |
| No Earners | 551 (19.5%) | $0 |
| 1 Earner | 1,423 (50.4%) | $53,239 |
| 2 Earners | 617 (21.9%) | $87,525 |
| 3+ Earners | 232 (8.2%) | $122,000 |
| Total | 2,823 (100.0%) | $59,886 |
Household Income in Lake Los Angeles
Household Income Brackets in Lake Los Angeles
With 1,011 households falling in the category, the $50,000 to $74,999 income range is the most frequent in Lake Los Angeles, accounting for 28.8% of all households. In contrast, only 74 households (2.1%) fall into the $10,000 to $14,999 income bracket, making it the least populous group.
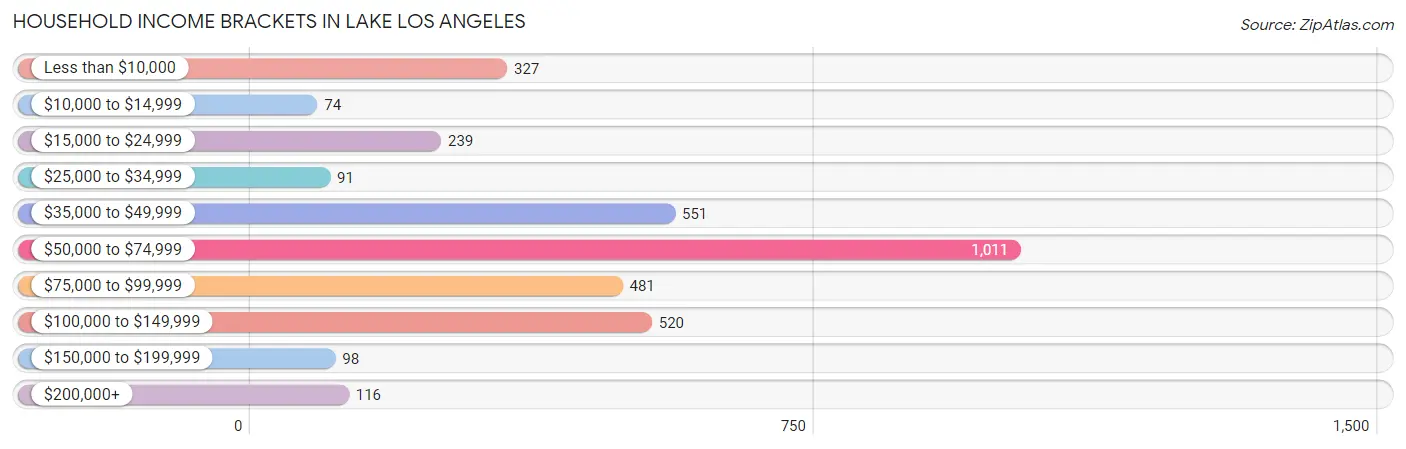
| Income Bracket | # Households | % Households |
| Less than $10,000 | 327 | 9.3% |
| $10,000 to $14,999 | 74 | 2.1% |
| $15,000 to $24,999 | 239 | 6.8% |
| $25,000 to $34,999 | 91 | 2.6% |
| $35,000 to $49,999 | 551 | 15.7% |
| $50,000 to $74,999 | 1,011 | 28.8% |
| $75,000 to $99,999 | 481 | 13.7% |
| $100,000 to $149,999 | 520 | 14.8% |
| $150,000 to $199,999 | 98 | 2.8% |
| $200,000+ | 116 | 3.3% |
Household Income by Householder Age in Lake Los Angeles
The median household income in Lake Los Angeles is $58,512, with the highest median household income of $59,408 found in the 25 to 44 years age bracket for the primary householder. A total of 1,091 households (31.1%) fall into this category. Meanwhile, the 15 to 24 years age bracket for the primary householder has the lowest median household income of $0, with 20 households (0.6%) in this group.
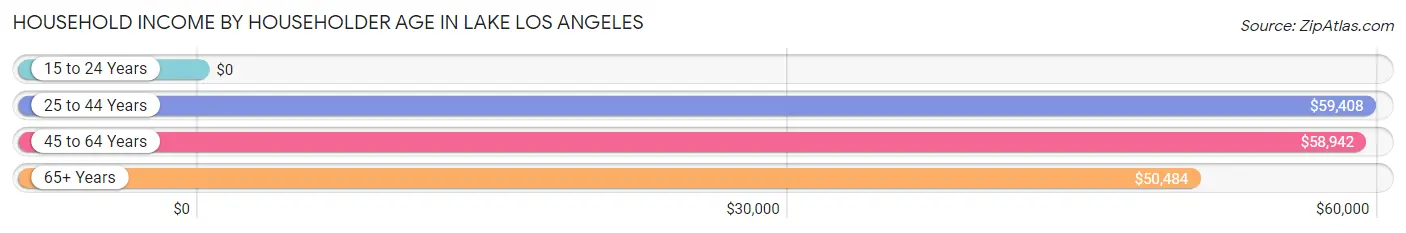
| Income Bracket | # Households | Median Income |
| 15 to 24 Years | 20 (0.6%) | $0 |
| 25 to 44 Years | 1,091 (31.1%) | $59,408 |
| 45 to 64 Years | 1,692 (48.2%) | $58,942 |
| 65+ Years | 708 (20.2%) | $50,484 |
| Total | 3,511 (100.0%) | $58,512 |
Poverty in Lake Los Angeles
Income Below Poverty by Sex and Age in Lake Los Angeles
With 12.3% poverty level for males and 15.7% for females among the residents of Lake Los Angeles, 75 year old and over males and 75 year old and over females are the most vulnerable to poverty, with 59 males (27.4%) and 130 females (45.9%) in their respective age groups living below the poverty level.
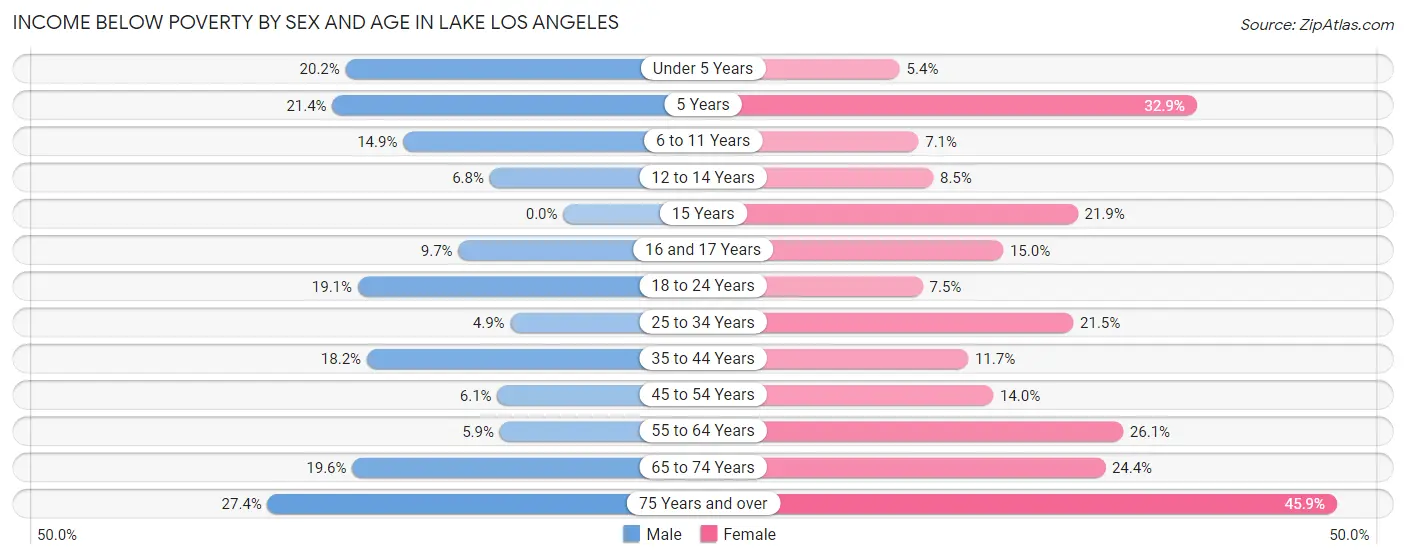
| Age Bracket | Male | Female |
| Under 5 Years | 77 (20.2%) | 28 (5.4%) |
| 5 Years | 6 (21.4%) | 27 (32.9%) |
| 6 to 11 Years | 110 (14.9%) | 67 (7.1%) |
| 12 to 14 Years | 25 (6.8%) | 46 (8.5%) |
| 15 Years | 0 (0.0%) | 7 (21.9%) |
| 16 and 17 Years | 37 (9.7%) | 35 (15.0%) |
| 18 to 24 Years | 94 (19.1%) | 38 (7.5%) |
| 25 to 34 Years | 34 (4.9%) | 167 (21.5%) |
| 35 to 44 Years | 163 (18.2%) | 91 (11.7%) |
| 45 to 54 Years | 55 (6.1%) | 111 (14.0%) |
| 55 to 64 Years | 47 (5.9%) | 197 (26.1%) |
| 65 to 74 Years | 84 (19.6%) | 95 (24.4%) |
| 75 Years and over | 59 (27.4%) | 130 (45.9%) |
| Total | 791 (12.3%) | 1,039 (15.7%) |
Income Above Poverty by Sex and Age in Lake Los Angeles
According to the poverty statistics in Lake Los Angeles, males aged 15 years and females aged under 5 years are the age groups that are most secure financially, with 100.0% of males and 94.6% of females in these age groups living above the poverty line.
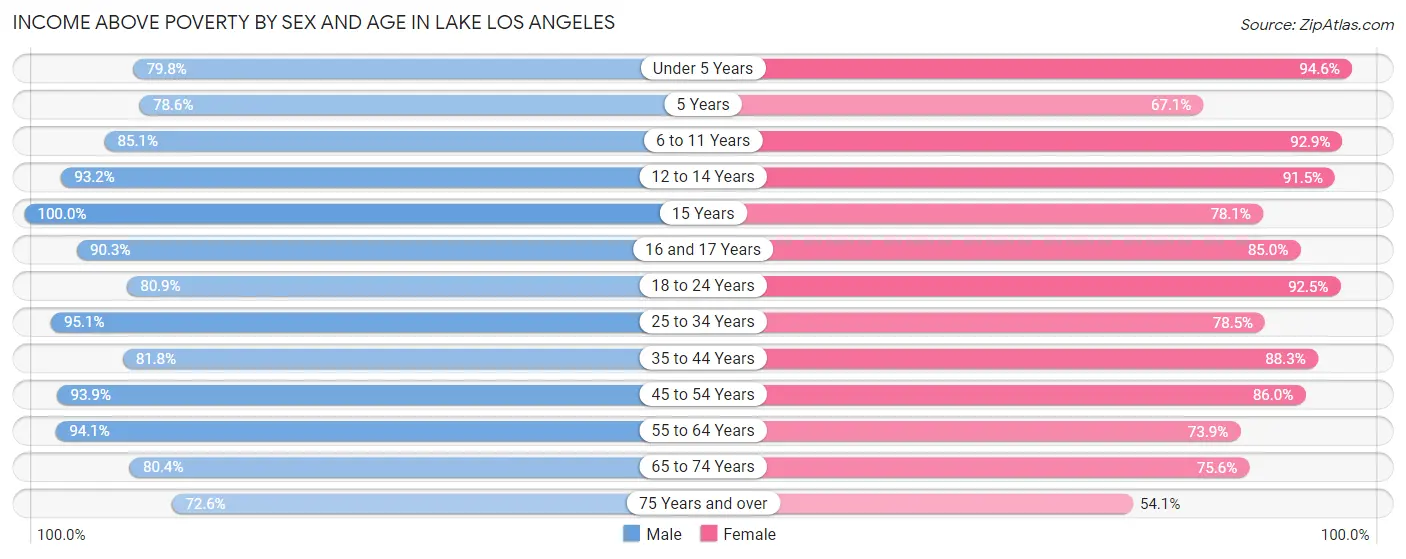
| Age Bracket | Male | Female |
| Under 5 Years | 304 (79.8%) | 493 (94.6%) |
| 5 Years | 22 (78.6%) | 55 (67.1%) |
| 6 to 11 Years | 630 (85.1%) | 877 (92.9%) |
| 12 to 14 Years | 341 (93.2%) | 497 (91.5%) |
| 15 Years | 110 (100.0%) | 25 (78.1%) |
| 16 and 17 Years | 343 (90.3%) | 199 (85.0%) |
| 18 to 24 Years | 399 (80.9%) | 469 (92.5%) |
| 25 to 34 Years | 659 (95.1%) | 611 (78.5%) |
| 35 to 44 Years | 731 (81.8%) | 686 (88.3%) |
| 45 to 54 Years | 844 (93.9%) | 680 (86.0%) |
| 55 to 64 Years | 750 (94.1%) | 558 (73.9%) |
| 65 to 74 Years | 345 (80.4%) | 294 (75.6%) |
| 75 Years and over | 156 (72.6%) | 153 (54.1%) |
| Total | 5,634 (87.7%) | 5,597 (84.3%) |
Income Below Poverty Among Married-Couple Families in Lake Los Angeles
The poverty statistics for married-couple families in Lake Los Angeles show that 10.7% or 187 of the total 1,751 families live below the poverty line. Families with no children have the highest poverty rate of 17.1%, comprising of 107 families. On the other hand, families with 5 or more children have the lowest poverty rate of 0.0%, which includes 0 families.
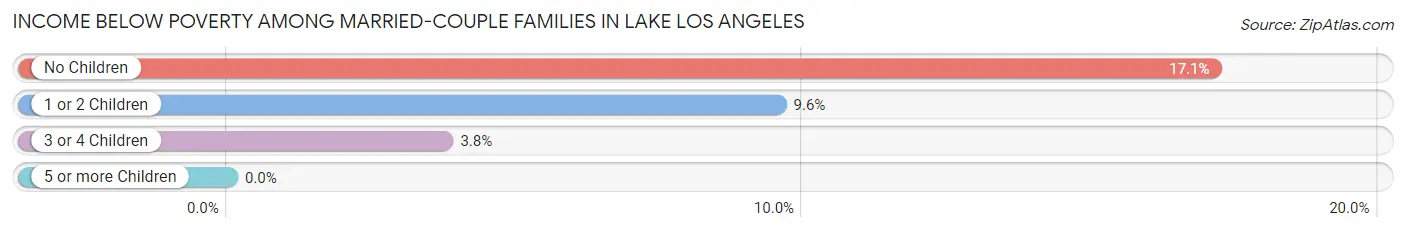
| Children | Above Poverty | Below Poverty |
| No Children | 518 (82.9%) | 107 (17.1%) |
| 1 or 2 Children | 625 (90.4%) | 66 (9.6%) |
| 3 or 4 Children | 359 (96.3%) | 14 (3.7%) |
| 5 or more Children | 62 (100.0%) | 0 (0.0%) |
| Total | 1,564 (89.3%) | 187 (10.7%) |
Income Below Poverty Among Single-Parent Households in Lake Los Angeles
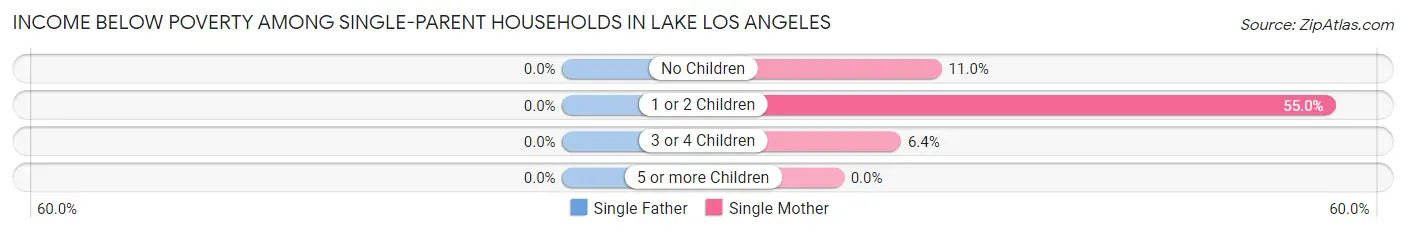
| Children | Single Father | Single Mother |
| No Children | 0 (0.0%) | 22 (11.0%) |
| 1 or 2 Children | 0 (0.0%) | 150 (54.9%) |
| 3 or 4 Children | 0 (0.0%) | 8 (6.4%) |
| 5 or more Children | 0 (0.0%) | 0 (0.0%) |
| Total | 0 (0.0%) | 180 (30.0%) |
Income Below Poverty Among Married-Couple vs Single-Parent Households in Lake Los Angeles
The poverty data for Lake Los Angeles shows that 187 of the married-couple family households (10.7%) and 180 of the single-parent households (16.8%) are living below the poverty level. Within the married-couple family households, those with no children have the highest poverty rate, with 107 households (17.1%) falling below the poverty line. Among the single-parent households, those with 1 or 2 children have the highest poverty rate, with 150 household (33.7%) living below poverty.
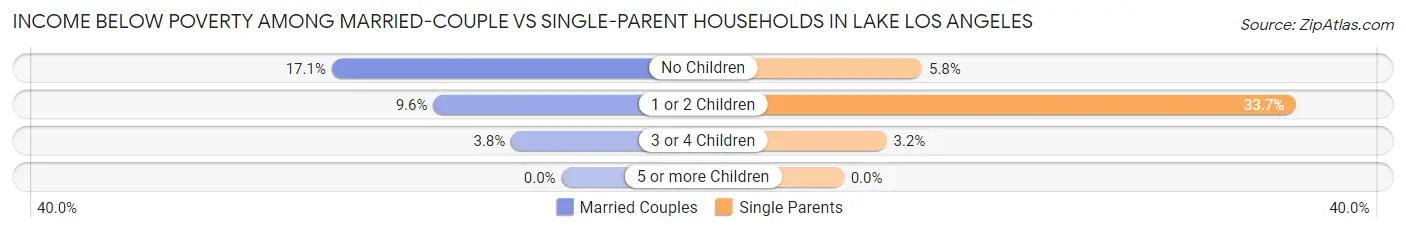
| Children | Married-Couple Families | Single-Parent Households |
| No Children | 107 (17.1%) | 22 (5.8%) |
| 1 or 2 Children | 66 (9.6%) | 150 (33.7%) |
| 3 or 4 Children | 14 (3.7%) | 8 (3.2%) |
| 5 or more Children | 0 (0.0%) | 0 (0.0%) |
| Total | 187 (10.7%) | 180 (16.8%) |
Employment Characteristics in Lake Los Angeles
Employment by Class of Employer in Lake Los Angeles
Among the 3,825 employed individuals in Lake Los Angeles, private company employees (2,676 | 70.0%), local government employees (542 | 14.2%), and self-employed (not incorporated) (264 | 6.9%) make up the most common classes of employment.
| Employer Class | # Employees | % Employees |
| Private Company Employees | 2,676 | 70.0% |
| Self-Employed (Incorporated) | 18 | 0.5% |
| Self-Employed (Not Incorporated) | 264 | 6.9% |
| Not-for-profit Organizations | 92 | 2.4% |
| Local Government Employees | 542 | 14.2% |
| State Government Employees | 141 | 3.7% |
| Federal Government Employees | 75 | 2.0% |
| Unpaid Family Workers | 17 | 0.4% |
| Total | 3,825 | 100.0% |
Employment Status by Age in Lake Los Angeles
According to the labor force statistics for Lake Los Angeles, out of the total population over 16 years of age (9,314), 45.9% or 4,275 individuals are in the labor force, with 8.0% or 342 of them unemployed. The age group with the highest labor force participation rate is 25 to 29 years, with 79.8% or 606 individuals in the labor force. Within the labor force, the 16 to 19 years age range has the highest percentage of unemployed individuals, with 30.6% or 22 of them being unemployed.
| Age Bracket | In Labor Force | Unemployed |
| 16 to 19 Years | 72 (7.9%) | 22 (30.6%) |
| 20 to 24 Years | 259 (36.9%) | 10 (3.9%) |
| 25 to 29 Years | 606 (79.8%) | 35 (5.7%) |
| 30 to 34 Years | 526 (73.9%) | 77 (14.6%) |
| 35 to 44 Years | 902 (54.0%) | 90 (10.0%) |
| 45 to 54 Years | 896 (53.0%) | 43 (4.8%) |
| 55 to 59 Years | 442 (65.8%) | 11 (2.5%) |
| 60 to 64 Years | 379 (43.1%) | 32 (8.4%) |
| 65 to 74 Years | 191 (23.3%) | 21 (11.0%) |
| 75 Years and over | 4 (0.8%) | 0 (0.0%) |
| Total | 4,275 (45.9%) | 342 (8.0%) |
Employment Status by Educational Attainment in Lake Los Angeles
According to labor force statistics for Lake Los Angeles, 58.7% of individuals (3,747) out of the total population between 25 and 64 years of age (6,384) are in the labor force, with 7.7% or 289 of them being unemployed. The group with the highest labor force participation rate are those with the educational attainment of bachelor's degree or higher, with 80.4% or 607 individuals in the labor force. Within the labor force, individuals with college / associate degree education have the highest percentage of unemployment, with 13.1% or 105 of them being unemployed.
| Educational Attainment | In Labor Force | Unemployed |
| Less than High School | 894 (51.7%) | 29 (1.7%) |
| High School Diploma | 1,445 (60.5%) | 170 (7.1%) |
| College / Associate Degree | 802 (53.1%) | 198 (13.1%) |
| Bachelor's Degree or higher | 607 (80.4%) | 81 (10.7%) |
| Total | 3,747 (58.7%) | 492 (7.7%) |
Employment Occupations by Sex in Lake Los Angeles
Management, Business, Science and Arts Occupations
The most common Management, Business, Science and Arts occupations in Lake Los Angeles are Community & Social Service (319 | 8.1%), Education Instruction & Library (269 | 6.9%), Management (244 | 6.2%), Business & Financial (176 | 4.5%), and Health Diagnosing & Treating (83 | 2.1%).
Management, Business, Science and Arts Occupations by Sex
Within the Management, Business, Science and Arts occupations in Lake Los Angeles, the most male-oriented occupations are Architecture & Engineering (100.0%), Education, Arts & Media (100.0%), and Legal Services & Support (100.0%), while the most female-oriented occupations are Arts, Media & Entertainment (85.7%), Education Instruction & Library (79.2%), and Business & Financial (77.3%).
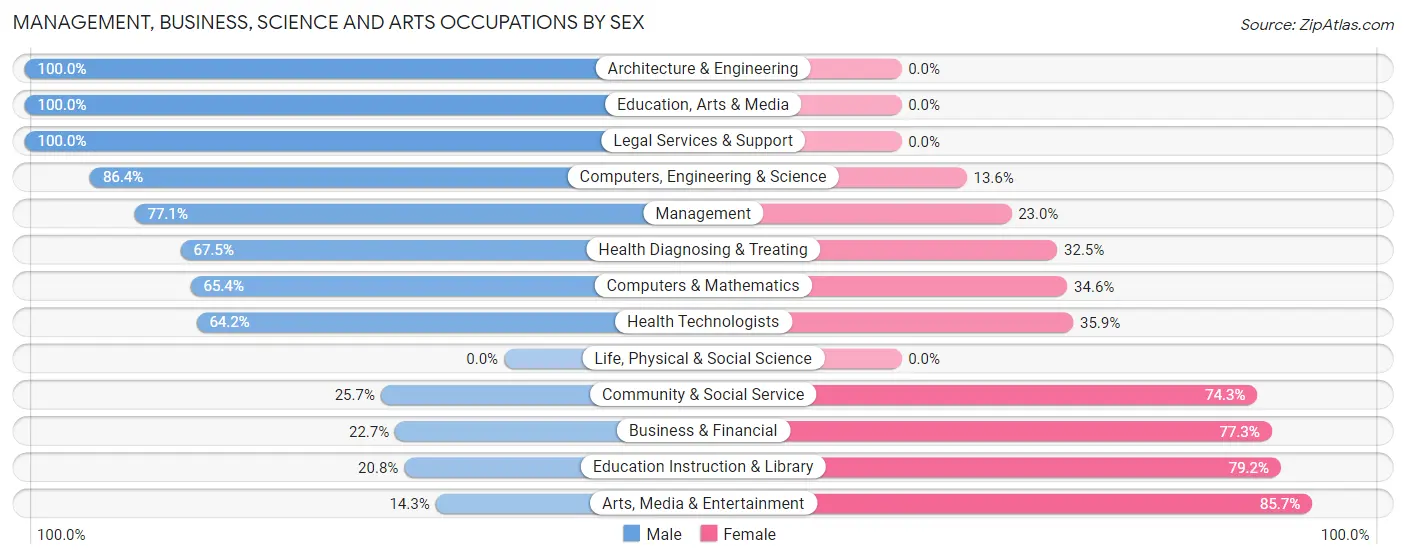
| Occupation | Male | Female |
| Management | 188 (77.0%) | 56 (23.0%) |
| Business & Financial | 40 (22.7%) | 136 (77.3%) |
| Computers, Engineering & Science | 57 (86.4%) | 9 (13.6%) |
| Computers & Mathematics | 17 (65.4%) | 9 (34.6%) |
| Architecture & Engineering | 40 (100.0%) | 0 (0.0%) |
| Life, Physical & Social Science | 0 (0.0%) | 0 (0.0%) |
| Community & Social Service | 82 (25.7%) | 237 (74.3%) |
| Education, Arts & Media | 13 (100.0%) | 0 (0.0%) |
| Legal Services & Support | 9 (100.0%) | 0 (0.0%) |
| Education Instruction & Library | 56 (20.8%) | 213 (79.2%) |
| Arts, Media & Entertainment | 4 (14.3%) | 24 (85.7%) |
| Health Diagnosing & Treating | 56 (67.5%) | 27 (32.5%) |
| Health Technologists | 34 (64.1%) | 19 (35.8%) |
| Total (Category) | 423 (47.6%) | 465 (52.4%) |
| Total (Overall) | 2,325 (59.2%) | 1,600 (40.8%) |
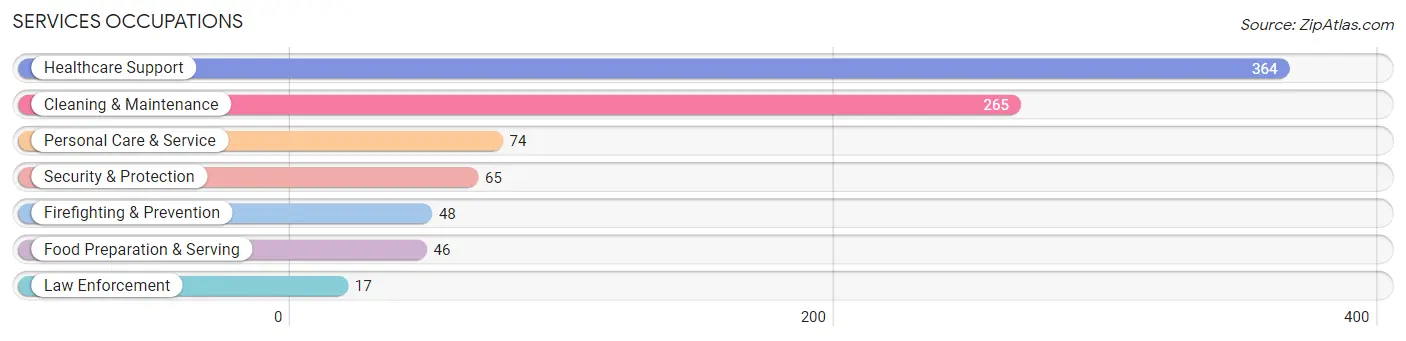
Services Occupations
The most common Services occupations in Lake Los Angeles are Healthcare Support (364 | 9.3%), Cleaning & Maintenance (265 | 6.8%), Personal Care & Service (74 | 1.9%), Security & Protection (65 | 1.7%), and Firefighting & Prevention (48 | 1.2%).
Services Occupations by Sex
Within the Services occupations in Lake Los Angeles, the most male-oriented occupations are Personal Care & Service (58.1%), Cleaning & Maintenance (48.3%), and Healthcare Support (42.3%), while the most female-oriented occupations are Security & Protection (100.0%), Firefighting & Prevention (100.0%), and Law Enforcement (100.0%).
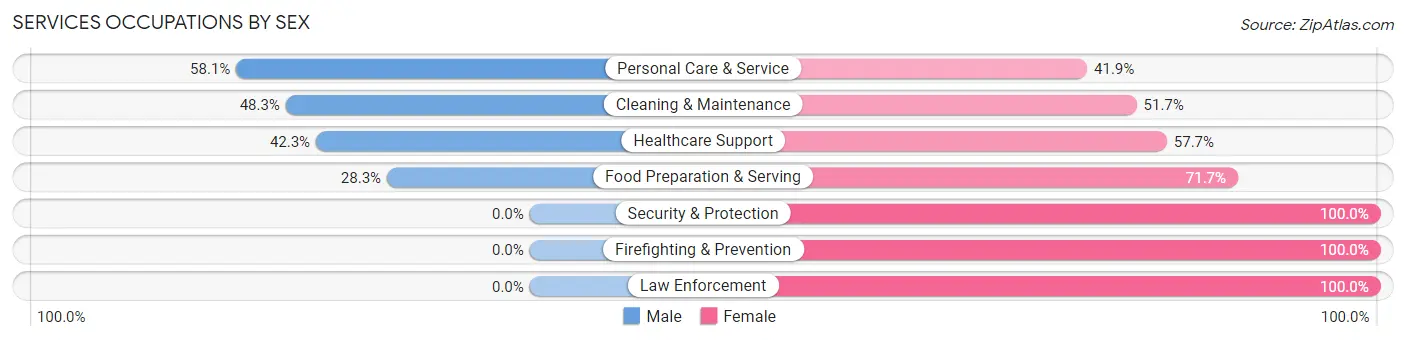
| Occupation | Male | Female |
| Healthcare Support | 154 (42.3%) | 210 (57.7%) |
| Security & Protection | 0 (0.0%) | 65 (100.0%) |
| Firefighting & Prevention | 0 (0.0%) | 48 (100.0%) |
| Law Enforcement | 0 (0.0%) | 17 (100.0%) |
| Food Preparation & Serving | 13 (28.3%) | 33 (71.7%) |
| Cleaning & Maintenance | 128 (48.3%) | 137 (51.7%) |
| Personal Care & Service | 43 (58.1%) | 31 (41.9%) |
| Total (Category) | 338 (41.5%) | 476 (58.5%) |
| Total (Overall) | 2,325 (59.2%) | 1,600 (40.8%) |
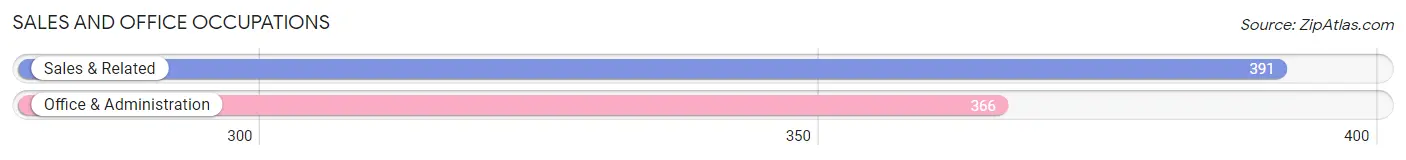
Sales and Office Occupations
The most common Sales and Office occupations in Lake Los Angeles are Sales & Related (391 | 10.0%), and Office & Administration (366 | 9.3%).
Sales and Office Occupations by Sex
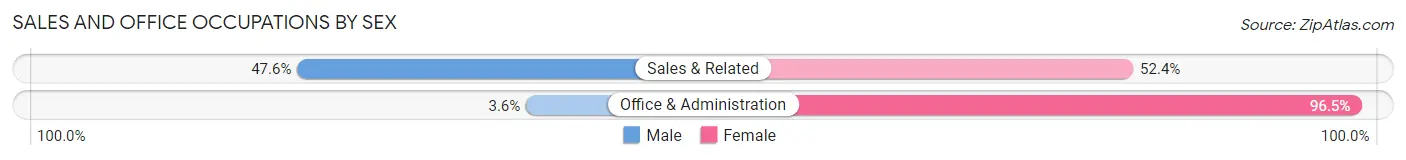
| Occupation | Male | Female |
| Sales & Related | 186 (47.6%) | 205 (52.4%) |
| Office & Administration | 13 (3.5%) | 353 (96.5%) |
| Total (Category) | 199 (26.3%) | 558 (73.7%) |
| Total (Overall) | 2,325 (59.2%) | 1,600 (40.8%) |
Natural Resources, Construction and Maintenance Occupations
The most common Natural Resources, Construction and Maintenance occupations in Lake Los Angeles are Construction & Extraction (494 | 12.6%), Installation, Maintenance & Repair (289 | 7.4%), and Farming, Fishing & Forestry (49 | 1.3%).
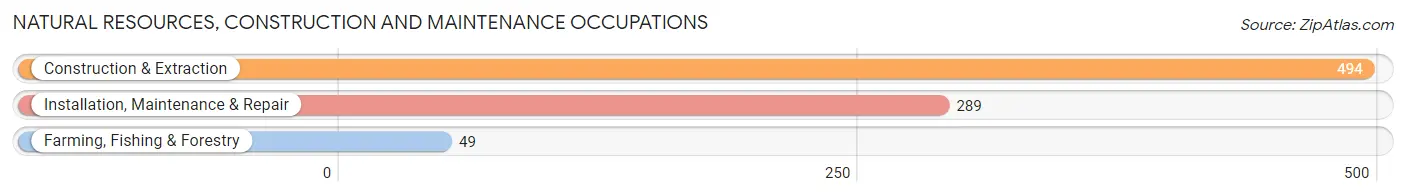
Natural Resources, Construction and Maintenance Occupations by Sex
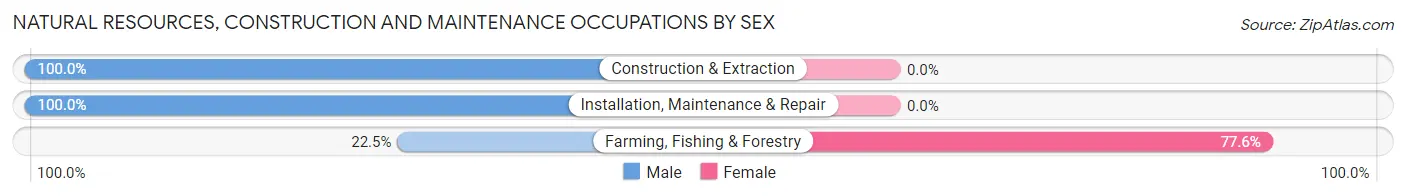
| Occupation | Male | Female |
| Farming, Fishing & Forestry | 11 (22.5%) | 38 (77.5%) |
| Construction & Extraction | 494 (100.0%) | 0 (0.0%) |
| Installation, Maintenance & Repair | 289 (100.0%) | 0 (0.0%) |
| Total (Category) | 794 (95.4%) | 38 (4.6%) |
| Total (Overall) | 2,325 (59.2%) | 1,600 (40.8%) |
Production, Transportation and Moving Occupations
The most common Production, Transportation and Moving occupations in Lake Los Angeles are Transportation (341 | 8.7%), Material Moving (151 | 3.8%), and Production (142 | 3.6%).
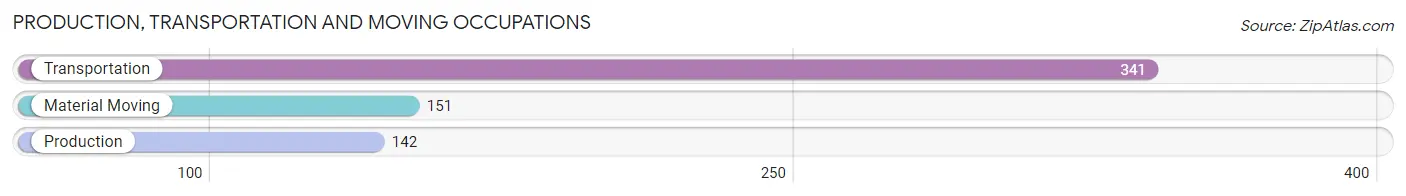
Production, Transportation and Moving Occupations by Sex
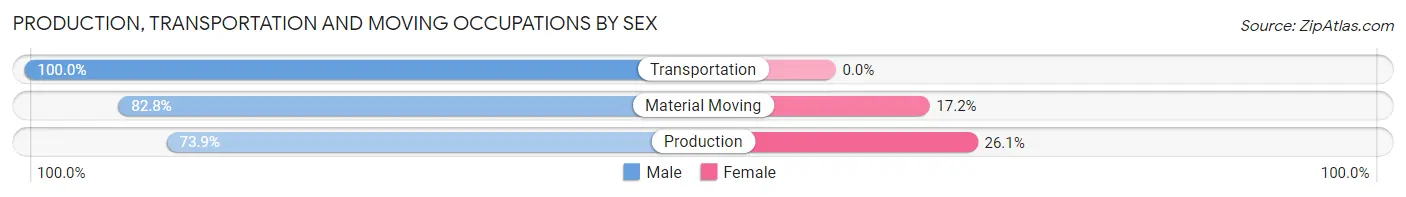
| Occupation | Male | Female |
| Production | 105 (73.9%) | 37 (26.1%) |
| Transportation | 341 (100.0%) | 0 (0.0%) |
| Material Moving | 125 (82.8%) | 26 (17.2%) |
| Total (Category) | 571 (90.1%) | 63 (9.9%) |
| Total (Overall) | 2,325 (59.2%) | 1,600 (40.8%) |
Employment Industries by Sex in Lake Los Angeles
Employment Industries in Lake Los Angeles
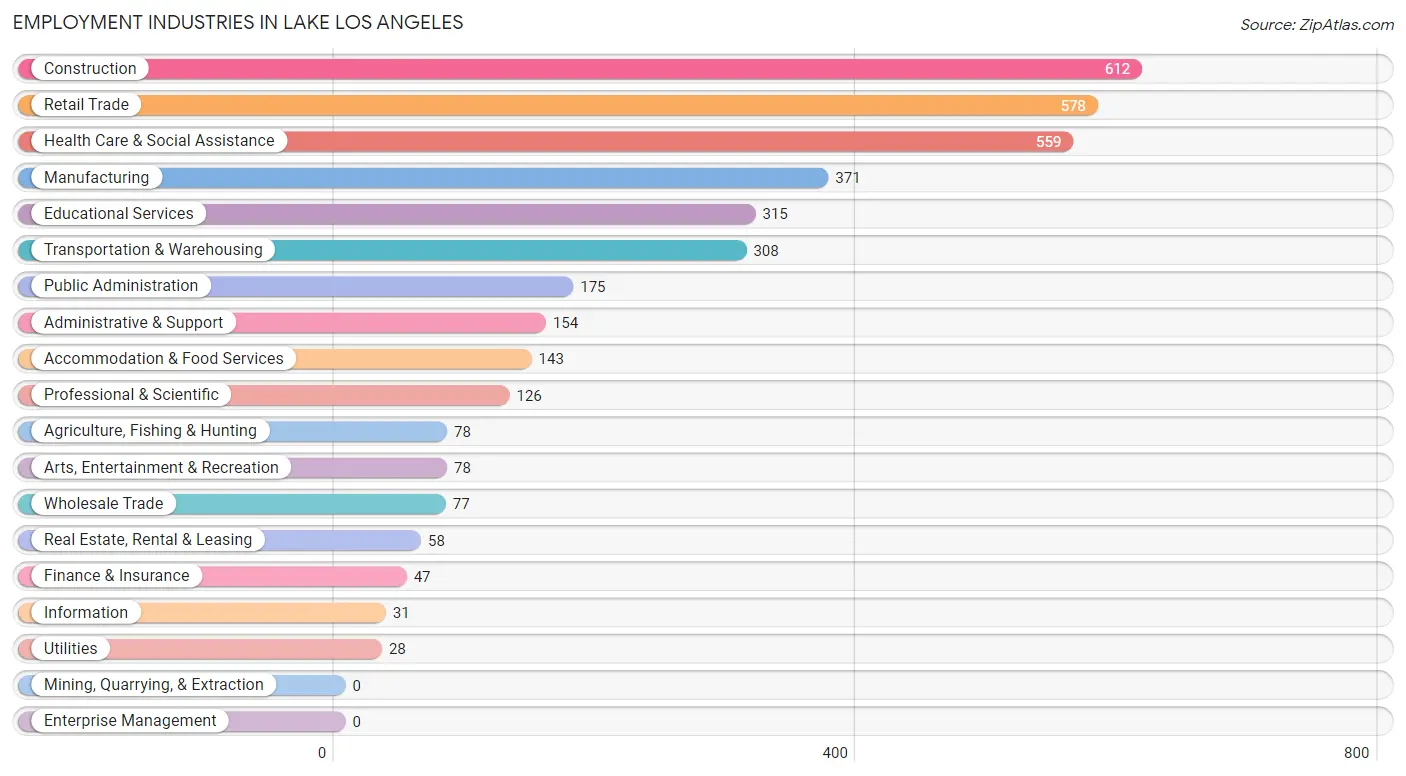
The major employment industries in Lake Los Angeles include Construction (612 | 15.6%), Retail Trade (578 | 14.7%), Health Care & Social Assistance (559 | 14.2%), Manufacturing (371 | 9.5%), and Educational Services (315 | 8.0%).
Employment Industries by Sex in Lake Los Angeles
The Lake Los Angeles industries that see more men than women are Utilities (100.0%), Real Estate, Rental & Leasing (100.0%), and Construction (98.5%), whereas the industries that tend to have a higher number of women are Information (100.0%), Finance & Insurance (80.8%), and Professional & Scientific (78.6%).
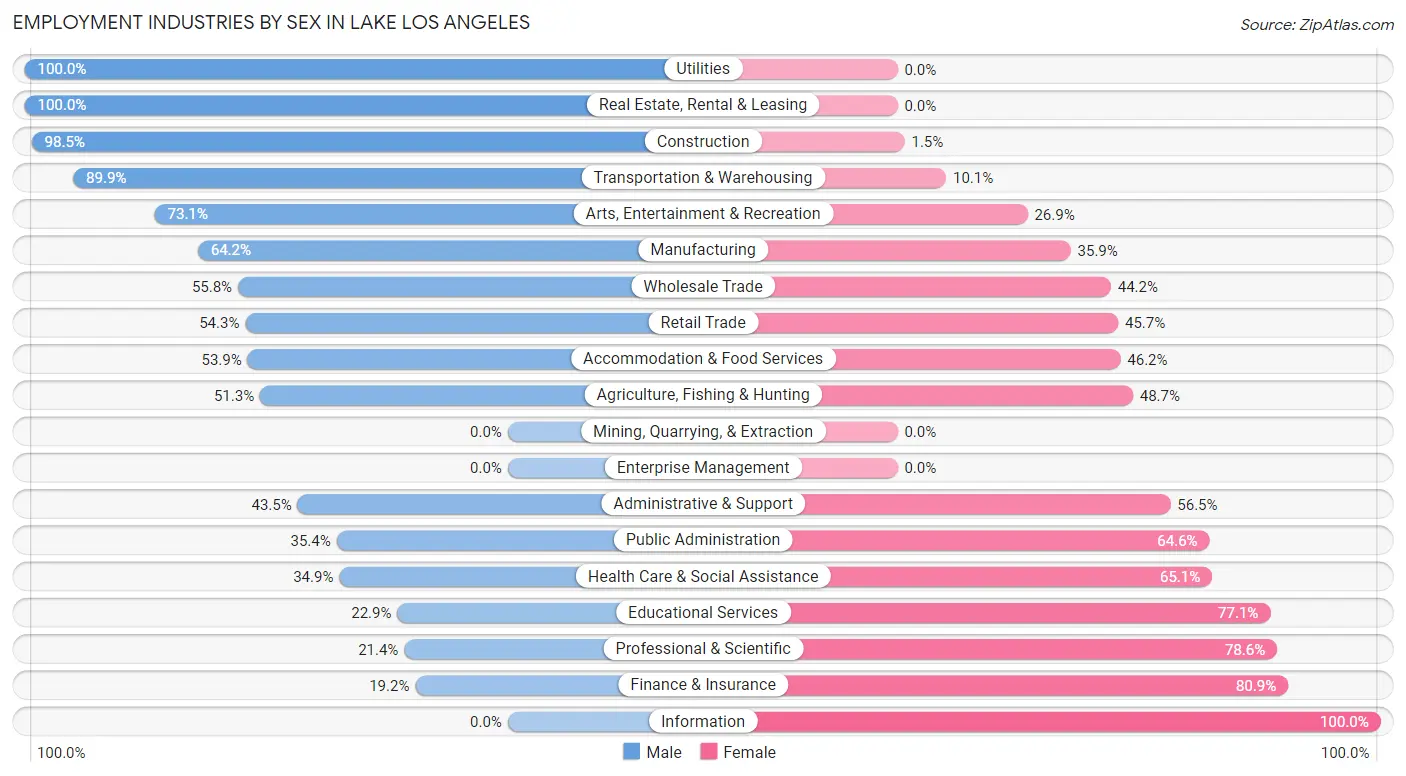
| Industry | Male | Female |
| Agriculture, Fishing & Hunting | 40 (51.3%) | 38 (48.7%) |
| Mining, Quarrying, & Extraction | 0 (0.0%) | 0 (0.0%) |
| Construction | 603 (98.5%) | 9 (1.5%) |
| Manufacturing | 238 (64.1%) | 133 (35.8%) |
| Wholesale Trade | 43 (55.8%) | 34 (44.2%) |
| Retail Trade | 314 (54.3%) | 264 (45.7%) |
| Transportation & Warehousing | 277 (89.9%) | 31 (10.1%) |
| Utilities | 28 (100.0%) | 0 (0.0%) |
| Information | 0 (0.0%) | 31 (100.0%) |
| Finance & Insurance | 9 (19.2%) | 38 (80.8%) |
| Real Estate, Rental & Leasing | 58 (100.0%) | 0 (0.0%) |
| Professional & Scientific | 27 (21.4%) | 99 (78.6%) |
| Enterprise Management | 0 (0.0%) | 0 (0.0%) |
| Administrative & Support | 67 (43.5%) | 87 (56.5%) |
| Educational Services | 72 (22.9%) | 243 (77.1%) |
| Health Care & Social Assistance | 195 (34.9%) | 364 (65.1%) |
| Arts, Entertainment & Recreation | 57 (73.1%) | 21 (26.9%) |
| Accommodation & Food Services | 77 (53.8%) | 66 (46.2%) |
| Public Administration | 62 (35.4%) | 113 (64.6%) |
| Total | 2,325 (59.2%) | 1,600 (40.8%) |
Education in Lake Los Angeles
School Enrollment in Lake Los Angeles
The most common levels of schooling among the 4,407 students in Lake Los Angeles are middle school (1,263 | 28.7%), elementary school (1,131 | 25.7%), and high school (1,124 | 25.5%).
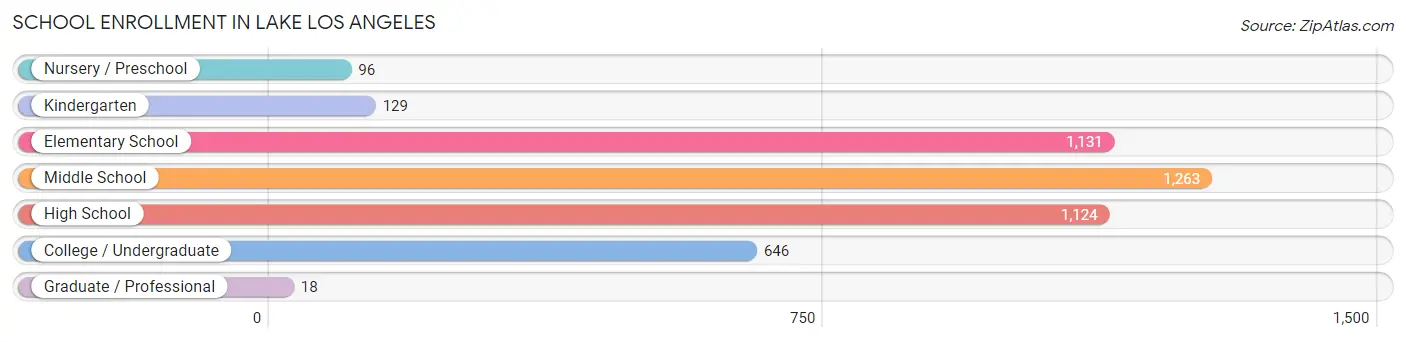
| School Level | # Students | % Students |
| Nursery / Preschool | 96 | 2.2% |
| Kindergarten | 129 | 2.9% |
| Elementary School | 1,131 | 25.7% |
| Middle School | 1,263 | 28.7% |
| High School | 1,124 | 25.5% |
| College / Undergraduate | 646 | 14.7% |
| Graduate / Professional | 18 | 0.4% |
| Total | 4,407 | 100.0% |
School Enrollment by Age by Funding Source in Lake Los Angeles
Out of a total of 4,407 students who are enrolled in schools in Lake Los Angeles, 247 (5.6%) attend a private institution, while the remaining 4,160 (94.4%) are enrolled in public schools. The age group of 35 years and over has the highest likelihood of being enrolled in private schools, with 38 (33.9% in the age bracket) enrolled. Conversely, the age group of 18 to 19 year olds has the lowest likelihood of being enrolled in a private school, with 219 (100.0% in the age bracket) attending a public institution.
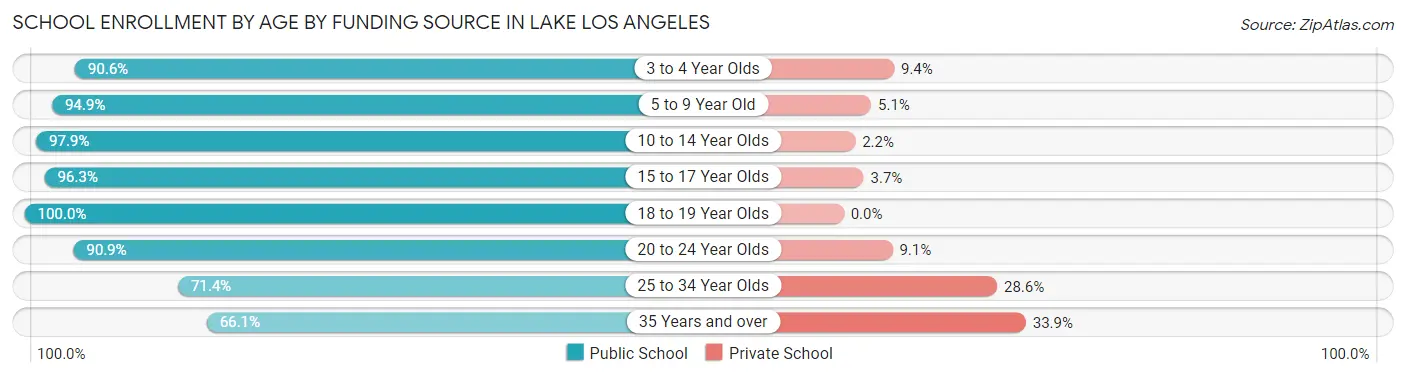
| Age Bracket | Public School | Private School |
| 3 to 4 Year Olds | 87 (90.6%) | 9 (9.4%) |
| 5 to 9 Year Old | 1,002 (94.9%) | 54 (5.1%) |
| 10 to 14 Year Olds | 1,596 (97.9%) | 35 (2.1%) |
| 15 to 17 Year Olds | 727 (96.3%) | 28 (3.7%) |
| 18 to 19 Year Olds | 219 (100.0%) | 0 (0.0%) |
| 20 to 24 Year Olds | 330 (90.9%) | 33 (9.1%) |
| 25 to 34 Year Olds | 125 (71.4%) | 50 (28.6%) |
| 35 Years and over | 74 (66.1%) | 38 (33.9%) |
| Total | 4,160 (94.4%) | 247 (5.6%) |
Educational Attainment by Field of Study in Lake Los Angeles
Business (195 | 20.9%), social sciences (100 | 10.7%), visual & performing arts (90 | 9.7%), liberal arts & history (81 | 8.7%), and science & technology (80 | 8.6%) are the most common fields of study among 933 individuals in Lake Los Angeles who have obtained a bachelor's degree or higher.
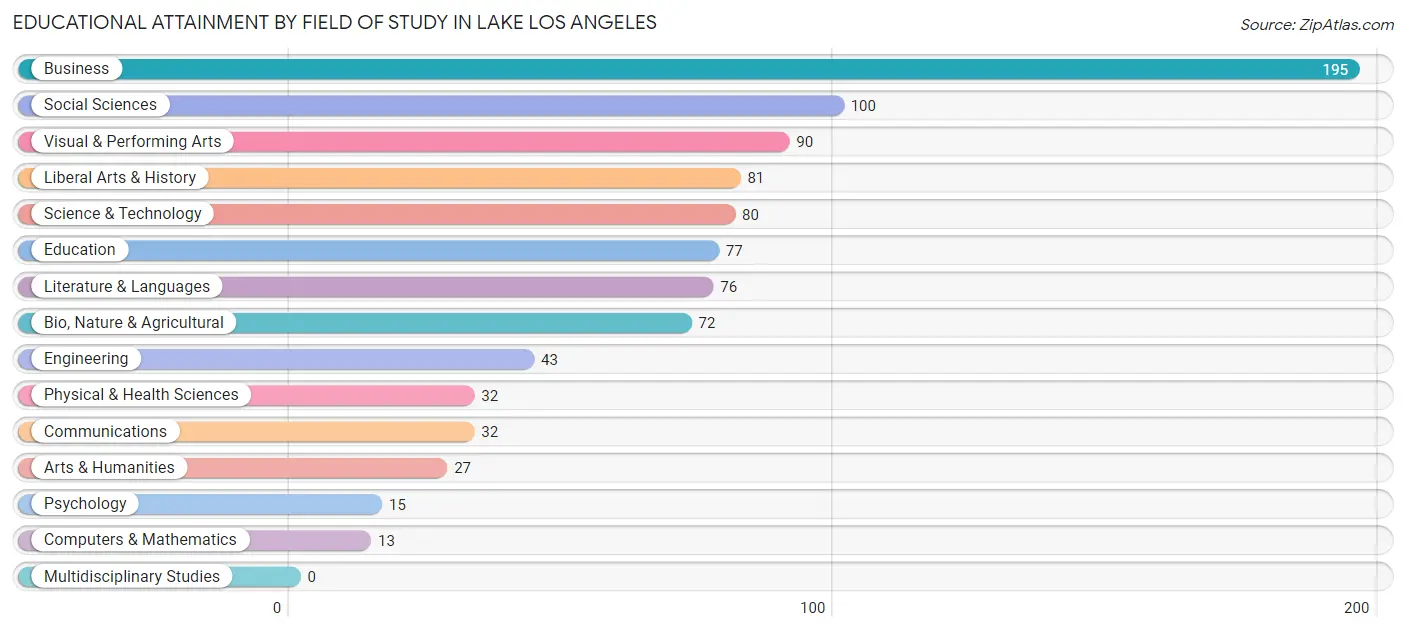
| Field of Study | # Graduates | % Graduates |
| Computers & Mathematics | 13 | 1.4% |
| Bio, Nature & Agricultural | 72 | 7.7% |
| Physical & Health Sciences | 32 | 3.4% |
| Psychology | 15 | 1.6% |
| Social Sciences | 100 | 10.7% |
| Engineering | 43 | 4.6% |
| Multidisciplinary Studies | 0 | 0.0% |
| Science & Technology | 80 | 8.6% |
| Business | 195 | 20.9% |
| Education | 77 | 8.3% |
| Literature & Languages | 76 | 8.2% |
| Liberal Arts & History | 81 | 8.7% |
| Visual & Performing Arts | 90 | 9.7% |
| Communications | 32 | 3.4% |
| Arts & Humanities | 27 | 2.9% |
| Total | 933 | 100.0% |
Transportation & Commute in Lake Los Angeles
Vehicle Availability by Sex in Lake Los Angeles
The most prevalent vehicle ownership categories in Lake Los Angeles are males with 3 vehicles (785, accounting for 34.4%) and females with 3 vehicles (525, making up 51.1%).
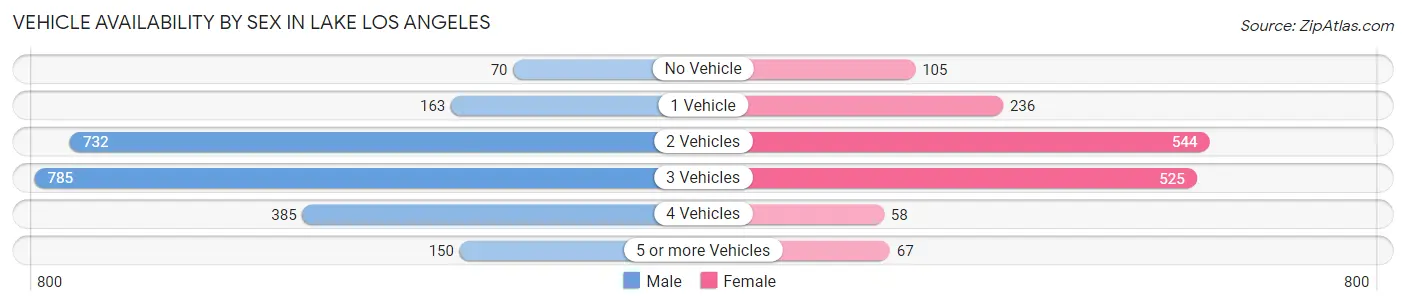
| Vehicles Available | Male | Female |
| No Vehicle | 70 (3.1%) | 105 (6.8%) |
| 1 Vehicle | 163 (7.1%) | 236 (15.4%) |
| 2 Vehicles | 732 (32.0%) | 544 (35.4%) |
| 3 Vehicles | 785 (34.4%) | 525 (34.2%) |
| 4 Vehicles | 385 (16.9%) | 58 (3.8%) |
| 5 or more Vehicles | 150 (6.6%) | 67 (4.4%) |
| Total | 2,285 (100.0%) | 1,535 (100.0%) |
Commute Time in Lake Los Angeles
The most frequently occuring commute durations in Lake Los Angeles are 30 to 34 minutes (745 commuters, 21.4%), 90 or more minutes (584 commuters, 16.8%), and 60 to 89 minutes (483 commuters, 13.9%).
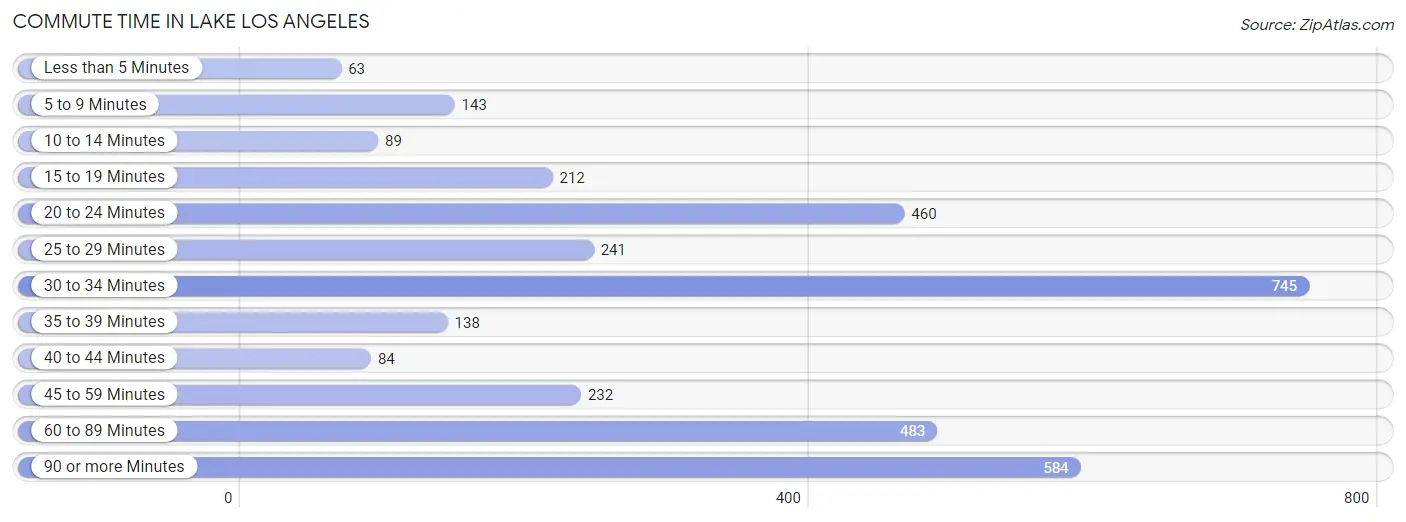
| Commute Time | # Commuters | % Commuters |
| Less than 5 Minutes | 63 | 1.8% |
| 5 to 9 Minutes | 143 | 4.1% |
| 10 to 14 Minutes | 89 | 2.6% |
| 15 to 19 Minutes | 212 | 6.1% |
| 20 to 24 Minutes | 460 | 13.2% |
| 25 to 29 Minutes | 241 | 6.9% |
| 30 to 34 Minutes | 745 | 21.4% |
| 35 to 39 Minutes | 138 | 4.0% |
| 40 to 44 Minutes | 84 | 2.4% |
| 45 to 59 Minutes | 232 | 6.7% |
| 60 to 89 Minutes | 483 | 13.9% |
| 90 or more Minutes | 584 | 16.8% |
Commute Time by Sex in Lake Los Angeles
The most common commute times in Lake Los Angeles are 60 to 89 minutes (405 commuters, 19.1%) for males and 30 to 34 minutes (395 commuters, 29.3%) for females.
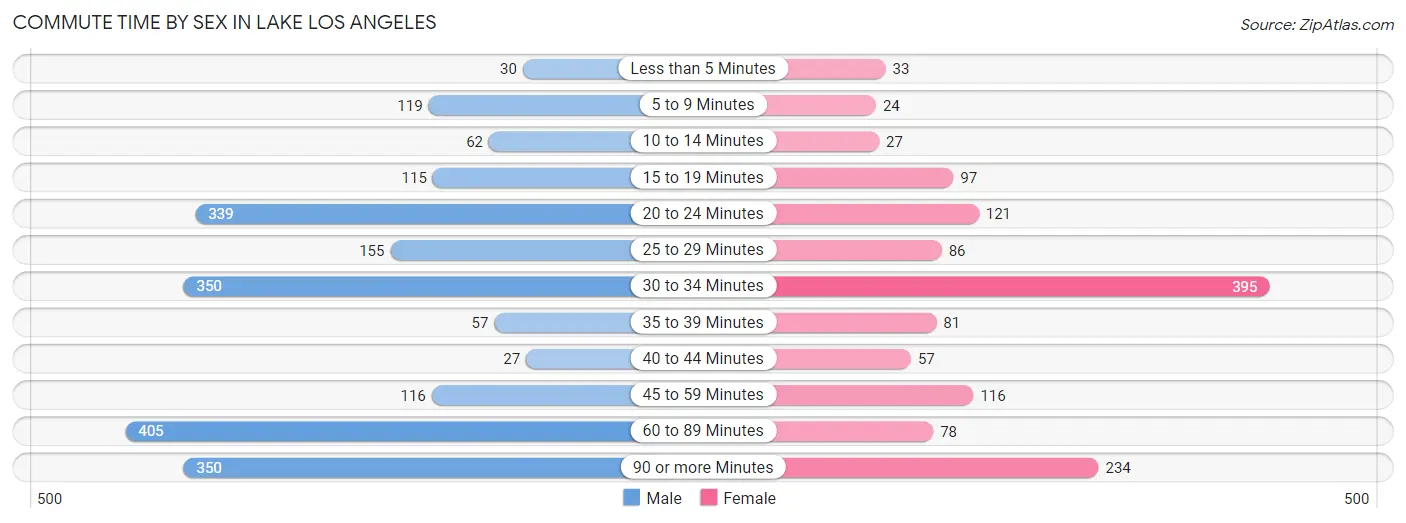
| Commute Time | Male | Female |
| Less than 5 Minutes | 30 (1.4%) | 33 (2.5%) |
| 5 to 9 Minutes | 119 (5.6%) | 24 (1.8%) |
| 10 to 14 Minutes | 62 (2.9%) | 27 (2.0%) |
| 15 to 19 Minutes | 115 (5.4%) | 97 (7.2%) |
| 20 to 24 Minutes | 339 (16.0%) | 121 (9.0%) |
| 25 to 29 Minutes | 155 (7.3%) | 86 (6.4%) |
| 30 to 34 Minutes | 350 (16.5%) | 395 (29.3%) |
| 35 to 39 Minutes | 57 (2.7%) | 81 (6.0%) |
| 40 to 44 Minutes | 27 (1.3%) | 57 (4.2%) |
| 45 to 59 Minutes | 116 (5.5%) | 116 (8.6%) |
| 60 to 89 Minutes | 405 (19.1%) | 78 (5.8%) |
| 90 or more Minutes | 350 (16.5%) | 234 (17.3%) |
Time of Departure to Work by Sex in Lake Los Angeles
The most frequent times of departure to work in Lake Los Angeles are 7:00 AM to 7:29 AM (480, 22.6%) for males and 7:00 AM to 7:29 AM (233, 17.3%) for females.
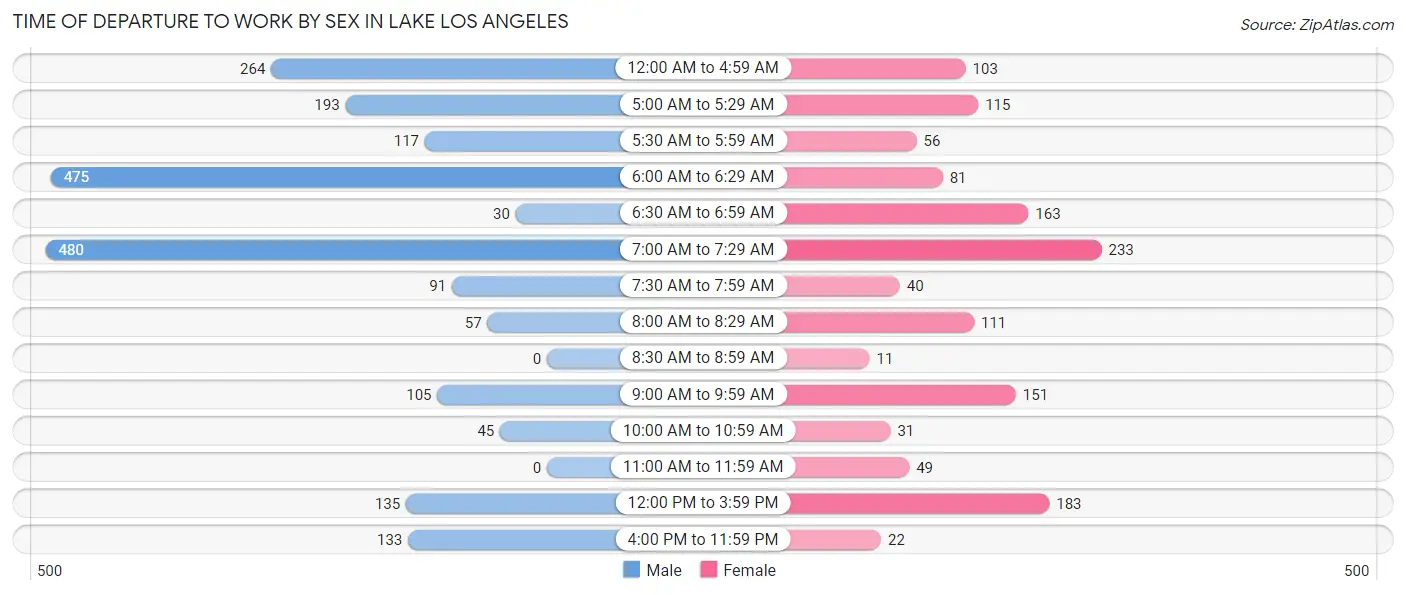
| Time of Departure | Male | Female |
| 12:00 AM to 4:59 AM | 264 (12.4%) | 103 (7.6%) |
| 5:00 AM to 5:29 AM | 193 (9.1%) | 115 (8.5%) |
| 5:30 AM to 5:59 AM | 117 (5.5%) | 56 (4.2%) |
| 6:00 AM to 6:29 AM | 475 (22.4%) | 81 (6.0%) |
| 6:30 AM to 6:59 AM | 30 (1.4%) | 163 (12.1%) |
| 7:00 AM to 7:29 AM | 480 (22.6%) | 233 (17.3%) |
| 7:30 AM to 7:59 AM | 91 (4.3%) | 40 (3.0%) |
| 8:00 AM to 8:29 AM | 57 (2.7%) | 111 (8.2%) |
| 8:30 AM to 8:59 AM | 0 (0.0%) | 11 (0.8%) |
| 9:00 AM to 9:59 AM | 105 (4.9%) | 151 (11.2%) |
| 10:00 AM to 10:59 AM | 45 (2.1%) | 31 (2.3%) |
| 11:00 AM to 11:59 AM | 0 (0.0%) | 49 (3.6%) |
| 12:00 PM to 3:59 PM | 135 (6.4%) | 183 (13.6%) |
| 4:00 PM to 11:59 PM | 133 (6.3%) | 22 (1.6%) |
| Total | 2,125 (100.0%) | 1,349 (100.0%) |
Housing Occupancy in Lake Los Angeles
Occupancy by Ownership in Lake Los Angeles
Of the total 3,511 dwellings in Lake Los Angeles, owner-occupied units account for 2,424 (69.0%), while renter-occupied units make up 1,087 (31.0%).
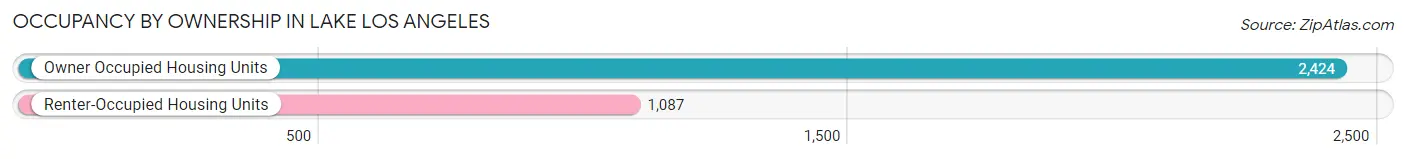
| Occupancy | # Housing Units | % Housing Units |
| Owner Occupied Housing Units | 2,424 | 69.0% |
| Renter-Occupied Housing Units | 1,087 | 31.0% |
| Total Occupied Housing Units | 3,511 | 100.0% |
Occupancy by Household Size in Lake Los Angeles
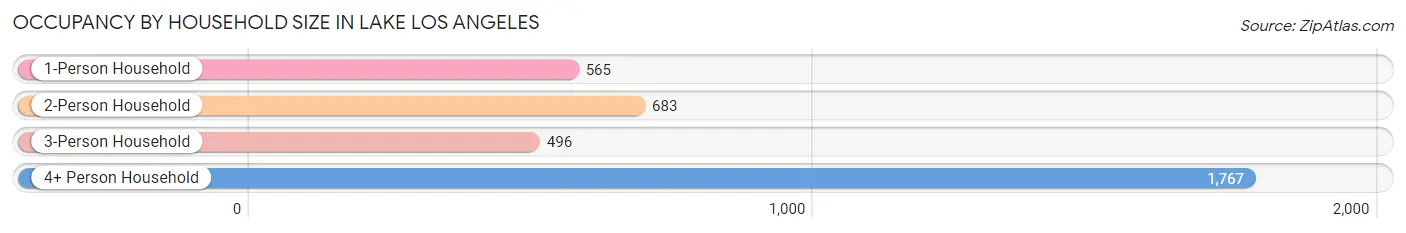
| Household Size | # Housing Units | % Housing Units |
| 1-Person Household | 565 | 16.1% |
| 2-Person Household | 683 | 19.5% |
| 3-Person Household | 496 | 14.1% |
| 4+ Person Household | 1,767 | 50.3% |
| Total Housing Units | 3,511 | 100.0% |
Occupancy by Ownership by Household Size in Lake Los Angeles
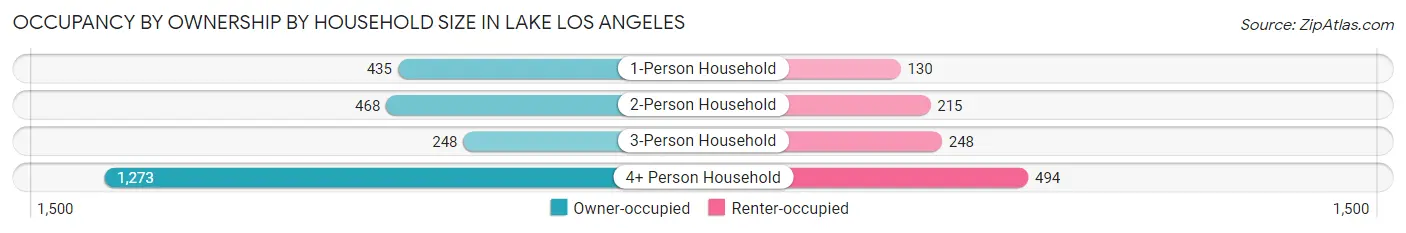
| Household Size | Owner-occupied | Renter-occupied |
| 1-Person Household | 435 (77.0%) | 130 (23.0%) |
| 2-Person Household | 468 (68.5%) | 215 (31.5%) |
| 3-Person Household | 248 (50.0%) | 248 (50.0%) |
| 4+ Person Household | 1,273 (72.0%) | 494 (28.0%) |
| Total Housing Units | 2,424 (69.0%) | 1,087 (31.0%) |
Occupancy by Educational Attainment in Lake Los Angeles
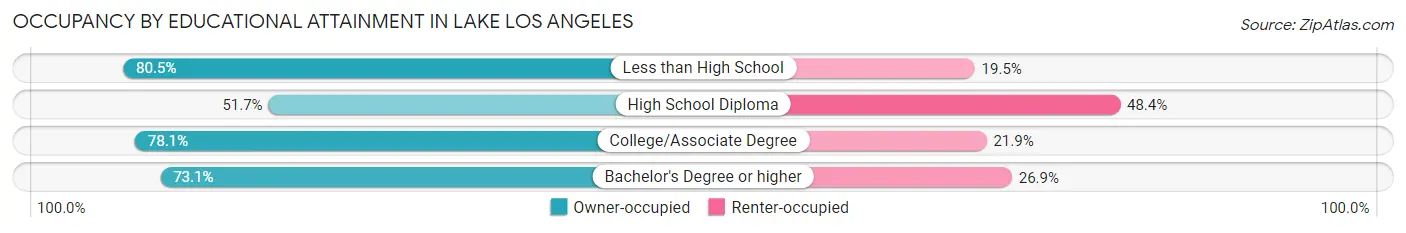
| Household Size | Owner-occupied | Renter-occupied |
| Less than High School | 725 (80.5%) | 176 (19.5%) |
| High School Diploma | 626 (51.6%) | 586 (48.3%) |
| College/Associate Degree | 793 (78.1%) | 222 (21.9%) |
| Bachelor's Degree or higher | 280 (73.1%) | 103 (26.9%) |
Occupancy by Age of Householder in Lake Los Angeles
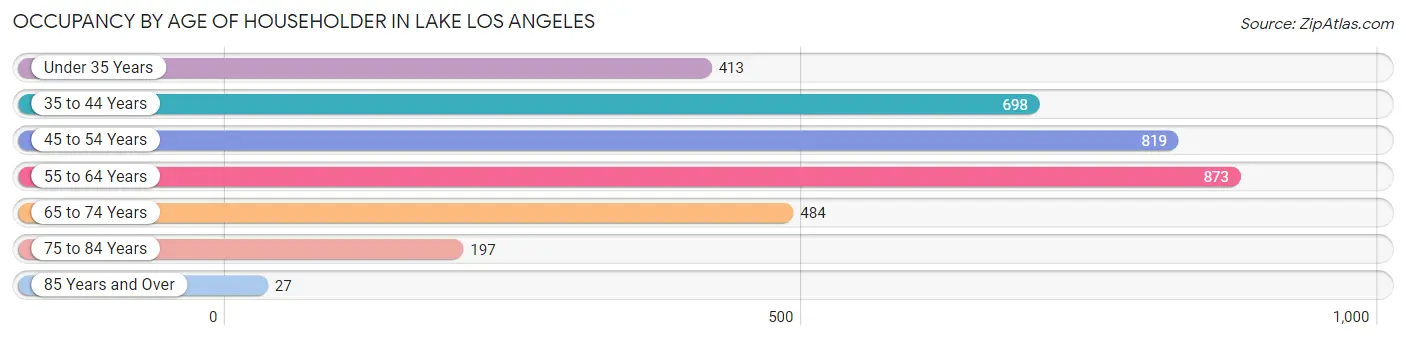
| Age Bracket | # Households | % Households |
| Under 35 Years | 413 | 11.8% |
| 35 to 44 Years | 698 | 19.9% |
| 45 to 54 Years | 819 | 23.3% |
| 55 to 64 Years | 873 | 24.9% |
| 65 to 74 Years | 484 | 13.8% |
| 75 to 84 Years | 197 | 5.6% |
| 85 Years and Over | 27 | 0.8% |
| Total | 3,511 | 100.0% |
Housing Finances in Lake Los Angeles
Median Income by Occupancy in Lake Los Angeles
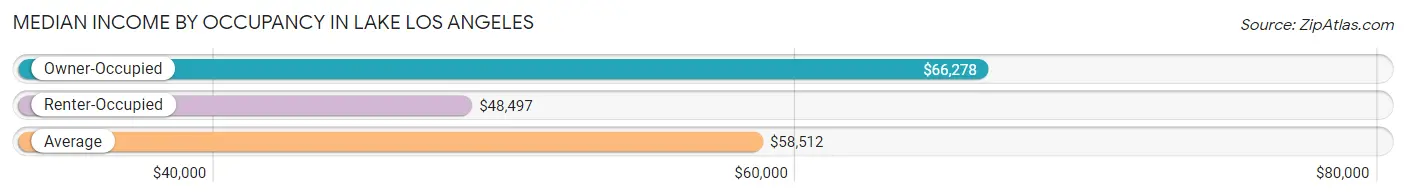
| Occupancy Type | # Households | Median Income |
| Owner-Occupied | 2,424 (69.0%) | $66,278 |
| Renter-Occupied | 1,087 (31.0%) | $48,497 |
| Average | 3,511 (100.0%) | $58,512 |
Occupancy by Householder Income Bracket in Lake Los Angeles
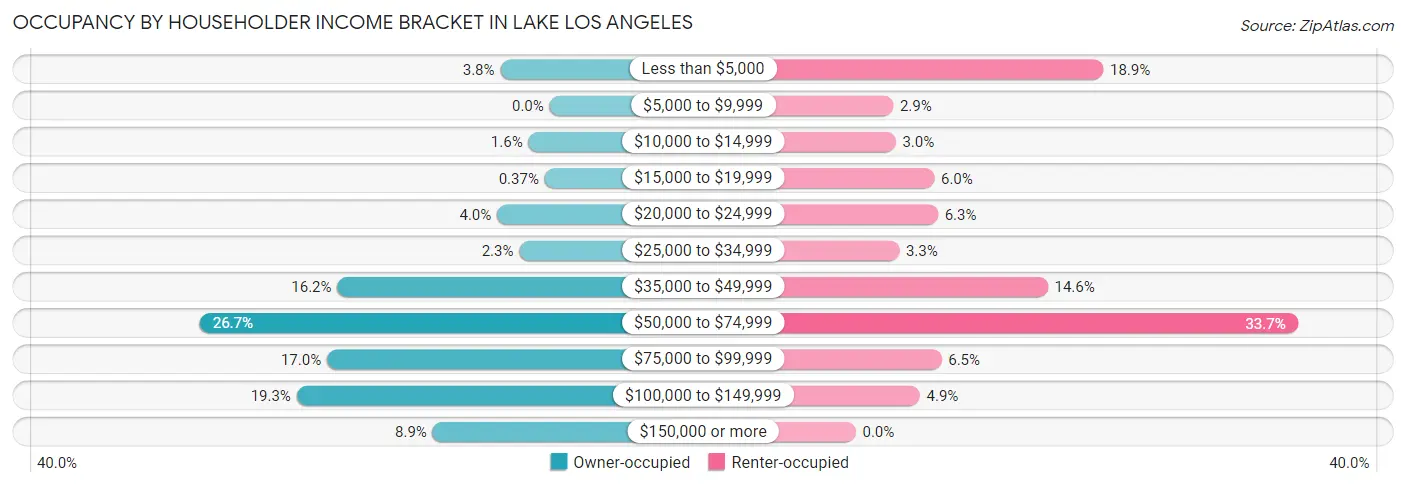
| Income Bracket | Owner-occupied | Renter-occupied |
| Less than $5,000 | 91 (3.7%) | 205 (18.9%) |
| $5,000 to $9,999 | 0 (0.0%) | 31 (2.9%) |
| $10,000 to $14,999 | 39 (1.6%) | 33 (3.0%) |
| $15,000 to $19,999 | 9 (0.4%) | 65 (6.0%) |
| $20,000 to $24,999 | 97 (4.0%) | 68 (6.3%) |
| $25,000 to $34,999 | 56 (2.3%) | 36 (3.3%) |
| $35,000 to $49,999 | 392 (16.2%) | 159 (14.6%) |
| $50,000 to $74,999 | 646 (26.7%) | 366 (33.7%) |
| $75,000 to $99,999 | 411 (17.0%) | 71 (6.5%) |
| $100,000 to $149,999 | 467 (19.3%) | 53 (4.9%) |
| $150,000 or more | 216 (8.9%) | 0 (0.0%) |
| Total | 2,424 (100.0%) | 1,087 (100.0%) |
Monthly Housing Cost Tiers in Lake Los Angeles
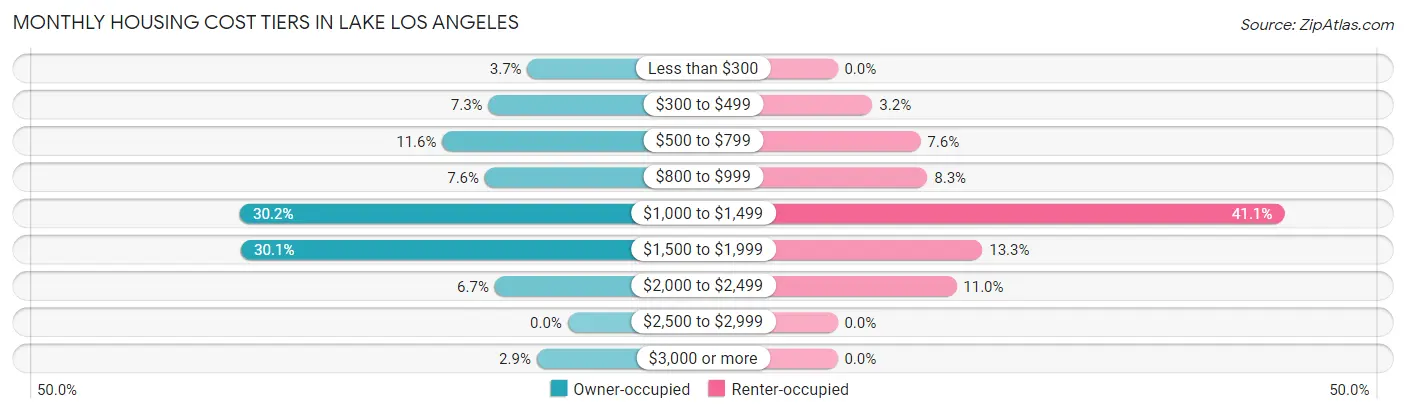
| Monthly Cost | Owner-occupied | Renter-occupied |
| Less than $300 | 90 (3.7%) | 0 (0.0%) |
| $300 to $499 | 177 (7.3%) | 35 (3.2%) |
| $500 to $799 | 280 (11.6%) | 83 (7.6%) |
| $800 to $999 | 185 (7.6%) | 90 (8.3%) |
| $1,000 to $1,499 | 731 (30.2%) | 447 (41.1%) |
| $1,500 to $1,999 | 729 (30.1%) | 145 (13.3%) |
| $2,000 to $2,499 | 163 (6.7%) | 119 (11.0%) |
| $2,500 to $2,999 | 0 (0.0%) | 0 (0.0%) |
| $3,000 or more | 69 (2.9%) | 0 (0.0%) |
| Total | 2,424 (100.0%) | 1,087 (100.0%) |
Physical Housing Characteristics in Lake Los Angeles
Housing Structures in Lake Los Angeles
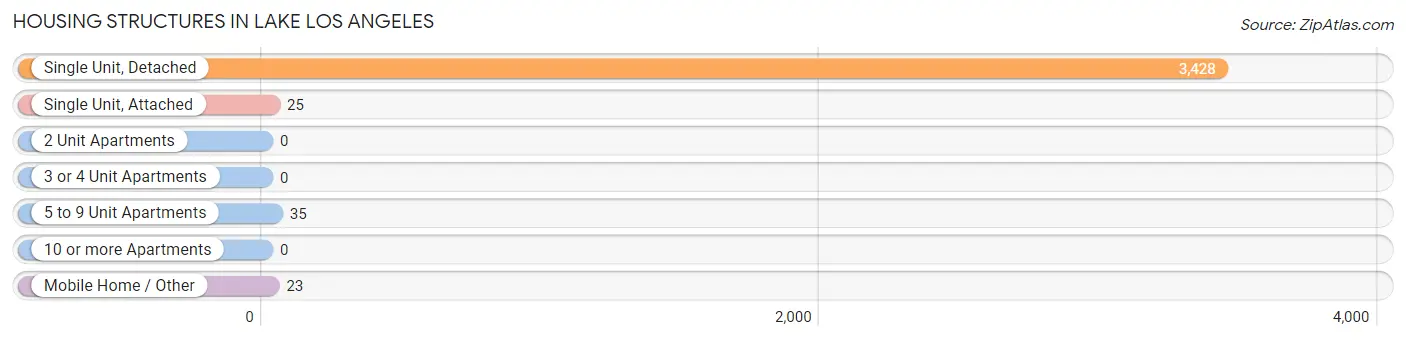
| Structure Type | # Housing Units | % Housing Units |
| Single Unit, Detached | 3,428 | 97.6% |
| Single Unit, Attached | 25 | 0.7% |
| 2 Unit Apartments | 0 | 0.0% |
| 3 or 4 Unit Apartments | 0 | 0.0% |
| 5 to 9 Unit Apartments | 35 | 1.0% |
| 10 or more Apartments | 0 | 0.0% |
| Mobile Home / Other | 23 | 0.7% |
| Total | 3,511 | 100.0% |
Housing Structures by Occupancy in Lake Los Angeles
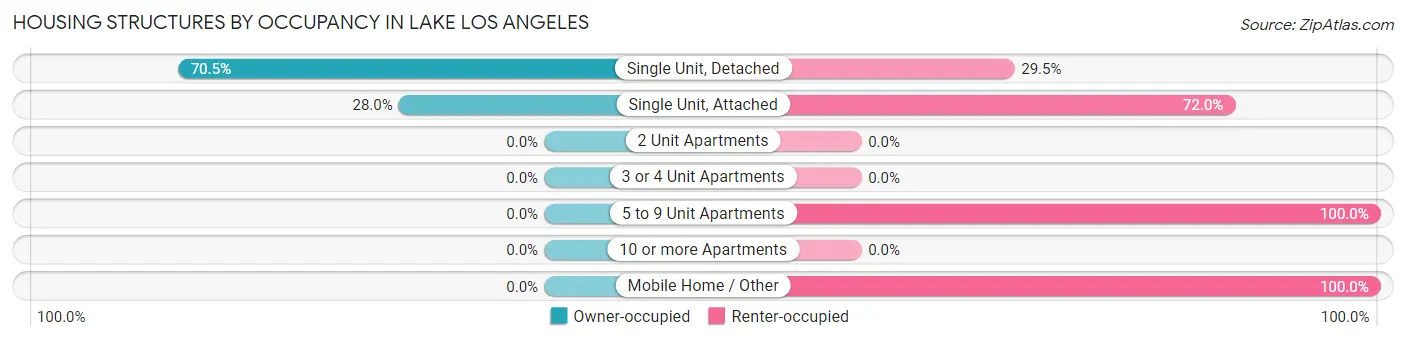
| Structure Type | Owner-occupied | Renter-occupied |
| Single Unit, Detached | 2,417 (70.5%) | 1,011 (29.5%) |
| Single Unit, Attached | 7 (28.0%) | 18 (72.0%) |
| 2 Unit Apartments | 0 (0.0%) | 0 (0.0%) |
| 3 or 4 Unit Apartments | 0 (0.0%) | 0 (0.0%) |
| 5 to 9 Unit Apartments | 0 (0.0%) | 35 (100.0%) |
| 10 or more Apartments | 0 (0.0%) | 0 (0.0%) |
| Mobile Home / Other | 0 (0.0%) | 23 (100.0%) |
| Total | 2,424 (69.0%) | 1,087 (31.0%) |
Housing Structures by Number of Rooms in Lake Los Angeles
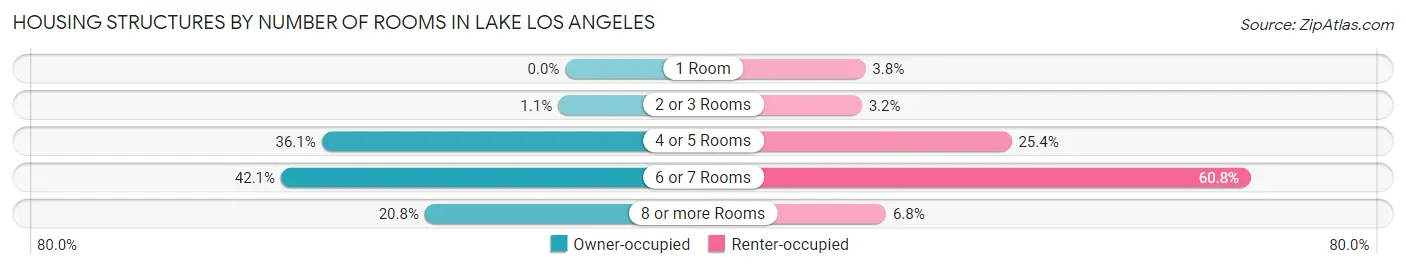
| Number of Rooms | Owner-occupied | Renter-occupied |
| 1 Room | 0 (0.0%) | 41 (3.8%) |
| 2 or 3 Rooms | 26 (1.1%) | 35 (3.2%) |
| 4 or 5 Rooms | 874 (36.1%) | 276 (25.4%) |
| 6 or 7 Rooms | 1,020 (42.1%) | 661 (60.8%) |
| 8 or more Rooms | 504 (20.8%) | 74 (6.8%) |
| Total | 2,424 (100.0%) | 1,087 (100.0%) |
Housing Structure by Heating Type in Lake Los Angeles
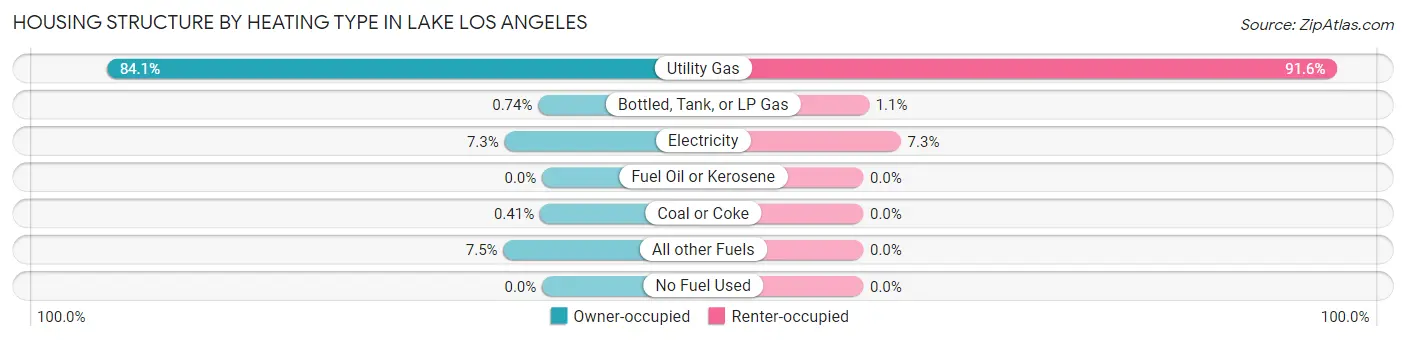
| Heating Type | Owner-occupied | Renter-occupied |
| Utility Gas | 2,039 (84.1%) | 996 (91.6%) |
| Bottled, Tank, or LP Gas | 18 (0.7%) | 12 (1.1%) |
| Electricity | 176 (7.3%) | 79 (7.3%) |
| Fuel Oil or Kerosene | 0 (0.0%) | 0 (0.0%) |
| Coal or Coke | 10 (0.4%) | 0 (0.0%) |
| All other Fuels | 181 (7.5%) | 0 (0.0%) |
| No Fuel Used | 0 (0.0%) | 0 (0.0%) |
| Total | 2,424 (100.0%) | 1,087 (100.0%) |
Household Vehicle Usage in Lake Los Angeles
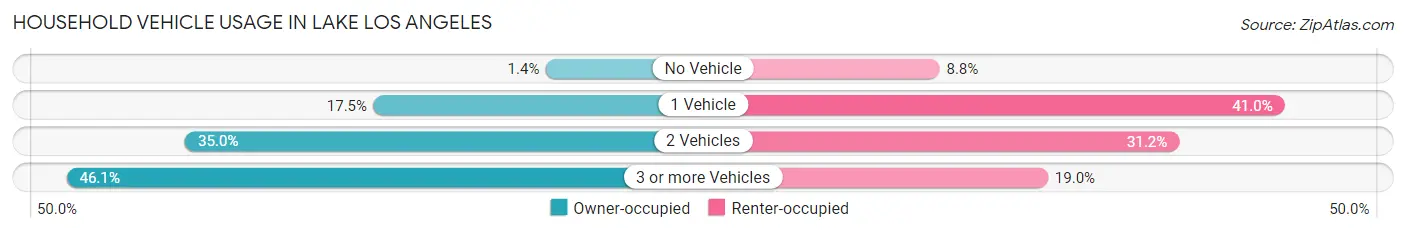
| Vehicles per Household | Owner-occupied | Renter-occupied |
| No Vehicle | 34 (1.4%) | 96 (8.8%) |
| 1 Vehicle | 424 (17.5%) | 446 (41.0%) |
| 2 Vehicles | 849 (35.0%) | 339 (31.2%) |
| 3 or more Vehicles | 1,117 (46.1%) | 206 (19.0%) |
| Total | 2,424 (100.0%) | 1,087 (100.0%) |
Real Estate & Mortgages in Lake Los Angeles
Real Estate and Mortgage Overview in Lake Los Angeles
| Characteristic | Without Mortgage | With Mortgage |
| Housing Units | 521 | 1,903 |
| Median Property Value | $269,200 | $257,100 |
| Median Household Income | $52,731 | $163 |
| Monthly Housing Costs | $495 | $69 |
| Real Estate Taxes | $1,944 | $0 |
Property Value by Mortgage Status in Lake Los Angeles
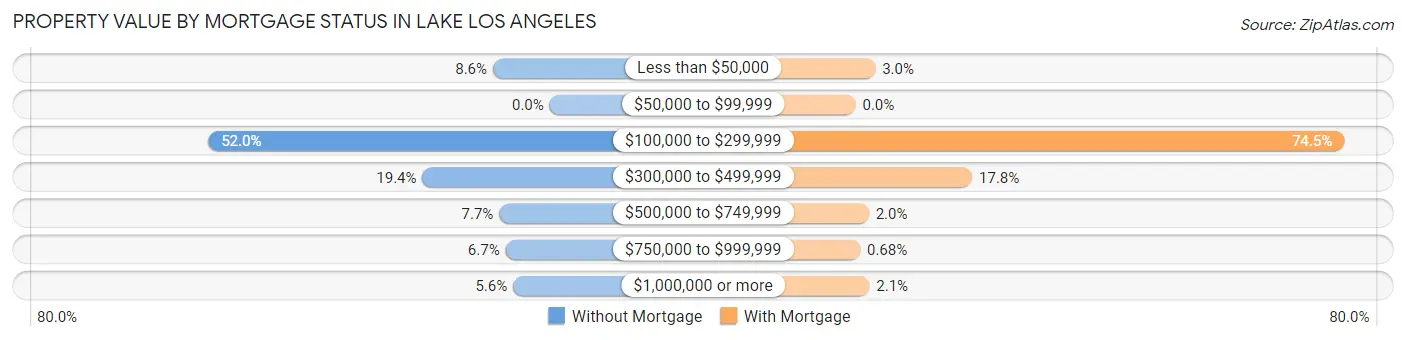
| Property Value | Without Mortgage | With Mortgage |
| Less than $50,000 | 45 (8.6%) | 57 (3.0%) |
| $50,000 to $99,999 | 0 (0.0%) | 0 (0.0%) |
| $100,000 to $299,999 | 271 (52.0%) | 1,417 (74.5%) |
| $300,000 to $499,999 | 101 (19.4%) | 338 (17.8%) |
| $500,000 to $749,999 | 40 (7.7%) | 38 (2.0%) |
| $750,000 to $999,999 | 35 (6.7%) | 13 (0.7%) |
| $1,000,000 or more | 29 (5.6%) | 40 (2.1%) |
| Total | 521 (100.0%) | 1,903 (100.0%) |
Household Income by Mortgage Status in Lake Los Angeles
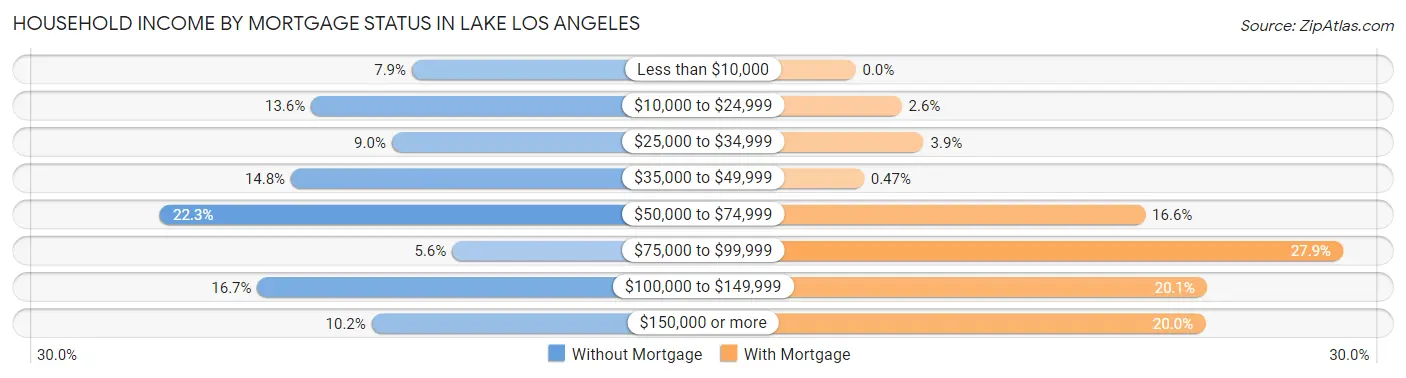
| Household Income | Without Mortgage | With Mortgage |
| Less than $10,000 | 41 (7.9%) | 0 (0.0%) |
| $10,000 to $24,999 | 71 (13.6%) | 50 (2.6%) |
| $25,000 to $34,999 | 47 (9.0%) | 74 (3.9%) |
| $35,000 to $49,999 | 77 (14.8%) | 9 (0.5%) |
| $50,000 to $74,999 | 116 (22.3%) | 315 (16.6%) |
| $75,000 to $99,999 | 29 (5.6%) | 530 (27.9%) |
| $100,000 to $149,999 | 87 (16.7%) | 382 (20.1%) |
| $150,000 or more | 53 (10.2%) | 380 (20.0%) |
| Total | 521 (100.0%) | 1,903 (100.0%) |
Property Value to Household Income Ratio in Lake Los Angeles
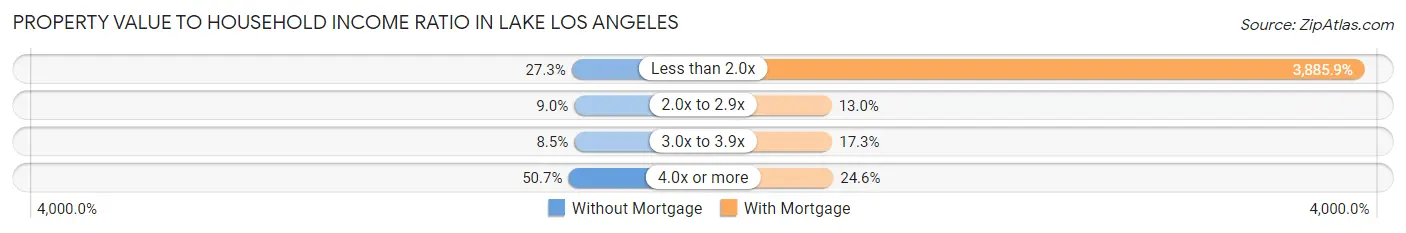
| Value-to-Income Ratio | Without Mortgage | With Mortgage |
| Less than 2.0x | 142 (27.3%) | 73,948 (3,885.9%) |
| 2.0x to 2.9x | 47 (9.0%) | 247 (13.0%) |
| 3.0x to 3.9x | 44 (8.5%) | 329 (17.3%) |
| 4.0x or more | 264 (50.7%) | 468 (24.6%) |
| Total | 521 (100.0%) | 1,903 (100.0%) |
Real Estate Taxes by Mortgage Status in Lake Los Angeles
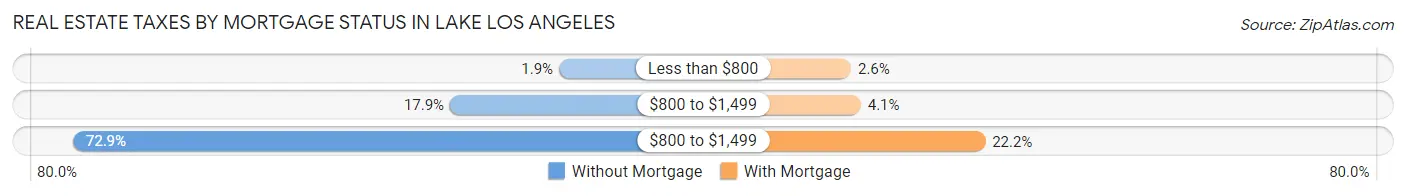
| Property Taxes | Without Mortgage | With Mortgage |
| Less than $800 | 10 (1.9%) | 50 (2.6%) |
| $800 to $1,499 | 93 (17.8%) | 77 (4.1%) |
| $800 to $1,499 | 380 (72.9%) | 423 (22.2%) |
| Total | 521 (100.0%) | 1,903 (100.0%) |
Health & Disability in Lake Los Angeles
Health Insurance Coverage by Age in Lake Los Angeles
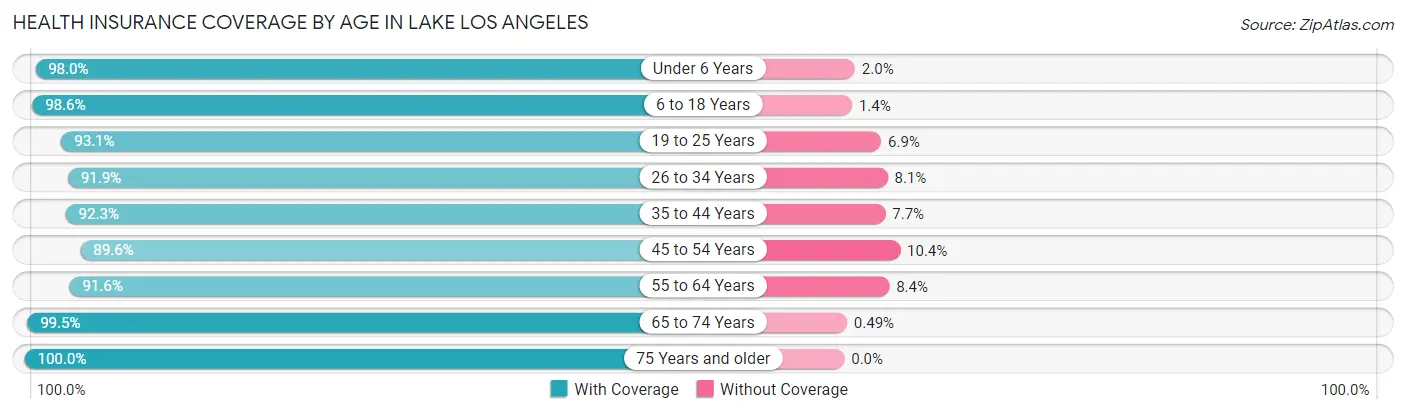
| Age Bracket | With Coverage | Without Coverage |
| Under 6 Years | 992 (98.0%) | 20 (2.0%) |
| 6 to 18 Years | 3,449 (98.6%) | 50 (1.4%) |
| 19 to 25 Years | 951 (93.1%) | 70 (6.9%) |
| 26 to 34 Years | 1,218 (91.9%) | 107 (8.1%) |
| 35 to 44 Years | 1,543 (92.3%) | 128 (7.7%) |
| 45 to 54 Years | 1,514 (89.6%) | 176 (10.4%) |
| 55 to 64 Years | 1,422 (91.6%) | 130 (8.4%) |
| 65 to 74 Years | 814 (99.5%) | 4 (0.5%) |
| 75 Years and older | 498 (100.0%) | 0 (0.0%) |
| Total | 12,401 (94.8%) | 685 (5.2%) |
Health Insurance Coverage by Citizenship Status in Lake Los Angeles
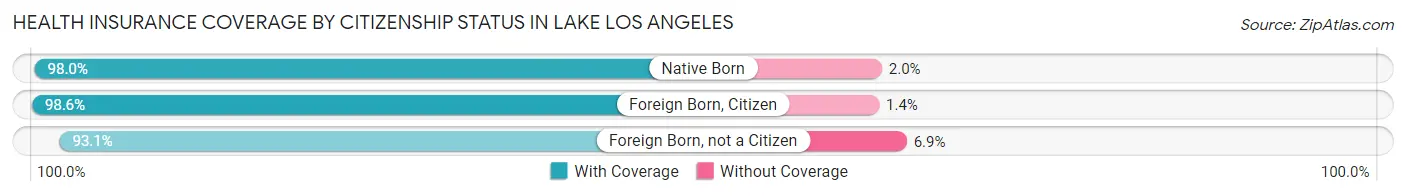
| Citizenship Status | With Coverage | Without Coverage |
| Native Born | 992 (98.0%) | 20 (2.0%) |
| Foreign Born, Citizen | 3,449 (98.6%) | 50 (1.4%) |
| Foreign Born, not a Citizen | 951 (93.1%) | 70 (6.9%) |
Health Insurance Coverage by Household Income in Lake Los Angeles
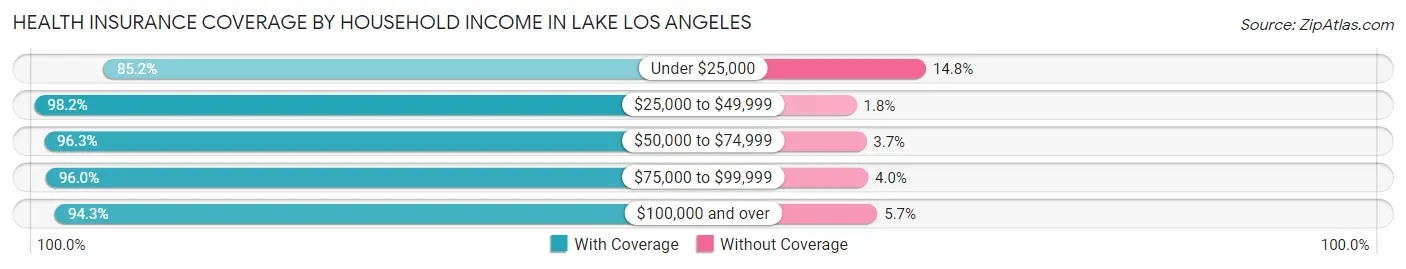
| Household Income | With Coverage | Without Coverage |
| Under $25,000 | 1,337 (85.2%) | 233 (14.8%) |
| $25,000 to $49,999 | 2,304 (98.2%) | 43 (1.8%) |
| $50,000 to $74,999 | 3,677 (96.3%) | 140 (3.7%) |
| $75,000 to $99,999 | 1,900 (96.0%) | 79 (4.0%) |
| $100,000 and over | 3,135 (94.3%) | 190 (5.7%) |
Public vs Private Health Insurance Coverage by Age in Lake Los Angeles
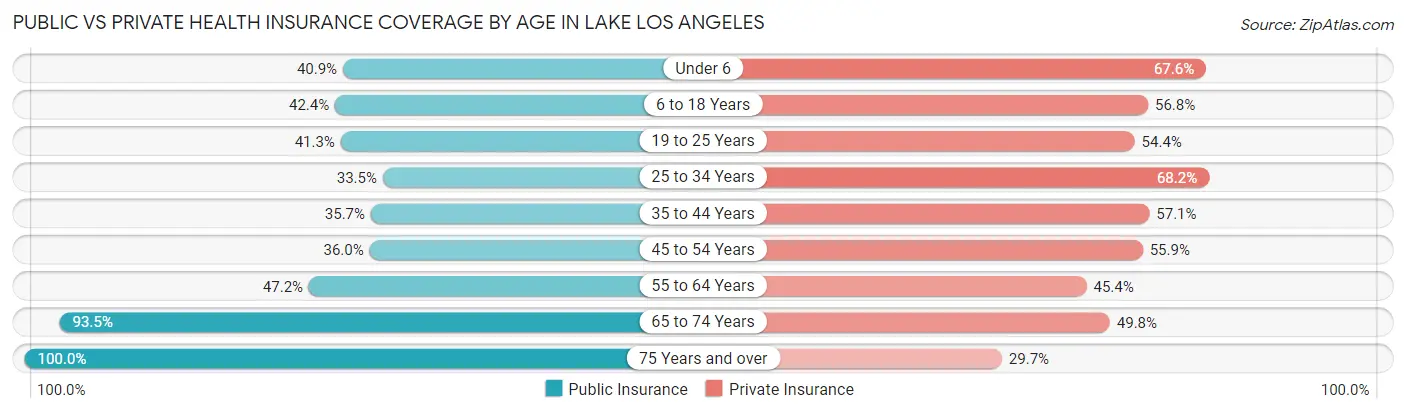
| Age Bracket | Public Insurance | Private Insurance |
| Under 6 | 414 (40.9%) | 684 (67.6%) |
| 6 to 18 Years | 1,483 (42.4%) | 1,989 (56.8%) |
| 19 to 25 Years | 422 (41.3%) | 555 (54.4%) |
| 25 to 34 Years | 444 (33.5%) | 903 (68.1%) |
| 35 to 44 Years | 597 (35.7%) | 954 (57.1%) |
| 45 to 54 Years | 608 (36.0%) | 944 (55.9%) |
| 55 to 64 Years | 733 (47.2%) | 705 (45.4%) |
| 65 to 74 Years | 765 (93.5%) | 407 (49.8%) |
| 75 Years and over | 498 (100.0%) | 148 (29.7%) |
| Total | 5,964 (45.6%) | 7,289 (55.7%) |
Disability Status by Sex by Age in Lake Los Angeles
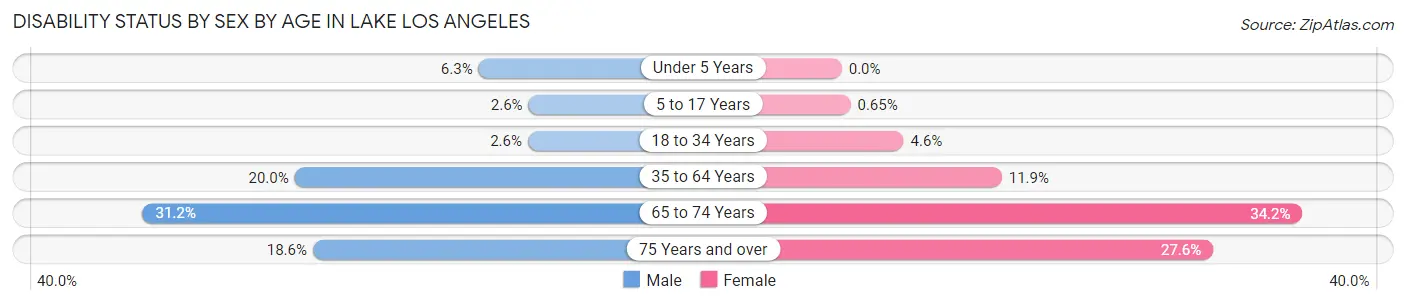
| Age Bracket | Male | Female |
| Under 5 Years | 24 (6.3%) | 0 (0.0%) |
| 5 to 17 Years | 43 (2.6%) | 12 (0.6%) |
| 18 to 34 Years | 31 (2.6%) | 59 (4.6%) |
| 35 to 64 Years | 517 (20.0%) | 276 (11.9%) |
| 65 to 74 Years | 134 (31.2%) | 133 (34.2%) |
| 75 Years and over | 40 (18.6%) | 78 (27.6%) |
Disability Class by Sex by Age in Lake Los Angeles
Disability Class: Hearing Difficulty
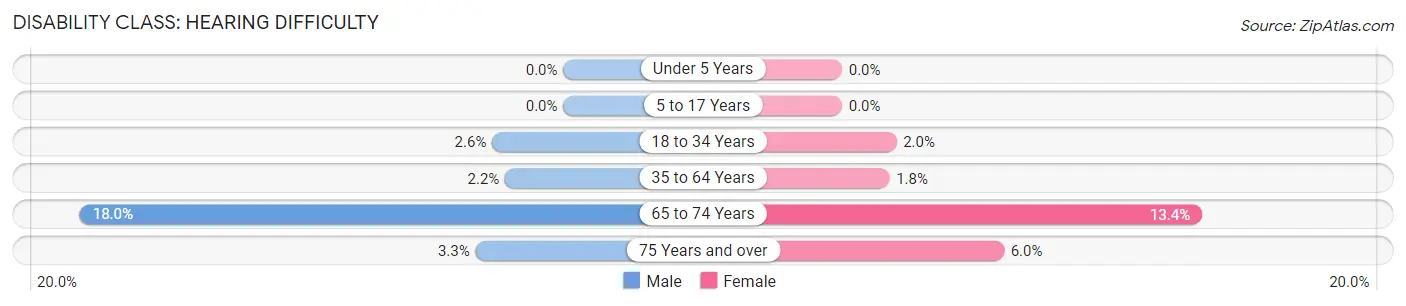
| Age Bracket | Male | Female |
| Under 5 Years | 0 (0.0%) | 0 (0.0%) |
| 5 to 17 Years | 0 (0.0%) | 0 (0.0%) |
| 18 to 34 Years | 31 (2.6%) | 26 (2.0%) |
| 35 to 64 Years | 56 (2.2%) | 41 (1.8%) |
| 65 to 74 Years | 77 (17.9%) | 52 (13.4%) |
| 75 Years and over | 7 (3.3%) | 17 (6.0%) |
Disability Class: Vision Difficulty
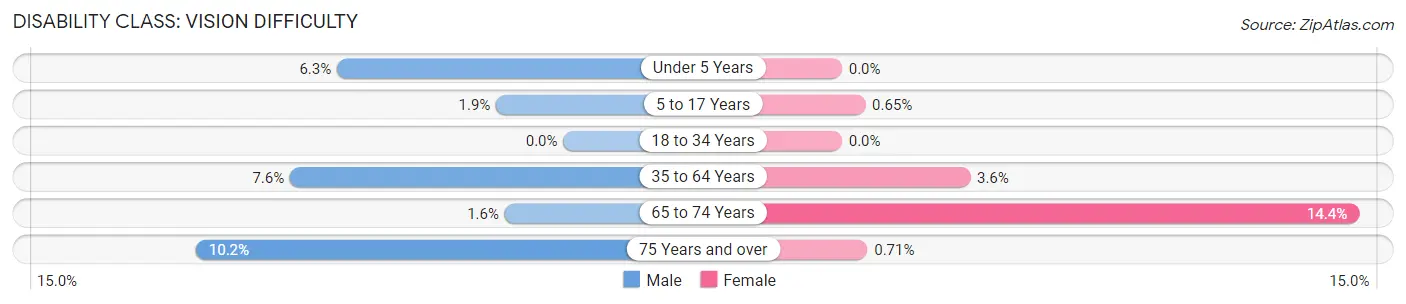
| Age Bracket | Male | Female |
| Under 5 Years | 24 (6.3%) | 0 (0.0%) |
| 5 to 17 Years | 31 (1.9%) | 12 (0.6%) |
| 18 to 34 Years | 0 (0.0%) | 0 (0.0%) |
| 35 to 64 Years | 197 (7.6%) | 83 (3.6%) |
| 65 to 74 Years | 7 (1.6%) | 56 (14.4%) |
| 75 Years and over | 22 (10.2%) | 2 (0.7%) |
Disability Class: Cognitive Difficulty
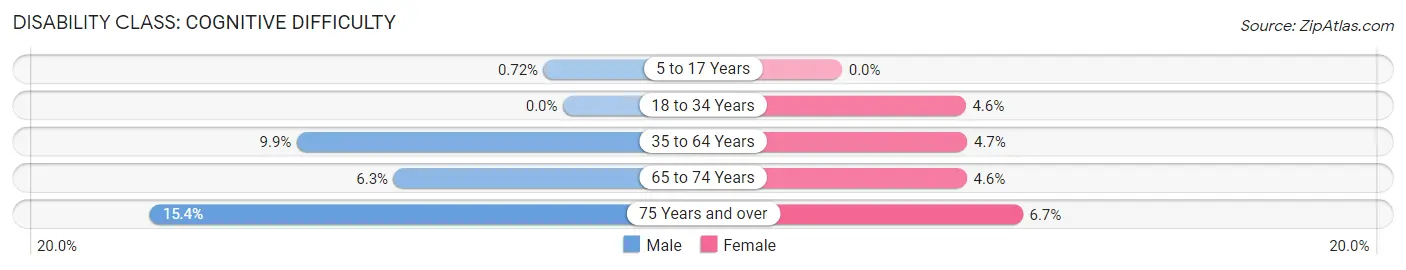
| Age Bracket | Male | Female |
| 5 to 17 Years | 12 (0.7%) | 0 (0.0%) |
| 18 to 34 Years | 0 (0.0%) | 59 (4.6%) |
| 35 to 64 Years | 256 (9.9%) | 108 (4.6%) |
| 65 to 74 Years | 27 (6.3%) | 18 (4.6%) |
| 75 Years and over | 33 (15.3%) | 19 (6.7%) |
Disability Class: Ambulatory Difficulty
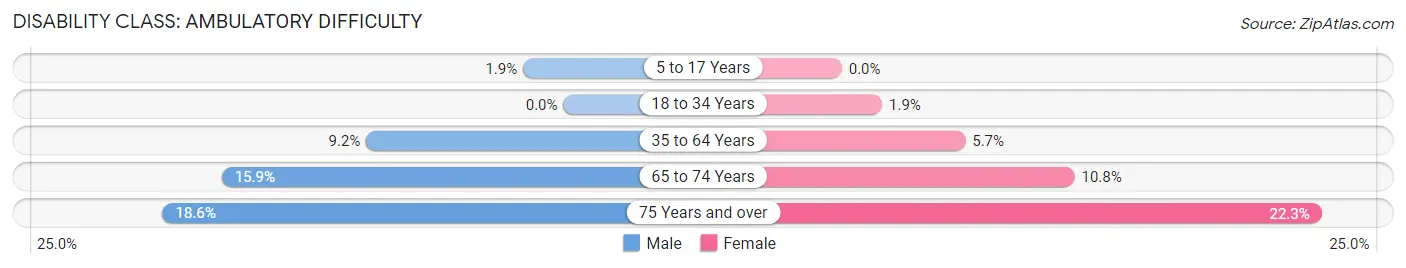
| Age Bracket | Male | Female |
| 5 to 17 Years | 31 (1.9%) | 0 (0.0%) |
| 18 to 34 Years | 0 (0.0%) | 24 (1.9%) |
| 35 to 64 Years | 237 (9.1%) | 133 (5.7%) |
| 65 to 74 Years | 68 (15.9%) | 42 (10.8%) |
| 75 Years and over | 40 (18.6%) | 63 (22.3%) |
Disability Class: Self-Care Difficulty
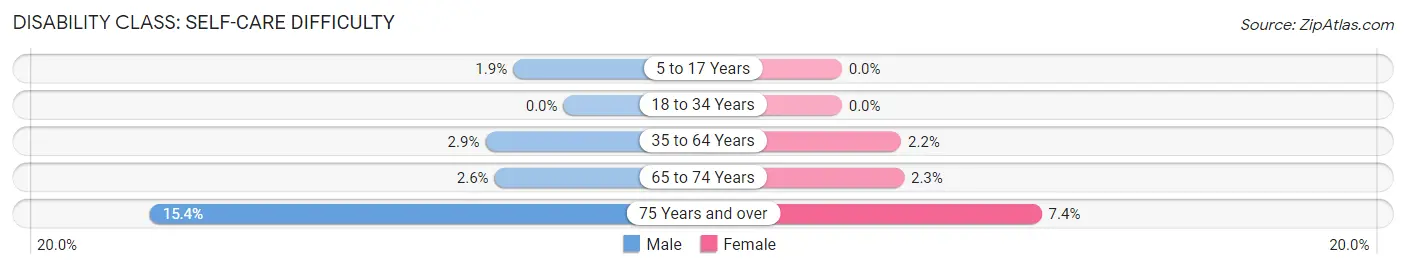
| Age Bracket | Male | Female |
| 5 to 17 Years | 31 (1.9%) | 0 (0.0%) |
| 18 to 34 Years | 0 (0.0%) | 0 (0.0%) |
| 35 to 64 Years | 75 (2.9%) | 51 (2.2%) |
| 65 to 74 Years | 11 (2.6%) | 9 (2.3%) |
| 75 Years and over | 33 (15.3%) | 21 (7.4%) |
Technology Access in Lake Los Angeles
Computing Device Access in Lake Los Angeles
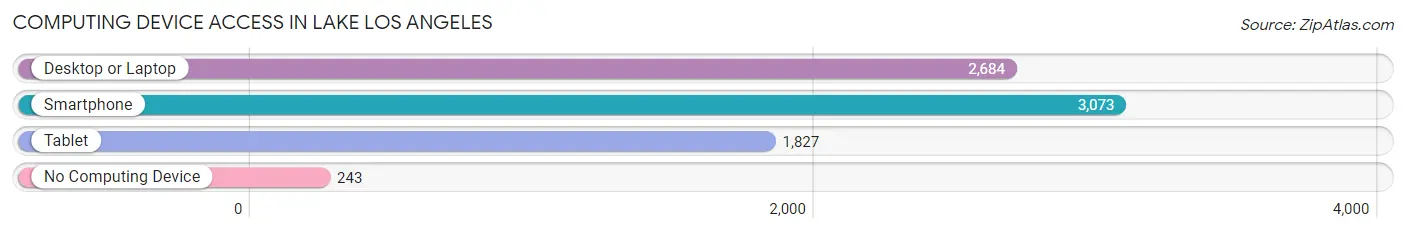
| Device Type | # Households | % Households |
| Desktop or Laptop | 2,684 | 76.4% |
| Smartphone | 3,073 | 87.5% |
| Tablet | 1,827 | 52.0% |
| No Computing Device | 243 | 6.9% |
| Total | 3,511 | 100.0% |
Internet Access in Lake Los Angeles
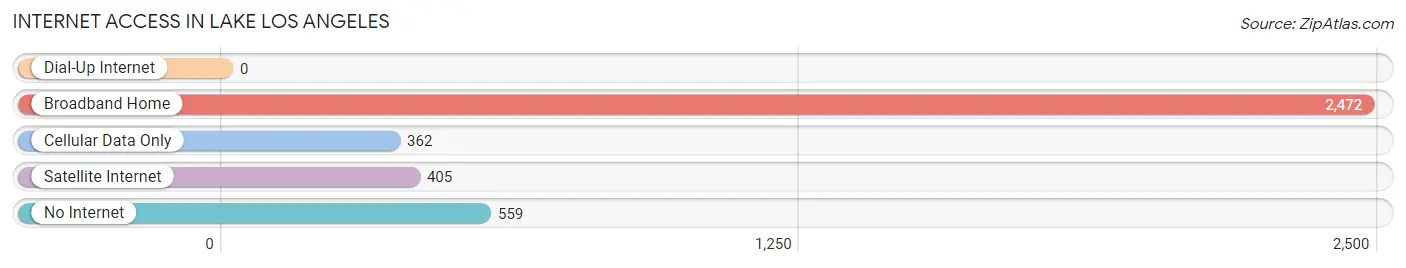
| Internet Type | # Households | % Households |
| Dial-Up Internet | 0 | 0.0% |
| Broadband Home | 2,472 | 70.4% |
| Cellular Data Only | 362 | 10.3% |
| Satellite Internet | 405 | 11.5% |
| No Internet | 559 | 15.9% |
| Total | 3,511 | 100.0% |
Lake Los Angeles Summary
Los Angeles County is home to many cities, towns, and unincorporated communities, but one of the most unique is Lake Los Angeles. Located in the Antelope Valley, Lake Los Angeles is a census-designated place (CDP) that is home to over 12,000 people. It is a small, rural community that is surrounded by desert and mountains.
History
The area that is now Lake Los Angeles was originally inhabited by the Tataviam people, who were a Native American tribe that lived in the area for thousands of years. The first Europeans to arrive in the area were Spanish missionaries in the late 1700s. The area was later settled by ranchers and farmers in the late 1800s.
In the early 1900s, the area was known as Palmdale. It was a small farming community that was home to a few hundred people. In the 1920s, the area was renamed Lake Los Angeles after the nearby lake. The lake was created by the Los Angeles Department of Water and Power in the 1930s.
In the 1950s, the area began to grow rapidly as people moved to the area to take advantage of the affordable housing and the nearby military bases. The population of Lake Los Angeles grew to over 10,000 by the 1970s.
Geography
Lake Los Angeles is located in the Antelope Valley, which is part of the Mojave Desert. The area is surrounded by mountains, including the San Gabriel Mountains to the south and the Tehachapi Mountains to the north. The area is also home to several dry lake beds, including the nearby Lake Los Angeles.
The climate in Lake Los Angeles is hot and dry, with temperatures reaching over 100 degrees Fahrenheit in the summer months. The area receives very little rainfall, with an average of only 4 inches per year.
Economy
The economy of Lake Los Angeles is largely based on agriculture. The area is home to several farms and ranches that produce a variety of crops, including alfalfa, cotton, and wheat. The area is also home to several manufacturing plants, including a plant that produces aircraft parts.
The area is also home to several military bases, including Edwards Air Force Base and Fort Irwin. These bases provide jobs for many of the residents of Lake Los Angeles.
Demographics
As of the 2010 census, the population of Lake Los Angeles was 12,328. The population is largely Hispanic, with over 80% of the population identifying as Hispanic or Latino. The median household income is $41,000, and the median age is 33.
Conclusion
Lake Los Angeles is a small, rural community located in the Antelope Valley of Los Angeles County. It is a unique area that is surrounded by desert and mountains, and is home to a largely Hispanic population. The economy of the area is largely based on agriculture and military bases, and the area is home to several manufacturing plants. Lake Los Angeles is a unique area that is worth exploring.
Common Questions
What is the Total Population of Lake Los Angeles?
Total Population of Lake Los Angeles is 13,097.
What is the Total Male Population of Lake Los Angeles?
Total Male Population of Lake Los Angeles is 6,461.
What is the Total Female Population of Lake Los Angeles?
Total Female Population of Lake Los Angeles is 6,636.
What is the Ratio of Males per 100 Females in Lake Los Angeles?
There are 97.36 Males per 100 Females in Lake Los Angeles.
What is the Ratio of Females per 100 Males in Lake Los Angeles?
There are 102.71 Females per 100 Males in Lake Los Angeles.
What is the Median Population Age in Lake Los Angeles?
Median Population Age in Lake Los Angeles is 32.8 Years.
What is the Average Family Size in Lake Los Angeles
Average Family Size in Lake Los Angeles is 4.1 People.
What is the Average Household Size in Lake Los Angeles
Average Household Size in Lake Los Angeles is 3.7 People.
What is Per Capita Income in Lake Los Angeles?
Per Capita income in Lake Los Angeles is $19,724.
What is the Median Family Income in Lake Los Angeles?
Median Family Income in Lake Los Angeles is $59,886.
What is the Median Household income in Lake Los Angeles?
Median Household Income in Lake Los Angeles is $58,512.
What is Income or Wage Gap in Lake Los Angeles?
Income or Wage Gap in Lake Los Angeles is 29.6%.
Women in Lake Los Angeles earn 70.4 cents for every dollar earned by a man.
What is Family Income Deficit in Lake Los Angeles?
Family Income Deficit in Lake Los Angeles is $15,336.
Families that are below poverty line in Lake Los Angeles earn $15,336 less on average than the poverty threshold level.
What is Inequality or Gini Index in Lake Los Angeles?
Inequality or Gini Index in Lake Los Angeles is 0.40.
How Large is the Labor Force in Lake Los Angeles?
There are 4,275 People in the Labor Forcein in Lake Los Angeles.
What is the Percentage of People in the Labor Force in Lake Los Angeles?
45.9% of People are in the Labor Force in Lake Los Angeles.
What is the Unemployment Rate in Lake Los Angeles?
Unemployment Rate in Lake Los Angeles is 8.0%.