La Selva Beach, CA
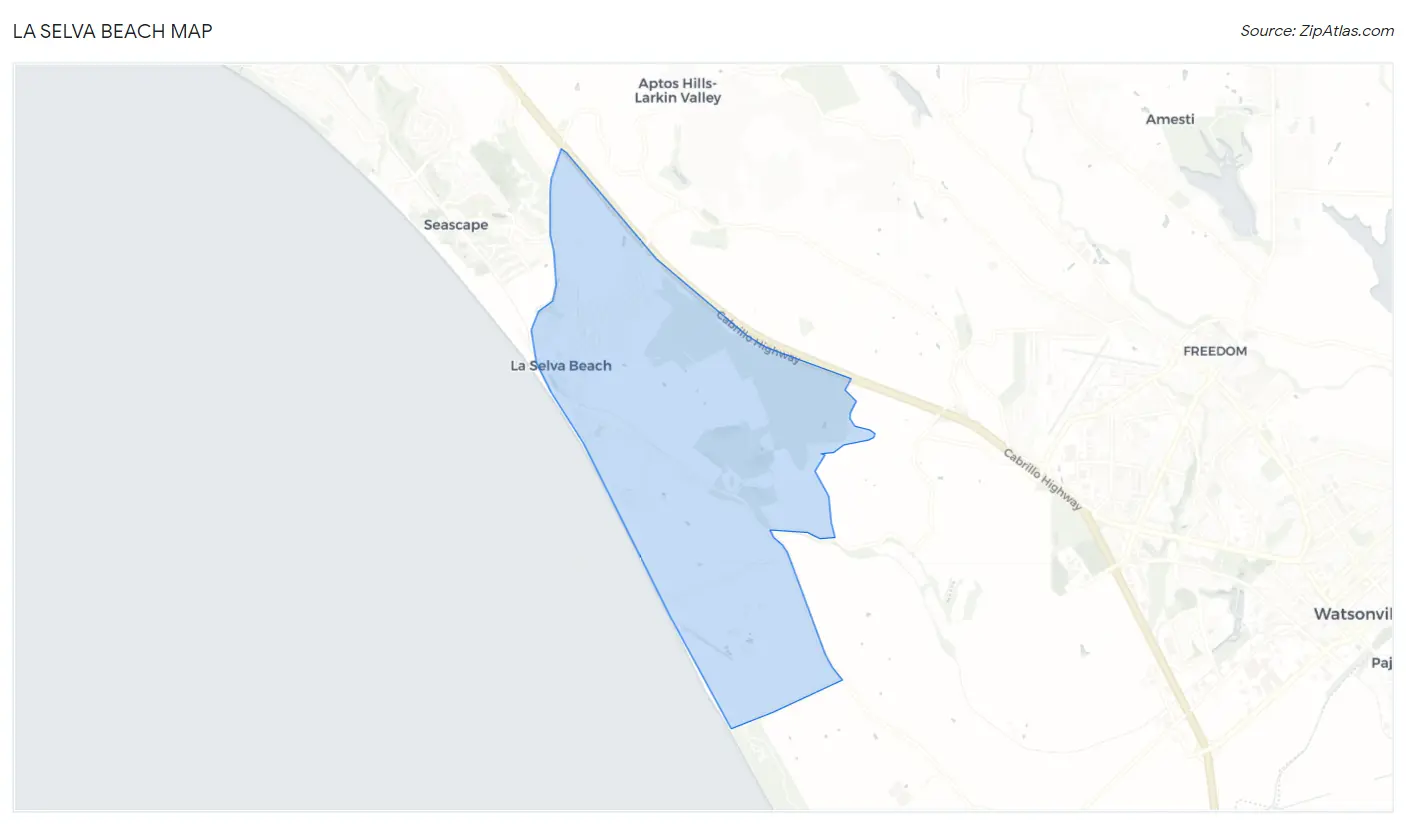
La Selva Beach Map
La Selva Beach Overview
2,320
TOTAL POPULATION
1,181
MALE POPULATION
1,139
FEMALE POPULATION
103.69
MALES / 100 FEMALES
96.44
FEMALES / 100 MALES
41.8
MEDIAN AGE
2.8
AVG FAMILY SIZE
2.5
AVG HOUSEHOLD SIZE
$69,919
PER CAPITA INCOME
$194,592
AVG FAMILY INCOME
$171,250
AVG HOUSEHOLD INCOME
33.0%
WAGE / INCOME GAP [ % ]
67.0¢/ $1
WAGE / INCOME GAP [ $ ]
0.36
INEQUALITY / GINI INDEX
1,239
LABOR FORCE [ PEOPLE ]
62.8%
PERCENT IN LABOR FORCE
3.6%
UNEMPLOYMENT RATE
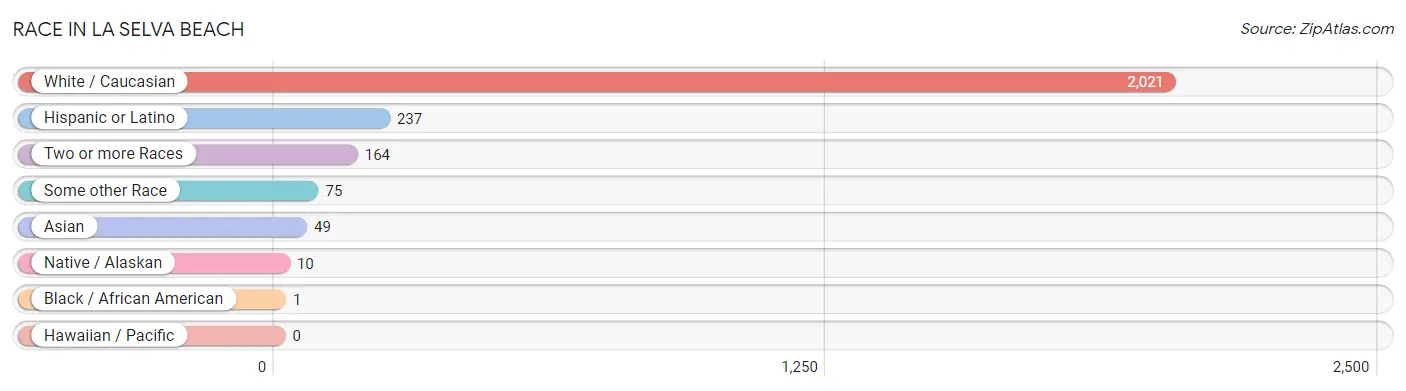
Race in La Selva Beach
The most populous races in La Selva Beach are White / Caucasian (2,021 | 87.1%), Hispanic or Latino (237 | 10.2%), and Two or more Races (164 | 7.1%).
| Race | # Population | % Population |
| Asian | 49 | 2.1% |
| Black / African American | 1 | 0.0% |
| Hawaiian / Pacific | 0 | 0.0% |
| Hispanic or Latino | 237 | 10.2% |
| Native / Alaskan | 10 | 0.4% |
| White / Caucasian | 2,021 | 87.1% |
| Two or more Races | 164 | 7.1% |
| Some other Race | 75 | 3.2% |
| Total | 2,320 | 100.0% |
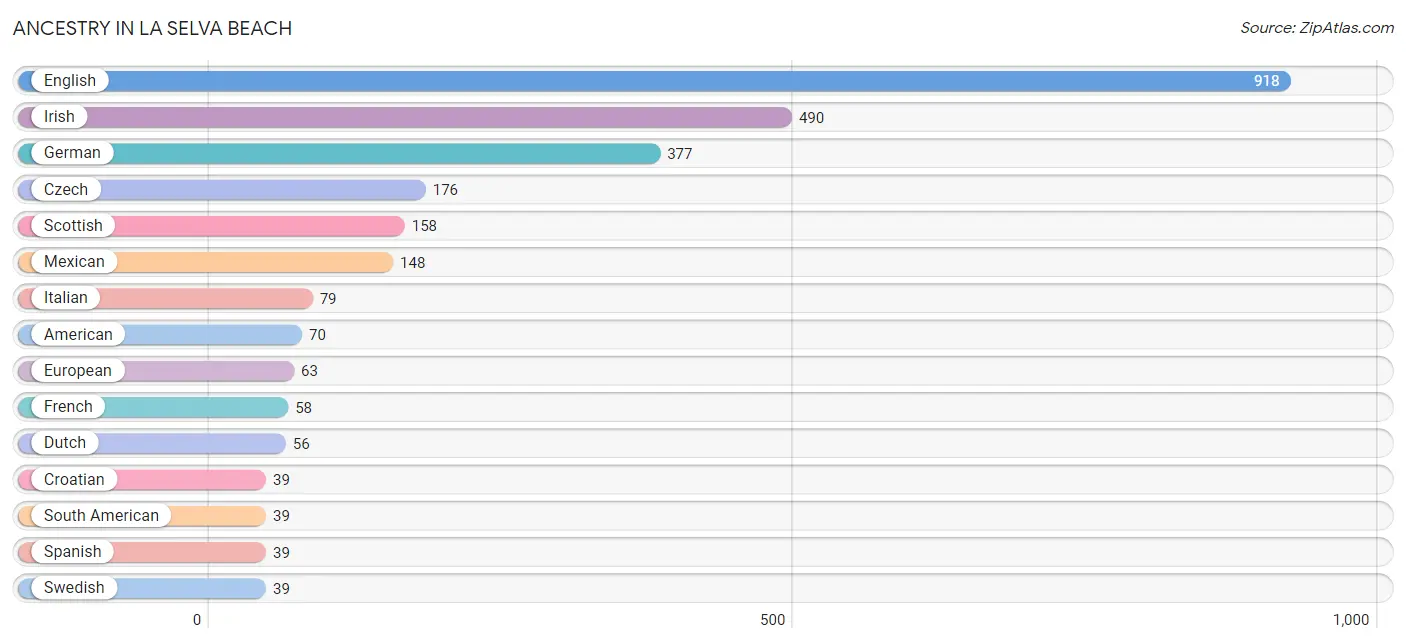
Ancestry in La Selva Beach
The most populous ancestries reported in La Selva Beach are English (918 | 39.6%), Irish (490 | 21.1%), German (377 | 16.3%), Czech (176 | 7.6%), and Scottish (158 | 6.8%), together accounting for 91.3% of all La Selva Beach residents.
| Ancestry | # Population | % Population |
| American | 70 | 3.0% |
| Armenian | 25 | 1.1% |
| Bangladeshi | 29 | 1.3% |
| Bhutanese | 12 | 0.5% |
| Blackfeet | 10 | 0.4% |
| British | 20 | 0.9% |
| Canadian | 4 | 0.2% |
| Colombian | 10 | 0.4% |
| Comanche | 10 | 0.4% |
| Cree | 3 | 0.1% |
| Croatian | 39 | 1.7% |
| Czech | 176 | 7.6% |
| Danish | 15 | 0.6% |
| Dutch | 56 | 2.4% |
| Eastern European | 25 | 1.1% |
| Ecuadorian | 29 | 1.3% |
| English | 918 | 39.6% |
| European | 63 | 2.7% |
| Finnish | 23 | 1.0% |
| French | 58 | 2.5% |
| German | 377 | 16.3% |
| Hungarian | 16 | 0.7% |
| Iranian | 34 | 1.5% |
| Irish | 490 | 21.1% |
| Italian | 79 | 3.4% |
| Korean | 13 | 0.6% |
| Lithuanian | 8 | 0.3% |
| Mexican | 148 | 6.4% |
| Norwegian | 38 | 1.6% |
| Polish | 21 | 0.9% |
| Portuguese | 24 | 1.0% |
| Puerto Rican | 11 | 0.5% |
| Russian | 33 | 1.4% |
| Scandinavian | 9 | 0.4% |
| Scotch-Irish | 36 | 1.5% |
| Scottish | 158 | 6.8% |
| South American | 39 | 1.7% |
| Spanish | 39 | 1.7% |
| Subsaharan African | 24 | 1.0% |
| Swedish | 39 | 1.7% |
| Thai | 8 | 0.3% |
| Welsh | 11 | 0.5% |
| Yugoslavian | 6 | 0.3% | View All 43 Rows |
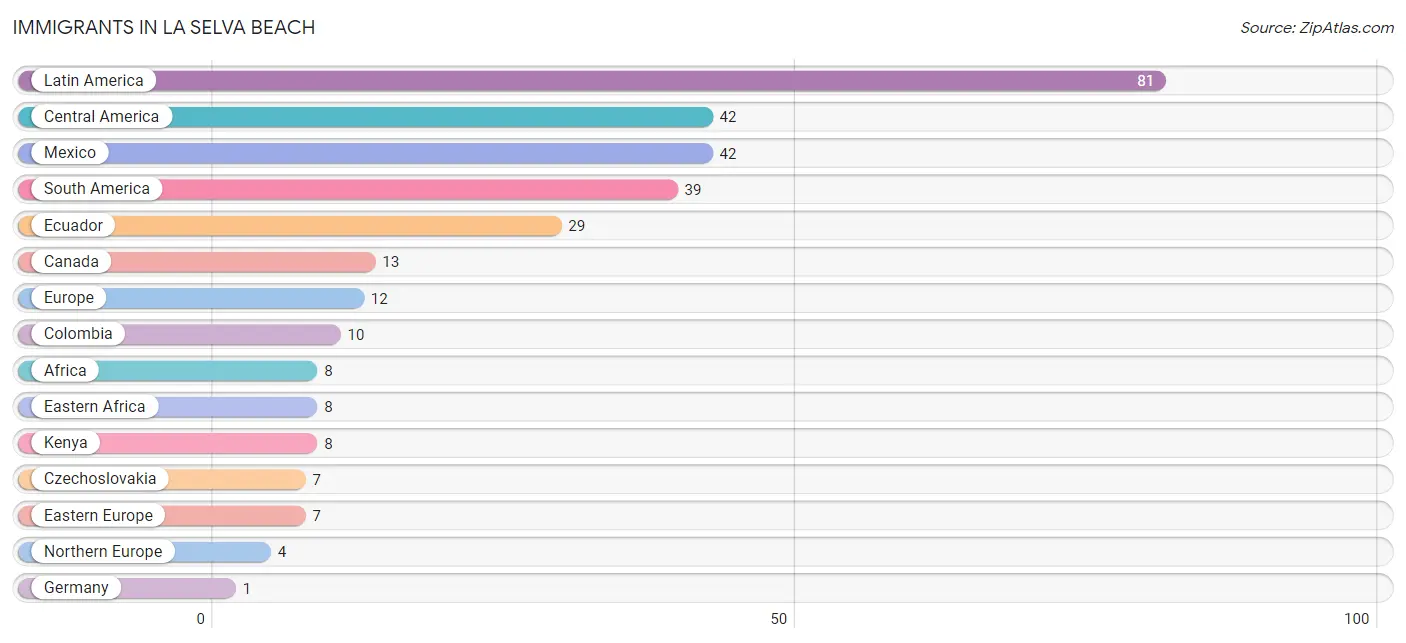
Immigrants in La Selva Beach
The most numerous immigrant groups reported in La Selva Beach came from Latin America (81 | 3.5%), Central America (42 | 1.8%), Mexico (42 | 1.8%), South America (39 | 1.7%), and Ecuador (29 | 1.3%), together accounting for 10.0% of all La Selva Beach residents.
| Immigration Origin | # Population | % Population |
| Africa | 8 | 0.3% |
| Canada | 13 | 0.6% |
| Central America | 42 | 1.8% |
| Colombia | 10 | 0.4% |
| Czechoslovakia | 7 | 0.3% |
| Eastern Africa | 8 | 0.3% |
| Eastern Europe | 7 | 0.3% |
| Ecuador | 29 | 1.3% |
| Europe | 12 | 0.5% |
| Germany | 1 | 0.0% |
| Kenya | 8 | 0.3% |
| Latin America | 81 | 3.5% |
| Mexico | 42 | 1.8% |
| Northern Europe | 4 | 0.2% |
| South America | 39 | 1.7% |
| Western Europe | 1 | 0.0% | View All 16 Rows |
Sex and Age in La Selva Beach
Sex and Age in La Selva Beach
The most populous age groups in La Selva Beach are 35 to 39 Years (188 | 15.9%) for men and 5 to 9 Years (149 | 13.1%) for women.
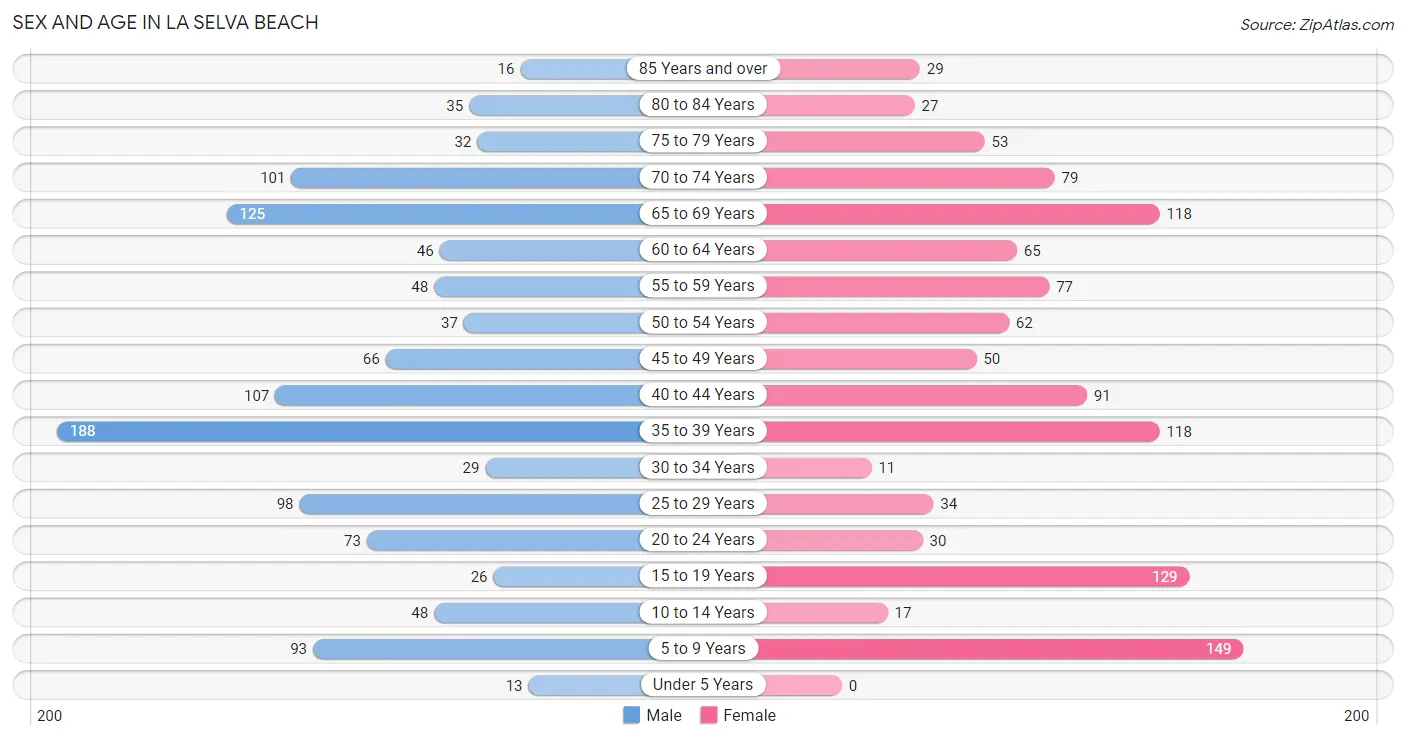
| Age Bracket | Male | Female |
| Under 5 Years | 13 (1.1%) | 0 (0.0%) |
| 5 to 9 Years | 93 (7.9%) | 149 (13.1%) |
| 10 to 14 Years | 48 (4.1%) | 17 (1.5%) |
| 15 to 19 Years | 26 (2.2%) | 129 (11.3%) |
| 20 to 24 Years | 73 (6.2%) | 30 (2.6%) |
| 25 to 29 Years | 98 (8.3%) | 34 (3.0%) |
| 30 to 34 Years | 29 (2.5%) | 11 (1.0%) |
| 35 to 39 Years | 188 (15.9%) | 118 (10.4%) |
| 40 to 44 Years | 107 (9.1%) | 91 (8.0%) |
| 45 to 49 Years | 66 (5.6%) | 50 (4.4%) |
| 50 to 54 Years | 37 (3.1%) | 62 (5.4%) |
| 55 to 59 Years | 48 (4.1%) | 77 (6.8%) |
| 60 to 64 Years | 46 (3.9%) | 65 (5.7%) |
| 65 to 69 Years | 125 (10.6%) | 118 (10.4%) |
| 70 to 74 Years | 101 (8.6%) | 79 (6.9%) |
| 75 to 79 Years | 32 (2.7%) | 53 (4.6%) |
| 80 to 84 Years | 35 (3.0%) | 27 (2.4%) |
| 85 Years and over | 16 (1.3%) | 29 (2.5%) |
| Total | 1,181 (100.0%) | 1,139 (100.0%) |
Families and Households in La Selva Beach
Median Family Size in La Selva Beach
The median family size in La Selva Beach is 2.83 persons per family, with married-couple families (546 | 84.7%) accounting for the largest median family size of 2.94 persons per family. On the other hand, single male/father families (40 | 6.2%) represent the smallest median family size with 2.03 persons per family.
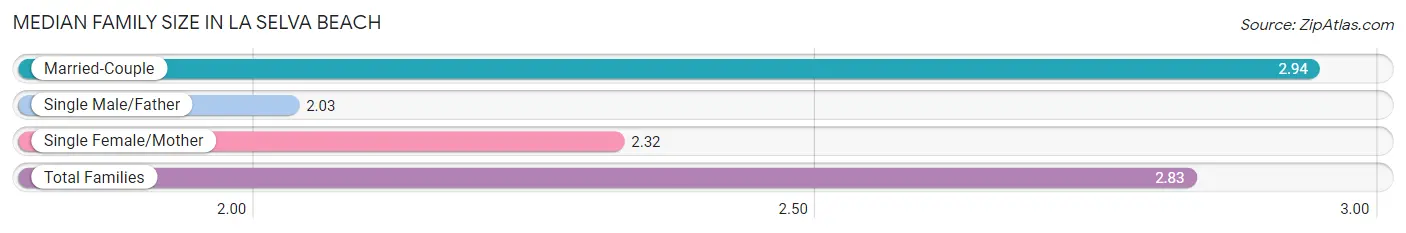
| Family Type | # Families | Family Size |
| Married-Couple | 546 (84.7%) | 2.94 |
| Single Male/Father | 40 (6.2%) | 2.03 |
| Single Female/Mother | 59 (9.1%) | 2.32 |
| Total Families | 645 (100.0%) | 2.83 |
Median Household Size in La Selva Beach
The median household size in La Selva Beach is 2.48 persons per household, with married-couple households (546 | 60.3%) accounting for the largest median household size of 3.02 persons per household. non-family households (261 | 28.8%) represent the smallest median household size with 1.47 persons per household.

| Household Type | # Households | Household Size |
| Married-Couple | 546 (60.3%) | 3.02 |
| Single Male/Father | 40 (4.4%) | 2.03 |
| Single Female/Mother | 59 (6.5%) | 2.32 |
| Non-family | 261 (28.8%) | 1.47 |
| Total Households | 906 (100.0%) | 2.48 |
Household Size by Marriage Status in La Selva Beach
Out of a total of 906 households in La Selva Beach, 645 (71.2%) are family households, while 261 (28.8%) are nonfamily households. The most numerous type of family households are 2-person households, comprising 284, and the most common type of nonfamily households are 1-person households, comprising 160.
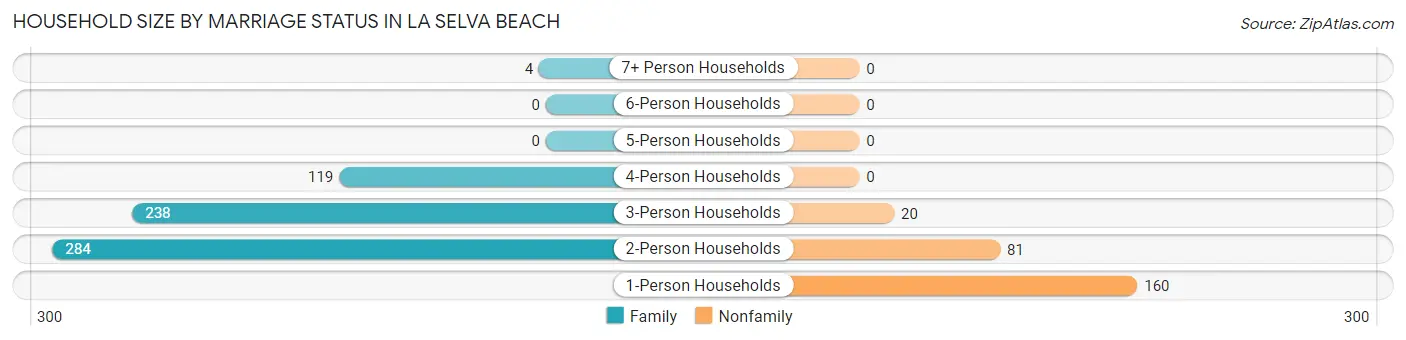
| Household Size | Family Households | Nonfamily Households |
| 1-Person Households | - | 160 (17.7%) |
| 2-Person Households | 284 (31.4%) | 81 (8.9%) |
| 3-Person Households | 238 (26.3%) | 20 (2.2%) |
| 4-Person Households | 119 (13.1%) | 0 (0.0%) |
| 5-Person Households | 0 (0.0%) | 0 (0.0%) |
| 6-Person Households | 0 (0.0%) | 0 (0.0%) |
| 7+ Person Households | 4 (0.4%) | 0 (0.0%) |
| Total | 645 (71.2%) | 261 (28.8%) |
Female Fertility in La Selva Beach
Fertility by Age in La Selva Beach
| Age Bracket | Women with Births | Births / 1,000 Women |
| 15 to 19 years | 0 (0.0%) | 0.0 |
| 20 to 34 years | 0 (0.0%) | 0.0 |
| 35 to 50 years | 0 (0.0%) | 0.0 |
| Total | 0 (0.0%) | 0.0 |
Fertility by Age by Marriage Status in La Selva Beach
| Age Bracket | Married | Unmarried |
| 15 to 19 years | 0 (0.0%) | 0 (0.0%) |
| 20 to 34 years | 0 (0.0%) | 0 (0.0%) |
| 35 to 50 years | 0 (0.0%) | 0 (0.0%) |
| Total | 0 (0.0%) | 0 (0.0%) |
Fertility by Education in La Selva Beach
| Educational Attainment | Women with Births | Births / 1,000 Women |
| Less than High School | 0 (0.0%) | 0.0 |
| High School Diploma | 0 (0.0%) | 0.0 |
| College or Associate's Degree | 0 (0.0%) | 0.0 |
| Bachelor's Degree | 0 (0.0%) | 0.0 |
| Graduate Degree | 0 (0.0%) | 0.0 |
| Total | 0 (0.0%) | 0.0 |
Fertility by Education by Marriage Status in La Selva Beach
| Educational Attainment | Married | Unmarried |
| Less than High School | 0 (0.0%) | 0 (0.0%) |
| High School Diploma | 0 (0.0%) | 0 (0.0%) |
| College or Associate's Degree | 0 (0.0%) | 0 (0.0%) |
| Bachelor's Degree | 0 (0.0%) | 0 (0.0%) |
| Graduate Degree | 0 (0.0%) | 0 (0.0%) |
| Total | 0 (0.0%) | 0 (0.0%) |
Income in La Selva Beach
Income Overview in La Selva Beach
Per Capita Income in La Selva Beach is $69,919, while median incomes of families and households are $194,592 and $171,250 respectively.
| Characteristic | Number | Measure |
| Per Capita Income | 2,320 | $69,919 |
| Median Family Income | 645 | $194,592 |
| Mean Family Income | 645 | $202,284 |
| Median Household Income | 906 | $171,250 |
| Mean Household Income | 906 | $176,597 |
| Income Deficit | 645 | $0 |
| Wage / Income Gap (%) | 2,320 | 33.03% |
| Wage / Income Gap ($) | 2,320 | 66.97¢ per $1 |
| Gini / Inequality Index | 2,320 | 0.36 |
Earnings by Sex in La Selva Beach
Average Earnings in La Selva Beach are $59,063, $71,771 for men and $48,065 for women, a difference of 33.0%.

| Sex | Number | Average Earnings |
| Male | 700 (51.8%) | $71,771 |
| Female | 651 (48.2%) | $48,065 |
| Total | 1,351 (100.0%) | $59,063 |
Earnings by Sex by Income Bracket in La Selva Beach
The most common earnings brackets in La Selva Beach are $100,000+ for men (233 | 33.3%) and $100,000+ for women (172 | 26.4%).
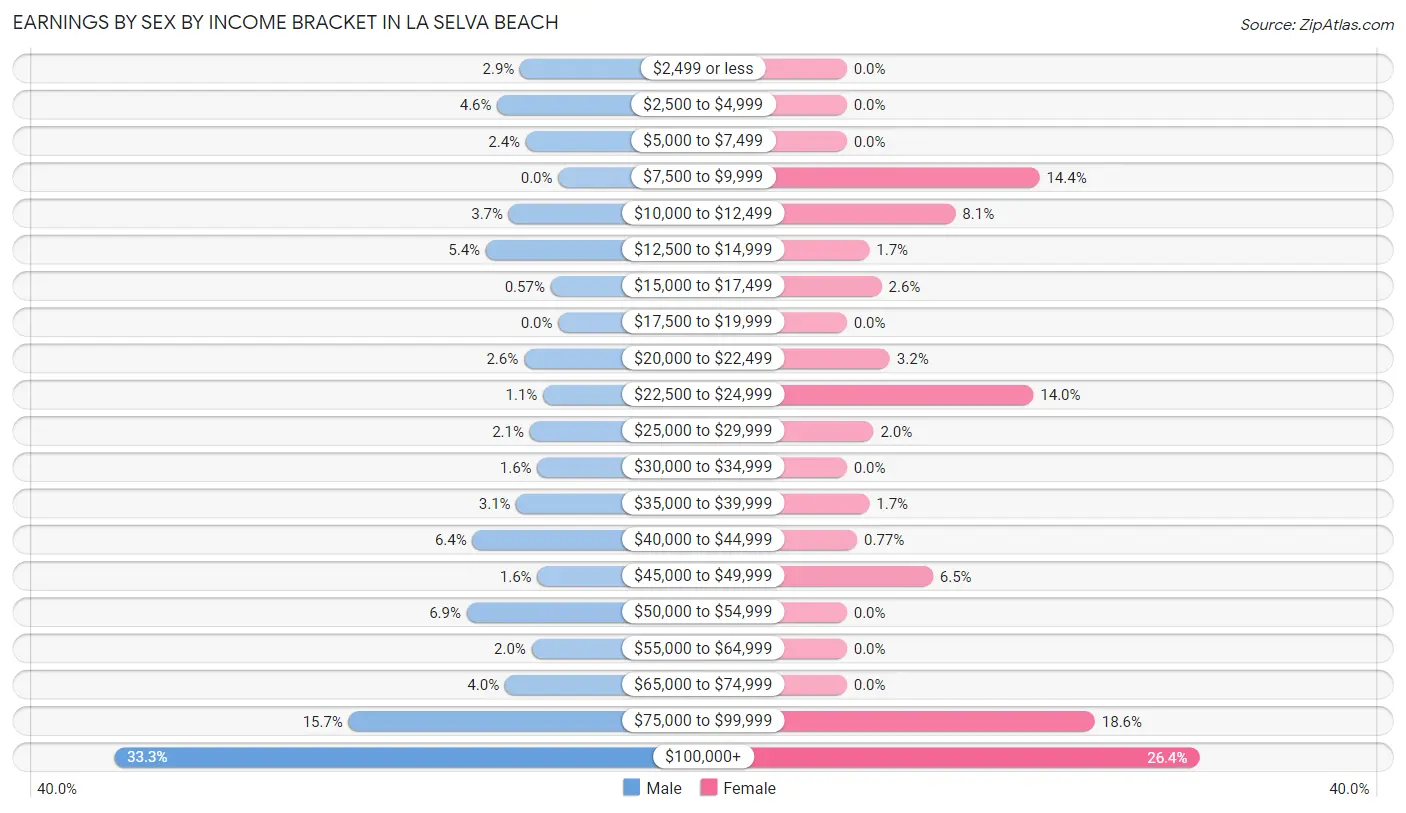
| Income | Male | Female |
| $2,499 or less | 20 (2.9%) | 0 (0.0%) |
| $2,500 to $4,999 | 32 (4.6%) | 0 (0.0%) |
| $5,000 to $7,499 | 17 (2.4%) | 0 (0.0%) |
| $7,500 to $9,999 | 0 (0.0%) | 94 (14.4%) |
| $10,000 to $12,499 | 26 (3.7%) | 53 (8.1%) |
| $12,500 to $14,999 | 38 (5.4%) | 11 (1.7%) |
| $15,000 to $17,499 | 4 (0.6%) | 17 (2.6%) |
| $17,500 to $19,999 | 0 (0.0%) | 0 (0.0%) |
| $20,000 to $22,499 | 18 (2.6%) | 21 (3.2%) |
| $22,500 to $24,999 | 8 (1.1%) | 91 (14.0%) |
| $25,000 to $29,999 | 15 (2.1%) | 13 (2.0%) |
| $30,000 to $34,999 | 11 (1.6%) | 0 (0.0%) |
| $35,000 to $39,999 | 22 (3.1%) | 11 (1.7%) |
| $40,000 to $44,999 | 45 (6.4%) | 5 (0.8%) |
| $45,000 to $49,999 | 11 (1.6%) | 42 (6.5%) |
| $50,000 to $54,999 | 48 (6.9%) | 0 (0.0%) |
| $55,000 to $64,999 | 14 (2.0%) | 0 (0.0%) |
| $65,000 to $74,999 | 28 (4.0%) | 0 (0.0%) |
| $75,000 to $99,999 | 110 (15.7%) | 121 (18.6%) |
| $100,000+ | 233 (33.3%) | 172 (26.4%) |
| Total | 700 (100.0%) | 651 (100.0%) |
Earnings by Sex by Educational Attainment in La Selva Beach
Average earnings in La Selva Beach are $86,007 for men and $77,981 for women, a difference of 9.3%. Men with an educational attainment of college or associate's degree enjoy the highest average annual earnings of $172,604, while those with bachelor's degree education earn the least with $54,671. Women with an educational attainment of graduate degree earn the most with the average annual earnings of $85,417, while those with high school diploma education have the smallest earnings of $16,094.
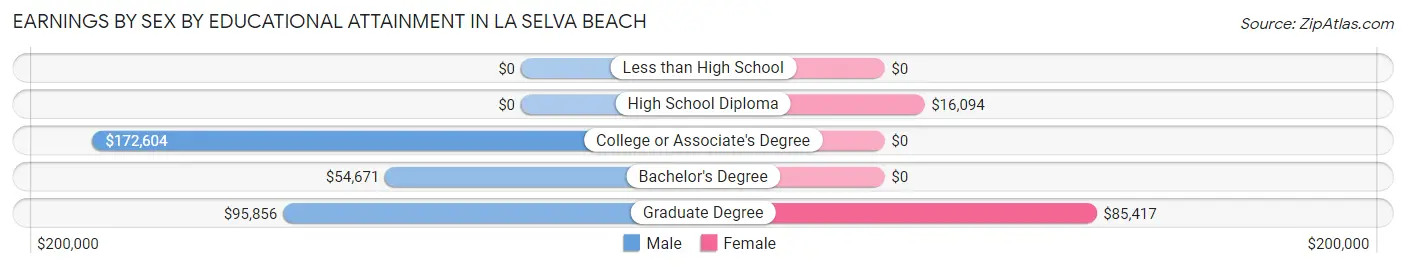
| Educational Attainment | Male Income | Female Income |
| Less than High School | - | - |
| High School Diploma | - | - |
| College or Associate's Degree | $172,604 | $0 |
| Bachelor's Degree | $54,671 | $0 |
| Graduate Degree | $95,856 | $85,417 |
| Total | $86,007 | $77,981 |
Family Income in La Selva Beach
Family Income Brackets in La Selva Beach
According to the La Selva Beach family income data, there are 310 families falling into the $200,000+ income range, which is the most common income bracket and makes up 48.1% of all families.
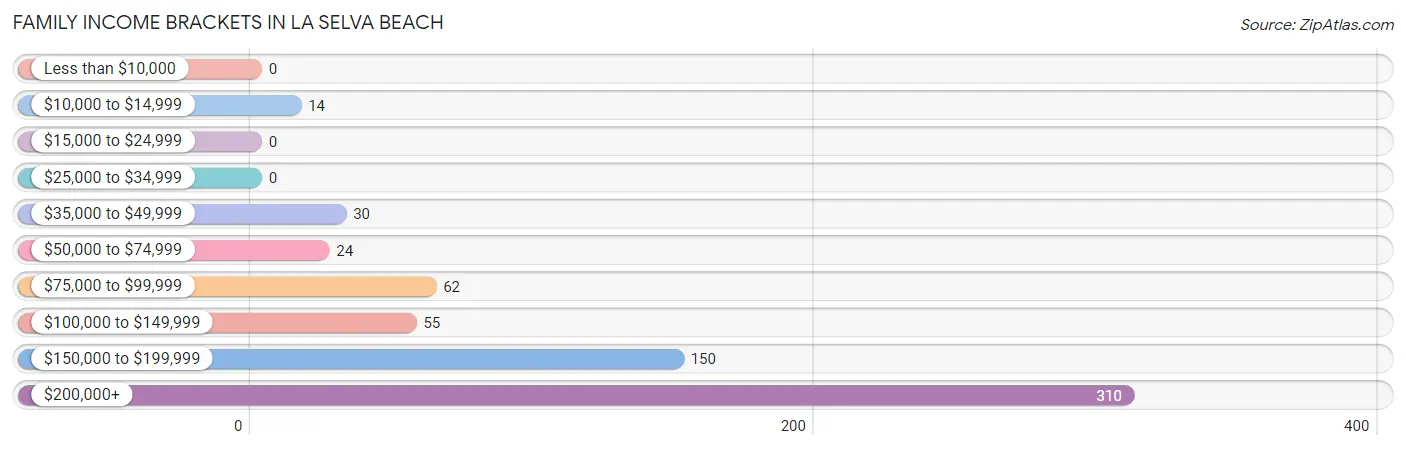
| Income Bracket | # Families | % Families |
| Less than $10,000 | 0 | 0.0% |
| $10,000 to $14,999 | 14 | 2.2% |
| $15,000 to $24,999 | 0 | 0.0% |
| $25,000 to $34,999 | 0 | 0.0% |
| $35,000 to $49,999 | 30 | 4.7% |
| $50,000 to $74,999 | 24 | 3.7% |
| $75,000 to $99,999 | 62 | 9.6% |
| $100,000 to $149,999 | 55 | 8.5% |
| $150,000 to $199,999 | 150 | 23.3% |
| $200,000+ | 310 | 48.1% |
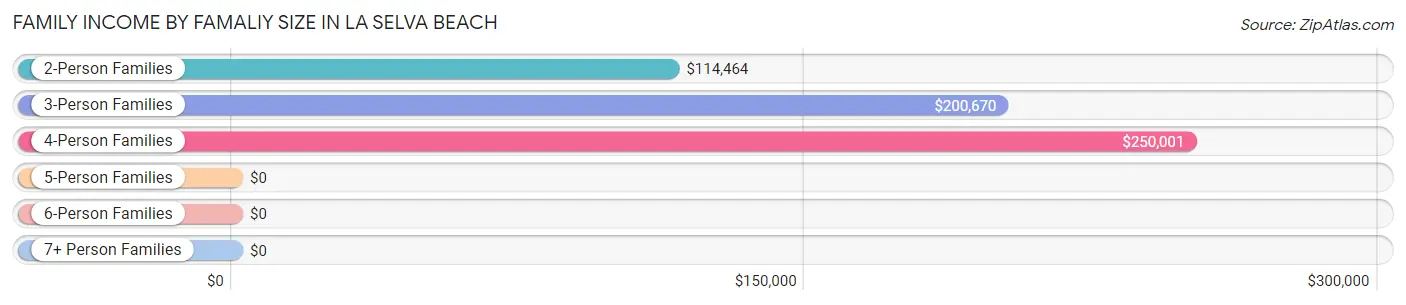
Family Income by Famaliy Size in La Selva Beach
4-person families (119 | 18.4%) account for the highest median family income in La Selva Beach with $250,001 per family, while 3-person families (211 | 32.7%) have the highest median income of $66,890 per family member.
| Income Bracket | # Families | Median Income |
| 2-Person Families | 311 (48.2%) | $114,464 |
| 3-Person Families | 211 (32.7%) | $200,670 |
| 4-Person Families | 119 (18.4%) | $250,001 |
| 5-Person Families | 0 (0.0%) | $0 |
| 6-Person Families | 0 (0.0%) | $0 |
| 7+ Person Families | 4 (0.6%) | $0 |
| Total | 645 (100.0%) | $194,592 |
Family Income by Number of Earners in La Selva Beach
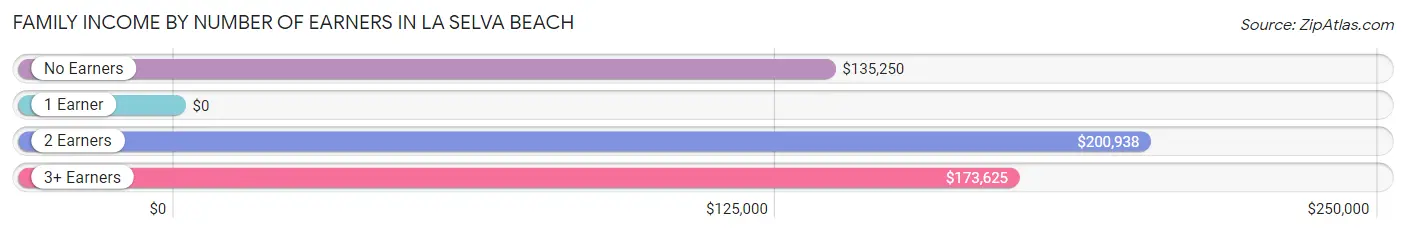
| Number of Earners | # Families | Median Income |
| No Earners | 129 (20.0%) | $135,250 |
| 1 Earner | 108 (16.7%) | $0 |
| 2 Earners | 377 (58.5%) | $200,938 |
| 3+ Earners | 31 (4.8%) | $173,625 |
| Total | 645 (100.0%) | $194,592 |
Household Income in La Selva Beach
Household Income Brackets in La Selva Beach
With 326 households falling in the category, the $200,000+ income range is the most frequent in La Selva Beach, accounting for 36.0% of all households. In contrast, only 6 households (0.7%) fall into the $15,000 to $24,999 income bracket, making it the least populous group.
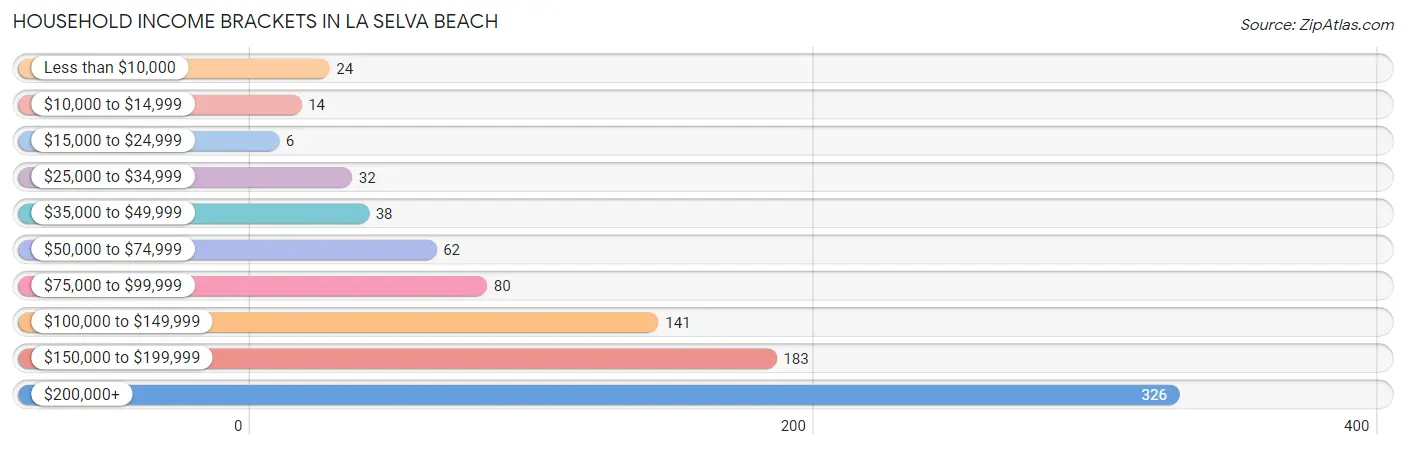
| Income Bracket | # Households | % Households |
| Less than $10,000 | 24 | 2.6% |
| $10,000 to $14,999 | 14 | 1.5% |
| $15,000 to $24,999 | 6 | 0.7% |
| $25,000 to $34,999 | 32 | 3.5% |
| $35,000 to $49,999 | 38 | 4.2% |
| $50,000 to $74,999 | 62 | 6.8% |
| $75,000 to $99,999 | 80 | 8.8% |
| $100,000 to $149,999 | 141 | 15.6% |
| $150,000 to $199,999 | 183 | 20.2% |
| $200,000+ | 326 | 36.0% |
Household Income by Householder Age in La Selva Beach
The median household income in La Selva Beach is $171,250, with the highest median household income of $200,298 found in the 25 to 44 years age bracket for the primary householder. A total of 266 households (29.4%) fall into this category.
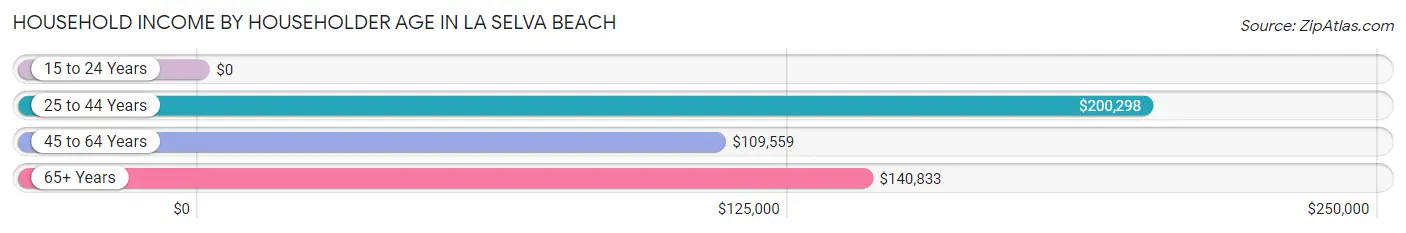
| Income Bracket | # Households | Median Income |
| 15 to 24 Years | 0 (0.0%) | $0 |
| 25 to 44 Years | 266 (29.4%) | $200,298 |
| 45 to 64 Years | 302 (33.3%) | $109,559 |
| 65+ Years | 338 (37.3%) | $140,833 |
| Total | 906 (100.0%) | $171,250 |
Poverty in La Selva Beach
Income Below Poverty by Sex and Age in La Selva Beach
With 7.6% poverty level for males and 4.4% for females among the residents of La Selva Beach, 12 to 14 year old males and 18 to 24 year old females are the most vulnerable to poverty, with 13 males (56.5%) and 25 females (25.3%) in their respective age groups living below the poverty level.
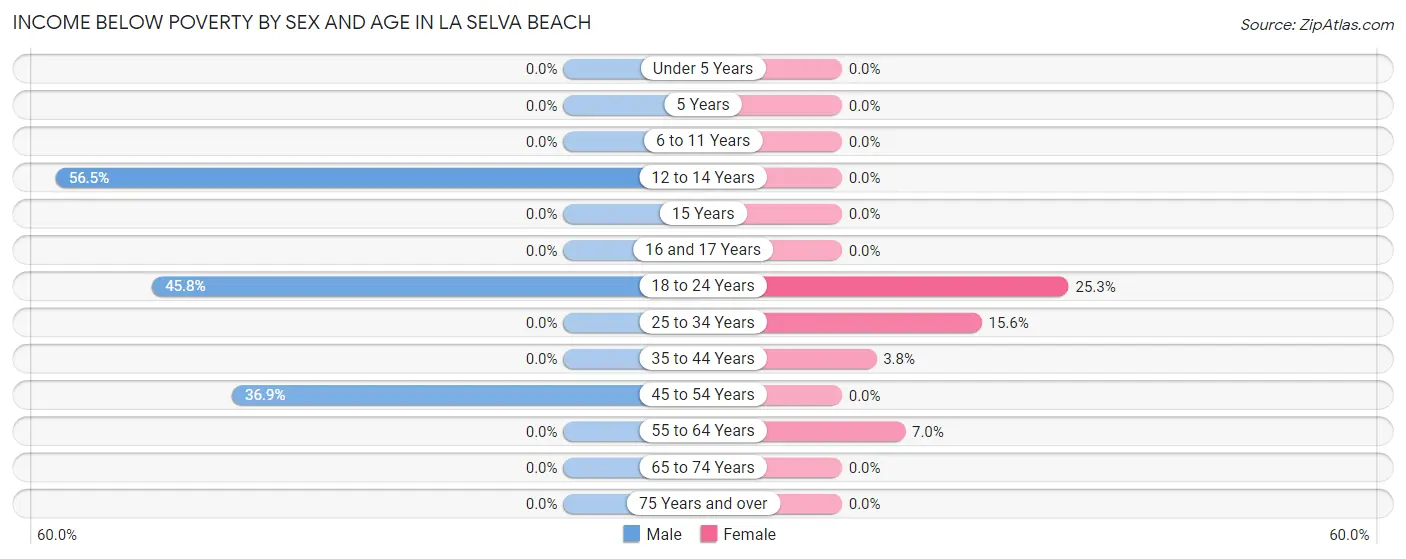
| Age Bracket | Male | Female |
| Under 5 Years | 0 (0.0%) | 0 (0.0%) |
| 5 Years | 0 (0.0%) | 0 (0.0%) |
| 6 to 11 Years | 0 (0.0%) | 0 (0.0%) |
| 12 to 14 Years | 13 (56.5%) | 0 (0.0%) |
| 15 Years | 0 (0.0%) | 0 (0.0%) |
| 16 and 17 Years | 0 (0.0%) | 0 (0.0%) |
| 18 to 24 Years | 38 (45.8%) | 25 (25.3%) |
| 25 to 34 Years | 0 (0.0%) | 7 (15.6%) |
| 35 to 44 Years | 0 (0.0%) | 8 (3.8%) |
| 45 to 54 Years | 38 (36.9%) | 0 (0.0%) |
| 55 to 64 Years | 0 (0.0%) | 10 (7.0%) |
| 65 to 74 Years | 0 (0.0%) | 0 (0.0%) |
| 75 Years and over | 0 (0.0%) | 0 (0.0%) |
| Total | 89 (7.6%) | 50 (4.4%) |
Income Above Poverty by Sex and Age in La Selva Beach
According to the poverty statistics in La Selva Beach, males aged 5 years and females aged 6 to 11 years are the age groups that are most secure financially, with 100.0% of males and 100.0% of females in these age groups living above the poverty line.
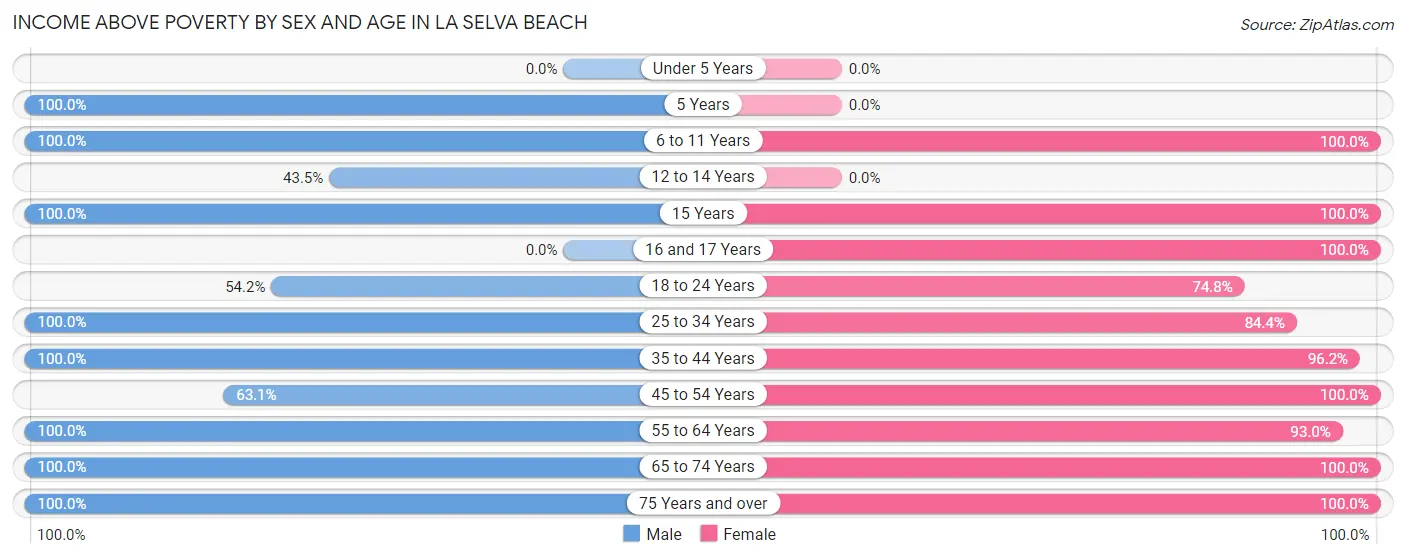
| Age Bracket | Male | Female |
| Under 5 Years | 0 (0.0%) | 0 (0.0%) |
| 5 Years | 73 (100.0%) | 0 (0.0%) |
| 6 to 11 Years | 45 (100.0%) | 166 (100.0%) |
| 12 to 14 Years | 10 (43.5%) | 0 (0.0%) |
| 15 Years | 14 (100.0%) | 12 (100.0%) |
| 16 and 17 Years | 0 (0.0%) | 48 (100.0%) |
| 18 to 24 Years | 45 (54.2%) | 74 (74.8%) |
| 25 to 34 Years | 127 (100.0%) | 38 (84.4%) |
| 35 to 44 Years | 295 (100.0%) | 201 (96.2%) |
| 45 to 54 Years | 65 (63.1%) | 112 (100.0%) |
| 55 to 64 Years | 94 (100.0%) | 132 (93.0%) |
| 65 to 74 Years | 226 (100.0%) | 197 (100.0%) |
| 75 Years and over | 83 (100.0%) | 109 (100.0%) |
| Total | 1,077 (92.4%) | 1,089 (95.6%) |
Income Below Poverty Among Married-Couple Families in La Selva Beach
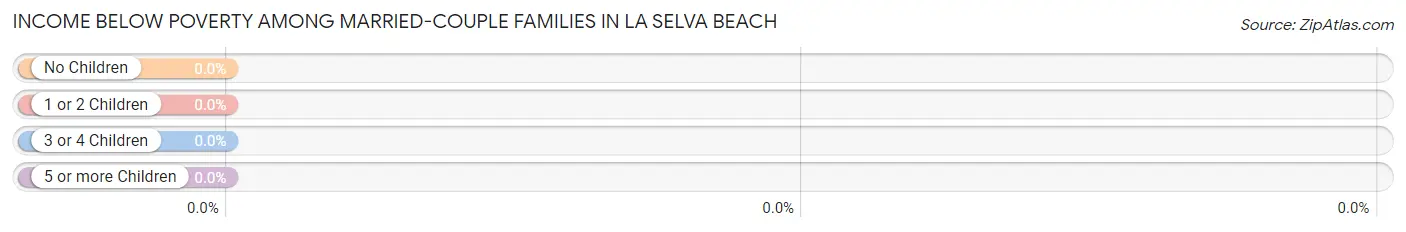
| Children | Above Poverty | Below Poverty |
| No Children | 287 (100.0%) | 0 (0.0%) |
| 1 or 2 Children | 259 (100.0%) | 0 (0.0%) |
| 3 or 4 Children | 0 (0.0%) | 0 (0.0%) |
| 5 or more Children | 0 (0.0%) | 0 (0.0%) |
| Total | 546 (100.0%) | 0 (0.0%) |
Income Below Poverty Among Single-Parent Households in La Selva Beach
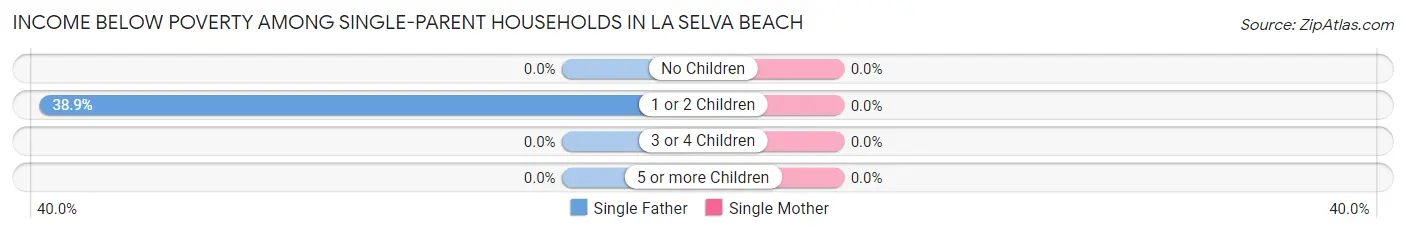
| Children | Single Father | Single Mother |
| No Children | 0 (0.0%) | 0 (0.0%) |
| 1 or 2 Children | 14 (38.9%) | 0 (0.0%) |
| 3 or 4 Children | 0 (0.0%) | 0 (0.0%) |
| 5 or more Children | 0 (0.0%) | 0 (0.0%) |
| Total | 14 (35.0%) | 0 (0.0%) |
Income Below Poverty Among Married-Couple vs Single-Parent Households in La Selva Beach
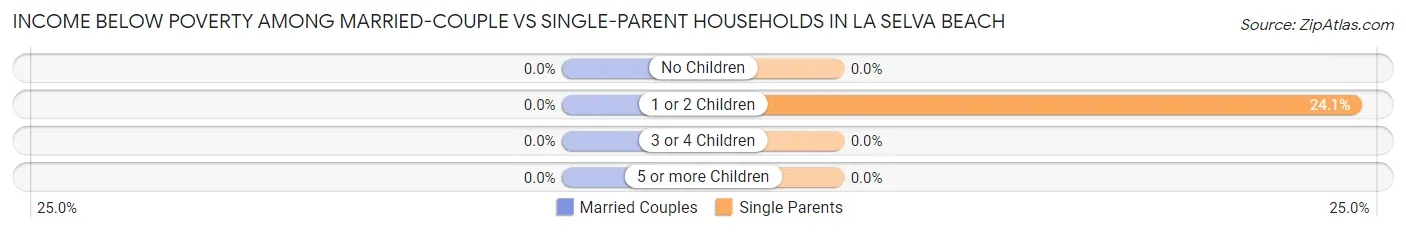
| Children | Married-Couple Families | Single-Parent Households |
| No Children | 0 (0.0%) | 0 (0.0%) |
| 1 or 2 Children | 0 (0.0%) | 14 (24.1%) |
| 3 or 4 Children | 0 (0.0%) | 0 (0.0%) |
| 5 or more Children | 0 (0.0%) | 0 (0.0%) |
| Total | 0 (0.0%) | 14 (14.1%) |
Employment Characteristics in La Selva Beach
Employment by Class of Employer in La Selva Beach
Among the 1,115 employed individuals in La Selva Beach, private company employees (688 | 61.7%), self-employed (not incorporated) (160 | 14.3%), and local government employees (117 | 10.5%) make up the most common classes of employment.
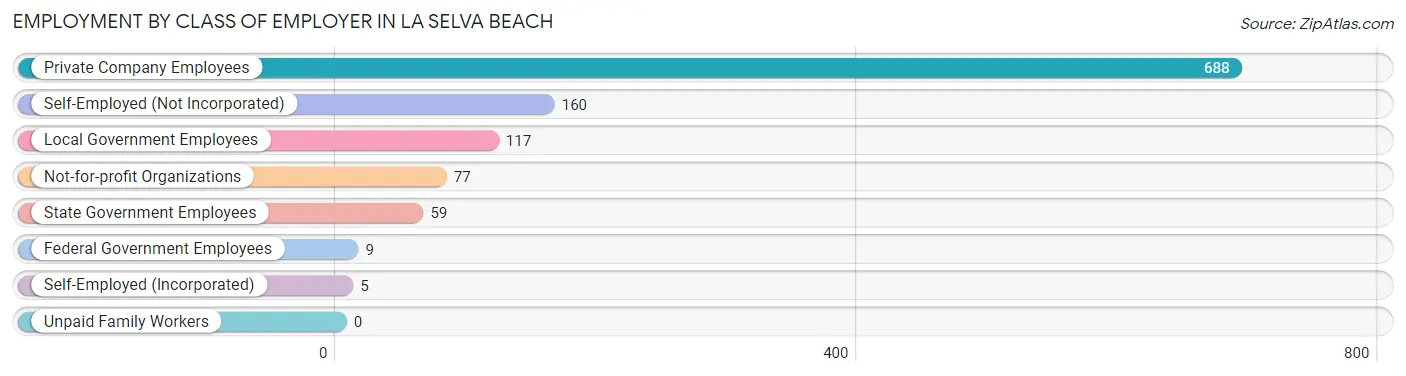
| Employer Class | # Employees | % Employees |
| Private Company Employees | 688 | 61.7% |
| Self-Employed (Incorporated) | 5 | 0.4% |
| Self-Employed (Not Incorporated) | 160 | 14.3% |
| Not-for-profit Organizations | 77 | 6.9% |
| Local Government Employees | 117 | 10.5% |
| State Government Employees | 59 | 5.3% |
| Federal Government Employees | 9 | 0.8% |
| Unpaid Family Workers | 0 | 0.0% |
| Total | 1,115 | 100.0% |
Employment Status by Age in La Selva Beach
According to the labor force statistics for La Selva Beach, out of the total population over 16 years of age (1,973), 62.8% or 1,239 individuals are in the labor force, with 3.6% or 45 of them unemployed. The age group with the highest labor force participation rate is 35 to 44 years, with 98.6% or 497 individuals in the labor force. Within the labor force, the 20 to 24 years age range has the highest percentage of unemployed individuals, with 25.5% or 25 of them being unemployed.
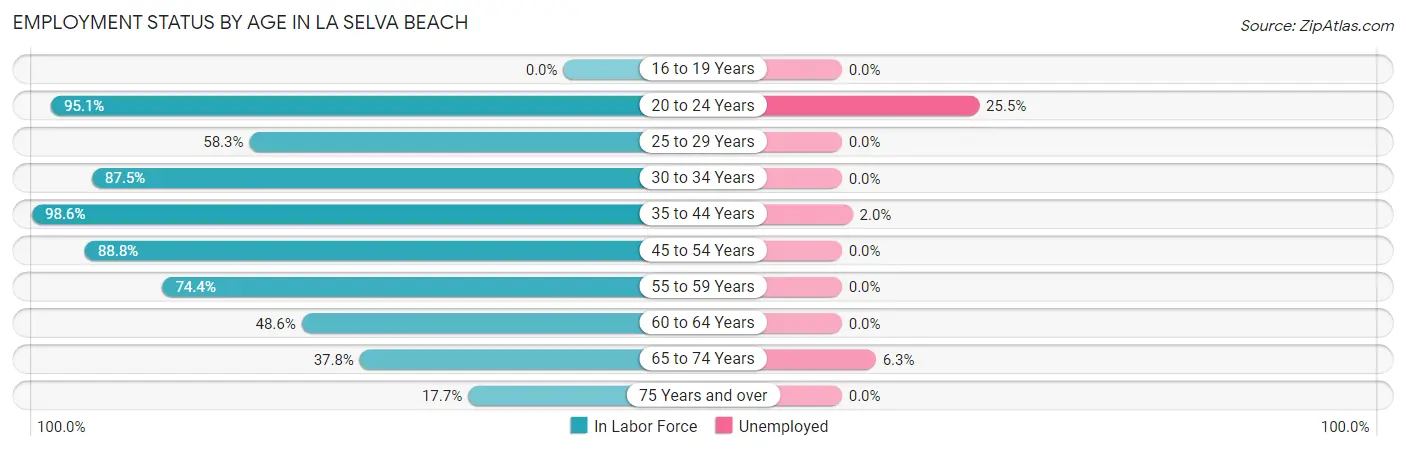
| Age Bracket | In Labor Force | Unemployed |
| 16 to 19 Years | 0 (0.0%) | 0 (0.0%) |
| 20 to 24 Years | 98 (95.1%) | 25 (25.5%) |
| 25 to 29 Years | 77 (58.3%) | 0 (0.0%) |
| 30 to 34 Years | 35 (87.5%) | 0 (0.0%) |
| 35 to 44 Years | 497 (98.6%) | 10 (2.0%) |
| 45 to 54 Years | 191 (88.8%) | 0 (0.0%) |
| 55 to 59 Years | 93 (74.4%) | 0 (0.0%) |
| 60 to 64 Years | 54 (48.6%) | 0 (0.0%) |
| 65 to 74 Years | 160 (37.8%) | 10 (6.3%) |
| 75 Years and over | 34 (17.7%) | 0 (0.0%) |
| Total | 1,239 (62.8%) | 45 (3.6%) |
Employment Status by Educational Attainment in La Selva Beach
According to labor force statistics for La Selva Beach, 84.0% of individuals (947) out of the total population between 25 and 64 years of age (1,127) are in the labor force, with 1.1% or 10 of them being unemployed. The group with the highest labor force participation rate are those with the educational attainment of bachelor's degree or higher, with 92.4% or 617 individuals in the labor force. Within the labor force, individuals with college / associate degree education have the highest percentage of unemployment, with 3.9% or 10 of them being unemployed.
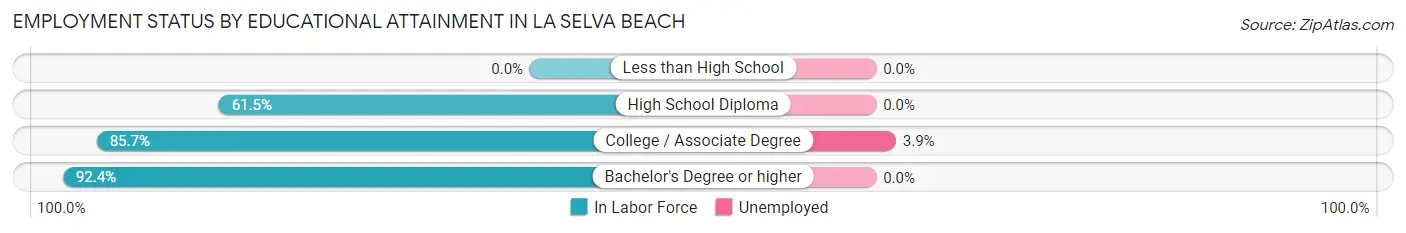
| Educational Attainment | In Labor Force | Unemployed |
| Less than High School | 0 (0.0%) | 0 (0.0%) |
| High School Diploma | 72 (61.5%) | 0 (0.0%) |
| College / Associate Degree | 258 (85.7%) | 12 (3.9%) |
| Bachelor's Degree or higher | 617 (92.4%) | 0 (0.0%) |
| Total | 947 (84.0%) | 12 (1.1%) |
Employment Occupations by Sex in La Selva Beach
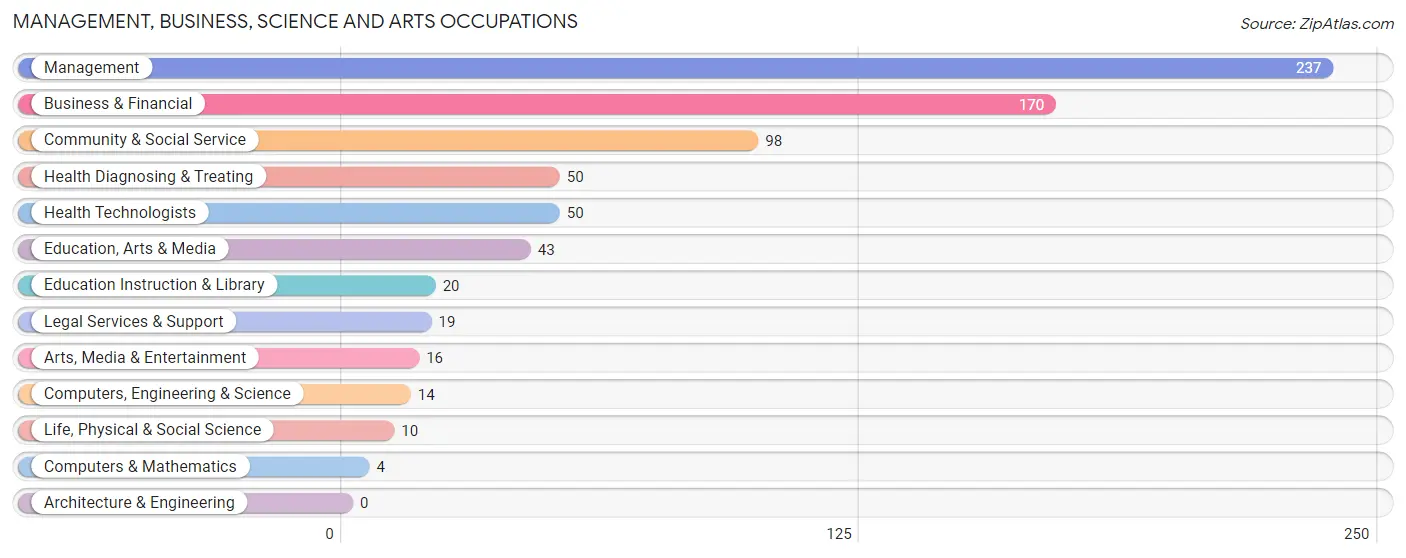
Management, Business, Science and Arts Occupations
The most common Management, Business, Science and Arts occupations in La Selva Beach are Management (237 | 19.9%), Business & Financial (170 | 14.2%), Community & Social Service (98 | 8.2%), Health Diagnosing & Treating (50 | 4.2%), and Health Technologists (50 | 4.2%).
Management, Business, Science and Arts Occupations by Sex
Within the Management, Business, Science and Arts occupations in La Selva Beach, the most male-oriented occupations are Computers, Engineering & Science (100.0%), Computers & Mathematics (100.0%), and Life, Physical & Social Science (100.0%), while the most female-oriented occupations are Health Diagnosing & Treating (100.0%), Health Technologists (100.0%), and Education Instruction & Library (55.0%).
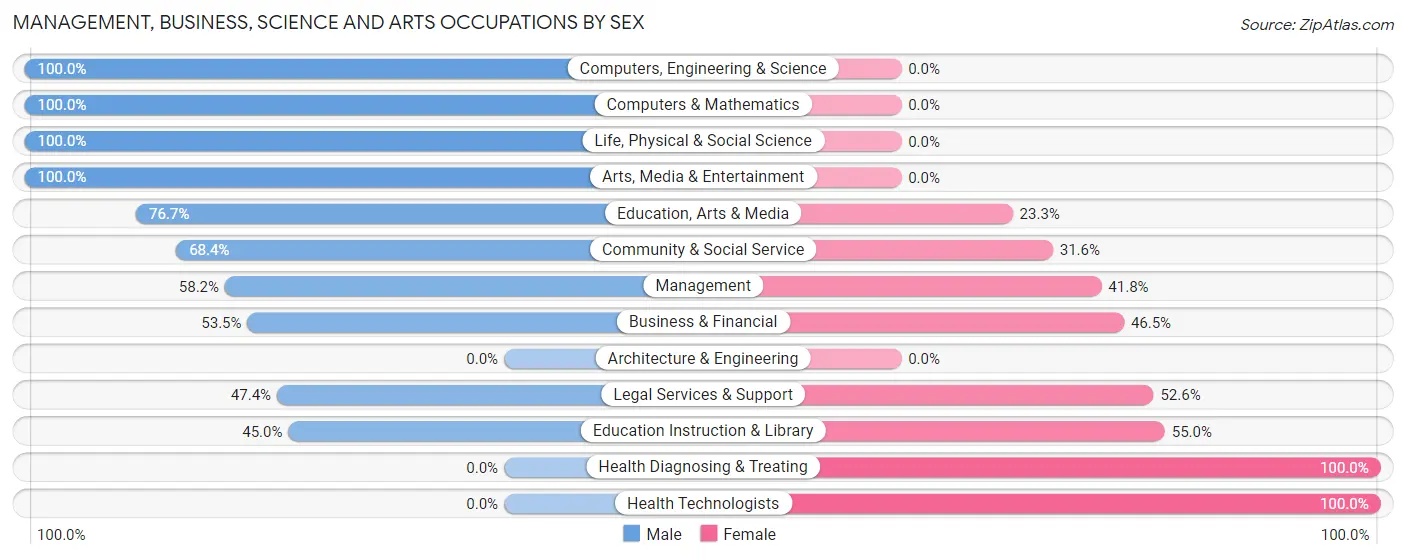
| Occupation | Male | Female |
| Management | 138 (58.2%) | 99 (41.8%) |
| Business & Financial | 91 (53.5%) | 79 (46.5%) |
| Computers, Engineering & Science | 14 (100.0%) | 0 (0.0%) |
| Computers & Mathematics | 4 (100.0%) | 0 (0.0%) |
| Architecture & Engineering | 0 (0.0%) | 0 (0.0%) |
| Life, Physical & Social Science | 10 (100.0%) | 0 (0.0%) |
| Community & Social Service | 67 (68.4%) | 31 (31.6%) |
| Education, Arts & Media | 33 (76.7%) | 10 (23.3%) |
| Legal Services & Support | 9 (47.4%) | 10 (52.6%) |
| Education Instruction & Library | 9 (45.0%) | 11 (55.0%) |
| Arts, Media & Entertainment | 16 (100.0%) | 0 (0.0%) |
| Health Diagnosing & Treating | 0 (0.0%) | 50 (100.0%) |
| Health Technologists | 0 (0.0%) | 50 (100.0%) |
| Total (Category) | 310 (54.5%) | 259 (45.5%) |
| Total (Overall) | 641 (53.7%) | 553 (46.3%) |
Services Occupations
The most common Services occupations in La Selva Beach are Security & Protection (37 | 3.1%), Law Enforcement (37 | 3.1%), Food Preparation & Serving (18 | 1.5%), and Healthcare Support (5 | 0.4%).
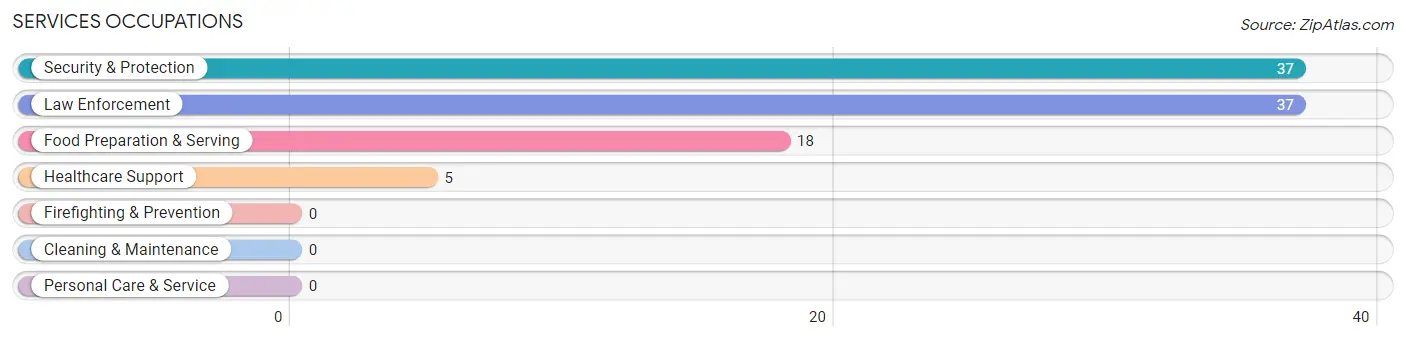
Services Occupations by Sex
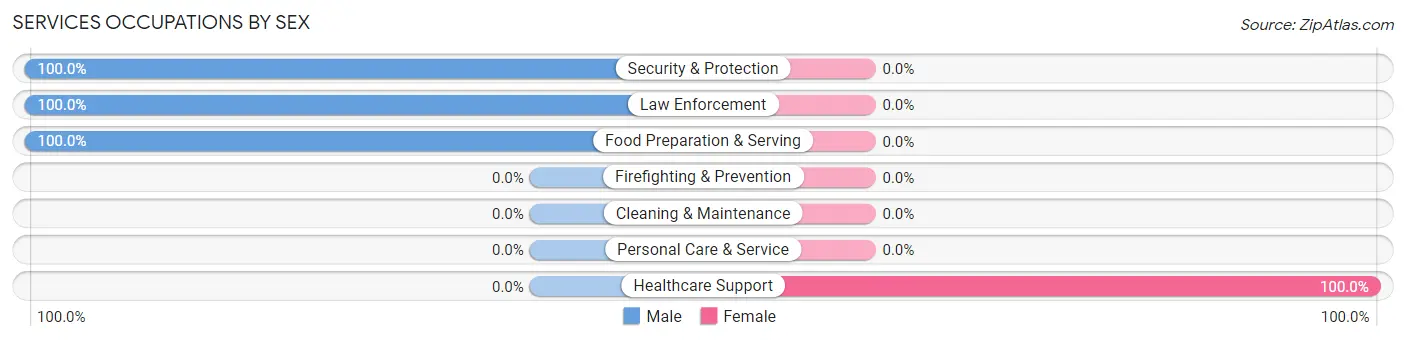
| Occupation | Male | Female |
| Healthcare Support | 0 (0.0%) | 5 (100.0%) |
| Security & Protection | 37 (100.0%) | 0 (0.0%) |
| Firefighting & Prevention | 0 (0.0%) | 0 (0.0%) |
| Law Enforcement | 37 (100.0%) | 0 (0.0%) |
| Food Preparation & Serving | 18 (100.0%) | 0 (0.0%) |
| Cleaning & Maintenance | 0 (0.0%) | 0 (0.0%) |
| Personal Care & Service | 0 (0.0%) | 0 (0.0%) |
| Total (Category) | 55 (91.7%) | 5 (8.3%) |
| Total (Overall) | 641 (53.7%) | 553 (46.3%) |
Sales and Office Occupations
The most common Sales and Office occupations in La Selva Beach are Office & Administration (172 | 14.4%), and Sales & Related (171 | 14.3%).
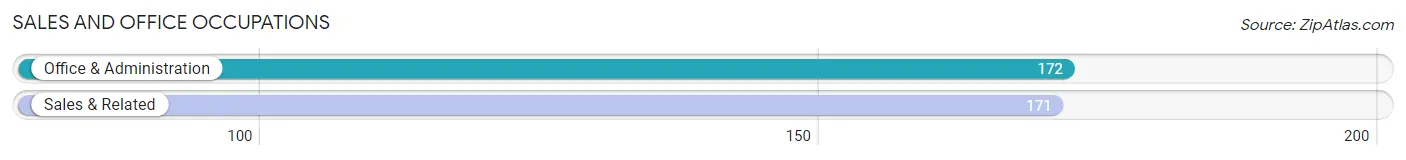
Sales and Office Occupations by Sex
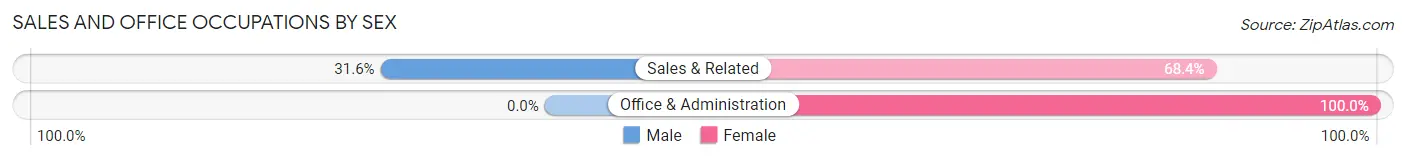
| Occupation | Male | Female |
| Sales & Related | 54 (31.6%) | 117 (68.4%) |
| Office & Administration | 0 (0.0%) | 172 (100.0%) |
| Total (Category) | 54 (15.7%) | 289 (84.3%) |
| Total (Overall) | 641 (53.7%) | 553 (46.3%) |
Natural Resources, Construction and Maintenance Occupations
The most common Natural Resources, Construction and Maintenance occupations in La Selva Beach are Construction & Extraction (150 | 12.6%), and Installation, Maintenance & Repair (38 | 3.2%).
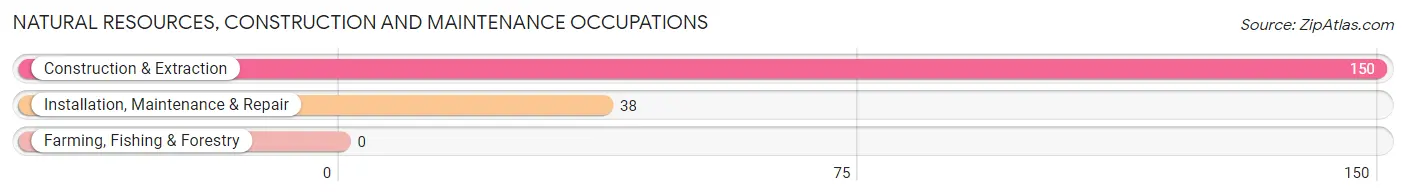
Natural Resources, Construction and Maintenance Occupations by Sex

| Occupation | Male | Female |
| Farming, Fishing & Forestry | 0 (0.0%) | 0 (0.0%) |
| Construction & Extraction | 150 (100.0%) | 0 (0.0%) |
| Installation, Maintenance & Repair | 38 (100.0%) | 0 (0.0%) |
| Total (Category) | 188 (100.0%) | 0 (0.0%) |
| Total (Overall) | 641 (53.7%) | 553 (46.3%) |
Production, Transportation and Moving Occupations
The most common Production, Transportation and Moving occupations in La Selva Beach are Production (23 | 1.9%), and Transportation (11 | 0.9%).

Production, Transportation and Moving Occupations by Sex
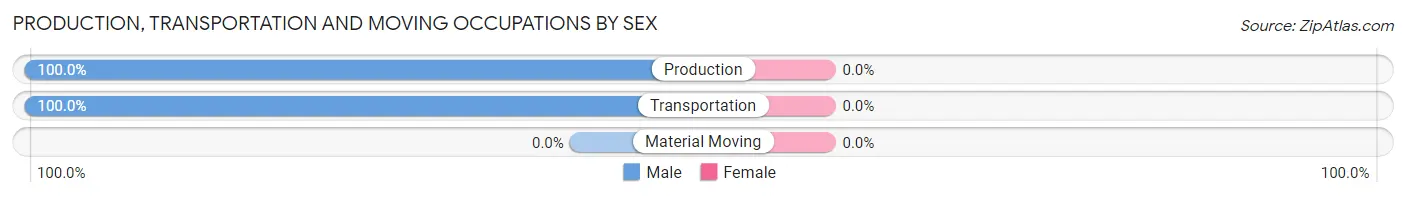
| Occupation | Male | Female |
| Production | 23 (100.0%) | 0 (0.0%) |
| Transportation | 11 (100.0%) | 0 (0.0%) |
| Material Moving | 0 (0.0%) | 0 (0.0%) |
| Total (Category) | 34 (100.0%) | 0 (0.0%) |
| Total (Overall) | 641 (53.7%) | 553 (46.3%) |
Employment Industries by Sex in La Selva Beach
Employment Industries in La Selva Beach
The major employment industries in La Selva Beach include Retail Trade (188 | 15.8%), Construction (150 | 12.6%), Agriculture, Fishing & Hunting (141 | 11.8%), Health Care & Social Assistance (139 | 11.6%), and Professional & Scientific (94 | 7.9%).

Employment Industries by Sex in La Selva Beach
The La Selva Beach industries that see more men than women are Construction (100.0%), Arts, Entertainment & Recreation (100.0%), and Accommodation & Food Services (100.0%), whereas the industries that tend to have a higher number of women are Information (100.0%), Administrative & Support (100.0%), and Real Estate, Rental & Leasing (89.9%).
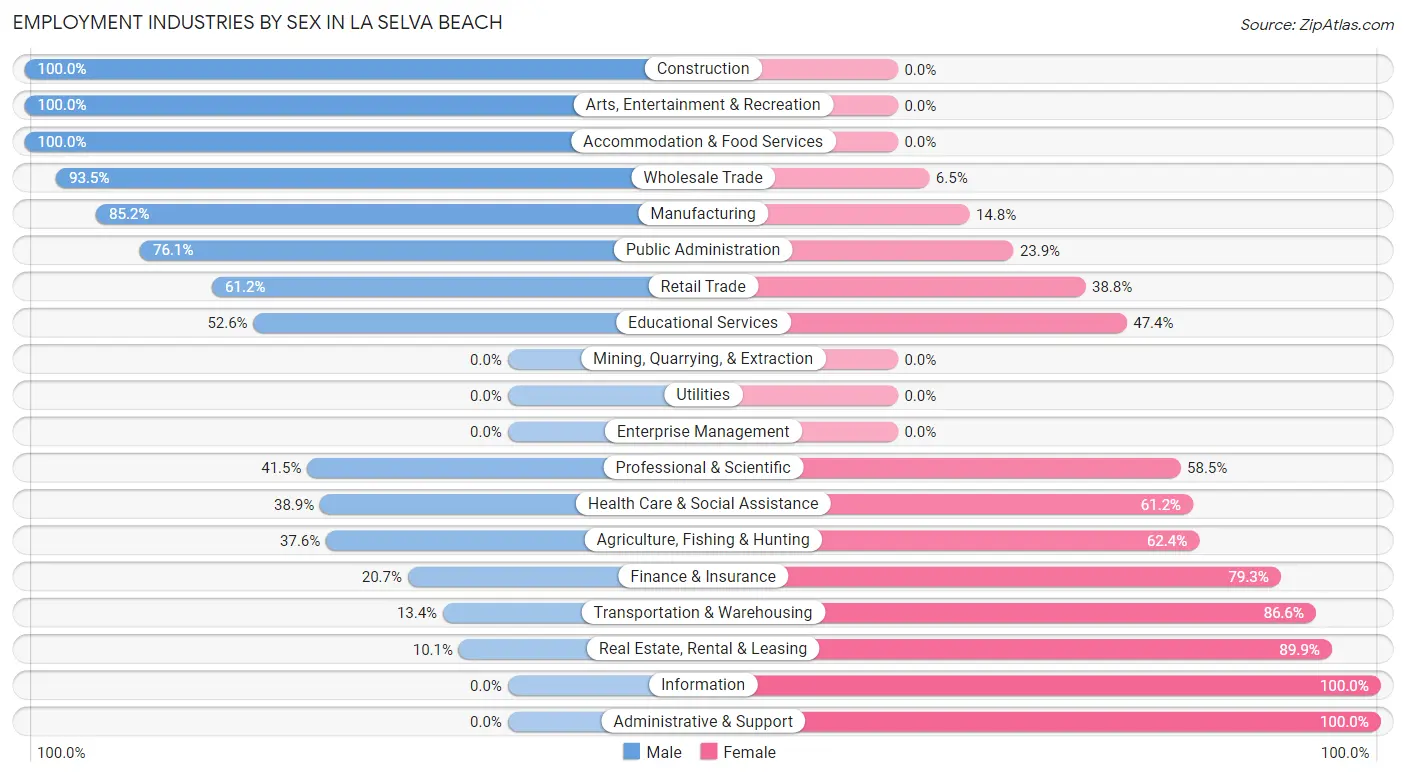
| Industry | Male | Female |
| Agriculture, Fishing & Hunting | 53 (37.6%) | 88 (62.4%) |
| Mining, Quarrying, & Extraction | 0 (0.0%) | 0 (0.0%) |
| Construction | 150 (100.0%) | 0 (0.0%) |
| Manufacturing | 23 (85.2%) | 4 (14.8%) |
| Wholesale Trade | 43 (93.5%) | 3 (6.5%) |
| Retail Trade | 115 (61.2%) | 73 (38.8%) |
| Transportation & Warehousing | 11 (13.4%) | 71 (86.6%) |
| Utilities | 0 (0.0%) | 0 (0.0%) |
| Information | 0 (0.0%) | 8 (100.0%) |
| Finance & Insurance | 12 (20.7%) | 46 (79.3%) |
| Real Estate, Rental & Leasing | 8 (10.1%) | 71 (89.9%) |
| Professional & Scientific | 39 (41.5%) | 55 (58.5%) |
| Enterprise Management | 0 (0.0%) | 0 (0.0%) |
| Administrative & Support | 0 (0.0%) | 4 (100.0%) |
| Educational Services | 20 (52.6%) | 18 (47.4%) |
| Health Care & Social Assistance | 54 (38.9%) | 85 (61.2%) |
| Arts, Entertainment & Recreation | 14 (100.0%) | 0 (0.0%) |
| Accommodation & Food Services | 29 (100.0%) | 0 (0.0%) |
| Public Administration | 70 (76.1%) | 22 (23.9%) |
| Total | 641 (53.7%) | 553 (46.3%) |
Education in La Selva Beach
School Enrollment in La Selva Beach
The most common levels of schooling among the 645 students in La Selva Beach are college / undergraduate (211 | 32.7%), kindergarten (129 | 20.0%), and graduate / professional (83 | 12.9%).
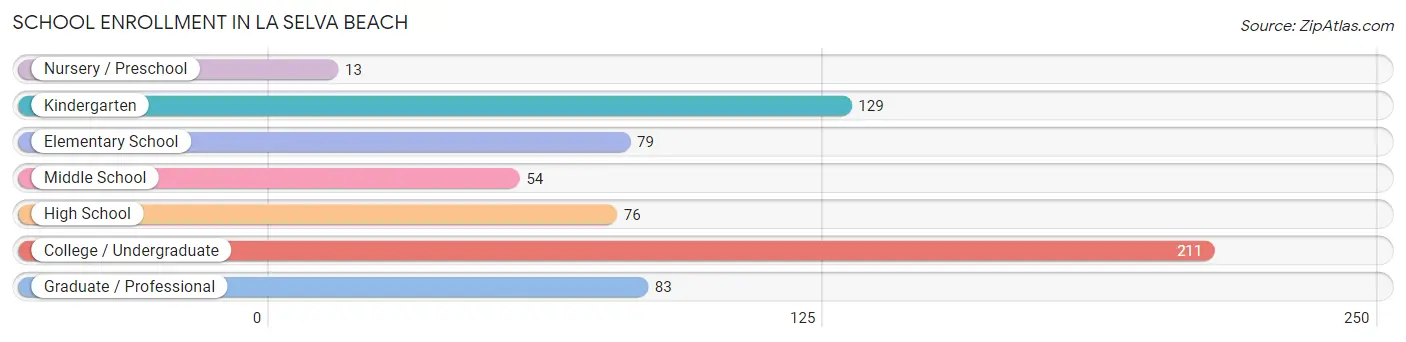
| School Level | # Students | % Students |
| Nursery / Preschool | 13 | 2.0% |
| Kindergarten | 129 | 20.0% |
| Elementary School | 79 | 12.2% |
| Middle School | 54 | 8.4% |
| High School | 76 | 11.8% |
| College / Undergraduate | 211 | 32.7% |
| Graduate / Professional | 83 | 12.9% |
| Total | 645 | 100.0% |
School Enrollment by Age by Funding Source in La Selva Beach
Out of a total of 645 students who are enrolled in schools in La Selva Beach, 92 (14.3%) attend a private institution, while the remaining 553 (85.7%) are enrolled in public schools. The age group of 3 to 4 year olds has the highest likelihood of being enrolled in private schools, with 13 (100.0% in the age bracket) enrolled. Conversely, the age group of 18 to 19 year olds has the lowest likelihood of being enrolled in a private school, with 79 (100.0% in the age bracket) attending a public institution.
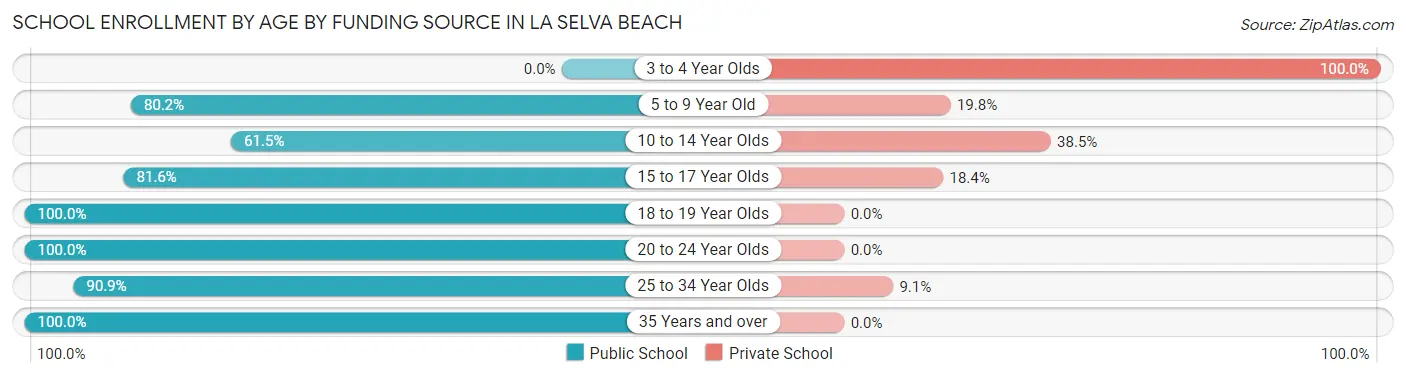
| Age Bracket | Public School | Private School |
| 3 to 4 Year Olds | 0 (0.0%) | 13 (100.0%) |
| 5 to 9 Year Old | 158 (80.2%) | 39 (19.8%) |
| 10 to 14 Year Olds | 40 (61.5%) | 25 (38.5%) |
| 15 to 17 Year Olds | 62 (81.6%) | 14 (18.4%) |
| 18 to 19 Year Olds | 79 (100.0%) | 0 (0.0%) |
| 20 to 24 Year Olds | 35 (100.0%) | 0 (0.0%) |
| 25 to 34 Year Olds | 10 (90.9%) | 1 (9.1%) |
| 35 Years and over | 169 (100.0%) | 0 (0.0%) |
| Total | 553 (85.7%) | 92 (14.3%) |
Educational Attainment by Field of Study in La Selva Beach
Business (229 | 18.4%), social sciences (154 | 12.3%), bio, nature & agricultural (133 | 10.7%), literature & languages (118 | 9.5%), and science & technology (109 | 8.7%) are the most common fields of study among 1,247 individuals in La Selva Beach who have obtained a bachelor's degree or higher.
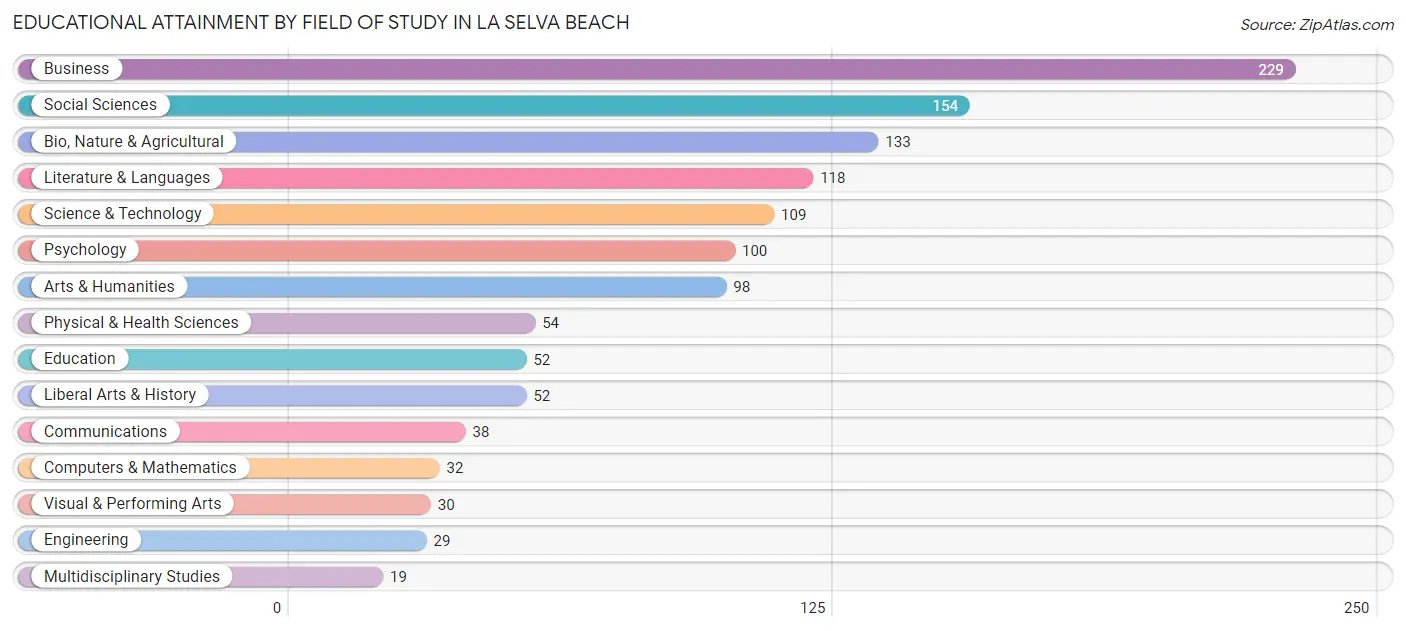
| Field of Study | # Graduates | % Graduates |
| Computers & Mathematics | 32 | 2.6% |
| Bio, Nature & Agricultural | 133 | 10.7% |
| Physical & Health Sciences | 54 | 4.3% |
| Psychology | 100 | 8.0% |
| Social Sciences | 154 | 12.3% |
| Engineering | 29 | 2.3% |
| Multidisciplinary Studies | 19 | 1.5% |
| Science & Technology | 109 | 8.7% |
| Business | 229 | 18.4% |
| Education | 52 | 4.2% |
| Literature & Languages | 118 | 9.5% |
| Liberal Arts & History | 52 | 4.2% |
| Visual & Performing Arts | 30 | 2.4% |
| Communications | 38 | 3.0% |
| Arts & Humanities | 98 | 7.9% |
| Total | 1,247 | 100.0% |
Transportation & Commute in La Selva Beach
Vehicle Availability by Sex in La Selva Beach
The most prevalent vehicle ownership categories in La Selva Beach are males with 2 vehicles (293, accounting for 50.0%) and females with 2 vehicles (241, making up 58.6%).
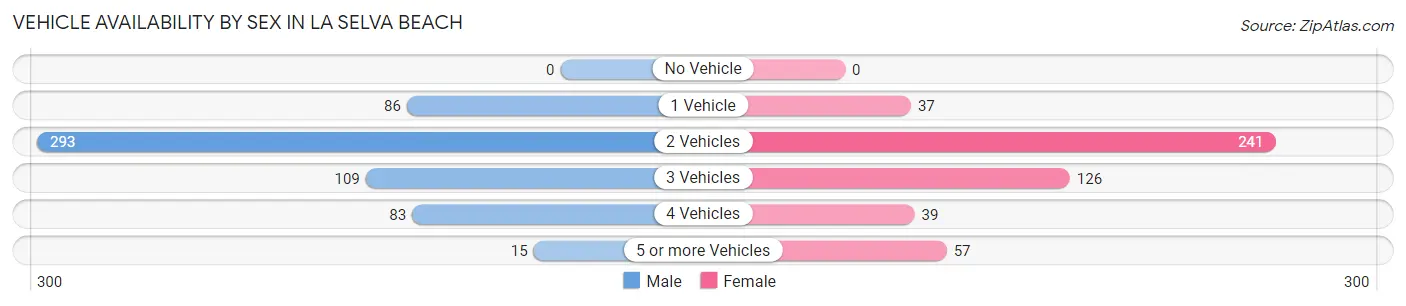
| Vehicles Available | Male | Female |
| No Vehicle | 0 (0.0%) | 0 (0.0%) |
| 1 Vehicle | 86 (14.7%) | 37 (7.4%) |
| 2 Vehicles | 293 (50.0%) | 241 (48.2%) |
| 3 Vehicles | 109 (18.6%) | 126 (25.2%) |
| 4 Vehicles | 83 (14.2%) | 39 (7.8%) |
| 5 or more Vehicles | 15 (2.6%) | 57 (11.4%) |
| Total | 586 (100.0%) | 500 (100.0%) |
Commute Time in La Selva Beach
The most frequently occuring commute durations in La Selva Beach are 15 to 19 minutes (186 commuters, 18.2%), 45 to 59 minutes (157 commuters, 15.4%), and 20 to 24 minutes (151 commuters, 14.8%).
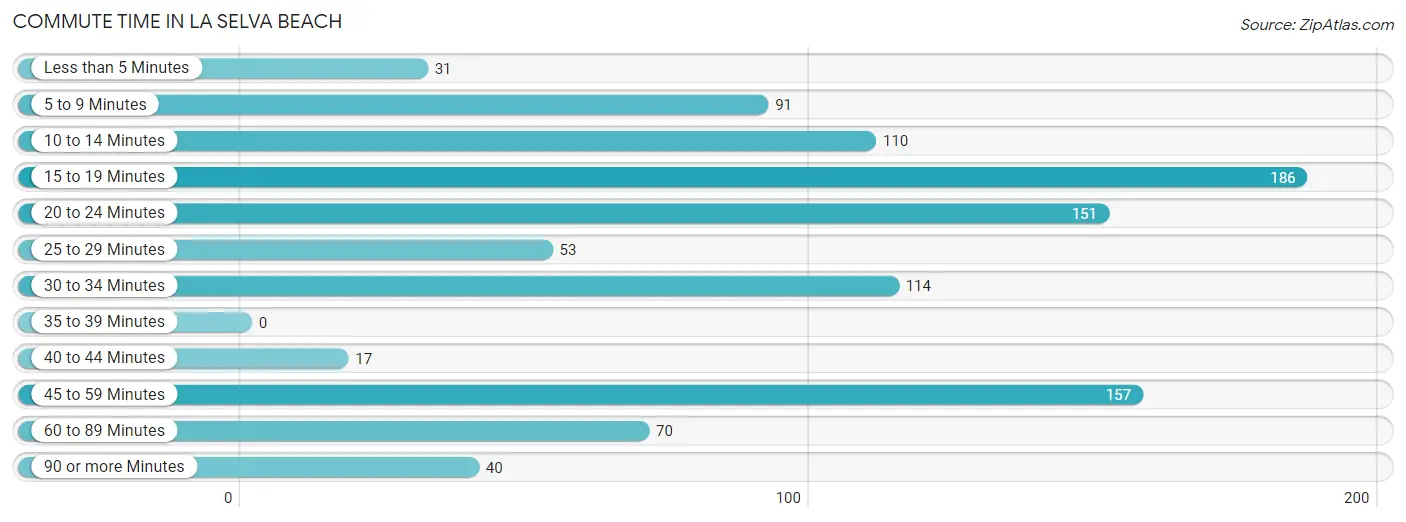
| Commute Time | # Commuters | % Commuters |
| Less than 5 Minutes | 31 | 3.0% |
| 5 to 9 Minutes | 91 | 8.9% |
| 10 to 14 Minutes | 110 | 10.8% |
| 15 to 19 Minutes | 186 | 18.2% |
| 20 to 24 Minutes | 151 | 14.8% |
| 25 to 29 Minutes | 53 | 5.2% |
| 30 to 34 Minutes | 114 | 11.2% |
| 35 to 39 Minutes | 0 | 0.0% |
| 40 to 44 Minutes | 17 | 1.7% |
| 45 to 59 Minutes | 157 | 15.4% |
| 60 to 89 Minutes | 70 | 6.9% |
| 90 or more Minutes | 40 | 3.9% |
Commute Time by Sex in La Selva Beach
The most common commute times in La Selva Beach are 45 to 59 minutes (142 commuters, 24.2%) for males and 15 to 19 minutes (116 commuters, 26.8%) for females.
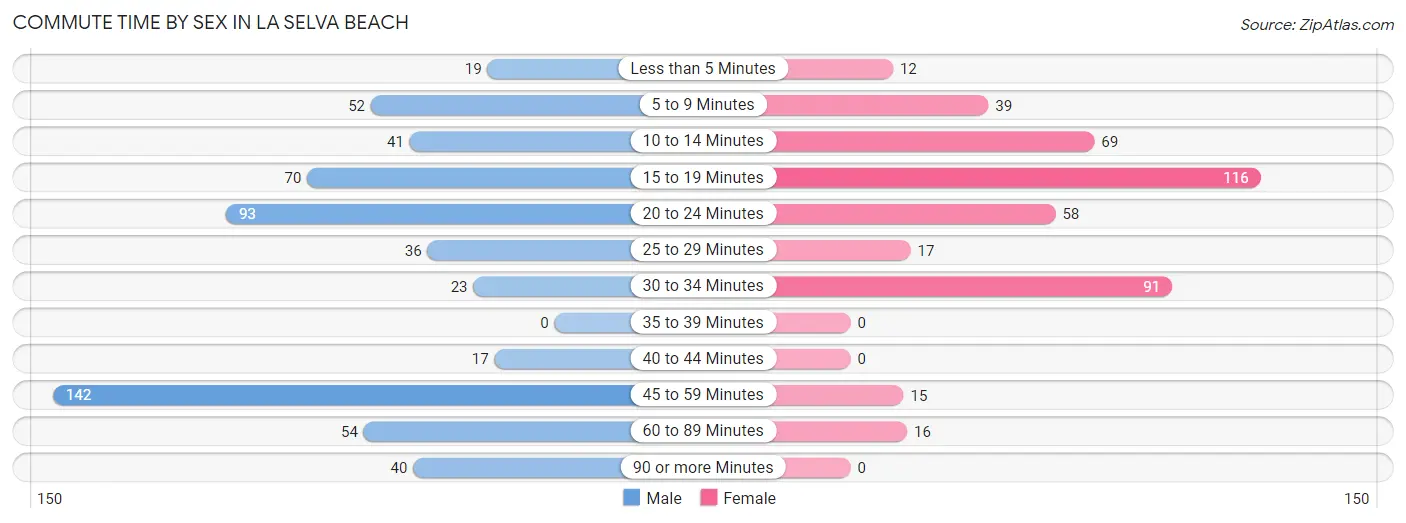
| Commute Time | Male | Female |
| Less than 5 Minutes | 19 (3.2%) | 12 (2.8%) |
| 5 to 9 Minutes | 52 (8.9%) | 39 (9.0%) |
| 10 to 14 Minutes | 41 (7.0%) | 69 (15.9%) |
| 15 to 19 Minutes | 70 (11.9%) | 116 (26.8%) |
| 20 to 24 Minutes | 93 (15.8%) | 58 (13.4%) |
| 25 to 29 Minutes | 36 (6.1%) | 17 (3.9%) |
| 30 to 34 Minutes | 23 (3.9%) | 91 (21.0%) |
| 35 to 39 Minutes | 0 (0.0%) | 0 (0.0%) |
| 40 to 44 Minutes | 17 (2.9%) | 0 (0.0%) |
| 45 to 59 Minutes | 142 (24.2%) | 15 (3.5%) |
| 60 to 89 Minutes | 54 (9.2%) | 16 (3.7%) |
| 90 or more Minutes | 40 (6.8%) | 0 (0.0%) |
Time of Departure to Work by Sex in La Selva Beach
The most frequent times of departure to work in La Selva Beach are 8:00 AM to 8:29 AM (112, 19.1%) for males and 8:30 AM to 8:59 AM (183, 42.3%) for females.
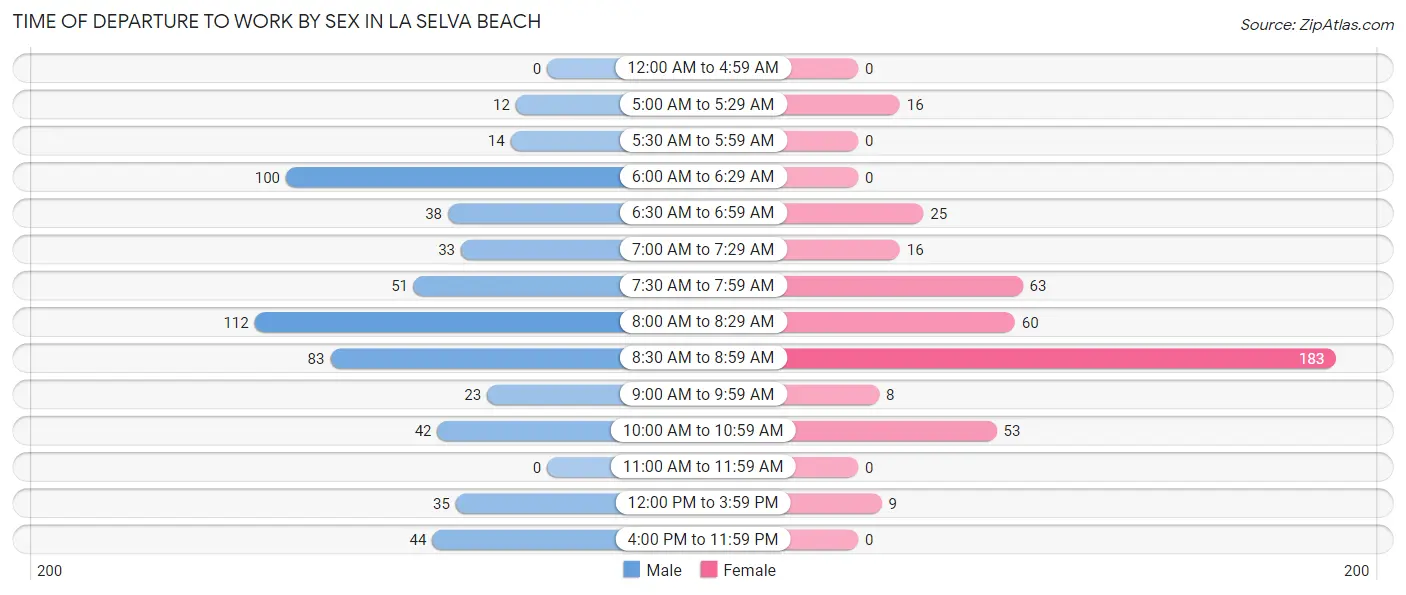
| Time of Departure | Male | Female |
| 12:00 AM to 4:59 AM | 0 (0.0%) | 0 (0.0%) |
| 5:00 AM to 5:29 AM | 12 (2.0%) | 16 (3.7%) |
| 5:30 AM to 5:59 AM | 14 (2.4%) | 0 (0.0%) |
| 6:00 AM to 6:29 AM | 100 (17.0%) | 0 (0.0%) |
| 6:30 AM to 6:59 AM | 38 (6.5%) | 25 (5.8%) |
| 7:00 AM to 7:29 AM | 33 (5.6%) | 16 (3.7%) |
| 7:30 AM to 7:59 AM | 51 (8.7%) | 63 (14.5%) |
| 8:00 AM to 8:29 AM | 112 (19.1%) | 60 (13.9%) |
| 8:30 AM to 8:59 AM | 83 (14.1%) | 183 (42.3%) |
| 9:00 AM to 9:59 AM | 23 (3.9%) | 8 (1.8%) |
| 10:00 AM to 10:59 AM | 42 (7.2%) | 53 (12.2%) |
| 11:00 AM to 11:59 AM | 0 (0.0%) | 0 (0.0%) |
| 12:00 PM to 3:59 PM | 35 (6.0%) | 9 (2.1%) |
| 4:00 PM to 11:59 PM | 44 (7.5%) | 0 (0.0%) |
| Total | 587 (100.0%) | 433 (100.0%) |
Housing Occupancy in La Selva Beach
Occupancy by Ownership in La Selva Beach
Of the total 906 dwellings in La Selva Beach, owner-occupied units account for 511 (56.4%), while renter-occupied units make up 395 (43.6%).
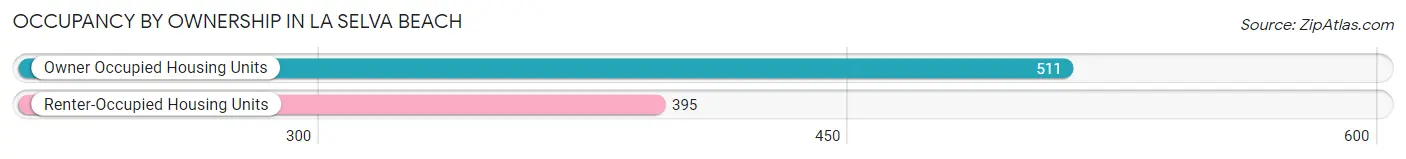
| Occupancy | # Housing Units | % Housing Units |
| Owner Occupied Housing Units | 511 | 56.4% |
| Renter-Occupied Housing Units | 395 | 43.6% |
| Total Occupied Housing Units | 906 | 100.0% |
Occupancy by Household Size in La Selva Beach
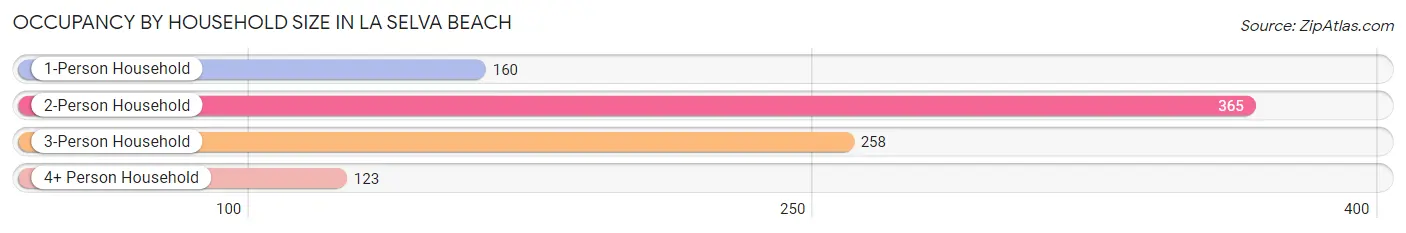
| Household Size | # Housing Units | % Housing Units |
| 1-Person Household | 160 | 17.7% |
| 2-Person Household | 365 | 40.3% |
| 3-Person Household | 258 | 28.5% |
| 4+ Person Household | 123 | 13.6% |
| Total Housing Units | 906 | 100.0% |
Occupancy by Ownership by Household Size in La Selva Beach

| Household Size | Owner-occupied | Renter-occupied |
| 1-Person Household | 129 (80.6%) | 31 (19.4%) |
| 2-Person Household | 221 (60.6%) | 144 (39.5%) |
| 3-Person Household | 96 (37.2%) | 162 (62.8%) |
| 4+ Person Household | 65 (52.8%) | 58 (47.1%) |
| Total Housing Units | 511 (56.4%) | 395 (43.6%) |
Occupancy by Educational Attainment in La Selva Beach
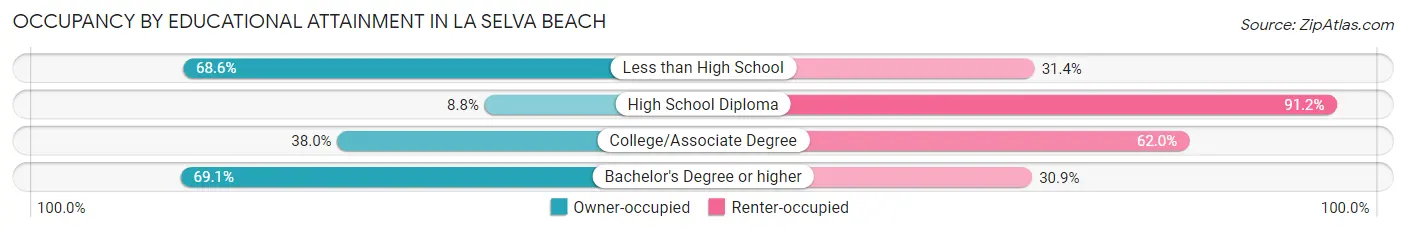
| Household Size | Owner-occupied | Renter-occupied |
| Less than High School | 24 (68.6%) | 11 (31.4%) |
| High School Diploma | 5 (8.8%) | 52 (91.2%) |
| College/Associate Degree | 98 (38.0%) | 160 (62.0%) |
| Bachelor's Degree or higher | 384 (69.1%) | 172 (30.9%) |
Occupancy by Age of Householder in La Selva Beach
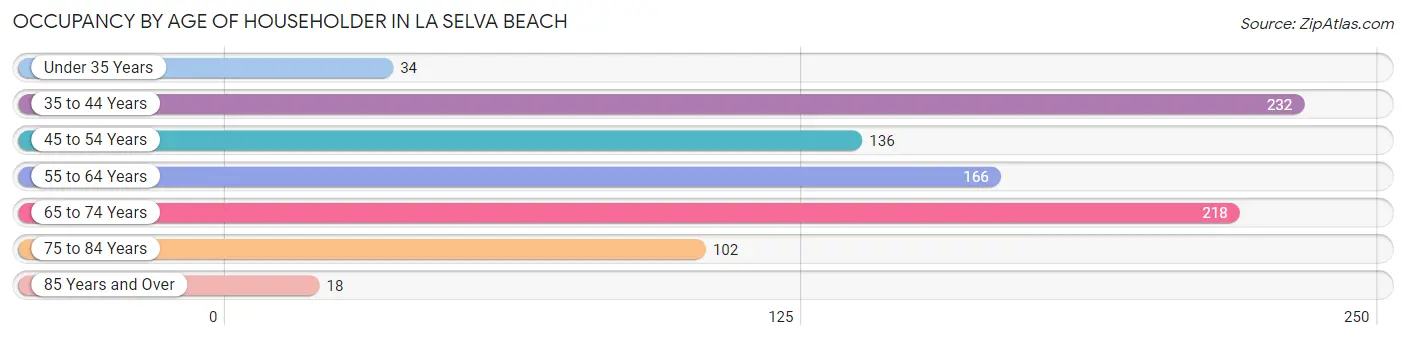
| Age Bracket | # Households | % Households |
| Under 35 Years | 34 | 3.7% |
| 35 to 44 Years | 232 | 25.6% |
| 45 to 54 Years | 136 | 15.0% |
| 55 to 64 Years | 166 | 18.3% |
| 65 to 74 Years | 218 | 24.1% |
| 75 to 84 Years | 102 | 11.3% |
| 85 Years and Over | 18 | 2.0% |
| Total | 906 | 100.0% |
Housing Finances in La Selva Beach
Median Income by Occupancy in La Selva Beach
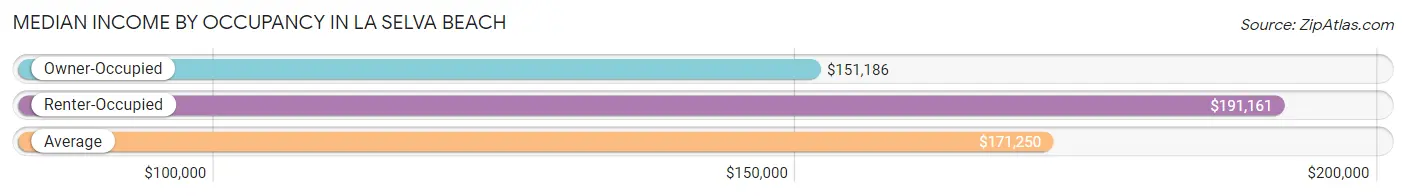
| Occupancy Type | # Households | Median Income |
| Owner-Occupied | 511 (56.4%) | $151,186 |
| Renter-Occupied | 395 (43.6%) | $191,161 |
| Average | 906 (100.0%) | $171,250 |
Occupancy by Householder Income Bracket in La Selva Beach
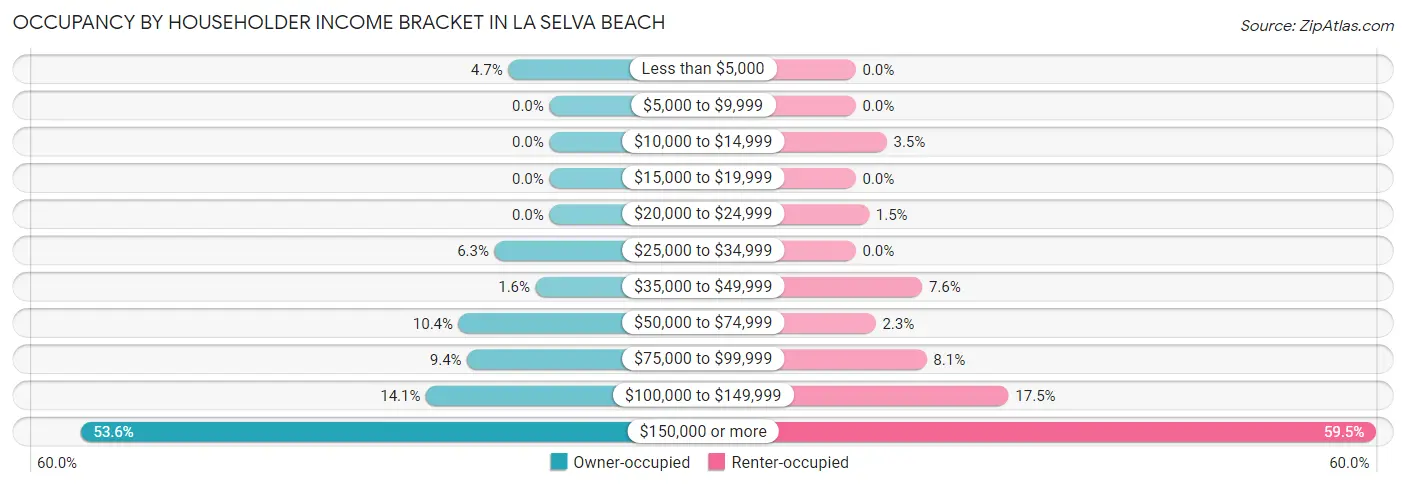
| Income Bracket | Owner-occupied | Renter-occupied |
| Less than $5,000 | 24 (4.7%) | 0 (0.0%) |
| $5,000 to $9,999 | 0 (0.0%) | 0 (0.0%) |
| $10,000 to $14,999 | 0 (0.0%) | 14 (3.5%) |
| $15,000 to $19,999 | 0 (0.0%) | 0 (0.0%) |
| $20,000 to $24,999 | 0 (0.0%) | 6 (1.5%) |
| $25,000 to $34,999 | 32 (6.3%) | 0 (0.0%) |
| $35,000 to $49,999 | 8 (1.6%) | 30 (7.6%) |
| $50,000 to $74,999 | 53 (10.4%) | 9 (2.3%) |
| $75,000 to $99,999 | 48 (9.4%) | 32 (8.1%) |
| $100,000 to $149,999 | 72 (14.1%) | 69 (17.5%) |
| $150,000 or more | 274 (53.6%) | 235 (59.5%) |
| Total | 511 (100.0%) | 395 (100.0%) |
Monthly Housing Cost Tiers in La Selva Beach
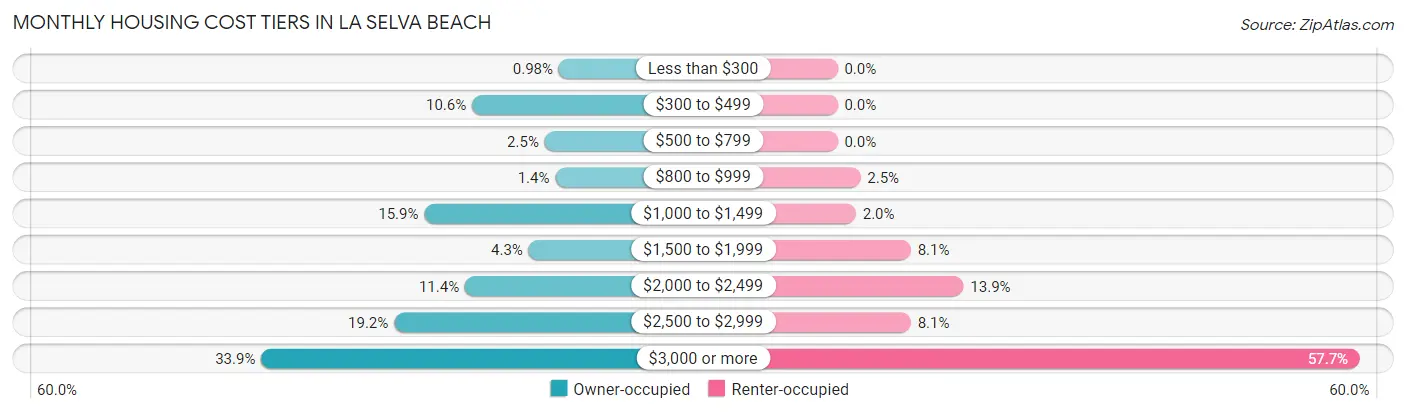
| Monthly Cost | Owner-occupied | Renter-occupied |
| Less than $300 | 5 (1.0%) | 0 (0.0%) |
| $300 to $499 | 54 (10.6%) | 0 (0.0%) |
| $500 to $799 | 13 (2.5%) | 0 (0.0%) |
| $800 to $999 | 7 (1.4%) | 10 (2.5%) |
| $1,000 to $1,499 | 81 (15.9%) | 8 (2.0%) |
| $1,500 to $1,999 | 22 (4.3%) | 32 (8.1%) |
| $2,000 to $2,499 | 58 (11.4%) | 55 (13.9%) |
| $2,500 to $2,999 | 98 (19.2%) | 32 (8.1%) |
| $3,000 or more | 173 (33.9%) | 228 (57.7%) |
| Total | 511 (100.0%) | 395 (100.0%) |
Physical Housing Characteristics in La Selva Beach
Housing Structures in La Selva Beach
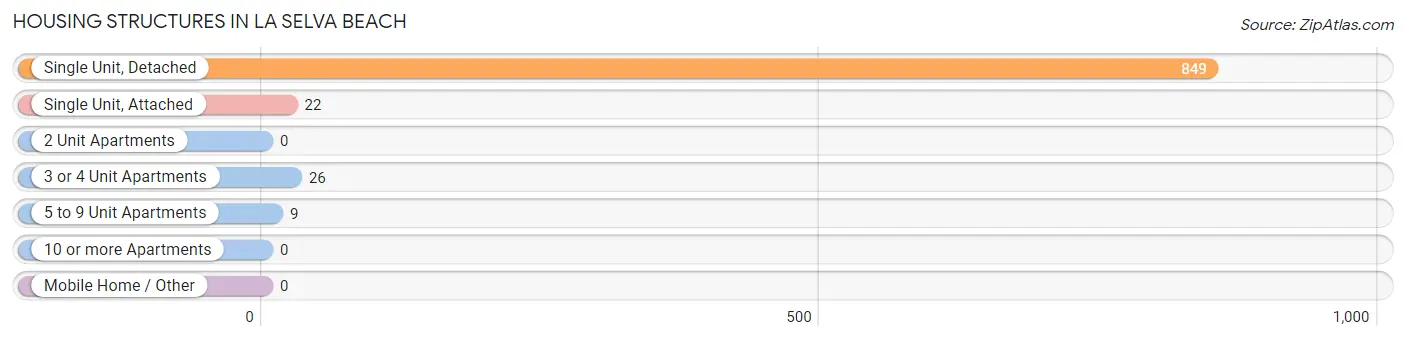
| Structure Type | # Housing Units | % Housing Units |
| Single Unit, Detached | 849 | 93.7% |
| Single Unit, Attached | 22 | 2.4% |
| 2 Unit Apartments | 0 | 0.0% |
| 3 or 4 Unit Apartments | 26 | 2.9% |
| 5 to 9 Unit Apartments | 9 | 1.0% |
| 10 or more Apartments | 0 | 0.0% |
| Mobile Home / Other | 0 | 0.0% |
| Total | 906 | 100.0% |
Housing Structures by Occupancy in La Selva Beach
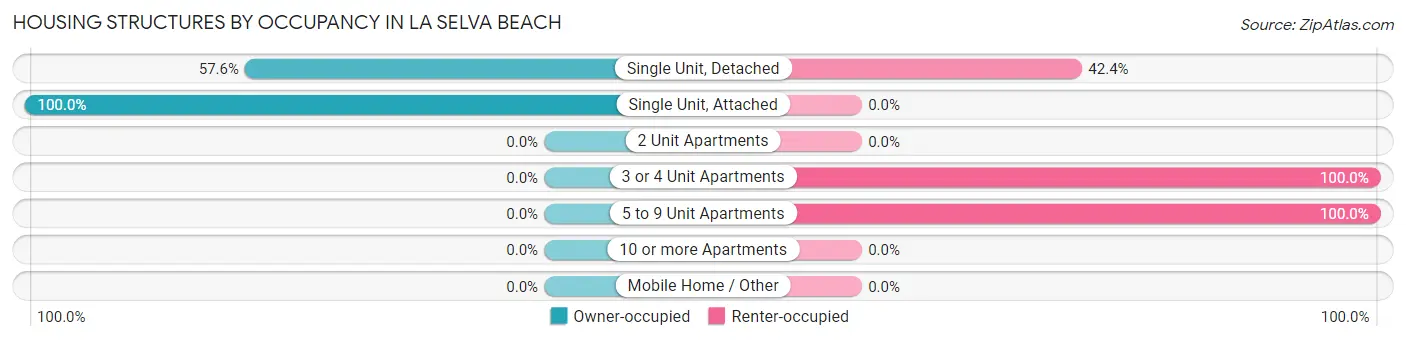
| Structure Type | Owner-occupied | Renter-occupied |
| Single Unit, Detached | 489 (57.6%) | 360 (42.4%) |
| Single Unit, Attached | 22 (100.0%) | 0 (0.0%) |
| 2 Unit Apartments | 0 (0.0%) | 0 (0.0%) |
| 3 or 4 Unit Apartments | 0 (0.0%) | 26 (100.0%) |
| 5 to 9 Unit Apartments | 0 (0.0%) | 9 (100.0%) |
| 10 or more Apartments | 0 (0.0%) | 0 (0.0%) |
| Mobile Home / Other | 0 (0.0%) | 0 (0.0%) |
| Total | 511 (56.4%) | 395 (43.6%) |
Housing Structures by Number of Rooms in La Selva Beach
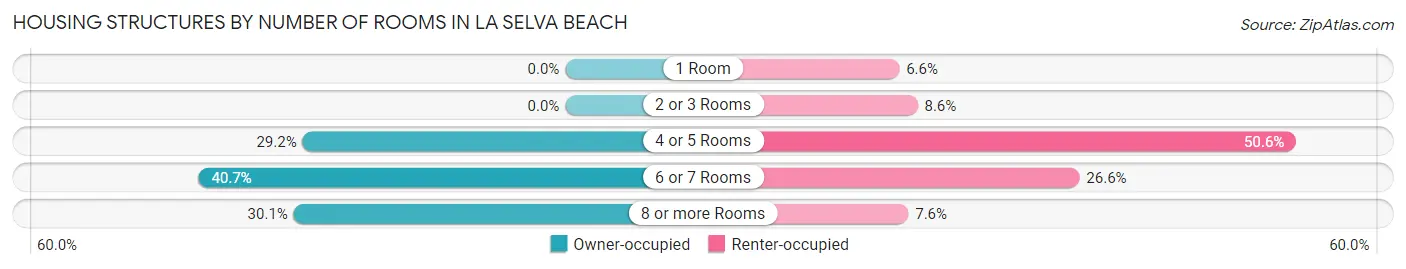
| Number of Rooms | Owner-occupied | Renter-occupied |
| 1 Room | 0 (0.0%) | 26 (6.6%) |
| 2 or 3 Rooms | 0 (0.0%) | 34 (8.6%) |
| 4 or 5 Rooms | 149 (29.2%) | 200 (50.6%) |
| 6 or 7 Rooms | 208 (40.7%) | 105 (26.6%) |
| 8 or more Rooms | 154 (30.1%) | 30 (7.6%) |
| Total | 511 (100.0%) | 395 (100.0%) |
Housing Structure by Heating Type in La Selva Beach
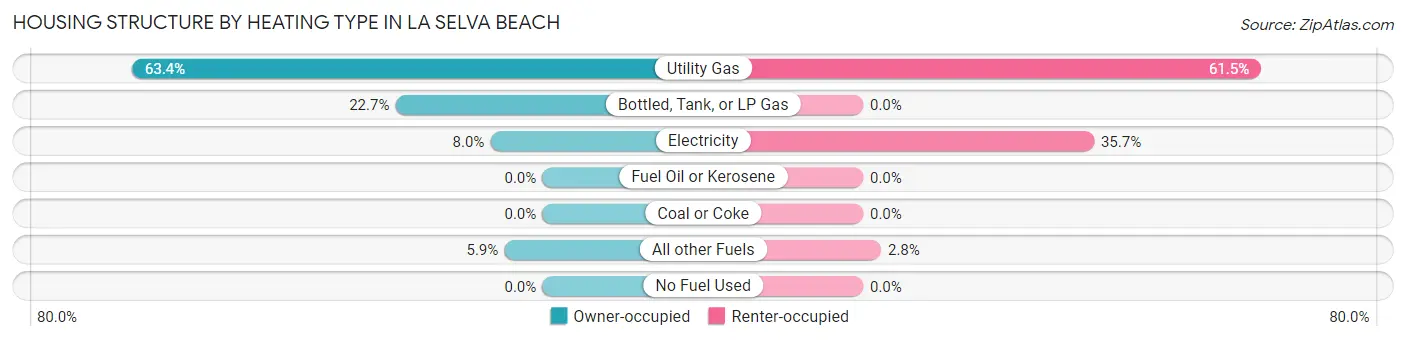
| Heating Type | Owner-occupied | Renter-occupied |
| Utility Gas | 324 (63.4%) | 243 (61.5%) |
| Bottled, Tank, or LP Gas | 116 (22.7%) | 0 (0.0%) |
| Electricity | 41 (8.0%) | 141 (35.7%) |
| Fuel Oil or Kerosene | 0 (0.0%) | 0 (0.0%) |
| Coal or Coke | 0 (0.0%) | 0 (0.0%) |
| All other Fuels | 30 (5.9%) | 11 (2.8%) |
| No Fuel Used | 0 (0.0%) | 0 (0.0%) |
| Total | 511 (100.0%) | 395 (100.0%) |
Household Vehicle Usage in La Selva Beach
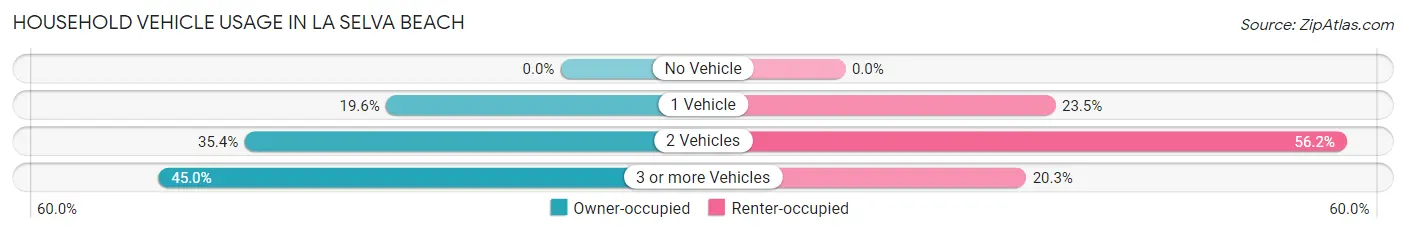
| Vehicles per Household | Owner-occupied | Renter-occupied |
| No Vehicle | 0 (0.0%) | 0 (0.0%) |
| 1 Vehicle | 100 (19.6%) | 93 (23.5%) |
| 2 Vehicles | 181 (35.4%) | 222 (56.2%) |
| 3 or more Vehicles | 230 (45.0%) | 80 (20.3%) |
| Total | 511 (100.0%) | 395 (100.0%) |
Real Estate & Mortgages in La Selva Beach
Real Estate and Mortgage Overview in La Selva Beach
| Characteristic | Without Mortgage | With Mortgage |
| Housing Units | 183 | 328 |
| Median Property Value | $1,059,400 | $1,238,700 |
| Median Household Income | $151,314 | $162 |
| Monthly Housing Costs | $1,057 | $163 |
| Real Estate Taxes | $8,063 | $0 |
Property Value by Mortgage Status in La Selva Beach
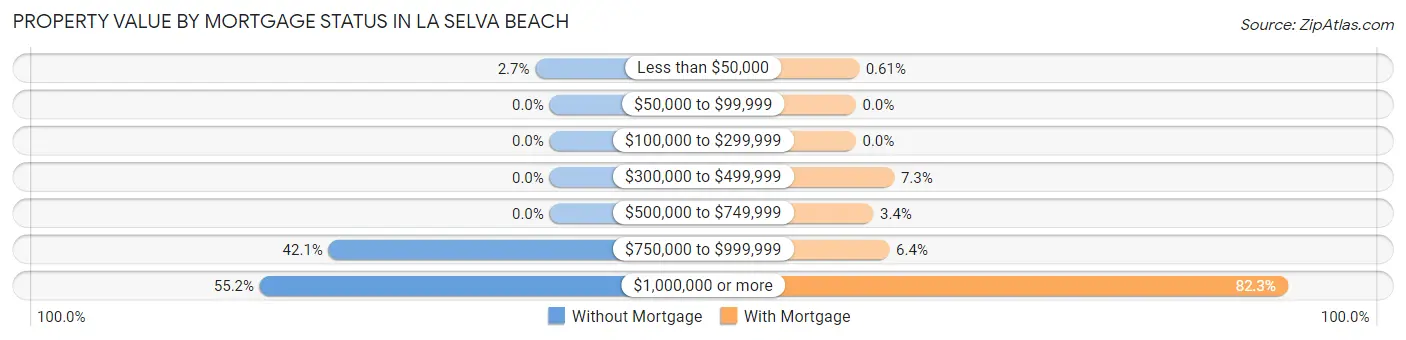
| Property Value | Without Mortgage | With Mortgage |
| Less than $50,000 | 5 (2.7%) | 2 (0.6%) |
| $50,000 to $99,999 | 0 (0.0%) | 0 (0.0%) |
| $100,000 to $299,999 | 0 (0.0%) | 0 (0.0%) |
| $300,000 to $499,999 | 0 (0.0%) | 24 (7.3%) |
| $500,000 to $749,999 | 0 (0.0%) | 11 (3.4%) |
| $750,000 to $999,999 | 77 (42.1%) | 21 (6.4%) |
| $1,000,000 or more | 101 (55.2%) | 270 (82.3%) |
| Total | 183 (100.0%) | 328 (100.0%) |
Household Income by Mortgage Status in La Selva Beach
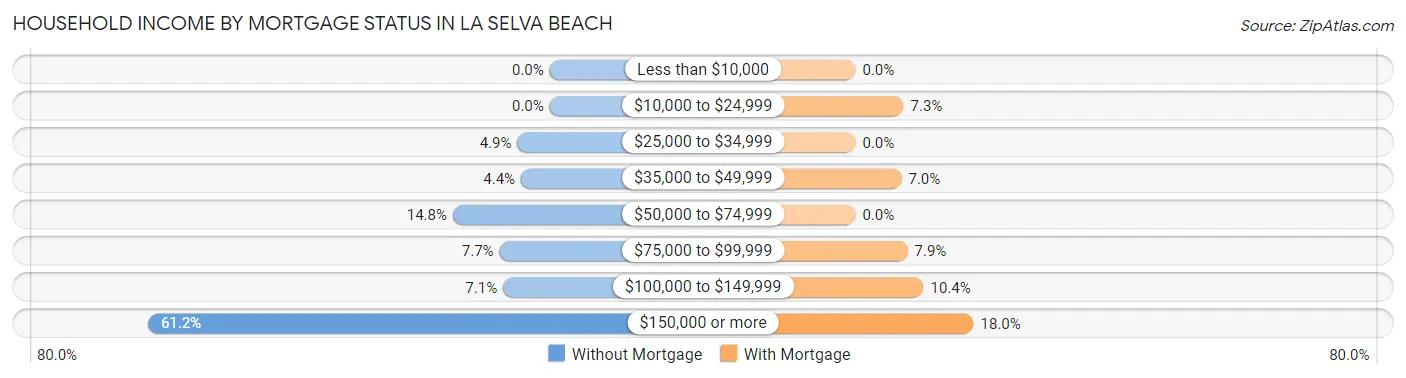
| Household Income | Without Mortgage | With Mortgage |
| Less than $10,000 | 0 (0.0%) | 0 (0.0%) |
| $10,000 to $24,999 | 0 (0.0%) | 24 (7.3%) |
| $25,000 to $34,999 | 9 (4.9%) | 0 (0.0%) |
| $35,000 to $49,999 | 8 (4.4%) | 23 (7.0%) |
| $50,000 to $74,999 | 27 (14.7%) | 0 (0.0%) |
| $75,000 to $99,999 | 14 (7.6%) | 26 (7.9%) |
| $100,000 to $149,999 | 13 (7.1%) | 34 (10.4%) |
| $150,000 or more | 112 (61.2%) | 59 (18.0%) |
| Total | 183 (100.0%) | 328 (100.0%) |
Property Value to Household Income Ratio in La Selva Beach
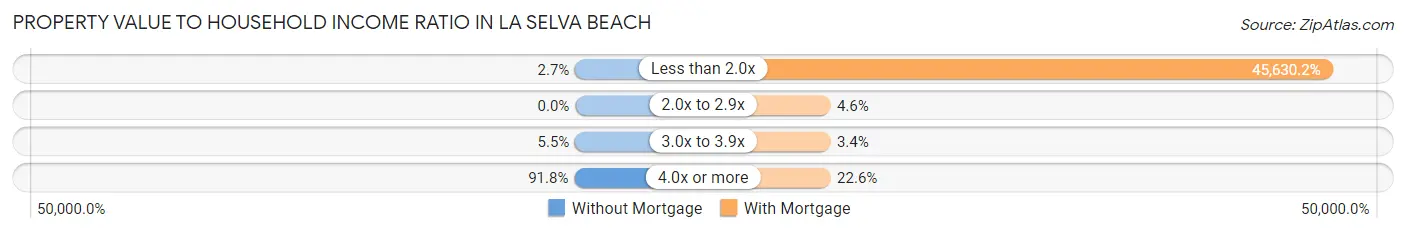
| Value-to-Income Ratio | Without Mortgage | With Mortgage |
| Less than 2.0x | 5 (2.7%) | 149,667 (45,630.2%) |
| 2.0x to 2.9x | 0 (0.0%) | 15 (4.6%) |
| 3.0x to 3.9x | 10 (5.5%) | 11 (3.4%) |
| 4.0x or more | 168 (91.8%) | 74 (22.6%) |
| Total | 183 (100.0%) | 328 (100.0%) |
Real Estate Taxes by Mortgage Status in La Selva Beach

| Property Taxes | Without Mortgage | With Mortgage |
| Less than $800 | 0 (0.0%) | 24 (7.3%) |
| $800 to $1,499 | 5 (2.7%) | 0 (0.0%) |
| $800 to $1,499 | 173 (94.5%) | 7 (2.1%) |
| Total | 183 (100.0%) | 328 (100.0%) |
Health & Disability in La Selva Beach
Health Insurance Coverage by Age in La Selva Beach
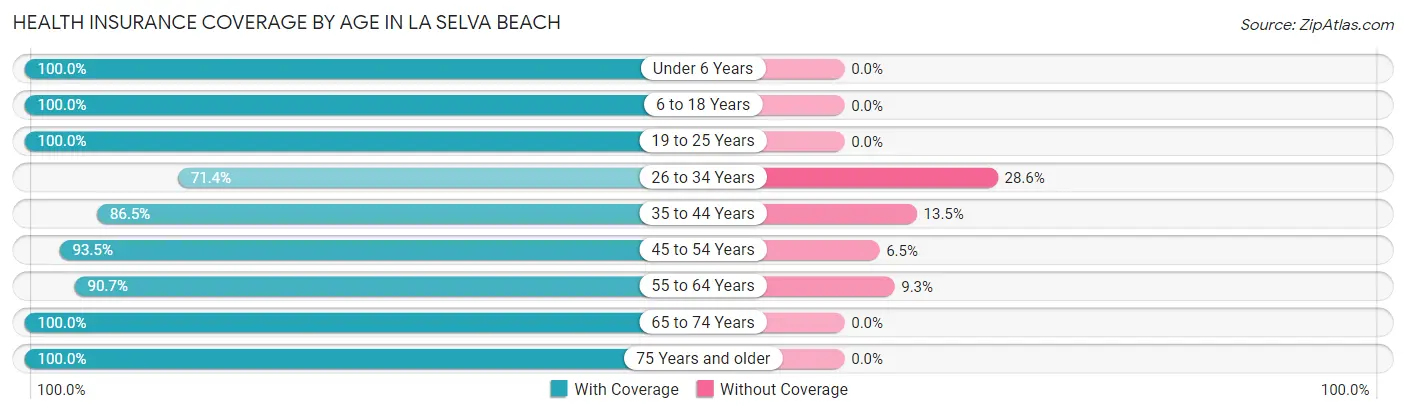
| Age Bracket | With Coverage | Without Coverage |
| Under 6 Years | 86 (100.0%) | 0 (0.0%) |
| 6 to 18 Years | 377 (100.0%) | 0 (0.0%) |
| 19 to 25 Years | 166 (100.0%) | 0 (0.0%) |
| 26 to 34 Years | 85 (71.4%) | 34 (28.6%) |
| 35 to 44 Years | 436 (86.5%) | 68 (13.5%) |
| 45 to 54 Years | 201 (93.5%) | 14 (6.5%) |
| 55 to 64 Years | 214 (90.7%) | 22 (9.3%) |
| 65 to 74 Years | 423 (100.0%) | 0 (0.0%) |
| 75 Years and older | 192 (100.0%) | 0 (0.0%) |
| Total | 2,180 (94.1%) | 138 (5.9%) |
Health Insurance Coverage by Citizenship Status in La Selva Beach
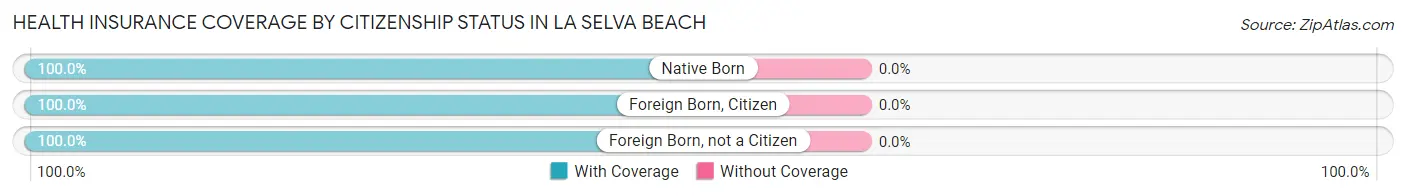
| Citizenship Status | With Coverage | Without Coverage |
| Native Born | 86 (100.0%) | 0 (0.0%) |
| Foreign Born, Citizen | 377 (100.0%) | 0 (0.0%) |
| Foreign Born, not a Citizen | 166 (100.0%) | 0 (0.0%) |
Health Insurance Coverage by Household Income in La Selva Beach
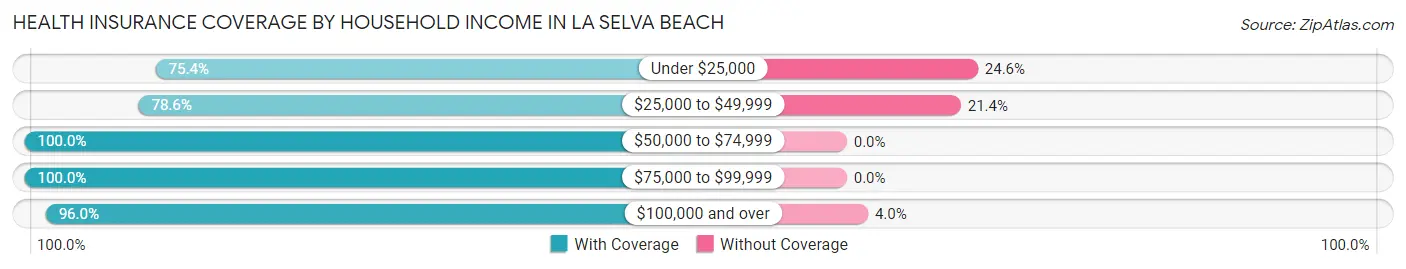
| Household Income | With Coverage | Without Coverage |
| Under $25,000 | 43 (75.4%) | 14 (24.6%) |
| $25,000 to $49,999 | 81 (78.6%) | 22 (21.4%) |
| $50,000 to $74,999 | 103 (100.0%) | 0 (0.0%) |
| $75,000 to $99,999 | 149 (100.0%) | 0 (0.0%) |
| $100,000 and over | 1,766 (96.0%) | 73 (4.0%) |
Public vs Private Health Insurance Coverage by Age in La Selva Beach
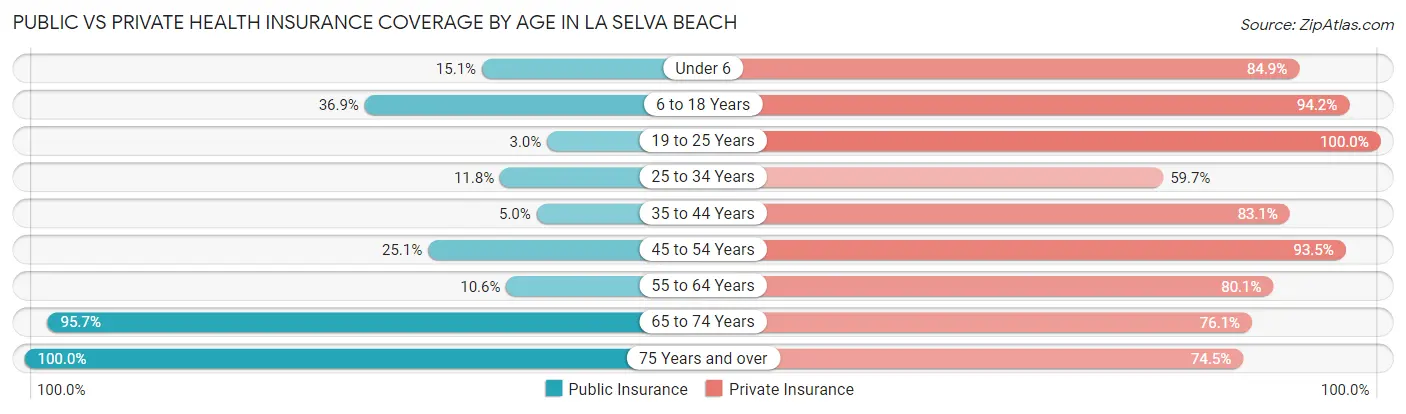
| Age Bracket | Public Insurance | Private Insurance |
| Under 6 | 13 (15.1%) | 73 (84.9%) |
| 6 to 18 Years | 139 (36.9%) | 355 (94.2%) |
| 19 to 25 Years | 5 (3.0%) | 166 (100.0%) |
| 25 to 34 Years | 14 (11.8%) | 71 (59.7%) |
| 35 to 44 Years | 25 (5.0%) | 419 (83.1%) |
| 45 to 54 Years | 54 (25.1%) | 201 (93.5%) |
| 55 to 64 Years | 25 (10.6%) | 189 (80.1%) |
| 65 to 74 Years | 405 (95.7%) | 322 (76.1%) |
| 75 Years and over | 192 (100.0%) | 143 (74.5%) |
| Total | 872 (37.6%) | 1,939 (83.7%) |
Disability Status by Sex by Age in La Selva Beach
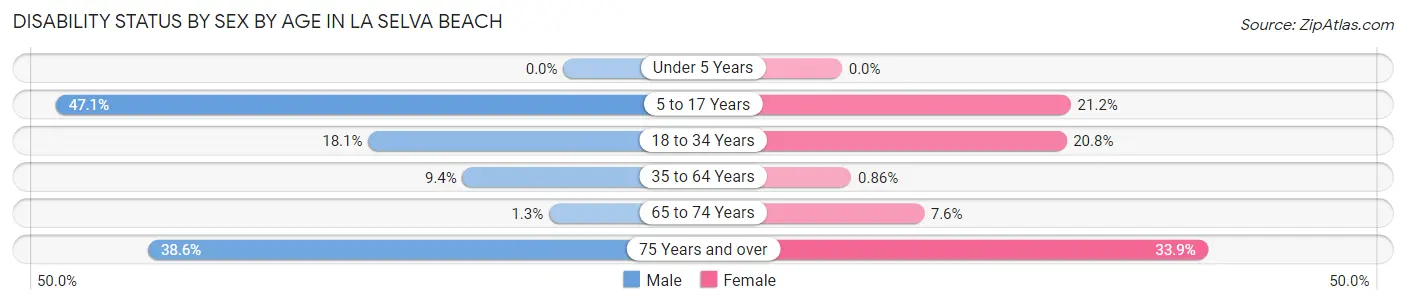
| Age Bracket | Male | Female |
| Under 5 Years | 0 (0.0%) | 0 (0.0%) |
| 5 to 17 Years | 73 (47.1%) | 48 (21.2%) |
| 18 to 34 Years | 38 (18.1%) | 30 (20.8%) |
| 35 to 64 Years | 46 (9.3%) | 4 (0.9%) |
| 65 to 74 Years | 3 (1.3%) | 15 (7.6%) |
| 75 Years and over | 32 (38.6%) | 37 (33.9%) |
Disability Class by Sex by Age in La Selva Beach
Disability Class: Hearing Difficulty
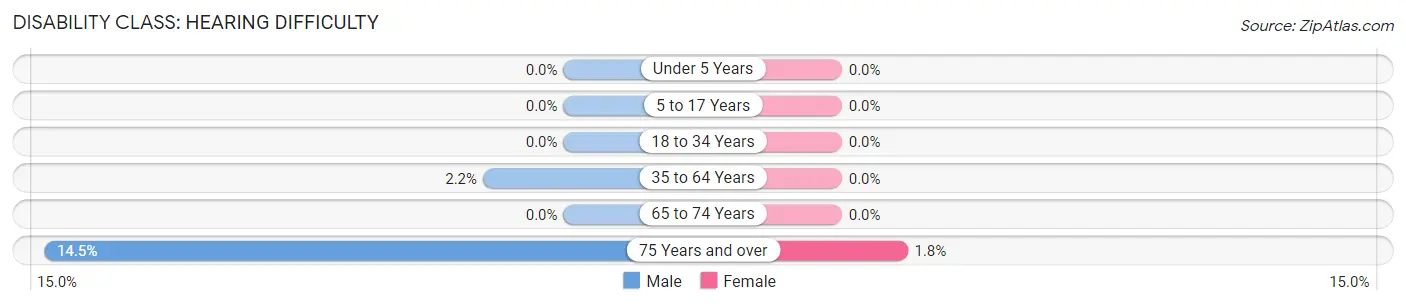
| Age Bracket | Male | Female |
| Under 5 Years | 0 (0.0%) | 0 (0.0%) |
| 5 to 17 Years | 0 (0.0%) | 0 (0.0%) |
| 18 to 34 Years | 0 (0.0%) | 0 (0.0%) |
| 35 to 64 Years | 11 (2.2%) | 0 (0.0%) |
| 65 to 74 Years | 0 (0.0%) | 0 (0.0%) |
| 75 Years and over | 12 (14.5%) | 2 (1.8%) |
Disability Class: Vision Difficulty
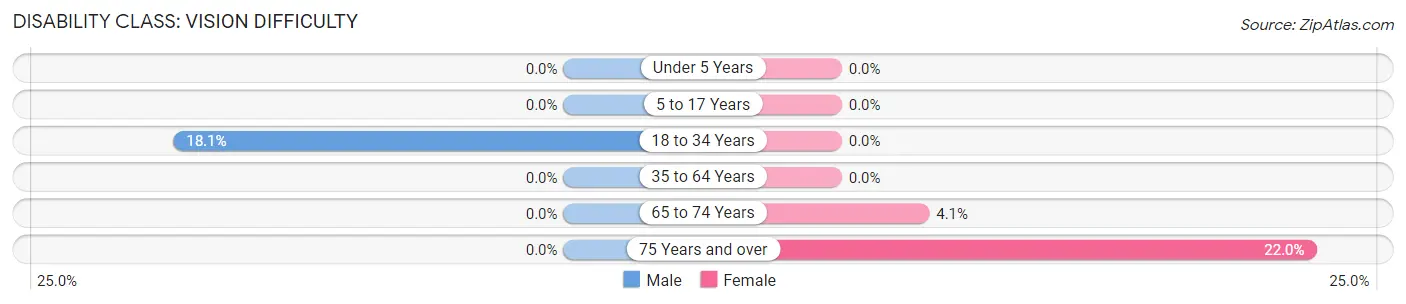
| Age Bracket | Male | Female |
| Under 5 Years | 0 (0.0%) | 0 (0.0%) |
| 5 to 17 Years | 0 (0.0%) | 0 (0.0%) |
| 18 to 34 Years | 38 (18.1%) | 0 (0.0%) |
| 35 to 64 Years | 0 (0.0%) | 0 (0.0%) |
| 65 to 74 Years | 0 (0.0%) | 8 (4.1%) |
| 75 Years and over | 0 (0.0%) | 24 (22.0%) |
Disability Class: Cognitive Difficulty
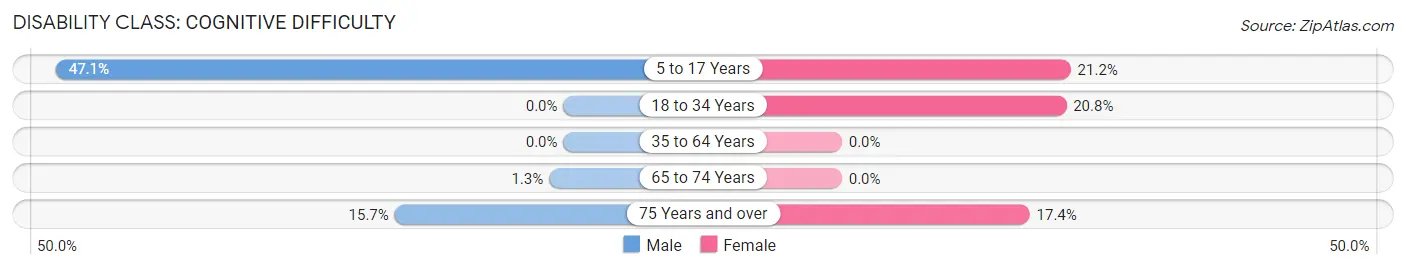
| Age Bracket | Male | Female |
| 5 to 17 Years | 73 (47.1%) | 48 (21.2%) |
| 18 to 34 Years | 0 (0.0%) | 30 (20.8%) |
| 35 to 64 Years | 0 (0.0%) | 0 (0.0%) |
| 65 to 74 Years | 3 (1.3%) | 0 (0.0%) |
| 75 Years and over | 13 (15.7%) | 19 (17.4%) |
Disability Class: Ambulatory Difficulty
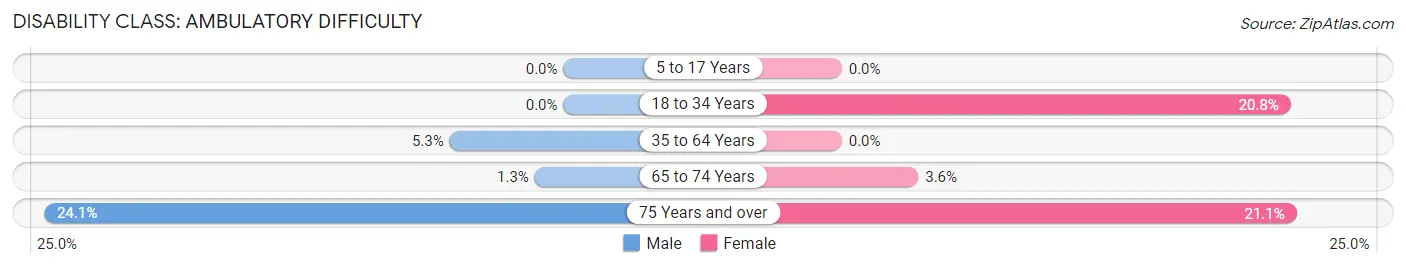
| Age Bracket | Male | Female |
| 5 to 17 Years | 0 (0.0%) | 0 (0.0%) |
| 18 to 34 Years | 0 (0.0%) | 30 (20.8%) |
| 35 to 64 Years | 26 (5.3%) | 0 (0.0%) |
| 65 to 74 Years | 3 (1.3%) | 7 (3.5%) |
| 75 Years and over | 20 (24.1%) | 23 (21.1%) |
Disability Class: Self-Care Difficulty
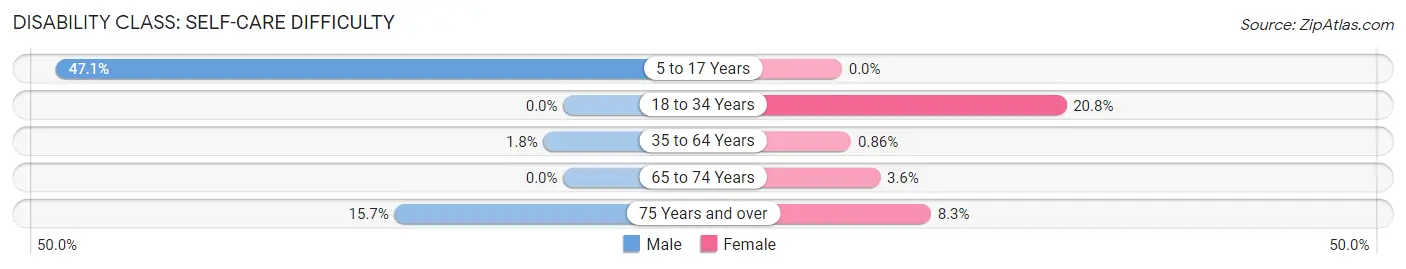
| Age Bracket | Male | Female |
| 5 to 17 Years | 73 (47.1%) | 0 (0.0%) |
| 18 to 34 Years | 0 (0.0%) | 30 (20.8%) |
| 35 to 64 Years | 9 (1.8%) | 4 (0.9%) |
| 65 to 74 Years | 0 (0.0%) | 7 (3.5%) |
| 75 Years and over | 13 (15.7%) | 9 (8.3%) |
Technology Access in La Selva Beach
Computing Device Access in La Selva Beach
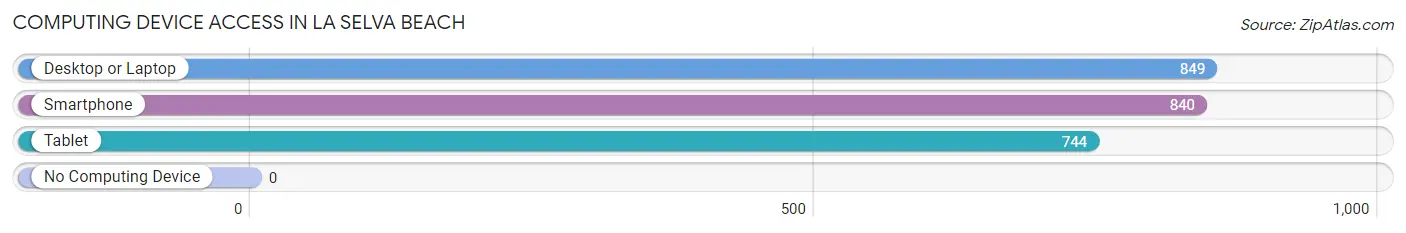
| Device Type | # Households | % Households |
| Desktop or Laptop | 849 | 93.7% |
| Smartphone | 840 | 92.7% |
| Tablet | 744 | 82.1% |
| No Computing Device | 0 | 0.0% |
| Total | 906 | 100.0% |
Internet Access in La Selva Beach
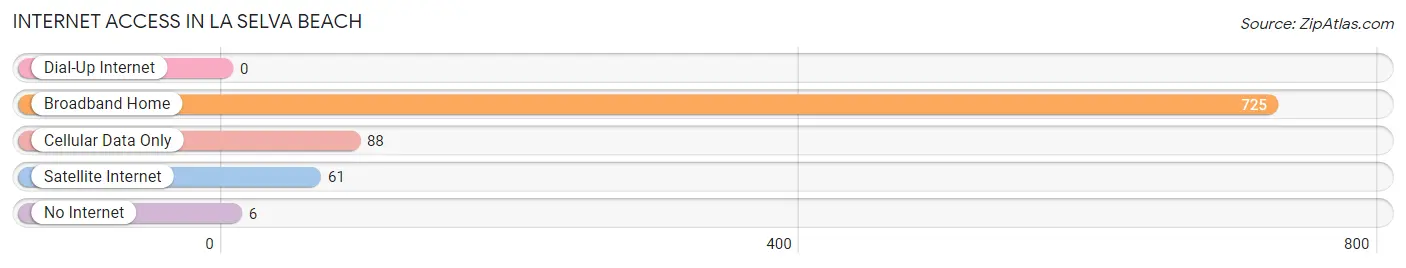
| Internet Type | # Households | % Households |
| Dial-Up Internet | 0 | 0.0% |
| Broadband Home | 725 | 80.0% |
| Cellular Data Only | 88 | 9.7% |
| Satellite Internet | 61 | 6.7% |
| No Internet | 6 | 0.7% |
| Total | 906 | 100.0% |
La Selva Beach Summary
Selva Beach is a small unincorporated community located in Santa Cruz County, California. It is situated on the Monterey Bay, just south of the city of Santa Cruz. The population of Selva Beach was estimated to be 1,845 in 2019.
History
Selva Beach was originally inhabited by the Ohlone people, who lived in the area for thousands of years before the arrival of Europeans. The first Europeans to settle in the area were Spanish missionaries, who established a mission in nearby Santa Cruz in 1791. The area was later settled by Mexican ranchers, who established large cattle ranches in the area.
In the late 19th century, the area was developed as a resort community. The first hotel in the area was built in 1887, and the area was known as "Selva Beach" by the early 1900s. The area was popular with tourists, and several hotels and resorts were built in the area.
In the 1950s, the area began to be developed as a residential community. The first homes were built in the area in the 1950s, and the area has since grown to become a popular residential community.
Geography
Selva Beach is located in Santa Cruz County, California, on the Monterey Bay. It is situated just south of the city of Santa Cruz. The area is characterized by rolling hills and a mild climate. The area is home to several parks and beaches, including Manresa State Beach, Seascape Beach, and Twin Lakes State Beach.
Economy
Selva Beach is primarily a residential community, and the local economy is largely driven by tourism. The area is home to several hotels and resorts, as well as restaurants and shops. The area is also home to several tech companies, including Google, Apple, and Adobe.
Demographics
As of 2019, the population of Selva Beach was estimated to be 1,845. The population is largely white (83.3%), with smaller percentages of Hispanic (7.2%), Asian (4.2%), and African American (2.2%) residents. The median household income in the area is $90,845, and the median home value is $1,072,000.
Conclusion
Selva Beach is a small unincorporated community located in Santa Cruz County, California. It is situated on the Monterey Bay, just south of the city of Santa Cruz. The area was originally inhabited by the Ohlone people, and was later developed as a resort community in the late 19th century. The area is now primarily a residential community, and the local economy is largely driven by tourism. The population of Selva Beach was estimated to be 1,845 in 2019, and the population is largely white. The median household income in the area is $90,845, and the median home value is $1,072,000.
Common Questions
What is the Total Population of La Selva Beach?
Total Population of La Selva Beach is 2,320.
What is the Total Male Population of La Selva Beach?
Total Male Population of La Selva Beach is 1,181.
What is the Total Female Population of La Selva Beach?
Total Female Population of La Selva Beach is 1,139.
What is the Ratio of Males per 100 Females in La Selva Beach?
There are 103.69 Males per 100 Females in La Selva Beach.
What is the Ratio of Females per 100 Males in La Selva Beach?
There are 96.44 Females per 100 Males in La Selva Beach.
What is the Median Population Age in La Selva Beach?
Median Population Age in La Selva Beach is 41.8 Years.
What is the Average Family Size in La Selva Beach
Average Family Size in La Selva Beach is 2.8 People.
What is the Average Household Size in La Selva Beach
Average Household Size in La Selva Beach is 2.5 People.
What is Per Capita Income in La Selva Beach?
Per Capita income in La Selva Beach is $69,919.
What is the Median Family Income in La Selva Beach?
Median Family Income in La Selva Beach is $194,592.
What is the Median Household income in La Selva Beach?
Median Household Income in La Selva Beach is $171,250.
What is Income or Wage Gap in La Selva Beach?
Income or Wage Gap in La Selva Beach is 33.0%.
Women in La Selva Beach earn 67.0 cents for every dollar earned by a man.
What is Inequality or Gini Index in La Selva Beach?
Inequality or Gini Index in La Selva Beach is 0.36.
How Large is the Labor Force in La Selva Beach?
There are 1,239 People in the Labor Forcein in La Selva Beach.
What is the Percentage of People in the Labor Force in La Selva Beach?
62.8% of People are in the Labor Force in La Selva Beach.
What is the Unemployment Rate in La Selva Beach?
Unemployment Rate in La Selva Beach is 3.6%.