Kings Beach, CA
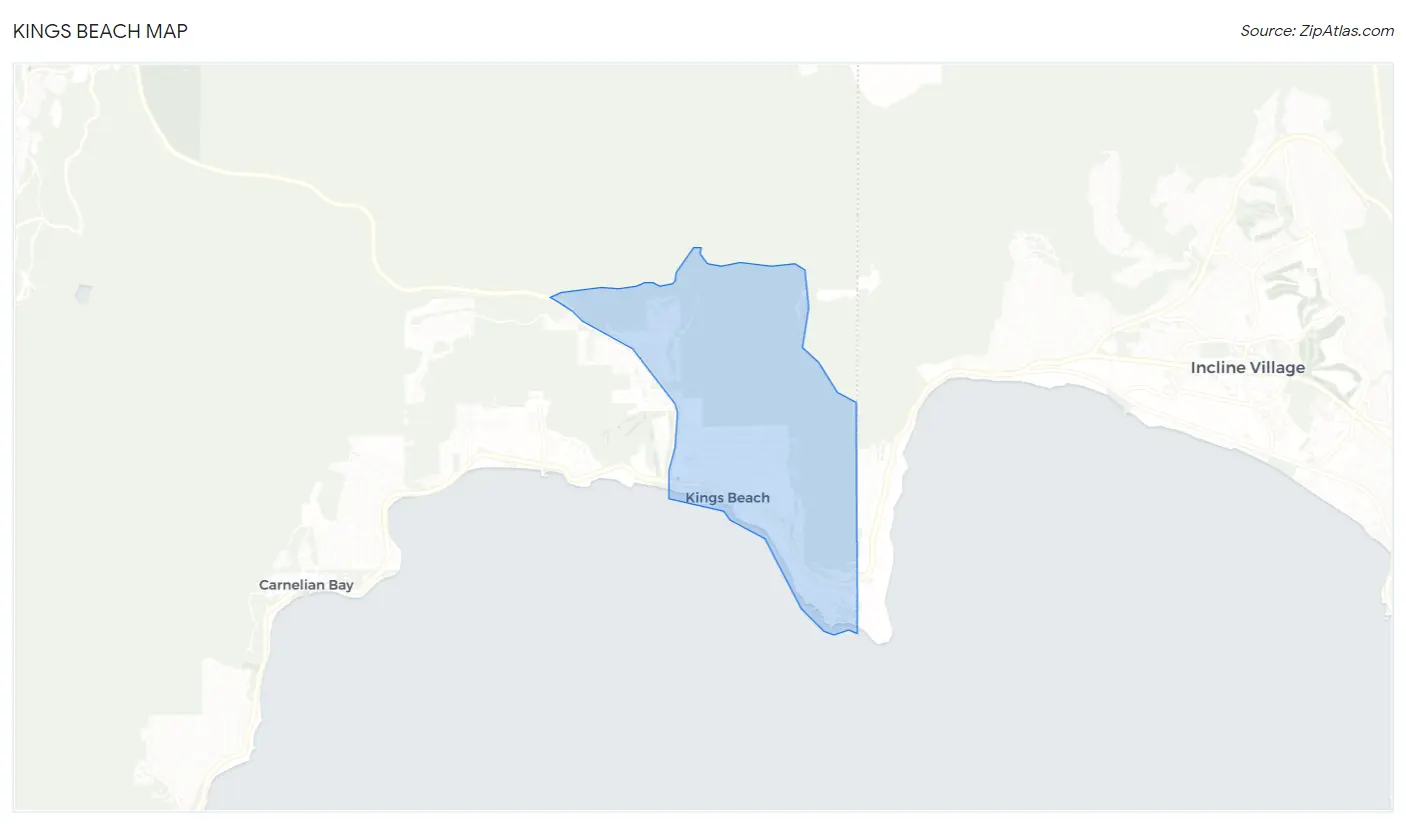
Kings Beach Map
Kings Beach Overview
2,589
TOTAL POPULATION
1,326
MALE POPULATION
1,263
FEMALE POPULATION
104.99
MALES / 100 FEMALES
95.25
FEMALES / 100 MALES
40.5
MEDIAN AGE
2.8
AVG FAMILY SIZE
2.4
AVG HOUSEHOLD SIZE
$29,941
PER CAPITA INCOME
$51,723
AVG FAMILY INCOME
$50,220
AVG HOUSEHOLD INCOME
28.9%
WAGE / INCOME GAP [ % ]
71.1¢/ $1
WAGE / INCOME GAP [ $ ]
0.45
INEQUALITY / GINI INDEX
1,594
LABOR FORCE [ PEOPLE ]
76.5%
PERCENT IN LABOR FORCE
Kings Beach Zip Codes
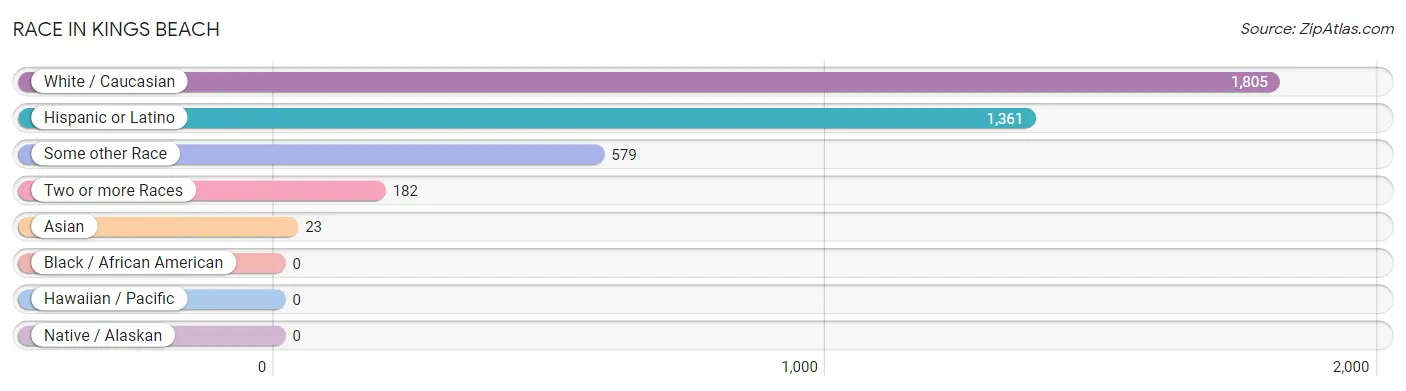
Race in Kings Beach
The most populous races in Kings Beach are White / Caucasian (1,805 | 69.7%), Hispanic or Latino (1,361 | 52.6%), and Some other Race (579 | 22.4%).
| Race | # Population | % Population |
| Asian | 23 | 0.9% |
| Black / African American | 0 | 0.0% |
| Hawaiian / Pacific | 0 | 0.0% |
| Hispanic or Latino | 1,361 | 52.6% |
| Native / Alaskan | 0 | 0.0% |
| White / Caucasian | 1,805 | 69.7% |
| Two or more Races | 182 | 7.0% |
| Some other Race | 579 | 22.4% |
| Total | 2,589 | 100.0% |
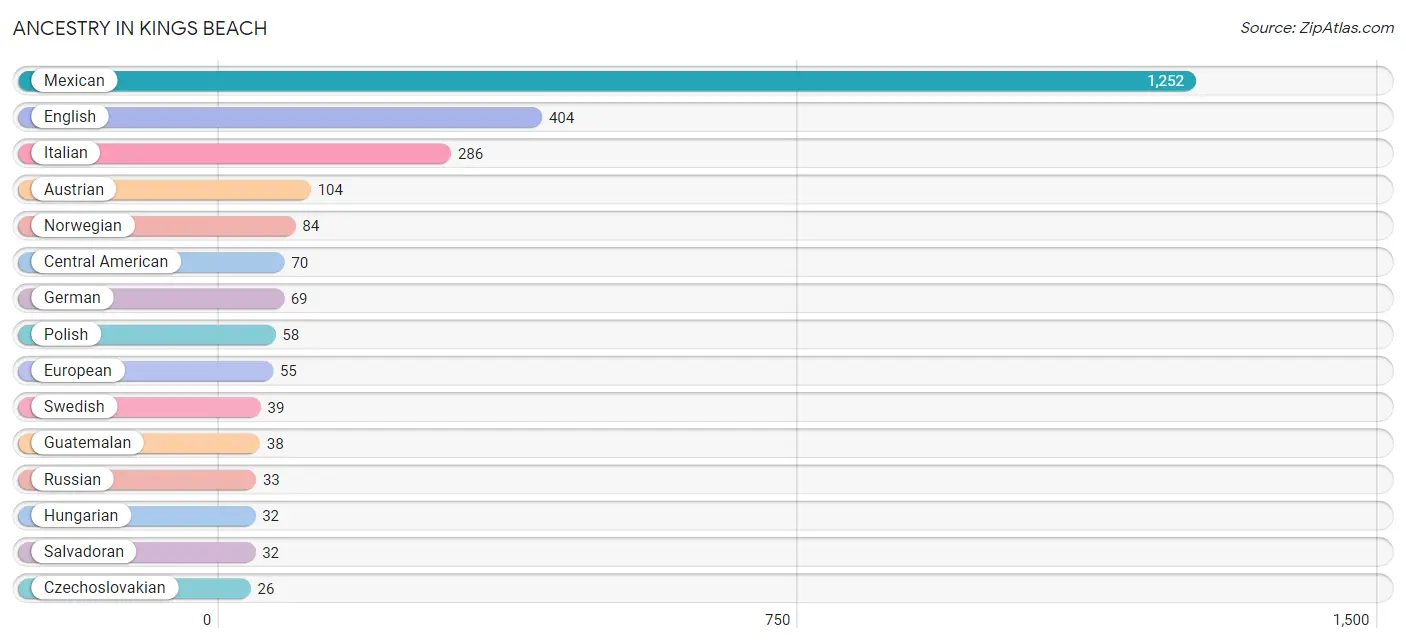
Ancestry in Kings Beach
The most populous ancestries reported in Kings Beach are Mexican (1,252 | 48.4%), English (404 | 15.6%), Italian (286 | 11.1%), Austrian (104 | 4.0%), and Norwegian (84 | 3.2%), together accounting for 82.3% of all Kings Beach residents.
| Ancestry | # Population | % Population |
| Austrian | 104 | 4.0% |
| Bhutanese | 19 | 0.7% |
| Central American | 70 | 2.7% |
| Czechoslovakian | 26 | 1.0% |
| Dutch | 10 | 0.4% |
| English | 404 | 15.6% |
| European | 55 | 2.1% |
| French | 9 | 0.4% |
| German | 69 | 2.7% |
| Guatemalan | 38 | 1.5% |
| Hungarian | 32 | 1.2% |
| Irish | 23 | 0.9% |
| Italian | 286 | 11.1% |
| Korean | 4 | 0.2% |
| Mexican | 1,252 | 48.4% |
| Mexican American Indian | 12 | 0.5% |
| Norwegian | 84 | 3.2% |
| Polish | 58 | 2.2% |
| Russian | 33 | 1.3% |
| Salvadoran | 32 | 1.2% |
| Scottish | 19 | 0.7% |
| Swedish | 39 | 1.5% | View All 22 Rows |
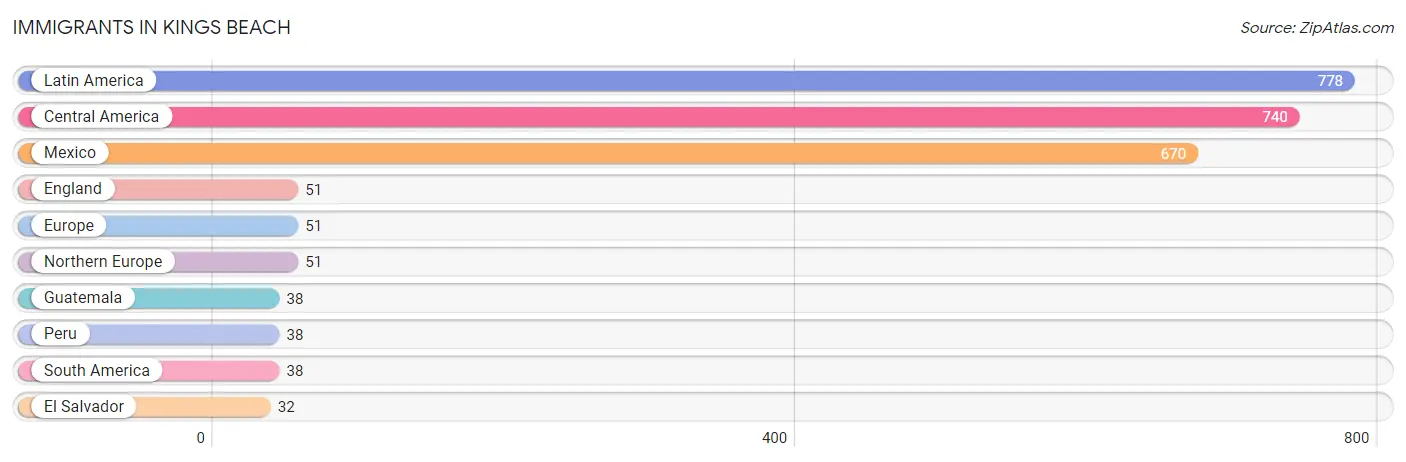
Immigrants in Kings Beach
The most numerous immigrant groups reported in Kings Beach came from Latin America (778 | 30.0%), Central America (740 | 28.6%), Mexico (670 | 25.9%), England (51 | 2.0%), and Europe (51 | 2.0%), together accounting for 88.5% of all Kings Beach residents.
| Immigration Origin | # Population | % Population |
| Central America | 740 | 28.6% |
| El Salvador | 32 | 1.2% |
| England | 51 | 2.0% |
| Europe | 51 | 2.0% |
| Guatemala | 38 | 1.5% |
| Latin America | 778 | 30.0% |
| Mexico | 670 | 25.9% |
| Northern Europe | 51 | 2.0% |
| Peru | 38 | 1.5% |
| South America | 38 | 1.5% | View All 10 Rows |
Sex and Age in Kings Beach
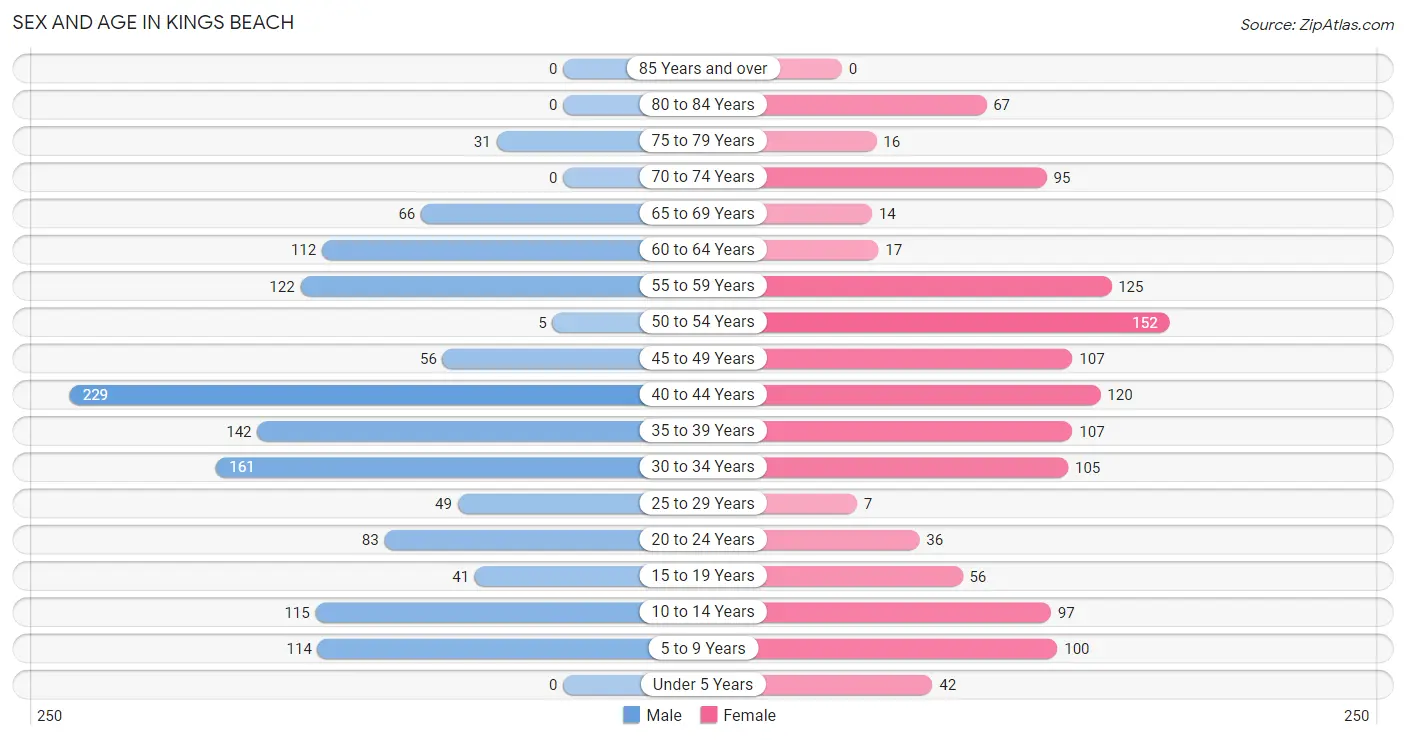
Sex and Age in Kings Beach
The most populous age groups in Kings Beach are 40 to 44 Years (229 | 17.3%) for men and 50 to 54 Years (152 | 12.0%) for women.
| Age Bracket | Male | Female |
| Under 5 Years | 0 (0.0%) | 42 (3.3%) |
| 5 to 9 Years | 114 (8.6%) | 100 (7.9%) |
| 10 to 14 Years | 115 (8.7%) | 97 (7.7%) |
| 15 to 19 Years | 41 (3.1%) | 56 (4.4%) |
| 20 to 24 Years | 83 (6.3%) | 36 (2.9%) |
| 25 to 29 Years | 49 (3.7%) | 7 (0.5%) |
| 30 to 34 Years | 161 (12.1%) | 105 (8.3%) |
| 35 to 39 Years | 142 (10.7%) | 107 (8.5%) |
| 40 to 44 Years | 229 (17.3%) | 120 (9.5%) |
| 45 to 49 Years | 56 (4.2%) | 107 (8.5%) |
| 50 to 54 Years | 5 (0.4%) | 152 (12.0%) |
| 55 to 59 Years | 122 (9.2%) | 125 (9.9%) |
| 60 to 64 Years | 112 (8.5%) | 17 (1.3%) |
| 65 to 69 Years | 66 (5.0%) | 14 (1.1%) |
| 70 to 74 Years | 0 (0.0%) | 95 (7.5%) |
| 75 to 79 Years | 31 (2.3%) | 16 (1.3%) |
| 80 to 84 Years | 0 (0.0%) | 67 (5.3%) |
| 85 Years and over | 0 (0.0%) | 0 (0.0%) |
| Total | 1,326 (100.0%) | 1,263 (100.0%) |
Families and Households in Kings Beach
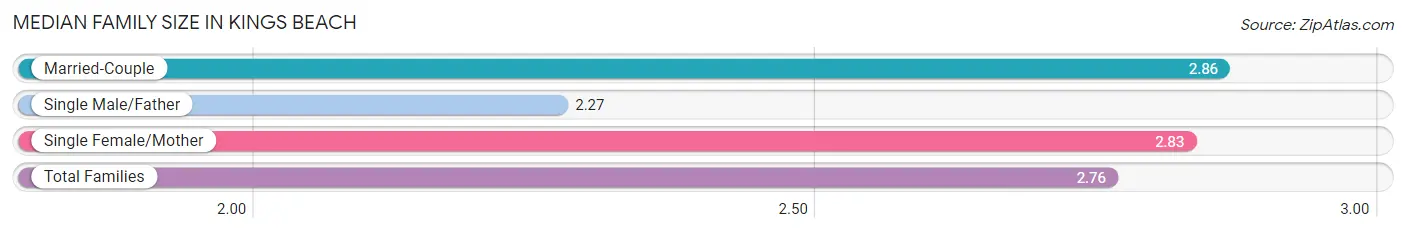
Median Family Size in Kings Beach
The median family size in Kings Beach is 2.76 persons per family, with married-couple families (442 | 67.3%) accounting for the largest median family size of 2.86 persons per family. On the other hand, single male/father families (106 | 16.1%) represent the smallest median family size with 2.27 persons per family.
| Family Type | # Families | Family Size |
| Married-Couple | 442 (67.3%) | 2.86 |
| Single Male/Father | 106 (16.1%) | 2.27 |
| Single Female/Mother | 109 (16.6%) | 2.83 |
| Total Families | 657 (100.0%) | 2.76 |
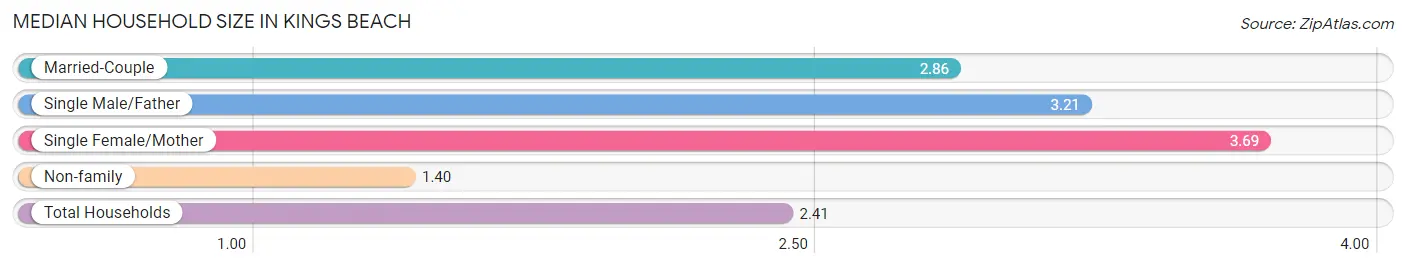
Median Household Size in Kings Beach
The median household size in Kings Beach is 2.41 persons per household, with single female/mother households (109 | 10.1%) accounting for the largest median household size of 3.69 persons per household. non-family households (418 | 38.9%) represent the smallest median household size with 1.40 persons per household.
| Household Type | # Households | Household Size |
| Married-Couple | 442 (41.1%) | 2.86 |
| Single Male/Father | 106 (9.9%) | 3.21 |
| Single Female/Mother | 109 (10.1%) | 3.69 |
| Non-family | 418 (38.9%) | 1.40 |
| Total Households | 1,075 (100.0%) | 2.41 |
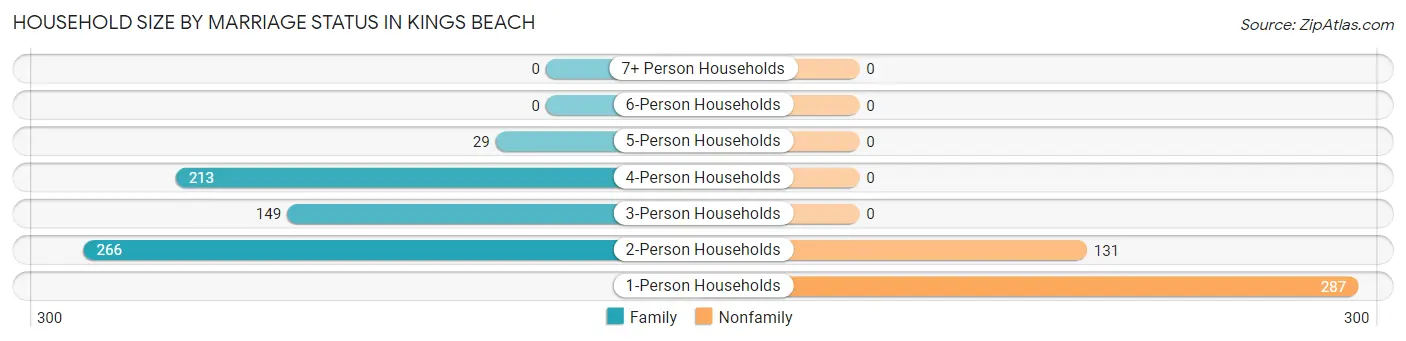
Household Size by Marriage Status in Kings Beach
Out of a total of 1,075 households in Kings Beach, 657 (61.1%) are family households, while 418 (38.9%) are nonfamily households. The most numerous type of family households are 2-person households, comprising 266, and the most common type of nonfamily households are 1-person households, comprising 287.
| Household Size | Family Households | Nonfamily Households |
| 1-Person Households | - | 287 (26.7%) |
| 2-Person Households | 266 (24.7%) | 131 (12.2%) |
| 3-Person Households | 149 (13.9%) | 0 (0.0%) |
| 4-Person Households | 213 (19.8%) | 0 (0.0%) |
| 5-Person Households | 29 (2.7%) | 0 (0.0%) |
| 6-Person Households | 0 (0.0%) | 0 (0.0%) |
| 7+ Person Households | 0 (0.0%) | 0 (0.0%) |
| Total | 657 (61.1%) | 418 (38.9%) |
Female Fertility in Kings Beach
Fertility by Age in Kings Beach
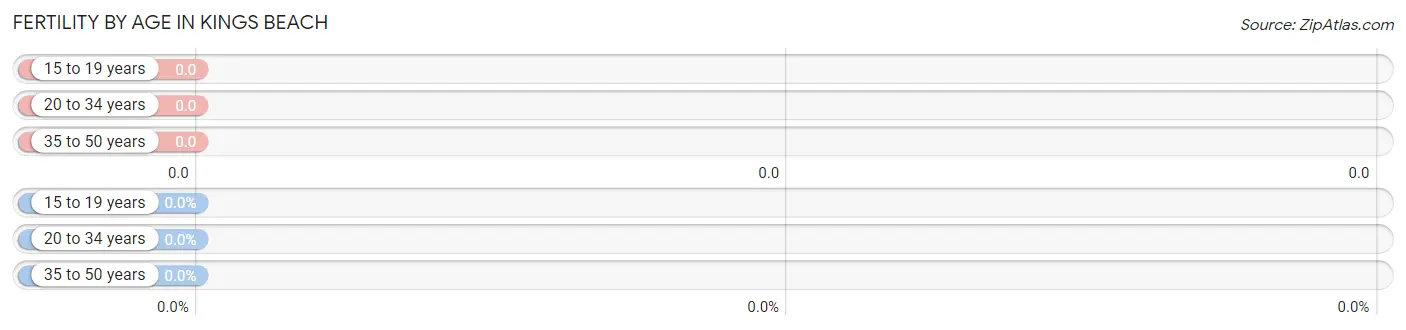
| Age Bracket | Women with Births | Births / 1,000 Women |
| 15 to 19 years | 0 (0.0%) | 0.0 |
| 20 to 34 years | 0 (0.0%) | 0.0 |
| 35 to 50 years | 0 (0.0%) | 0.0 |
| Total | 0 (0.0%) | 0.0 |
Fertility by Age by Marriage Status in Kings Beach
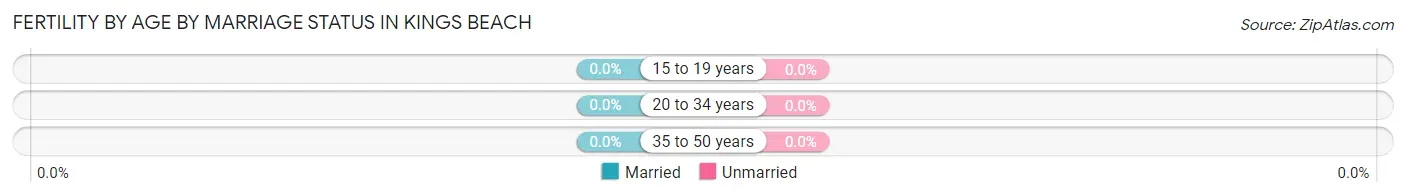
| Age Bracket | Married | Unmarried |
| 15 to 19 years | 0 (0.0%) | 0 (0.0%) |
| 20 to 34 years | 0 (0.0%) | 0 (0.0%) |
| 35 to 50 years | 0 (0.0%) | 0 (0.0%) |
| Total | 0 (0.0%) | 0 (0.0%) |
Fertility by Education in Kings Beach
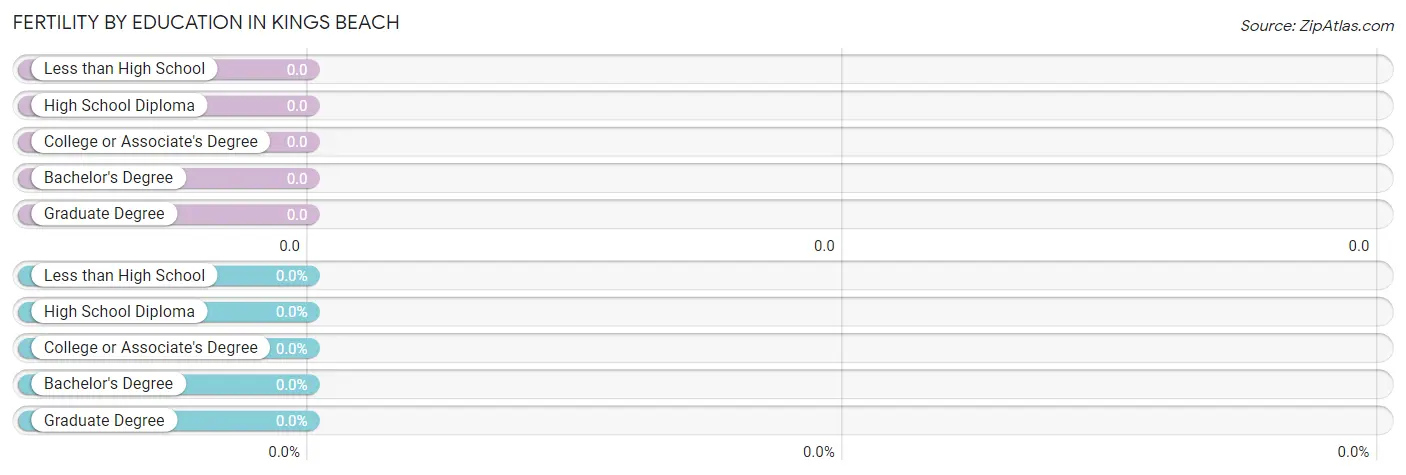
| Educational Attainment | Women with Births | Births / 1,000 Women |
| Less than High School | 0 (0.0%) | 0.0 |
| High School Diploma | 0 (0.0%) | 0.0 |
| College or Associate's Degree | 0 (0.0%) | 0.0 |
| Bachelor's Degree | 0 (0.0%) | 0.0 |
| Graduate Degree | 0 (0.0%) | 0.0 |
| Total | 0 (0.0%) | 0.0 |
Fertility by Education by Marriage Status in Kings Beach
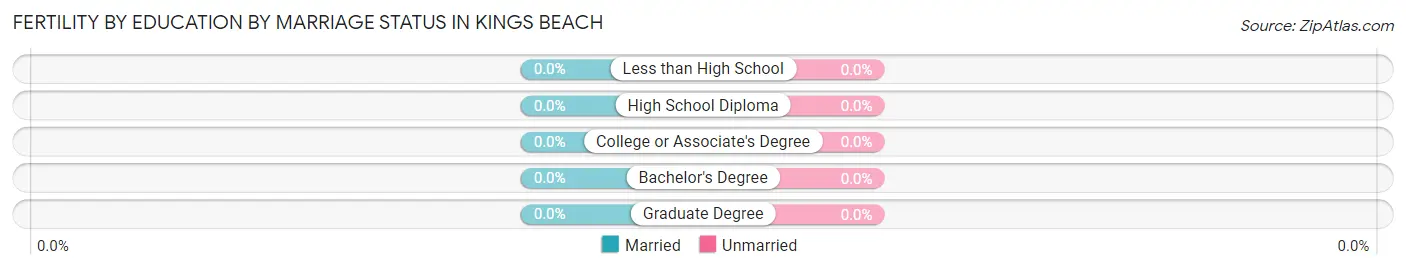
| Educational Attainment | Married | Unmarried |
| Less than High School | 0 (0.0%) | 0 (0.0%) |
| High School Diploma | 0 (0.0%) | 0 (0.0%) |
| College or Associate's Degree | 0 (0.0%) | 0 (0.0%) |
| Bachelor's Degree | 0 (0.0%) | 0 (0.0%) |
| Graduate Degree | 0 (0.0%) | 0 (0.0%) |
| Total | 0 (0.0%) | 0 (0.0%) |
Income in Kings Beach
Income Overview in Kings Beach
Per Capita Income in Kings Beach is $29,941, while median incomes of families and households are $51,723 and $50,220 respectively.
| Characteristic | Number | Measure |
| Per Capita Income | 2,589 | $29,941 |
| Median Family Income | 657 | $51,723 |
| Mean Family Income | 657 | $66,978 |
| Median Household Income | 1,075 | $50,220 |
| Mean Household Income | 1,075 | $69,134 |
| Income Deficit | 657 | $0 |
| Wage / Income Gap (%) | 2,589 | 28.94% |
| Wage / Income Gap ($) | 2,589 | 71.06¢ per $1 |
| Gini / Inequality Index | 2,589 | 0.45 |
Earnings by Sex in Kings Beach
Average Earnings in Kings Beach are $31,294, $41,065 for men and $29,180 for women, a difference of 28.9%.
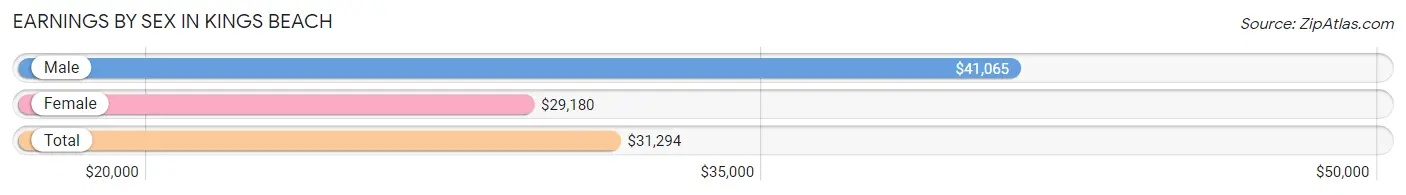
| Sex | Number | Average Earnings |
| Male | 947 (58.6%) | $41,065 |
| Female | 670 (41.4%) | $29,180 |
| Total | 1,617 (100.0%) | $31,294 |
Earnings by Sex by Income Bracket in Kings Beach
The most common earnings brackets in Kings Beach are $55,000 to $64,999 for men (192 | 20.3%) and $25,000 to $29,999 for women (167 | 24.9%).
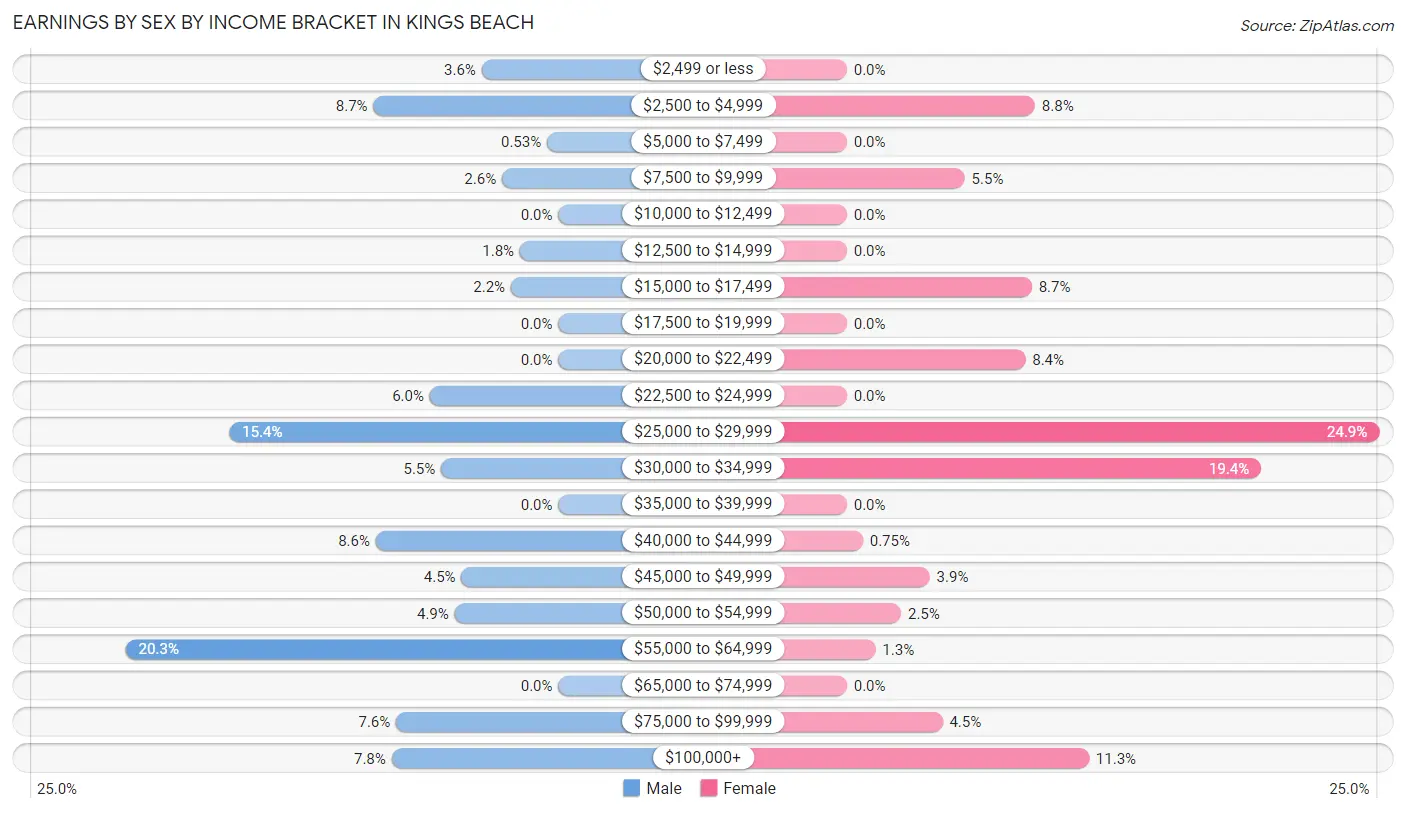
| Income | Male | Female |
| $2,499 or less | 34 (3.6%) | 0 (0.0%) |
| $2,500 to $4,999 | 82 (8.7%) | 59 (8.8%) |
| $5,000 to $7,499 | 5 (0.5%) | 0 (0.0%) |
| $7,500 to $9,999 | 25 (2.6%) | 37 (5.5%) |
| $10,000 to $12,499 | 0 (0.0%) | 0 (0.0%) |
| $12,500 to $14,999 | 17 (1.8%) | 0 (0.0%) |
| $15,000 to $17,499 | 21 (2.2%) | 58 (8.7%) |
| $17,500 to $19,999 | 0 (0.0%) | 0 (0.0%) |
| $20,000 to $22,499 | 0 (0.0%) | 56 (8.4%) |
| $22,500 to $24,999 | 57 (6.0%) | 0 (0.0%) |
| $25,000 to $29,999 | 146 (15.4%) | 167 (24.9%) |
| $30,000 to $34,999 | 52 (5.5%) | 130 (19.4%) |
| $35,000 to $39,999 | 0 (0.0%) | 0 (0.0%) |
| $40,000 to $44,999 | 81 (8.6%) | 5 (0.7%) |
| $45,000 to $49,999 | 43 (4.5%) | 26 (3.9%) |
| $50,000 to $54,999 | 46 (4.9%) | 17 (2.5%) |
| $55,000 to $64,999 | 192 (20.3%) | 9 (1.3%) |
| $65,000 to $74,999 | 0 (0.0%) | 0 (0.0%) |
| $75,000 to $99,999 | 72 (7.6%) | 30 (4.5%) |
| $100,000+ | 74 (7.8%) | 76 (11.3%) |
| Total | 947 (100.0%) | 670 (100.0%) |
Earnings by Sex by Educational Attainment in Kings Beach
Average earnings in Kings Beach are $42,346 for men and $29,531 for women, a difference of 30.3%. Men with an educational attainment of graduate degree enjoy the highest average annual earnings of $92,528, while those with less than high school education earn the least with $40,525. Women with an educational attainment of bachelor's degree earn the most with the average annual earnings of $34,258, while those with high school diploma education have the smallest earnings of $25,256.
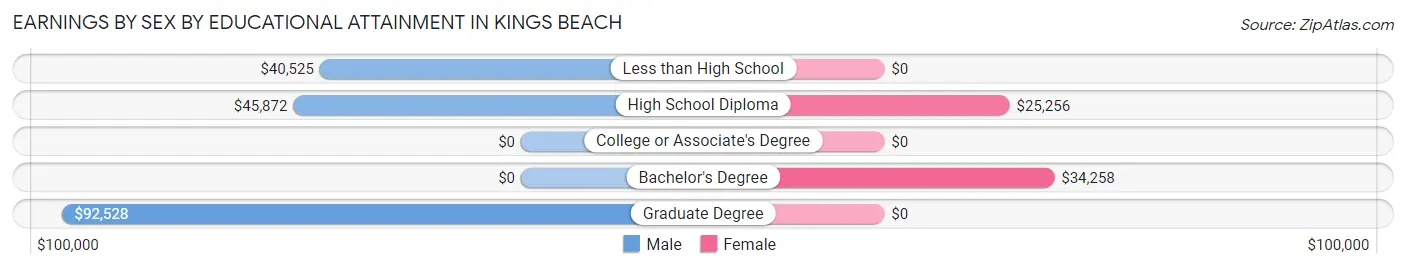
| Educational Attainment | Male Income | Female Income |
| Less than High School | $40,525 | $0 |
| High School Diploma | $45,872 | $25,256 |
| College or Associate's Degree | - | - |
| Bachelor's Degree | - | - |
| Graduate Degree | $92,528 | $0 |
| Total | $42,346 | $29,531 |
Family Income in Kings Beach
Family Income Brackets in Kings Beach
According to the Kings Beach family income data, there are 122 families falling into the $50,000 to $74,999 income range, which is the most common income bracket and makes up 18.6% of all families.
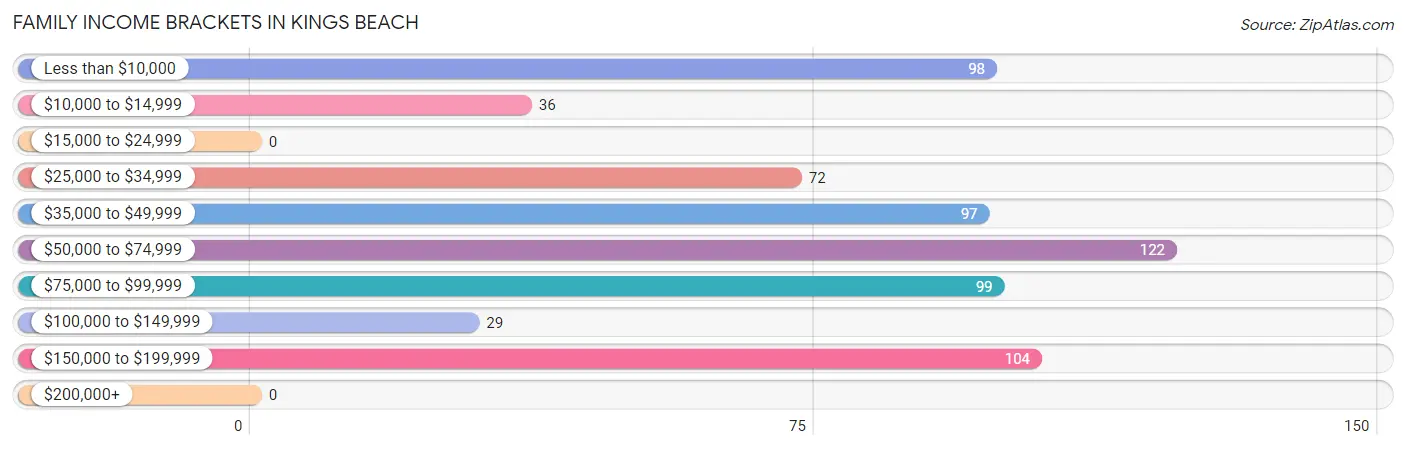
| Income Bracket | # Families | % Families |
| Less than $10,000 | 98 | 14.9% |
| $10,000 to $14,999 | 36 | 5.5% |
| $15,000 to $24,999 | 0 | 0.0% |
| $25,000 to $34,999 | 72 | 11.0% |
| $35,000 to $49,999 | 97 | 14.8% |
| $50,000 to $74,999 | 122 | 18.6% |
| $75,000 to $99,999 | 99 | 15.1% |
| $100,000 to $149,999 | 29 | 4.4% |
| $150,000 to $199,999 | 104 | 15.8% |
| $200,000+ | 0 | 0.0% |
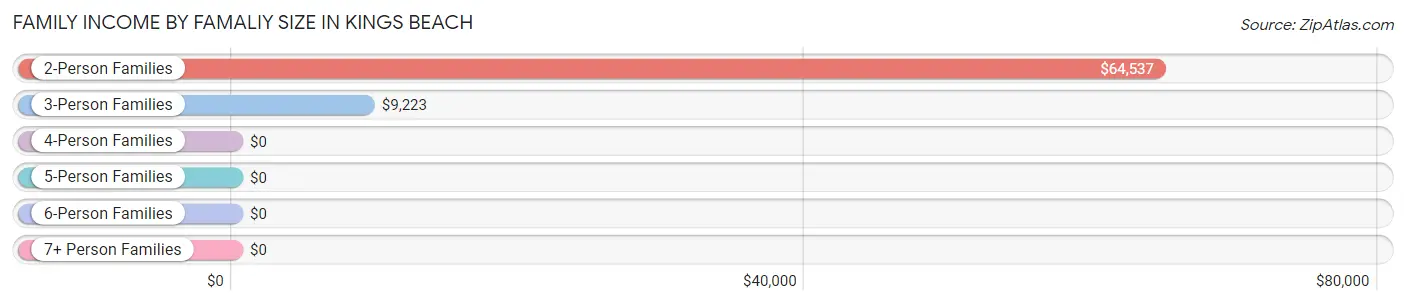
Family Income by Famaliy Size in Kings Beach
2-person families (340 | 51.7%) account for the highest median family income in Kings Beach with $64,537 per family, while 2-person families (340 | 51.7%) have the highest median income of $32,268 per family member.
| Income Bracket | # Families | Median Income |
| 2-Person Families | 340 (51.7%) | $64,537 |
| 3-Person Families | 173 (26.3%) | $9,223 |
| 4-Person Families | 115 (17.5%) | $0 |
| 5-Person Families | 29 (4.4%) | $0 |
| 6-Person Families | 0 (0.0%) | $0 |
| 7+ Person Families | 0 (0.0%) | $0 |
| Total | 657 (100.0%) | $51,723 |
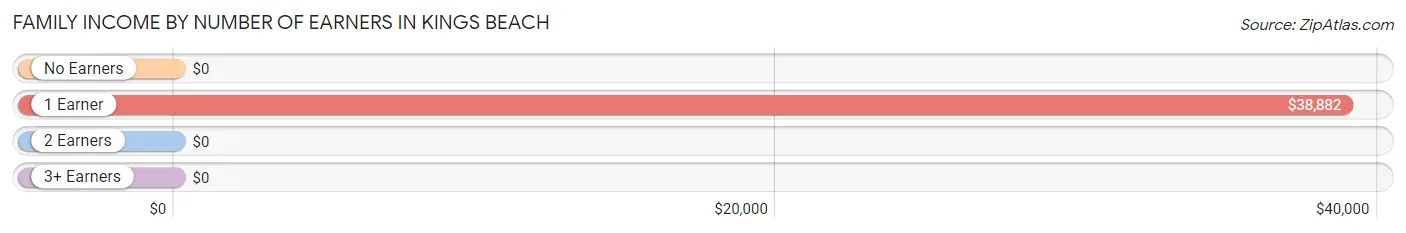
Family Income by Number of Earners in Kings Beach
| Number of Earners | # Families | Median Income |
| No Earners | 96 (14.6%) | $0 |
| 1 Earner | 252 (38.4%) | $38,882 |
| 2 Earners | 268 (40.8%) | $0 |
| 3+ Earners | 41 (6.2%) | $0 |
| Total | 657 (100.0%) | $51,723 |
Household Income in Kings Beach
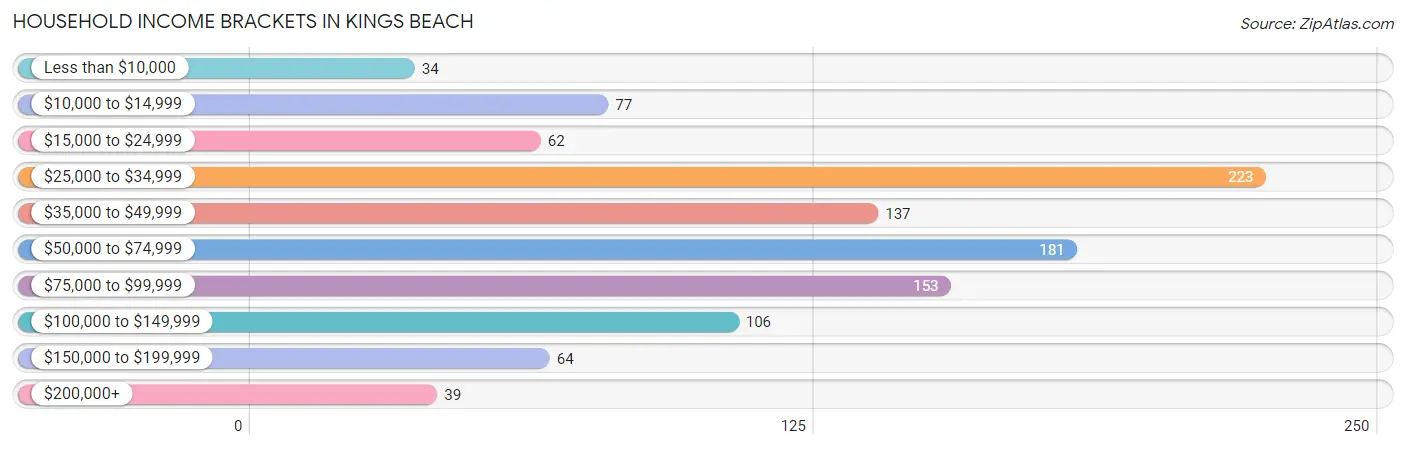
Household Income Brackets in Kings Beach
With 223 households falling in the category, the $25,000 to $34,999 income range is the most frequent in Kings Beach, accounting for 20.7% of all households. In contrast, only 34 households (3.2%) fall into the less than $10,000 income bracket, making it the least populous group.
| Income Bracket | # Households | % Households |
| Less than $10,000 | 34 | 3.2% |
| $10,000 to $14,999 | 77 | 7.2% |
| $15,000 to $24,999 | 62 | 5.8% |
| $25,000 to $34,999 | 223 | 20.7% |
| $35,000 to $49,999 | 137 | 12.7% |
| $50,000 to $74,999 | 181 | 16.8% |
| $75,000 to $99,999 | 153 | 14.2% |
| $100,000 to $149,999 | 106 | 9.9% |
| $150,000 to $199,999 | 64 | 6.0% |
| $200,000+ | 39 | 3.6% |
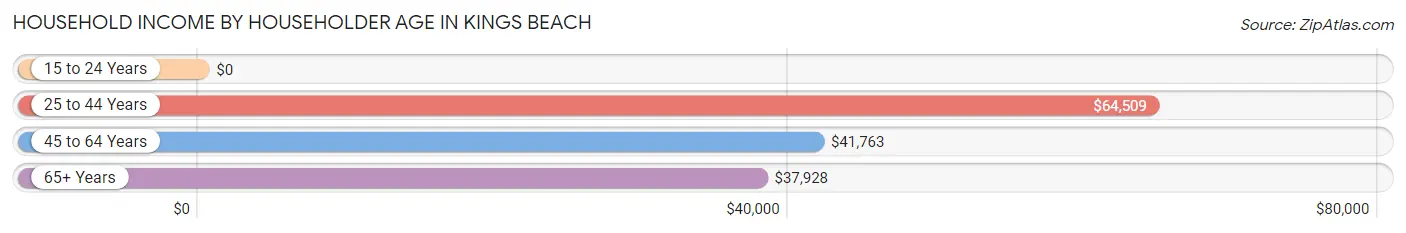
Household Income by Householder Age in Kings Beach
The median household income in Kings Beach is $50,220, with the highest median household income of $64,509 found in the 25 to 44 years age bracket for the primary householder. A total of 433 households (40.3%) fall into this category. Meanwhile, the 15 to 24 years age bracket for the primary householder has the lowest median household income of $0, with 36 households (3.4%) in this group.
| Income Bracket | # Households | Median Income |
| 15 to 24 Years | 36 (3.4%) | $0 |
| 25 to 44 Years | 433 (40.3%) | $64,509 |
| 45 to 64 Years | 415 (38.6%) | $41,763 |
| 65+ Years | 191 (17.8%) | $37,928 |
| Total | 1,075 (100.0%) | $50,220 |
Poverty in Kings Beach
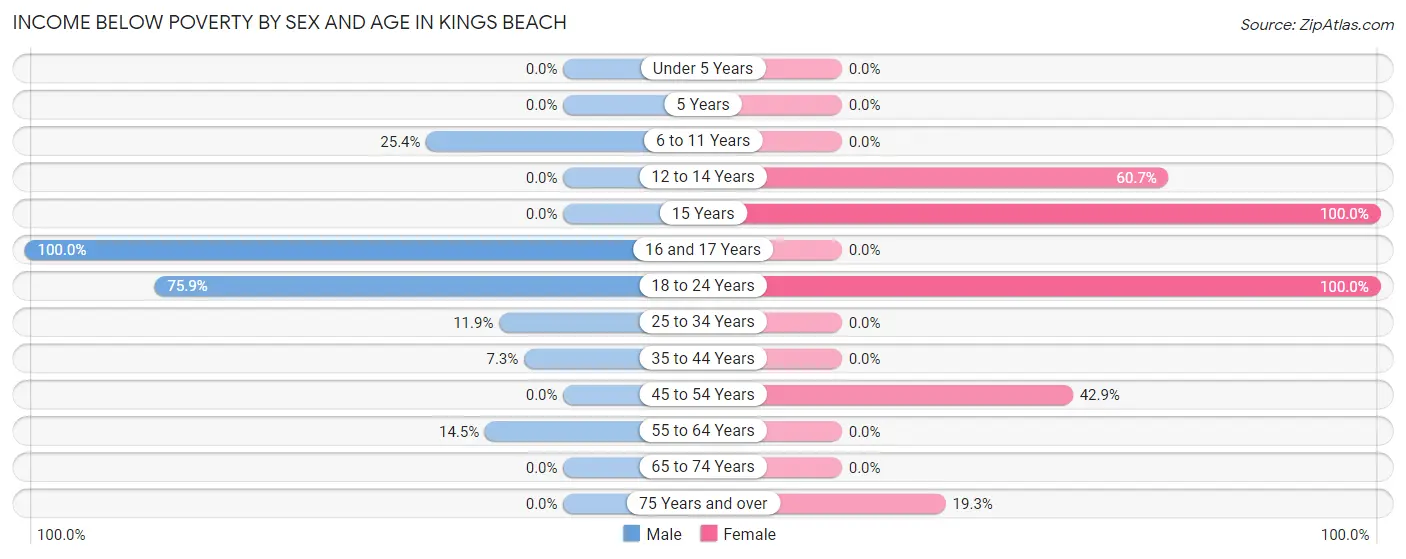
Income Below Poverty by Sex and Age in Kings Beach
With 17.6% poverty level for males and 18.8% for females among the residents of Kings Beach, 16 and 17 year old males and 15 year old females are the most vulnerable to poverty, with 41 males (100.0%) and 37 females (100.0%) in their respective age groups living below the poverty level.
| Age Bracket | Male | Female |
| Under 5 Years | 0 (0.0%) | 0 (0.0%) |
| 5 Years | 0 (0.0%) | 0 (0.0%) |
| 6 to 11 Years | 44 (25.4%) | 0 (0.0%) |
| 12 to 14 Years | 0 (0.0%) | 37 (60.7%) |
| 15 Years | 0 (0.0%) | 37 (100.0%) |
| 16 and 17 Years | 41 (100.0%) | 0 (0.0%) |
| 18 to 24 Years | 63 (75.9%) | 36 (100.0%) |
| 25 to 34 Years | 25 (11.9%) | 0 (0.0%) |
| 35 to 44 Years | 27 (7.3%) | 0 (0.0%) |
| 45 to 54 Years | 0 (0.0%) | 111 (42.9%) |
| 55 to 64 Years | 34 (14.5%) | 0 (0.0%) |
| 65 to 74 Years | 0 (0.0%) | 0 (0.0%) |
| 75 Years and over | 0 (0.0%) | 16 (19.3%) |
| Total | 234 (17.6%) | 237 (18.8%) |
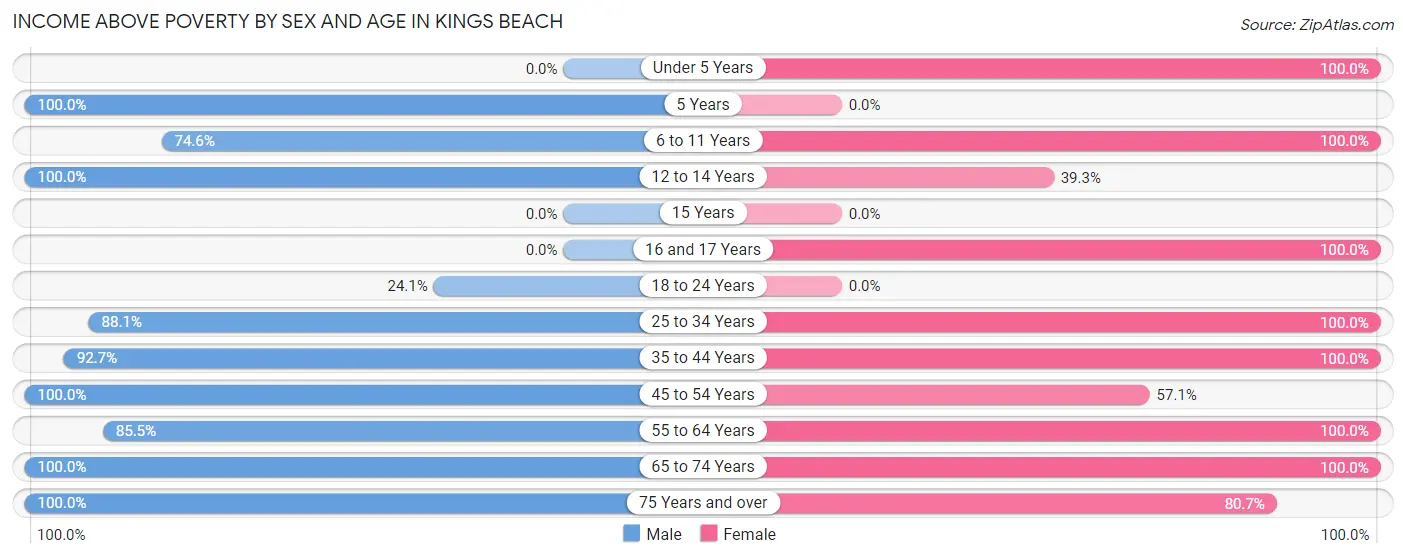
Income Above Poverty by Sex and Age in Kings Beach
According to the poverty statistics in Kings Beach, males aged 5 years and females aged under 5 years are the age groups that are most secure financially, with 100.0% of males and 100.0% of females in these age groups living above the poverty line.
| Age Bracket | Male | Female |
| Under 5 Years | 0 (0.0%) | 42 (100.0%) |
| 5 Years | 33 (100.0%) | 0 (0.0%) |
| 6 to 11 Years | 129 (74.6%) | 136 (100.0%) |
| 12 to 14 Years | 23 (100.0%) | 24 (39.3%) |
| 15 Years | 0 (0.0%) | 0 (0.0%) |
| 16 and 17 Years | 0 (0.0%) | 19 (100.0%) |
| 18 to 24 Years | 20 (24.1%) | 0 (0.0%) |
| 25 to 34 Years | 185 (88.1%) | 112 (100.0%) |
| 35 to 44 Years | 344 (92.7%) | 227 (100.0%) |
| 45 to 54 Years | 61 (100.0%) | 148 (57.1%) |
| 55 to 64 Years | 200 (85.5%) | 142 (100.0%) |
| 65 to 74 Years | 66 (100.0%) | 109 (100.0%) |
| 75 Years and over | 31 (100.0%) | 67 (80.7%) |
| Total | 1,092 (82.4%) | 1,026 (81.2%) |
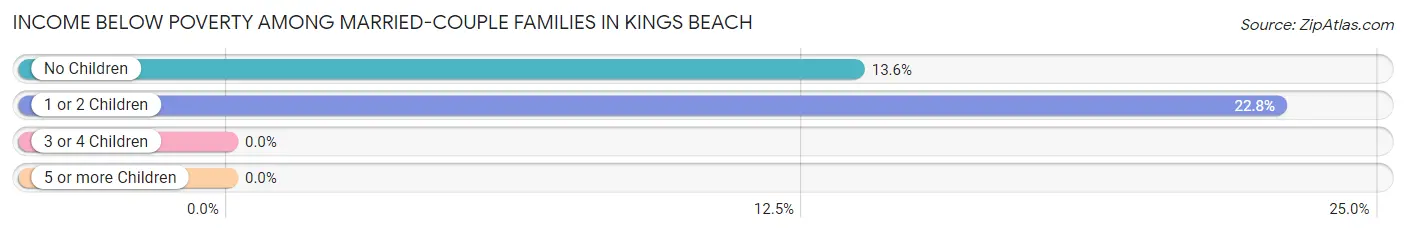
Income Below Poverty Among Married-Couple Families in Kings Beach
The poverty statistics for married-couple families in Kings Beach show that 15.8% or 70 of the total 442 families live below the poverty line. Families with 1 or 2 children have the highest poverty rate of 22.8%, comprising of 34 families. On the other hand, families with 3 or 4 children have the lowest poverty rate of 0.0%, which includes 0 families.
| Children | Above Poverty | Below Poverty |
| No Children | 228 (86.4%) | 36 (13.6%) |
| 1 or 2 Children | 115 (77.2%) | 34 (22.8%) |
| 3 or 4 Children | 29 (100.0%) | 0 (0.0%) |
| 5 or more Children | 0 (0.0%) | 0 (0.0%) |
| Total | 372 (84.2%) | 70 (15.8%) |
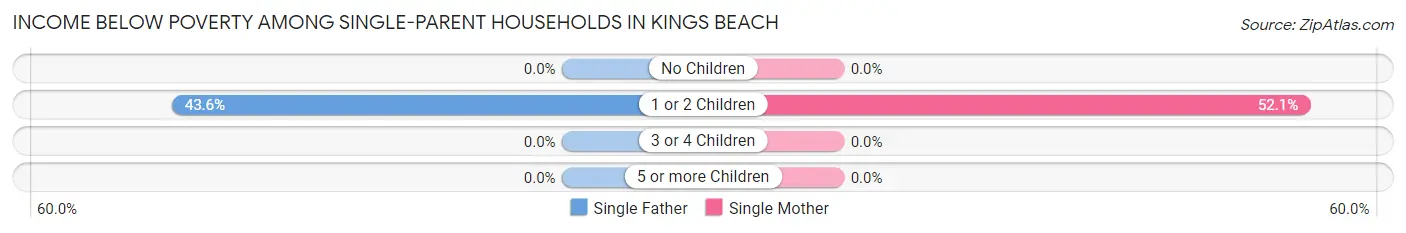
Income Below Poverty Among Single-Parent Households in Kings Beach
According to the poverty data in Kings Beach, 25.5% or 27 single-father households and 33.9% or 37 single-mother households are living below the poverty line. Among single-father households, those with 1 or 2 children have the highest poverty rate, with 27 households (43.5%) experiencing poverty. Likewise, among single-mother households, those with 1 or 2 children have the highest poverty rate, with 37 households (52.1%) falling below the poverty line.
| Children | Single Father | Single Mother |
| No Children | 0 (0.0%) | 0 (0.0%) |
| 1 or 2 Children | 27 (43.5%) | 37 (52.1%) |
| 3 or 4 Children | 0 (0.0%) | 0 (0.0%) |
| 5 or more Children | 0 (0.0%) | 0 (0.0%) |
| Total | 27 (25.5%) | 37 (33.9%) |
Income Below Poverty Among Married-Couple vs Single-Parent Households in Kings Beach
The poverty data for Kings Beach shows that 70 of the married-couple family households (15.8%) and 64 of the single-parent households (29.8%) are living below the poverty level. Within the married-couple family households, those with 1 or 2 children have the highest poverty rate, with 34 households (22.8%) falling below the poverty line. Among the single-parent households, those with 1 or 2 children have the highest poverty rate, with 64 household (48.1%) living below poverty.
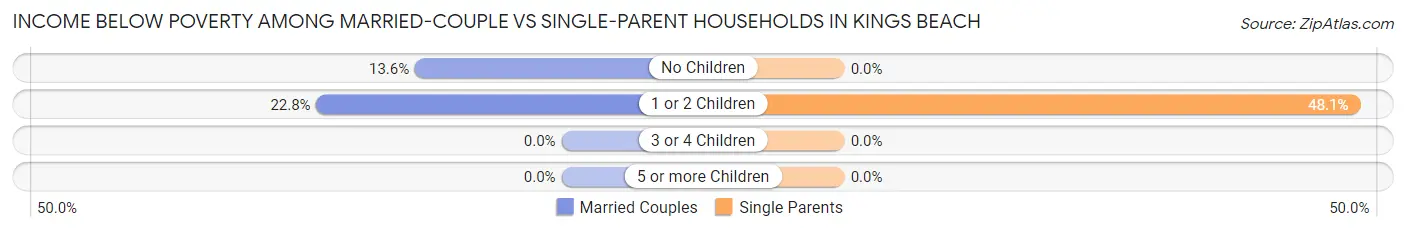
| Children | Married-Couple Families | Single-Parent Households |
| No Children | 36 (13.6%) | 0 (0.0%) |
| 1 or 2 Children | 34 (22.8%) | 64 (48.1%) |
| 3 or 4 Children | 0 (0.0%) | 0 (0.0%) |
| 5 or more Children | 0 (0.0%) | 0 (0.0%) |
| Total | 70 (15.8%) | 64 (29.8%) |
Employment Characteristics in Kings Beach
Employment by Class of Employer in Kings Beach
Among the 1,594 employed individuals in Kings Beach, private company employees (987 | 61.9%), self-employed (not incorporated) (279 | 17.5%), and local government employees (125 | 7.8%) make up the most common classes of employment.
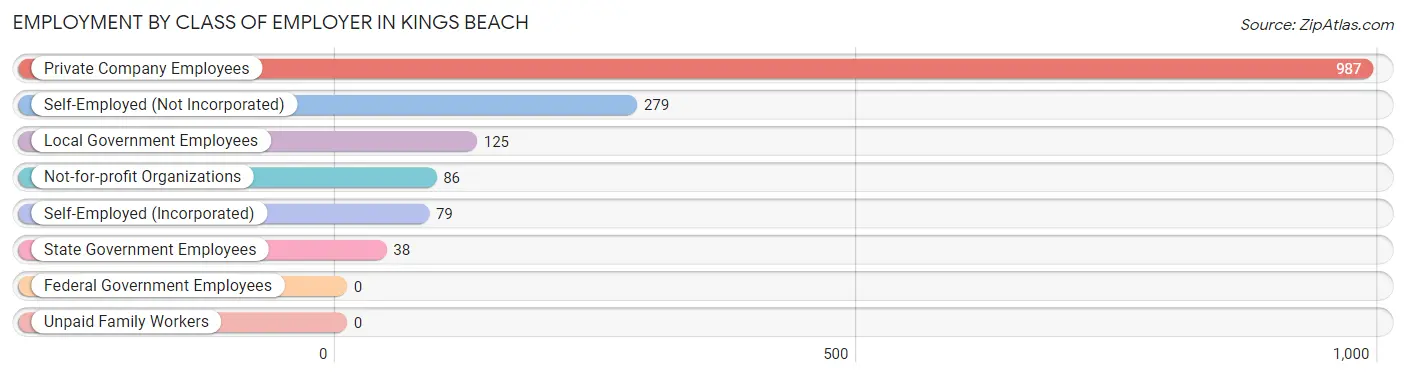
| Employer Class | # Employees | % Employees |
| Private Company Employees | 987 | 61.9% |
| Self-Employed (Incorporated) | 79 | 5.0% |
| Self-Employed (Not Incorporated) | 279 | 17.5% |
| Not-for-profit Organizations | 86 | 5.4% |
| Local Government Employees | 125 | 7.8% |
| State Government Employees | 38 | 2.4% |
| Federal Government Employees | 0 | 0.0% |
| Unpaid Family Workers | 0 | 0.0% |
| Total | 1,594 | 100.0% |
Employment Status by Age in Kings Beach
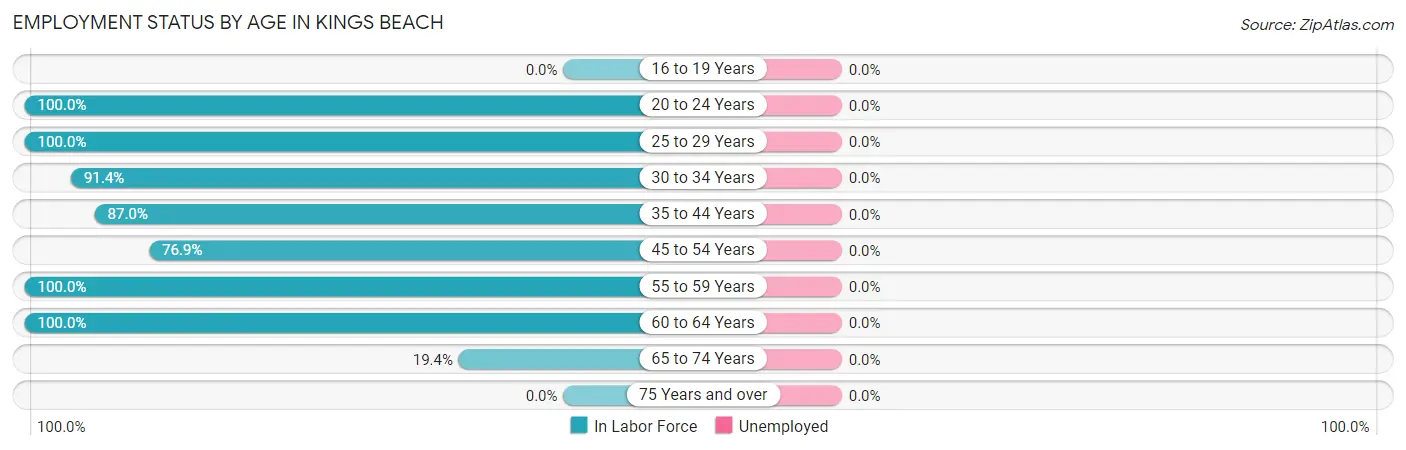
| Age Bracket | In Labor Force | Unemployed |
| 16 to 19 Years | 0 (0.0%) | 0 (0.0%) |
| 20 to 24 Years | 119 (100.0%) | 0 (0.0%) |
| 25 to 29 Years | 56 (100.0%) | 0 (0.0%) |
| 30 to 34 Years | 243 (91.4%) | 0 (0.0%) |
| 35 to 44 Years | 520 (87.0%) | 0 (0.0%) |
| 45 to 54 Years | 246 (76.9%) | 0 (0.0%) |
| 55 to 59 Years | 247 (100.0%) | 0 (0.0%) |
| 60 to 64 Years | 129 (100.0%) | 0 (0.0%) |
| 65 to 74 Years | 34 (19.4%) | 0 (0.0%) |
| 75 Years and over | 0 (0.0%) | 0 (0.0%) |
| Total | 1,594 (76.5%) | 0 (0.0%) |
Employment Status by Educational Attainment in Kings Beach
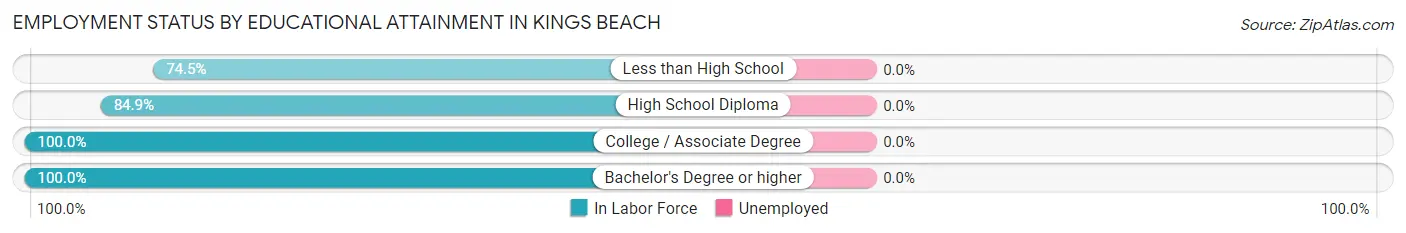
| Educational Attainment | In Labor Force | Unemployed |
| Less than High School | 309 (74.5%) | 0 (0.0%) |
| High School Diploma | 387 (84.9%) | 0 (0.0%) |
| College / Associate Degree | 306 (100.0%) | 0 (0.0%) |
| Bachelor's Degree or higher | 439 (100.0%) | 0 (0.0%) |
| Total | 1,441 (89.2%) | 0 (0.0%) |
Employment Occupations by Sex in Kings Beach
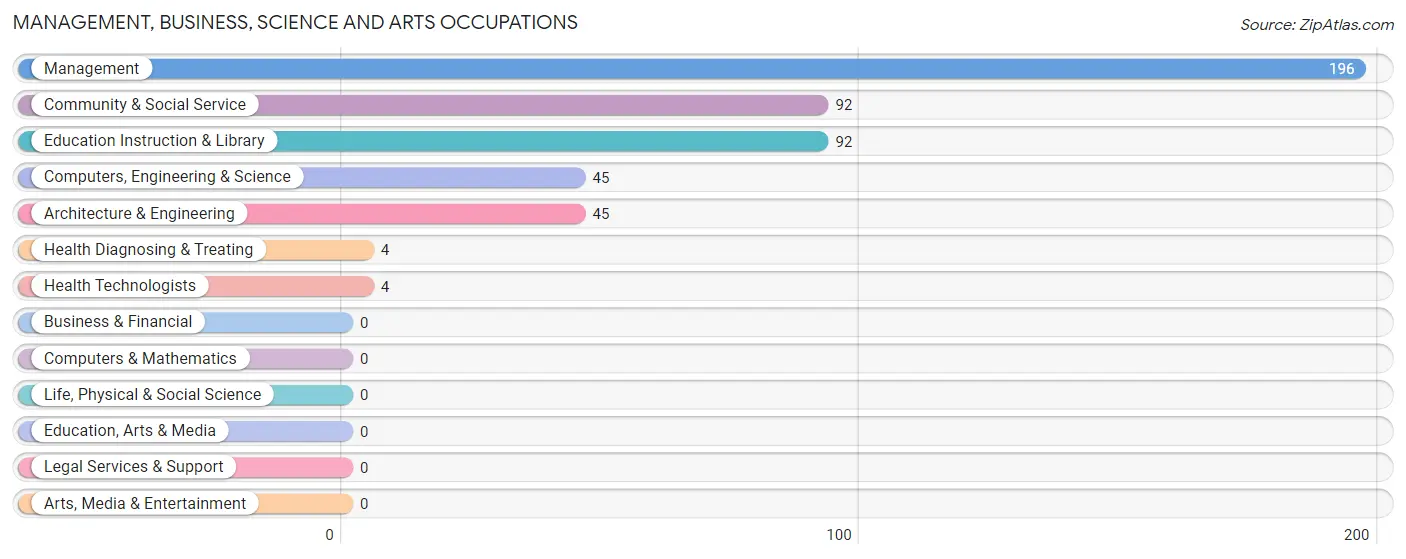
Management, Business, Science and Arts Occupations
The most common Management, Business, Science and Arts occupations in Kings Beach are Management (196 | 12.3%), Community & Social Service (92 | 5.8%), Education Instruction & Library (92 | 5.8%), Computers, Engineering & Science (45 | 2.8%), and Architecture & Engineering (45 | 2.8%).
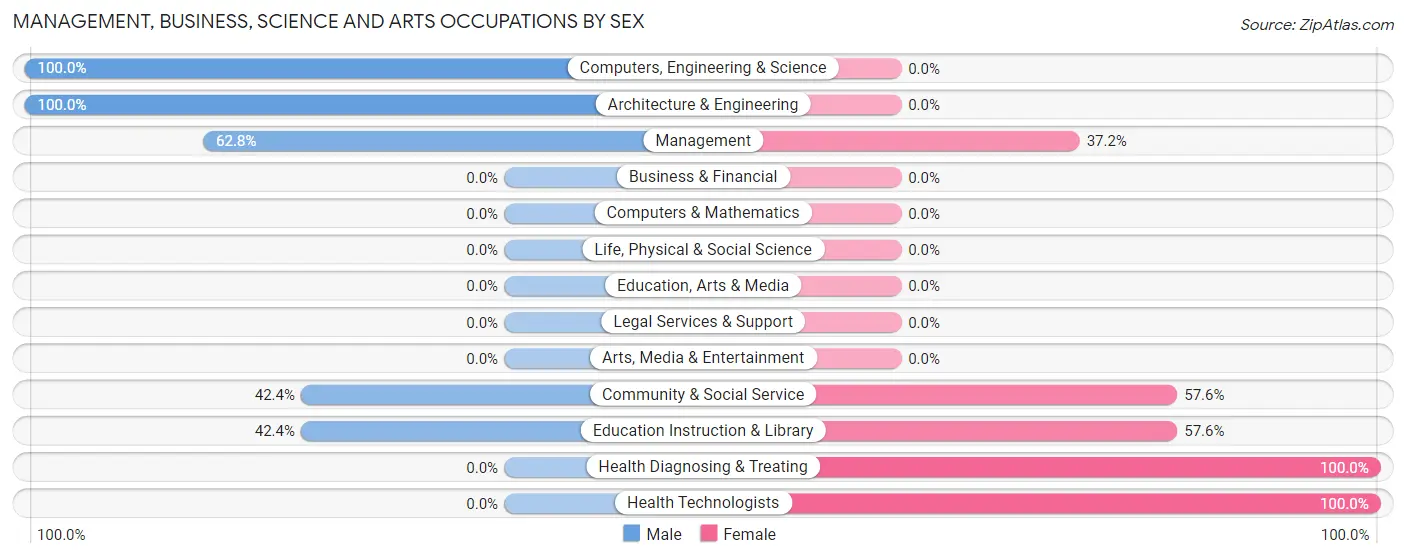
Management, Business, Science and Arts Occupations by Sex
Within the Management, Business, Science and Arts occupations in Kings Beach, the most male-oriented occupations are Computers, Engineering & Science (100.0%), Architecture & Engineering (100.0%), and Management (62.8%), while the most female-oriented occupations are Health Diagnosing & Treating (100.0%), Health Technologists (100.0%), and Community & Social Service (57.6%).
| Occupation | Male | Female |
| Management | 123 (62.8%) | 73 (37.2%) |
| Business & Financial | 0 (0.0%) | 0 (0.0%) |
| Computers, Engineering & Science | 45 (100.0%) | 0 (0.0%) |
| Computers & Mathematics | 0 (0.0%) | 0 (0.0%) |
| Architecture & Engineering | 45 (100.0%) | 0 (0.0%) |
| Life, Physical & Social Science | 0 (0.0%) | 0 (0.0%) |
| Community & Social Service | 39 (42.4%) | 53 (57.6%) |
| Education, Arts & Media | 0 (0.0%) | 0 (0.0%) |
| Legal Services & Support | 0 (0.0%) | 0 (0.0%) |
| Education Instruction & Library | 39 (42.4%) | 53 (57.6%) |
| Arts, Media & Entertainment | 0 (0.0%) | 0 (0.0%) |
| Health Diagnosing & Treating | 0 (0.0%) | 4 (100.0%) |
| Health Technologists | 0 (0.0%) | 4 (100.0%) |
| Total (Category) | 207 (61.4%) | 130 (38.6%) |
| Total (Overall) | 947 (59.4%) | 647 (40.6%) |
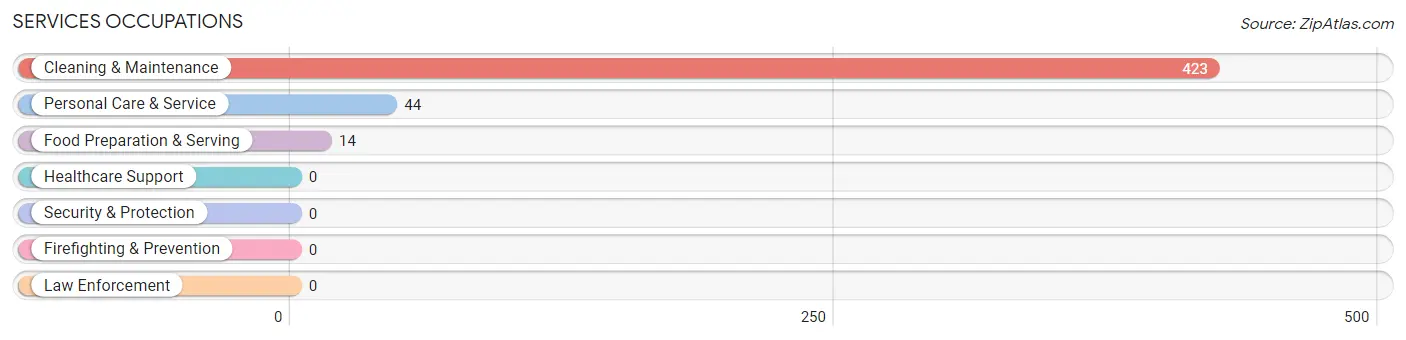
Services Occupations
The most common Services occupations in Kings Beach are Cleaning & Maintenance (423 | 26.5%), Personal Care & Service (44 | 2.8%), and Food Preparation & Serving (14 | 0.9%).
Services Occupations by Sex
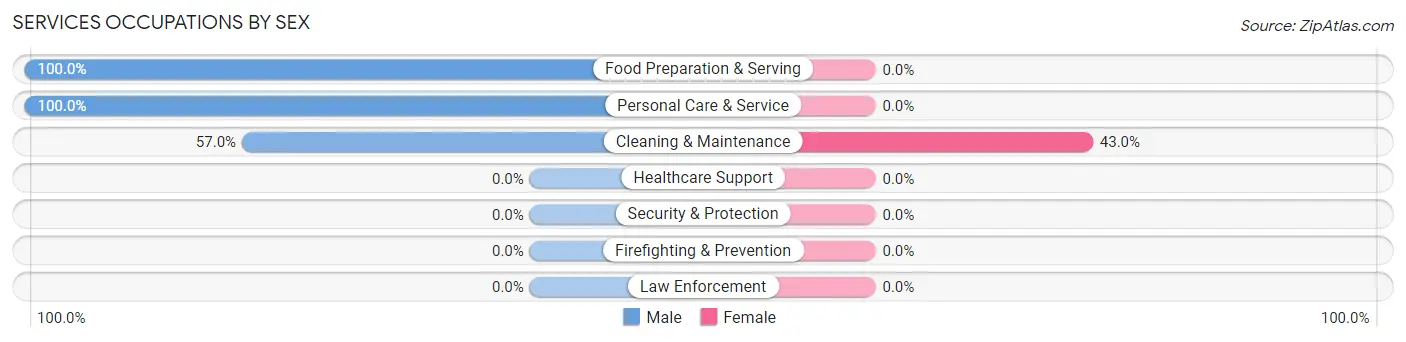
| Occupation | Male | Female |
| Healthcare Support | 0 (0.0%) | 0 (0.0%) |
| Security & Protection | 0 (0.0%) | 0 (0.0%) |
| Firefighting & Prevention | 0 (0.0%) | 0 (0.0%) |
| Law Enforcement | 0 (0.0%) | 0 (0.0%) |
| Food Preparation & Serving | 14 (100.0%) | 0 (0.0%) |
| Cleaning & Maintenance | 241 (57.0%) | 182 (43.0%) |
| Personal Care & Service | 44 (100.0%) | 0 (0.0%) |
| Total (Category) | 299 (62.2%) | 182 (37.8%) |
| Total (Overall) | 947 (59.4%) | 647 (40.6%) |
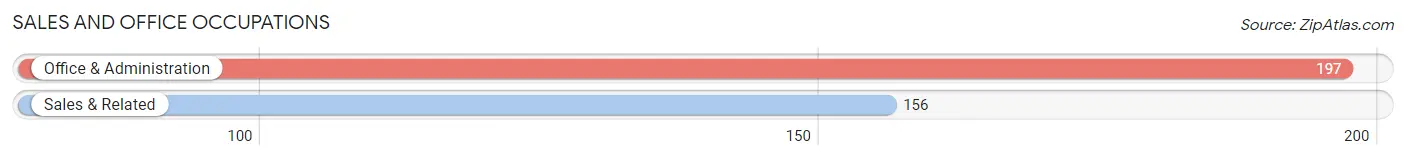
Sales and Office Occupations
The most common Sales and Office occupations in Kings Beach are Office & Administration (197 | 12.4%), and Sales & Related (156 | 9.8%).
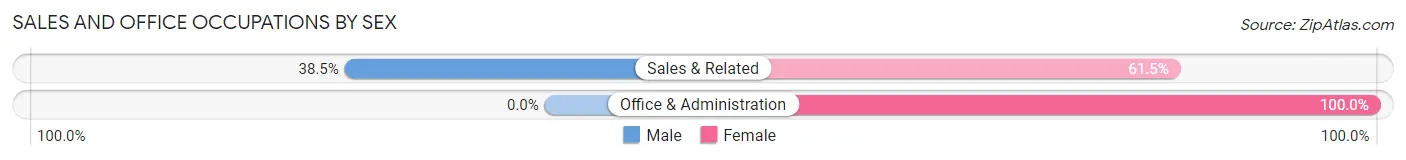
Sales and Office Occupations by Sex
| Occupation | Male | Female |
| Sales & Related | 60 (38.5%) | 96 (61.5%) |
| Office & Administration | 0 (0.0%) | 197 (100.0%) |
| Total (Category) | 60 (17.0%) | 293 (83.0%) |
| Total (Overall) | 947 (59.4%) | 647 (40.6%) |
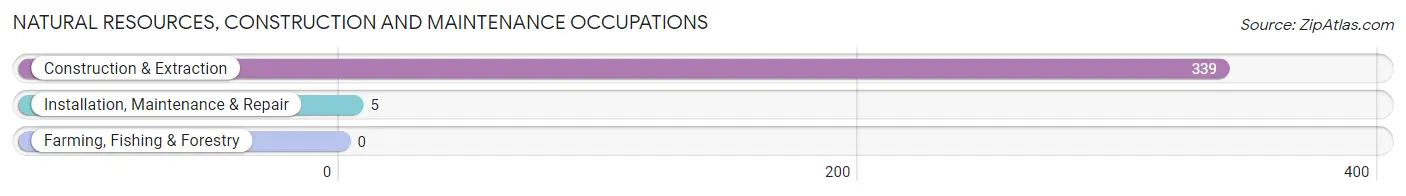
Natural Resources, Construction and Maintenance Occupations
The most common Natural Resources, Construction and Maintenance occupations in Kings Beach are Construction & Extraction (339 | 21.3%), and Installation, Maintenance & Repair (5 | 0.3%).
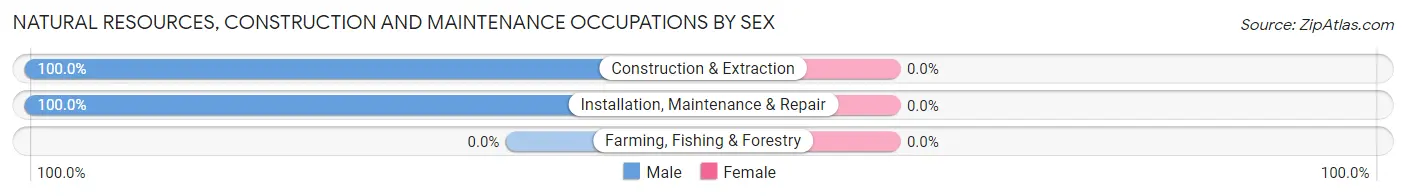
Natural Resources, Construction and Maintenance Occupations by Sex
| Occupation | Male | Female |
| Farming, Fishing & Forestry | 0 (0.0%) | 0 (0.0%) |
| Construction & Extraction | 339 (100.0%) | 0 (0.0%) |
| Installation, Maintenance & Repair | 5 (100.0%) | 0 (0.0%) |
| Total (Category) | 344 (100.0%) | 0 (0.0%) |
| Total (Overall) | 947 (59.4%) | 647 (40.6%) |
Production, Transportation and Moving Occupations
The most common Production, Transportation and Moving occupations in Kings Beach are Transportation (72 | 4.5%), and Material Moving (7 | 0.4%).
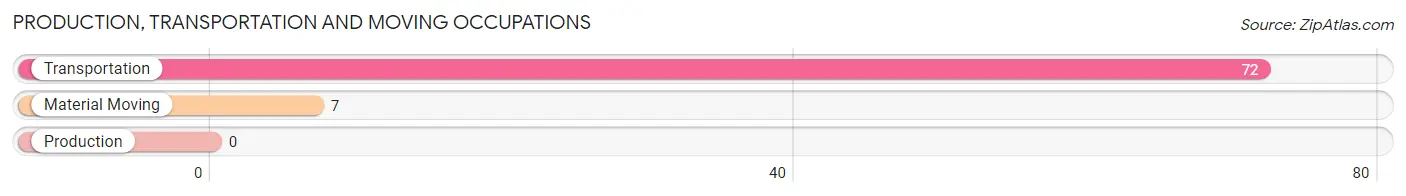
Production, Transportation and Moving Occupations by Sex
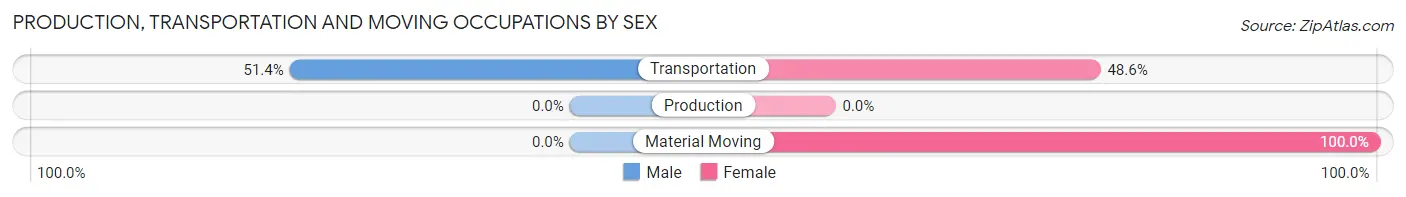
| Occupation | Male | Female |
| Production | 0 (0.0%) | 0 (0.0%) |
| Transportation | 37 (51.4%) | 35 (48.6%) |
| Material Moving | 0 (0.0%) | 7 (100.0%) |
| Total (Category) | 37 (46.8%) | 42 (53.2%) |
| Total (Overall) | 947 (59.4%) | 647 (40.6%) |
Employment Industries by Sex in Kings Beach
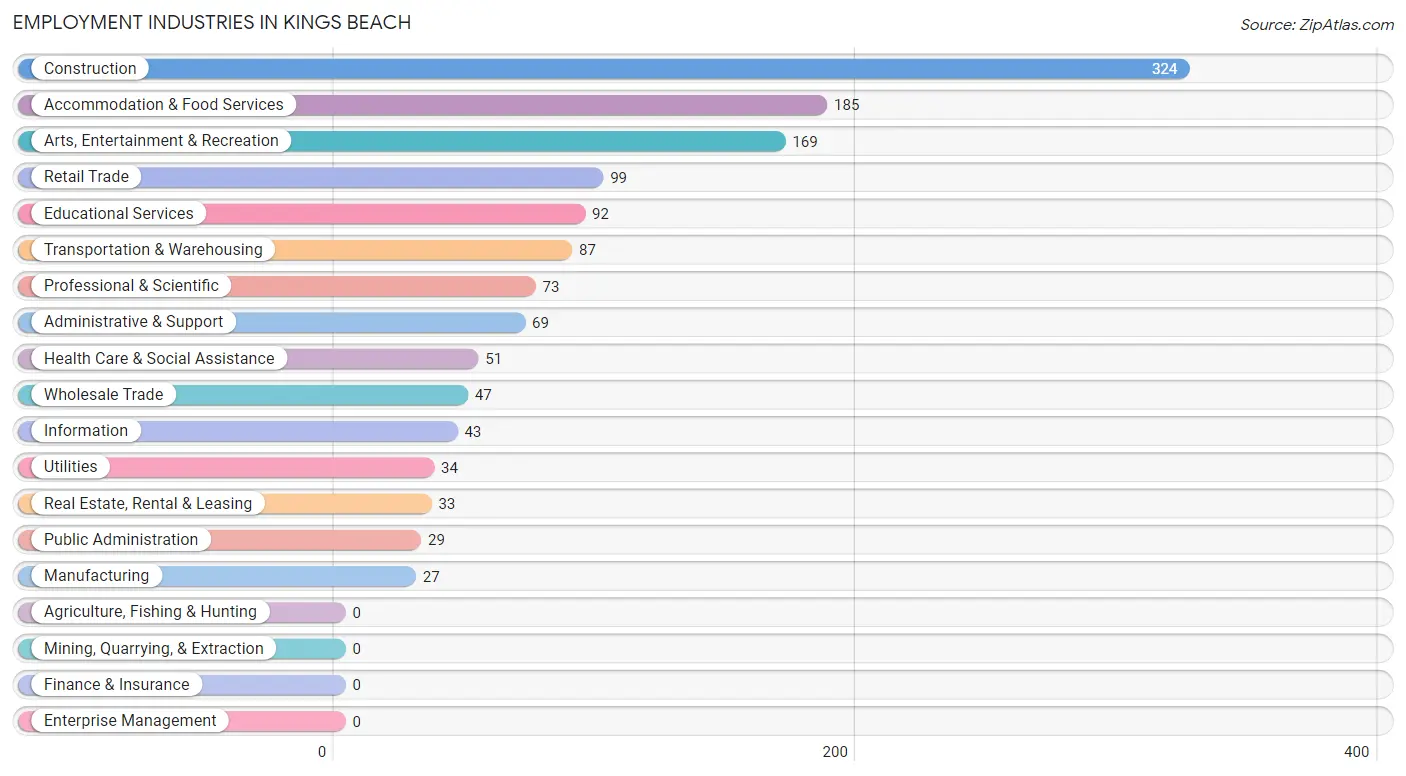
Employment Industries in Kings Beach
The major employment industries in Kings Beach include Construction (324 | 20.3%), Accommodation & Food Services (185 | 11.6%), Arts, Entertainment & Recreation (169 | 10.6%), Retail Trade (99 | 6.2%), and Educational Services (92 | 5.8%).
Employment Industries by Sex in Kings Beach
The Kings Beach industries that see more men than women are Construction (100.0%), Manufacturing (100.0%), and Administrative & Support (100.0%), whereas the industries that tend to have a higher number of women are Utilities (100.0%), Real Estate, Rental & Leasing (100.0%), and Health Care & Social Assistance (100.0%).
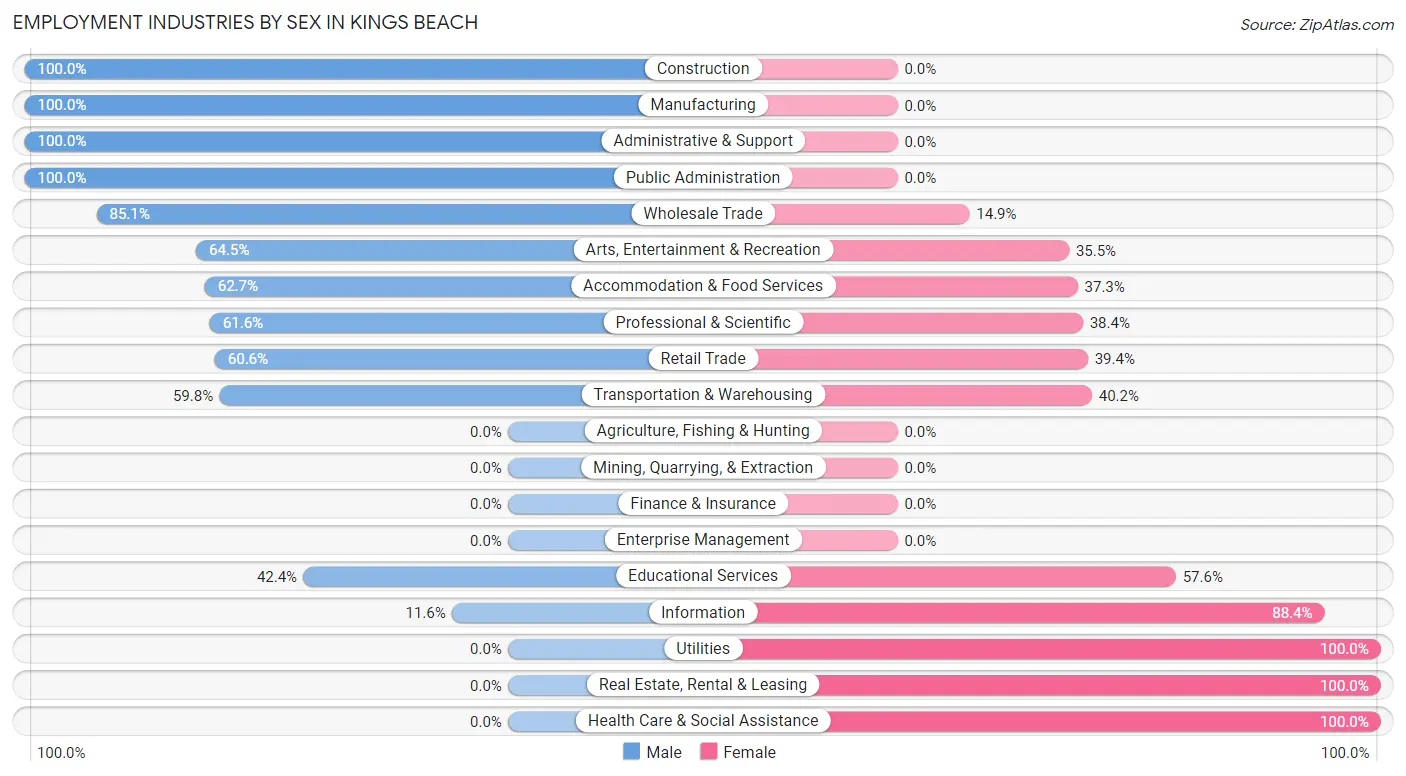
| Industry | Male | Female |
| Agriculture, Fishing & Hunting | 0 (0.0%) | 0 (0.0%) |
| Mining, Quarrying, & Extraction | 0 (0.0%) | 0 (0.0%) |
| Construction | 324 (100.0%) | 0 (0.0%) |
| Manufacturing | 27 (100.0%) | 0 (0.0%) |
| Wholesale Trade | 40 (85.1%) | 7 (14.9%) |
| Retail Trade | 60 (60.6%) | 39 (39.4%) |
| Transportation & Warehousing | 52 (59.8%) | 35 (40.2%) |
| Utilities | 0 (0.0%) | 34 (100.0%) |
| Information | 5 (11.6%) | 38 (88.4%) |
| Finance & Insurance | 0 (0.0%) | 0 (0.0%) |
| Real Estate, Rental & Leasing | 0 (0.0%) | 33 (100.0%) |
| Professional & Scientific | 45 (61.6%) | 28 (38.4%) |
| Enterprise Management | 0 (0.0%) | 0 (0.0%) |
| Administrative & Support | 69 (100.0%) | 0 (0.0%) |
| Educational Services | 39 (42.4%) | 53 (57.6%) |
| Health Care & Social Assistance | 0 (0.0%) | 51 (100.0%) |
| Arts, Entertainment & Recreation | 109 (64.5%) | 60 (35.5%) |
| Accommodation & Food Services | 116 (62.7%) | 69 (37.3%) |
| Public Administration | 29 (100.0%) | 0 (0.0%) |
| Total | 947 (59.4%) | 647 (40.6%) |
Education in Kings Beach
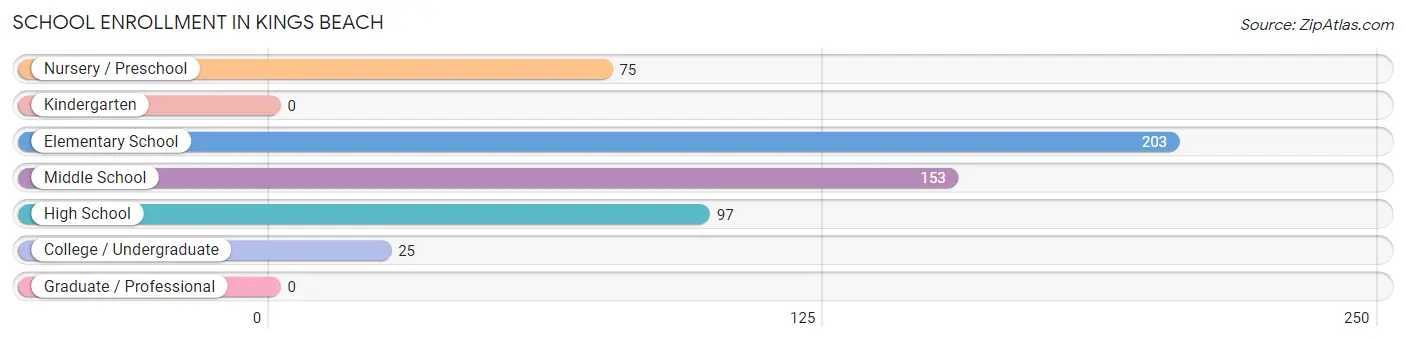
School Enrollment in Kings Beach
The most common levels of schooling among the 553 students in Kings Beach are elementary school (203 | 36.7%), middle school (153 | 27.7%), and high school (97 | 17.5%).
| School Level | # Students | % Students |
| Nursery / Preschool | 75 | 13.6% |
| Kindergarten | 0 | 0.0% |
| Elementary School | 203 | 36.7% |
| Middle School | 153 | 27.7% |
| High School | 97 | 17.5% |
| College / Undergraduate | 25 | 4.5% |
| Graduate / Professional | 0 | 0.0% |
| Total | 553 | 100.0% |
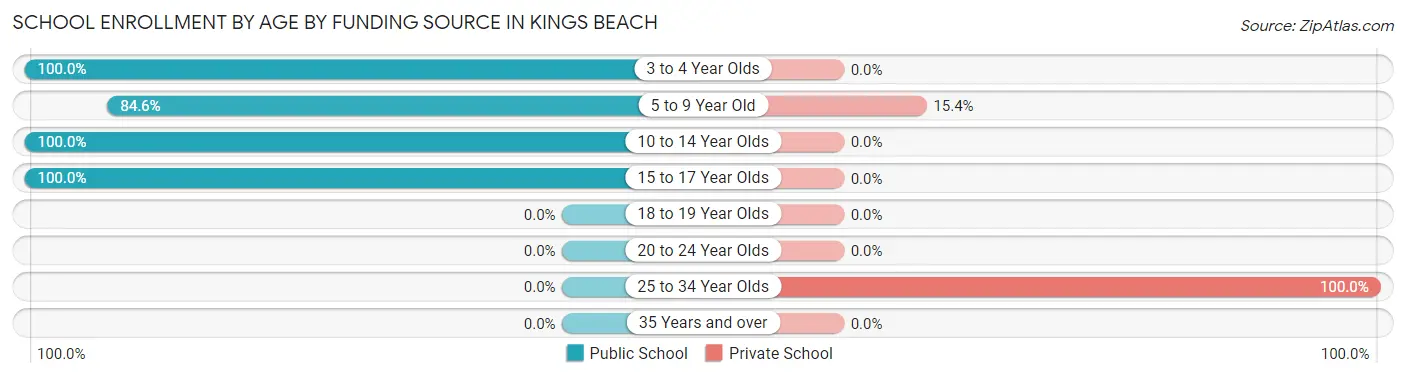
School Enrollment by Age by Funding Source in Kings Beach
Out of a total of 553 students who are enrolled in schools in Kings Beach, 58 (10.5%) attend a private institution, while the remaining 495 (89.5%) are enrolled in public schools. The age group of 25 to 34 year olds has the highest likelihood of being enrolled in private schools, with 25 (100.0% in the age bracket) enrolled. Conversely, the age group of 3 to 4 year olds has the lowest likelihood of being enrolled in a private school, with 42 (100.0% in the age bracket) attending a public institution.
| Age Bracket | Public School | Private School |
| 3 to 4 Year Olds | 42 (100.0%) | 0 (0.0%) |
| 5 to 9 Year Old | 181 (84.6%) | 33 (15.4%) |
| 10 to 14 Year Olds | 175 (100.0%) | 0 (0.0%) |
| 15 to 17 Year Olds | 97 (100.0%) | 0 (0.0%) |
| 18 to 19 Year Olds | 0 (0.0%) | 0 (0.0%) |
| 20 to 24 Year Olds | 0 (0.0%) | 0 (0.0%) |
| 25 to 34 Year Olds | 0 (0.0%) | 25 (100.0%) |
| 35 Years and over | 0 (0.0%) | 0 (0.0%) |
| Total | 495 (89.5%) | 58 (10.5%) |
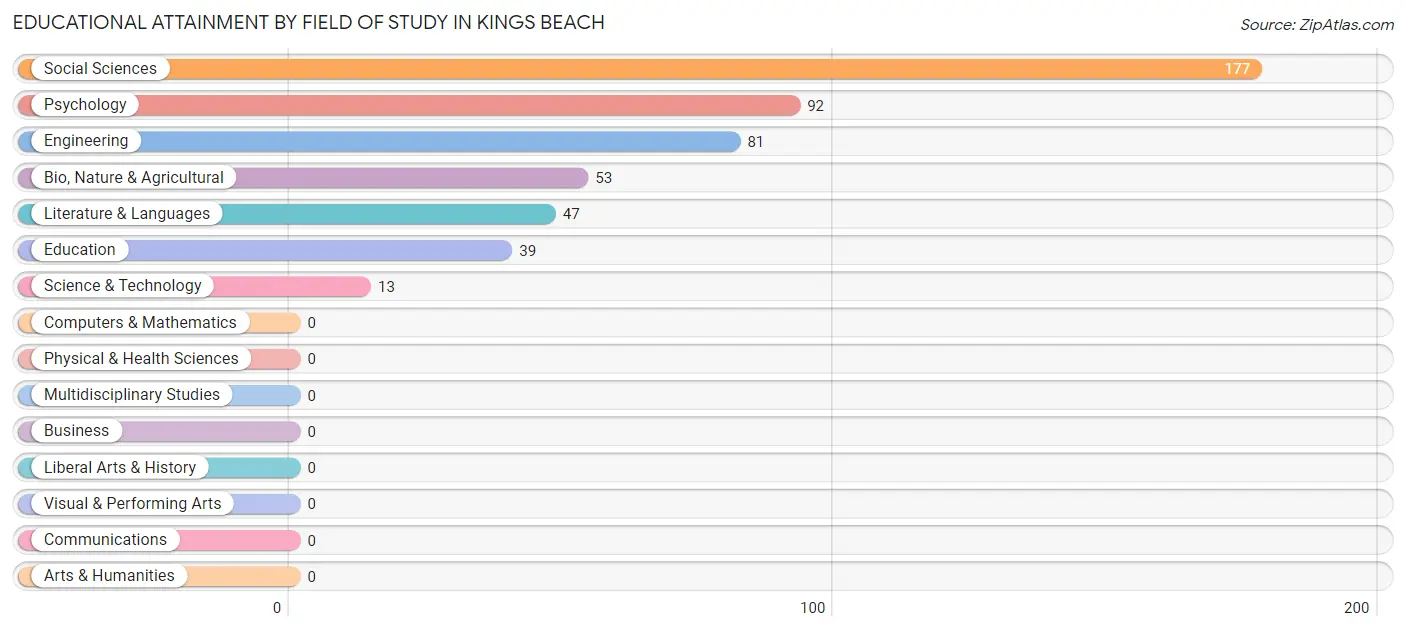
Educational Attainment by Field of Study in Kings Beach
Social sciences (177 | 35.3%), psychology (92 | 18.3%), engineering (81 | 16.1%), bio, nature & agricultural (53 | 10.6%), and literature & languages (47 | 9.4%) are the most common fields of study among 502 individuals in Kings Beach who have obtained a bachelor's degree or higher.
| Field of Study | # Graduates | % Graduates |
| Computers & Mathematics | 0 | 0.0% |
| Bio, Nature & Agricultural | 53 | 10.6% |
| Physical & Health Sciences | 0 | 0.0% |
| Psychology | 92 | 18.3% |
| Social Sciences | 177 | 35.3% |
| Engineering | 81 | 16.1% |
| Multidisciplinary Studies | 0 | 0.0% |
| Science & Technology | 13 | 2.6% |
| Business | 0 | 0.0% |
| Education | 39 | 7.8% |
| Literature & Languages | 47 | 9.4% |
| Liberal Arts & History | 0 | 0.0% |
| Visual & Performing Arts | 0 | 0.0% |
| Communications | 0 | 0.0% |
| Arts & Humanities | 0 | 0.0% |
| Total | 502 | 100.0% |
Transportation & Commute in Kings Beach
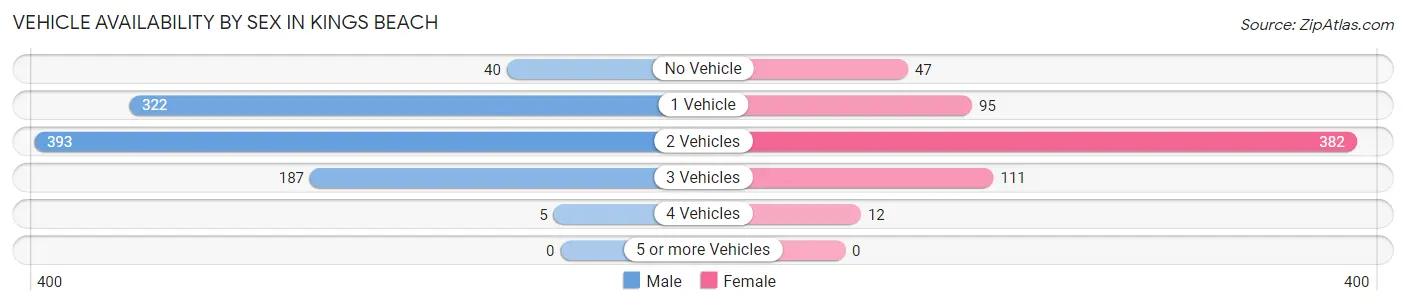
Vehicle Availability by Sex in Kings Beach
The most prevalent vehicle ownership categories in Kings Beach are males with 2 vehicles (393, accounting for 41.5%) and females with 2 vehicles (382, making up 60.7%).
| Vehicles Available | Male | Female |
| No Vehicle | 40 (4.2%) | 47 (7.3%) |
| 1 Vehicle | 322 (34.0%) | 95 (14.7%) |
| 2 Vehicles | 393 (41.5%) | 382 (59.0%) |
| 3 Vehicles | 187 (19.8%) | 111 (17.2%) |
| 4 Vehicles | 5 (0.5%) | 12 (1.8%) |
| 5 or more Vehicles | 0 (0.0%) | 0 (0.0%) |
| Total | 947 (100.0%) | 647 (100.0%) |
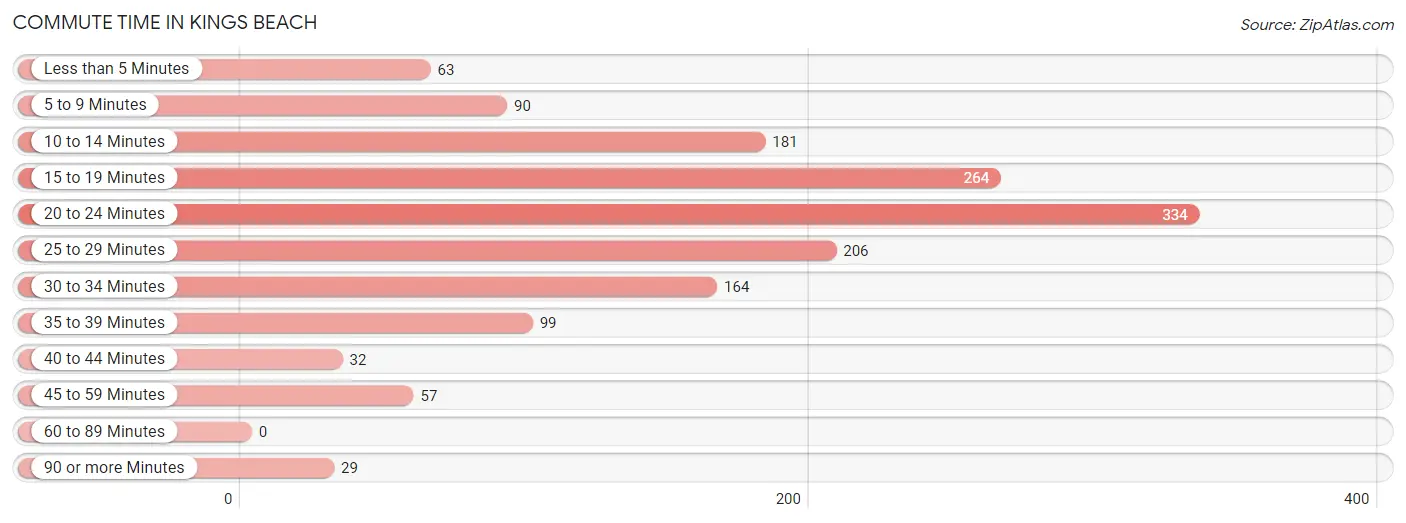
Commute Time in Kings Beach
The most frequently occuring commute durations in Kings Beach are 20 to 24 minutes (334 commuters, 22.0%), 15 to 19 minutes (264 commuters, 17.4%), and 25 to 29 minutes (206 commuters, 13.6%).
| Commute Time | # Commuters | % Commuters |
| Less than 5 Minutes | 63 | 4.2% |
| 5 to 9 Minutes | 90 | 5.9% |
| 10 to 14 Minutes | 181 | 11.9% |
| 15 to 19 Minutes | 264 | 17.4% |
| 20 to 24 Minutes | 334 | 22.0% |
| 25 to 29 Minutes | 206 | 13.6% |
| 30 to 34 Minutes | 164 | 10.8% |
| 35 to 39 Minutes | 99 | 6.5% |
| 40 to 44 Minutes | 32 | 2.1% |
| 45 to 59 Minutes | 57 | 3.7% |
| 60 to 89 Minutes | 0 | 0.0% |
| 90 or more Minutes | 29 | 1.9% |
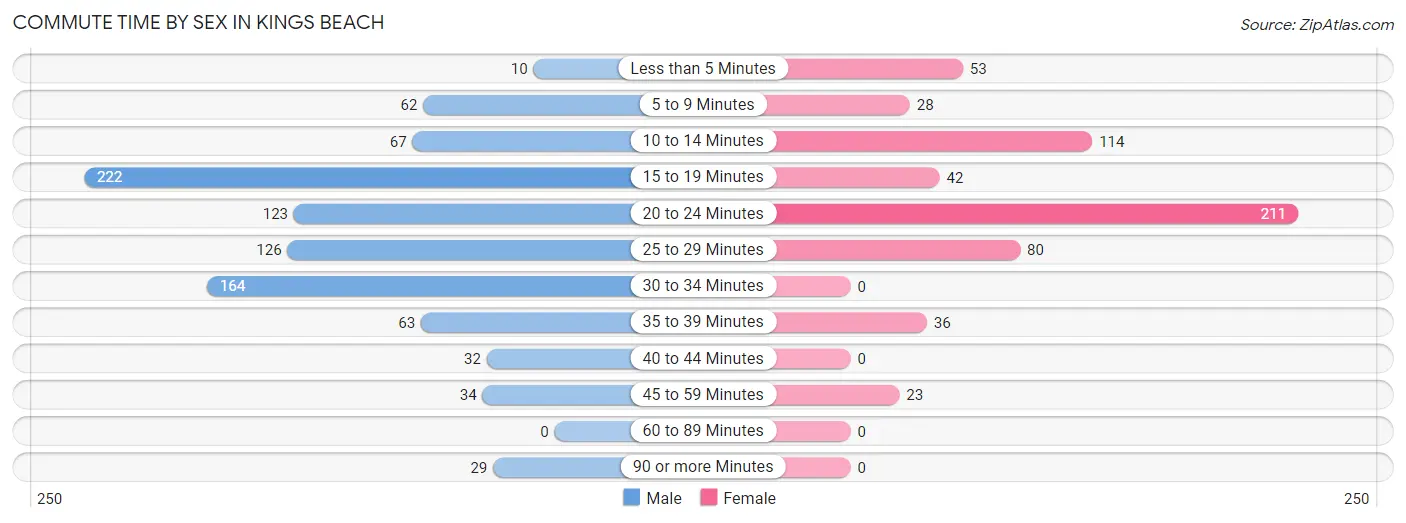
Commute Time by Sex in Kings Beach
The most common commute times in Kings Beach are 15 to 19 minutes (222 commuters, 23.8%) for males and 20 to 24 minutes (211 commuters, 35.9%) for females.
| Commute Time | Male | Female |
| Less than 5 Minutes | 10 (1.1%) | 53 (9.0%) |
| 5 to 9 Minutes | 62 (6.7%) | 28 (4.8%) |
| 10 to 14 Minutes | 67 (7.2%) | 114 (19.4%) |
| 15 to 19 Minutes | 222 (23.8%) | 42 (7.2%) |
| 20 to 24 Minutes | 123 (13.2%) | 211 (35.9%) |
| 25 to 29 Minutes | 126 (13.5%) | 80 (13.6%) |
| 30 to 34 Minutes | 164 (17.6%) | 0 (0.0%) |
| 35 to 39 Minutes | 63 (6.8%) | 36 (6.1%) |
| 40 to 44 Minutes | 32 (3.4%) | 0 (0.0%) |
| 45 to 59 Minutes | 34 (3.6%) | 23 (3.9%) |
| 60 to 89 Minutes | 0 (0.0%) | 0 (0.0%) |
| 90 or more Minutes | 29 (3.1%) | 0 (0.0%) |
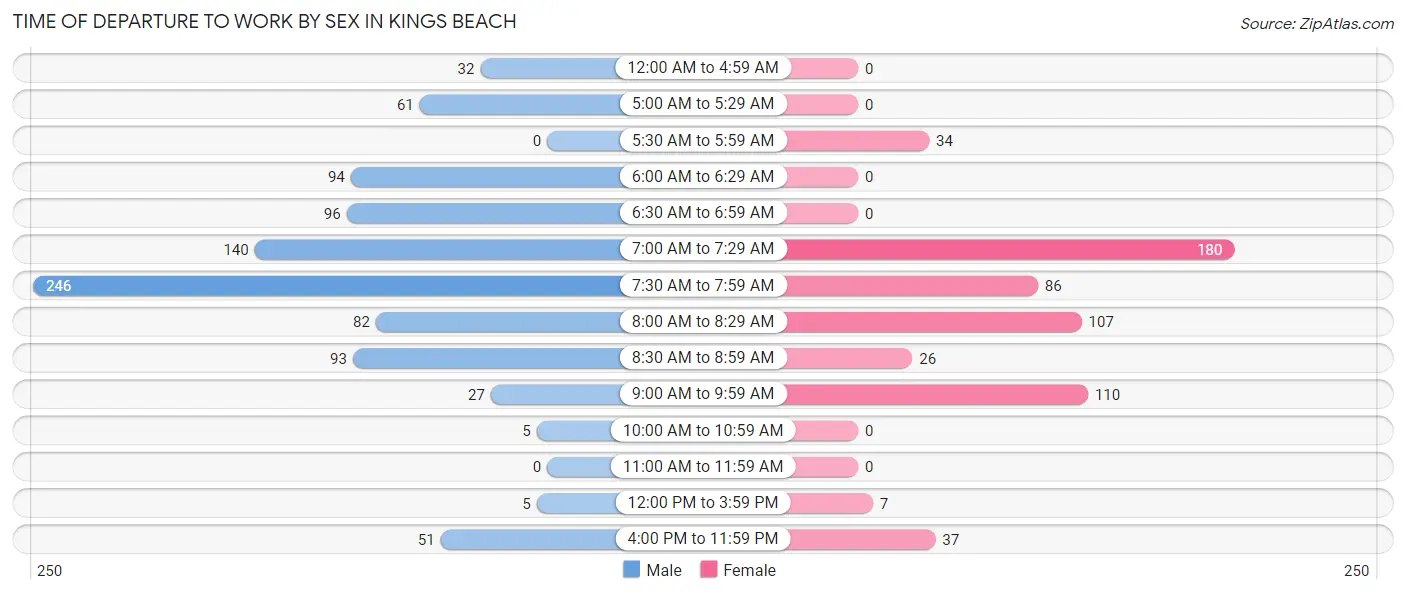
Time of Departure to Work by Sex in Kings Beach
The most frequent times of departure to work in Kings Beach are 7:30 AM to 7:59 AM (246, 26.4%) for males and 7:00 AM to 7:29 AM (180, 30.7%) for females.
| Time of Departure | Male | Female |
| 12:00 AM to 4:59 AM | 32 (3.4%) | 0 (0.0%) |
| 5:00 AM to 5:29 AM | 61 (6.6%) | 0 (0.0%) |
| 5:30 AM to 5:59 AM | 0 (0.0%) | 34 (5.8%) |
| 6:00 AM to 6:29 AM | 94 (10.1%) | 0 (0.0%) |
| 6:30 AM to 6:59 AM | 96 (10.3%) | 0 (0.0%) |
| 7:00 AM to 7:29 AM | 140 (15.0%) | 180 (30.7%) |
| 7:30 AM to 7:59 AM | 246 (26.4%) | 86 (14.6%) |
| 8:00 AM to 8:29 AM | 82 (8.8%) | 107 (18.2%) |
| 8:30 AM to 8:59 AM | 93 (10.0%) | 26 (4.4%) |
| 9:00 AM to 9:59 AM | 27 (2.9%) | 110 (18.7%) |
| 10:00 AM to 10:59 AM | 5 (0.5%) | 0 (0.0%) |
| 11:00 AM to 11:59 AM | 0 (0.0%) | 0 (0.0%) |
| 12:00 PM to 3:59 PM | 5 (0.5%) | 7 (1.2%) |
| 4:00 PM to 11:59 PM | 51 (5.5%) | 37 (6.3%) |
| Total | 932 (100.0%) | 587 (100.0%) |
Housing Occupancy in Kings Beach
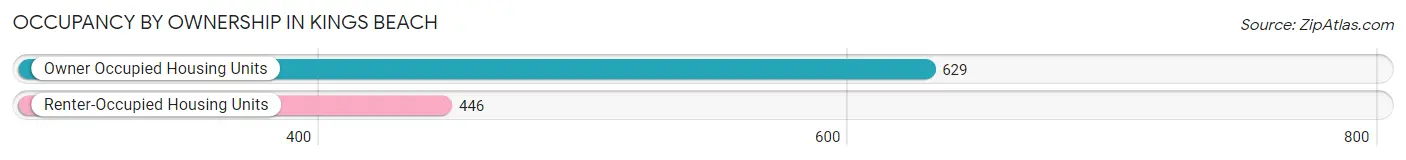
Occupancy by Ownership in Kings Beach
Of the total 1,075 dwellings in Kings Beach, owner-occupied units account for 629 (58.5%), while renter-occupied units make up 446 (41.5%).
| Occupancy | # Housing Units | % Housing Units |
| Owner Occupied Housing Units | 629 | 58.5% |
| Renter-Occupied Housing Units | 446 | 41.5% |
| Total Occupied Housing Units | 1,075 | 100.0% |
Occupancy by Household Size in Kings Beach
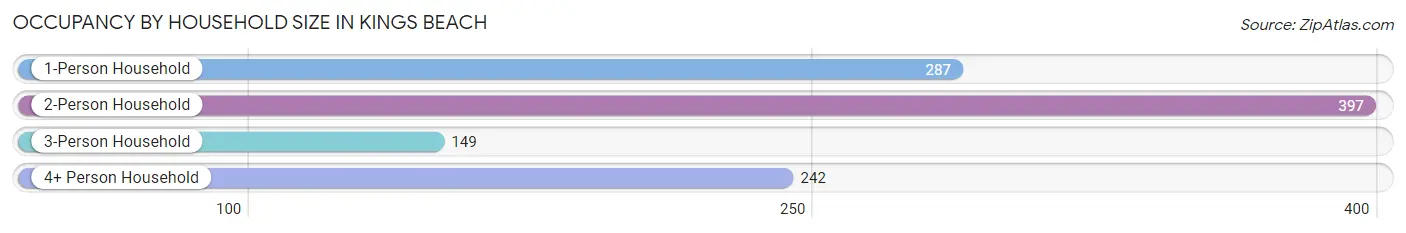
| Household Size | # Housing Units | % Housing Units |
| 1-Person Household | 287 | 26.7% |
| 2-Person Household | 397 | 36.9% |
| 3-Person Household | 149 | 13.9% |
| 4+ Person Household | 242 | 22.5% |
| Total Housing Units | 1,075 | 100.0% |
Occupancy by Ownership by Household Size in Kings Beach
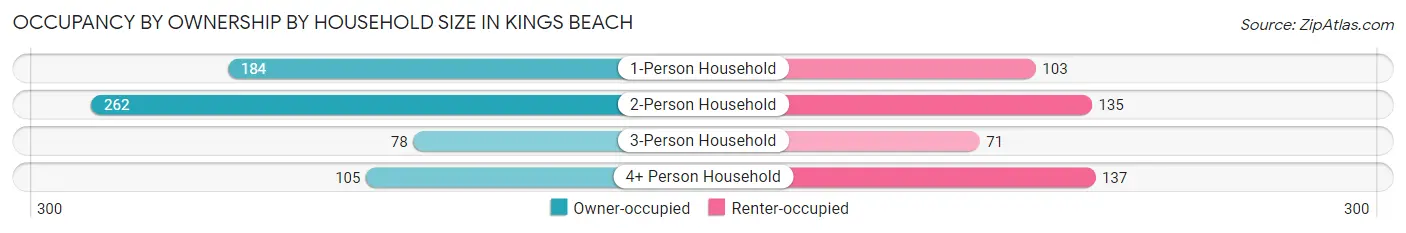
| Household Size | Owner-occupied | Renter-occupied |
| 1-Person Household | 184 (64.1%) | 103 (35.9%) |
| 2-Person Household | 262 (66.0%) | 135 (34.0%) |
| 3-Person Household | 78 (52.3%) | 71 (47.6%) |
| 4+ Person Household | 105 (43.4%) | 137 (56.6%) |
| Total Housing Units | 629 (58.5%) | 446 (41.5%) |
Occupancy by Educational Attainment in Kings Beach
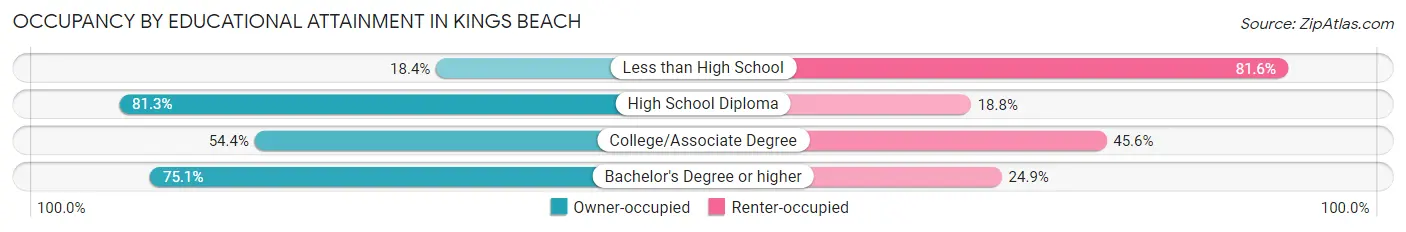
| Household Size | Owner-occupied | Renter-occupied |
| Less than High School | 39 (18.4%) | 173 (81.6%) |
| High School Diploma | 234 (81.2%) | 54 (18.8%) |
| College/Associate Degree | 199 (54.4%) | 167 (45.6%) |
| Bachelor's Degree or higher | 157 (75.1%) | 52 (24.9%) |
Occupancy by Age of Householder in Kings Beach
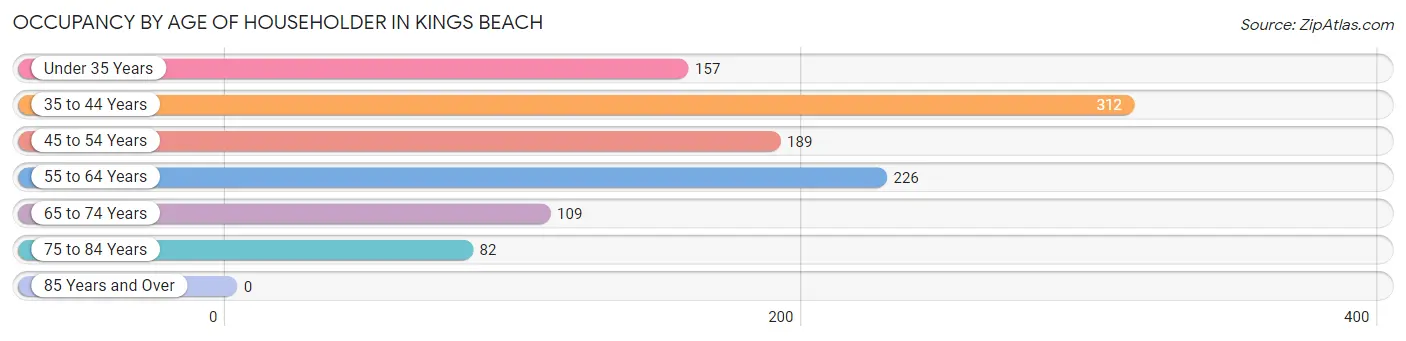
| Age Bracket | # Households | % Households |
| Under 35 Years | 157 | 14.6% |
| 35 to 44 Years | 312 | 29.0% |
| 45 to 54 Years | 189 | 17.6% |
| 55 to 64 Years | 226 | 21.0% |
| 65 to 74 Years | 109 | 10.1% |
| 75 to 84 Years | 82 | 7.6% |
| 85 Years and Over | 0 | 0.0% |
| Total | 1,075 | 100.0% |
Housing Finances in Kings Beach
Median Income by Occupancy in Kings Beach
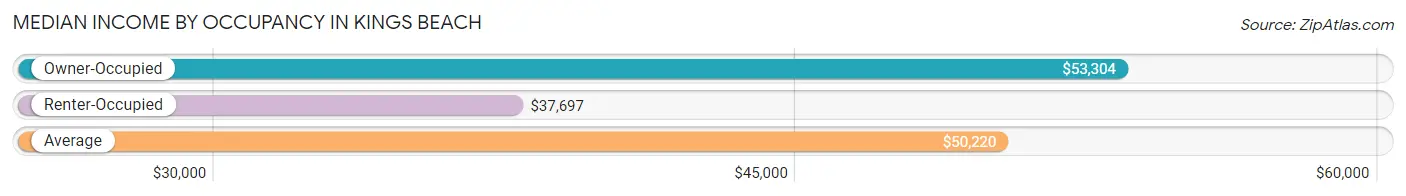
| Occupancy Type | # Households | Median Income |
| Owner-Occupied | 629 (58.5%) | $53,304 |
| Renter-Occupied | 446 (41.5%) | $37,697 |
| Average | 1,075 (100.0%) | $50,220 |
Occupancy by Householder Income Bracket in Kings Beach
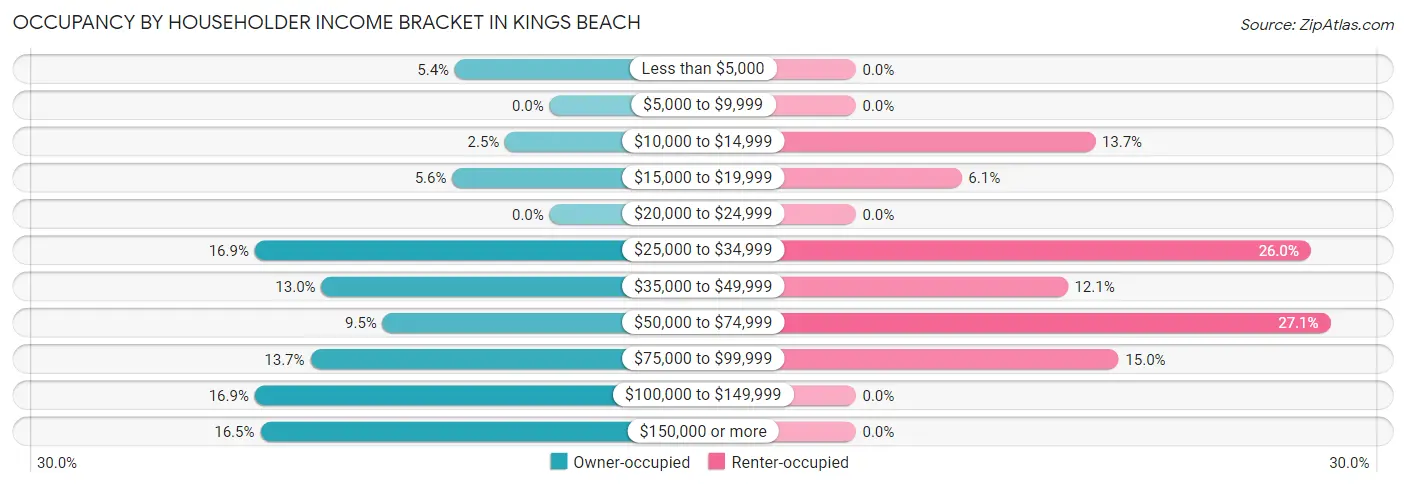
| Income Bracket | Owner-occupied | Renter-occupied |
| Less than $5,000 | 34 (5.4%) | 0 (0.0%) |
| $5,000 to $9,999 | 0 (0.0%) | 0 (0.0%) |
| $10,000 to $14,999 | 16 (2.5%) | 61 (13.7%) |
| $15,000 to $19,999 | 35 (5.6%) | 27 (6.0%) |
| $20,000 to $24,999 | 0 (0.0%) | 0 (0.0%) |
| $25,000 to $34,999 | 106 (16.9%) | 116 (26.0%) |
| $35,000 to $49,999 | 82 (13.0%) | 54 (12.1%) |
| $50,000 to $74,999 | 60 (9.5%) | 121 (27.1%) |
| $75,000 to $99,999 | 86 (13.7%) | 67 (15.0%) |
| $100,000 to $149,999 | 106 (16.9%) | 0 (0.0%) |
| $150,000 or more | 104 (16.5%) | 0 (0.0%) |
| Total | 629 (100.0%) | 446 (100.0%) |
Monthly Housing Cost Tiers in Kings Beach
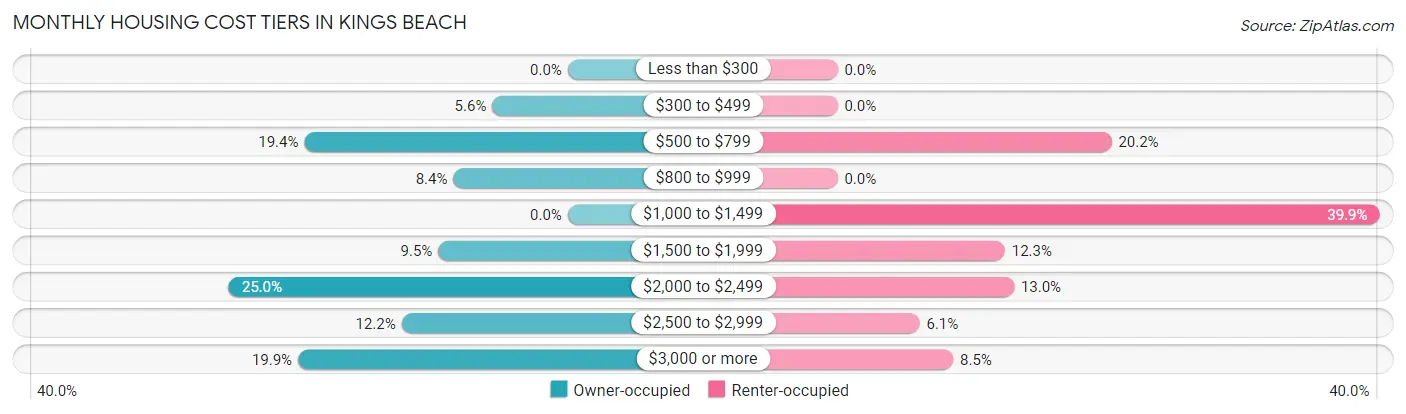
| Monthly Cost | Owner-occupied | Renter-occupied |
| Less than $300 | 0 (0.0%) | 0 (0.0%) |
| $300 to $499 | 35 (5.6%) | 0 (0.0%) |
| $500 to $799 | 122 (19.4%) | 90 (20.2%) |
| $800 to $999 | 53 (8.4%) | 0 (0.0%) |
| $1,000 to $1,499 | 0 (0.0%) | 178 (39.9%) |
| $1,500 to $1,999 | 60 (9.5%) | 55 (12.3%) |
| $2,000 to $2,499 | 157 (25.0%) | 58 (13.0%) |
| $2,500 to $2,999 | 77 (12.2%) | 27 (6.0%) |
| $3,000 or more | 125 (19.9%) | 38 (8.5%) |
| Total | 629 (100.0%) | 446 (100.0%) |
Physical Housing Characteristics in Kings Beach
Housing Structures in Kings Beach
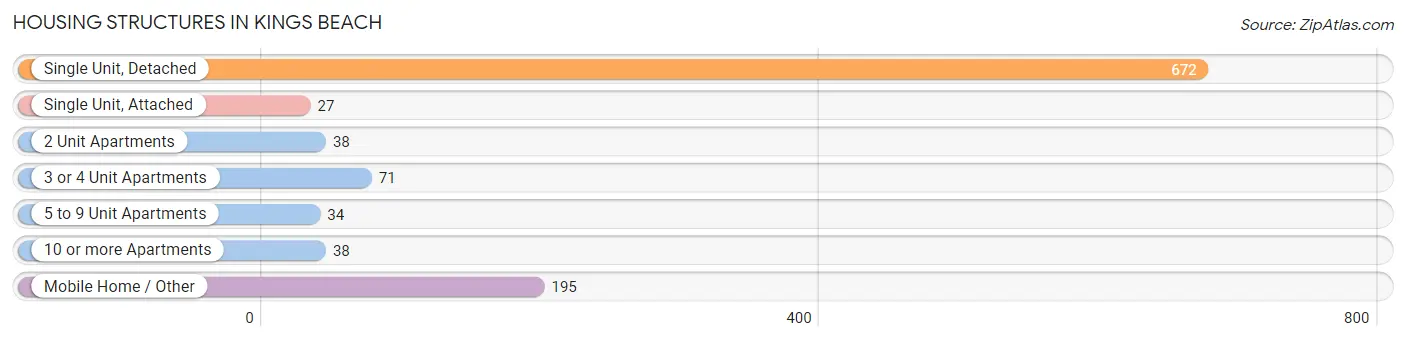
| Structure Type | # Housing Units | % Housing Units |
| Single Unit, Detached | 672 | 62.5% |
| Single Unit, Attached | 27 | 2.5% |
| 2 Unit Apartments | 38 | 3.5% |
| 3 or 4 Unit Apartments | 71 | 6.6% |
| 5 to 9 Unit Apartments | 34 | 3.2% |
| 10 or more Apartments | 38 | 3.5% |
| Mobile Home / Other | 195 | 18.1% |
| Total | 1,075 | 100.0% |
Housing Structures by Occupancy in Kings Beach
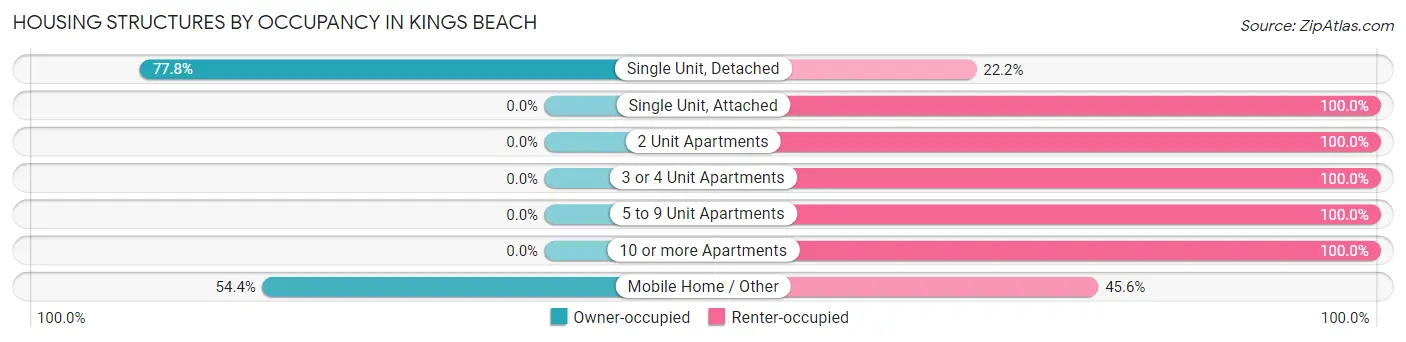
| Structure Type | Owner-occupied | Renter-occupied |
| Single Unit, Detached | 523 (77.8%) | 149 (22.2%) |
| Single Unit, Attached | 0 (0.0%) | 27 (100.0%) |
| 2 Unit Apartments | 0 (0.0%) | 38 (100.0%) |
| 3 or 4 Unit Apartments | 0 (0.0%) | 71 (100.0%) |
| 5 to 9 Unit Apartments | 0 (0.0%) | 34 (100.0%) |
| 10 or more Apartments | 0 (0.0%) | 38 (100.0%) |
| Mobile Home / Other | 106 (54.4%) | 89 (45.6%) |
| Total | 629 (58.5%) | 446 (41.5%) |
Housing Structures by Number of Rooms in Kings Beach
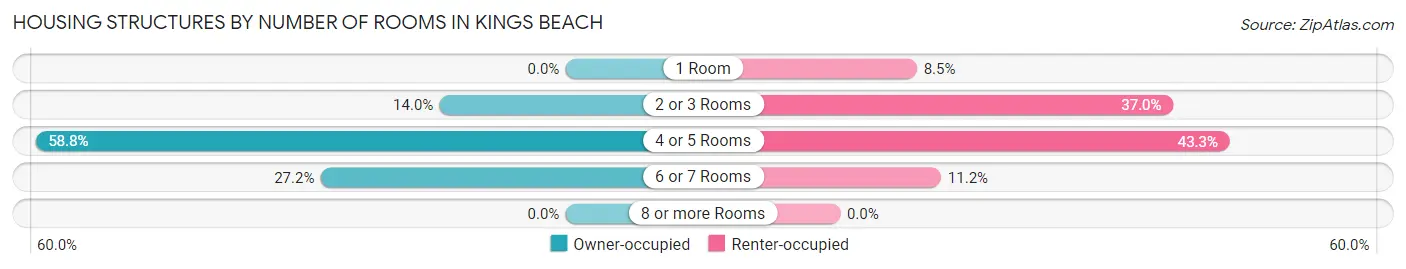
| Number of Rooms | Owner-occupied | Renter-occupied |
| 1 Room | 0 (0.0%) | 38 (8.5%) |
| 2 or 3 Rooms | 88 (14.0%) | 165 (37.0%) |
| 4 or 5 Rooms | 370 (58.8%) | 193 (43.3%) |
| 6 or 7 Rooms | 171 (27.2%) | 50 (11.2%) |
| 8 or more Rooms | 0 (0.0%) | 0 (0.0%) |
| Total | 629 (100.0%) | 446 (100.0%) |
Housing Structure by Heating Type in Kings Beach
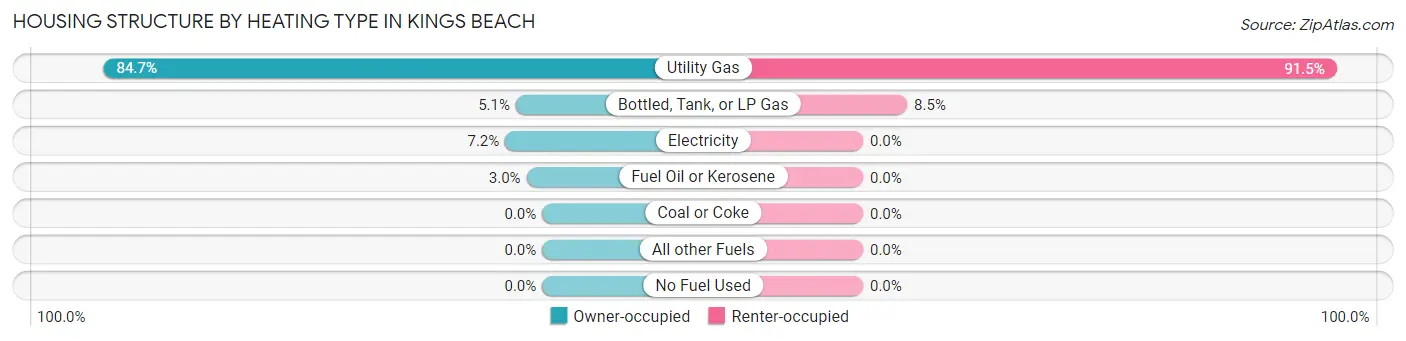
| Heating Type | Owner-occupied | Renter-occupied |
| Utility Gas | 533 (84.7%) | 408 (91.5%) |
| Bottled, Tank, or LP Gas | 32 (5.1%) | 38 (8.5%) |
| Electricity | 45 (7.1%) | 0 (0.0%) |
| Fuel Oil or Kerosene | 19 (3.0%) | 0 (0.0%) |
| Coal or Coke | 0 (0.0%) | 0 (0.0%) |
| All other Fuels | 0 (0.0%) | 0 (0.0%) |
| No Fuel Used | 0 (0.0%) | 0 (0.0%) |
| Total | 629 (100.0%) | 446 (100.0%) |
Household Vehicle Usage in Kings Beach
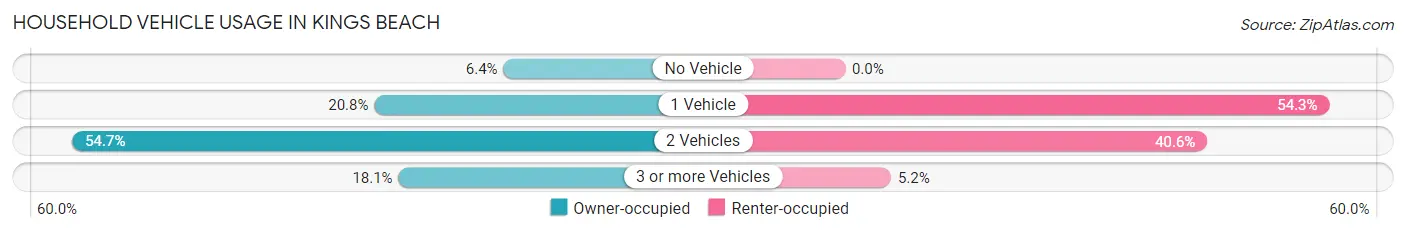
| Vehicles per Household | Owner-occupied | Renter-occupied |
| No Vehicle | 40 (6.4%) | 0 (0.0%) |
| 1 Vehicle | 131 (20.8%) | 242 (54.3%) |
| 2 Vehicles | 344 (54.7%) | 181 (40.6%) |
| 3 or more Vehicles | 114 (18.1%) | 23 (5.2%) |
| Total | 629 (100.0%) | 446 (100.0%) |
Real Estate & Mortgages in Kings Beach
Real Estate and Mortgage Overview in Kings Beach
| Characteristic | Without Mortgage | With Mortgage |
| Housing Units | 226 | 403 |
| Median Property Value | - | - |
| Median Household Income | $27,183 | $104 |
| Monthly Housing Costs | $742 | $125 |
| Real Estate Taxes | $2,375 | $0 |
Property Value by Mortgage Status in Kings Beach
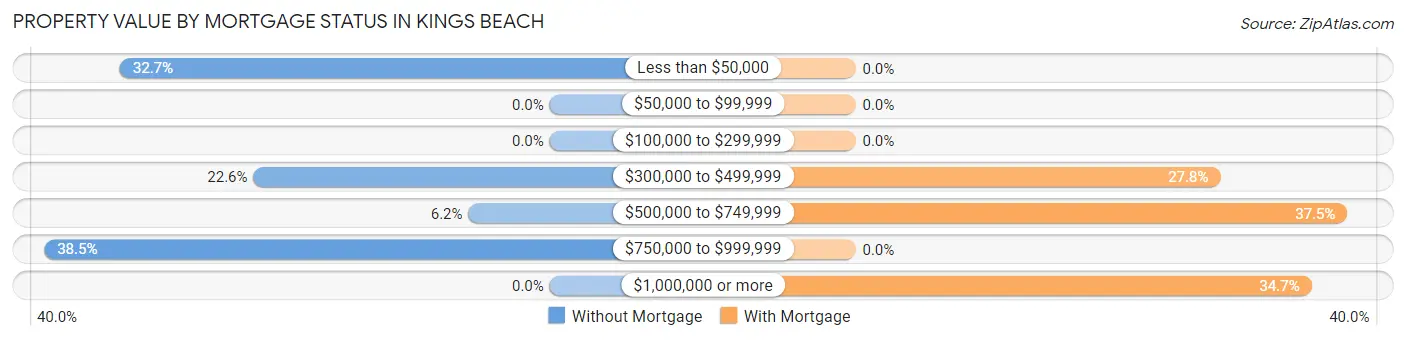
| Property Value | Without Mortgage | With Mortgage |
| Less than $50,000 | 74 (32.7%) | 0 (0.0%) |
| $50,000 to $99,999 | 0 (0.0%) | 0 (0.0%) |
| $100,000 to $299,999 | 0 (0.0%) | 0 (0.0%) |
| $300,000 to $499,999 | 51 (22.6%) | 112 (27.8%) |
| $500,000 to $749,999 | 14 (6.2%) | 151 (37.5%) |
| $750,000 to $999,999 | 87 (38.5%) | 0 (0.0%) |
| $1,000,000 or more | 0 (0.0%) | 140 (34.7%) |
| Total | 226 (100.0%) | 403 (100.0%) |
Household Income by Mortgage Status in Kings Beach
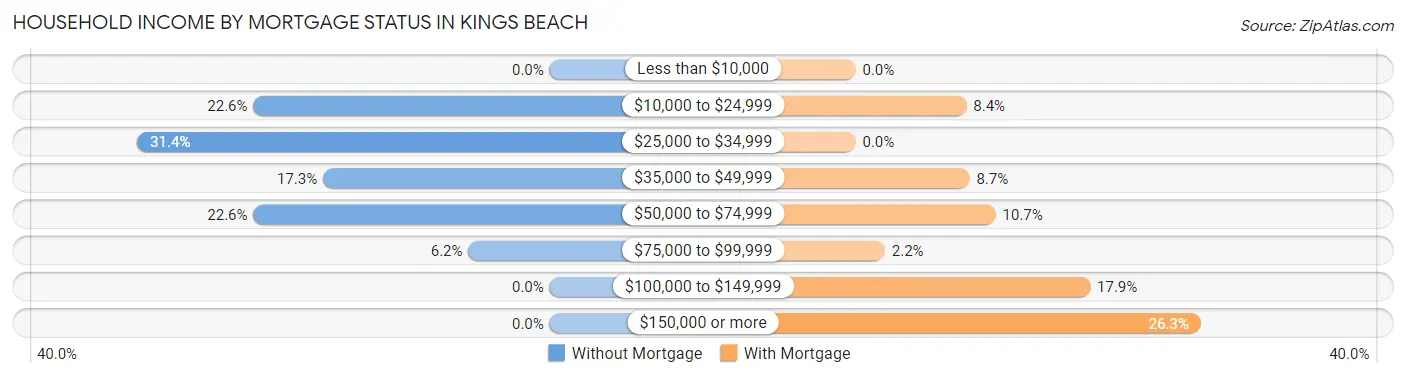
| Household Income | Without Mortgage | With Mortgage |
| Less than $10,000 | 0 (0.0%) | 0 (0.0%) |
| $10,000 to $24,999 | 51 (22.6%) | 34 (8.4%) |
| $25,000 to $34,999 | 71 (31.4%) | 0 (0.0%) |
| $35,000 to $49,999 | 39 (17.3%) | 35 (8.7%) |
| $50,000 to $74,999 | 51 (22.6%) | 43 (10.7%) |
| $75,000 to $99,999 | 14 (6.2%) | 9 (2.2%) |
| $100,000 to $149,999 | 0 (0.0%) | 72 (17.9%) |
| $150,000 or more | 0 (0.0%) | 106 (26.3%) |
| Total | 226 (100.0%) | 403 (100.0%) |
Property Value to Household Income Ratio in Kings Beach
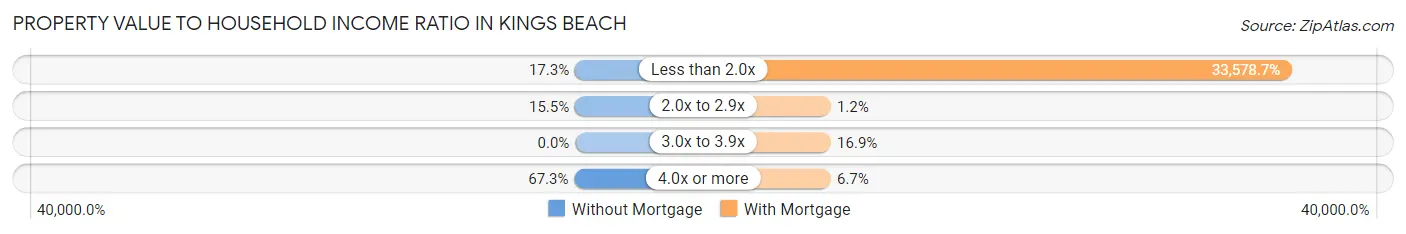
| Value-to-Income Ratio | Without Mortgage | With Mortgage |
| Less than 2.0x | 39 (17.3%) | 135,322 (33,578.7%) |
| 2.0x to 2.9x | 35 (15.5%) | 5 (1.2%) |
| 3.0x to 3.9x | 0 (0.0%) | 68 (16.9%) |
| 4.0x or more | 152 (67.3%) | 27 (6.7%) |
| Total | 226 (100.0%) | 403 (100.0%) |
Real Estate Taxes by Mortgage Status in Kings Beach
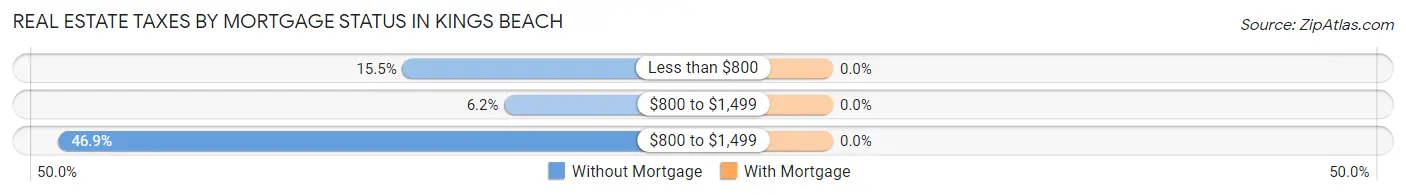
| Property Taxes | Without Mortgage | With Mortgage |
| Less than $800 | 35 (15.5%) | 0 (0.0%) |
| $800 to $1,499 | 14 (6.2%) | 0 (0.0%) |
| $800 to $1,499 | 106 (46.9%) | 0 (0.0%) |
| Total | 226 (100.0%) | 403 (100.0%) |
Health & Disability in Kings Beach
Health Insurance Coverage by Age in Kings Beach
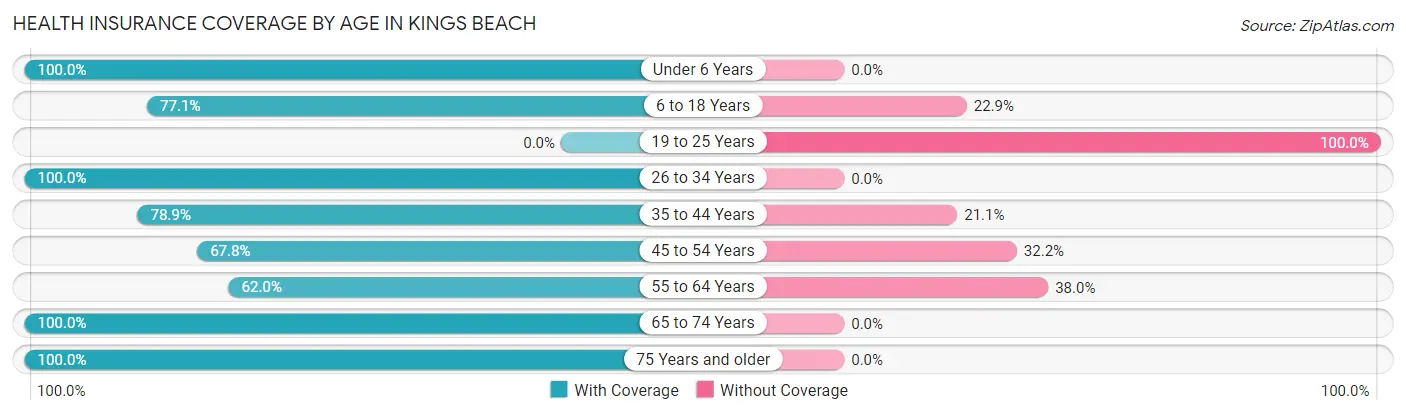
| Age Bracket | With Coverage | Without Coverage |
| Under 6 Years | 75 (100.0%) | 0 (0.0%) |
| 6 to 18 Years | 378 (77.1%) | 112 (22.9%) |
| 19 to 25 Years | 0 (0.0%) | 119 (100.0%) |
| 26 to 34 Years | 322 (100.0%) | 0 (0.0%) |
| 35 to 44 Years | 472 (78.9%) | 126 (21.1%) |
| 45 to 54 Years | 217 (67.8%) | 103 (32.2%) |
| 55 to 64 Years | 233 (62.0%) | 143 (38.0%) |
| 65 to 74 Years | 175 (100.0%) | 0 (0.0%) |
| 75 Years and older | 114 (100.0%) | 0 (0.0%) |
| Total | 1,986 (76.7%) | 603 (23.3%) |
Health Insurance Coverage by Citizenship Status in Kings Beach
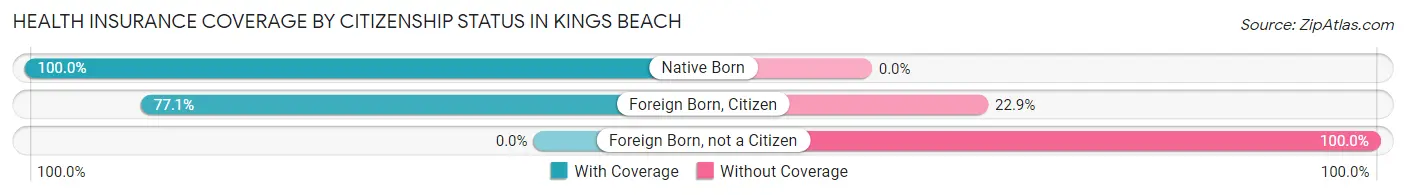
| Citizenship Status | With Coverage | Without Coverage |
| Native Born | 75 (100.0%) | 0 (0.0%) |
| Foreign Born, Citizen | 378 (77.1%) | 112 (22.9%) |
| Foreign Born, not a Citizen | 0 (0.0%) | 119 (100.0%) |
Health Insurance Coverage by Household Income in Kings Beach
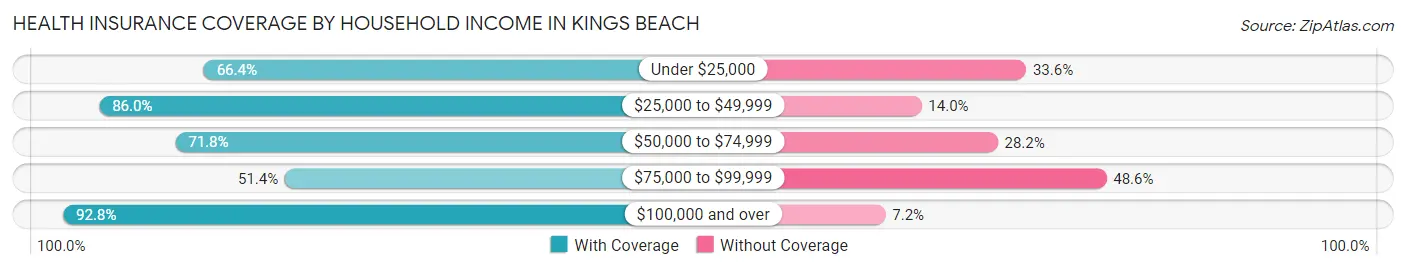
| Household Income | With Coverage | Without Coverage |
| Under $25,000 | 275 (66.4%) | 139 (33.6%) |
| $25,000 to $49,999 | 523 (86.0%) | 85 (14.0%) |
| $50,000 to $74,999 | 399 (71.8%) | 157 (28.2%) |
| $75,000 to $99,999 | 185 (51.4%) | 175 (48.6%) |
| $100,000 and over | 604 (92.8%) | 47 (7.2%) |
Public vs Private Health Insurance Coverage by Age in Kings Beach
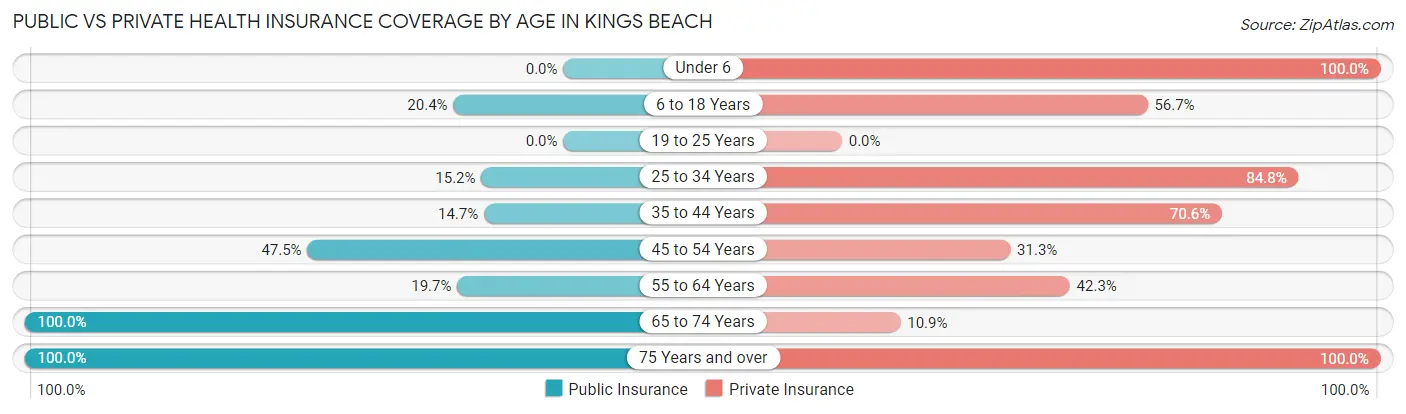
| Age Bracket | Public Insurance | Private Insurance |
| Under 6 | 0 (0.0%) | 75 (100.0%) |
| 6 to 18 Years | 100 (20.4%) | 278 (56.7%) |
| 19 to 25 Years | 0 (0.0%) | 0 (0.0%) |
| 25 to 34 Years | 49 (15.2%) | 273 (84.8%) |
| 35 to 44 Years | 88 (14.7%) | 422 (70.6%) |
| 45 to 54 Years | 152 (47.5%) | 100 (31.2%) |
| 55 to 64 Years | 74 (19.7%) | 159 (42.3%) |
| 65 to 74 Years | 175 (100.0%) | 19 (10.9%) |
| 75 Years and over | 114 (100.0%) | 114 (100.0%) |
| Total | 752 (29.0%) | 1,440 (55.6%) |
Disability Status by Sex by Age in Kings Beach
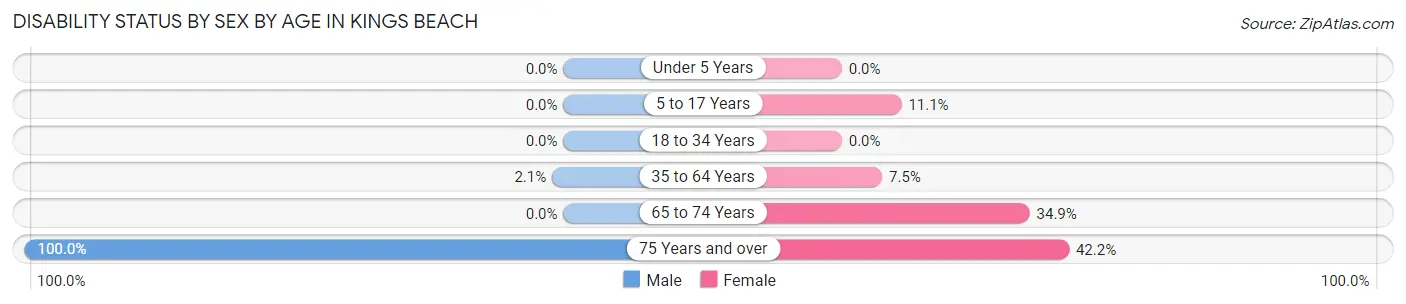
| Age Bracket | Male | Female |
| Under 5 Years | 0 (0.0%) | 0 (0.0%) |
| 5 to 17 Years | 0 (0.0%) | 28 (11.1%) |
| 18 to 34 Years | 0 (0.0%) | 0 (0.0%) |
| 35 to 64 Years | 14 (2.1%) | 47 (7.5%) |
| 65 to 74 Years | 0 (0.0%) | 38 (34.9%) |
| 75 Years and over | 31 (100.0%) | 35 (42.2%) |
Disability Class by Sex by Age in Kings Beach
Disability Class: Hearing Difficulty
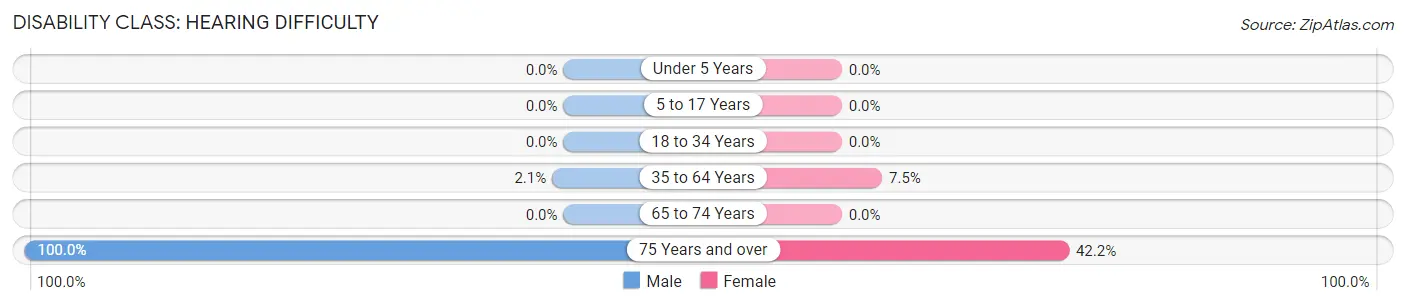
| Age Bracket | Male | Female |
| Under 5 Years | 0 (0.0%) | 0 (0.0%) |
| 5 to 17 Years | 0 (0.0%) | 0 (0.0%) |
| 18 to 34 Years | 0 (0.0%) | 0 (0.0%) |
| 35 to 64 Years | 14 (2.1%) | 47 (7.5%) |
| 65 to 74 Years | 0 (0.0%) | 0 (0.0%) |
| 75 Years and over | 31 (100.0%) | 35 (42.2%) |
Disability Class: Vision Difficulty
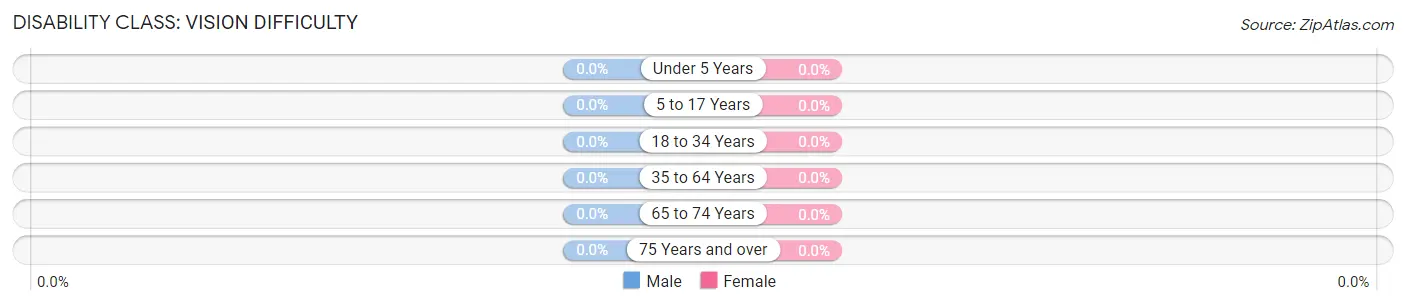
| Age Bracket | Male | Female |
| Under 5 Years | 0 (0.0%) | 0 (0.0%) |
| 5 to 17 Years | 0 (0.0%) | 0 (0.0%) |
| 18 to 34 Years | 0 (0.0%) | 0 (0.0%) |
| 35 to 64 Years | 0 (0.0%) | 0 (0.0%) |
| 65 to 74 Years | 0 (0.0%) | 0 (0.0%) |
| 75 Years and over | 0 (0.0%) | 0 (0.0%) |
Disability Class: Cognitive Difficulty
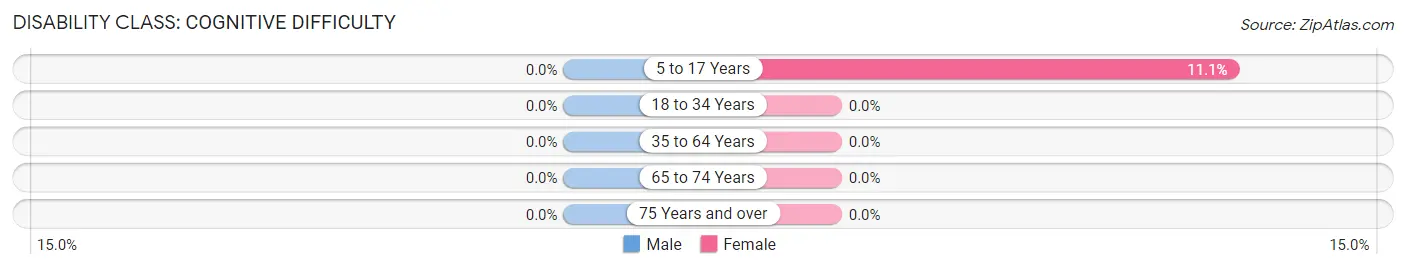
| Age Bracket | Male | Female |
| 5 to 17 Years | 0 (0.0%) | 28 (11.1%) |
| 18 to 34 Years | 0 (0.0%) | 0 (0.0%) |
| 35 to 64 Years | 0 (0.0%) | 0 (0.0%) |
| 65 to 74 Years | 0 (0.0%) | 0 (0.0%) |
| 75 Years and over | 0 (0.0%) | 0 (0.0%) |
Disability Class: Ambulatory Difficulty
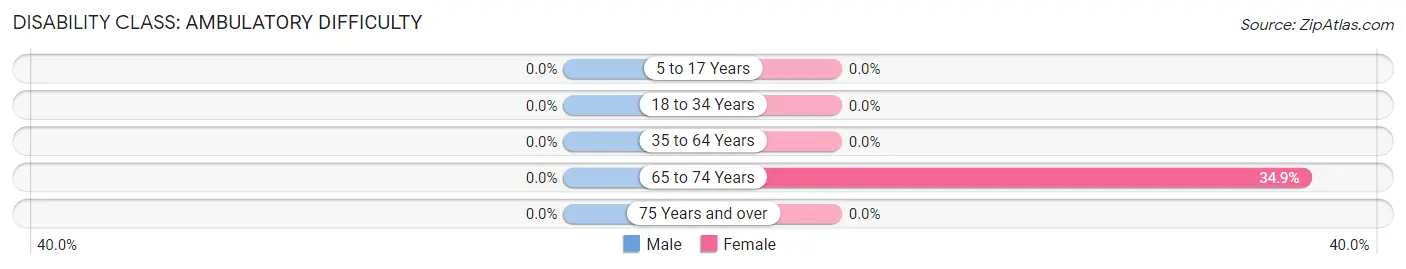
| Age Bracket | Male | Female |
| 5 to 17 Years | 0 (0.0%) | 0 (0.0%) |
| 18 to 34 Years | 0 (0.0%) | 0 (0.0%) |
| 35 to 64 Years | 0 (0.0%) | 0 (0.0%) |
| 65 to 74 Years | 0 (0.0%) | 38 (34.9%) |
| 75 Years and over | 0 (0.0%) | 0 (0.0%) |
Disability Class: Self-Care Difficulty
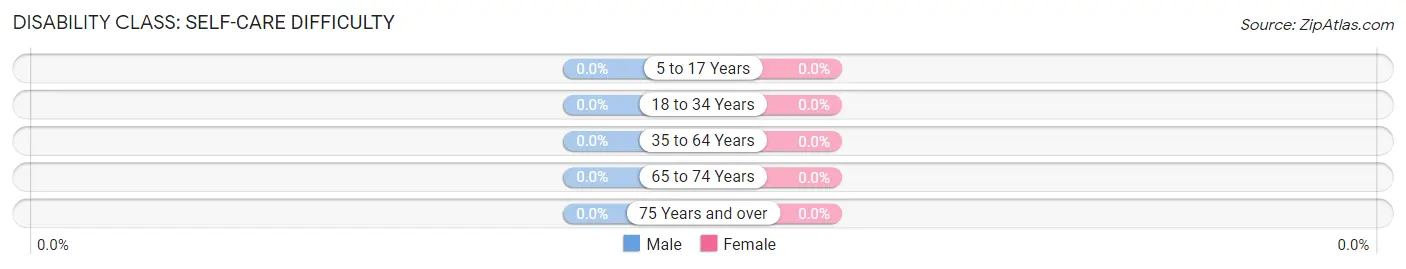
| Age Bracket | Male | Female |
| 5 to 17 Years | 0 (0.0%) | 0 (0.0%) |
| 18 to 34 Years | 0 (0.0%) | 0 (0.0%) |
| 35 to 64 Years | 0 (0.0%) | 0 (0.0%) |
| 65 to 74 Years | 0 (0.0%) | 0 (0.0%) |
| 75 Years and over | 0 (0.0%) | 0 (0.0%) |
Technology Access in Kings Beach
Computing Device Access in Kings Beach
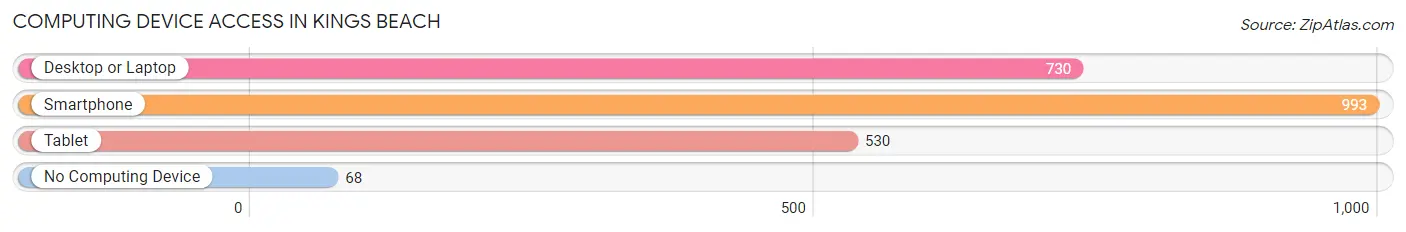
| Device Type | # Households | % Households |
| Desktop or Laptop | 730 | 67.9% |
| Smartphone | 993 | 92.4% |
| Tablet | 530 | 49.3% |
| No Computing Device | 68 | 6.3% |
| Total | 1,075 | 100.0% |
Internet Access in Kings Beach
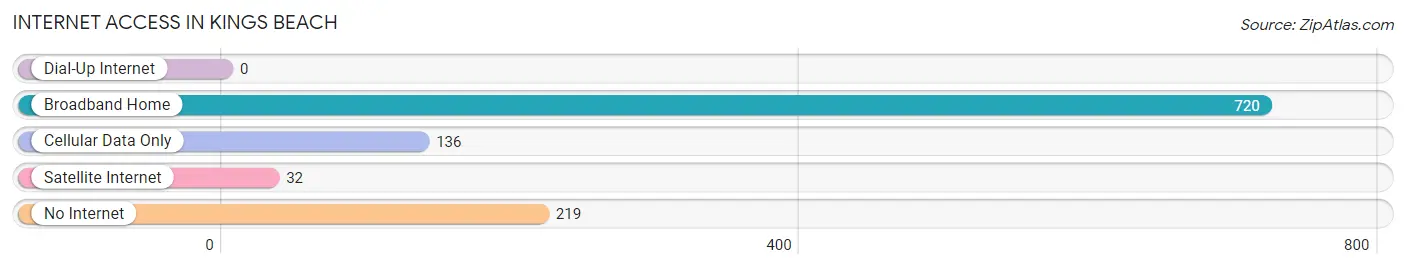
| Internet Type | # Households | % Households |
| Dial-Up Internet | 0 | 0.0% |
| Broadband Home | 720 | 67.0% |
| Cellular Data Only | 136 | 12.7% |
| Satellite Internet | 32 | 3.0% |
| No Internet | 219 | 20.4% |
| Total | 1,075 | 100.0% |
Kings Beach Summary
History
Kings Beach is a small unincorporated community located in Placer County, California, United States. It is situated on the north shore of Lake Tahoe, and is part of the North Lake Tahoe region. The community was named after Charles King, a local miner who settled in the area in the 1860s.
The area was first inhabited by the Washoe people, who lived in the area for thousands of years before the arrival of European settlers. The Washoe people were hunter-gatherers who lived off the land, and were known for their basket weaving and fishing skills.
In the 1860s, the area was settled by miners who were drawn to the area by the discovery of gold. The miners built cabins and established small settlements, and the area became known as Kings Beach.
In the early 1900s, the area began to attract tourists who were drawn to the area by its natural beauty. The area became a popular destination for fishing, camping, and other outdoor activities.
In the 1950s, the area began to develop as a resort destination. The first hotel was built in 1952, and the area began to attract more visitors. In the 1960s, the area was developed further with the construction of a marina, a golf course, and other amenities.
Today, Kings Beach is a popular destination for tourists and locals alike. The area is known for its beautiful scenery, outdoor activities, and its laid-back atmosphere.
Geography
Kings Beach is located on the north shore of Lake Tahoe, in Placer County, California. The community is situated at an elevation of 6,200 feet, and is surrounded by the Sierra Nevada mountain range.
The area is known for its stunning natural beauty, with its crystal clear waters, snow-capped mountains, and lush forests. The area is also home to a variety of wildlife, including black bears, deer, and bald eagles.
The climate in Kings Beach is mild, with warm summers and cold winters. The average temperature in the summer is around 70 degrees Fahrenheit, and the average temperature in the winter is around 30 degrees Fahrenheit.
Economy
The economy of Kings Beach is largely driven by tourism. The area is a popular destination for outdoor activities, such as skiing, snowboarding, fishing, and camping. The area is also home to a variety of restaurants, bars, and shops.
The area is also home to a number of businesses, including construction companies, real estate agencies, and other service-based businesses.
Demographics
As of the 2010 census, the population of Kings Beach was 2,845. The population is largely white (90.2%), with a small percentage of Hispanic or Latino (4.2%) and Asian (2.2%) residents. The median household income is $50,977, and the median age is 44.
Conclusion
Kings Beach is a small unincorporated community located in Placer County, California, United States. It is situated on the north shore of Lake Tahoe, and is part of the North Lake Tahoe region. The area is known for its stunning natural beauty, and is a popular destination for outdoor activities, such as skiing, snowboarding, fishing, and camping. The economy of Kings Beach is largely driven by tourism, and the area is home to a variety of businesses, including construction companies, real estate agencies, and other service-based businesses. As of the 2010 census, the population of Kings Beach was 2,845, and the median household income is $50,977.
Common Questions
What is the Total Population of Kings Beach?
Total Population of Kings Beach is 2,589.
What is the Total Male Population of Kings Beach?
Total Male Population of Kings Beach is 1,326.
What is the Total Female Population of Kings Beach?
Total Female Population of Kings Beach is 1,263.
What is the Ratio of Males per 100 Females in Kings Beach?
There are 104.99 Males per 100 Females in Kings Beach.
What is the Ratio of Females per 100 Males in Kings Beach?
There are 95.25 Females per 100 Males in Kings Beach.
What is the Median Population Age in Kings Beach?
Median Population Age in Kings Beach is 40.5 Years.
What is the Average Family Size in Kings Beach
Average Family Size in Kings Beach is 2.8 People.
What is the Average Household Size in Kings Beach
Average Household Size in Kings Beach is 2.4 People.
What is Per Capita Income in Kings Beach?
Per Capita income in Kings Beach is $29,941.
What is the Median Family Income in Kings Beach?
Median Family Income in Kings Beach is $51,723.
What is the Median Household income in Kings Beach?
Median Household Income in Kings Beach is $50,220.
What is Income or Wage Gap in Kings Beach?
Income or Wage Gap in Kings Beach is 28.9%.
Women in Kings Beach earn 71.1 cents for every dollar earned by a man.
What is Inequality or Gini Index in Kings Beach?
Inequality or Gini Index in Kings Beach is 0.45.
How Large is the Labor Force in Kings Beach?
There are 1,594 People in the Labor Forcein in Kings Beach.
What is the Percentage of People in the Labor Force in Kings Beach?
76.5% of People are in the Labor Force in Kings Beach.