Kennedy, CA
Kennedy Map
Kennedy Overview
2,516
TOTAL POPULATION
1,346
MALE POPULATION
1,170
FEMALE POPULATION
115.04
MALES / 100 FEMALES
86.92
FEMALES / 100 MALES
28.6
MEDIAN AGE
3.9
AVG FAMILY SIZE
3.4
AVG HOUSEHOLD SIZE
$19,081
PER CAPITA INCOME
$54,583
AVG FAMILY INCOME
$55,337
AVG HOUSEHOLD INCOME
38.7%
WAGE / INCOME GAP [ % ]
61.3¢/ $1
WAGE / INCOME GAP [ $ ]
0.36
INEQUALITY / GINI INDEX
1,038
LABOR FORCE [ PEOPLE ]
58.6%
PERCENT IN LABOR FORCE
8.7%
UNEMPLOYMENT RATE
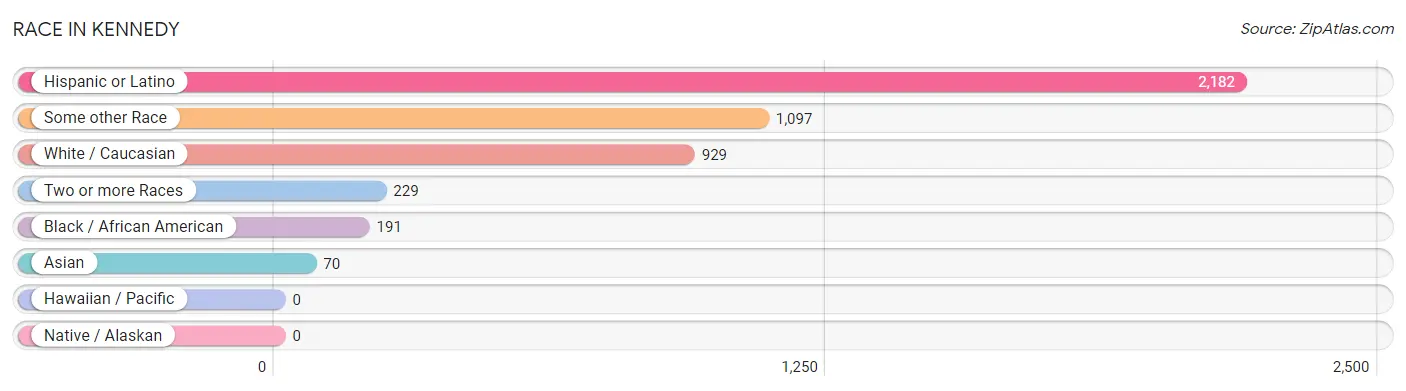
Race in Kennedy
The most populous races in Kennedy are Hispanic or Latino (2,182 | 86.7%), Some other Race (1,097 | 43.6%), and White / Caucasian (929 | 36.9%).
| Race | # Population | % Population |
| Asian | 70 | 2.8% |
| Black / African American | 191 | 7.6% |
| Hawaiian / Pacific | 0 | 0.0% |
| Hispanic or Latino | 2,182 | 86.7% |
| Native / Alaskan | 0 | 0.0% |
| White / Caucasian | 929 | 36.9% |
| Two or more Races | 229 | 9.1% |
| Some other Race | 1,097 | 43.6% |
| Total | 2,516 | 100.0% |
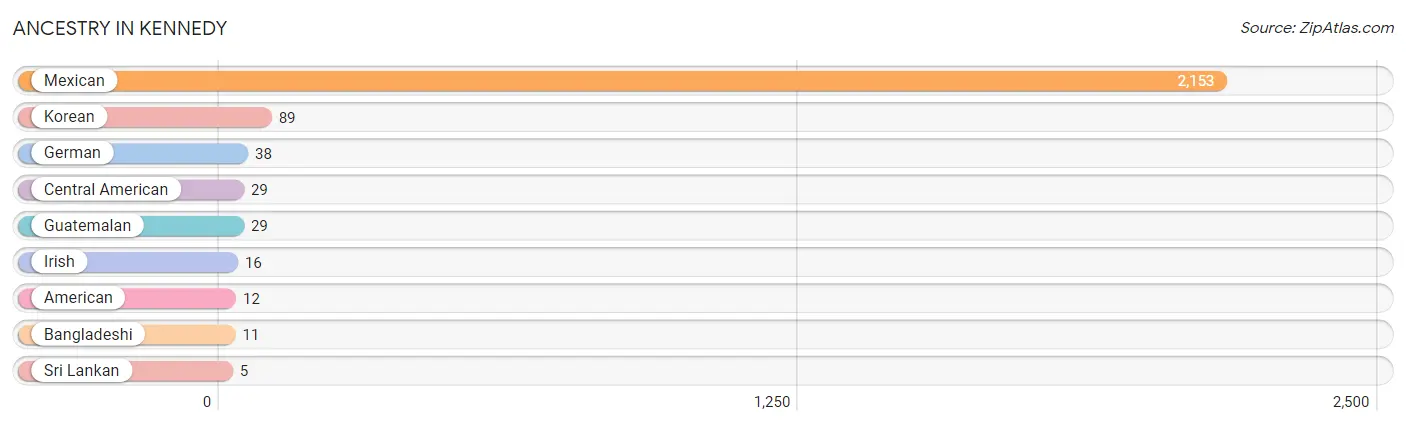
Ancestry in Kennedy
The most populous ancestries reported in Kennedy are Mexican (2,153 | 85.6%), Korean (89 | 3.5%), German (38 | 1.5%), Central American (29 | 1.1%), and Guatemalan (29 | 1.1%), together accounting for 92.9% of all Kennedy residents.
| Ancestry | # Population | % Population |
| American | 12 | 0.5% |
| Bangladeshi | 11 | 0.4% |
| Central American | 29 | 1.1% |
| German | 38 | 1.5% |
| Guatemalan | 29 | 1.1% |
| Irish | 16 | 0.6% |
| Korean | 89 | 3.5% |
| Mexican | 2,153 | 85.6% |
| Sri Lankan | 5 | 0.2% | View All 9 Rows |
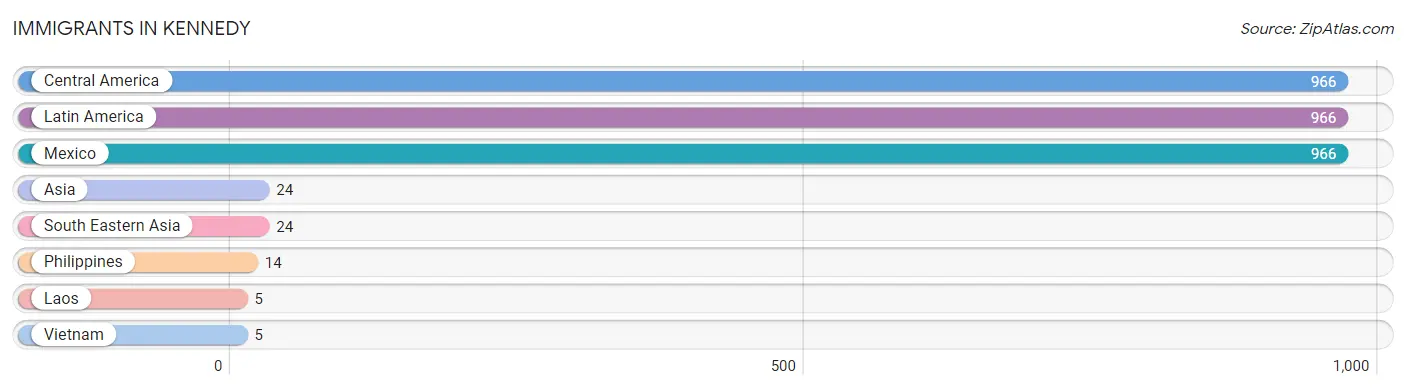
Immigrants in Kennedy
The most numerous immigrant groups reported in Kennedy came from Central America (966 | 38.4%), Latin America (966 | 38.4%), Mexico (966 | 38.4%), Asia (24 | 0.9%), and South Eastern Asia (24 | 0.9%), together accounting for 117.1% of all Kennedy residents.
| Immigration Origin | # Population | % Population |
| Asia | 24 | 0.9% |
| Central America | 966 | 38.4% |
| Laos | 5 | 0.2% |
| Latin America | 966 | 38.4% |
| Mexico | 966 | 38.4% |
| Philippines | 14 | 0.6% |
| South Eastern Asia | 24 | 0.9% |
| Vietnam | 5 | 0.2% | View All 8 Rows |
Sex and Age in Kennedy
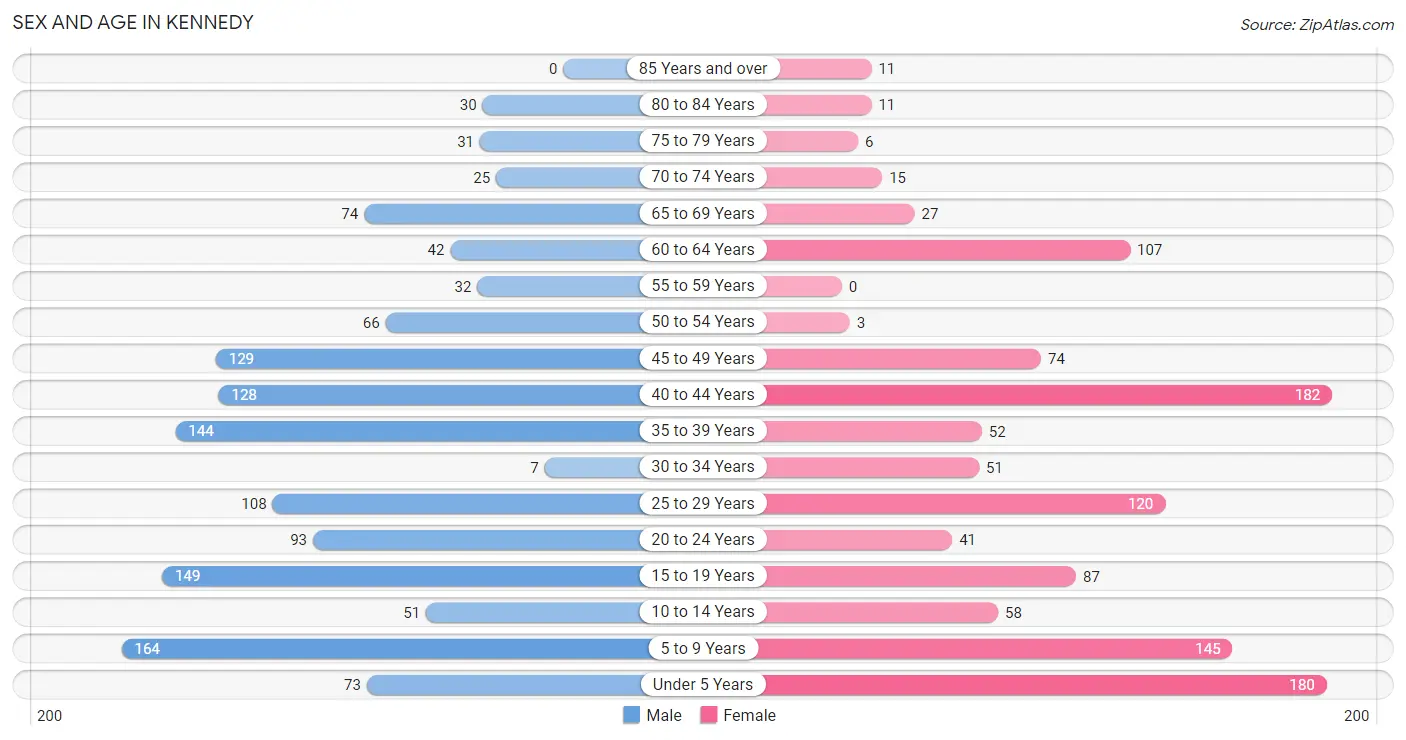
Sex and Age in Kennedy
The most populous age groups in Kennedy are 5 to 9 Years (164 | 12.2%) for men and 40 to 44 Years (182 | 15.6%) for women.
| Age Bracket | Male | Female |
| Under 5 Years | 73 (5.4%) | 180 (15.4%) |
| 5 to 9 Years | 164 (12.2%) | 145 (12.4%) |
| 10 to 14 Years | 51 (3.8%) | 58 (5.0%) |
| 15 to 19 Years | 149 (11.1%) | 87 (7.4%) |
| 20 to 24 Years | 93 (6.9%) | 41 (3.5%) |
| 25 to 29 Years | 108 (8.0%) | 120 (10.3%) |
| 30 to 34 Years | 7 (0.5%) | 51 (4.4%) |
| 35 to 39 Years | 144 (10.7%) | 52 (4.4%) |
| 40 to 44 Years | 128 (9.5%) | 182 (15.6%) |
| 45 to 49 Years | 129 (9.6%) | 74 (6.3%) |
| 50 to 54 Years | 66 (4.9%) | 3 (0.3%) |
| 55 to 59 Years | 32 (2.4%) | 0 (0.0%) |
| 60 to 64 Years | 42 (3.1%) | 107 (9.1%) |
| 65 to 69 Years | 74 (5.5%) | 27 (2.3%) |
| 70 to 74 Years | 25 (1.9%) | 15 (1.3%) |
| 75 to 79 Years | 31 (2.3%) | 6 (0.5%) |
| 80 to 84 Years | 30 (2.2%) | 11 (0.9%) |
| 85 Years and over | 0 (0.0%) | 11 (0.9%) |
| Total | 1,346 (100.0%) | 1,170 (100.0%) |
Families and Households in Kennedy
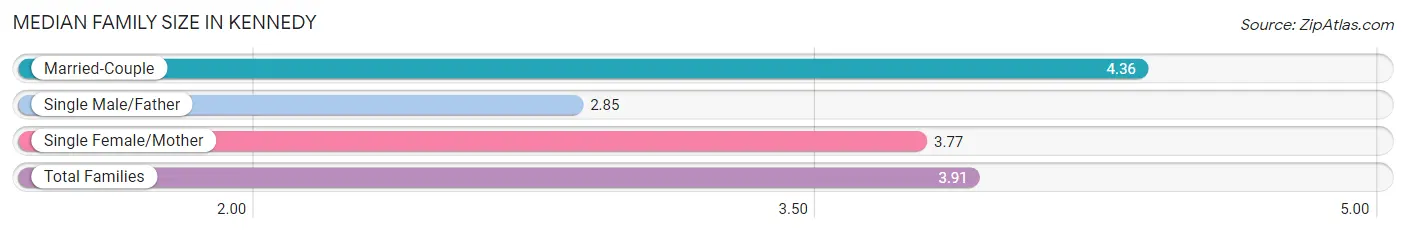
Median Family Size in Kennedy
The median family size in Kennedy is 3.91 persons per family, with married-couple families (351 | 60.3%) accounting for the largest median family size of 4.36 persons per family. On the other hand, single male/father families (136 | 23.4%) represent the smallest median family size with 2.85 persons per family.
| Family Type | # Families | Family Size |
| Married-Couple | 351 (60.3%) | 4.36 |
| Single Male/Father | 136 (23.4%) | 2.85 |
| Single Female/Mother | 95 (16.3%) | 3.77 |
| Total Families | 582 (100.0%) | 3.91 |
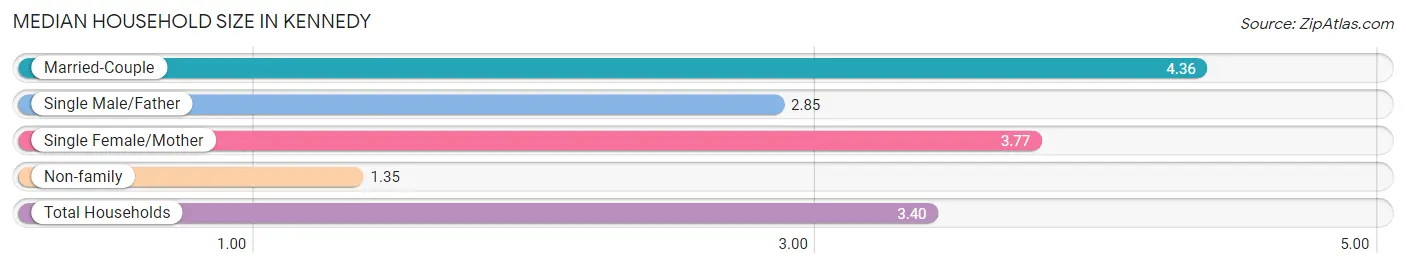
Median Household Size in Kennedy
The median household size in Kennedy is 3.40 persons per household, with married-couple households (351 | 48.3%) accounting for the largest median household size of 4.36 persons per household. non-family households (144 | 19.8%) represent the smallest median household size with 1.35 persons per household.
| Household Type | # Households | Household Size |
| Married-Couple | 351 (48.3%) | 4.36 |
| Single Male/Father | 136 (18.7%) | 2.85 |
| Single Female/Mother | 95 (13.1%) | 3.77 |
| Non-family | 144 (19.8%) | 1.35 |
| Total Households | 726 (100.0%) | 3.40 |
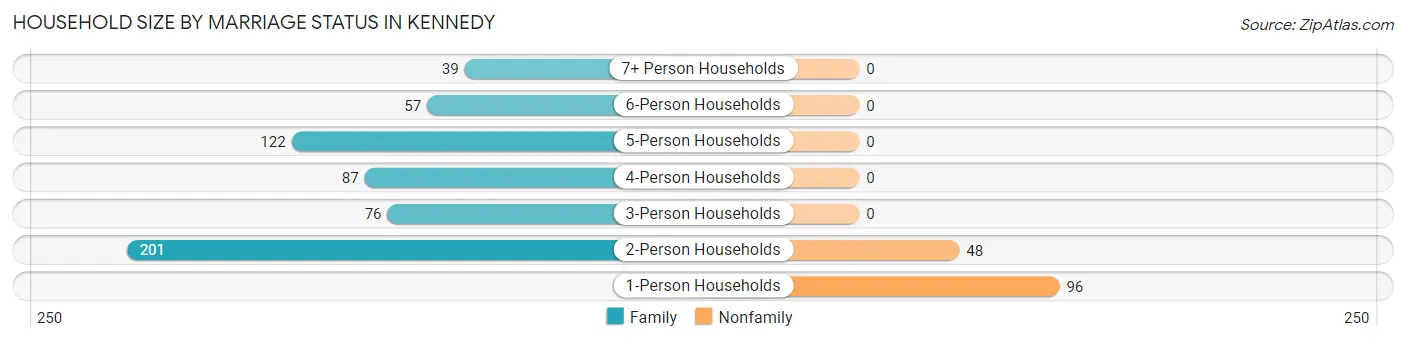
Household Size by Marriage Status in Kennedy
Out of a total of 726 households in Kennedy, 582 (80.2%) are family households, while 144 (19.8%) are nonfamily households. The most numerous type of family households are 2-person households, comprising 201, and the most common type of nonfamily households are 1-person households, comprising 96.
| Household Size | Family Households | Nonfamily Households |
| 1-Person Households | - | 96 (13.2%) |
| 2-Person Households | 201 (27.7%) | 48 (6.6%) |
| 3-Person Households | 76 (10.5%) | 0 (0.0%) |
| 4-Person Households | 87 (12.0%) | 0 (0.0%) |
| 5-Person Households | 122 (16.8%) | 0 (0.0%) |
| 6-Person Households | 57 (7.9%) | 0 (0.0%) |
| 7+ Person Households | 39 (5.4%) | 0 (0.0%) |
| Total | 582 (80.2%) | 144 (19.8%) |
Female Fertility in Kennedy
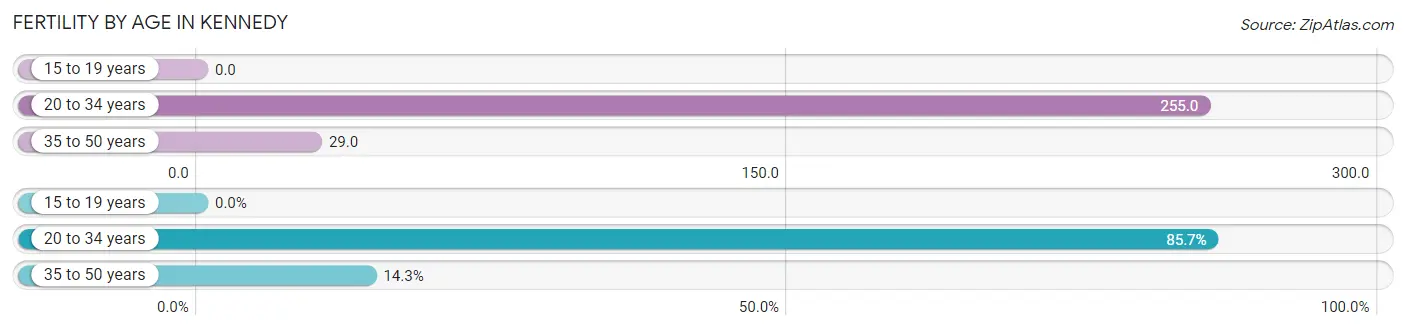
Fertility by Age in Kennedy
Average fertility rate in Kennedy is 104.0 births per 1,000 women. Women in the age bracket of 20 to 34 years have the highest fertility rate with 255.0 births per 1,000 women. Women in the age bracket of 20 to 34 years acount for 85.7% of all women with births.
| Age Bracket | Women with Births | Births / 1,000 Women |
| 15 to 19 years | 0 (0.0%) | 0.0 |
| 20 to 34 years | 54 (85.7%) | 255.0 |
| 35 to 50 years | 9 (14.3%) | 29.0 |
| Total | 63 (100.0%) | 104.0 |
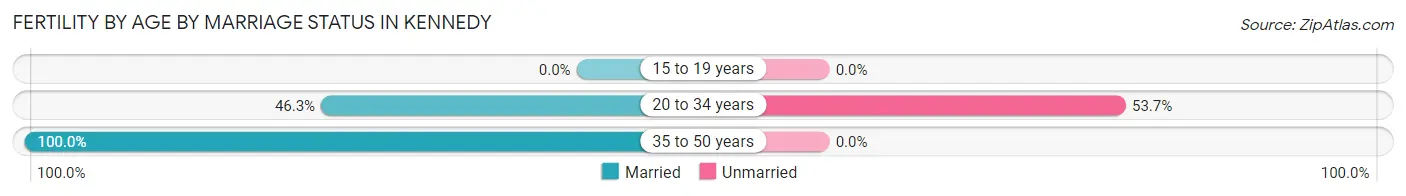
Fertility by Age by Marriage Status in Kennedy
54.0% of women with births (63) in Kennedy are married. The highest percentage of unmarried women with births falls into 20 to 34 years age bracket with 53.7% of them unmarried at the time of birth, while the lowest percentage of unmarried women with births belong to 35 to 50 years age bracket with 0.0% of them unmarried.
| Age Bracket | Married | Unmarried |
| 15 to 19 years | 0 (0.0%) | 0 (0.0%) |
| 20 to 34 years | 25 (46.3%) | 29 (53.7%) |
| 35 to 50 years | 9 (100.0%) | 0 (0.0%) |
| Total | 34 (54.0%) | 29 (46.0%) |
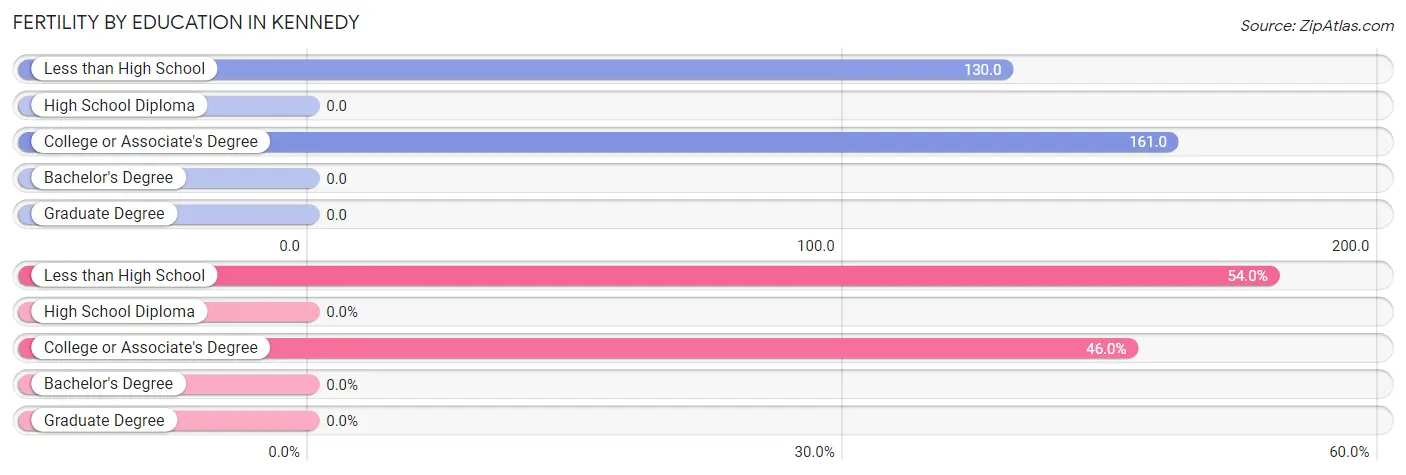
Fertility by Education in Kennedy
| Educational Attainment | Women with Births | Births / 1,000 Women |
| Less than High School | 34 (54.0%) | 130.0 |
| High School Diploma | 0 (0.0%) | 0.0 |
| College or Associate's Degree | 29 (46.0%) | 161.0 |
| Bachelor's Degree | 0 (0.0%) | 0.0 |
| Graduate Degree | 0 (0.0%) | 0.0 |
| Total | 63 (100.0%) | 104.0 |
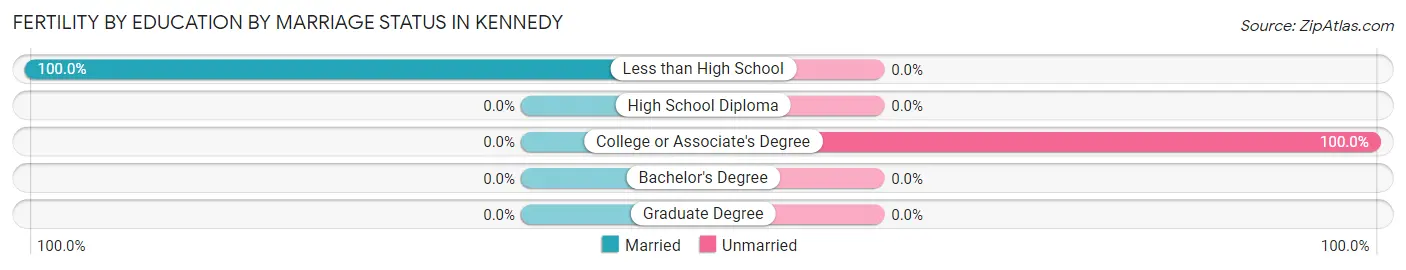
Fertility by Education by Marriage Status in Kennedy
46.0% of women with births in Kennedy are unmarried. Women with the educational attainment of less than high school are most likely to be married with 100.0% of them married at childbirth, while women with the educational attainment of college or associate's degree are least likely to be married with 100.0% of them unmarried at childbirth.
| Educational Attainment | Married | Unmarried |
| Less than High School | 34 (100.0%) | 0 (0.0%) |
| High School Diploma | 0 (0.0%) | 0 (0.0%) |
| College or Associate's Degree | 0 (0.0%) | 29 (100.0%) |
| Bachelor's Degree | 0 (0.0%) | 0 (0.0%) |
| Graduate Degree | 0 (0.0%) | 0 (0.0%) |
| Total | 34 (54.0%) | 29 (46.0%) |
Income in Kennedy
Income Overview in Kennedy
Per Capita Income in Kennedy is $19,081, while median incomes of families and households are $54,583 and $55,337 respectively.
| Characteristic | Number | Measure |
| Per Capita Income | 2,516 | $19,081 |
| Median Family Income | 582 | $54,583 |
| Mean Family Income | 582 | $59,980 |
| Median Household Income | 726 | $55,337 |
| Mean Household Income | 726 | $63,984 |
| Income Deficit | 582 | $0 |
| Wage / Income Gap (%) | 2,516 | 38.72% |
| Wage / Income Gap ($) | 2,516 | 61.28¢ per $1 |
| Gini / Inequality Index | 2,516 | 0.36 |
Earnings by Sex in Kennedy
Average Earnings in Kennedy are $32,380, $34,167 for men and $20,938 for women, a difference of 38.7%.
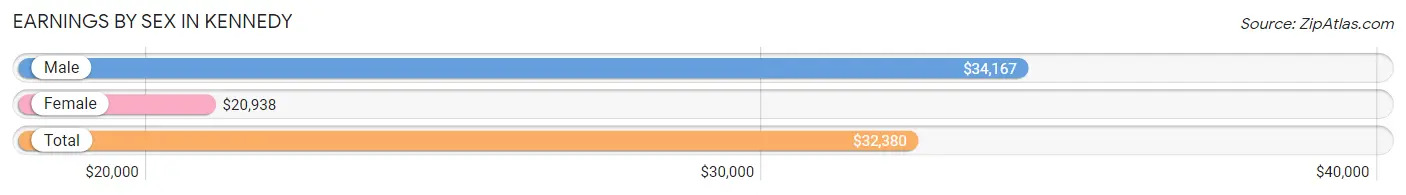
| Sex | Number | Average Earnings |
| Male | 744 (70.3%) | $34,167 |
| Female | 315 (29.7%) | $20,938 |
| Total | 1,059 (100.0%) | $32,380 |
Earnings by Sex by Income Bracket in Kennedy
The most common earnings brackets in Kennedy are $30,000 to $34,999 for men (112 | 15.0%) and $12,500 to $14,999 for women (67 | 21.3%).
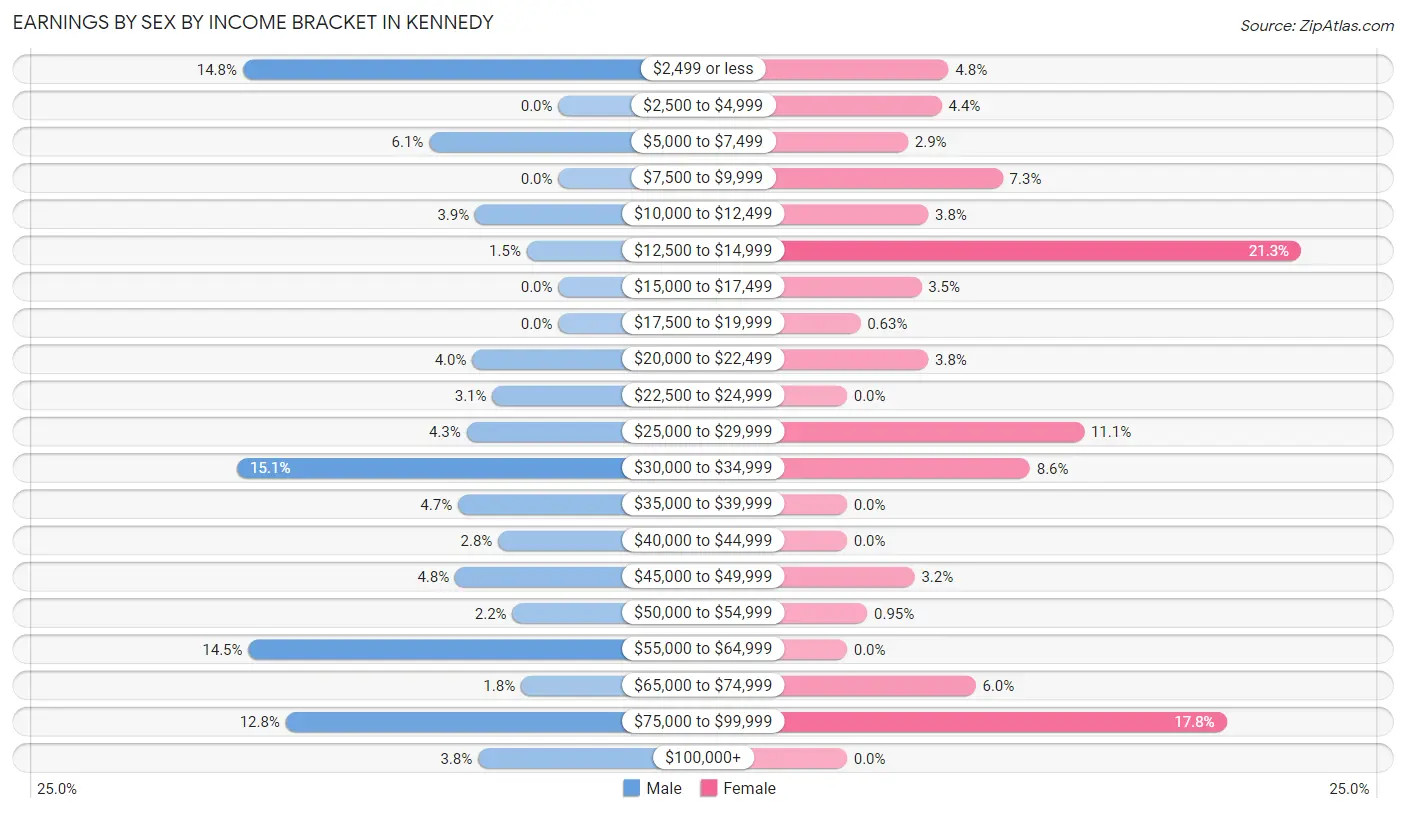
| Income | Male | Female |
| $2,499 or less | 110 (14.8%) | 15 (4.8%) |
| $2,500 to $4,999 | 0 (0.0%) | 14 (4.4%) |
| $5,000 to $7,499 | 45 (6.0%) | 9 (2.9%) |
| $7,500 to $9,999 | 0 (0.0%) | 23 (7.3%) |
| $10,000 to $12,499 | 29 (3.9%) | 12 (3.8%) |
| $12,500 to $14,999 | 11 (1.5%) | 67 (21.3%) |
| $15,000 to $17,499 | 0 (0.0%) | 11 (3.5%) |
| $17,500 to $19,999 | 0 (0.0%) | 2 (0.6%) |
| $20,000 to $22,499 | 30 (4.0%) | 12 (3.8%) |
| $22,500 to $24,999 | 23 (3.1%) | 0 (0.0%) |
| $25,000 to $29,999 | 32 (4.3%) | 35 (11.1%) |
| $30,000 to $34,999 | 112 (15.0%) | 27 (8.6%) |
| $35,000 to $39,999 | 35 (4.7%) | 0 (0.0%) |
| $40,000 to $44,999 | 21 (2.8%) | 0 (0.0%) |
| $45,000 to $49,999 | 36 (4.8%) | 10 (3.2%) |
| $50,000 to $54,999 | 16 (2.1%) | 3 (0.9%) |
| $55,000 to $64,999 | 108 (14.5%) | 0 (0.0%) |
| $65,000 to $74,999 | 13 (1.8%) | 19 (6.0%) |
| $75,000 to $99,999 | 95 (12.8%) | 56 (17.8%) |
| $100,000+ | 28 (3.8%) | 0 (0.0%) |
| Total | 744 (100.0%) | 315 (100.0%) |
Earnings by Sex by Educational Attainment in Kennedy
Average earnings in Kennedy are $47,240 for men and $28,750 for women, a difference of 39.1%. Men with an educational attainment of bachelor's degree enjoy the highest average annual earnings of $103,036, while those with college or associate's degree education earn the least with $31,196. Women with an educational attainment of high school diploma earn the most with the average annual earnings of $22,188, while those with high school diploma education have the smallest earnings of $22,188.
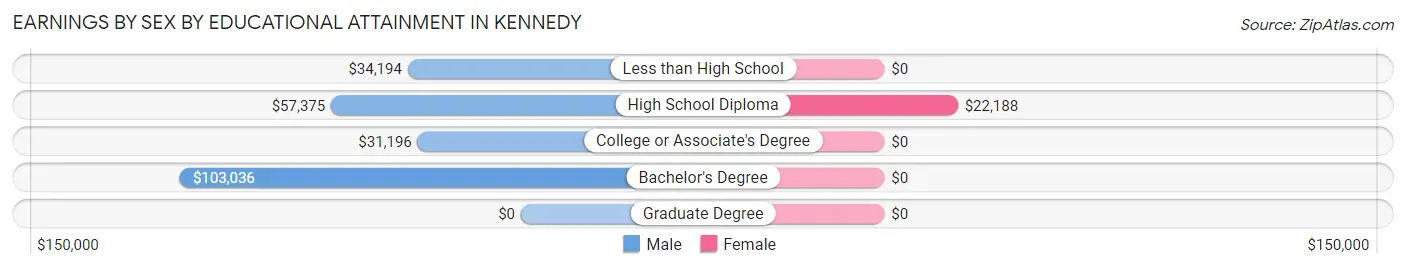
| Educational Attainment | Male Income | Female Income |
| Less than High School | $34,194 | $0 |
| High School Diploma | $57,375 | $22,188 |
| College or Associate's Degree | $31,196 | $0 |
| Bachelor's Degree | $103,036 | $0 |
| Graduate Degree | - | - |
| Total | $47,240 | $28,750 |
Family Income in Kennedy
Family Income Brackets in Kennedy
According to the Kennedy family income data, there are 149 families falling into the $50,000 to $74,999 income range, which is the most common income bracket and makes up 25.6% of all families.
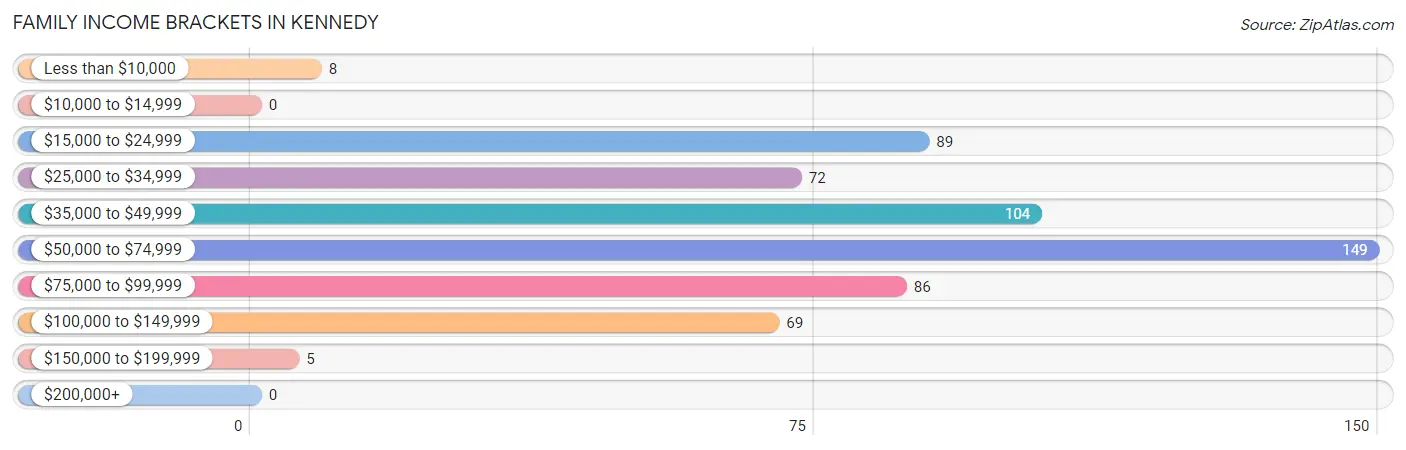
| Income Bracket | # Families | % Families |
| Less than $10,000 | 8 | 1.4% |
| $10,000 to $14,999 | 0 | 0.0% |
| $15,000 to $24,999 | 89 | 15.3% |
| $25,000 to $34,999 | 72 | 12.4% |
| $35,000 to $49,999 | 104 | 17.9% |
| $50,000 to $74,999 | 149 | 25.6% |
| $75,000 to $99,999 | 86 | 14.8% |
| $100,000 to $149,999 | 69 | 11.9% |
| $150,000 to $199,999 | 5 | 0.9% |
| $200,000+ | 0 | 0.0% |
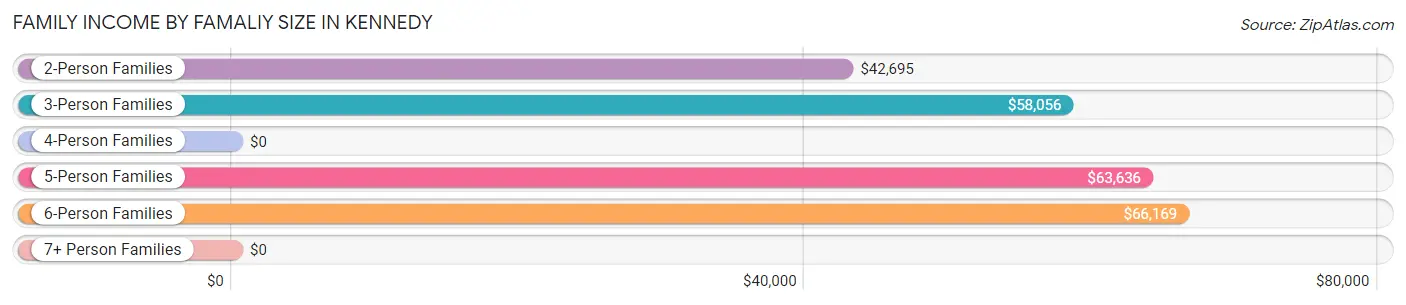
Family Income by Famaliy Size in Kennedy
6-person families (57 | 9.8%) account for the highest median family income in Kennedy with $66,169 per family, while 2-person families (201 | 34.5%) have the highest median income of $21,348 per family member.
| Income Bracket | # Families | Median Income |
| 2-Person Families | 201 (34.5%) | $42,695 |
| 3-Person Families | 76 (13.1%) | $58,056 |
| 4-Person Families | 87 (14.9%) | $0 |
| 5-Person Families | 122 (21.0%) | $63,636 |
| 6-Person Families | 57 (9.8%) | $66,169 |
| 7+ Person Families | 39 (6.7%) | $0 |
| Total | 582 (100.0%) | $54,583 |
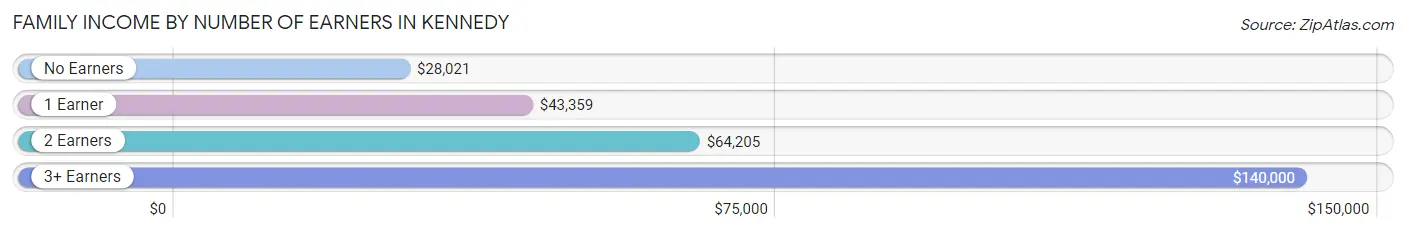
Family Income by Number of Earners in Kennedy
The median family income in Kennedy is $54,583, with families comprising 3+ earners (84) having the highest median family income of $140,000, while families with no earners (75) have the lowest median family income of $28,021, accounting for 14.4% and 12.9% of families, respectively.
| Number of Earners | # Families | Median Income |
| No Earners | 75 (12.9%) | $28,021 |
| 1 Earner | 248 (42.6%) | $43,359 |
| 2 Earners | 175 (30.1%) | $64,205 |
| 3+ Earners | 84 (14.4%) | $140,000 |
| Total | 582 (100.0%) | $54,583 |
Household Income in Kennedy
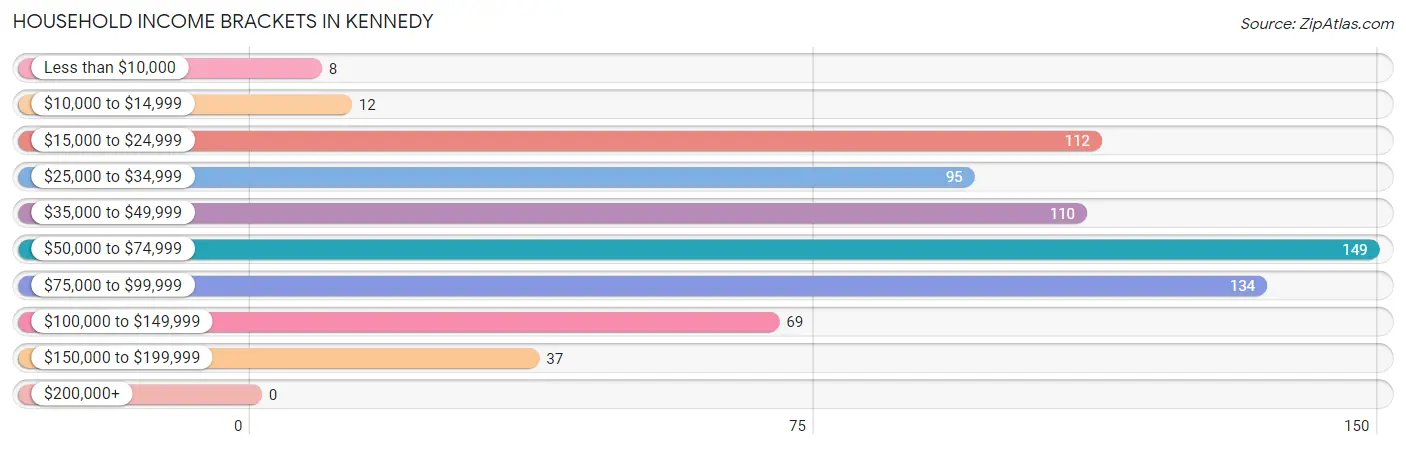
Household Income Brackets in Kennedy
With 149 households falling in the category, the $50,000 to $74,999 income range is the most frequent in Kennedy, accounting for 20.5% of all households.
| Income Bracket | # Households | % Households |
| Less than $10,000 | 8 | 1.1% |
| $10,000 to $14,999 | 12 | 1.7% |
| $15,000 to $24,999 | 112 | 15.4% |
| $25,000 to $34,999 | 95 | 13.1% |
| $35,000 to $49,999 | 110 | 15.2% |
| $50,000 to $74,999 | 149 | 20.5% |
| $75,000 to $99,999 | 134 | 18.5% |
| $100,000 to $149,999 | 69 | 9.5% |
| $150,000 to $199,999 | 37 | 5.1% |
| $200,000+ | 0 | 0.0% |
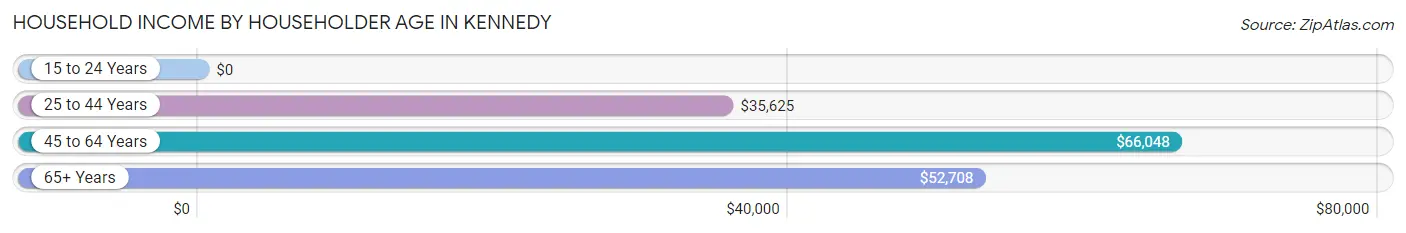
Household Income by Householder Age in Kennedy
The median household income in Kennedy is $55,337, with the highest median household income of $66,048 found in the 45 to 64 years age bracket for the primary householder. A total of 276 households (38.0%) fall into this category.
| Income Bracket | # Households | Median Income |
| 15 to 24 Years | 0 (0.0%) | $0 |
| 25 to 44 Years | 303 (41.7%) | $35,625 |
| 45 to 64 Years | 276 (38.0%) | $66,048 |
| 65+ Years | 147 (20.3%) | $52,708 |
| Total | 726 (100.0%) | $55,337 |
Poverty in Kennedy
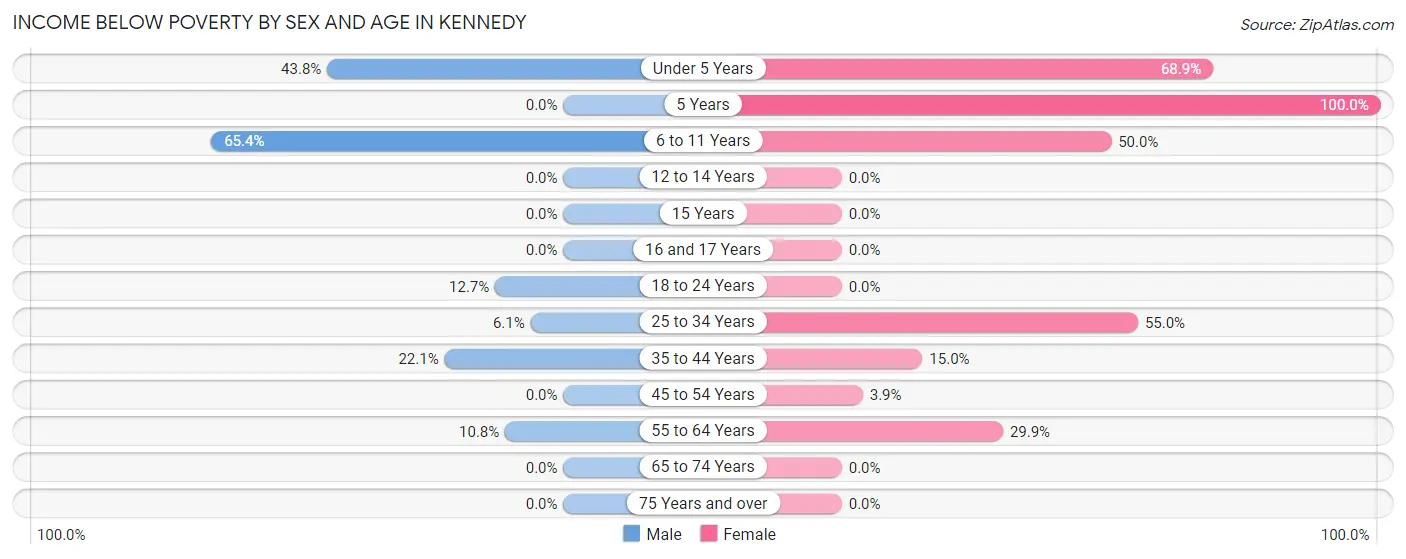
Income Below Poverty by Sex and Age in Kennedy
With 17.5% poverty level for males and 32.5% for females among the residents of Kennedy, 6 to 11 year old males and 5 year old females are the most vulnerable to poverty, with 100 males (65.4%) and 13 females (100.0%) in their respective age groups living below the poverty level.
| Age Bracket | Male | Female |
| Under 5 Years | 32 (43.8%) | 124 (68.9%) |
| 5 Years | 0 (0.0%) | 13 (100.0%) |
| 6 to 11 Years | 100 (65.4%) | 79 (50.0%) |
| 12 to 14 Years | 0 (0.0%) | 0 (0.0%) |
| 15 Years | 0 (0.0%) | 0 (0.0%) |
| 16 and 17 Years | 0 (0.0%) | 0 (0.0%) |
| 18 to 24 Years | 28 (12.7%) | 0 (0.0%) |
| 25 to 34 Years | 7 (6.1%) | 94 (55.0%) |
| 35 to 44 Years | 60 (22.1%) | 35 (15.0%) |
| 45 to 54 Years | 0 (0.0%) | 3 (3.9%) |
| 55 to 64 Years | 8 (10.8%) | 32 (29.9%) |
| 65 to 74 Years | 0 (0.0%) | 0 (0.0%) |
| 75 Years and over | 0 (0.0%) | 0 (0.0%) |
| Total | 235 (17.5%) | 380 (32.5%) |
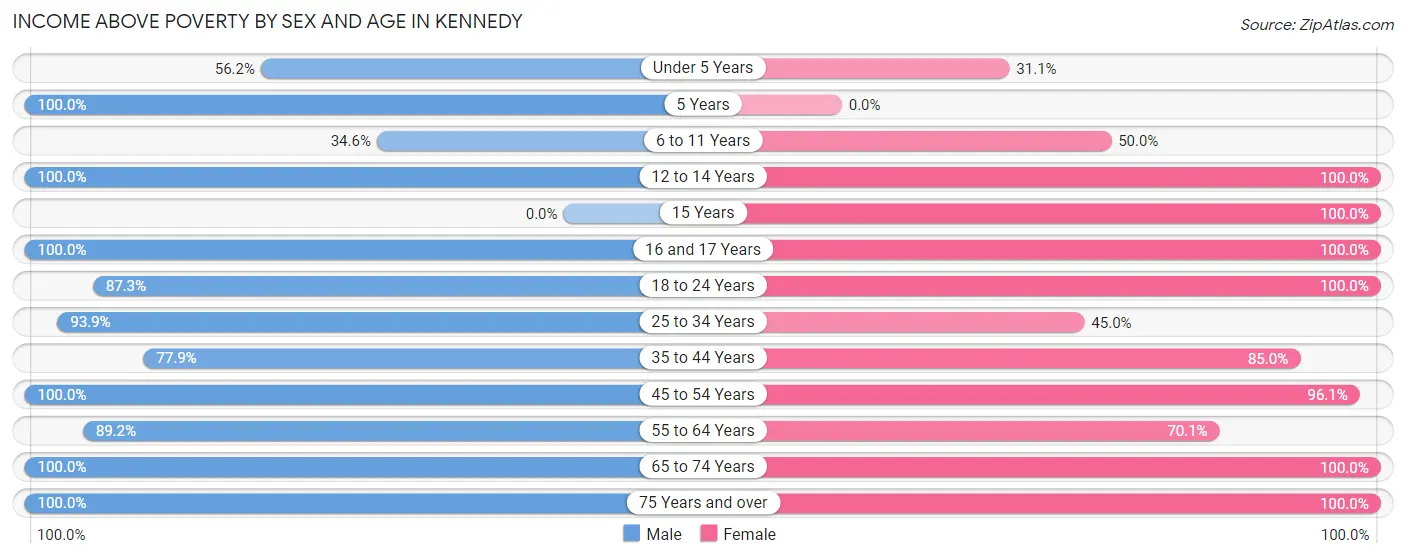
Income Above Poverty by Sex and Age in Kennedy
According to the poverty statistics in Kennedy, males aged 5 years and females aged 12 to 14 years are the age groups that are most secure financially, with 100.0% of males and 100.0% of females in these age groups living above the poverty line.
| Age Bracket | Male | Female |
| Under 5 Years | 41 (56.2%) | 56 (31.1%) |
| 5 Years | 11 (100.0%) | 0 (0.0%) |
| 6 to 11 Years | 53 (34.6%) | 79 (50.0%) |
| 12 to 14 Years | 51 (100.0%) | 32 (100.0%) |
| 15 Years | 0 (0.0%) | 73 (100.0%) |
| 16 and 17 Years | 21 (100.0%) | 3 (100.0%) |
| 18 to 24 Years | 193 (87.3%) | 52 (100.0%) |
| 25 to 34 Years | 108 (93.9%) | 77 (45.0%) |
| 35 to 44 Years | 212 (77.9%) | 199 (85.0%) |
| 45 to 54 Years | 195 (100.0%) | 74 (96.1%) |
| 55 to 64 Years | 66 (89.2%) | 75 (70.1%) |
| 65 to 74 Years | 99 (100.0%) | 42 (100.0%) |
| 75 Years and over | 61 (100.0%) | 28 (100.0%) |
| Total | 1,111 (82.5%) | 790 (67.5%) |
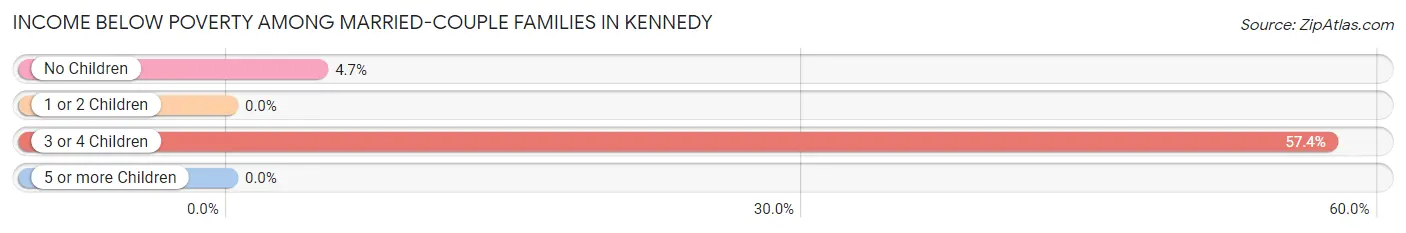
Income Below Poverty Among Married-Couple Families in Kennedy
The poverty statistics for married-couple families in Kennedy show that 18.8% or 66 of the total 351 families live below the poverty line. Families with 3 or 4 children have the highest poverty rate of 57.4%, comprising of 58 families. On the other hand, families with 1 or 2 children have the lowest poverty rate of 0.0%, which includes 0 families.
| Children | Above Poverty | Below Poverty |
| No Children | 162 (95.3%) | 8 (4.7%) |
| 1 or 2 Children | 80 (100.0%) | 0 (0.0%) |
| 3 or 4 Children | 43 (42.6%) | 58 (57.4%) |
| 5 or more Children | 0 (0.0%) | 0 (0.0%) |
| Total | 285 (81.2%) | 66 (18.8%) |
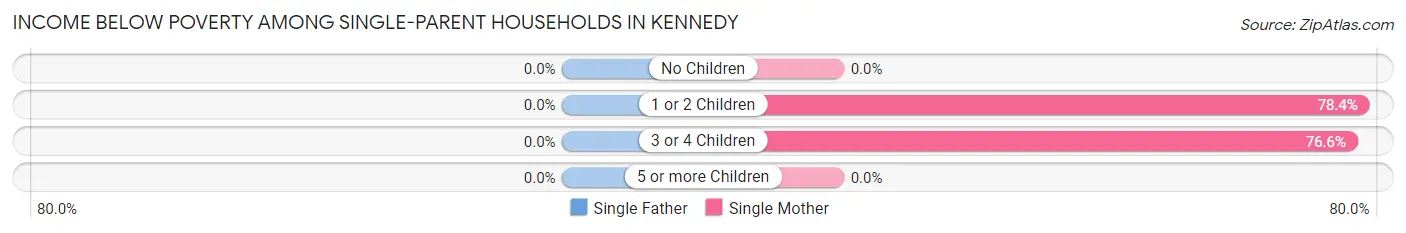
Income Below Poverty Among Single-Parent Households in Kennedy
| Children | Single Father | Single Mother |
| No Children | 0 (0.0%) | 0 (0.0%) |
| 1 or 2 Children | 0 (0.0%) | 29 (78.4%) |
| 3 or 4 Children | 0 (0.0%) | 36 (76.6%) |
| 5 or more Children | 0 (0.0%) | 0 (0.0%) |
| Total | 0 (0.0%) | 65 (68.4%) |
Income Below Poverty Among Married-Couple vs Single-Parent Households in Kennedy
The poverty data for Kennedy shows that 66 of the married-couple family households (18.8%) and 65 of the single-parent households (28.1%) are living below the poverty level. Within the married-couple family households, those with 3 or 4 children have the highest poverty rate, with 58 households (57.4%) falling below the poverty line. Among the single-parent households, those with 3 or 4 children have the highest poverty rate, with 36 household (76.6%) living below poverty.
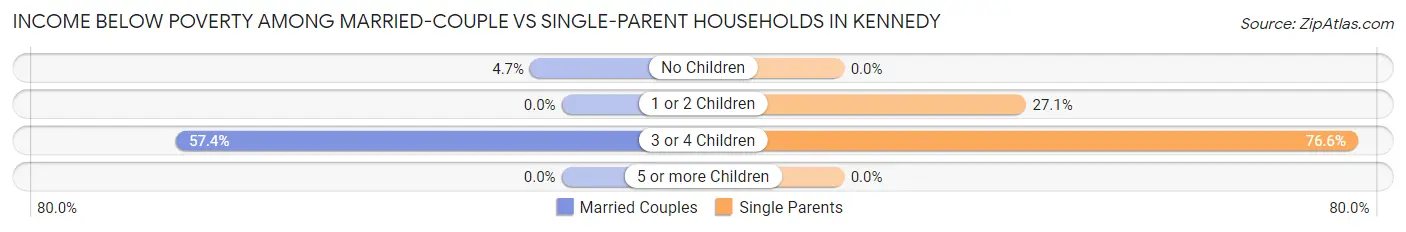
| Children | Married-Couple Families | Single-Parent Households |
| No Children | 8 (4.7%) | 0 (0.0%) |
| 1 or 2 Children | 0 (0.0%) | 29 (27.1%) |
| 3 or 4 Children | 58 (57.4%) | 36 (76.6%) |
| 5 or more Children | 0 (0.0%) | 0 (0.0%) |
| Total | 66 (18.8%) | 65 (28.1%) |
Employment Characteristics in Kennedy
Employment by Class of Employer in Kennedy
Among the 935 employed individuals in Kennedy, private company employees (755 | 80.7%), local government employees (91 | 9.7%), and federal government employees (34 | 3.6%) make up the most common classes of employment.
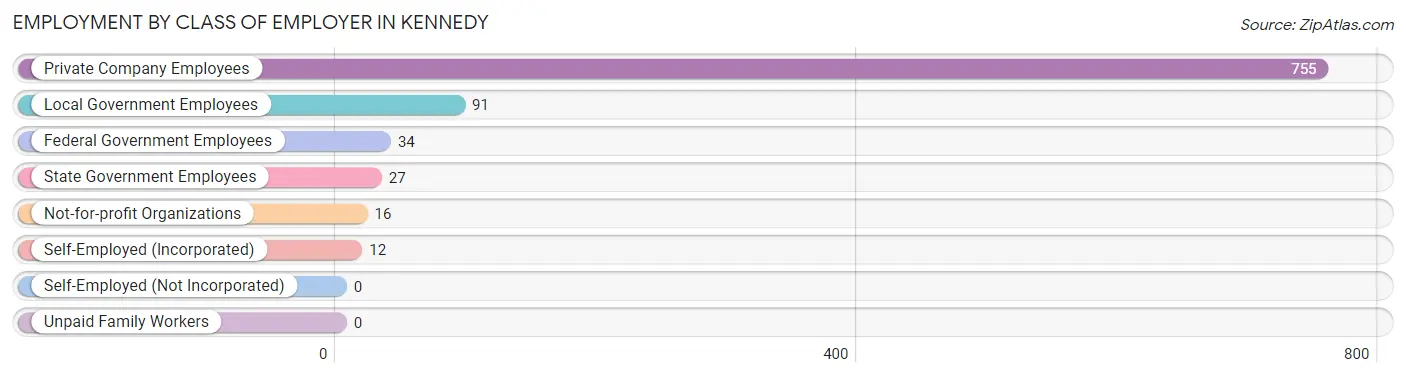
| Employer Class | # Employees | % Employees |
| Private Company Employees | 755 | 80.7% |
| Self-Employed (Incorporated) | 12 | 1.3% |
| Self-Employed (Not Incorporated) | 0 | 0.0% |
| Not-for-profit Organizations | 16 | 1.7% |
| Local Government Employees | 91 | 9.7% |
| State Government Employees | 27 | 2.9% |
| Federal Government Employees | 34 | 3.6% |
| Unpaid Family Workers | 0 | 0.0% |
| Total | 935 | 100.0% |
Employment Status by Age in Kennedy
According to the labor force statistics for Kennedy, out of the total population over 16 years of age (1,772), 58.6% or 1,038 individuals are in the labor force, with 8.7% or 90 of them unemployed. The age group with the highest labor force participation rate is 45 to 54 years, with 79.4% or 216 individuals in the labor force. Within the labor force, the 25 to 29 years age range has the highest percentage of unemployed individuals, with 21.3% or 36 of them being unemployed.
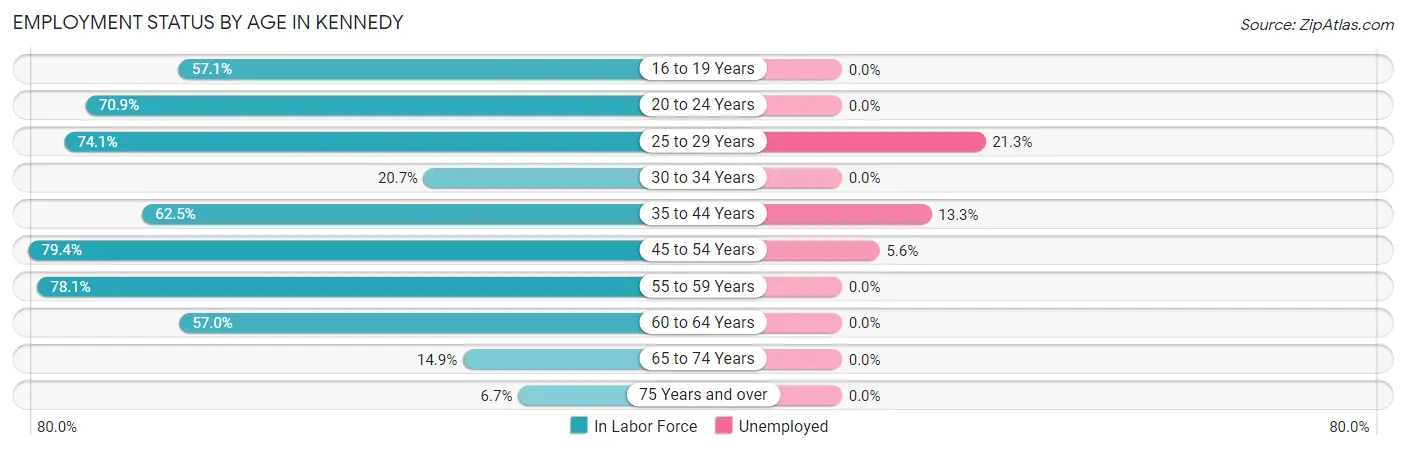
| Age Bracket | In Labor Force | Unemployed |
| 16 to 19 Years | 93 (57.1%) | 0 (0.0%) |
| 20 to 24 Years | 95 (70.9%) | 0 (0.0%) |
| 25 to 29 Years | 169 (74.1%) | 36 (21.3%) |
| 30 to 34 Years | 12 (20.7%) | 0 (0.0%) |
| 35 to 44 Years | 316 (62.5%) | 42 (13.3%) |
| 45 to 54 Years | 216 (79.4%) | 12 (5.6%) |
| 55 to 59 Years | 25 (78.1%) | 0 (0.0%) |
| 60 to 64 Years | 85 (57.0%) | 0 (0.0%) |
| 65 to 74 Years | 21 (14.9%) | 0 (0.0%) |
| 75 Years and over | 6 (6.7%) | 0 (0.0%) |
| Total | 1,038 (58.6%) | 90 (8.7%) |
Employment Status by Educational Attainment in Kennedy
According to labor force statistics for Kennedy, 66.1% of individuals (823) out of the total population between 25 and 64 years of age (1,245) are in the labor force, with 10.9% or 90 of them being unemployed. The group with the highest labor force participation rate are those with the educational attainment of bachelor's degree or higher, with 93.2% or 55 individuals in the labor force. Within the labor force, individuals with less than high school education have the highest percentage of unemployment, with 24.2% or 78 of them being unemployed.
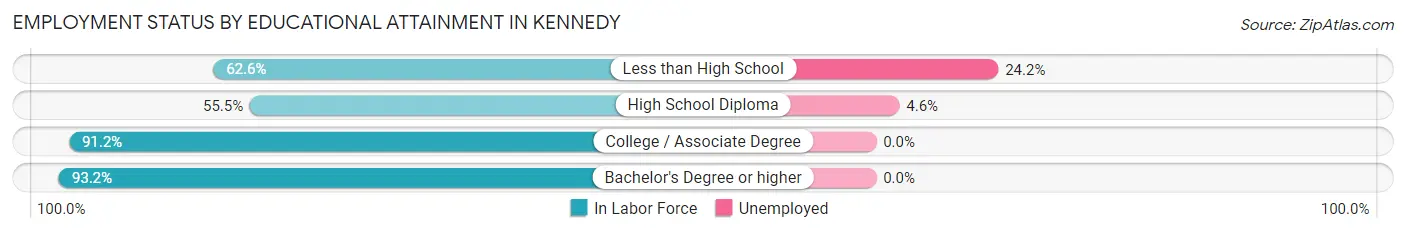
| Educational Attainment | In Labor Force | Unemployed |
| Less than High School | 322 (62.6%) | 124 (24.2%) |
| High School Diploma | 259 (55.5%) | 21 (4.6%) |
| College / Associate Degree | 187 (91.2%) | 0 (0.0%) |
| Bachelor's Degree or higher | 55 (93.2%) | 0 (0.0%) |
| Total | 823 (66.1%) | 136 (10.9%) |
Employment Occupations by Sex in Kennedy
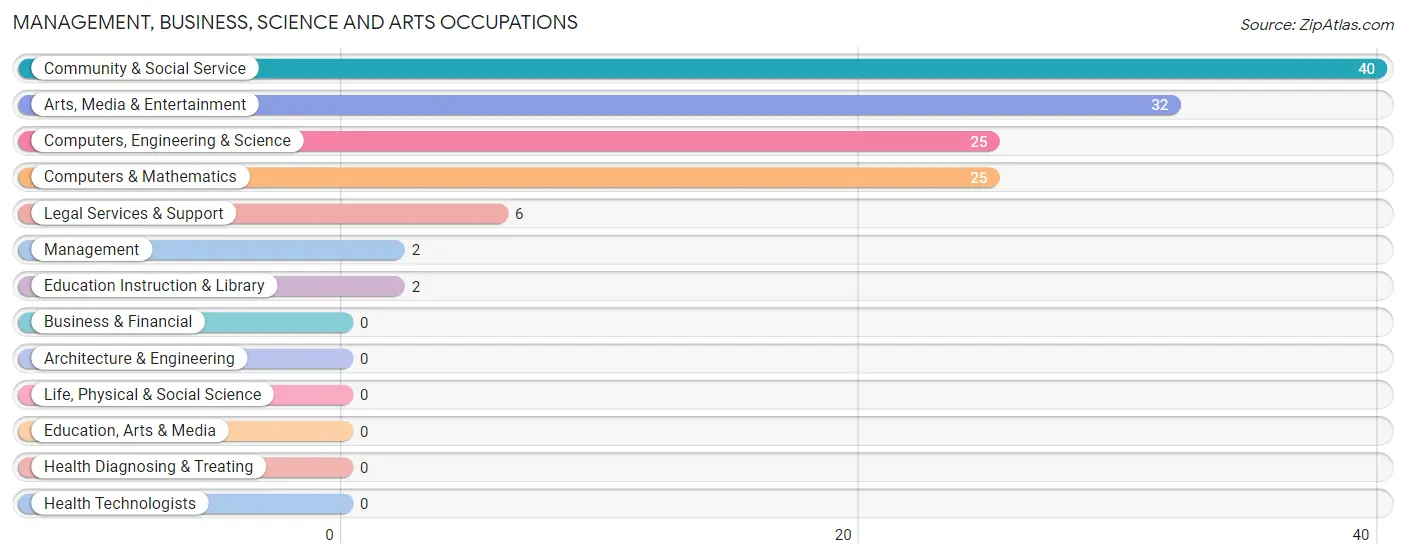
Management, Business, Science and Arts Occupations
The most common Management, Business, Science and Arts occupations in Kennedy are Community & Social Service (40 | 4.2%), Arts, Media & Entertainment (32 | 3.4%), Computers, Engineering & Science (25 | 2.6%), Computers & Mathematics (25 | 2.6%), and Legal Services & Support (6 | 0.6%).
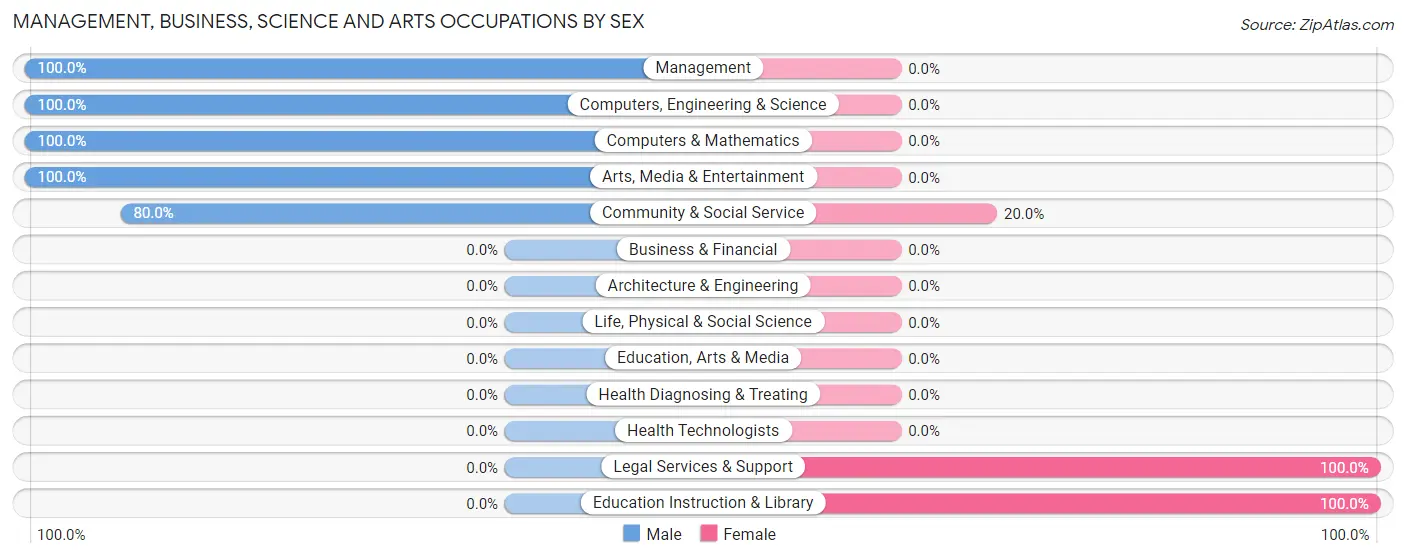
Management, Business, Science and Arts Occupations by Sex
Within the Management, Business, Science and Arts occupations in Kennedy, the most male-oriented occupations are Management (100.0%), Computers, Engineering & Science (100.0%), and Computers & Mathematics (100.0%), while the most female-oriented occupations are Legal Services & Support (100.0%), Education Instruction & Library (100.0%), and Community & Social Service (20.0%).
| Occupation | Male | Female |
| Management | 2 (100.0%) | 0 (0.0%) |
| Business & Financial | 0 (0.0%) | 0 (0.0%) |
| Computers, Engineering & Science | 25 (100.0%) | 0 (0.0%) |
| Computers & Mathematics | 25 (100.0%) | 0 (0.0%) |
| Architecture & Engineering | 0 (0.0%) | 0 (0.0%) |
| Life, Physical & Social Science | 0 (0.0%) | 0 (0.0%) |
| Community & Social Service | 32 (80.0%) | 8 (20.0%) |
| Education, Arts & Media | 0 (0.0%) | 0 (0.0%) |
| Legal Services & Support | 0 (0.0%) | 6 (100.0%) |
| Education Instruction & Library | 0 (0.0%) | 2 (100.0%) |
| Arts, Media & Entertainment | 32 (100.0%) | 0 (0.0%) |
| Health Diagnosing & Treating | 0 (0.0%) | 0 (0.0%) |
| Health Technologists | 0 (0.0%) | 0 (0.0%) |
| Total (Category) | 59 (88.1%) | 8 (11.9%) |
| Total (Overall) | 672 (70.9%) | 276 (29.1%) |
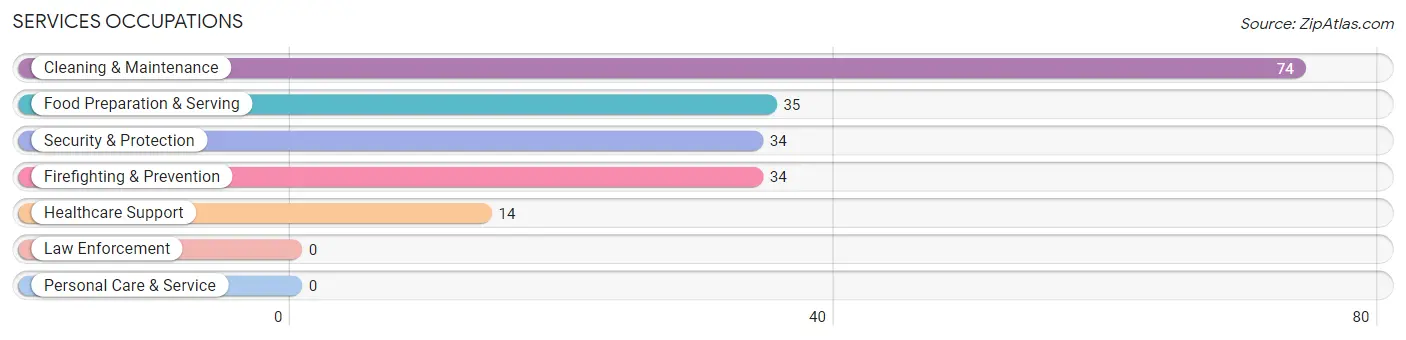
Services Occupations
The most common Services occupations in Kennedy are Cleaning & Maintenance (74 | 7.8%), Food Preparation & Serving (35 | 3.7%), Security & Protection (34 | 3.6%), Firefighting & Prevention (34 | 3.6%), and Healthcare Support (14 | 1.5%).
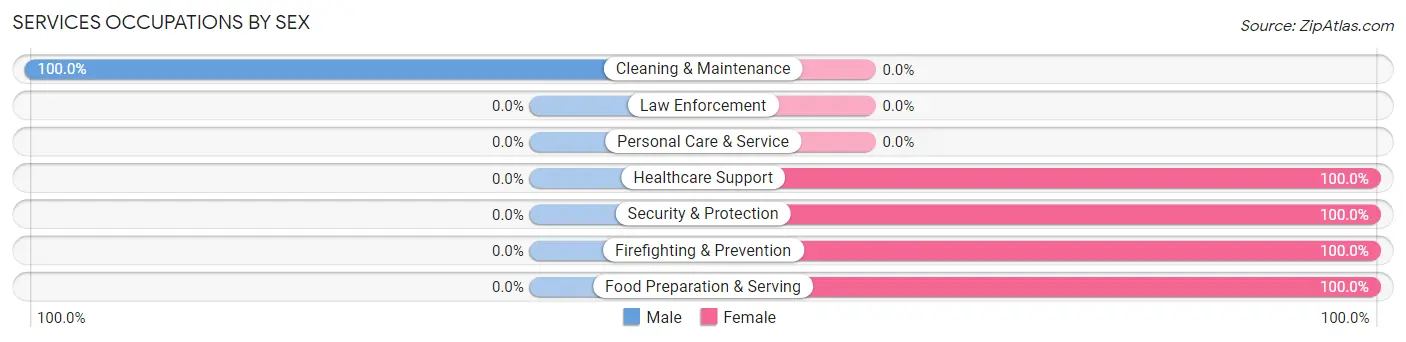
Services Occupations by Sex
| Occupation | Male | Female |
| Healthcare Support | 0 (0.0%) | 14 (100.0%) |
| Security & Protection | 0 (0.0%) | 34 (100.0%) |
| Firefighting & Prevention | 0 (0.0%) | 34 (100.0%) |
| Law Enforcement | 0 (0.0%) | 0 (0.0%) |
| Food Preparation & Serving | 0 (0.0%) | 35 (100.0%) |
| Cleaning & Maintenance | 74 (100.0%) | 0 (0.0%) |
| Personal Care & Service | 0 (0.0%) | 0 (0.0%) |
| Total (Category) | 74 (47.1%) | 83 (52.9%) |
| Total (Overall) | 672 (70.9%) | 276 (29.1%) |
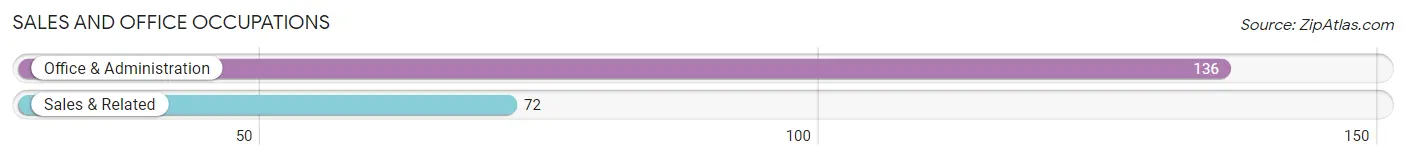
Sales and Office Occupations
The most common Sales and Office occupations in Kennedy are Office & Administration (136 | 14.3%), and Sales & Related (72 | 7.6%).
Sales and Office Occupations by Sex
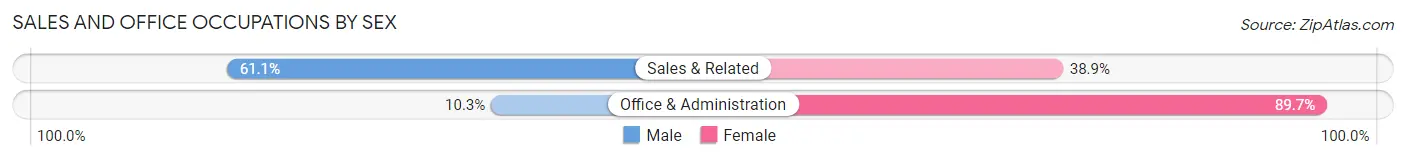
| Occupation | Male | Female |
| Sales & Related | 44 (61.1%) | 28 (38.9%) |
| Office & Administration | 14 (10.3%) | 122 (89.7%) |
| Total (Category) | 58 (27.9%) | 150 (72.1%) |
| Total (Overall) | 672 (70.9%) | 276 (29.1%) |
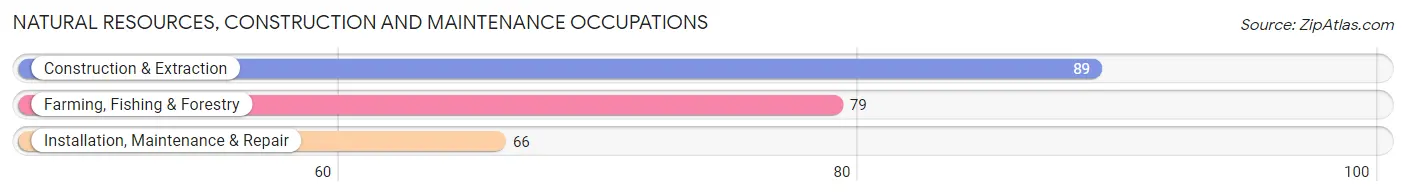
Natural Resources, Construction and Maintenance Occupations
The most common Natural Resources, Construction and Maintenance occupations in Kennedy are Construction & Extraction (89 | 9.4%), Farming, Fishing & Forestry (79 | 8.3%), and Installation, Maintenance & Repair (66 | 7.0%).
Natural Resources, Construction and Maintenance Occupations by Sex
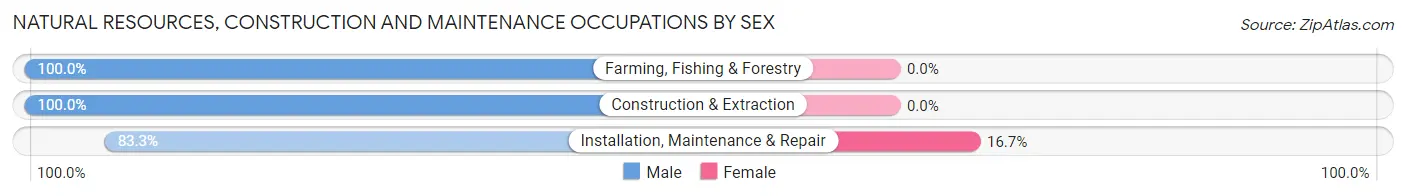
| Occupation | Male | Female |
| Farming, Fishing & Forestry | 79 (100.0%) | 0 (0.0%) |
| Construction & Extraction | 89 (100.0%) | 0 (0.0%) |
| Installation, Maintenance & Repair | 55 (83.3%) | 11 (16.7%) |
| Total (Category) | 223 (95.3%) | 11 (4.7%) |
| Total (Overall) | 672 (70.9%) | 276 (29.1%) |
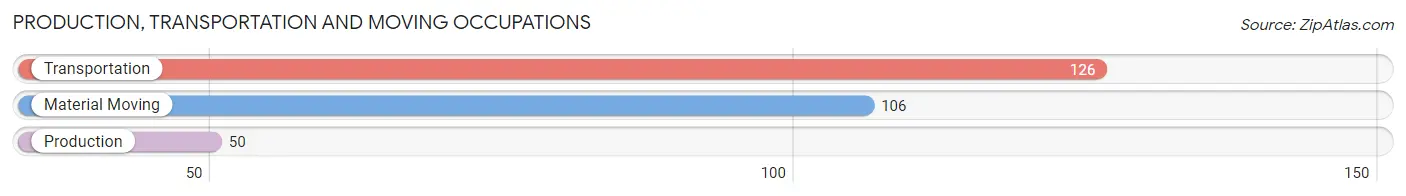
Production, Transportation and Moving Occupations
The most common Production, Transportation and Moving occupations in Kennedy are Transportation (126 | 13.3%), Material Moving (106 | 11.2%), and Production (50 | 5.3%).
Production, Transportation and Moving Occupations by Sex
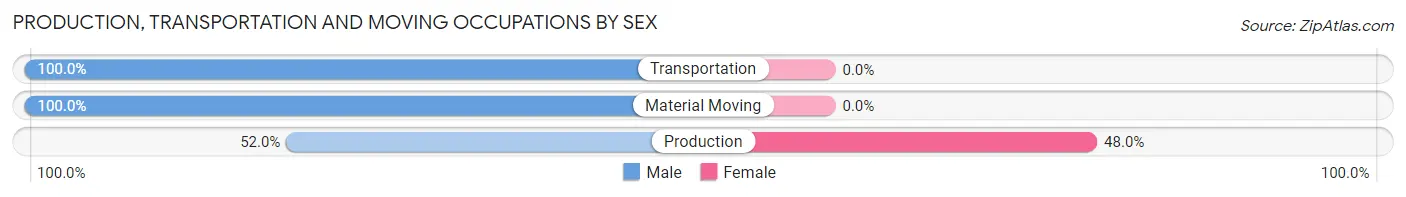
| Occupation | Male | Female |
| Production | 26 (52.0%) | 24 (48.0%) |
| Transportation | 126 (100.0%) | 0 (0.0%) |
| Material Moving | 106 (100.0%) | 0 (0.0%) |
| Total (Category) | 258 (91.5%) | 24 (8.5%) |
| Total (Overall) | 672 (70.9%) | 276 (29.1%) |
Employment Industries by Sex in Kennedy
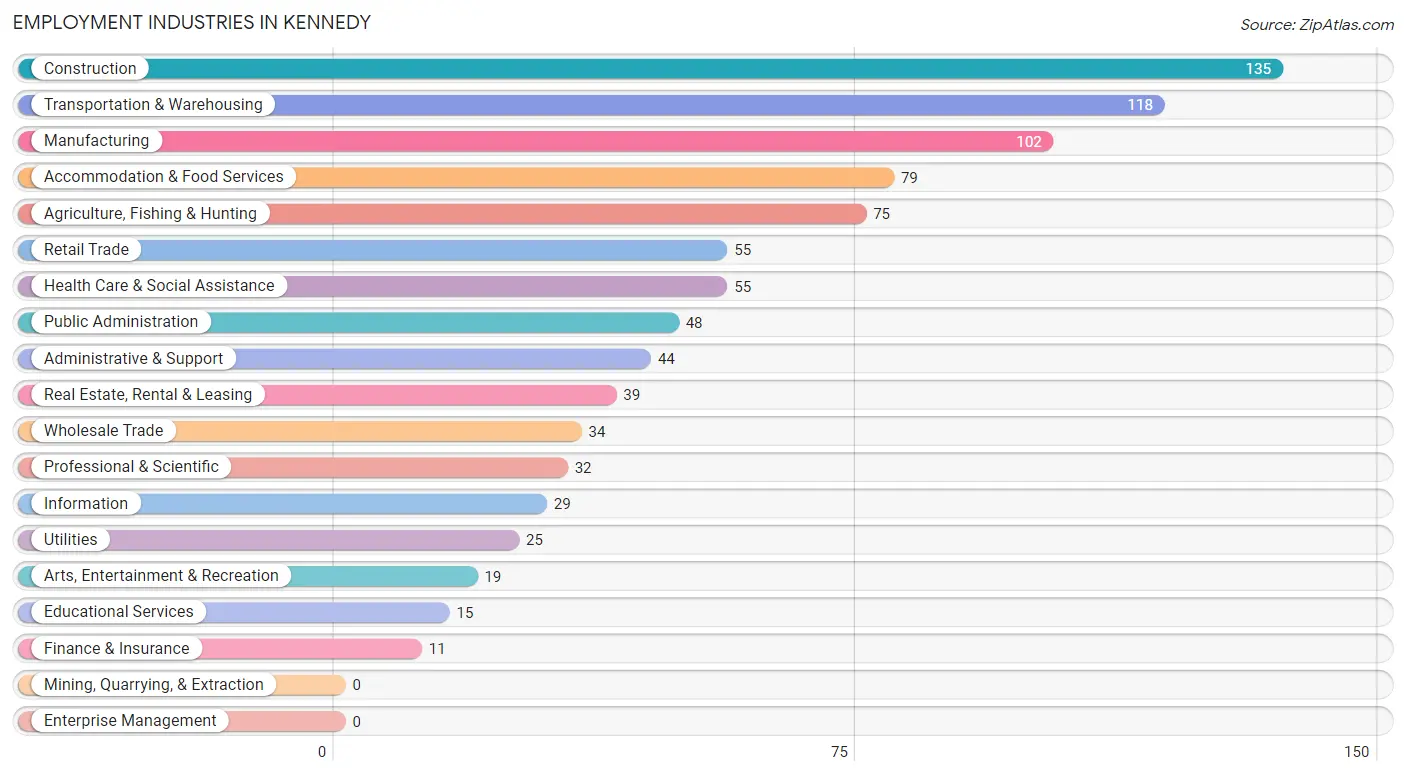
Employment Industries in Kennedy
The major employment industries in Kennedy include Construction (135 | 14.2%), Transportation & Warehousing (118 | 12.4%), Manufacturing (102 | 10.8%), Accommodation & Food Services (79 | 8.3%), and Agriculture, Fishing & Hunting (75 | 7.9%).
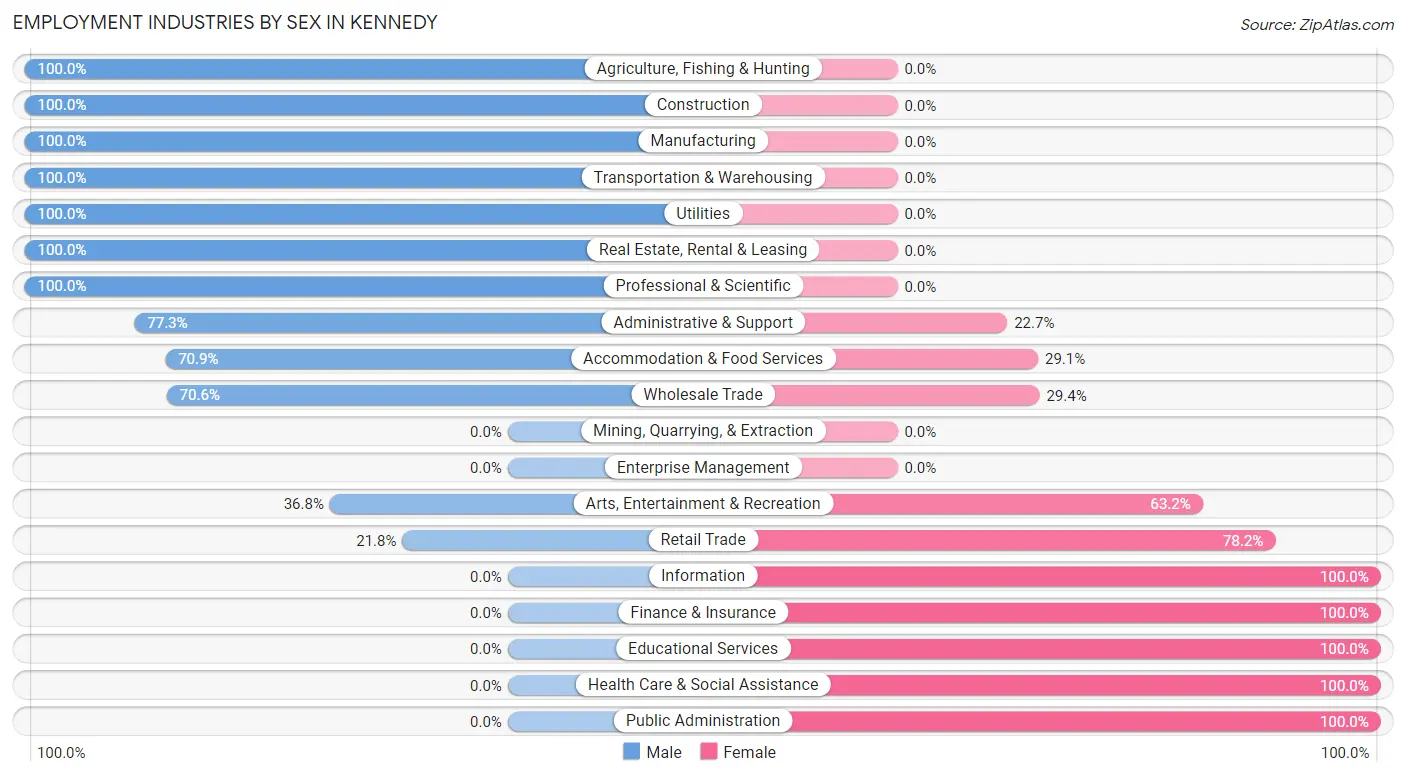
Employment Industries by Sex in Kennedy
The Kennedy industries that see more men than women are Agriculture, Fishing & Hunting (100.0%), Construction (100.0%), and Manufacturing (100.0%), whereas the industries that tend to have a higher number of women are Information (100.0%), Finance & Insurance (100.0%), and Educational Services (100.0%).
| Industry | Male | Female |
| Agriculture, Fishing & Hunting | 75 (100.0%) | 0 (0.0%) |
| Mining, Quarrying, & Extraction | 0 (0.0%) | 0 (0.0%) |
| Construction | 135 (100.0%) | 0 (0.0%) |
| Manufacturing | 102 (100.0%) | 0 (0.0%) |
| Wholesale Trade | 24 (70.6%) | 10 (29.4%) |
| Retail Trade | 12 (21.8%) | 43 (78.2%) |
| Transportation & Warehousing | 118 (100.0%) | 0 (0.0%) |
| Utilities | 25 (100.0%) | 0 (0.0%) |
| Information | 0 (0.0%) | 29 (100.0%) |
| Finance & Insurance | 0 (0.0%) | 11 (100.0%) |
| Real Estate, Rental & Leasing | 39 (100.0%) | 0 (0.0%) |
| Professional & Scientific | 32 (100.0%) | 0 (0.0%) |
| Enterprise Management | 0 (0.0%) | 0 (0.0%) |
| Administrative & Support | 34 (77.3%) | 10 (22.7%) |
| Educational Services | 0 (0.0%) | 15 (100.0%) |
| Health Care & Social Assistance | 0 (0.0%) | 55 (100.0%) |
| Arts, Entertainment & Recreation | 7 (36.8%) | 12 (63.2%) |
| Accommodation & Food Services | 56 (70.9%) | 23 (29.1%) |
| Public Administration | 0 (0.0%) | 48 (100.0%) |
| Total | 672 (70.9%) | 276 (29.1%) |
Education in Kennedy
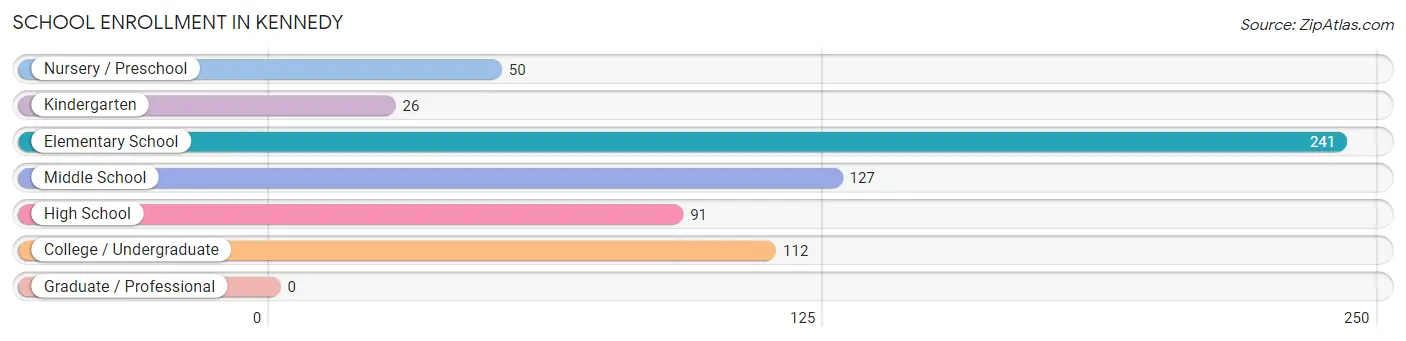
School Enrollment in Kennedy
The most common levels of schooling among the 647 students in Kennedy are elementary school (241 | 37.2%), middle school (127 | 19.6%), and college / undergraduate (112 | 17.3%).
| School Level | # Students | % Students |
| Nursery / Preschool | 50 | 7.7% |
| Kindergarten | 26 | 4.0% |
| Elementary School | 241 | 37.2% |
| Middle School | 127 | 19.6% |
| High School | 91 | 14.1% |
| College / Undergraduate | 112 | 17.3% |
| Graduate / Professional | 0 | 0.0% |
| Total | 647 | 100.0% |
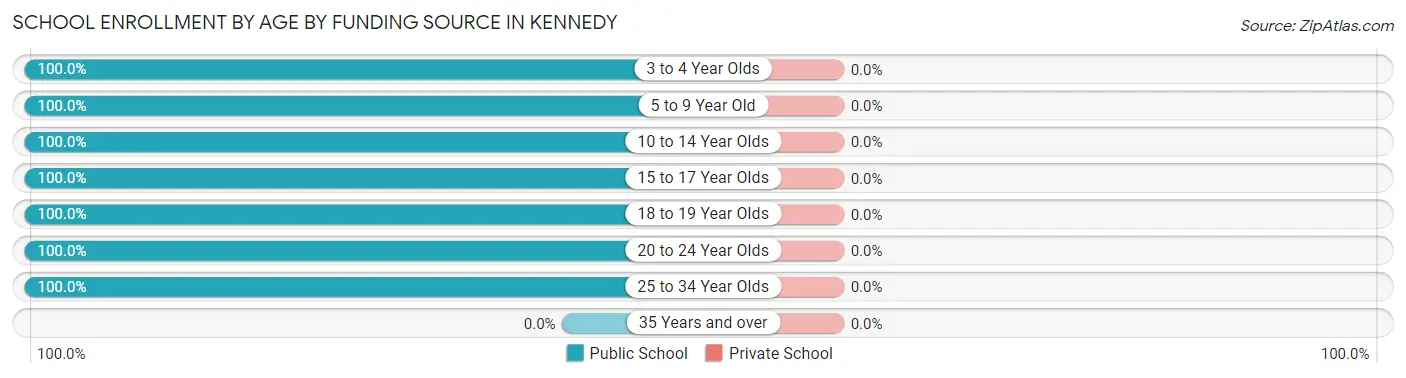
School Enrollment by Age by Funding Source in Kennedy
| Age Bracket | Public School | Private School |
| 3 to 4 Year Olds | 37 (100.0%) | 0 (0.0%) |
| 5 to 9 Year Old | 309 (100.0%) | 0 (0.0%) |
| 10 to 14 Year Olds | 109 (100.0%) | 0 (0.0%) |
| 15 to 17 Year Olds | 65 (100.0%) | 0 (0.0%) |
| 18 to 19 Year Olds | 87 (100.0%) | 0 (0.0%) |
| 20 to 24 Year Olds | 28 (100.0%) | 0 (0.0%) |
| 25 to 34 Year Olds | 12 (100.0%) | 0 (0.0%) |
| 35 Years and over | 0 (0.0%) | 0 (0.0%) |
| Total | 647 (100.0%) | 0 (0.0%) |
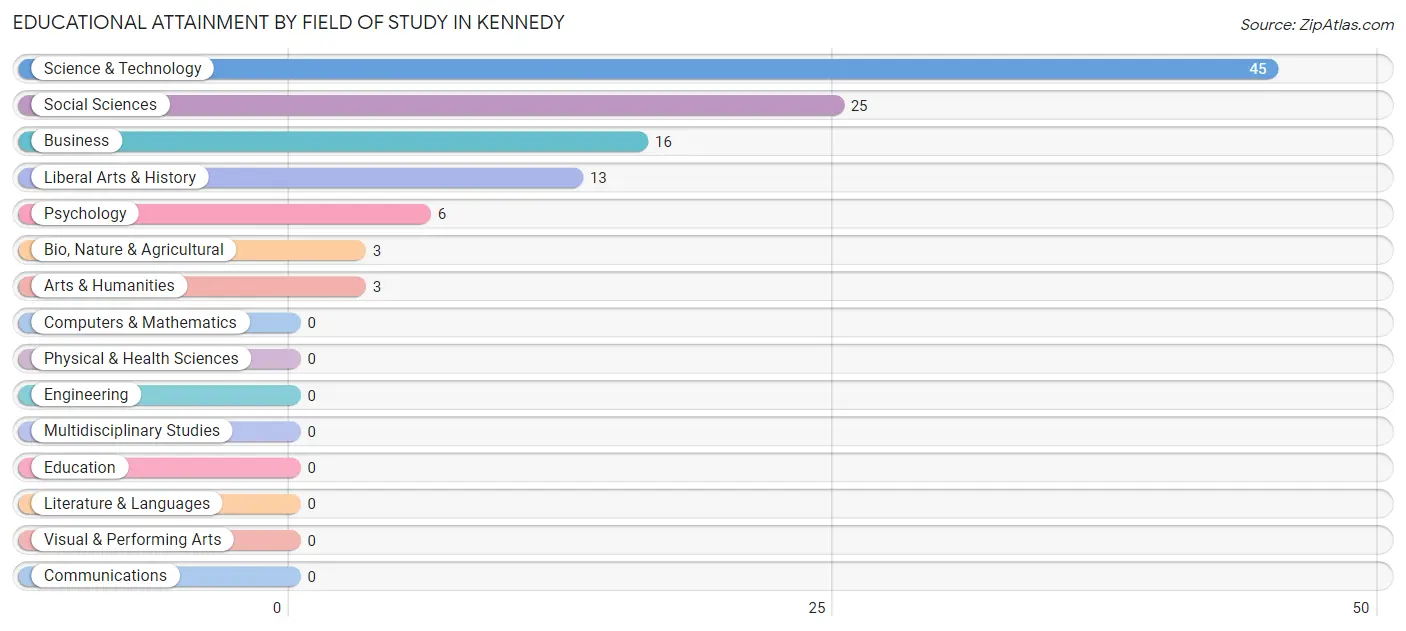
Educational Attainment by Field of Study in Kennedy
Science & technology (45 | 40.5%), social sciences (25 | 22.5%), business (16 | 14.4%), liberal arts & history (13 | 11.7%), and psychology (6 | 5.4%) are the most common fields of study among 111 individuals in Kennedy who have obtained a bachelor's degree or higher.
| Field of Study | # Graduates | % Graduates |
| Computers & Mathematics | 0 | 0.0% |
| Bio, Nature & Agricultural | 3 | 2.7% |
| Physical & Health Sciences | 0 | 0.0% |
| Psychology | 6 | 5.4% |
| Social Sciences | 25 | 22.5% |
| Engineering | 0 | 0.0% |
| Multidisciplinary Studies | 0 | 0.0% |
| Science & Technology | 45 | 40.5% |
| Business | 16 | 14.4% |
| Education | 0 | 0.0% |
| Literature & Languages | 0 | 0.0% |
| Liberal Arts & History | 13 | 11.7% |
| Visual & Performing Arts | 0 | 0.0% |
| Communications | 0 | 0.0% |
| Arts & Humanities | 3 | 2.7% |
| Total | 111 | 100.0% |
Transportation & Commute in Kennedy
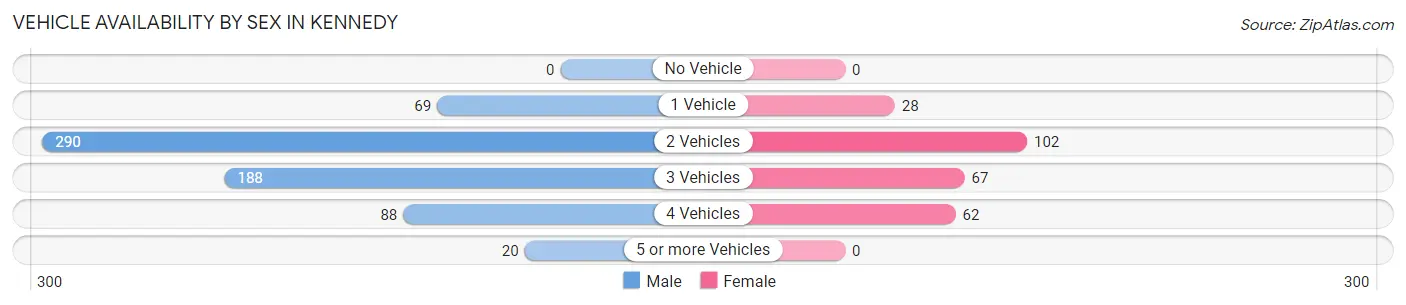
Vehicle Availability by Sex in Kennedy
The most prevalent vehicle ownership categories in Kennedy are males with 2 vehicles (290, accounting for 44.3%) and females with 2 vehicles (102, making up 112.0%).
| Vehicles Available | Male | Female |
| No Vehicle | 0 (0.0%) | 0 (0.0%) |
| 1 Vehicle | 69 (10.5%) | 28 (10.8%) |
| 2 Vehicles | 290 (44.3%) | 102 (39.4%) |
| 3 Vehicles | 188 (28.7%) | 67 (25.9%) |
| 4 Vehicles | 88 (13.4%) | 62 (23.9%) |
| 5 or more Vehicles | 20 (3.0%) | 0 (0.0%) |
| Total | 655 (100.0%) | 259 (100.0%) |
Commute Time in Kennedy
The most frequently occuring commute durations in Kennedy are 15 to 19 minutes (182 commuters, 20.2%), 90 or more minutes (157 commuters, 17.4%), and 30 to 34 minutes (127 commuters, 14.1%).
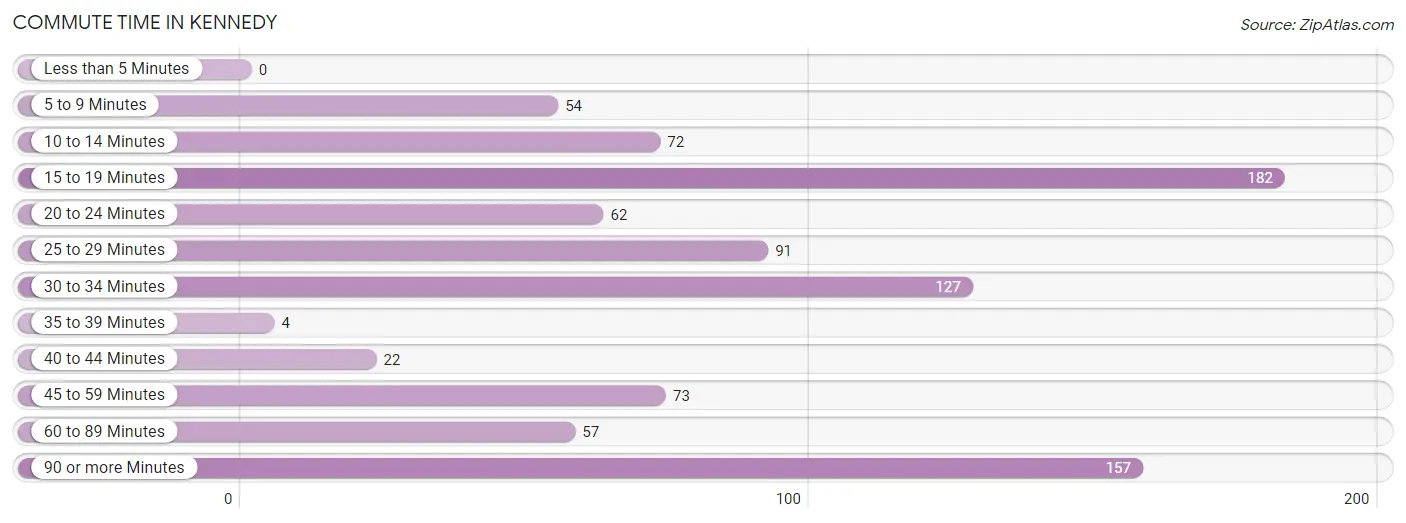
| Commute Time | # Commuters | % Commuters |
| Less than 5 Minutes | 0 | 0.0% |
| 5 to 9 Minutes | 54 | 6.0% |
| 10 to 14 Minutes | 72 | 8.0% |
| 15 to 19 Minutes | 182 | 20.2% |
| 20 to 24 Minutes | 62 | 6.9% |
| 25 to 29 Minutes | 91 | 10.1% |
| 30 to 34 Minutes | 127 | 14.1% |
| 35 to 39 Minutes | 4 | 0.4% |
| 40 to 44 Minutes | 22 | 2.4% |
| 45 to 59 Minutes | 73 | 8.1% |
| 60 to 89 Minutes | 57 | 6.3% |
| 90 or more Minutes | 157 | 17.4% |
Commute Time by Sex in Kennedy
The most common commute times in Kennedy are 30 to 34 minutes (127 commuters, 19.3%) for males and 15 to 19 minutes (77 commuters, 31.8%) for females.
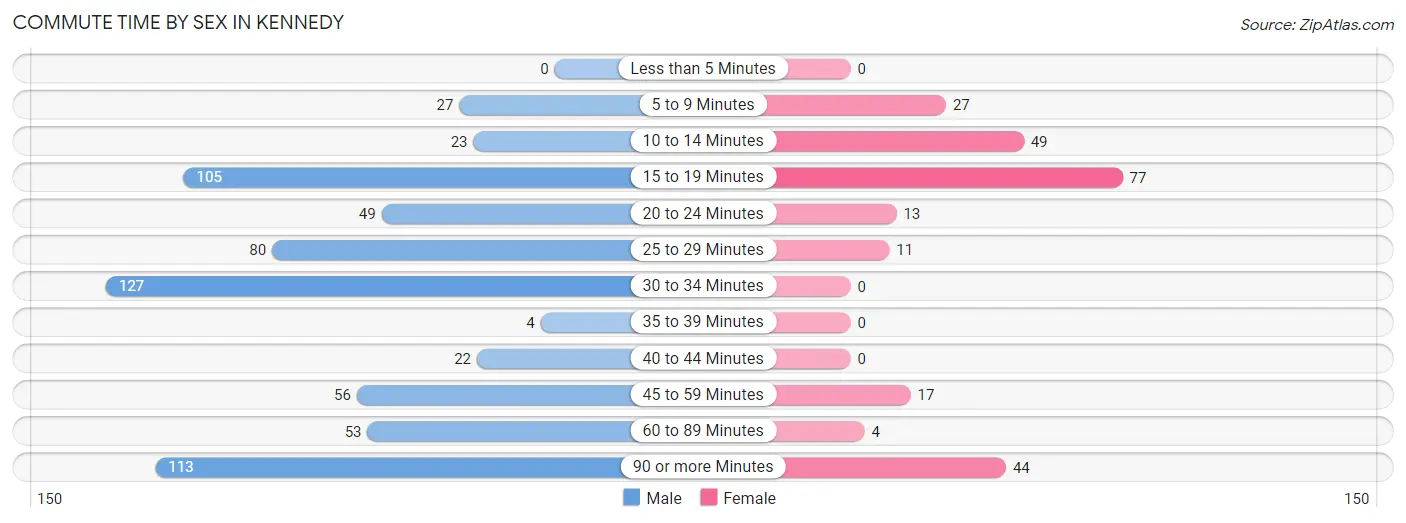
| Commute Time | Male | Female |
| Less than 5 Minutes | 0 (0.0%) | 0 (0.0%) |
| 5 to 9 Minutes | 27 (4.1%) | 27 (11.2%) |
| 10 to 14 Minutes | 23 (3.5%) | 49 (20.3%) |
| 15 to 19 Minutes | 105 (15.9%) | 77 (31.8%) |
| 20 to 24 Minutes | 49 (7.4%) | 13 (5.4%) |
| 25 to 29 Minutes | 80 (12.1%) | 11 (4.5%) |
| 30 to 34 Minutes | 127 (19.3%) | 0 (0.0%) |
| 35 to 39 Minutes | 4 (0.6%) | 0 (0.0%) |
| 40 to 44 Minutes | 22 (3.3%) | 0 (0.0%) |
| 45 to 59 Minutes | 56 (8.5%) | 17 (7.0%) |
| 60 to 89 Minutes | 53 (8.0%) | 4 (1.7%) |
| 90 or more Minutes | 113 (17.2%) | 44 (18.2%) |
Time of Departure to Work by Sex in Kennedy
The most frequent times of departure to work in Kennedy are 7:00 AM to 7:29 AM (213, 32.3%) for males and 8:30 AM to 8:59 AM (57, 23.5%) for females.
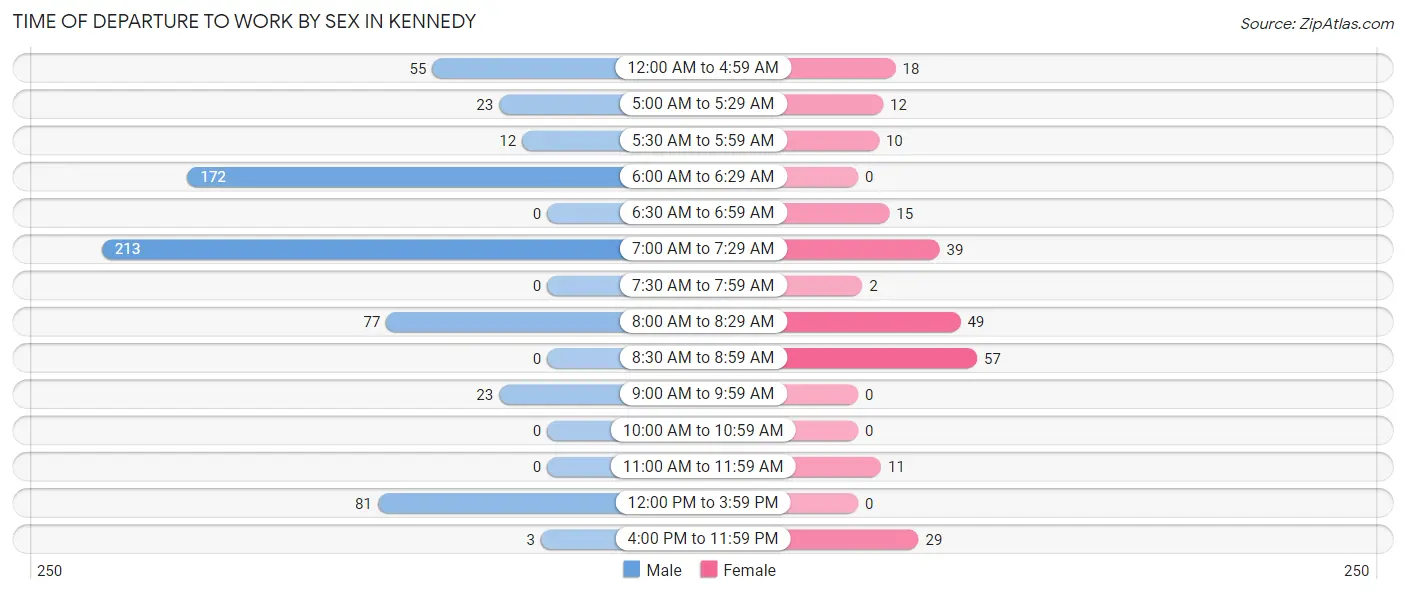
| Time of Departure | Male | Female |
| 12:00 AM to 4:59 AM | 55 (8.4%) | 18 (7.4%) |
| 5:00 AM to 5:29 AM | 23 (3.5%) | 12 (5.0%) |
| 5:30 AM to 5:59 AM | 12 (1.8%) | 10 (4.1%) |
| 6:00 AM to 6:29 AM | 172 (26.1%) | 0 (0.0%) |
| 6:30 AM to 6:59 AM | 0 (0.0%) | 15 (6.2%) |
| 7:00 AM to 7:29 AM | 213 (32.3%) | 39 (16.1%) |
| 7:30 AM to 7:59 AM | 0 (0.0%) | 2 (0.8%) |
| 8:00 AM to 8:29 AM | 77 (11.7%) | 49 (20.3%) |
| 8:30 AM to 8:59 AM | 0 (0.0%) | 57 (23.5%) |
| 9:00 AM to 9:59 AM | 23 (3.5%) | 0 (0.0%) |
| 10:00 AM to 10:59 AM | 0 (0.0%) | 0 (0.0%) |
| 11:00 AM to 11:59 AM | 0 (0.0%) | 11 (4.5%) |
| 12:00 PM to 3:59 PM | 81 (12.3%) | 0 (0.0%) |
| 4:00 PM to 11:59 PM | 3 (0.5%) | 29 (12.0%) |
| Total | 659 (100.0%) | 242 (100.0%) |
Housing Occupancy in Kennedy
Occupancy by Ownership in Kennedy
Of the total 726 dwellings in Kennedy, owner-occupied units account for 374 (51.5%), while renter-occupied units make up 352 (48.5%).
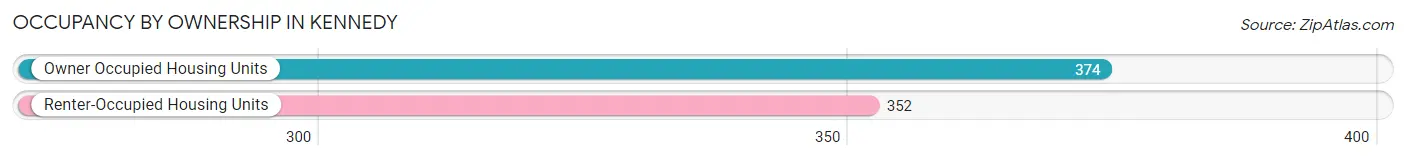
| Occupancy | # Housing Units | % Housing Units |
| Owner Occupied Housing Units | 374 | 51.5% |
| Renter-Occupied Housing Units | 352 | 48.5% |
| Total Occupied Housing Units | 726 | 100.0% |
Occupancy by Household Size in Kennedy
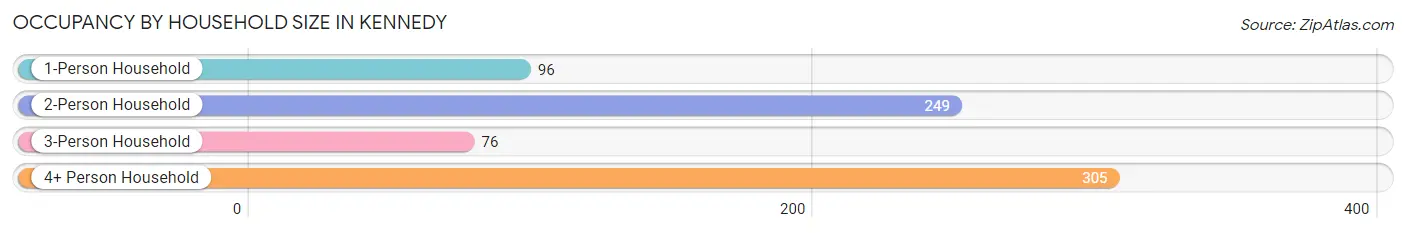
| Household Size | # Housing Units | % Housing Units |
| 1-Person Household | 96 | 13.2% |
| 2-Person Household | 249 | 34.3% |
| 3-Person Household | 76 | 10.5% |
| 4+ Person Household | 305 | 42.0% |
| Total Housing Units | 726 | 100.0% |
Occupancy by Ownership by Household Size in Kennedy
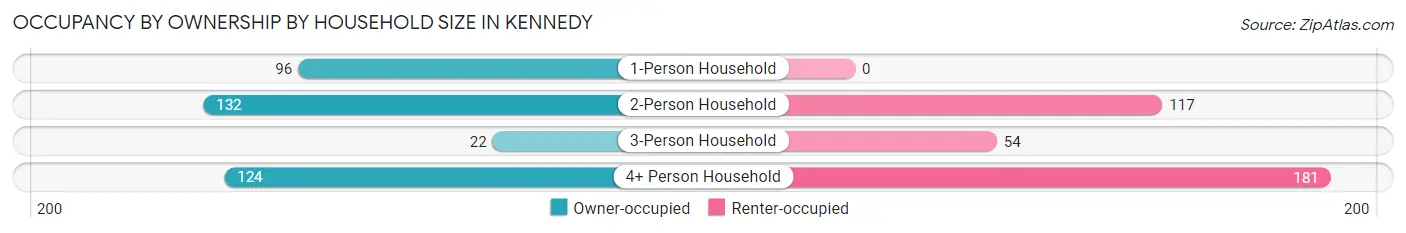
| Household Size | Owner-occupied | Renter-occupied |
| 1-Person Household | 96 (100.0%) | 0 (0.0%) |
| 2-Person Household | 132 (53.0%) | 117 (47.0%) |
| 3-Person Household | 22 (28.9%) | 54 (71.1%) |
| 4+ Person Household | 124 (40.7%) | 181 (59.3%) |
| Total Housing Units | 374 (51.5%) | 352 (48.5%) |
Occupancy by Educational Attainment in Kennedy
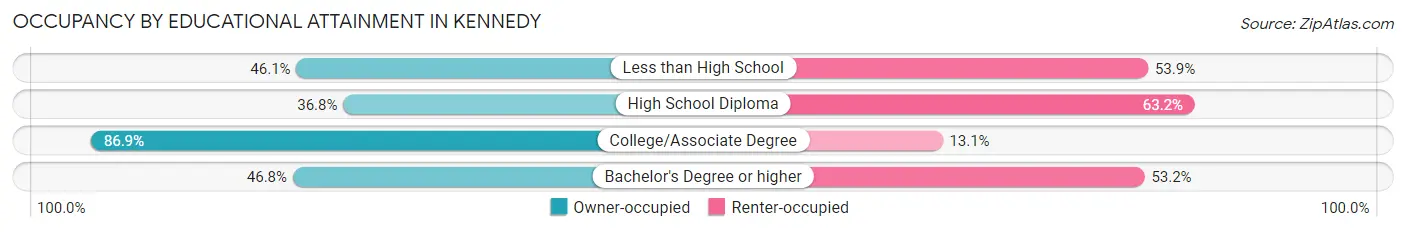
| Household Size | Owner-occupied | Renter-occupied |
| Less than High School | 166 (46.1%) | 194 (53.9%) |
| High School Diploma | 67 (36.8%) | 115 (63.2%) |
| College/Associate Degree | 119 (86.9%) | 18 (13.1%) |
| Bachelor's Degree or higher | 22 (46.8%) | 25 (53.2%) |
Occupancy by Age of Householder in Kennedy
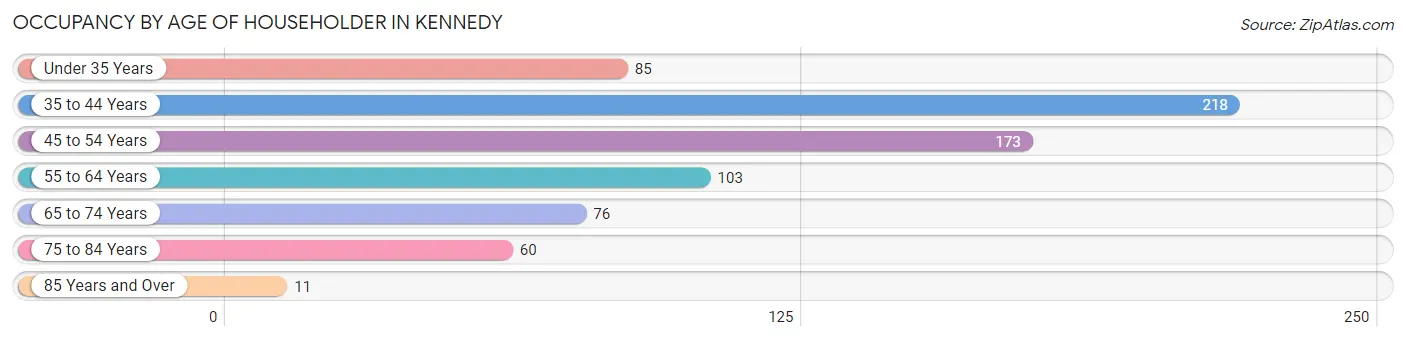
| Age Bracket | # Households | % Households |
| Under 35 Years | 85 | 11.7% |
| 35 to 44 Years | 218 | 30.0% |
| 45 to 54 Years | 173 | 23.8% |
| 55 to 64 Years | 103 | 14.2% |
| 65 to 74 Years | 76 | 10.5% |
| 75 to 84 Years | 60 | 8.3% |
| 85 Years and Over | 11 | 1.5% |
| Total | 726 | 100.0% |
Housing Finances in Kennedy
Median Income by Occupancy in Kennedy
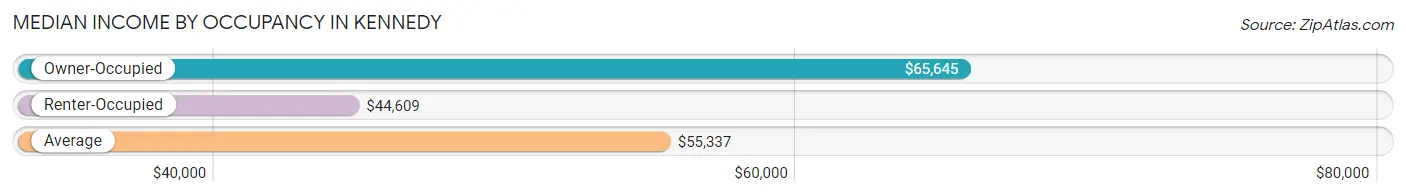
| Occupancy Type | # Households | Median Income |
| Owner-Occupied | 374 (51.5%) | $65,645 |
| Renter-Occupied | 352 (48.5%) | $44,609 |
| Average | 726 (100.0%) | $55,337 |
Occupancy by Householder Income Bracket in Kennedy
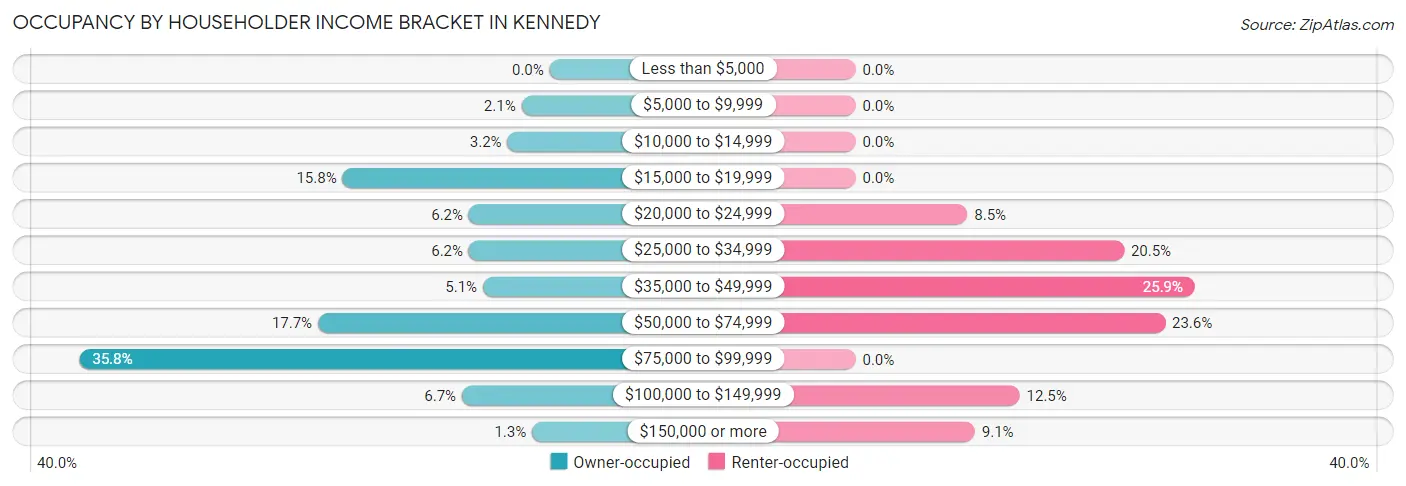
| Income Bracket | Owner-occupied | Renter-occupied |
| Less than $5,000 | 0 (0.0%) | 0 (0.0%) |
| $5,000 to $9,999 | 8 (2.1%) | 0 (0.0%) |
| $10,000 to $14,999 | 12 (3.2%) | 0 (0.0%) |
| $15,000 to $19,999 | 59 (15.8%) | 0 (0.0%) |
| $20,000 to $24,999 | 23 (6.1%) | 30 (8.5%) |
| $25,000 to $34,999 | 23 (6.1%) | 72 (20.4%) |
| $35,000 to $49,999 | 19 (5.1%) | 91 (25.9%) |
| $50,000 to $74,999 | 66 (17.6%) | 83 (23.6%) |
| $75,000 to $99,999 | 134 (35.8%) | 0 (0.0%) |
| $100,000 to $149,999 | 25 (6.7%) | 44 (12.5%) |
| $150,000 or more | 5 (1.3%) | 32 (9.1%) |
| Total | 374 (100.0%) | 352 (100.0%) |
Monthly Housing Cost Tiers in Kennedy
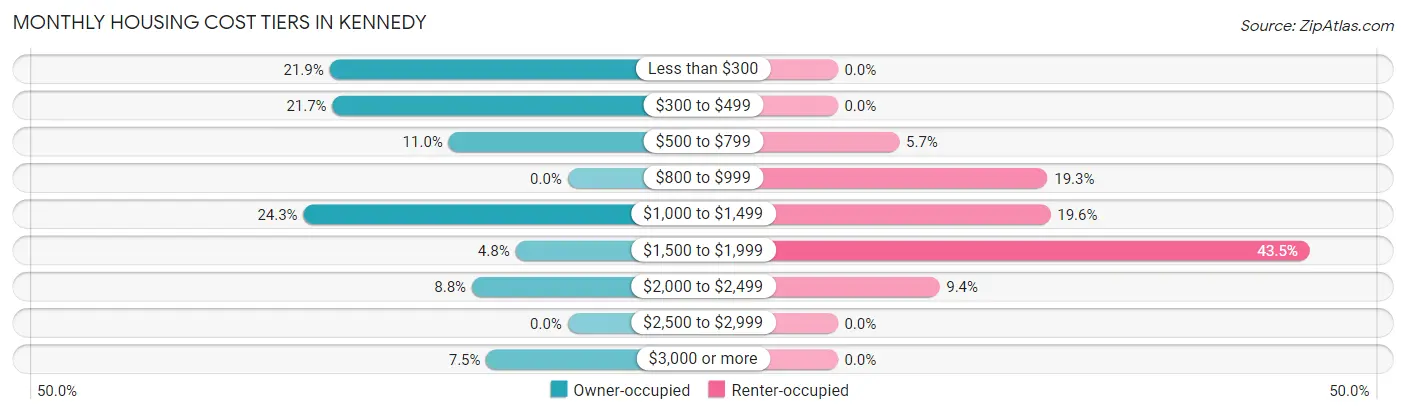
| Monthly Cost | Owner-occupied | Renter-occupied |
| Less than $300 | 82 (21.9%) | 0 (0.0%) |
| $300 to $499 | 81 (21.7%) | 0 (0.0%) |
| $500 to $799 | 41 (11.0%) | 20 (5.7%) |
| $800 to $999 | 0 (0.0%) | 68 (19.3%) |
| $1,000 to $1,499 | 91 (24.3%) | 69 (19.6%) |
| $1,500 to $1,999 | 18 (4.8%) | 153 (43.5%) |
| $2,000 to $2,499 | 33 (8.8%) | 33 (9.4%) |
| $2,500 to $2,999 | 0 (0.0%) | 0 (0.0%) |
| $3,000 or more | 28 (7.5%) | 0 (0.0%) |
| Total | 374 (100.0%) | 352 (100.0%) |
Physical Housing Characteristics in Kennedy
Housing Structures in Kennedy
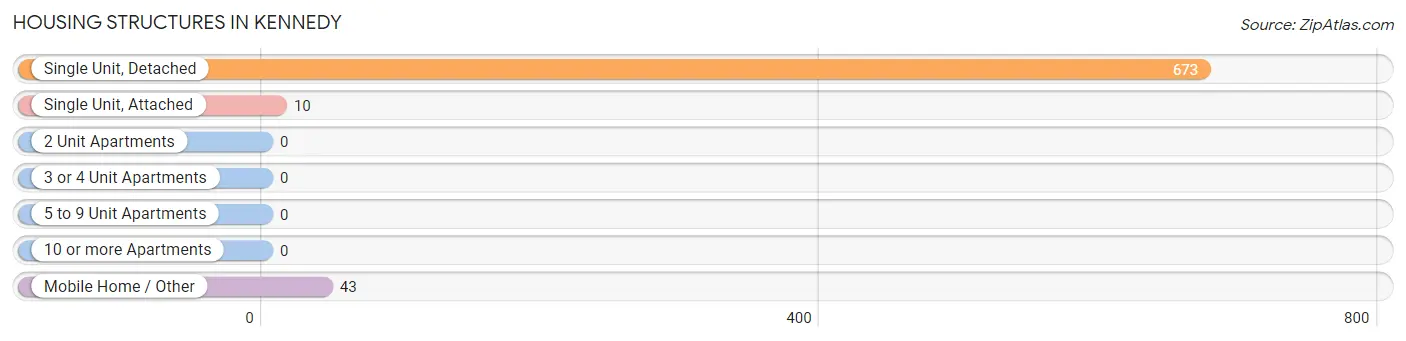
| Structure Type | # Housing Units | % Housing Units |
| Single Unit, Detached | 673 | 92.7% |
| Single Unit, Attached | 10 | 1.4% |
| 2 Unit Apartments | 0 | 0.0% |
| 3 or 4 Unit Apartments | 0 | 0.0% |
| 5 to 9 Unit Apartments | 0 | 0.0% |
| 10 or more Apartments | 0 | 0.0% |
| Mobile Home / Other | 43 | 5.9% |
| Total | 726 | 100.0% |
Housing Structures by Occupancy in Kennedy
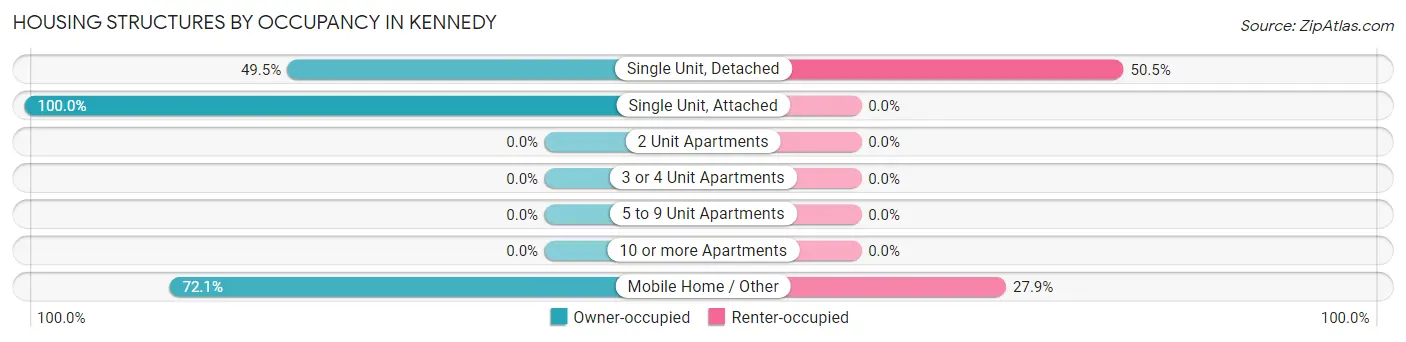
| Structure Type | Owner-occupied | Renter-occupied |
| Single Unit, Detached | 333 (49.5%) | 340 (50.5%) |
| Single Unit, Attached | 10 (100.0%) | 0 (0.0%) |
| 2 Unit Apartments | 0 (0.0%) | 0 (0.0%) |
| 3 or 4 Unit Apartments | 0 (0.0%) | 0 (0.0%) |
| 5 to 9 Unit Apartments | 0 (0.0%) | 0 (0.0%) |
| 10 or more Apartments | 0 (0.0%) | 0 (0.0%) |
| Mobile Home / Other | 31 (72.1%) | 12 (27.9%) |
| Total | 374 (51.5%) | 352 (48.5%) |
Housing Structures by Number of Rooms in Kennedy
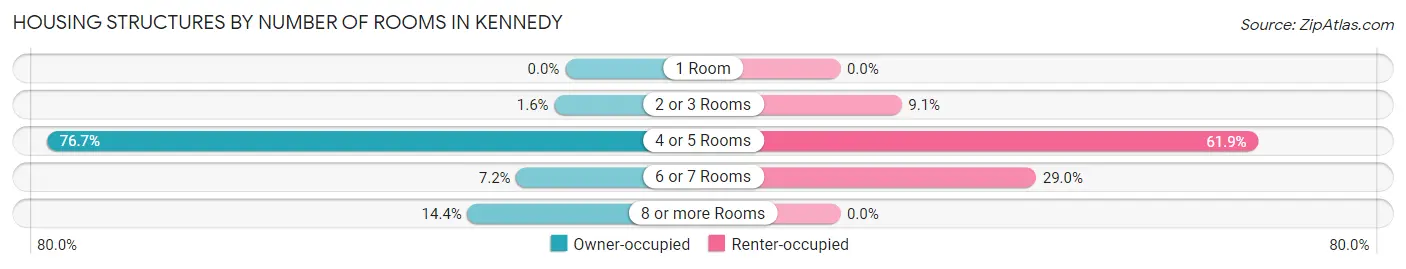
| Number of Rooms | Owner-occupied | Renter-occupied |
| 1 Room | 0 (0.0%) | 0 (0.0%) |
| 2 or 3 Rooms | 6 (1.6%) | 32 (9.1%) |
| 4 or 5 Rooms | 287 (76.7%) | 218 (61.9%) |
| 6 or 7 Rooms | 27 (7.2%) | 102 (29.0%) |
| 8 or more Rooms | 54 (14.4%) | 0 (0.0%) |
| Total | 374 (100.0%) | 352 (100.0%) |
Housing Structure by Heating Type in Kennedy
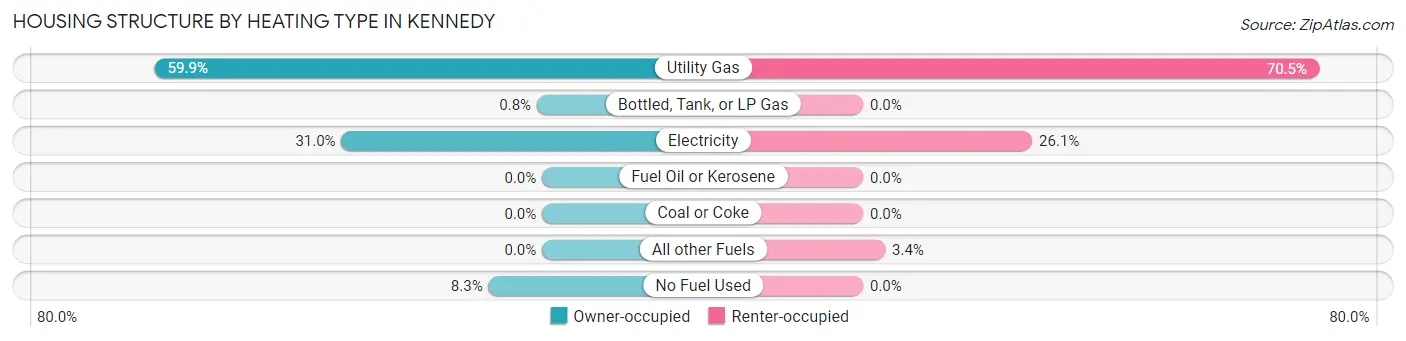
| Heating Type | Owner-occupied | Renter-occupied |
| Utility Gas | 224 (59.9%) | 248 (70.5%) |
| Bottled, Tank, or LP Gas | 3 (0.8%) | 0 (0.0%) |
| Electricity | 116 (31.0%) | 92 (26.1%) |
| Fuel Oil or Kerosene | 0 (0.0%) | 0 (0.0%) |
| Coal or Coke | 0 (0.0%) | 0 (0.0%) |
| All other Fuels | 0 (0.0%) | 12 (3.4%) |
| No Fuel Used | 31 (8.3%) | 0 (0.0%) |
| Total | 374 (100.0%) | 352 (100.0%) |
Household Vehicle Usage in Kennedy
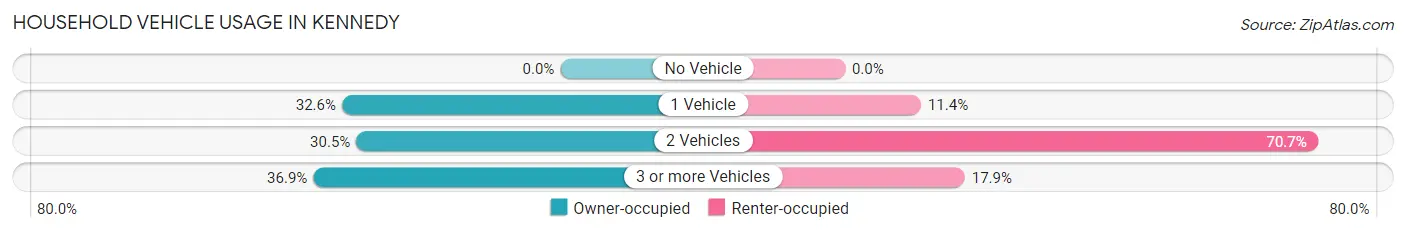
| Vehicles per Household | Owner-occupied | Renter-occupied |
| No Vehicle | 0 (0.0%) | 0 (0.0%) |
| 1 Vehicle | 122 (32.6%) | 40 (11.4%) |
| 2 Vehicles | 114 (30.5%) | 249 (70.7%) |
| 3 or more Vehicles | 138 (36.9%) | 63 (17.9%) |
| Total | 374 (100.0%) | 352 (100.0%) |
Real Estate & Mortgages in Kennedy
Real Estate and Mortgage Overview in Kennedy
| Characteristic | Without Mortgage | With Mortgage |
| Housing Units | 198 | 176 |
| Median Property Value | $191,700 | $345,300 |
| Median Household Income | $50,192 | $5 |
| Monthly Housing Costs | $407 | $28 |
| Real Estate Taxes | $931 | $3 |
Property Value by Mortgage Status in Kennedy
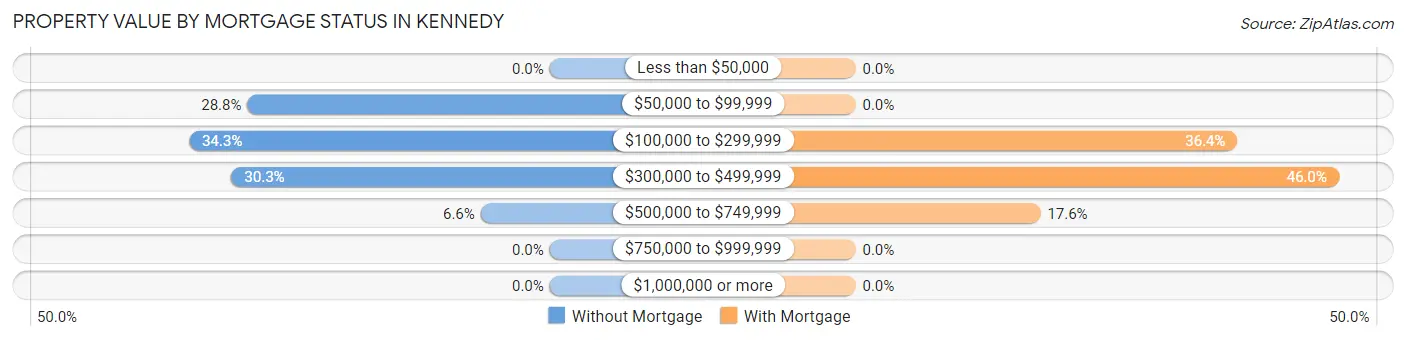
| Property Value | Without Mortgage | With Mortgage |
| Less than $50,000 | 0 (0.0%) | 0 (0.0%) |
| $50,000 to $99,999 | 57 (28.8%) | 0 (0.0%) |
| $100,000 to $299,999 | 68 (34.3%) | 64 (36.4%) |
| $300,000 to $499,999 | 60 (30.3%) | 81 (46.0%) |
| $500,000 to $749,999 | 13 (6.6%) | 31 (17.6%) |
| $750,000 to $999,999 | 0 (0.0%) | 0 (0.0%) |
| $1,000,000 or more | 0 (0.0%) | 0 (0.0%) |
| Total | 198 (100.0%) | 176 (100.0%) |
Household Income by Mortgage Status in Kennedy
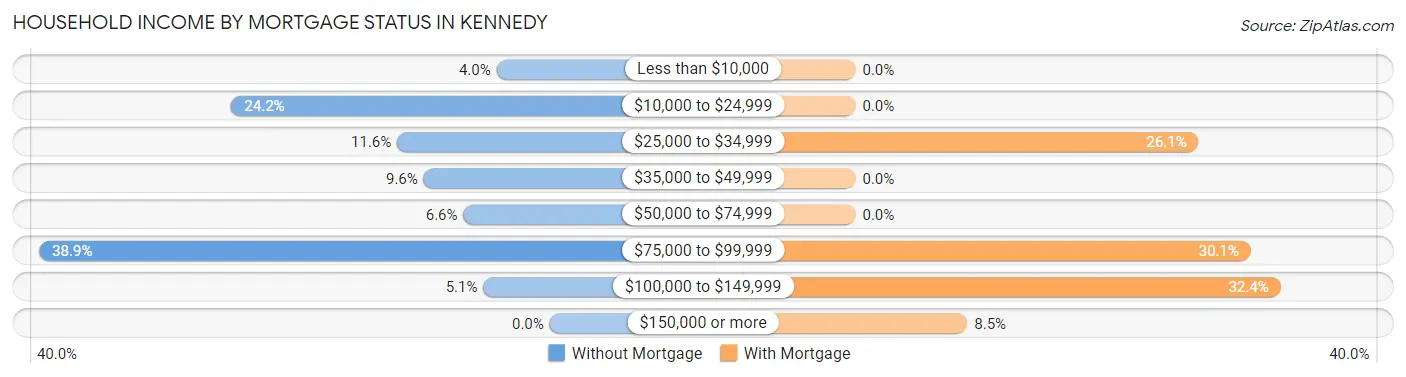
| Household Income | Without Mortgage | With Mortgage |
| Less than $10,000 | 8 (4.0%) | 0 (0.0%) |
| $10,000 to $24,999 | 48 (24.2%) | 0 (0.0%) |
| $25,000 to $34,999 | 23 (11.6%) | 46 (26.1%) |
| $35,000 to $49,999 | 19 (9.6%) | 0 (0.0%) |
| $50,000 to $74,999 | 13 (6.6%) | 0 (0.0%) |
| $75,000 to $99,999 | 77 (38.9%) | 53 (30.1%) |
| $100,000 to $149,999 | 10 (5.1%) | 57 (32.4%) |
| $150,000 or more | 0 (0.0%) | 15 (8.5%) |
| Total | 198 (100.0%) | 176 (100.0%) |
Property Value to Household Income Ratio in Kennedy
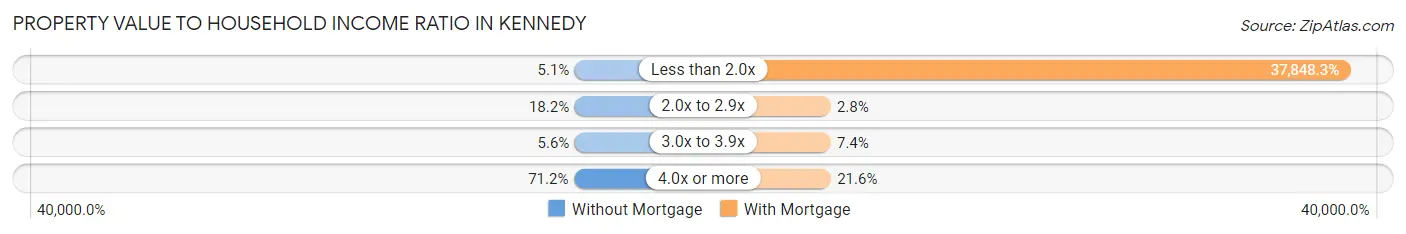
| Value-to-Income Ratio | Without Mortgage | With Mortgage |
| Less than 2.0x | 10 (5.1%) | 66,613 (37,848.3%) |
| 2.0x to 2.9x | 36 (18.2%) | 5 (2.8%) |
| 3.0x to 3.9x | 11 (5.6%) | 13 (7.4%) |
| 4.0x or more | 141 (71.2%) | 38 (21.6%) |
| Total | 198 (100.0%) | 176 (100.0%) |
Real Estate Taxes by Mortgage Status in Kennedy
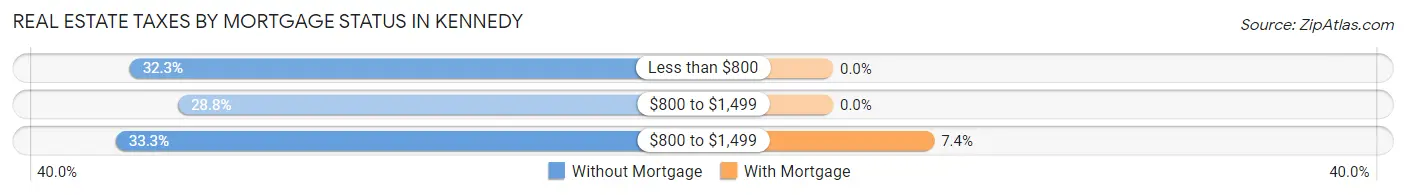
| Property Taxes | Without Mortgage | With Mortgage |
| Less than $800 | 64 (32.3%) | 0 (0.0%) |
| $800 to $1,499 | 57 (28.8%) | 0 (0.0%) |
| $800 to $1,499 | 66 (33.3%) | 13 (7.4%) |
| Total | 198 (100.0%) | 176 (100.0%) |
Health & Disability in Kennedy
Health Insurance Coverage by Age in Kennedy
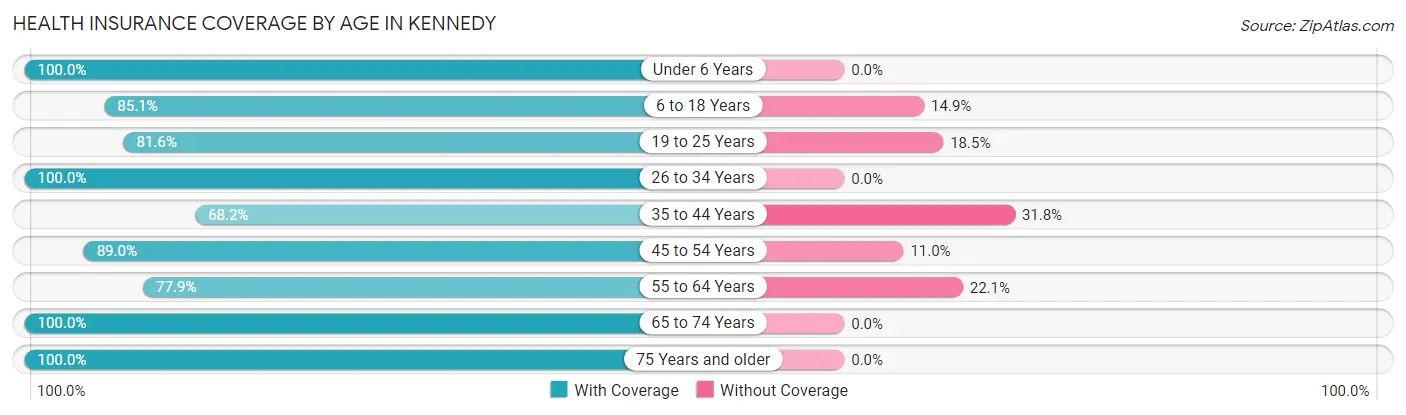
| Age Bracket | With Coverage | Without Coverage |
| Under 6 Years | 277 (100.0%) | 0 (0.0%) |
| 6 to 18 Years | 446 (85.1%) | 78 (14.9%) |
| 19 to 25 Years | 274 (81.6%) | 62 (18.4%) |
| 26 to 34 Years | 190 (100.0%) | 0 (0.0%) |
| 35 to 44 Years | 345 (68.2%) | 161 (31.8%) |
| 45 to 54 Years | 242 (89.0%) | 30 (11.0%) |
| 55 to 64 Years | 141 (77.9%) | 40 (22.1%) |
| 65 to 74 Years | 141 (100.0%) | 0 (0.0%) |
| 75 Years and older | 89 (100.0%) | 0 (0.0%) |
| Total | 2,145 (85.3%) | 371 (14.7%) |
Health Insurance Coverage by Citizenship Status in Kennedy
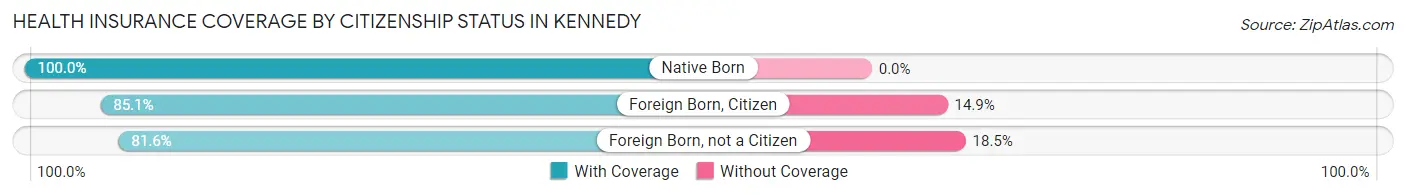
| Citizenship Status | With Coverage | Without Coverage |
| Native Born | 277 (100.0%) | 0 (0.0%) |
| Foreign Born, Citizen | 446 (85.1%) | 78 (14.9%) |
| Foreign Born, not a Citizen | 274 (81.6%) | 62 (18.4%) |
Health Insurance Coverage by Household Income in Kennedy
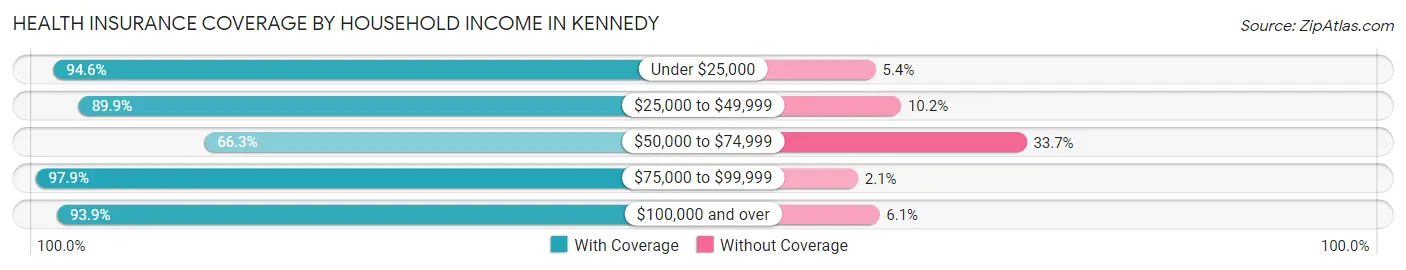
| Household Income | With Coverage | Without Coverage |
| Under $25,000 | 351 (94.6%) | 20 (5.4%) |
| $25,000 to $49,999 | 531 (89.8%) | 60 (10.2%) |
| $50,000 to $74,999 | 471 (66.3%) | 239 (33.7%) |
| $75,000 to $99,999 | 331 (97.9%) | 7 (2.1%) |
| $100,000 and over | 431 (93.9%) | 28 (6.1%) |
Public vs Private Health Insurance Coverage by Age in Kennedy
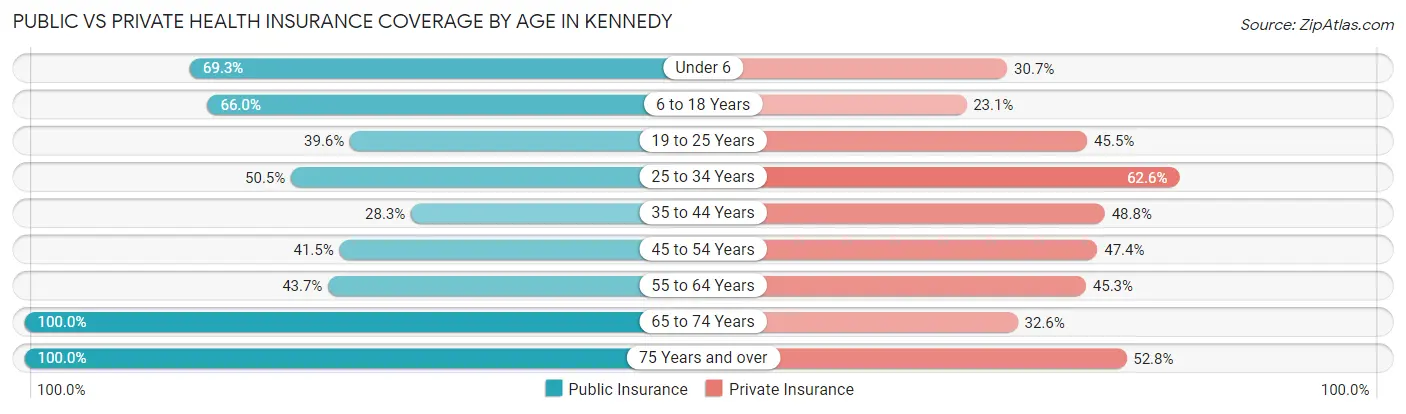
| Age Bracket | Public Insurance | Private Insurance |
| Under 6 | 192 (69.3%) | 85 (30.7%) |
| 6 to 18 Years | 346 (66.0%) | 121 (23.1%) |
| 19 to 25 Years | 133 (39.6%) | 153 (45.5%) |
| 25 to 34 Years | 96 (50.5%) | 119 (62.6%) |
| 35 to 44 Years | 143 (28.3%) | 247 (48.8%) |
| 45 to 54 Years | 113 (41.5%) | 129 (47.4%) |
| 55 to 64 Years | 79 (43.6%) | 82 (45.3%) |
| 65 to 74 Years | 141 (100.0%) | 46 (32.6%) |
| 75 Years and over | 89 (100.0%) | 47 (52.8%) |
| Total | 1,332 (52.9%) | 1,029 (40.9%) |
Disability Status by Sex by Age in Kennedy
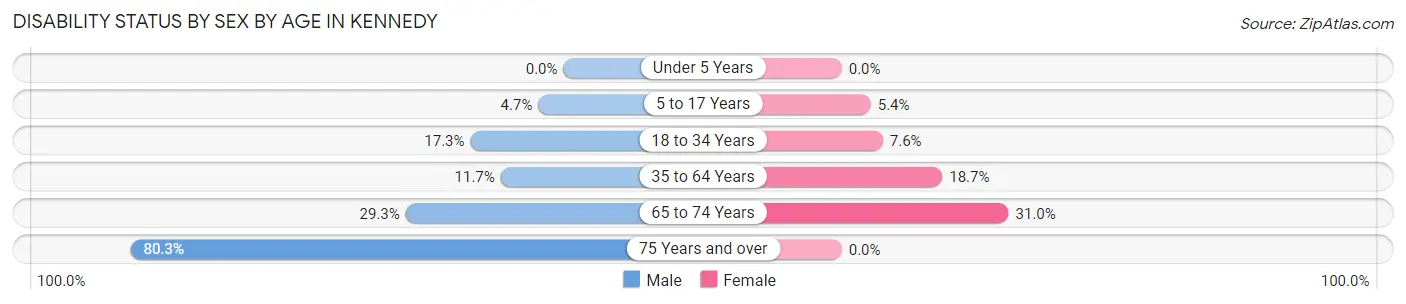
| Age Bracket | Male | Female |
| Under 5 Years | 0 (0.0%) | 0 (0.0%) |
| 5 to 17 Years | 11 (4.7%) | 15 (5.4%) |
| 18 to 34 Years | 58 (17.3%) | 17 (7.6%) |
| 35 to 64 Years | 63 (11.7%) | 78 (18.7%) |
| 65 to 74 Years | 29 (29.3%) | 13 (30.9%) |
| 75 Years and over | 49 (80.3%) | 0 (0.0%) |
Disability Class by Sex by Age in Kennedy
Disability Class: Hearing Difficulty
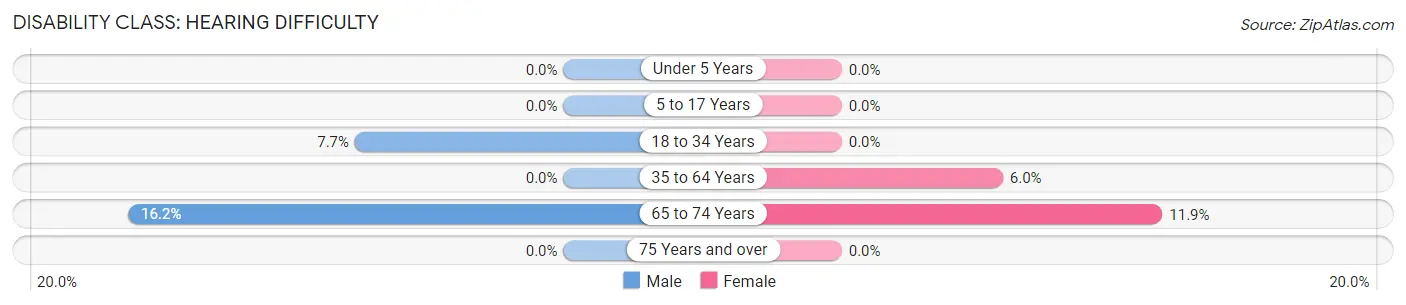
| Age Bracket | Male | Female |
| Under 5 Years | 0 (0.0%) | 0 (0.0%) |
| 5 to 17 Years | 0 (0.0%) | 0 (0.0%) |
| 18 to 34 Years | 26 (7.7%) | 0 (0.0%) |
| 35 to 64 Years | 0 (0.0%) | 25 (6.0%) |
| 65 to 74 Years | 16 (16.2%) | 5 (11.9%) |
| 75 Years and over | 0 (0.0%) | 0 (0.0%) |
Disability Class: Vision Difficulty
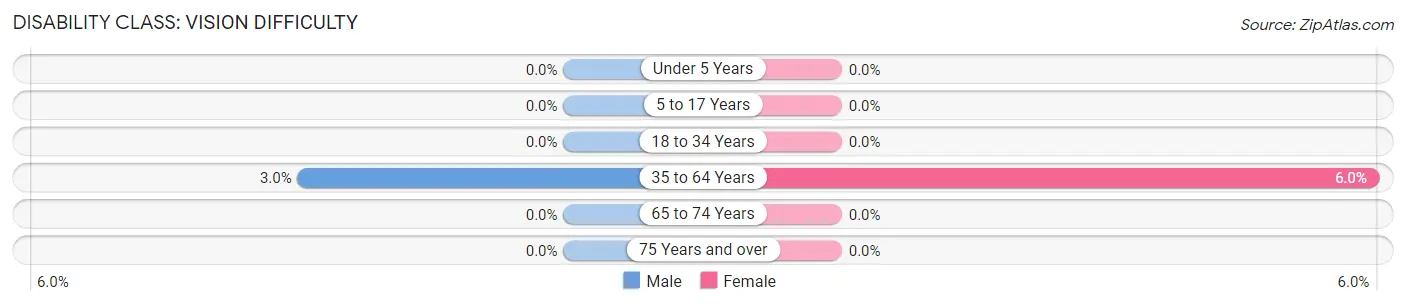
| Age Bracket | Male | Female |
| Under 5 Years | 0 (0.0%) | 0 (0.0%) |
| 5 to 17 Years | 0 (0.0%) | 0 (0.0%) |
| 18 to 34 Years | 0 (0.0%) | 0 (0.0%) |
| 35 to 64 Years | 16 (3.0%) | 25 (6.0%) |
| 65 to 74 Years | 0 (0.0%) | 0 (0.0%) |
| 75 Years and over | 0 (0.0%) | 0 (0.0%) |
Disability Class: Cognitive Difficulty
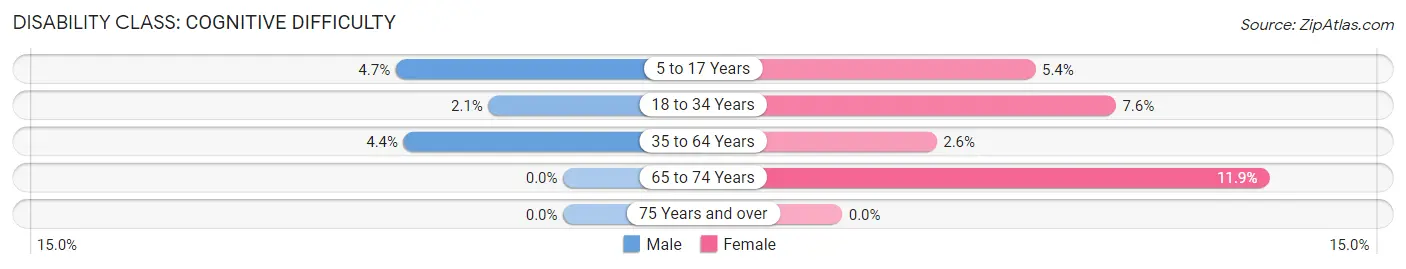
| Age Bracket | Male | Female |
| 5 to 17 Years | 11 (4.7%) | 15 (5.4%) |
| 18 to 34 Years | 7 (2.1%) | 17 (7.6%) |
| 35 to 64 Years | 24 (4.4%) | 11 (2.6%) |
| 65 to 74 Years | 0 (0.0%) | 5 (11.9%) |
| 75 Years and over | 0 (0.0%) | 0 (0.0%) |
Disability Class: Ambulatory Difficulty
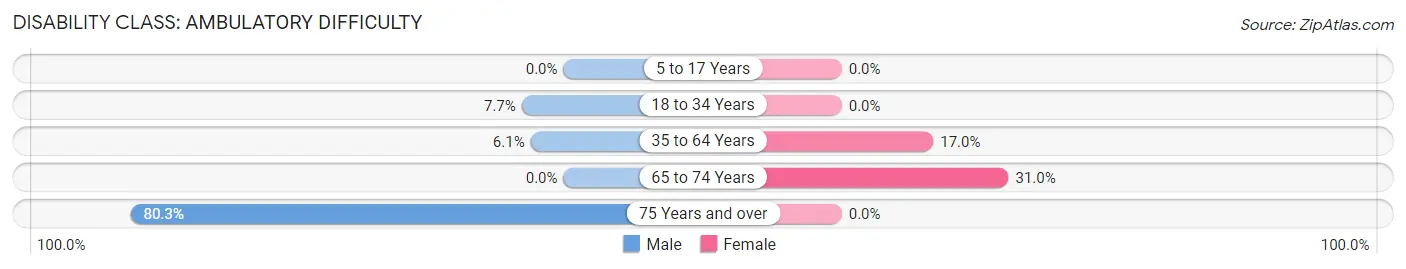
| Age Bracket | Male | Female |
| 5 to 17 Years | 0 (0.0%) | 0 (0.0%) |
| 18 to 34 Years | 26 (7.7%) | 0 (0.0%) |
| 35 to 64 Years | 33 (6.1%) | 71 (17.0%) |
| 65 to 74 Years | 0 (0.0%) | 13 (30.9%) |
| 75 Years and over | 49 (80.3%) | 0 (0.0%) |
Disability Class: Self-Care Difficulty
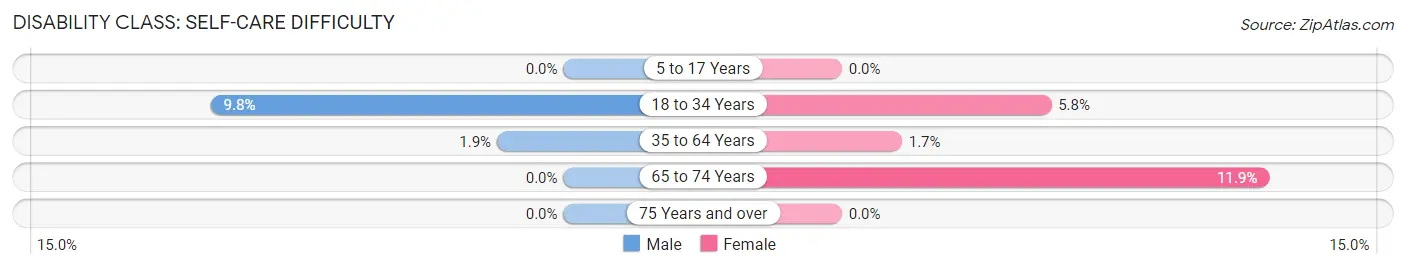
| Age Bracket | Male | Female |
| 5 to 17 Years | 0 (0.0%) | 0 (0.0%) |
| 18 to 34 Years | 33 (9.8%) | 13 (5.8%) |
| 35 to 64 Years | 10 (1.8%) | 7 (1.7%) |
| 65 to 74 Years | 0 (0.0%) | 5 (11.9%) |
| 75 Years and over | 0 (0.0%) | 0 (0.0%) |
Technology Access in Kennedy
Computing Device Access in Kennedy
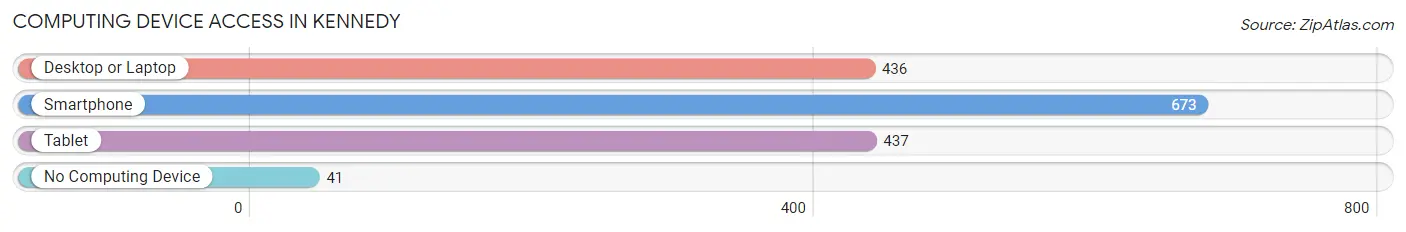
| Device Type | # Households | % Households |
| Desktop or Laptop | 436 | 60.1% |
| Smartphone | 673 | 92.7% |
| Tablet | 437 | 60.2% |
| No Computing Device | 41 | 5.7% |
| Total | 726 | 100.0% |
Internet Access in Kennedy
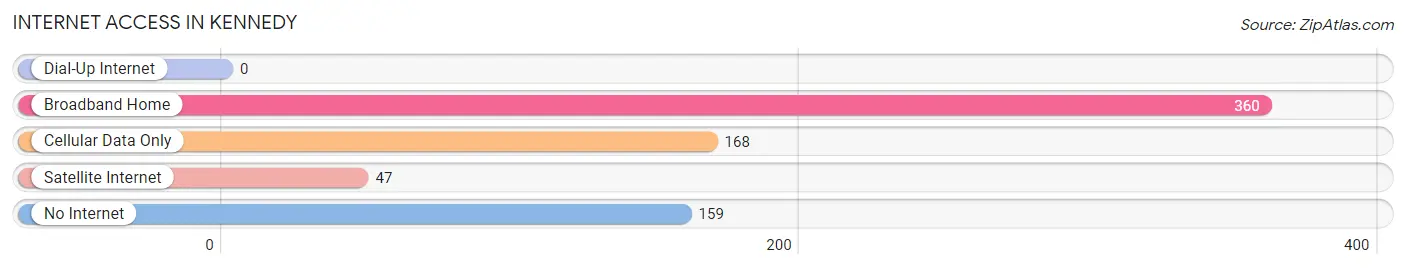
| Internet Type | # Households | % Households |
| Dial-Up Internet | 0 | 0.0% |
| Broadband Home | 360 | 49.6% |
| Cellular Data Only | 168 | 23.1% |
| Satellite Internet | 47 | 6.5% |
| No Internet | 159 | 21.9% |
| Total | 726 | 100.0% |
Kennedy Summary
Kennedy, California is a small unincorporated community located in the Sierra Nevada foothills of Tuolumne County. It is situated in the foothills of the Sierra Nevada Mountains, approximately 25 miles east of Sonora and 30 miles west of Yosemite National Park. The population of Kennedy is estimated to be around 200 people.
History
Kennedy was founded in 1852 by a group of miners who were searching for gold in the area. The town was named after the Kennedy brothers, who were among the first settlers in the area. The town was originally a mining camp, but it soon became a popular stop for travelers and settlers heading to the gold fields of California.
In the late 1800s, Kennedy was a bustling town with a population of over 1,000 people. It had a post office, a school, a hotel, a general store, and several saloons. The town was also home to a number of businesses, including a blacksmith, a livery stable, and a stagecoach line.
In the early 1900s, the population of Kennedy began to decline as the gold rush ended and the town’s economy shifted to logging and ranching. By the 1950s, the population had dwindled to just a few hundred people.
Geography
Kennedy is located in the Sierra Nevada foothills of Tuolumne County. It is situated in the foothills of the Sierra Nevada Mountains, approximately 25 miles east of Sonora and 30 miles west of Yosemite National Park. The town is surrounded by rolling hills and is situated at an elevation of 2,400 feet.
The climate in Kennedy is mild and temperate, with hot summers and cold winters. The average annual temperature is around 60 degrees Fahrenheit. The average annual precipitation is around 20 inches.
Economy
The economy of Kennedy is largely based on tourism and agriculture. The town is a popular destination for hikers, campers, and other outdoor enthusiasts. There are several campgrounds and recreational areas in the area, as well as a number of restaurants and shops.
Agriculture is also an important part of the local economy. The area is known for its apples, pears, and other fruits. There are also several wineries in the area, as well as a number of small farms.
Demographics
The population of Kennedy is estimated to be around 200 people. The town is predominantly white, with a small Hispanic population. The median household income is around $50,000. The median age is around 40 years old.
Common Questions
What is the Total Population of Kennedy?
Total Population of Kennedy is 2,516.
What is the Total Male Population of Kennedy?
Total Male Population of Kennedy is 1,346.
What is the Total Female Population of Kennedy?
Total Female Population of Kennedy is 1,170.
What is the Ratio of Males per 100 Females in Kennedy?
There are 115.04 Males per 100 Females in Kennedy.
What is the Ratio of Females per 100 Males in Kennedy?
There are 86.92 Females per 100 Males in Kennedy.
What is the Median Population Age in Kennedy?
Median Population Age in Kennedy is 28.6 Years.
What is the Average Family Size in Kennedy
Average Family Size in Kennedy is 3.9 People.
What is the Average Household Size in Kennedy
Average Household Size in Kennedy is 3.4 People.
What is Per Capita Income in Kennedy?
Per Capita income in Kennedy is $19,081.
What is the Median Family Income in Kennedy?
Median Family Income in Kennedy is $54,583.
What is the Median Household income in Kennedy?
Median Household Income in Kennedy is $55,337.
What is Income or Wage Gap in Kennedy?
Income or Wage Gap in Kennedy is 38.7%.
Women in Kennedy earn 61.3 cents for every dollar earned by a man.
What is Inequality or Gini Index in Kennedy?
Inequality or Gini Index in Kennedy is 0.36.
How Large is the Labor Force in Kennedy?
There are 1,038 People in the Labor Forcein in Kennedy.
What is the Percentage of People in the Labor Force in Kennedy?
58.6% of People are in the Labor Force in Kennedy.
What is the Unemployment Rate in Kennedy?
Unemployment Rate in Kennedy is 8.7%.