Zip Codes with the Highest Percentage of Trinidadian and Tobagonian Population in Inglewood, CA

RELATED REPORTS & OPTIONS

Trinidadian and Tobagonian
Population
Families and Households
Female Fertility
Female Fertility (Unmarried)
Race (Community Size)
Race (Percentage)
Ancestry (Community Size)
AfricanAmericanApacheArabArgentineanArmenianAustrianBasqueBelizeanBhutaneseBlackfeetBolivianBrazilianBritishBritish West IndianBurmeseCentral AmericanCentral American IndianCherokeeChileanColombianCosta RicanCroatianCubanCzechDanishDominicanDutchEastern EuropeanEcuadorianEgyptianEnglishEthiopianEuropeanFrenchFrench CanadianGermanGhanaianGuatemalanGuyaneseHaitianHonduranHungarianIndian (Asian)IranianIrishIsraeliItalianJamaicanJapaneseKenyanKoreanLaotianLatvianLebaneseMexicanMexican American IndianMoroccanNative HawaiianNavajoNicaraguanNigerianNorwegianPakistaniPanamanianPeruvianPolishPortuguesePuerto RicanRussianSalvadoranSamoanScotch-IrishScottishSouth AmericanSouth American IndianSpaniardSpanishSri LankanSubsaharan AfricanSwedishThaiTrinidadian and TobagonianUkrainianVenezuelanVietnameseWest Indian
Ancestry (Percentage)
AfricanAmericanApacheArabArgentineanArmenianAustrianBasqueBelizeanBhutaneseBlackfeetBolivianBrazilianBritishBritish West IndianBurmeseCentral AmericanCentral American IndianCherokeeChileanColombianCosta RicanCroatianCubanCzechDanishDominicanDutchEastern EuropeanEcuadorianEgyptianEnglishEthiopianEuropeanFrenchFrench CanadianGermanGhanaianGuatemalanGuyaneseHaitianHonduranHungarianIndian (Asian)IranianIrishIsraeliItalianJamaicanJapaneseKenyanKoreanLaotianLatvianLebaneseMexicanMexican American IndianMoroccanNative HawaiianNavajoNicaraguanNigerianNorwegianPakistaniPanamanianPeruvianPolishPortuguesePuerto RicanRussianSalvadoranSamoanScotch-IrishScottishSouth AmericanSouth American IndianSpaniardSpanishSri LankanSubsaharan AfricanSwedishThaiTrinidadian and TobagonianUkrainianVenezuelanVietnameseWest Indian
Immigrant Origin (Total)
Immigrant Origin (Percentage)
Income
Income (Families)
Income (Households)
Poverty
Poverty (Families)
Unemployment
Employment Occupations
Employment Industries
Employer Class
Commute Time
Commute Means
School Enrollment
Education by Degree Field
Occupancy
Finances
Physical Characteristics
Inglewood
Compare Zip Codes
Comparison Subject

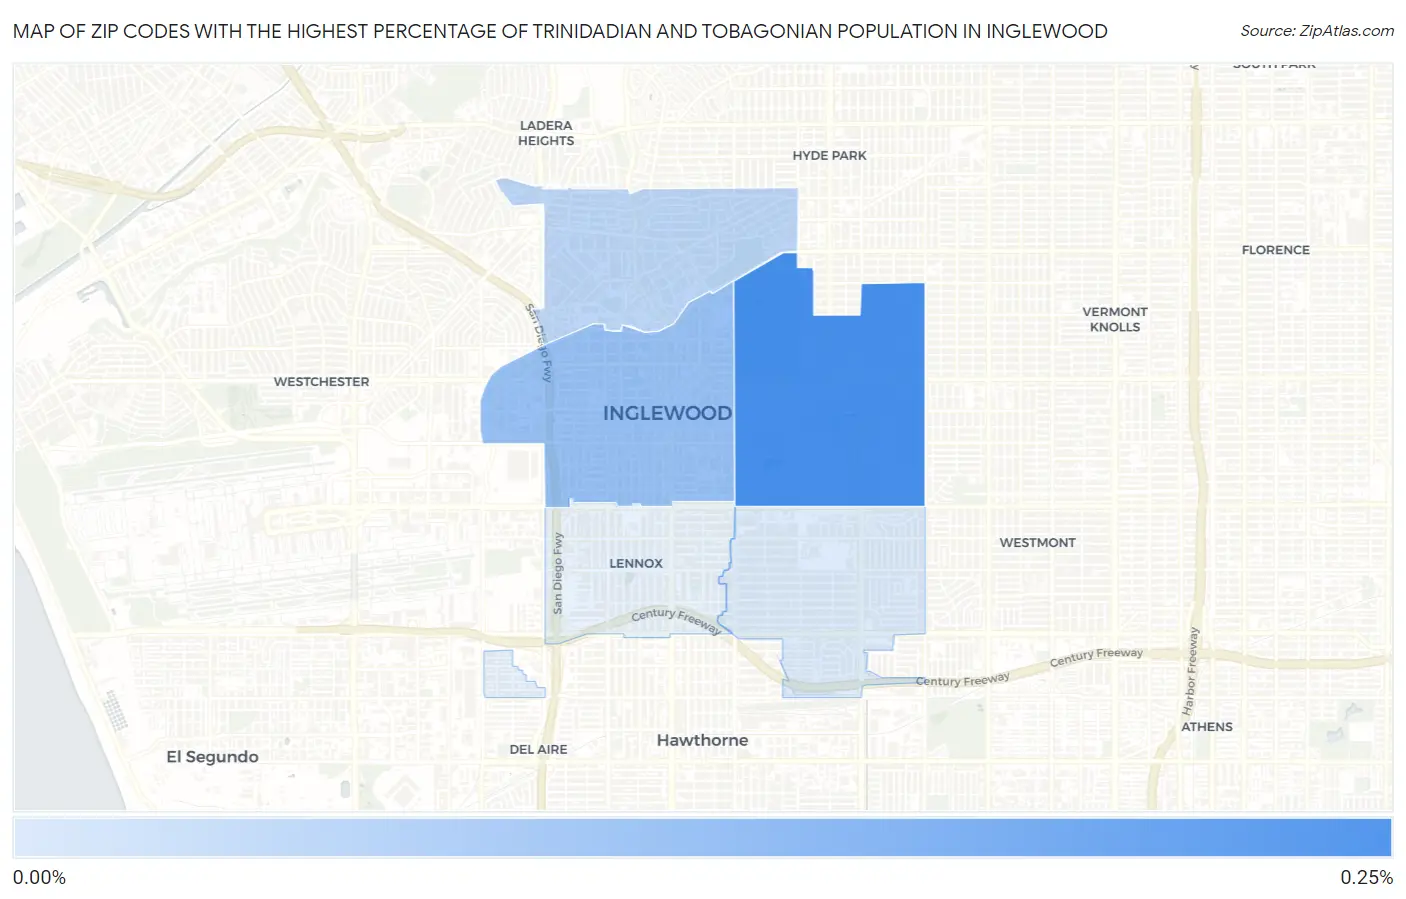
Map of Zip Codes with the Highest Percentage of Trinidadian and Tobagonian Population in Inglewood

0.00%
0.25%
Zip Codes with the Highest Percentage of Trinidadian and Tobagonian Population in Inglewood Map

Zip Codes with the Highest Percentage of Trinidadian and Tobagonian Population in Inglewood, CA

Zip Code Trinidadian and Tobagonian vs State vs National
1.903050.22%0.017%(+0.208)#210.071%(+0.154)#911
2.903010.13%0.017%(+0.109)#440.071%(+0.055)#1,409
3.903020.078%0.017%(+0.062)#700.071%(+0.008)#1,824
4.903030.039%0.017%(+0.022)#1360.071%(-0.032)#2,386

Common Questions

What are the Top 3 Zip Codes with the Highest Percentage of Trinidadian and Tobagonian Population in Inglewood, CA?
Top 3 Zip Codes with the Highest Percentage of Trinidadian and Tobagonian Population in Inglewood, CA are:
#1
0.22%
#2
0.13%
#3
0.078%
What zip code has the Highest Percentage of Trinidadian and Tobagonian Population in Inglewood, CA?
90305 has the Highest Percentage of Trinidadian and Tobagonian Population in Inglewood, CA with 0.22%.
What is the Percentage of Trinidadian and Tobagonian Population in Inglewood, CA?
Percentage of Trinidadian and Tobagonian Population in Inglewood is 0.10%.
What is the Percentage of Trinidadian and Tobagonian Population in California?
Percentage of Trinidadian and Tobagonian Population in California is 0.017%.
What is the Percentage of Trinidadian and Tobagonian Population in the United States?
Percentage of Trinidadian and Tobagonian Population in the United States is 0.071%.