Happy Camp, CA
Happy Camp Map
Happy Camp Overview
679
TOTAL POPULATION
364
MALE POPULATION
315
FEMALE POPULATION
115.56
MALES / 100 FEMALES
86.54
FEMALES / 100 MALES
59.7
MEDIAN AGE
2.5
AVG FAMILY SIZE
2.0
AVG HOUSEHOLD SIZE
$27,297
PER CAPITA INCOME
$40,795
AVG FAMILY INCOME
$37,841
AVG HOUSEHOLD INCOME
36.9%
WAGE / INCOME GAP [ % ]
63.1¢/ $1
WAGE / INCOME GAP [ $ ]
0.56
INEQUALITY / GINI INDEX
263
LABOR FORCE [ PEOPLE ]
45.3%
PERCENT IN LABOR FORCE
26.6%
UNEMPLOYMENT RATE
Happy Camp Zip Codes
Happy Camp Area Codes
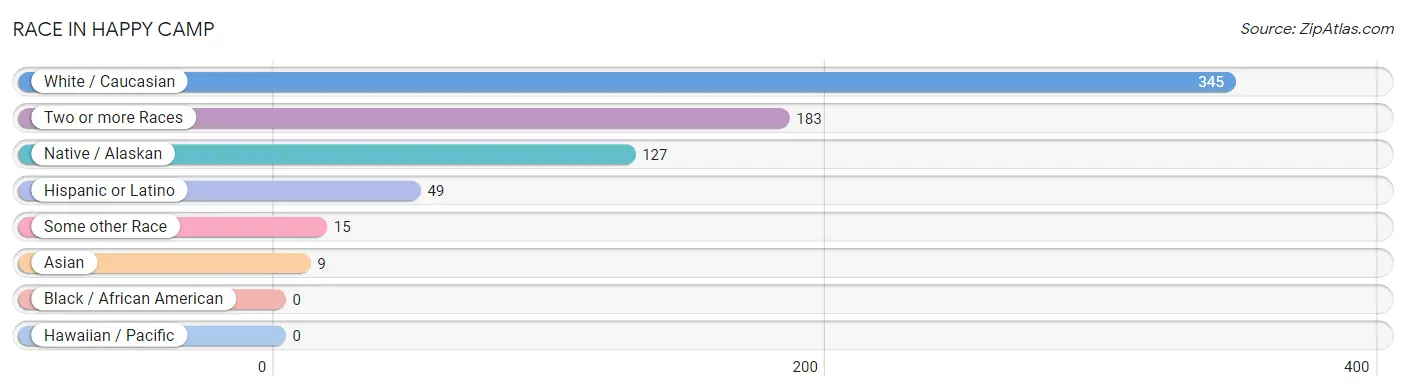
Race in Happy Camp
The most populous races in Happy Camp are White / Caucasian (345 | 50.8%), Two or more Races (183 | 27.0%), and Native / Alaskan (127 | 18.7%).
| Race | # Population | % Population |
| Asian | 9 | 1.3% |
| Black / African American | 0 | 0.0% |
| Hawaiian / Pacific | 0 | 0.0% |
| Hispanic or Latino | 49 | 7.2% |
| Native / Alaskan | 127 | 18.7% |
| White / Caucasian | 345 | 50.8% |
| Two or more Races | 183 | 27.0% |
| Some other Race | 15 | 2.2% |
| Total | 679 | 100.0% |
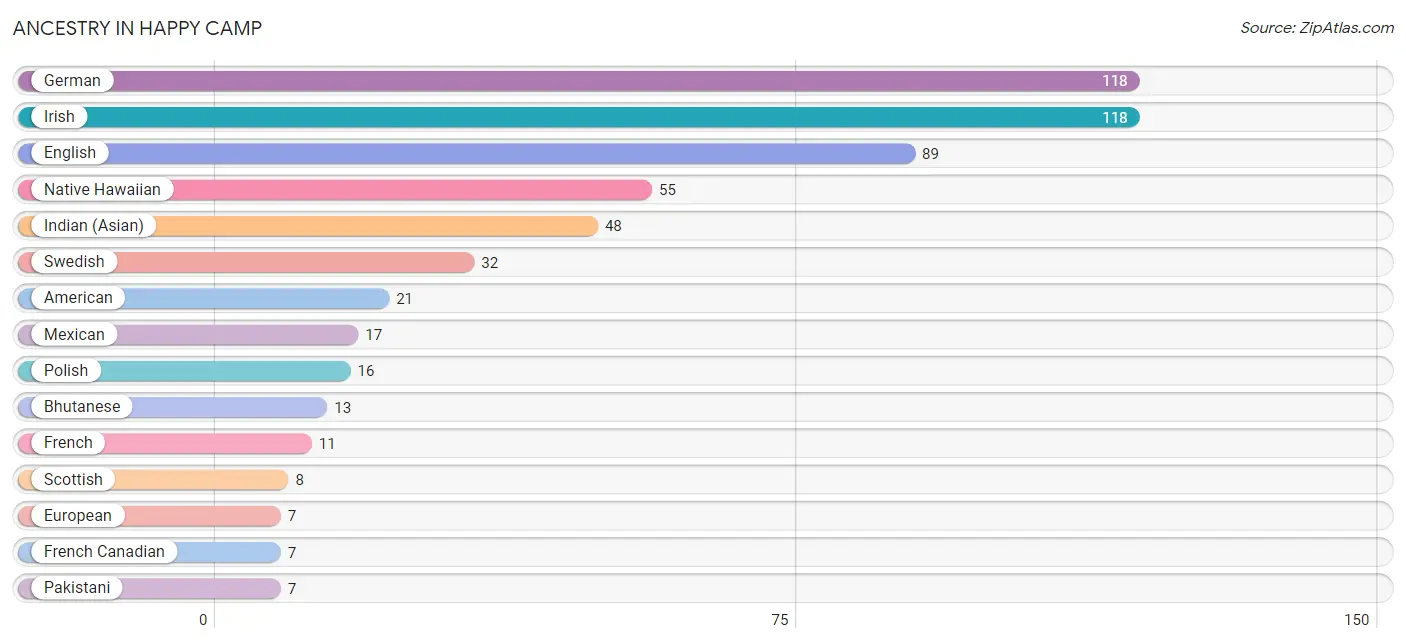
Ancestry in Happy Camp
The most populous ancestries reported in Happy Camp are German (118 | 17.4%), Irish (118 | 17.4%), English (89 | 13.1%), Native Hawaiian (55 | 8.1%), and Indian (Asian) (48 | 7.1%), together accounting for 63.0% of all Happy Camp residents.
| Ancestry | # Population | % Population |
| American | 21 | 3.1% |
| Bhutanese | 13 | 1.9% |
| Canadian | 1 | 0.2% |
| Central American | 2 | 0.3% |
| Chickasaw | 5 | 0.7% |
| Costa Rican | 2 | 0.3% |
| Dominican | 2 | 0.3% |
| Dutch | 3 | 0.4% |
| English | 89 | 13.1% |
| European | 7 | 1.0% |
| French | 11 | 1.6% |
| French Canadian | 7 | 1.0% |
| German | 118 | 17.4% |
| Indian (Asian) | 48 | 7.1% |
| Inupiat | 2 | 0.3% |
| Irish | 118 | 17.4% |
| Italian | 4 | 0.6% |
| Korean | 2 | 0.3% |
| Lithuanian | 3 | 0.4% |
| Mexican | 17 | 2.5% |
| Native Hawaiian | 55 | 8.1% |
| Norwegian | 6 | 0.9% |
| Pakistani | 7 | 1.0% |
| Polish | 16 | 2.4% |
| Puerto Rican | 1 | 0.2% |
| Scotch-Irish | 3 | 0.4% |
| Scottish | 8 | 1.2% |
| Sioux | 6 | 0.9% |
| Spaniard | 2 | 0.3% |
| Swedish | 32 | 4.7% |
| Welsh | 4 | 0.6% | View All 31 Rows |
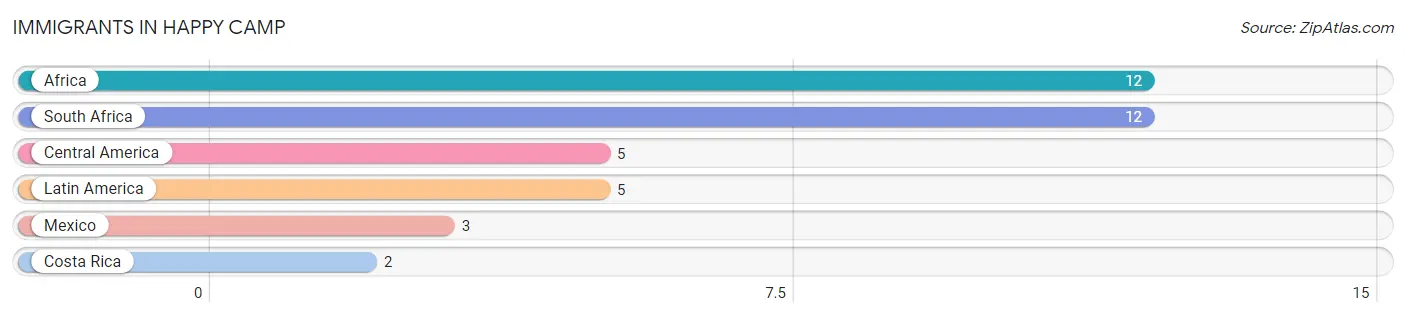
Immigrants in Happy Camp
The most numerous immigrant groups reported in Happy Camp came from Africa (12 | 1.8%), South Africa (12 | 1.8%), Central America (5 | 0.7%), Latin America (5 | 0.7%), and Mexico (3 | 0.4%), together accounting for 5.5% of all Happy Camp residents.
| Immigration Origin | # Population | % Population |
| Africa | 12 | 1.8% |
| Central America | 5 | 0.7% |
| Costa Rica | 2 | 0.3% |
| Latin America | 5 | 0.7% |
| Mexico | 3 | 0.4% |
| South Africa | 12 | 1.8% | View All 6 Rows |
Sex and Age in Happy Camp
Sex and Age in Happy Camp
The most populous age groups in Happy Camp are 60 to 64 Years (81 | 22.3%) for men and 60 to 64 Years (55 | 17.5%) for women.
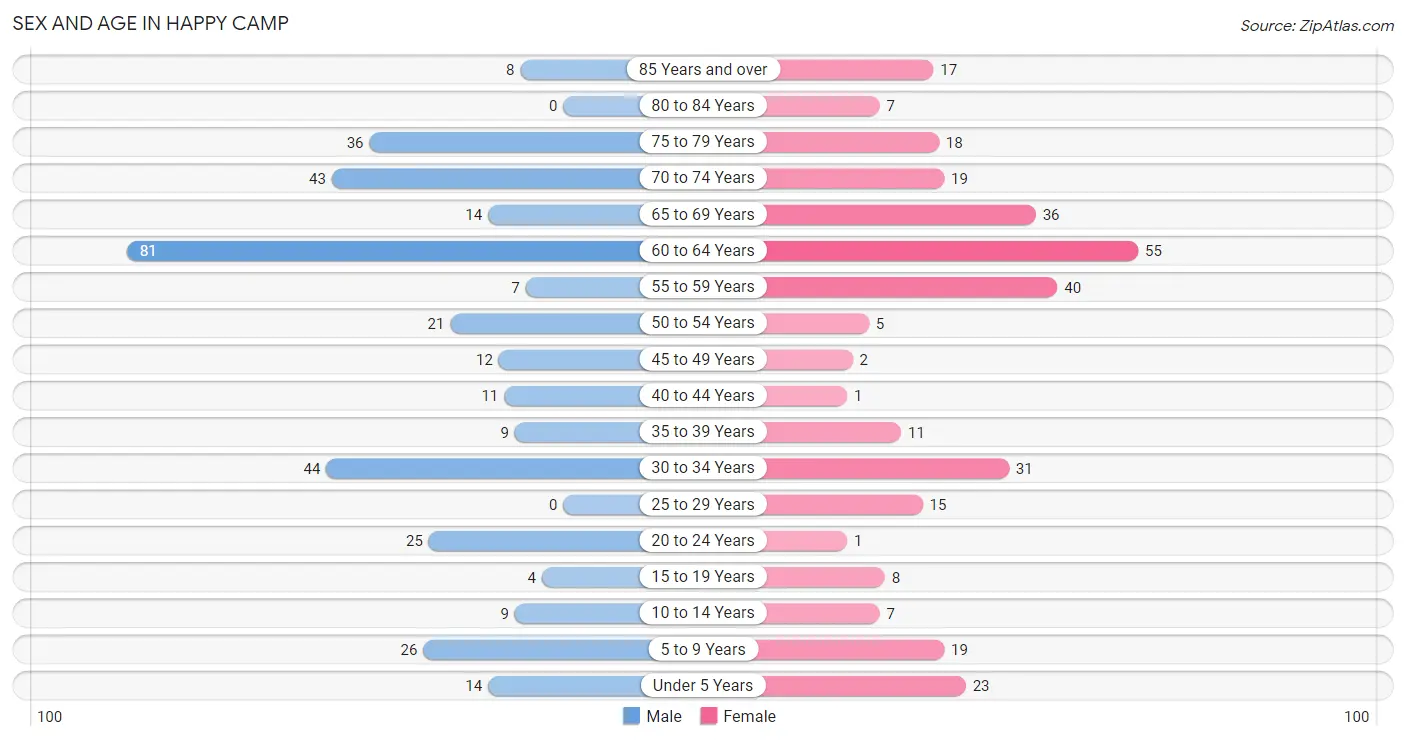
| Age Bracket | Male | Female |
| Under 5 Years | 14 (3.8%) | 23 (7.3%) |
| 5 to 9 Years | 26 (7.1%) | 19 (6.0%) |
| 10 to 14 Years | 9 (2.5%) | 7 (2.2%) |
| 15 to 19 Years | 4 (1.1%) | 8 (2.5%) |
| 20 to 24 Years | 25 (6.9%) | 1 (0.3%) |
| 25 to 29 Years | 0 (0.0%) | 15 (4.8%) |
| 30 to 34 Years | 44 (12.1%) | 31 (9.8%) |
| 35 to 39 Years | 9 (2.5%) | 11 (3.5%) |
| 40 to 44 Years | 11 (3.0%) | 1 (0.3%) |
| 45 to 49 Years | 12 (3.3%) | 2 (0.6%) |
| 50 to 54 Years | 21 (5.8%) | 5 (1.6%) |
| 55 to 59 Years | 7 (1.9%) | 40 (12.7%) |
| 60 to 64 Years | 81 (22.3%) | 55 (17.5%) |
| 65 to 69 Years | 14 (3.8%) | 36 (11.4%) |
| 70 to 74 Years | 43 (11.8%) | 19 (6.0%) |
| 75 to 79 Years | 36 (9.9%) | 18 (5.7%) |
| 80 to 84 Years | 0 (0.0%) | 7 (2.2%) |
| 85 Years and over | 8 (2.2%) | 17 (5.4%) |
| Total | 364 (100.0%) | 315 (100.0%) |
Families and Households in Happy Camp
Median Family Size in Happy Camp
The median family size in Happy Camp is 2.53 persons per family, with single male/father families (16 | 10.0%) accounting for the largest median family size of 2.69 persons per family. On the other hand, single female/mother families (36 | 22.5%) represent the smallest median family size with 2.42 persons per family.

| Family Type | # Families | Family Size |
| Married-Couple | 108 (67.5%) | 2.55 |
| Single Male/Father | 16 (10.0%) | 2.69 |
| Single Female/Mother | 36 (22.5%) | 2.42 |
| Total Families | 160 (100.0%) | 2.53 |
Median Household Size in Happy Camp
The median household size in Happy Camp is 1.96 persons per household, with single male/father households (16 | 4.7%) accounting for the largest median household size of 3.63 persons per household. non-family households (180 | 52.9%) represent the smallest median household size with 1.29 persons per household.
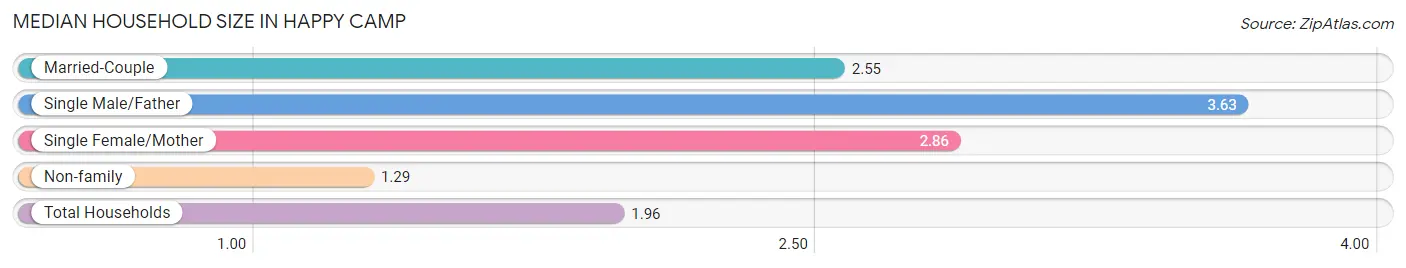
| Household Type | # Households | Household Size |
| Married-Couple | 108 (31.8%) | 2.55 |
| Single Male/Father | 16 (4.7%) | 3.63 |
| Single Female/Mother | 36 (10.6%) | 2.86 |
| Non-family | 180 (52.9%) | 1.29 |
| Total Households | 340 (100.0%) | 1.96 |
Household Size by Marriage Status in Happy Camp
Out of a total of 340 households in Happy Camp, 160 (47.1%) are family households, while 180 (52.9%) are nonfamily households. The most numerous type of family households are 2-person households, comprising 111, and the most common type of nonfamily households are 1-person households, comprising 136.
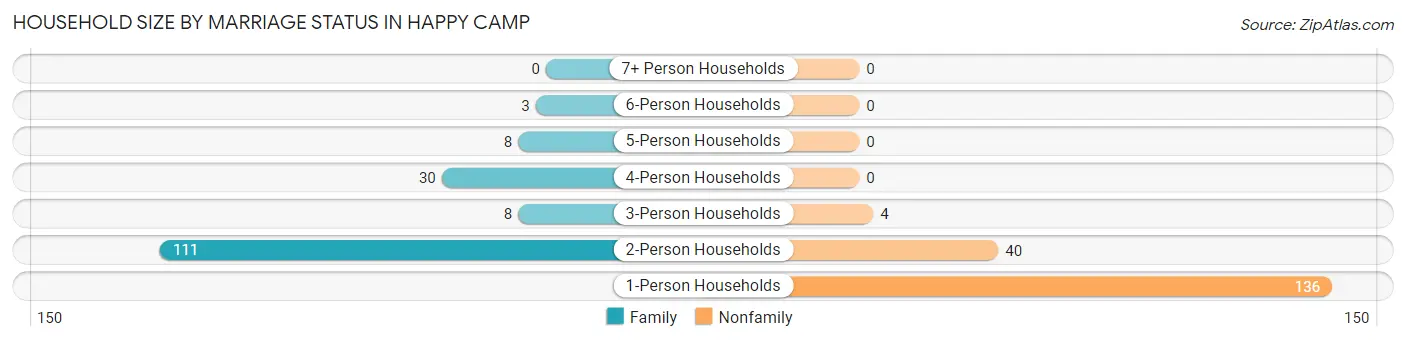
| Household Size | Family Households | Nonfamily Households |
| 1-Person Households | - | 136 (40.0%) |
| 2-Person Households | 111 (32.7%) | 40 (11.8%) |
| 3-Person Households | 8 (2.4%) | 4 (1.2%) |
| 4-Person Households | 30 (8.8%) | 0 (0.0%) |
| 5-Person Households | 8 (2.4%) | 0 (0.0%) |
| 6-Person Households | 3 (0.9%) | 0 (0.0%) |
| 7+ Person Households | 0 (0.0%) | 0 (0.0%) |
| Total | 160 (47.1%) | 180 (52.9%) |
Female Fertility in Happy Camp
Fertility by Age in Happy Camp
Average fertility rate in Happy Camp is 81.0 births per 1,000 women. Women in the age bracket of 20 to 34 years have the highest fertility rate with 128.0 births per 1,000 women. Women in the age bracket of 20 to 34 years acount for 100.0% of all women with births.
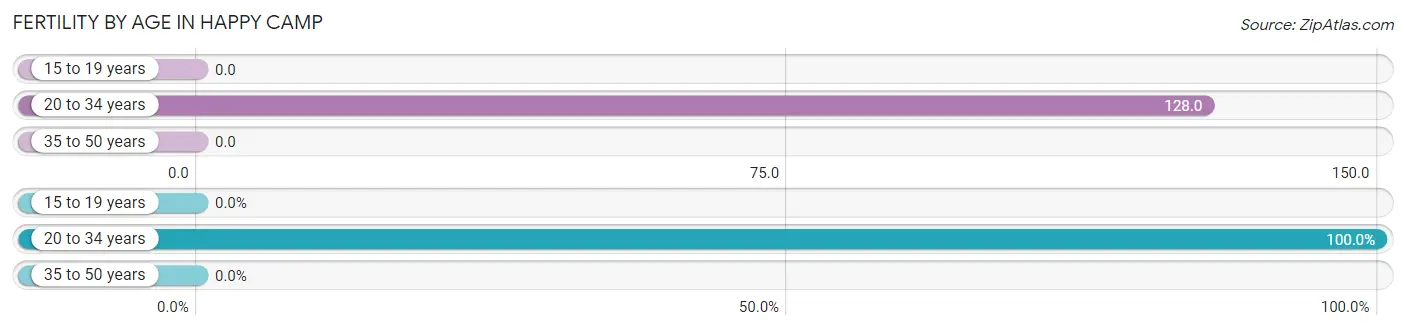
| Age Bracket | Women with Births | Births / 1,000 Women |
| 15 to 19 years | 0 (0.0%) | 0.0 |
| 20 to 34 years | 6 (100.0%) | 128.0 |
| 35 to 50 years | 0 (0.0%) | 0.0 |
| Total | 6 (100.0%) | 81.0 |
Fertility by Age by Marriage Status in Happy Camp
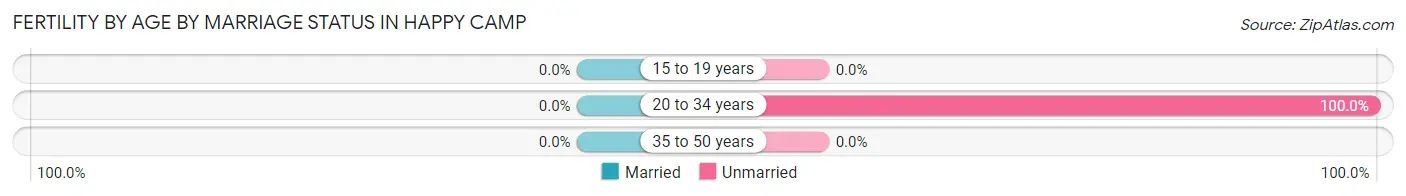
| Age Bracket | Married | Unmarried |
| 15 to 19 years | 0 (0.0%) | 0 (0.0%) |
| 20 to 34 years | 0 (0.0%) | 6 (100.0%) |
| 35 to 50 years | 0 (0.0%) | 0 (0.0%) |
| Total | 0 (0.0%) | 6 (100.0%) |
Fertility by Education in Happy Camp
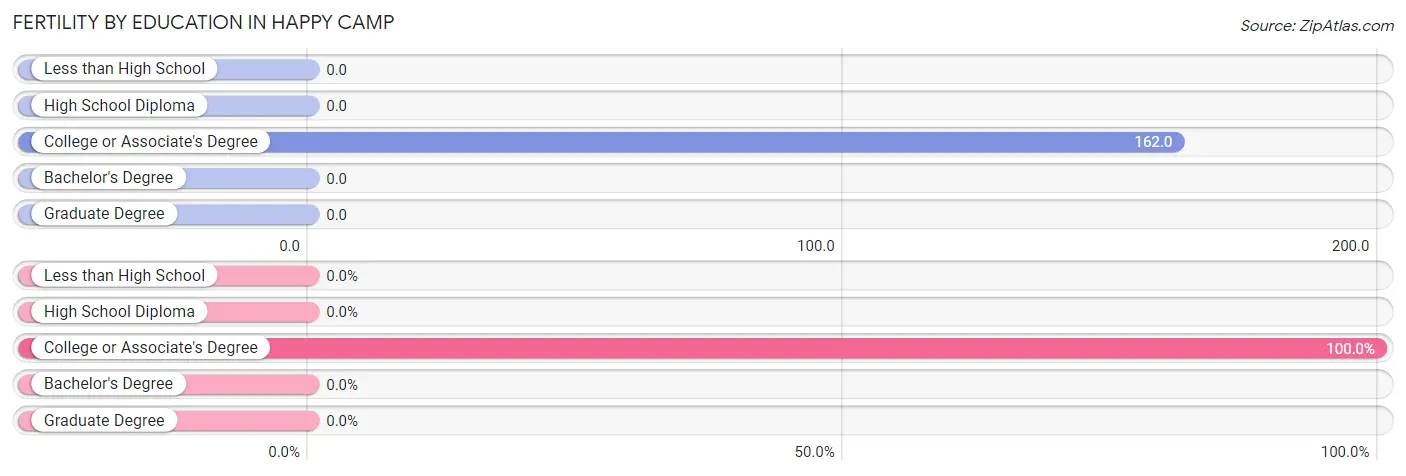
| Educational Attainment | Women with Births | Births / 1,000 Women |
| Less than High School | 0 (0.0%) | 0.0 |
| High School Diploma | 0 (0.0%) | 0.0 |
| College or Associate's Degree | 6 (100.0%) | 162.0 |
| Bachelor's Degree | 0 (0.0%) | 0.0 |
| Graduate Degree | 0 (0.0%) | 0.0 |
| Total | 6 (100.0%) | 81.0 |
Fertility by Education by Marriage Status in Happy Camp
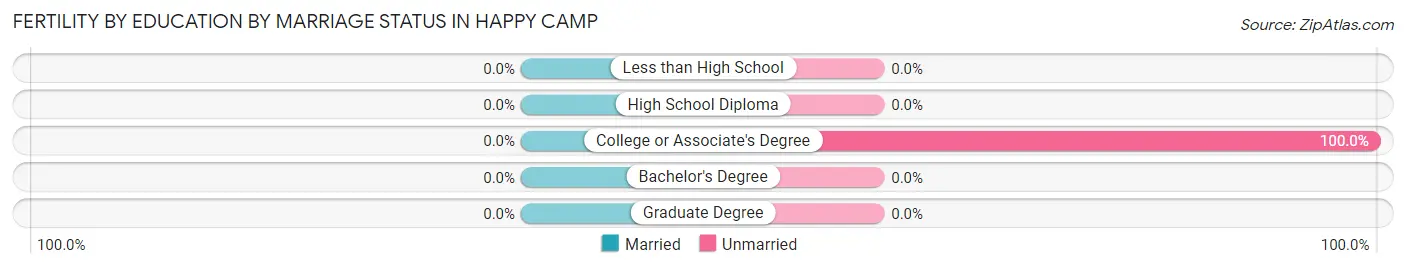
| Educational Attainment | Married | Unmarried |
| Less than High School | 0 (0.0%) | 0 (0.0%) |
| High School Diploma | 0 (0.0%) | 0 (0.0%) |
| College or Associate's Degree | 0 (0.0%) | 6 (100.0%) |
| Bachelor's Degree | 0 (0.0%) | 0 (0.0%) |
| Graduate Degree | 0 (0.0%) | 0 (0.0%) |
| Total | 0 (0.0%) | 6 (100.0%) |
Income in Happy Camp
Income Overview in Happy Camp
Per Capita Income in Happy Camp is $27,297, while median incomes of families and households are $40,795 and $37,841 respectively.
| Characteristic | Number | Measure |
| Per Capita Income | 679 | $27,297 |
| Median Family Income | 160 | $40,795 |
| Mean Family Income | 160 | $51,941 |
| Median Household Income | 340 | $37,841 |
| Mean Household Income | 340 | $53,221 |
| Income Deficit | 160 | $0 |
| Wage / Income Gap (%) | 679 | 36.87% |
| Wage / Income Gap ($) | 679 | 63.13¢ per $1 |
| Gini / Inequality Index | 679 | 0.56 |
Earnings by Sex in Happy Camp
Average Earnings in Happy Camp are $21,429, $23,393 for men and $14,769 for women, a difference of 36.9%.
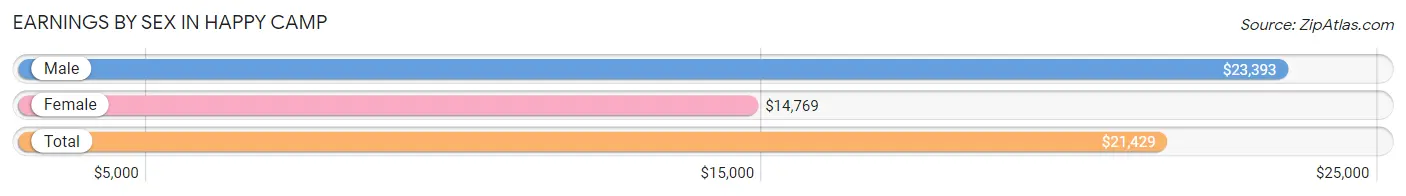
| Sex | Number | Average Earnings |
| Male | 167 (55.7%) | $23,393 |
| Female | 133 (44.3%) | $14,769 |
| Total | 300 (100.0%) | $21,429 |
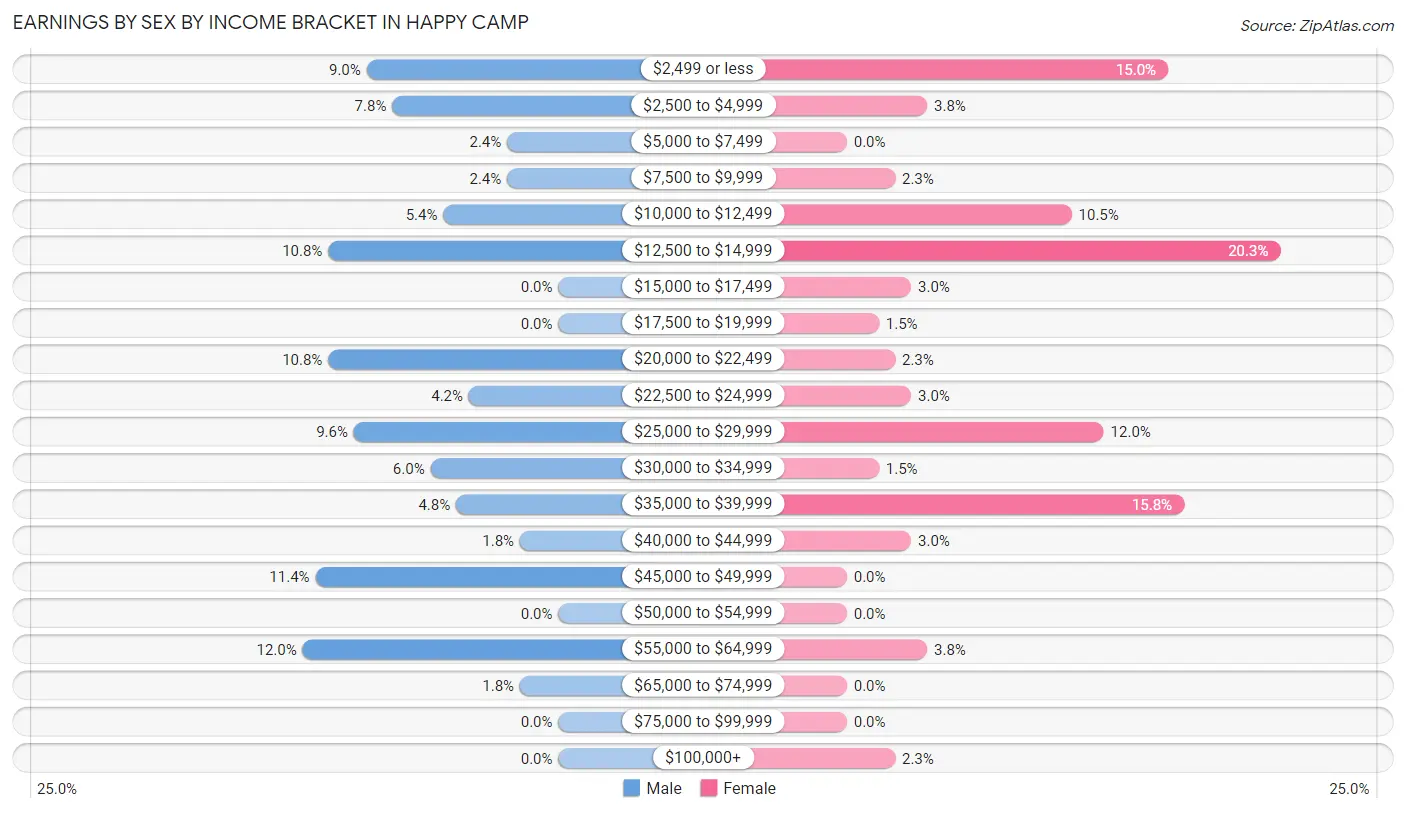
Earnings by Sex by Income Bracket in Happy Camp
The most common earnings brackets in Happy Camp are $55,000 to $64,999 for men (20 | 12.0%) and $12,500 to $14,999 for women (27 | 20.3%).
| Income | Male | Female |
| $2,499 or less | 15 (9.0%) | 20 (15.0%) |
| $2,500 to $4,999 | 13 (7.8%) | 5 (3.8%) |
| $5,000 to $7,499 | 4 (2.4%) | 0 (0.0%) |
| $7,500 to $9,999 | 4 (2.4%) | 3 (2.3%) |
| $10,000 to $12,499 | 9 (5.4%) | 14 (10.5%) |
| $12,500 to $14,999 | 18 (10.8%) | 27 (20.3%) |
| $15,000 to $17,499 | 0 (0.0%) | 4 (3.0%) |
| $17,500 to $19,999 | 0 (0.0%) | 2 (1.5%) |
| $20,000 to $22,499 | 18 (10.8%) | 3 (2.3%) |
| $22,500 to $24,999 | 7 (4.2%) | 4 (3.0%) |
| $25,000 to $29,999 | 16 (9.6%) | 16 (12.0%) |
| $30,000 to $34,999 | 10 (6.0%) | 2 (1.5%) |
| $35,000 to $39,999 | 8 (4.8%) | 21 (15.8%) |
| $40,000 to $44,999 | 3 (1.8%) | 4 (3.0%) |
| $45,000 to $49,999 | 19 (11.4%) | 0 (0.0%) |
| $50,000 to $54,999 | 0 (0.0%) | 0 (0.0%) |
| $55,000 to $64,999 | 20 (12.0%) | 5 (3.8%) |
| $65,000 to $74,999 | 3 (1.8%) | 0 (0.0%) |
| $75,000 to $99,999 | 0 (0.0%) | 0 (0.0%) |
| $100,000+ | 0 (0.0%) | 3 (2.3%) |
| Total | 167 (100.0%) | 133 (100.0%) |
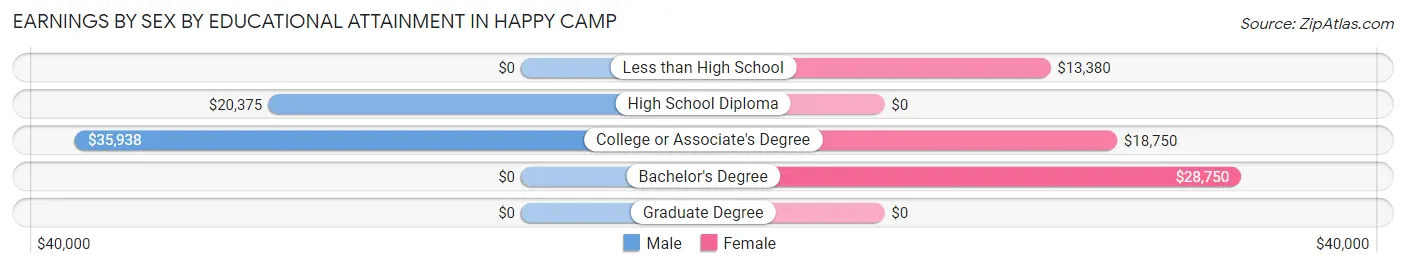
Earnings by Sex by Educational Attainment in Happy Camp
Average earnings in Happy Camp are $25,000 for men and $14,722 for women, a difference of 41.1%. Men with an educational attainment of college or associate's degree enjoy the highest average annual earnings of $35,938, while those with high school diploma education earn the least with $20,375. Women with an educational attainment of bachelor's degree earn the most with the average annual earnings of $28,750, while those with less than high school education have the smallest earnings of $13,380.
| Educational Attainment | Male Income | Female Income |
| Less than High School | - | - |
| High School Diploma | $20,375 | $0 |
| College or Associate's Degree | $35,938 | $18,750 |
| Bachelor's Degree | - | - |
| Graduate Degree | - | - |
| Total | $25,000 | $14,722 |
Family Income in Happy Camp
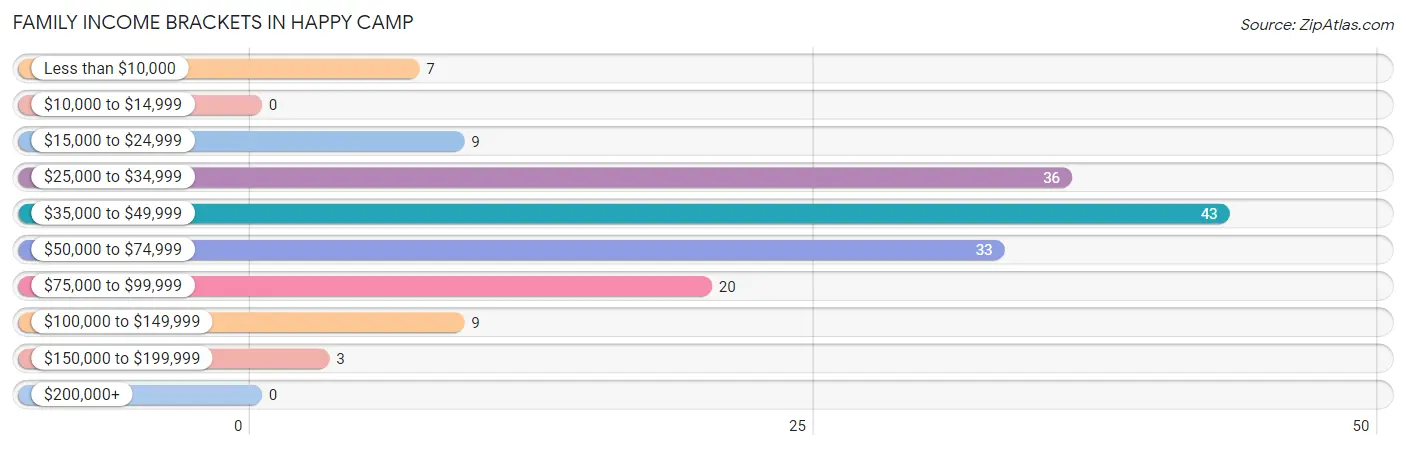
Family Income Brackets in Happy Camp
According to the Happy Camp family income data, there are 43 families falling into the $35,000 to $49,999 income range, which is the most common income bracket and makes up 26.9% of all families.
| Income Bracket | # Families | % Families |
| Less than $10,000 | 7 | 4.4% |
| $10,000 to $14,999 | 0 | 0.0% |
| $15,000 to $24,999 | 9 | 5.6% |
| $25,000 to $34,999 | 36 | 22.5% |
| $35,000 to $49,999 | 43 | 26.9% |
| $50,000 to $74,999 | 33 | 20.6% |
| $75,000 to $99,999 | 20 | 12.5% |
| $100,000 to $149,999 | 9 | 5.6% |
| $150,000 to $199,999 | 3 | 1.9% |
| $200,000+ | 0 | 0.0% |
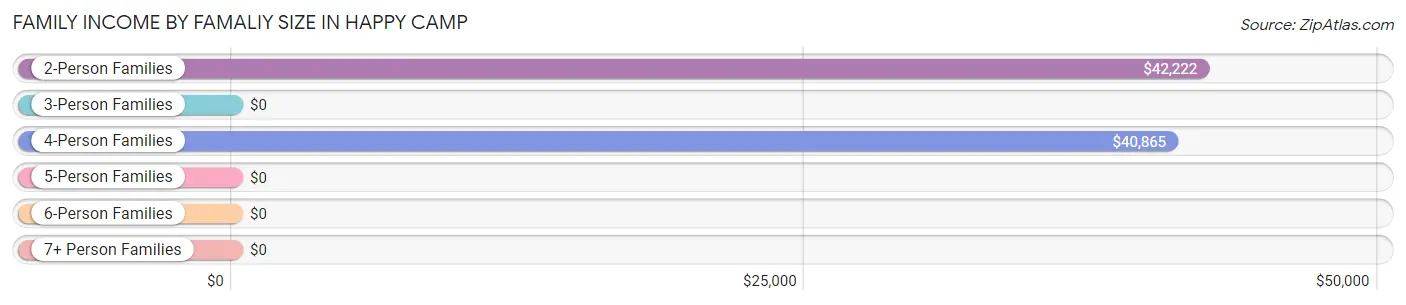
Family Income by Famaliy Size in Happy Camp
2-person families (112 | 70.0%) account for the highest median family income in Happy Camp with $42,222 per family, while 2-person families (112 | 70.0%) have the highest median income of $21,111 per family member.
| Income Bracket | # Families | Median Income |
| 2-Person Families | 112 (70.0%) | $42,222 |
| 3-Person Families | 23 (14.4%) | $0 |
| 4-Person Families | 17 (10.6%) | $40,865 |
| 5-Person Families | 5 (3.1%) | $0 |
| 6-Person Families | 3 (1.9%) | $0 |
| 7+ Person Families | 0 (0.0%) | $0 |
| Total | 160 (100.0%) | $40,795 |
Family Income by Number of Earners in Happy Camp
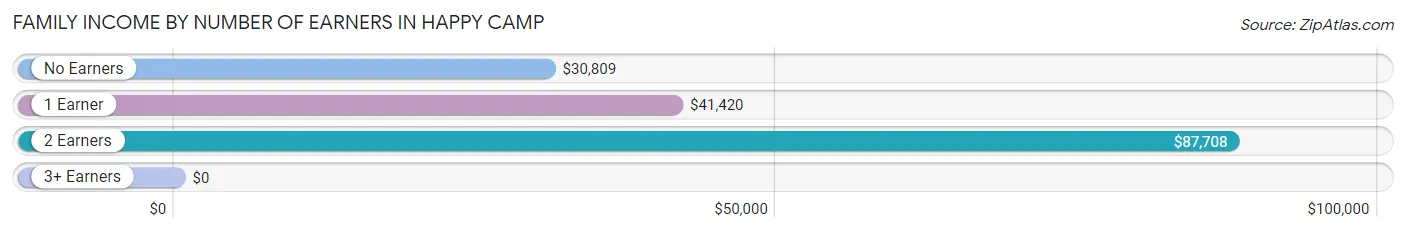
| Number of Earners | # Families | Median Income |
| No Earners | 29 (18.1%) | $30,809 |
| 1 Earner | 85 (53.1%) | $41,420 |
| 2 Earners | 43 (26.9%) | $87,708 |
| 3+ Earners | 3 (1.9%) | $0 |
| Total | 160 (100.0%) | $40,795 |
Household Income in Happy Camp
Household Income Brackets in Happy Camp
With 77 households falling in the category, the $35,000 to $49,999 income range is the most frequent in Happy Camp, accounting for 22.7% of all households. In contrast, only 3 households (0.9%) fall into the $150,000 to $199,999 income bracket, making it the least populous group.
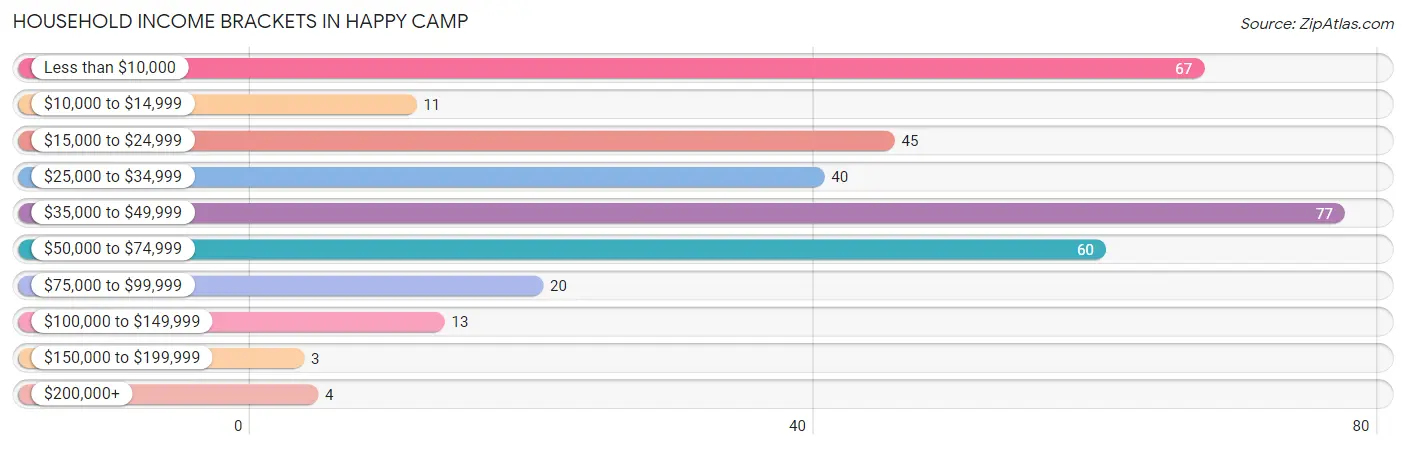
| Income Bracket | # Households | % Households |
| Less than $10,000 | 67 | 19.7% |
| $10,000 to $14,999 | 11 | 3.2% |
| $15,000 to $24,999 | 45 | 13.2% |
| $25,000 to $34,999 | 40 | 11.8% |
| $35,000 to $49,999 | 77 | 22.6% |
| $50,000 to $74,999 | 60 | 17.6% |
| $75,000 to $99,999 | 20 | 5.9% |
| $100,000 to $149,999 | 13 | 3.8% |
| $150,000 to $199,999 | 3 | 0.9% |
| $200,000+ | 4 | 1.2% |
Household Income by Householder Age in Happy Camp
The median household income in Happy Camp is $37,841, with the highest median household income of $41,339 found in the 25 to 44 years age bracket for the primary householder. A total of 65 households (19.1%) fall into this category. Meanwhile, the 15 to 24 years age bracket for the primary householder has the lowest median household income of $0, with 1 households (0.3%) in this group.
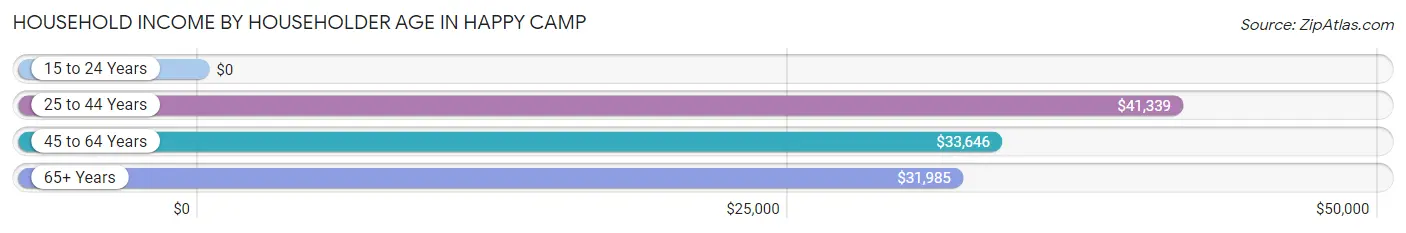
| Income Bracket | # Households | Median Income |
| 15 to 24 Years | 1 (0.3%) | $0 |
| 25 to 44 Years | 65 (19.1%) | $41,339 |
| 45 to 64 Years | 139 (40.9%) | $33,646 |
| 65+ Years | 135 (39.7%) | $31,985 |
| Total | 340 (100.0%) | $37,841 |
Poverty in Happy Camp
Income Below Poverty by Sex and Age in Happy Camp
With 30.2% poverty level for males and 16.3% for females among the residents of Happy Camp, under 5 year old males and 15 year old females are the most vulnerable to poverty, with 14 males (100.0%) and 1 females (100.0%) in their respective age groups living below the poverty level.
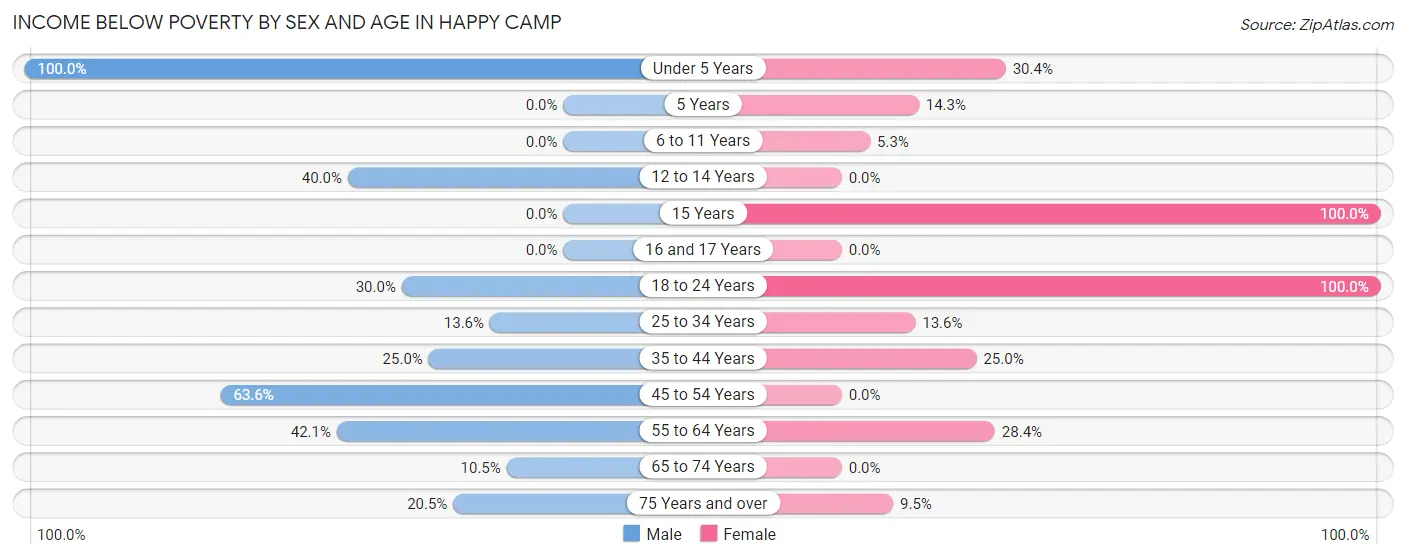
| Age Bracket | Male | Female |
| Under 5 Years | 14 (100.0%) | 7 (30.4%) |
| 5 Years | 0 (0.0%) | 1 (14.3%) |
| 6 to 11 Years | 0 (0.0%) | 1 (5.3%) |
| 12 to 14 Years | 2 (40.0%) | 0 (0.0%) |
| 15 Years | 0 (0.0%) | 1 (100.0%) |
| 16 and 17 Years | 0 (0.0%) | 0 (0.0%) |
| 18 to 24 Years | 6 (30.0%) | 1 (100.0%) |
| 25 to 34 Years | 6 (13.6%) | 6 (13.6%) |
| 35 to 44 Years | 5 (25.0%) | 3 (25.0%) |
| 45 to 54 Years | 21 (63.6%) | 0 (0.0%) |
| 55 to 64 Years | 37 (42.0%) | 27 (28.4%) |
| 65 to 74 Years | 6 (10.5%) | 0 (0.0%) |
| 75 Years and over | 9 (20.4%) | 4 (9.5%) |
| Total | 106 (30.2%) | 51 (16.3%) |
Income Above Poverty by Sex and Age in Happy Camp
According to the poverty statistics in Happy Camp, males aged 5 years and females aged 16 and 17 years are the age groups that are most secure financially, with 100.0% of males and 100.0% of females in these age groups living above the poverty line.
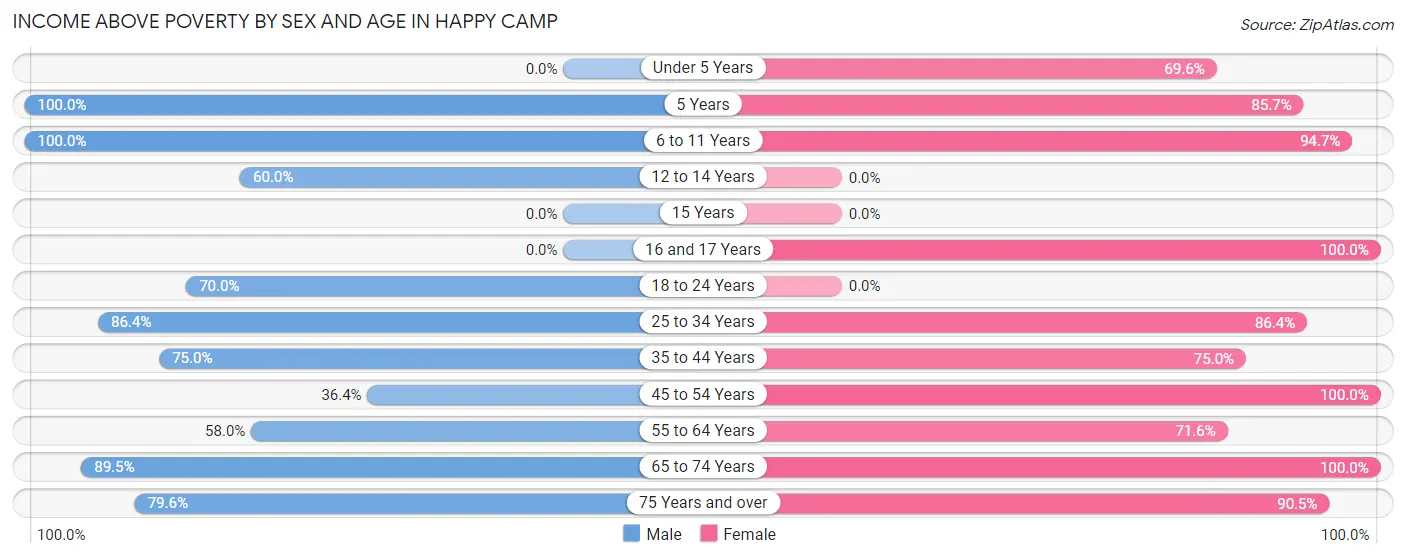
| Age Bracket | Male | Female |
| Under 5 Years | 0 (0.0%) | 16 (69.6%) |
| 5 Years | 15 (100.0%) | 6 (85.7%) |
| 6 to 11 Years | 11 (100.0%) | 18 (94.7%) |
| 12 to 14 Years | 3 (60.0%) | 0 (0.0%) |
| 15 Years | 0 (0.0%) | 0 (0.0%) |
| 16 and 17 Years | 0 (0.0%) | 7 (100.0%) |
| 18 to 24 Years | 14 (70.0%) | 0 (0.0%) |
| 25 to 34 Years | 38 (86.4%) | 38 (86.4%) |
| 35 to 44 Years | 15 (75.0%) | 9 (75.0%) |
| 45 to 54 Years | 12 (36.4%) | 7 (100.0%) |
| 55 to 64 Years | 51 (58.0%) | 68 (71.6%) |
| 65 to 74 Years | 51 (89.5%) | 55 (100.0%) |
| 75 Years and over | 35 (79.5%) | 38 (90.5%) |
| Total | 245 (69.8%) | 262 (83.7%) |
Income Below Poverty Among Married-Couple Families in Happy Camp
The poverty statistics for married-couple families in Happy Camp show that 2.8% or 3 of the total 108 families live below the poverty line. Families with 1 or 2 children have the highest poverty rate of 17.6%, comprising of 3 families. On the other hand, families with no children have the lowest poverty rate of 0.0%, which includes 0 families.
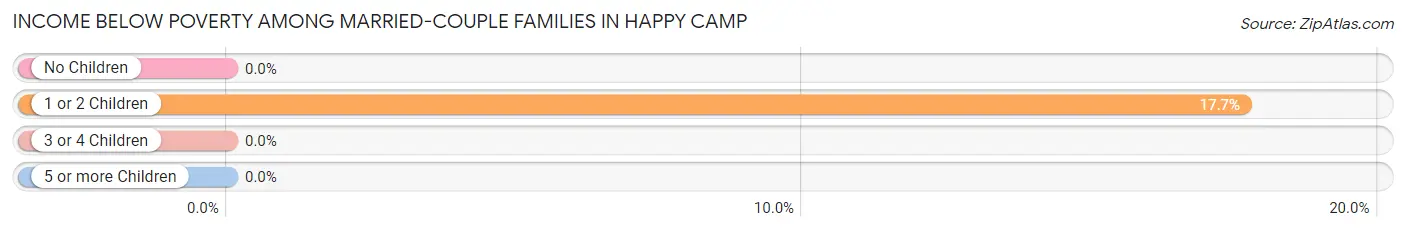
| Children | Above Poverty | Below Poverty |
| No Children | 83 (100.0%) | 0 (0.0%) |
| 1 or 2 Children | 14 (82.4%) | 3 (17.6%) |
| 3 or 4 Children | 8 (100.0%) | 0 (0.0%) |
| 5 or more Children | 0 (0.0%) | 0 (0.0%) |
| Total | 105 (97.2%) | 3 (2.8%) |
Income Below Poverty Among Single-Parent Households in Happy Camp
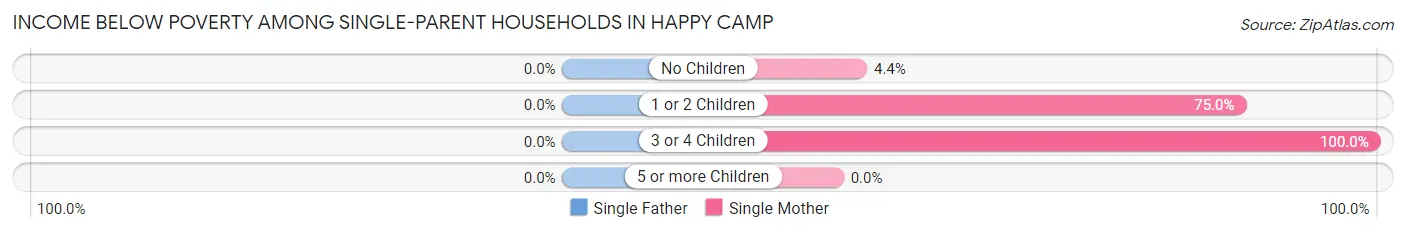
| Children | Single Father | Single Mother |
| No Children | 0 (0.0%) | 1 (4.3%) |
| 1 or 2 Children | 0 (0.0%) | 9 (75.0%) |
| 3 or 4 Children | 0 (0.0%) | 1 (100.0%) |
| 5 or more Children | 0 (0.0%) | 0 (0.0%) |
| Total | 0 (0.0%) | 11 (30.6%) |
Income Below Poverty Among Married-Couple vs Single-Parent Households in Happy Camp
The poverty data for Happy Camp shows that 3 of the married-couple family households (2.8%) and 11 of the single-parent households (21.1%) are living below the poverty level. Within the married-couple family households, those with 1 or 2 children have the highest poverty rate, with 3 households (17.6%) falling below the poverty line. Among the single-parent households, those with 3 or 4 children have the highest poverty rate, with 1 household (100.0%) living below poverty.
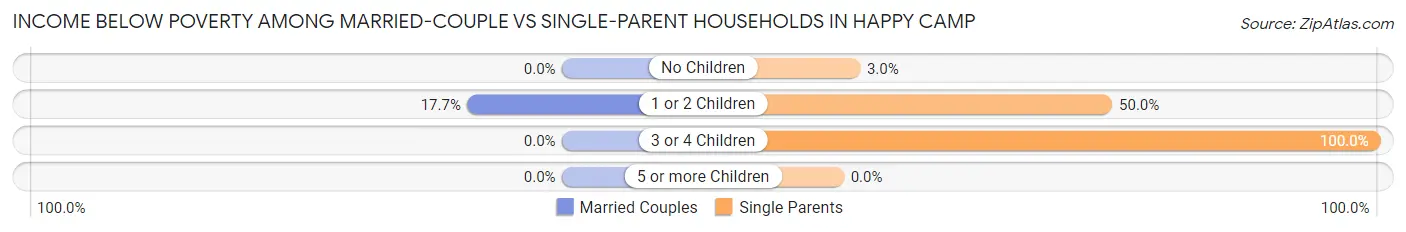
| Children | Married-Couple Families | Single-Parent Households |
| No Children | 0 (0.0%) | 1 (3.0%) |
| 1 or 2 Children | 3 (17.6%) | 9 (50.0%) |
| 3 or 4 Children | 0 (0.0%) | 1 (100.0%) |
| 5 or more Children | 0 (0.0%) | 0 (0.0%) |
| Total | 3 (2.8%) | 11 (21.1%) |
Employment Characteristics in Happy Camp
Employment by Class of Employer in Happy Camp
Among the 185 employed individuals in Happy Camp, private company employees (52 | 28.1%), local government employees (50 | 27.0%), and federal government employees (50 | 27.0%) make up the most common classes of employment.
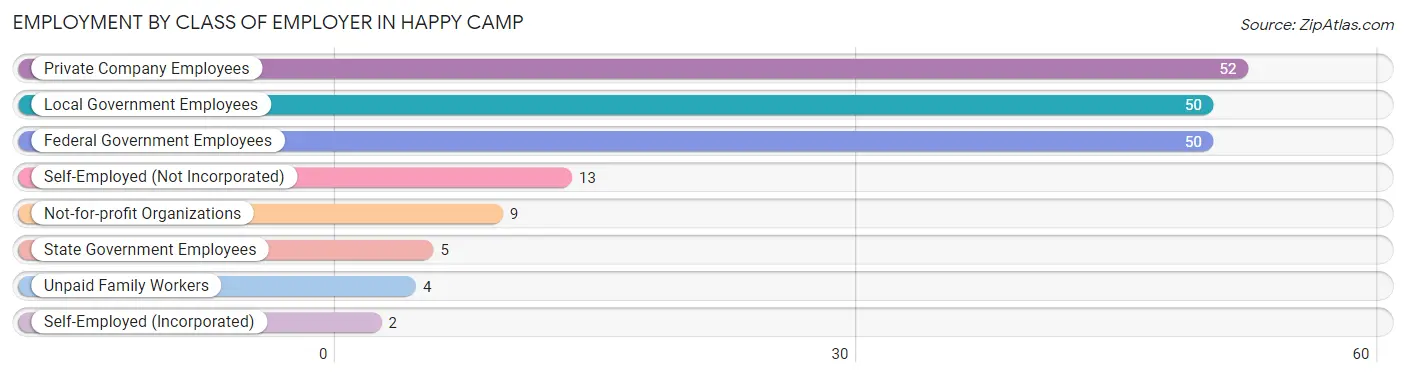
| Employer Class | # Employees | % Employees |
| Private Company Employees | 52 | 28.1% |
| Self-Employed (Incorporated) | 2 | 1.1% |
| Self-Employed (Not Incorporated) | 13 | 7.0% |
| Not-for-profit Organizations | 9 | 4.9% |
| Local Government Employees | 50 | 27.0% |
| State Government Employees | 5 | 2.7% |
| Federal Government Employees | 50 | 27.0% |
| Unpaid Family Workers | 4 | 2.2% |
| Total | 185 | 100.0% |
Employment Status by Age in Happy Camp
According to the labor force statistics for Happy Camp, out of the total population over 16 years of age (580), 45.3% or 263 individuals are in the labor force, with 26.6% or 70 of them unemployed. The age group with the highest labor force participation rate is 20 to 24 years, with 76.9% or 20 individuals in the labor force. Within the labor force, the 30 to 34 years age range has the highest percentage of unemployed individuals, with 40.5% or 17 of them being unemployed.
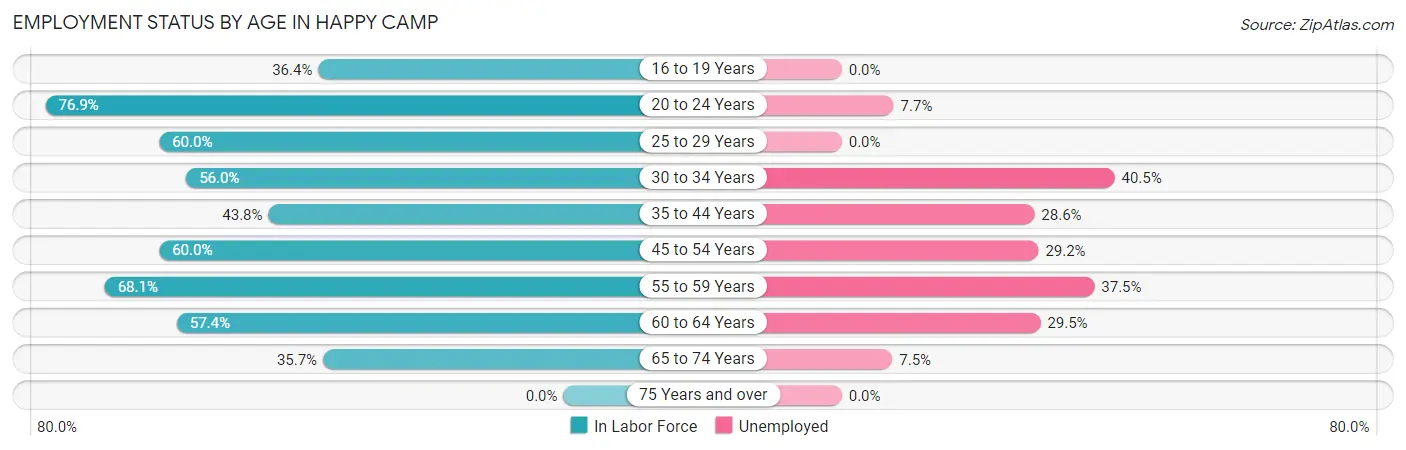
| Age Bracket | In Labor Force | Unemployed |
| 16 to 19 Years | 4 (36.4%) | 0 (0.0%) |
| 20 to 24 Years | 20 (76.9%) | 2 (7.7%) |
| 25 to 29 Years | 9 (60.0%) | 0 (0.0%) |
| 30 to 34 Years | 42 (56.0%) | 17 (40.5%) |
| 35 to 44 Years | 14 (43.8%) | 4 (28.6%) |
| 45 to 54 Years | 24 (60.0%) | 7 (29.2%) |
| 55 to 59 Years | 32 (68.1%) | 12 (37.5%) |
| 60 to 64 Years | 78 (57.4%) | 23 (29.5%) |
| 65 to 74 Years | 40 (35.7%) | 3 (7.5%) |
| 75 Years and over | 0 (0.0%) | 0 (0.0%) |
| Total | 263 (45.3%) | 70 (26.6%) |
Employment Status by Educational Attainment in Happy Camp
According to labor force statistics for Happy Camp, 57.7% of individuals (199) out of the total population between 25 and 64 years of age (345) are in the labor force, with 32.0% or 64 of them being unemployed. The group with the highest labor force participation rate are those with the educational attainment of bachelor's degree or higher, with 74.6% or 47 individuals in the labor force. Within the labor force, individuals with bachelor's degree or higher education have the highest percentage of unemployment, with 50.0% or 24 of them being unemployed.
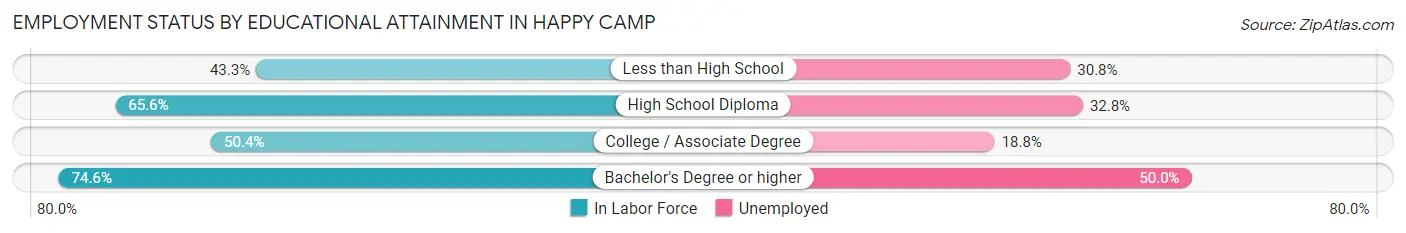
| Educational Attainment | In Labor Force | Unemployed |
| Less than High School | 26 (43.3%) | 18 (30.8%) |
| High School Diploma | 61 (65.6%) | 31 (32.8%) |
| College / Associate Degree | 65 (50.4%) | 24 (18.8%) |
| Bachelor's Degree or higher | 47 (74.6%) | 32 (50.0%) |
| Total | 199 (57.7%) | 110 (32.0%) |
Employment Occupations by Sex in Happy Camp
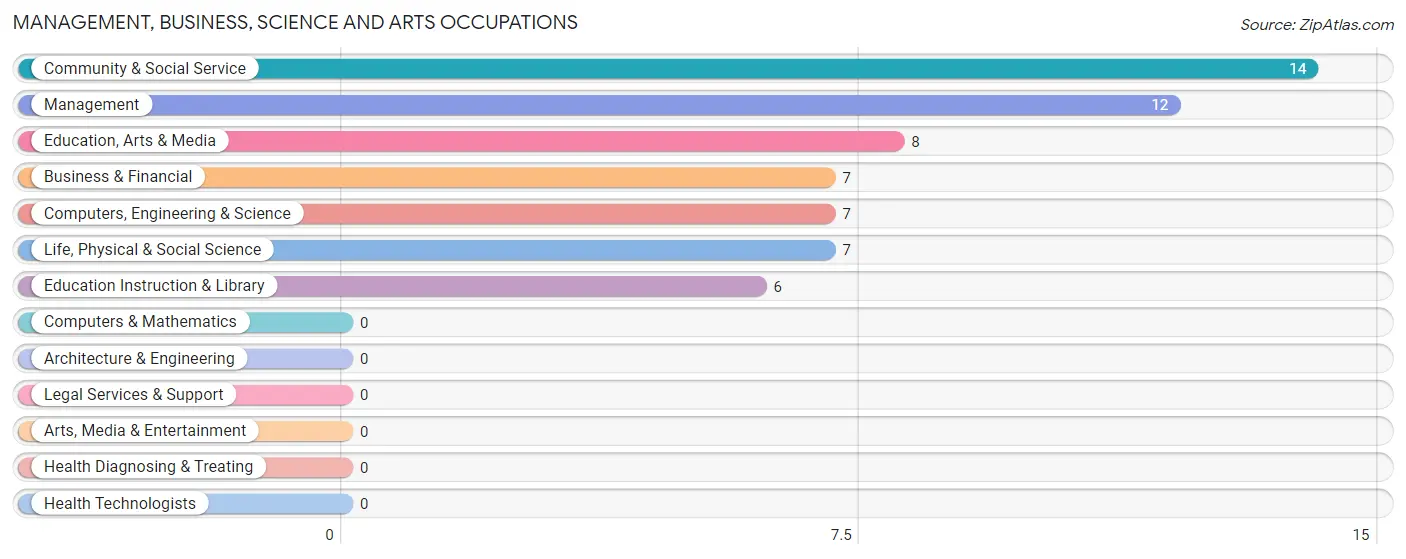
Management, Business, Science and Arts Occupations
The most common Management, Business, Science and Arts occupations in Happy Camp are Community & Social Service (14 | 7.6%), Management (12 | 6.5%), Education, Arts & Media (8 | 4.3%), Business & Financial (7 | 3.8%), and Computers, Engineering & Science (7 | 3.8%).
Management, Business, Science and Arts Occupations by Sex
Within the Management, Business, Science and Arts occupations in Happy Camp, the most male-oriented occupations are Education Instruction & Library (66.7%), Computers, Engineering & Science (57.1%), and Life, Physical & Social Science (57.1%), while the most female-oriented occupations are Business & Financial (100.0%), Education, Arts & Media (100.0%), and Community & Social Service (71.4%).
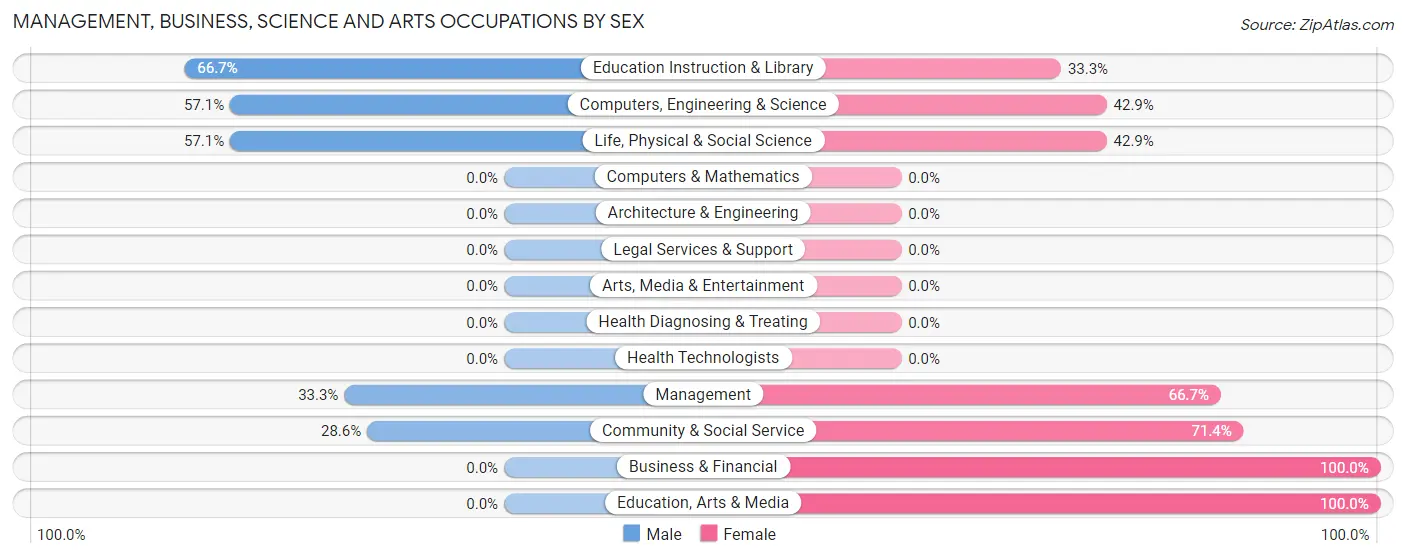
| Occupation | Male | Female |
| Management | 4 (33.3%) | 8 (66.7%) |
| Business & Financial | 0 (0.0%) | 7 (100.0%) |
| Computers, Engineering & Science | 4 (57.1%) | 3 (42.9%) |
| Computers & Mathematics | 0 (0.0%) | 0 (0.0%) |
| Architecture & Engineering | 0 (0.0%) | 0 (0.0%) |
| Life, Physical & Social Science | 4 (57.1%) | 3 (42.9%) |
| Community & Social Service | 4 (28.6%) | 10 (71.4%) |
| Education, Arts & Media | 0 (0.0%) | 8 (100.0%) |
| Legal Services & Support | 0 (0.0%) | 0 (0.0%) |
| Education Instruction & Library | 4 (66.7%) | 2 (33.3%) |
| Arts, Media & Entertainment | 0 (0.0%) | 0 (0.0%) |
| Health Diagnosing & Treating | 0 (0.0%) | 0 (0.0%) |
| Health Technologists | 0 (0.0%) | 0 (0.0%) |
| Total (Category) | 12 (30.0%) | 28 (70.0%) |
| Total (Overall) | 101 (54.6%) | 84 (45.4%) |
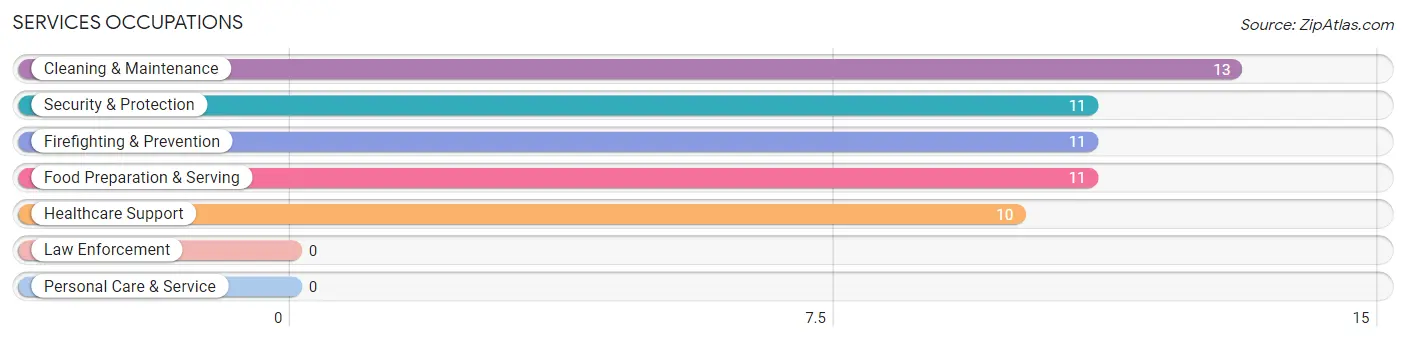
Services Occupations
The most common Services occupations in Happy Camp are Cleaning & Maintenance (13 | 7.0%), Security & Protection (11 | 5.9%), Firefighting & Prevention (11 | 5.9%), Food Preparation & Serving (11 | 5.9%), and Healthcare Support (10 | 5.4%).
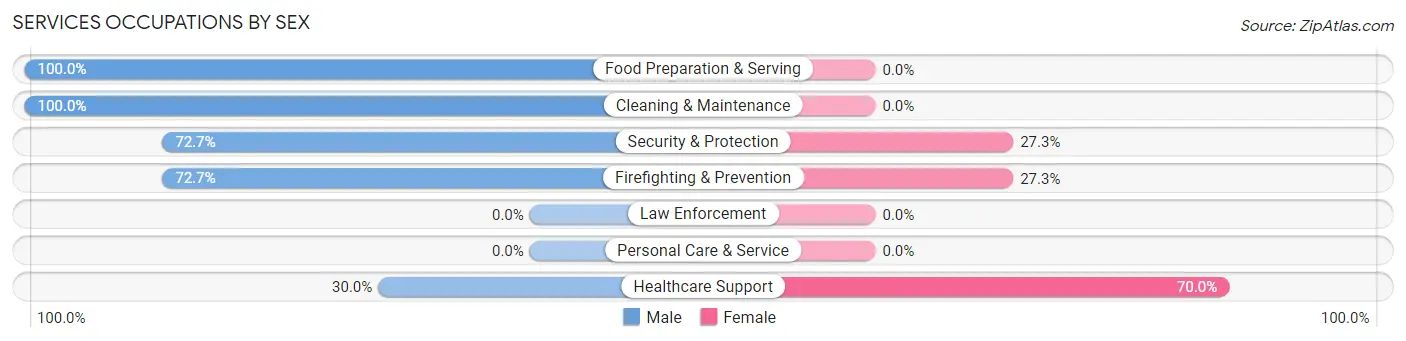
Services Occupations by Sex
Within the Services occupations in Happy Camp, the most male-oriented occupations are Food Preparation & Serving (100.0%), Cleaning & Maintenance (100.0%), and Security & Protection (72.7%), while the most female-oriented occupations are Healthcare Support (70.0%), Security & Protection (27.3%), and Firefighting & Prevention (27.3%).
| Occupation | Male | Female |
| Healthcare Support | 3 (30.0%) | 7 (70.0%) |
| Security & Protection | 8 (72.7%) | 3 (27.3%) |
| Firefighting & Prevention | 8 (72.7%) | 3 (27.3%) |
| Law Enforcement | 0 (0.0%) | 0 (0.0%) |
| Food Preparation & Serving | 11 (100.0%) | 0 (0.0%) |
| Cleaning & Maintenance | 13 (100.0%) | 0 (0.0%) |
| Personal Care & Service | 0 (0.0%) | 0 (0.0%) |
| Total (Category) | 35 (77.8%) | 10 (22.2%) |
| Total (Overall) | 101 (54.6%) | 84 (45.4%) |
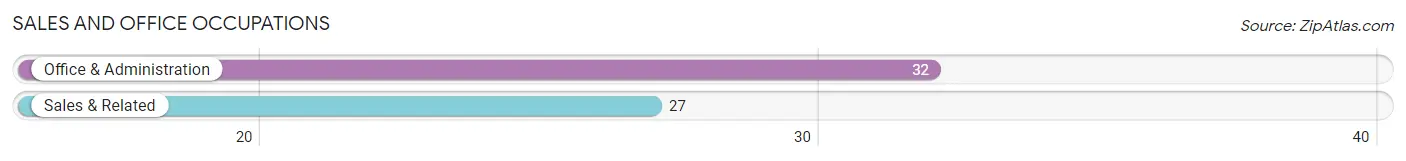
Sales and Office Occupations
The most common Sales and Office occupations in Happy Camp are Office & Administration (32 | 17.3%), and Sales & Related (27 | 14.6%).
Sales and Office Occupations by Sex
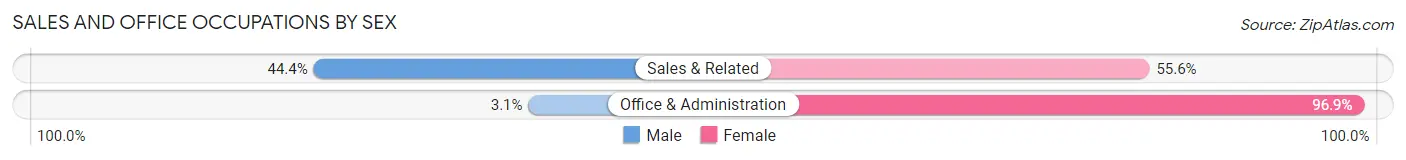
| Occupation | Male | Female |
| Sales & Related | 12 (44.4%) | 15 (55.6%) |
| Office & Administration | 1 (3.1%) | 31 (96.9%) |
| Total (Category) | 13 (22.0%) | 46 (78.0%) |
| Total (Overall) | 101 (54.6%) | 84 (45.4%) |
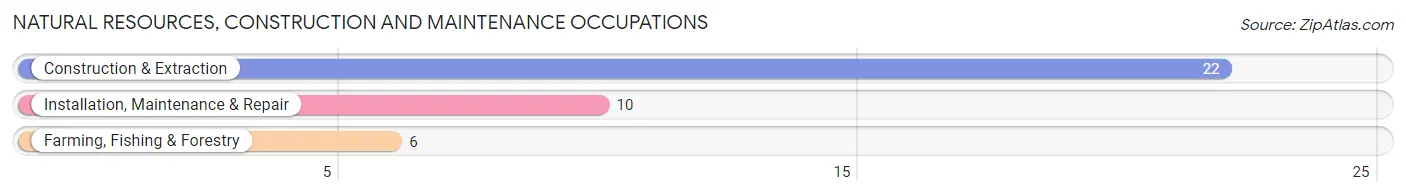
Natural Resources, Construction and Maintenance Occupations
The most common Natural Resources, Construction and Maintenance occupations in Happy Camp are Construction & Extraction (22 | 11.9%), Installation, Maintenance & Repair (10 | 5.4%), and Farming, Fishing & Forestry (6 | 3.2%).
Natural Resources, Construction and Maintenance Occupations by Sex
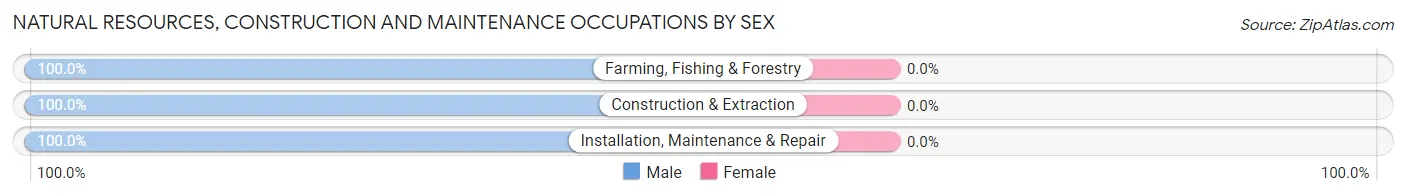
| Occupation | Male | Female |
| Farming, Fishing & Forestry | 6 (100.0%) | 0 (0.0%) |
| Construction & Extraction | 22 (100.0%) | 0 (0.0%) |
| Installation, Maintenance & Repair | 10 (100.0%) | 0 (0.0%) |
| Total (Category) | 38 (100.0%) | 0 (0.0%) |
| Total (Overall) | 101 (54.6%) | 84 (45.4%) |
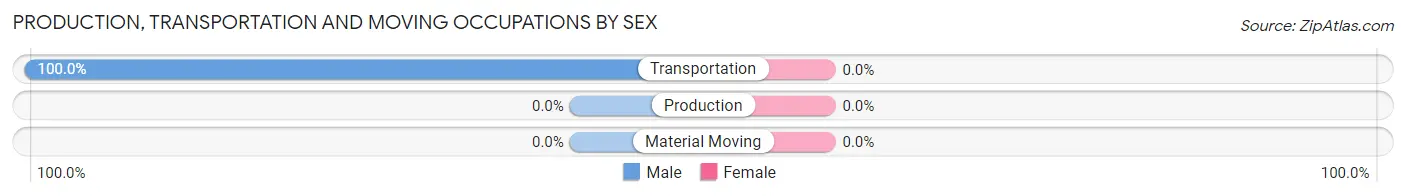
Production, Transportation and Moving Occupations
The most common Production, Transportation and Moving occupations in Happy Camp are , and Transportation (3 | 1.6%).
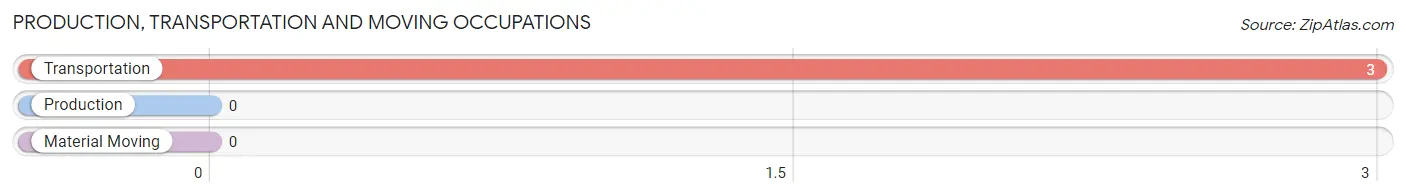
Production, Transportation and Moving Occupations by Sex
| Occupation | Male | Female |
| Production | 0 (0.0%) | 0 (0.0%) |
| Transportation | 3 (100.0%) | 0 (0.0%) |
| Material Moving | 0 (0.0%) | 0 (0.0%) |
| Total (Category) | 3 (100.0%) | 0 (0.0%) |
| Total (Overall) | 101 (54.6%) | 84 (45.4%) |
Employment Industries by Sex in Happy Camp
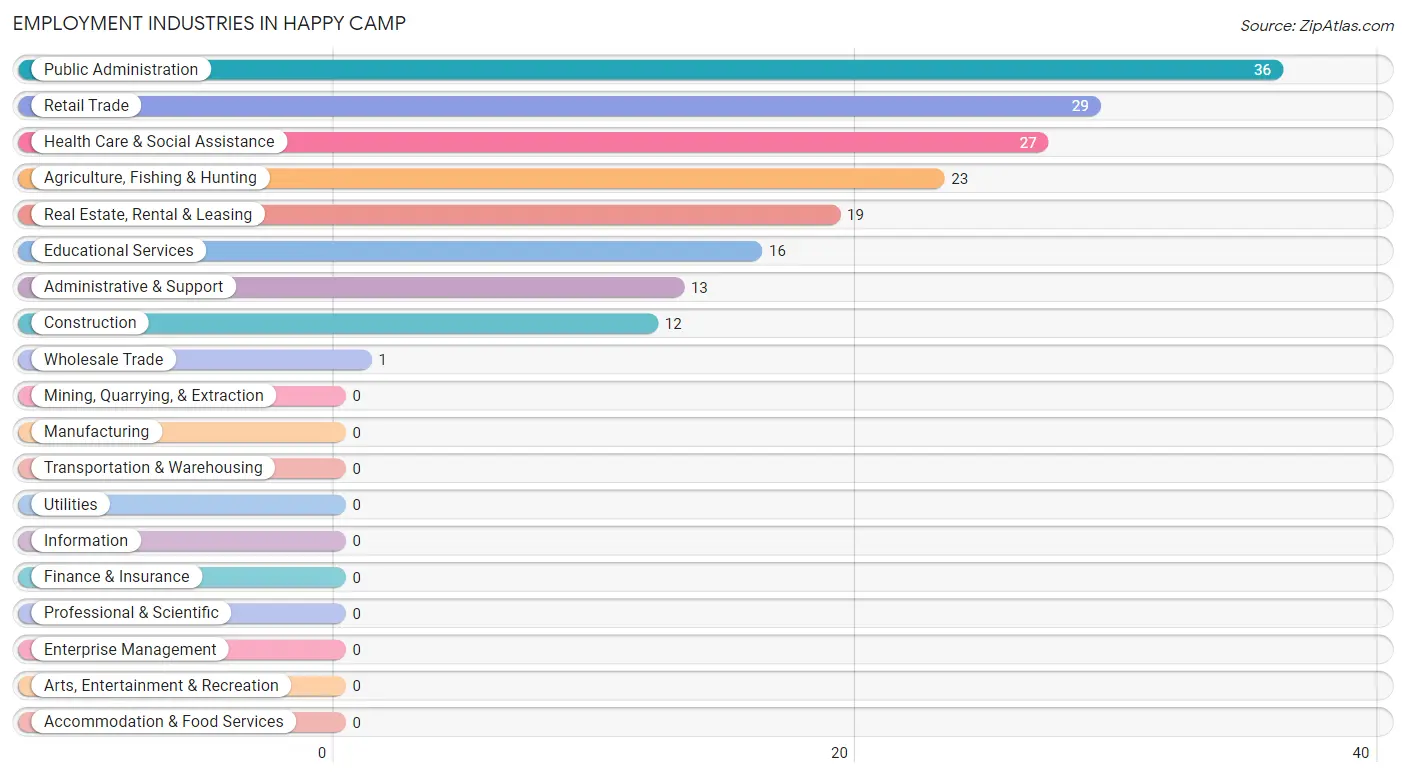
Employment Industries in Happy Camp
The major employment industries in Happy Camp include Public Administration (36 | 19.5%), Retail Trade (29 | 15.7%), Health Care & Social Assistance (27 | 14.6%), Agriculture, Fishing & Hunting (23 | 12.4%), and Real Estate, Rental & Leasing (19 | 10.3%).
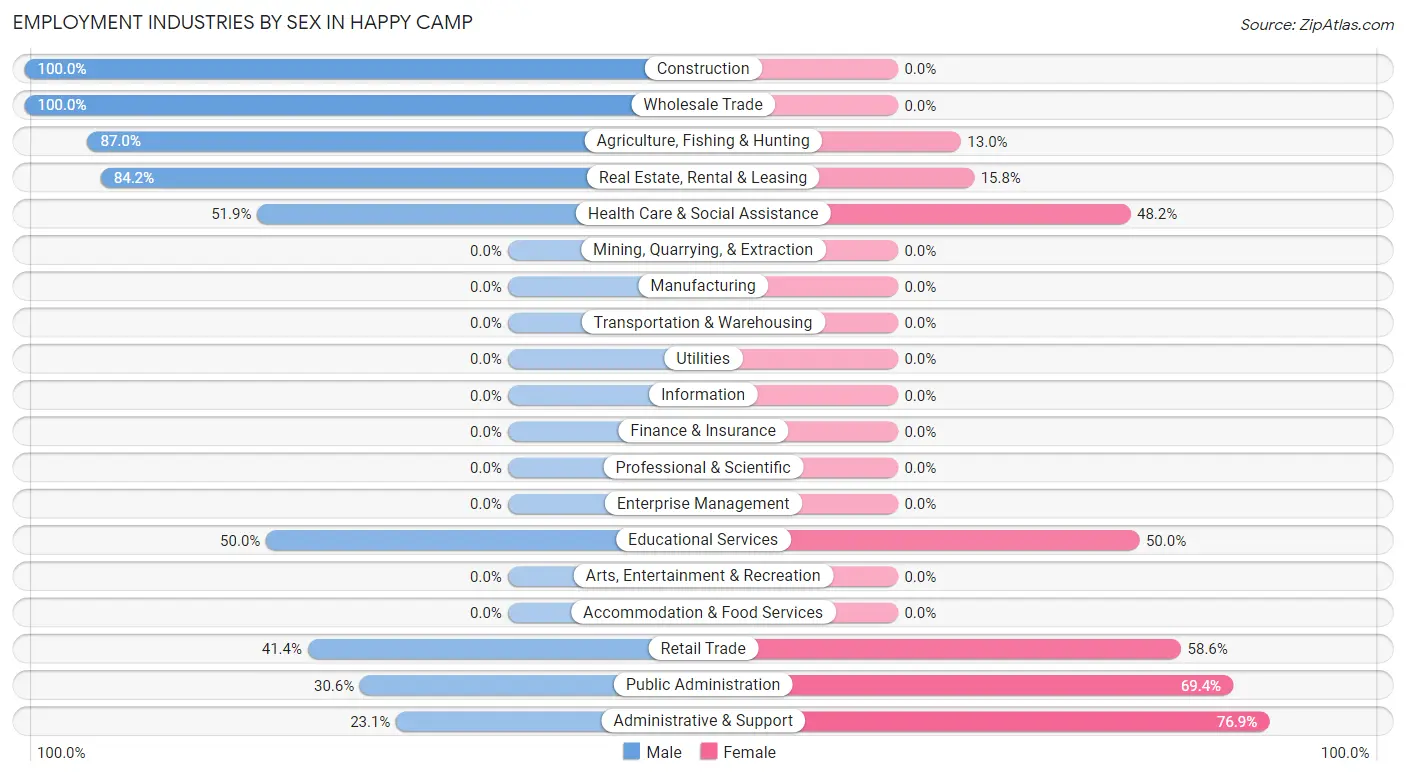
Employment Industries by Sex in Happy Camp
The Happy Camp industries that see more men than women are Construction (100.0%), Wholesale Trade (100.0%), and Agriculture, Fishing & Hunting (87.0%), whereas the industries that tend to have a higher number of women are Administrative & Support (76.9%), Public Administration (69.4%), and Retail Trade (58.6%).
| Industry | Male | Female |
| Agriculture, Fishing & Hunting | 20 (87.0%) | 3 (13.0%) |
| Mining, Quarrying, & Extraction | 0 (0.0%) | 0 (0.0%) |
| Construction | 12 (100.0%) | 0 (0.0%) |
| Manufacturing | 0 (0.0%) | 0 (0.0%) |
| Wholesale Trade | 1 (100.0%) | 0 (0.0%) |
| Retail Trade | 12 (41.4%) | 17 (58.6%) |
| Transportation & Warehousing | 0 (0.0%) | 0 (0.0%) |
| Utilities | 0 (0.0%) | 0 (0.0%) |
| Information | 0 (0.0%) | 0 (0.0%) |
| Finance & Insurance | 0 (0.0%) | 0 (0.0%) |
| Real Estate, Rental & Leasing | 16 (84.2%) | 3 (15.8%) |
| Professional & Scientific | 0 (0.0%) | 0 (0.0%) |
| Enterprise Management | 0 (0.0%) | 0 (0.0%) |
| Administrative & Support | 3 (23.1%) | 10 (76.9%) |
| Educational Services | 8 (50.0%) | 8 (50.0%) |
| Health Care & Social Assistance | 14 (51.8%) | 13 (48.1%) |
| Arts, Entertainment & Recreation | 0 (0.0%) | 0 (0.0%) |
| Accommodation & Food Services | 0 (0.0%) | 0 (0.0%) |
| Public Administration | 11 (30.6%) | 25 (69.4%) |
| Total | 101 (54.6%) | 84 (45.4%) |
Education in Happy Camp
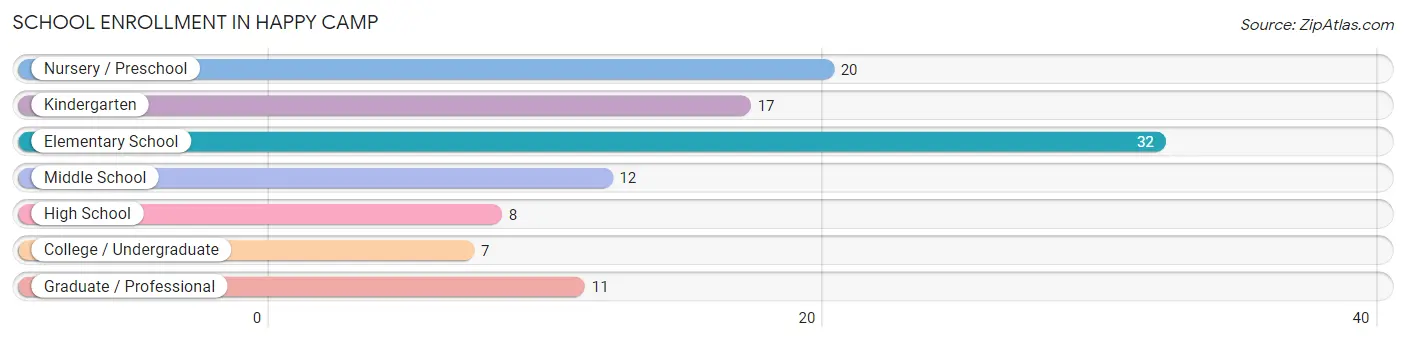
School Enrollment in Happy Camp
The most common levels of schooling among the 107 students in Happy Camp are elementary school (32 | 29.9%), nursery / preschool (20 | 18.7%), and kindergarten (17 | 15.9%).
| School Level | # Students | % Students |
| Nursery / Preschool | 20 | 18.7% |
| Kindergarten | 17 | 15.9% |
| Elementary School | 32 | 29.9% |
| Middle School | 12 | 11.2% |
| High School | 8 | 7.5% |
| College / Undergraduate | 7 | 6.5% |
| Graduate / Professional | 11 | 10.3% |
| Total | 107 | 100.0% |
School Enrollment by Age by Funding Source in Happy Camp
Out of a total of 107 students who are enrolled in schools in Happy Camp, 11 (10.3%) attend a private institution, while the remaining 96 (89.7%) are enrolled in public schools. The age group of 35 years and over has the highest likelihood of being enrolled in private schools, with 9 (69.2% in the age bracket) enrolled. Conversely, the age group of 3 to 4 year olds has the lowest likelihood of being enrolled in a private school, with 20 (100.0% in the age bracket) attending a public institution.
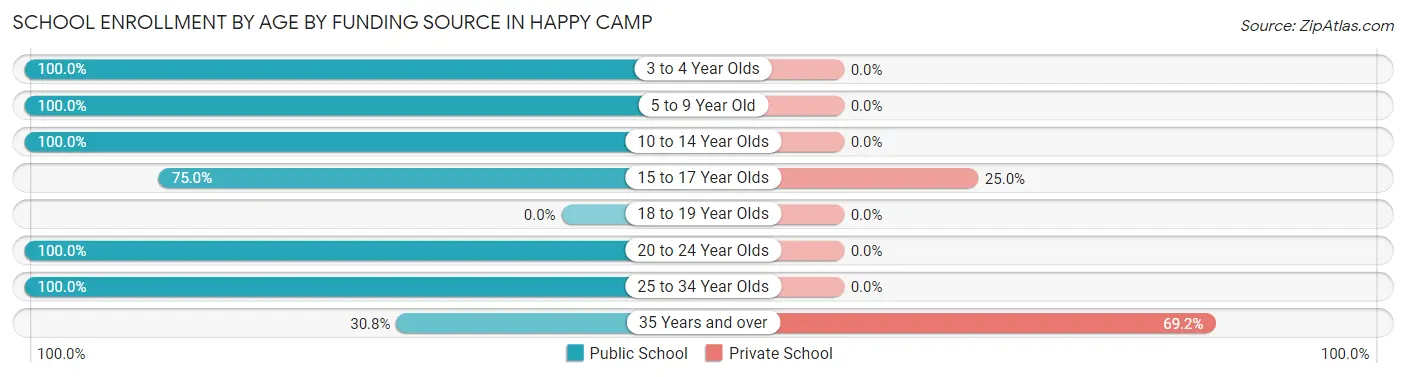
| Age Bracket | Public School | Private School |
| 3 to 4 Year Olds | 20 (100.0%) | 0 (0.0%) |
| 5 to 9 Year Old | 45 (100.0%) | 0 (0.0%) |
| 10 to 14 Year Olds | 16 (100.0%) | 0 (0.0%) |
| 15 to 17 Year Olds | 6 (75.0%) | 2 (25.0%) |
| 18 to 19 Year Olds | 0 (0.0%) | 0 (0.0%) |
| 20 to 24 Year Olds | 3 (100.0%) | 0 (0.0%) |
| 25 to 34 Year Olds | 2 (100.0%) | 0 (0.0%) |
| 35 Years and over | 4 (30.8%) | 9 (69.2%) |
| Total | 96 (89.7%) | 11 (10.3%) |
Educational Attainment by Field of Study in Happy Camp
Bio, nature & agricultural (35 | 25.2%), liberal arts & history (30 | 21.6%), education (24 | 17.3%), social sciences (16 | 11.5%), and science & technology (10 | 7.2%) are the most common fields of study among 139 individuals in Happy Camp who have obtained a bachelor's degree or higher.
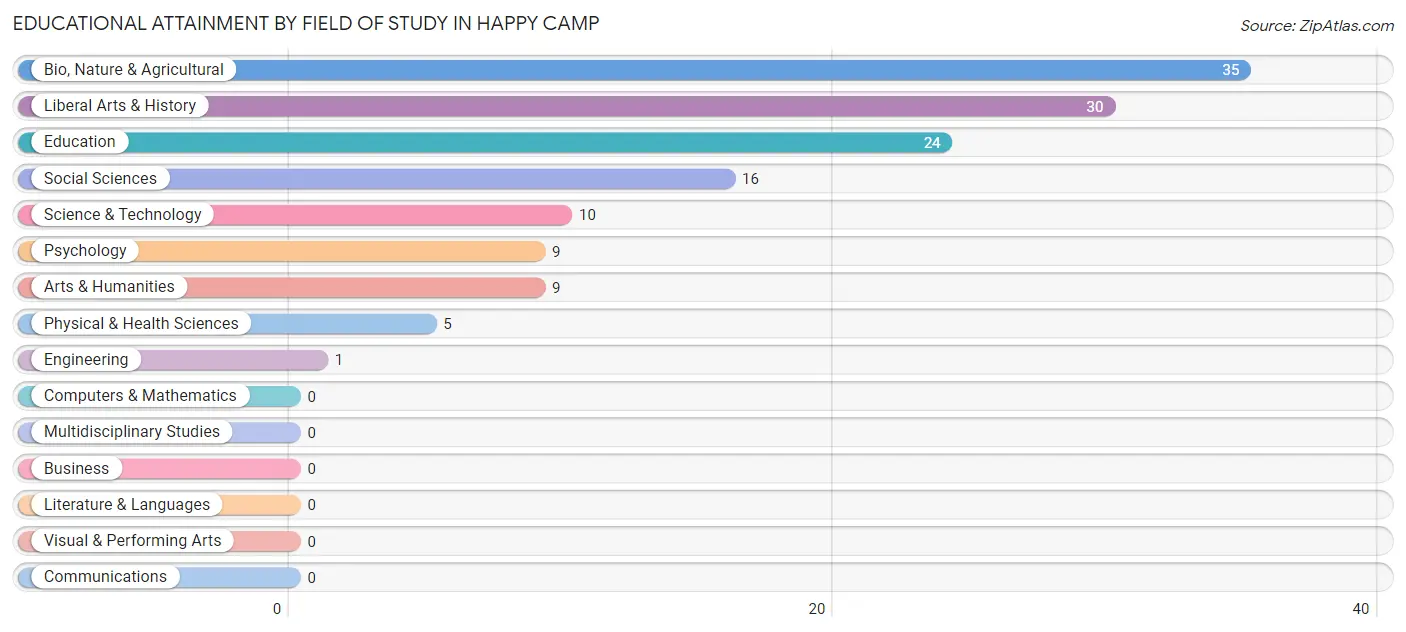
| Field of Study | # Graduates | % Graduates |
| Computers & Mathematics | 0 | 0.0% |
| Bio, Nature & Agricultural | 35 | 25.2% |
| Physical & Health Sciences | 5 | 3.6% |
| Psychology | 9 | 6.5% |
| Social Sciences | 16 | 11.5% |
| Engineering | 1 | 0.7% |
| Multidisciplinary Studies | 0 | 0.0% |
| Science & Technology | 10 | 7.2% |
| Business | 0 | 0.0% |
| Education | 24 | 17.3% |
| Literature & Languages | 0 | 0.0% |
| Liberal Arts & History | 30 | 21.6% |
| Visual & Performing Arts | 0 | 0.0% |
| Communications | 0 | 0.0% |
| Arts & Humanities | 9 | 6.5% |
| Total | 139 | 100.0% |
Transportation & Commute in Happy Camp
Vehicle Availability by Sex in Happy Camp
The most prevalent vehicle ownership categories in Happy Camp are males with 3 vehicles (28, accounting for 29.5%) and females with 3 vehicles (7, making up 35.4%).
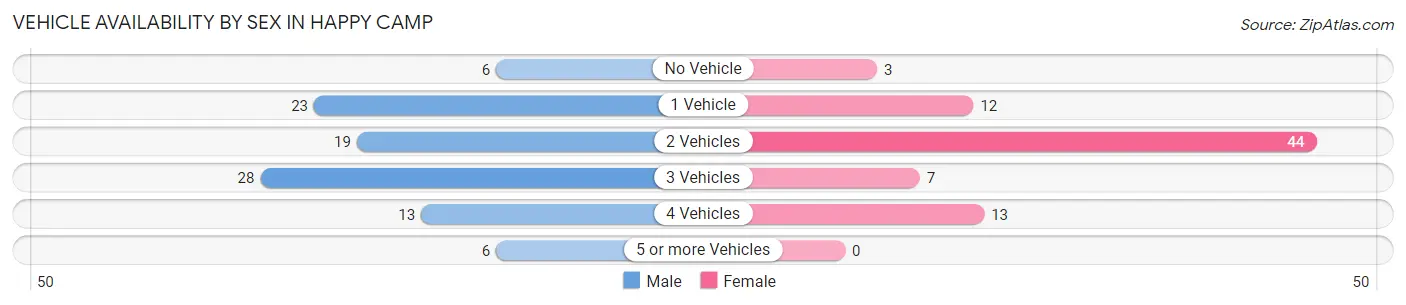
| Vehicles Available | Male | Female |
| No Vehicle | 6 (6.3%) | 3 (3.8%) |
| 1 Vehicle | 23 (24.2%) | 12 (15.2%) |
| 2 Vehicles | 19 (20.0%) | 44 (55.7%) |
| 3 Vehicles | 28 (29.5%) | 7 (8.9%) |
| 4 Vehicles | 13 (13.7%) | 13 (16.5%) |
| 5 or more Vehicles | 6 (6.3%) | 0 (0.0%) |
| Total | 95 (100.0%) | 79 (100.0%) |
Commute Time in Happy Camp
The most frequently occuring commute durations in Happy Camp are less than 5 minutes (89 commuters, 54.9%), 5 to 9 minutes (45 commuters, 27.8%), and 60 to 89 minutes (12 commuters, 7.4%).
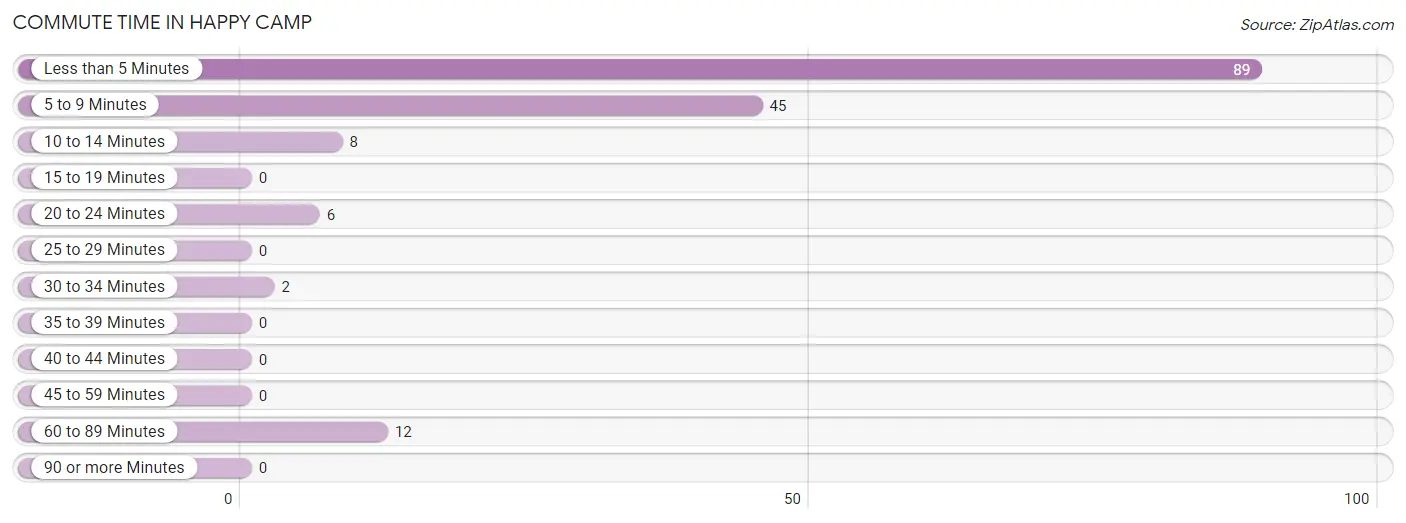
| Commute Time | # Commuters | % Commuters |
| Less than 5 Minutes | 89 | 54.9% |
| 5 to 9 Minutes | 45 | 27.8% |
| 10 to 14 Minutes | 8 | 4.9% |
| 15 to 19 Minutes | 0 | 0.0% |
| 20 to 24 Minutes | 6 | 3.7% |
| 25 to 29 Minutes | 0 | 0.0% |
| 30 to 34 Minutes | 2 | 1.2% |
| 35 to 39 Minutes | 0 | 0.0% |
| 40 to 44 Minutes | 0 | 0.0% |
| 45 to 59 Minutes | 0 | 0.0% |
| 60 to 89 Minutes | 12 | 7.4% |
| 90 or more Minutes | 0 | 0.0% |
Commute Time by Sex in Happy Camp
The most common commute times in Happy Camp are less than 5 minutes (32 commuters, 38.1%) for males and less than 5 minutes (57 commuters, 73.1%) for females.
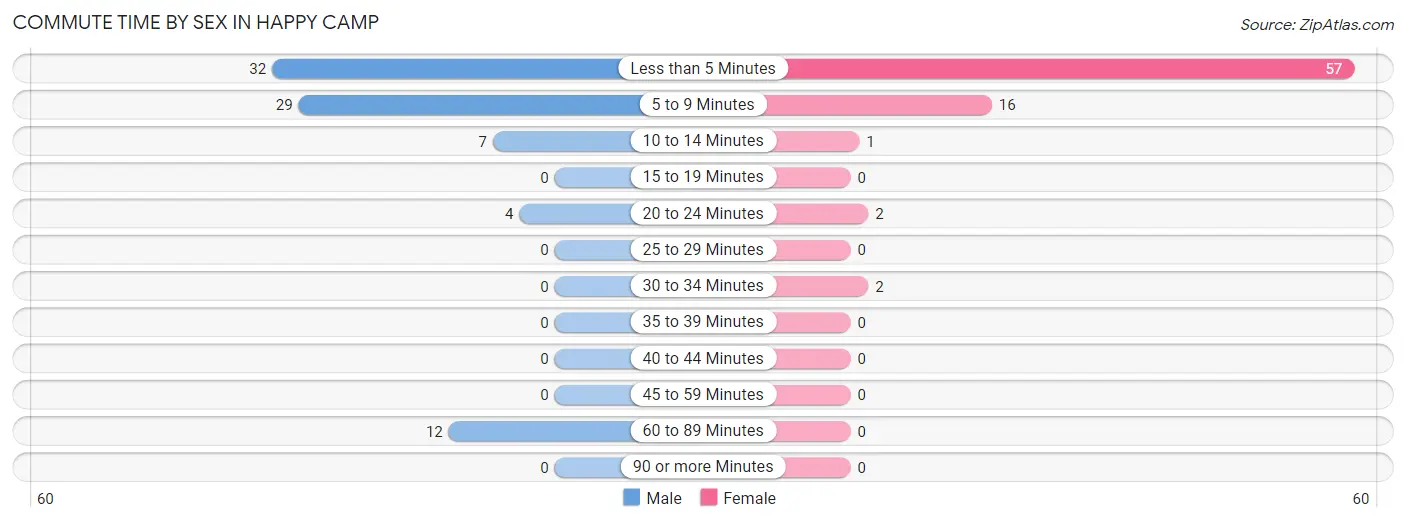
| Commute Time | Male | Female |
| Less than 5 Minutes | 32 (38.1%) | 57 (73.1%) |
| 5 to 9 Minutes | 29 (34.5%) | 16 (20.5%) |
| 10 to 14 Minutes | 7 (8.3%) | 1 (1.3%) |
| 15 to 19 Minutes | 0 (0.0%) | 0 (0.0%) |
| 20 to 24 Minutes | 4 (4.8%) | 2 (2.6%) |
| 25 to 29 Minutes | 0 (0.0%) | 0 (0.0%) |
| 30 to 34 Minutes | 0 (0.0%) | 2 (2.6%) |
| 35 to 39 Minutes | 0 (0.0%) | 0 (0.0%) |
| 40 to 44 Minutes | 0 (0.0%) | 0 (0.0%) |
| 45 to 59 Minutes | 0 (0.0%) | 0 (0.0%) |
| 60 to 89 Minutes | 12 (14.3%) | 0 (0.0%) |
| 90 or more Minutes | 0 (0.0%) | 0 (0.0%) |
Time of Departure to Work by Sex in Happy Camp
The most frequent times of departure to work in Happy Camp are 8:00 AM to 8:29 AM (37, 44.1%) for males and 7:30 AM to 7:59 AM (45, 57.7%) for females.
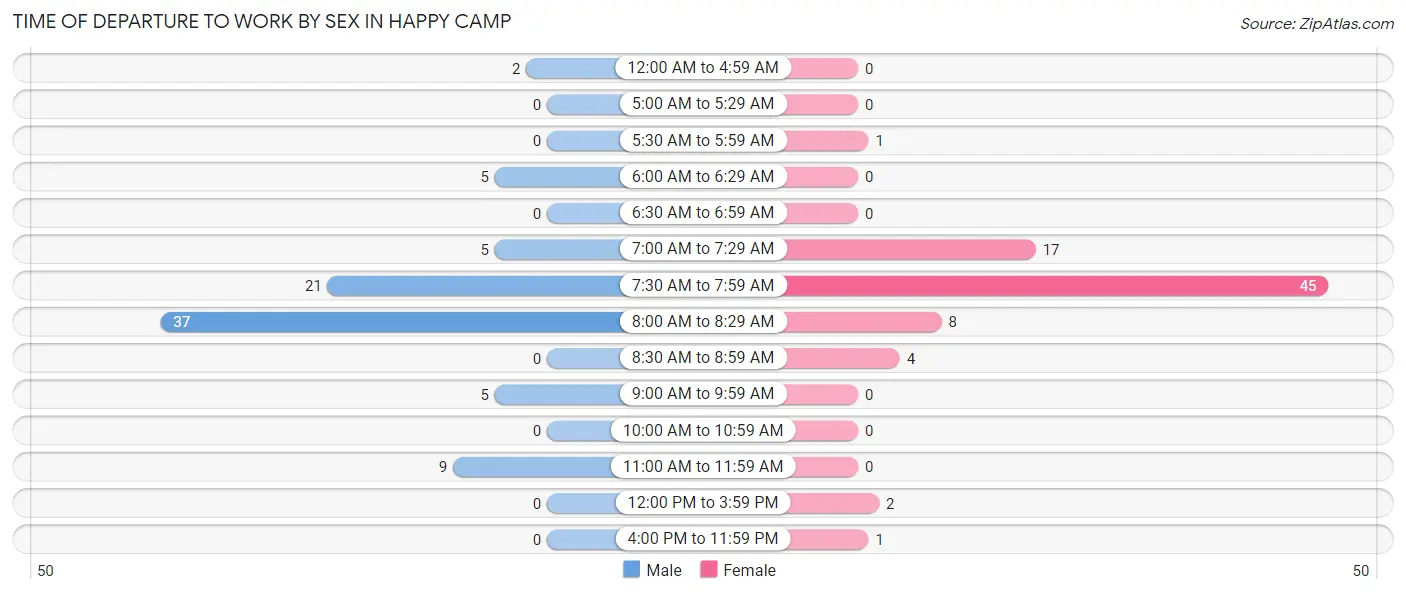
| Time of Departure | Male | Female |
| 12:00 AM to 4:59 AM | 2 (2.4%) | 0 (0.0%) |
| 5:00 AM to 5:29 AM | 0 (0.0%) | 0 (0.0%) |
| 5:30 AM to 5:59 AM | 0 (0.0%) | 1 (1.3%) |
| 6:00 AM to 6:29 AM | 5 (5.9%) | 0 (0.0%) |
| 6:30 AM to 6:59 AM | 0 (0.0%) | 0 (0.0%) |
| 7:00 AM to 7:29 AM | 5 (5.9%) | 17 (21.8%) |
| 7:30 AM to 7:59 AM | 21 (25.0%) | 45 (57.7%) |
| 8:00 AM to 8:29 AM | 37 (44.1%) | 8 (10.3%) |
| 8:30 AM to 8:59 AM | 0 (0.0%) | 4 (5.1%) |
| 9:00 AM to 9:59 AM | 5 (5.9%) | 0 (0.0%) |
| 10:00 AM to 10:59 AM | 0 (0.0%) | 0 (0.0%) |
| 11:00 AM to 11:59 AM | 9 (10.7%) | 0 (0.0%) |
| 12:00 PM to 3:59 PM | 0 (0.0%) | 2 (2.6%) |
| 4:00 PM to 11:59 PM | 0 (0.0%) | 1 (1.3%) |
| Total | 84 (100.0%) | 78 (100.0%) |
Housing Occupancy in Happy Camp
Occupancy by Ownership in Happy Camp
Of the total 340 dwellings in Happy Camp, owner-occupied units account for 178 (52.3%), while renter-occupied units make up 162 (47.6%).
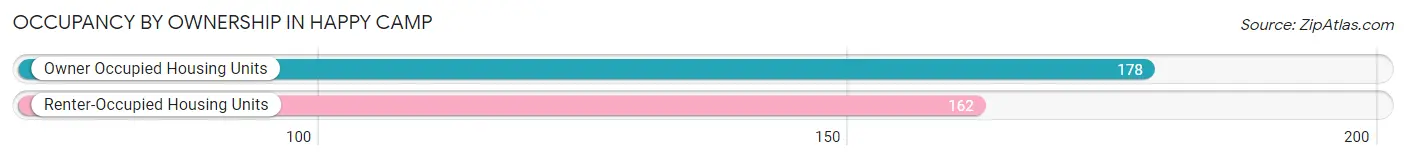
| Occupancy | # Housing Units | % Housing Units |
| Owner Occupied Housing Units | 178 | 52.3% |
| Renter-Occupied Housing Units | 162 | 47.6% |
| Total Occupied Housing Units | 340 | 100.0% |
Occupancy by Household Size in Happy Camp
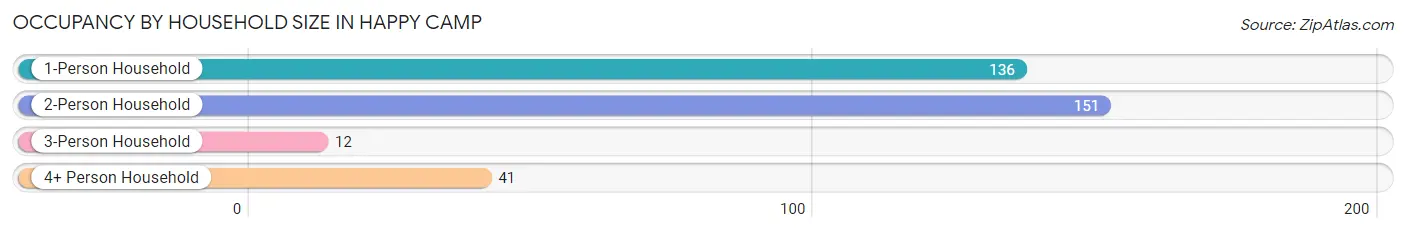
| Household Size | # Housing Units | % Housing Units |
| 1-Person Household | 136 | 40.0% |
| 2-Person Household | 151 | 44.4% |
| 3-Person Household | 12 | 3.5% |
| 4+ Person Household | 41 | 12.1% |
| Total Housing Units | 340 | 100.0% |
Occupancy by Ownership by Household Size in Happy Camp
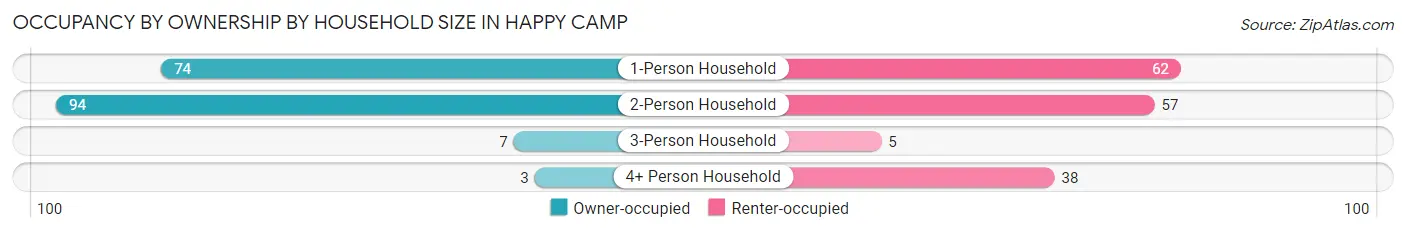
| Household Size | Owner-occupied | Renter-occupied |
| 1-Person Household | 74 (54.4%) | 62 (45.6%) |
| 2-Person Household | 94 (62.3%) | 57 (37.8%) |
| 3-Person Household | 7 (58.3%) | 5 (41.7%) |
| 4+ Person Household | 3 (7.3%) | 38 (92.7%) |
| Total Housing Units | 178 (52.3%) | 162 (47.6%) |
Occupancy by Educational Attainment in Happy Camp
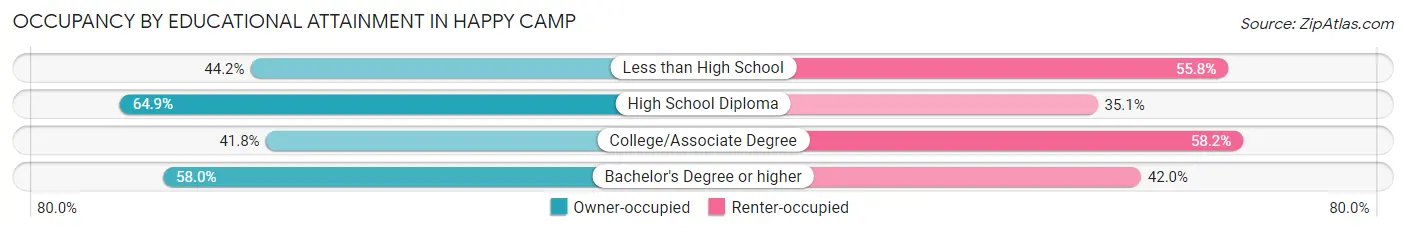
| Household Size | Owner-occupied | Renter-occupied |
| Less than High School | 19 (44.2%) | 24 (55.8%) |
| High School Diploma | 61 (64.9%) | 33 (35.1%) |
| College/Associate Degree | 51 (41.8%) | 71 (58.2%) |
| Bachelor's Degree or higher | 47 (58.0%) | 34 (42.0%) |
Occupancy by Age of Householder in Happy Camp
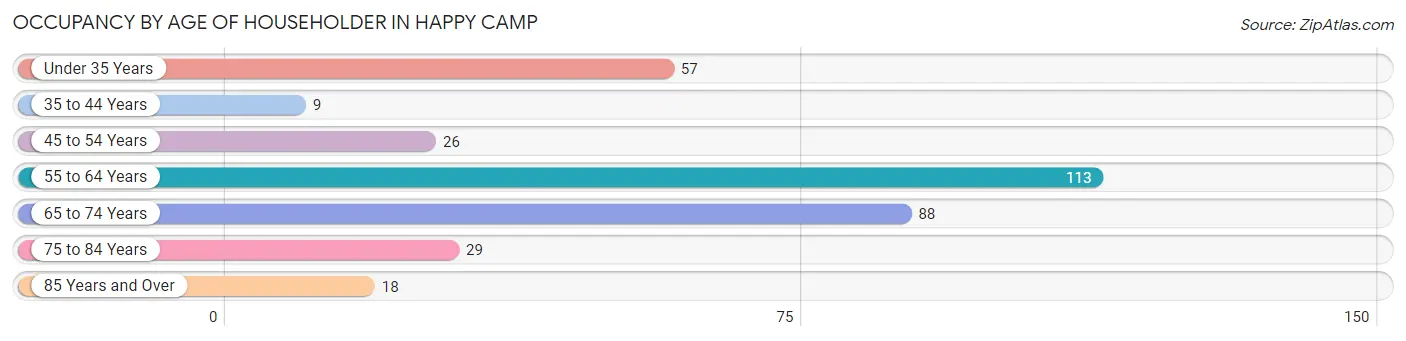
| Age Bracket | # Households | % Households |
| Under 35 Years | 57 | 16.8% |
| 35 to 44 Years | 9 | 2.6% |
| 45 to 54 Years | 26 | 7.6% |
| 55 to 64 Years | 113 | 33.2% |
| 65 to 74 Years | 88 | 25.9% |
| 75 to 84 Years | 29 | 8.5% |
| 85 Years and Over | 18 | 5.3% |
| Total | 340 | 100.0% |
Housing Finances in Happy Camp
Median Income by Occupancy in Happy Camp
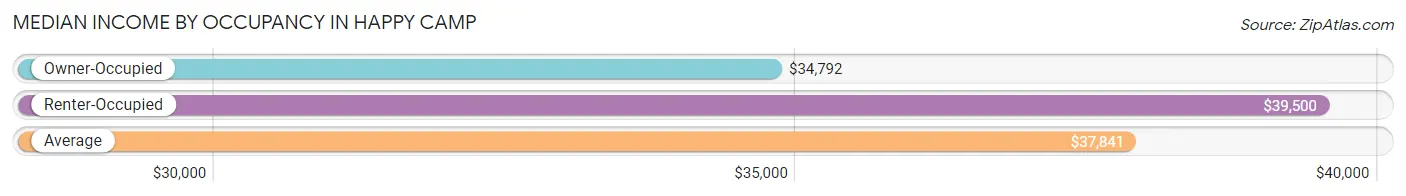
| Occupancy Type | # Households | Median Income |
| Owner-Occupied | 178 (52.3%) | $34,792 |
| Renter-Occupied | 162 (47.6%) | $39,500 |
| Average | 340 (100.0%) | $37,841 |
Occupancy by Householder Income Bracket in Happy Camp
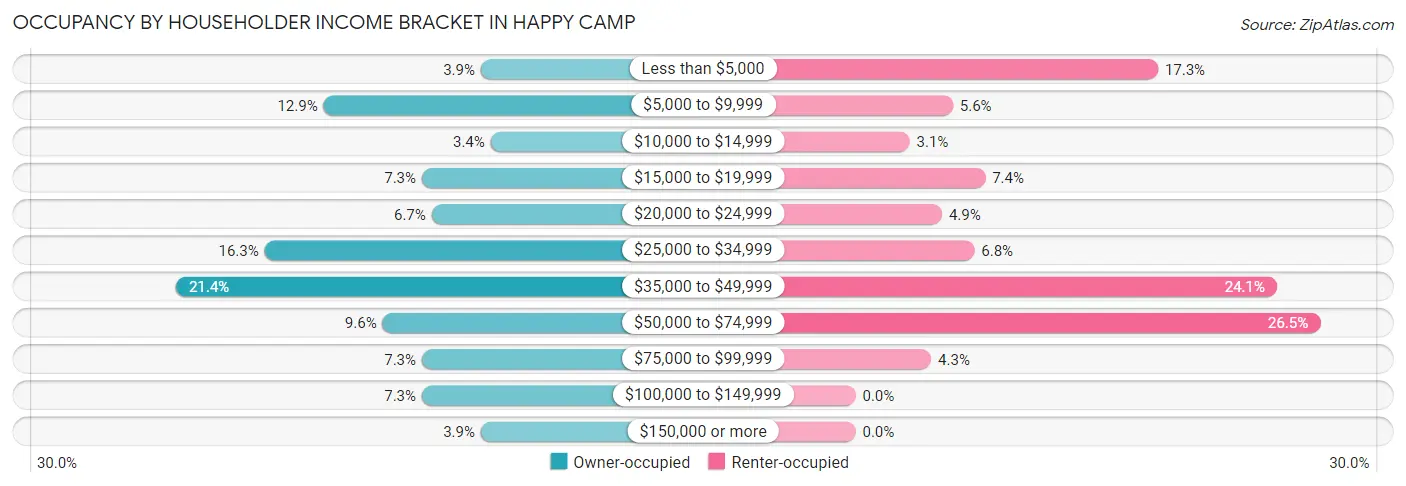
| Income Bracket | Owner-occupied | Renter-occupied |
| Less than $5,000 | 7 (3.9%) | 28 (17.3%) |
| $5,000 to $9,999 | 23 (12.9%) | 9 (5.6%) |
| $10,000 to $14,999 | 6 (3.4%) | 5 (3.1%) |
| $15,000 to $19,999 | 13 (7.3%) | 12 (7.4%) |
| $20,000 to $24,999 | 12 (6.7%) | 8 (4.9%) |
| $25,000 to $34,999 | 29 (16.3%) | 11 (6.8%) |
| $35,000 to $49,999 | 38 (21.3%) | 39 (24.1%) |
| $50,000 to $74,999 | 17 (9.6%) | 43 (26.5%) |
| $75,000 to $99,999 | 13 (7.3%) | 7 (4.3%) |
| $100,000 to $149,999 | 13 (7.3%) | 0 (0.0%) |
| $150,000 or more | 7 (3.9%) | 0 (0.0%) |
| Total | 178 (100.0%) | 162 (100.0%) |
Monthly Housing Cost Tiers in Happy Camp
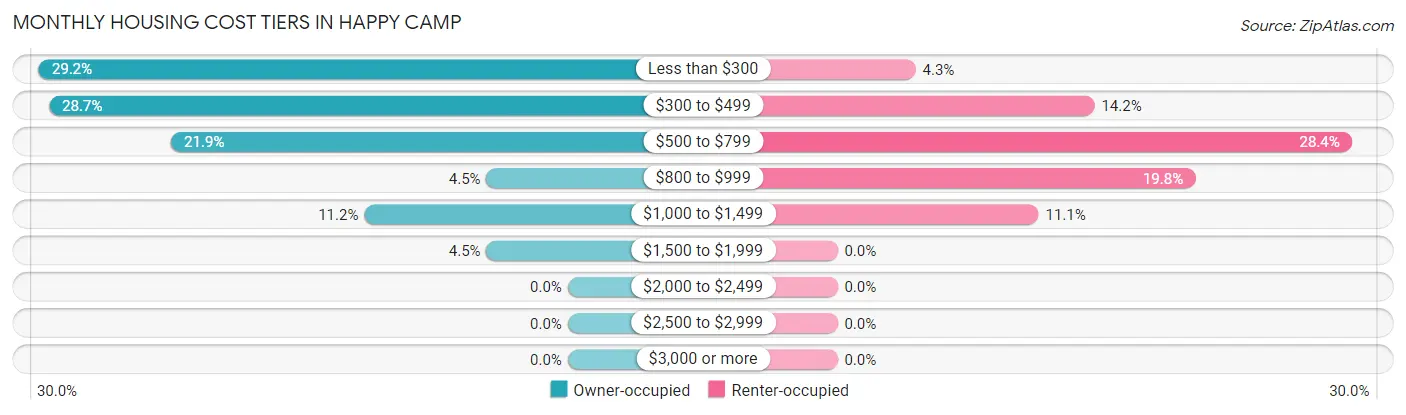
| Monthly Cost | Owner-occupied | Renter-occupied |
| Less than $300 | 52 (29.2%) | 7 (4.3%) |
| $300 to $499 | 51 (28.6%) | 23 (14.2%) |
| $500 to $799 | 39 (21.9%) | 46 (28.4%) |
| $800 to $999 | 8 (4.5%) | 32 (19.8%) |
| $1,000 to $1,499 | 20 (11.2%) | 18 (11.1%) |
| $1,500 to $1,999 | 8 (4.5%) | 0 (0.0%) |
| $2,000 to $2,499 | 0 (0.0%) | 0 (0.0%) |
| $2,500 to $2,999 | 0 (0.0%) | 0 (0.0%) |
| $3,000 or more | 0 (0.0%) | 0 (0.0%) |
| Total | 178 (100.0%) | 162 (100.0%) |
Physical Housing Characteristics in Happy Camp
Housing Structures in Happy Camp
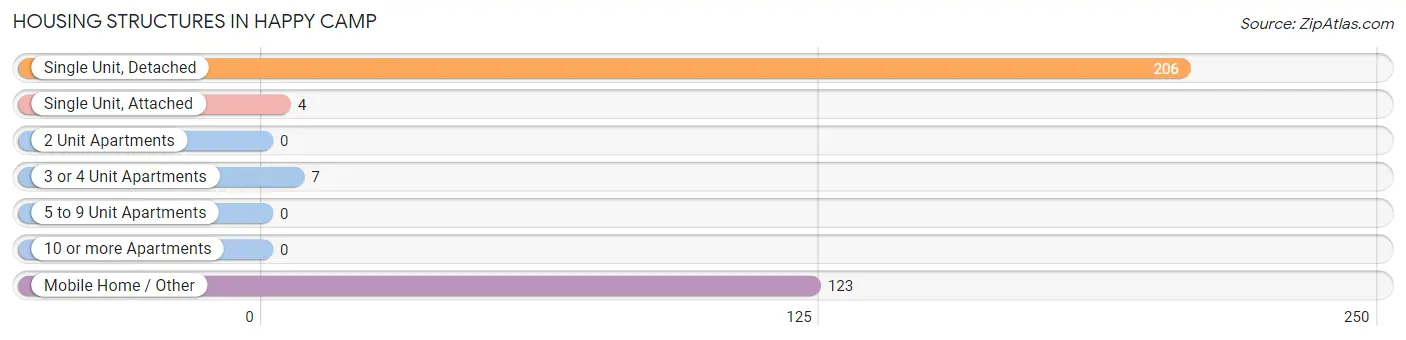
| Structure Type | # Housing Units | % Housing Units |
| Single Unit, Detached | 206 | 60.6% |
| Single Unit, Attached | 4 | 1.2% |
| 2 Unit Apartments | 0 | 0.0% |
| 3 or 4 Unit Apartments | 7 | 2.1% |
| 5 to 9 Unit Apartments | 0 | 0.0% |
| 10 or more Apartments | 0 | 0.0% |
| Mobile Home / Other | 123 | 36.2% |
| Total | 340 | 100.0% |
Housing Structures by Occupancy in Happy Camp
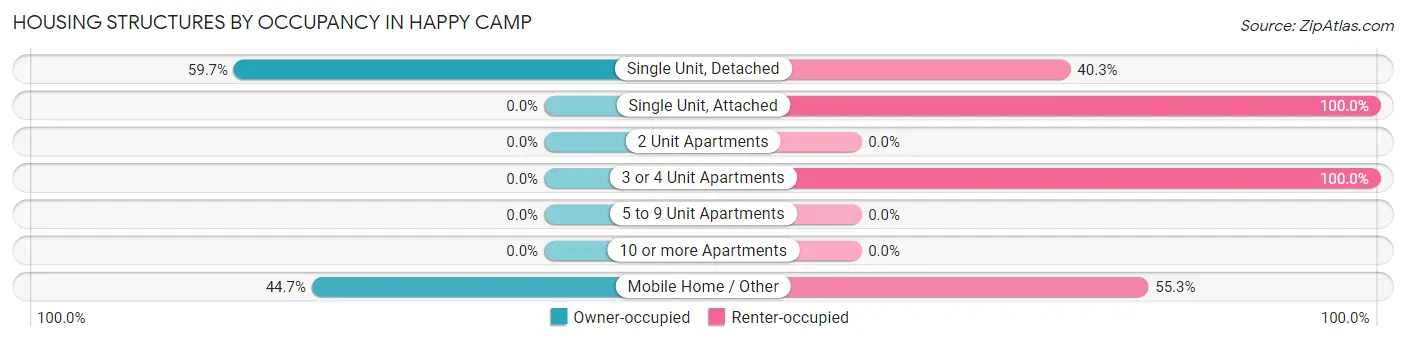
| Structure Type | Owner-occupied | Renter-occupied |
| Single Unit, Detached | 123 (59.7%) | 83 (40.3%) |
| Single Unit, Attached | 0 (0.0%) | 4 (100.0%) |
| 2 Unit Apartments | 0 (0.0%) | 0 (0.0%) |
| 3 or 4 Unit Apartments | 0 (0.0%) | 7 (100.0%) |
| 5 to 9 Unit Apartments | 0 (0.0%) | 0 (0.0%) |
| 10 or more Apartments | 0 (0.0%) | 0 (0.0%) |
| Mobile Home / Other | 55 (44.7%) | 68 (55.3%) |
| Total | 178 (52.3%) | 162 (47.6%) |
Housing Structures by Number of Rooms in Happy Camp
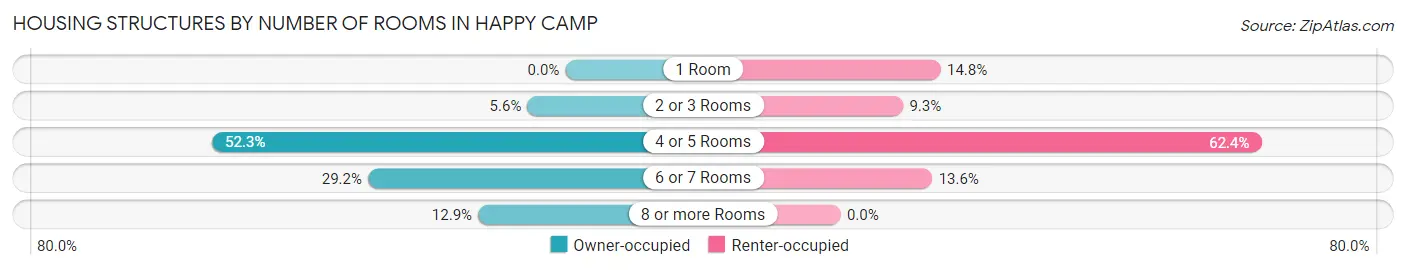
| Number of Rooms | Owner-occupied | Renter-occupied |
| 1 Room | 0 (0.0%) | 24 (14.8%) |
| 2 or 3 Rooms | 10 (5.6%) | 15 (9.3%) |
| 4 or 5 Rooms | 93 (52.2%) | 101 (62.4%) |
| 6 or 7 Rooms | 52 (29.2%) | 22 (13.6%) |
| 8 or more Rooms | 23 (12.9%) | 0 (0.0%) |
| Total | 178 (100.0%) | 162 (100.0%) |
Housing Structure by Heating Type in Happy Camp
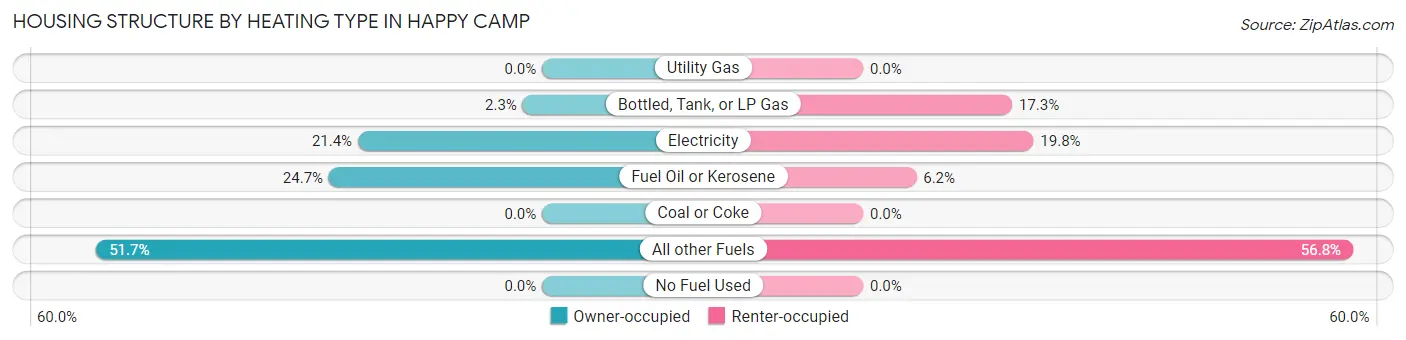
| Heating Type | Owner-occupied | Renter-occupied |
| Utility Gas | 0 (0.0%) | 0 (0.0%) |
| Bottled, Tank, or LP Gas | 4 (2.2%) | 28 (17.3%) |
| Electricity | 38 (21.3%) | 32 (19.8%) |
| Fuel Oil or Kerosene | 44 (24.7%) | 10 (6.2%) |
| Coal or Coke | 0 (0.0%) | 0 (0.0%) |
| All other Fuels | 92 (51.7%) | 92 (56.8%) |
| No Fuel Used | 0 (0.0%) | 0 (0.0%) |
| Total | 178 (100.0%) | 162 (100.0%) |
Household Vehicle Usage in Happy Camp
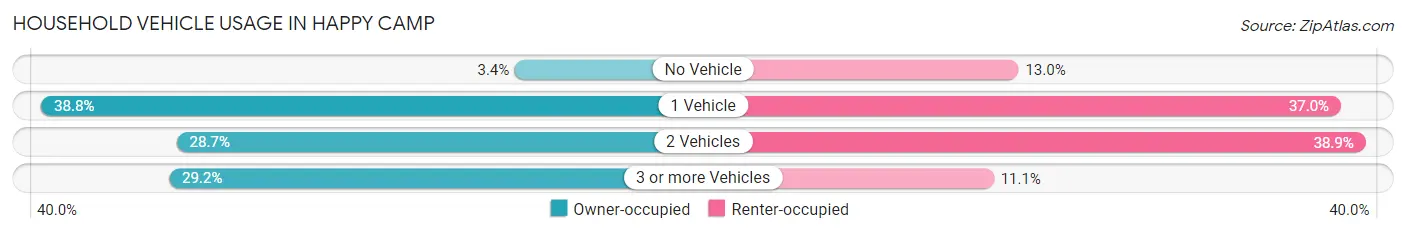
| Vehicles per Household | Owner-occupied | Renter-occupied |
| No Vehicle | 6 (3.4%) | 21 (13.0%) |
| 1 Vehicle | 69 (38.8%) | 60 (37.0%) |
| 2 Vehicles | 51 (28.6%) | 63 (38.9%) |
| 3 or more Vehicles | 52 (29.2%) | 18 (11.1%) |
| Total | 178 (100.0%) | 162 (100.0%) |
Real Estate & Mortgages in Happy Camp
Real Estate and Mortgage Overview in Happy Camp
| Characteristic | Without Mortgage | With Mortgage |
| Housing Units | 143 | 35 |
| Median Property Value | $177,000 | $181,900 |
| Median Household Income | $33,229 | $0 |
| Monthly Housing Costs | $366 | $0 |
| Real Estate Taxes | $876 | $0 |
Property Value by Mortgage Status in Happy Camp
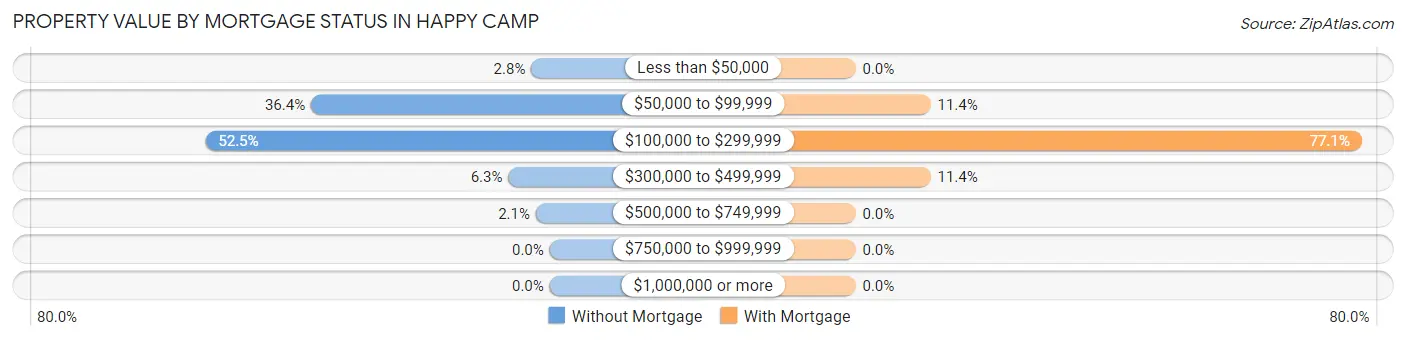
| Property Value | Without Mortgage | With Mortgage |
| Less than $50,000 | 4 (2.8%) | 0 (0.0%) |
| $50,000 to $99,999 | 52 (36.4%) | 4 (11.4%) |
| $100,000 to $299,999 | 75 (52.4%) | 27 (77.1%) |
| $300,000 to $499,999 | 9 (6.3%) | 4 (11.4%) |
| $500,000 to $749,999 | 3 (2.1%) | 0 (0.0%) |
| $750,000 to $999,999 | 0 (0.0%) | 0 (0.0%) |
| $1,000,000 or more | 0 (0.0%) | 0 (0.0%) |
| Total | 143 (100.0%) | 35 (100.0%) |
Household Income by Mortgage Status in Happy Camp
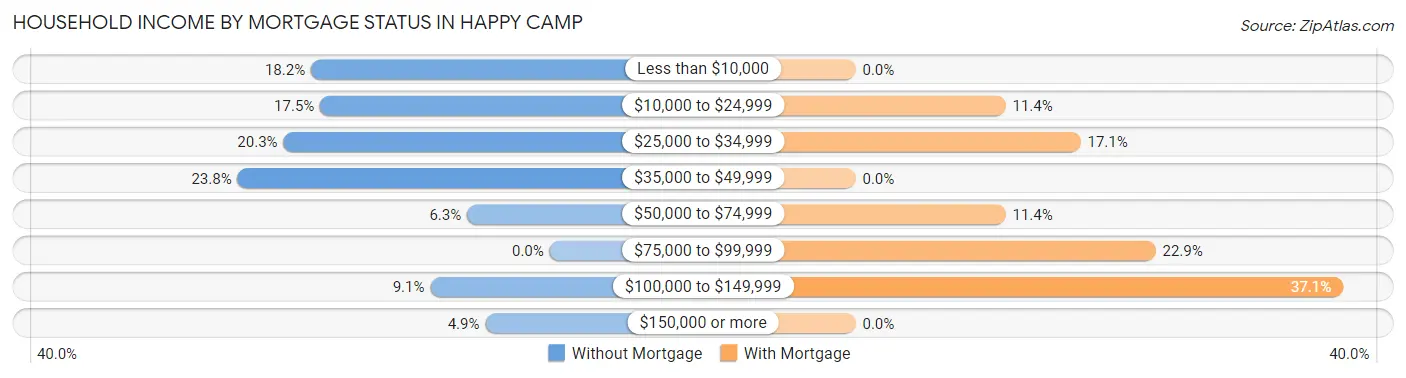
| Household Income | Without Mortgage | With Mortgage |
| Less than $10,000 | 26 (18.2%) | 0 (0.0%) |
| $10,000 to $24,999 | 25 (17.5%) | 4 (11.4%) |
| $25,000 to $34,999 | 29 (20.3%) | 6 (17.1%) |
| $35,000 to $49,999 | 34 (23.8%) | 0 (0.0%) |
| $50,000 to $74,999 | 9 (6.3%) | 4 (11.4%) |
| $75,000 to $99,999 | 0 (0.0%) | 8 (22.9%) |
| $100,000 to $149,999 | 13 (9.1%) | 13 (37.1%) |
| $150,000 or more | 7 (4.9%) | 0 (0.0%) |
| Total | 143 (100.0%) | 35 (100.0%) |
Property Value to Household Income Ratio in Happy Camp
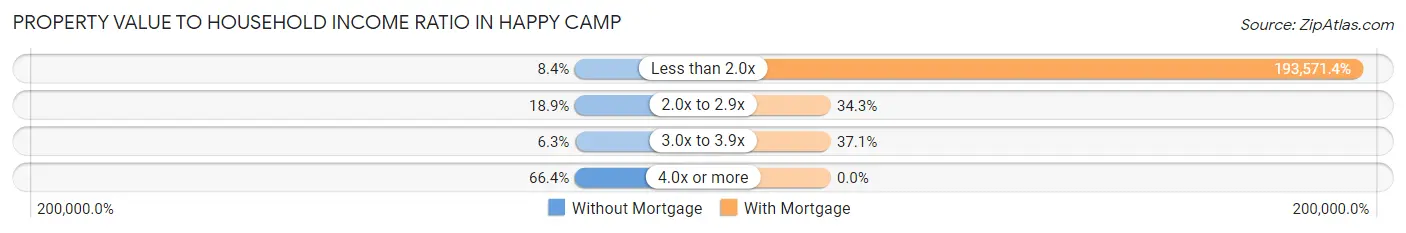
| Value-to-Income Ratio | Without Mortgage | With Mortgage |
| Less than 2.0x | 12 (8.4%) | 67,750 (193,571.4%) |
| 2.0x to 2.9x | 27 (18.9%) | 12 (34.3%) |
| 3.0x to 3.9x | 9 (6.3%) | 13 (37.1%) |
| 4.0x or more | 95 (66.4%) | 0 (0.0%) |
| Total | 143 (100.0%) | 35 (100.0%) |
Real Estate Taxes by Mortgage Status in Happy Camp
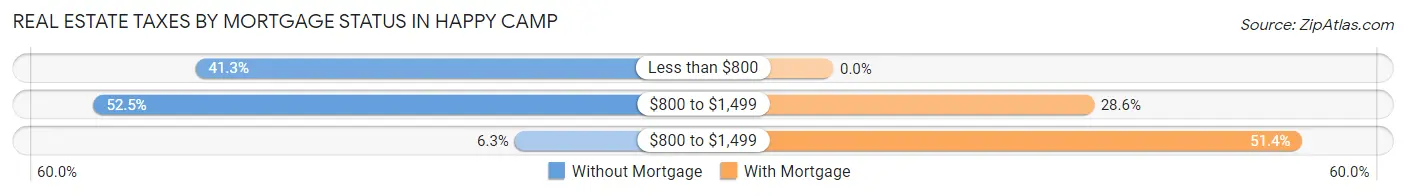
| Property Taxes | Without Mortgage | With Mortgage |
| Less than $800 | 59 (41.3%) | 0 (0.0%) |
| $800 to $1,499 | 75 (52.4%) | 10 (28.6%) |
| $800 to $1,499 | 9 (6.3%) | 18 (51.4%) |
| Total | 143 (100.0%) | 35 (100.0%) |
Health & Disability in Happy Camp
Health Insurance Coverage by Age in Happy Camp
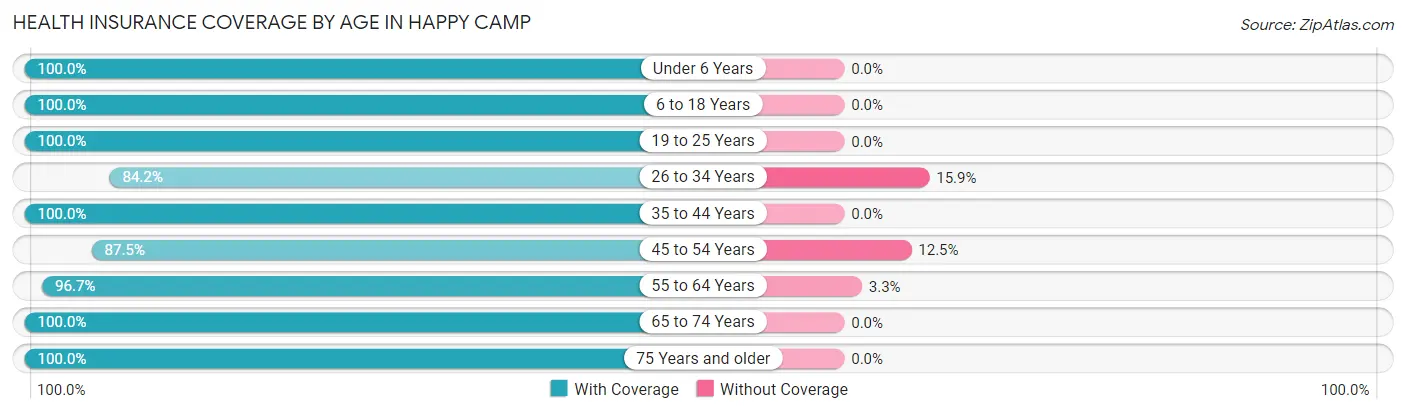
| Age Bracket | With Coverage | Without Coverage |
| Under 6 Years | 59 (100.0%) | 0 (0.0%) |
| 6 to 18 Years | 47 (100.0%) | 0 (0.0%) |
| 19 to 25 Years | 27 (100.0%) | 0 (0.0%) |
| 26 to 34 Years | 69 (84.2%) | 13 (15.9%) |
| 35 to 44 Years | 32 (100.0%) | 0 (0.0%) |
| 45 to 54 Years | 35 (87.5%) | 5 (12.5%) |
| 55 to 64 Years | 177 (96.7%) | 6 (3.3%) |
| 65 to 74 Years | 112 (100.0%) | 0 (0.0%) |
| 75 Years and older | 86 (100.0%) | 0 (0.0%) |
| Total | 644 (96.4%) | 24 (3.6%) |
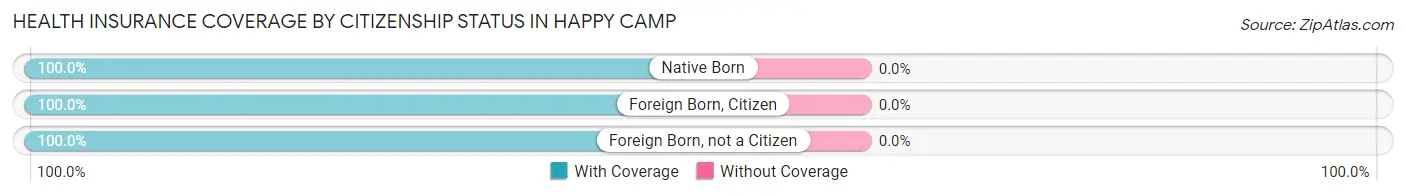
Health Insurance Coverage by Citizenship Status in Happy Camp
| Citizenship Status | With Coverage | Without Coverage |
| Native Born | 59 (100.0%) | 0 (0.0%) |
| Foreign Born, Citizen | 47 (100.0%) | 0 (0.0%) |
| Foreign Born, not a Citizen | 27 (100.0%) | 0 (0.0%) |
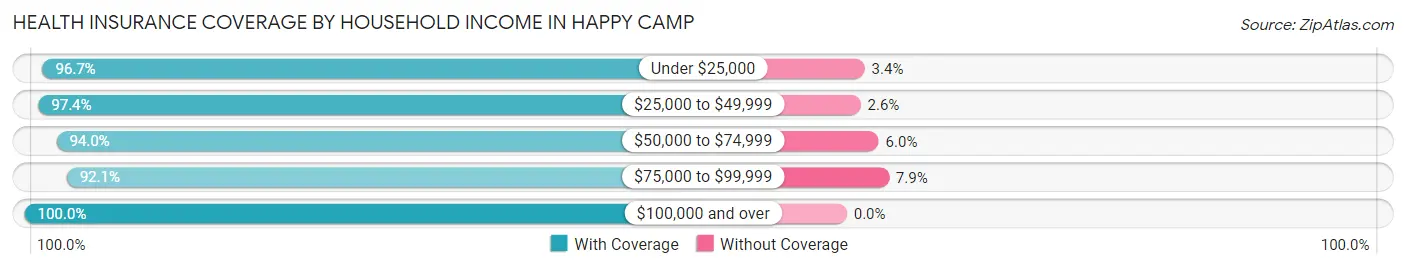
Health Insurance Coverage by Household Income in Happy Camp
| Household Income | With Coverage | Without Coverage |
| Under $25,000 | 173 (96.7%) | 6 (3.4%) |
| $25,000 to $49,999 | 264 (97.4%) | 7 (2.6%) |
| $50,000 to $74,999 | 126 (94.0%) | 8 (6.0%) |
| $75,000 to $99,999 | 35 (92.1%) | 3 (7.9%) |
| $100,000 and over | 46 (100.0%) | 0 (0.0%) |
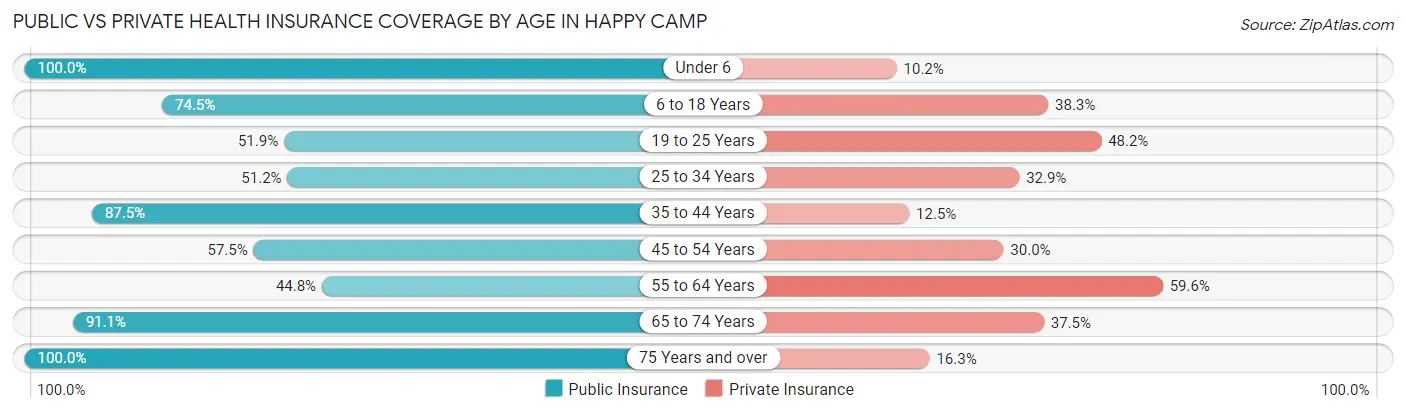
Public vs Private Health Insurance Coverage by Age in Happy Camp
| Age Bracket | Public Insurance | Private Insurance |
| Under 6 | 59 (100.0%) | 6 (10.2%) |
| 6 to 18 Years | 35 (74.5%) | 18 (38.3%) |
| 19 to 25 Years | 14 (51.8%) | 13 (48.1%) |
| 25 to 34 Years | 42 (51.2%) | 27 (32.9%) |
| 35 to 44 Years | 28 (87.5%) | 4 (12.5%) |
| 45 to 54 Years | 23 (57.5%) | 12 (30.0%) |
| 55 to 64 Years | 82 (44.8%) | 109 (59.6%) |
| 65 to 74 Years | 102 (91.1%) | 42 (37.5%) |
| 75 Years and over | 86 (100.0%) | 14 (16.3%) |
| Total | 471 (70.5%) | 245 (36.7%) |
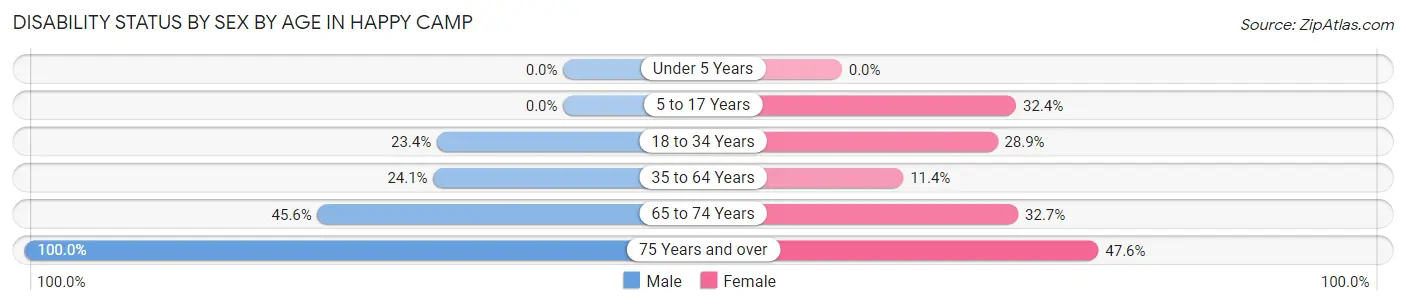
Disability Status by Sex by Age in Happy Camp
| Age Bracket | Male | Female |
| Under 5 Years | 0 (0.0%) | 0 (0.0%) |
| 5 to 17 Years | 0 (0.0%) | 11 (32.4%) |
| 18 to 34 Years | 15 (23.4%) | 13 (28.9%) |
| 35 to 64 Years | 34 (24.1%) | 13 (11.4%) |
| 65 to 74 Years | 26 (45.6%) | 18 (32.7%) |
| 75 Years and over | 44 (100.0%) | 20 (47.6%) |
Disability Class by Sex by Age in Happy Camp
Disability Class: Hearing Difficulty
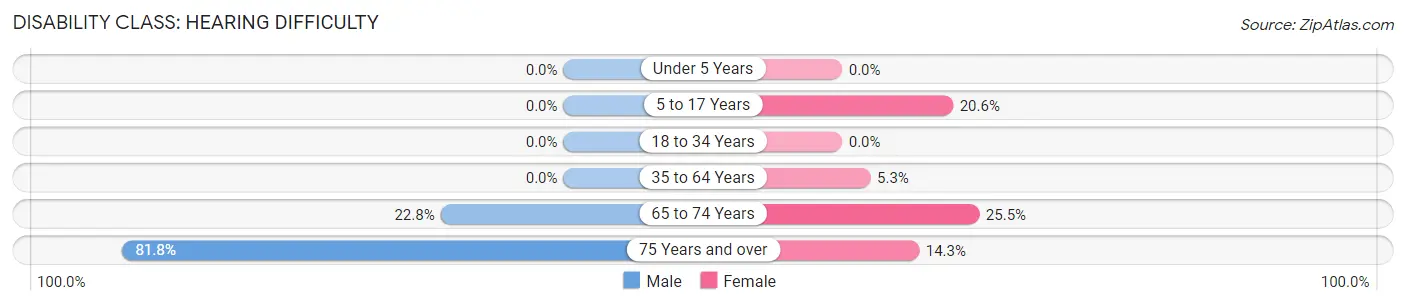
| Age Bracket | Male | Female |
| Under 5 Years | 0 (0.0%) | 0 (0.0%) |
| 5 to 17 Years | 0 (0.0%) | 7 (20.6%) |
| 18 to 34 Years | 0 (0.0%) | 0 (0.0%) |
| 35 to 64 Years | 0 (0.0%) | 6 (5.3%) |
| 65 to 74 Years | 13 (22.8%) | 14 (25.5%) |
| 75 Years and over | 36 (81.8%) | 6 (14.3%) |
Disability Class: Vision Difficulty
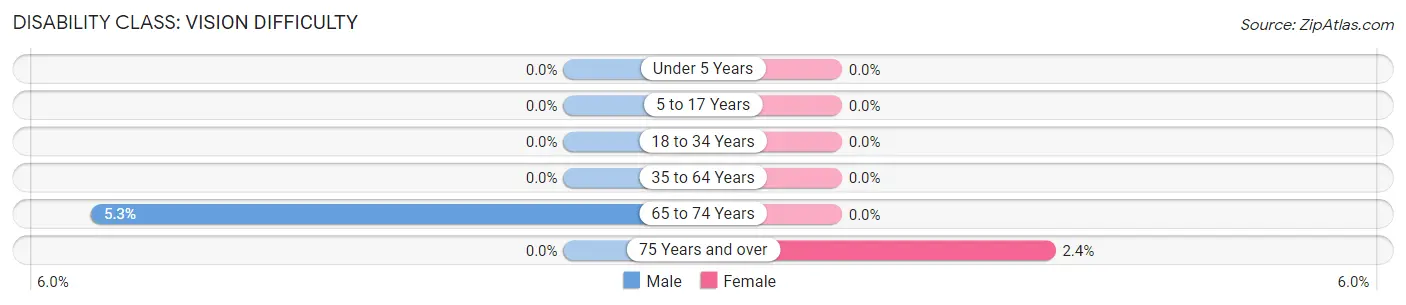
| Age Bracket | Male | Female |
| Under 5 Years | 0 (0.0%) | 0 (0.0%) |
| 5 to 17 Years | 0 (0.0%) | 0 (0.0%) |
| 18 to 34 Years | 0 (0.0%) | 0 (0.0%) |
| 35 to 64 Years | 0 (0.0%) | 0 (0.0%) |
| 65 to 74 Years | 3 (5.3%) | 0 (0.0%) |
| 75 Years and over | 0 (0.0%) | 1 (2.4%) |
Disability Class: Cognitive Difficulty
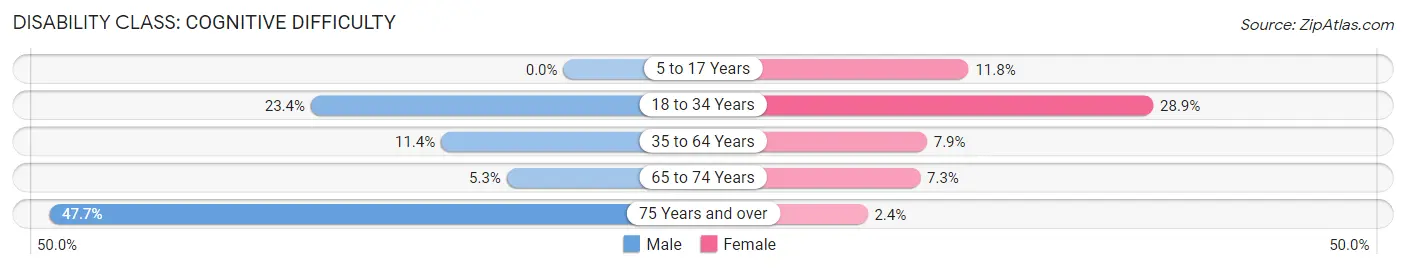
| Age Bracket | Male | Female |
| 5 to 17 Years | 0 (0.0%) | 4 (11.8%) |
| 18 to 34 Years | 15 (23.4%) | 13 (28.9%) |
| 35 to 64 Years | 16 (11.4%) | 9 (7.9%) |
| 65 to 74 Years | 3 (5.3%) | 4 (7.3%) |
| 75 Years and over | 21 (47.7%) | 1 (2.4%) |
Disability Class: Ambulatory Difficulty
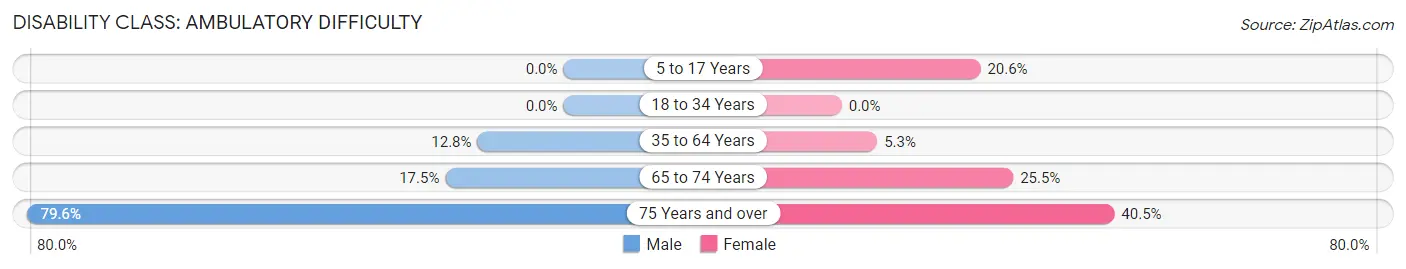
| Age Bracket | Male | Female |
| 5 to 17 Years | 0 (0.0%) | 7 (20.6%) |
| 18 to 34 Years | 0 (0.0%) | 0 (0.0%) |
| 35 to 64 Years | 18 (12.8%) | 6 (5.3%) |
| 65 to 74 Years | 10 (17.5%) | 14 (25.5%) |
| 75 Years and over | 35 (79.5%) | 17 (40.5%) |
Disability Class: Self-Care Difficulty
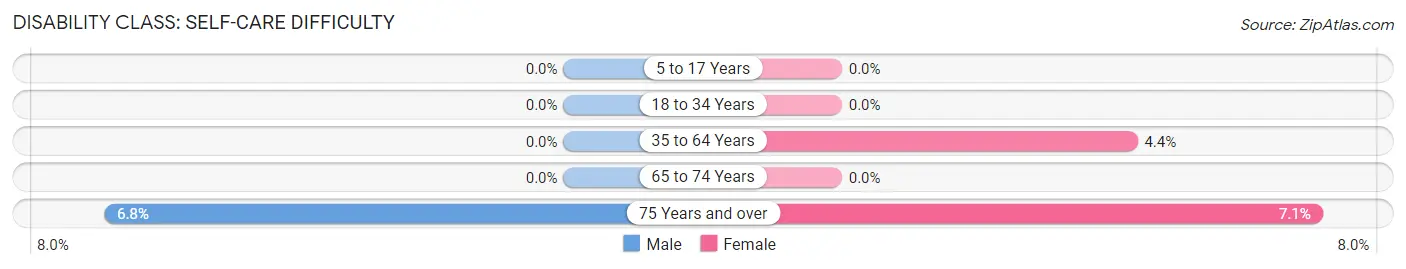
| Age Bracket | Male | Female |
| 5 to 17 Years | 0 (0.0%) | 0 (0.0%) |
| 18 to 34 Years | 0 (0.0%) | 0 (0.0%) |
| 35 to 64 Years | 0 (0.0%) | 5 (4.4%) |
| 65 to 74 Years | 0 (0.0%) | 0 (0.0%) |
| 75 Years and over | 3 (6.8%) | 3 (7.1%) |
Technology Access in Happy Camp
Computing Device Access in Happy Camp
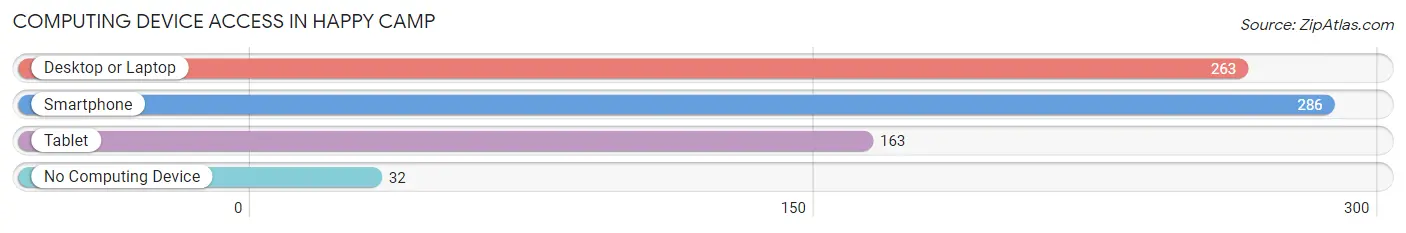
| Device Type | # Households | % Households |
| Desktop or Laptop | 263 | 77.3% |
| Smartphone | 286 | 84.1% |
| Tablet | 163 | 47.9% |
| No Computing Device | 32 | 9.4% |
| Total | 340 | 100.0% |
Internet Access in Happy Camp
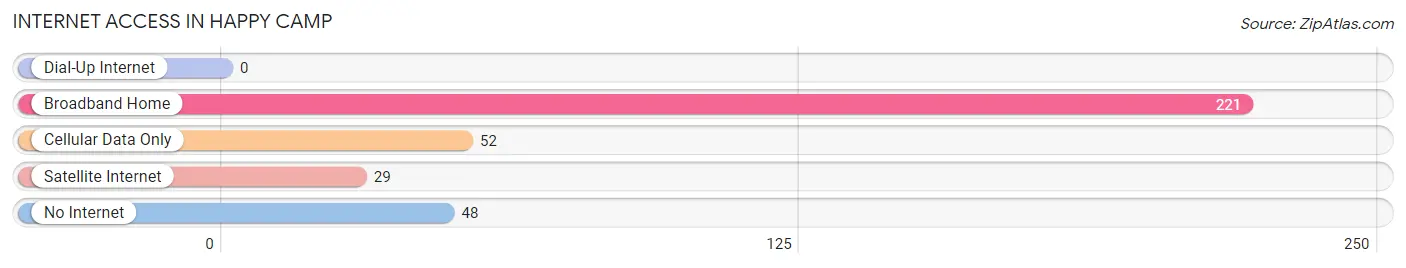
| Internet Type | # Households | % Households |
| Dial-Up Internet | 0 | 0.0% |
| Broadband Home | 221 | 65.0% |
| Cellular Data Only | 52 | 15.3% |
| Satellite Internet | 29 | 8.5% |
| No Internet | 48 | 14.1% |
| Total | 340 | 100.0% |
Happy Camp Summary
History
Happy Camp is a small unincorporated community located in Siskiyou County, California. It is situated in the Klamath National Forest, along the Klamath River, and is home to the Karuk Tribe of Native Americans. The town was originally established in the late 1800s as a mining camp, and was named after the nearby Happy Camp Mine. The mine was discovered in 1851 by a group of prospectors, and was the first gold mine in the area. The town quickly grew, and by the early 1900s, it had become a bustling community with a population of over 1,000 people.
The town was home to a variety of businesses, including a hotel, saloon, general store, and a post office. The town also had a school, which was attended by both Native American and non-Native American children. The town was also home to a number of churches, including the First Baptist Church, which was established in 1891.
In the early 1900s, the town began to decline as the gold mines in the area began to run dry. By the 1950s, the population had dropped to just over 200 people. In the 1960s, the town was revitalized when the Karuk Tribe of Native Americans established a reservation in the area. The tribe has since become the largest employer in the area, and has helped to bring new life to the town.
Geography
Happy Camp is located in Siskiyou County, California, in the Klamath National Forest. It is situated along the Klamath River, at an elevation of 2,000 feet. The town is surrounded by mountains, including the Marble Mountains to the east, the Trinity Alps to the south, and the Salmon Mountains to the west. The town is located approximately 40 miles east of Yreka, California, and is accessible via State Route 96.
The climate in Happy Camp is generally mild, with hot summers and cold winters. The average high temperature in the summer is around 90 degrees Fahrenheit, and the average low temperature in the winter is around 30 degrees Fahrenheit. The area receives an average of 30 inches of precipitation per year, with most of it falling in the winter months.
Economy
The economy of Happy Camp is largely based on tourism and the timber industry. The town is home to a number of tourist attractions, including the Klamath River, the Marble Mountains, and the Salmon Mountains. The town is also home to a number of outdoor recreation activities, including fishing, hunting, camping, and hiking.
The timber industry is also an important part of the local economy. The Klamath National Forest is home to a variety of trees, including Douglas fir, ponderosa pine, and white fir. The timber industry provides jobs for many of the town’s residents, and is an important source of income for the local economy.
Demographics
As of the 2010 census, the population of Happy Camp was 1,190. The racial makeup of the town was 94.3% White, 0.3% African American, 1.2% Native American, 0.2% Asian, 0.1% Pacific Islander, 0.7% from other races, and 2.4% from two or more races. The median household income was $30,938, and the median family income was $35,625. The per capita income was $15,945.
The town is home to the Karuk Tribe of Native Americans, who make up the majority of the population. The Karuk Tribe is the largest employer in the area, and is an important part of the local economy. The tribe is also involved in a number of cultural activities, including traditional dances, ceremonies, and festivals.
Common Questions
What is the Total Population of Happy Camp?
Total Population of Happy Camp is 679.
What is the Total Male Population of Happy Camp?
Total Male Population of Happy Camp is 364.
What is the Total Female Population of Happy Camp?
Total Female Population of Happy Camp is 315.
What is the Ratio of Males per 100 Females in Happy Camp?
There are 115.56 Males per 100 Females in Happy Camp.
What is the Ratio of Females per 100 Males in Happy Camp?
There are 86.54 Females per 100 Males in Happy Camp.
What is the Median Population Age in Happy Camp?
Median Population Age in Happy Camp is 59.7 Years.
What is the Average Family Size in Happy Camp
Average Family Size in Happy Camp is 2.5 People.
What is the Average Household Size in Happy Camp
Average Household Size in Happy Camp is 2.0 People.
What is Per Capita Income in Happy Camp?
Per Capita income in Happy Camp is $27,297.
What is the Median Family Income in Happy Camp?
Median Family Income in Happy Camp is $40,795.
What is the Median Household income in Happy Camp?
Median Household Income in Happy Camp is $37,841.
What is Income or Wage Gap in Happy Camp?
Income or Wage Gap in Happy Camp is 36.9%.
Women in Happy Camp earn 63.1 cents for every dollar earned by a man.
What is Inequality or Gini Index in Happy Camp?
Inequality or Gini Index in Happy Camp is 0.56.
How Large is the Labor Force in Happy Camp?
There are 263 People in the Labor Forcein in Happy Camp.
What is the Percentage of People in the Labor Force in Happy Camp?
45.3% of People are in the Labor Force in Happy Camp.
What is the Unemployment Rate in Happy Camp?
Unemployment Rate in Happy Camp is 26.6%.