Greenhorn, CA
Greenhorn Map
Greenhorn Overview
174
TOTAL POPULATION
107
MALE POPULATION
67
FEMALE POPULATION
159.70
MALES / 100 FEMALES
62.62
FEMALES / 100 MALES
64.6
MEDIAN AGE
3.2
AVG FAMILY SIZE
1.8
AVG HOUSEHOLD SIZE
$22,467
PER CAPITA INCOME
$28,984
AVG HOUSEHOLD INCOME
0.45
INEQUALITY / GINI INDEX
53
LABOR FORCE [ PEOPLE ]
30.5%
PERCENT IN LABOR FORCE
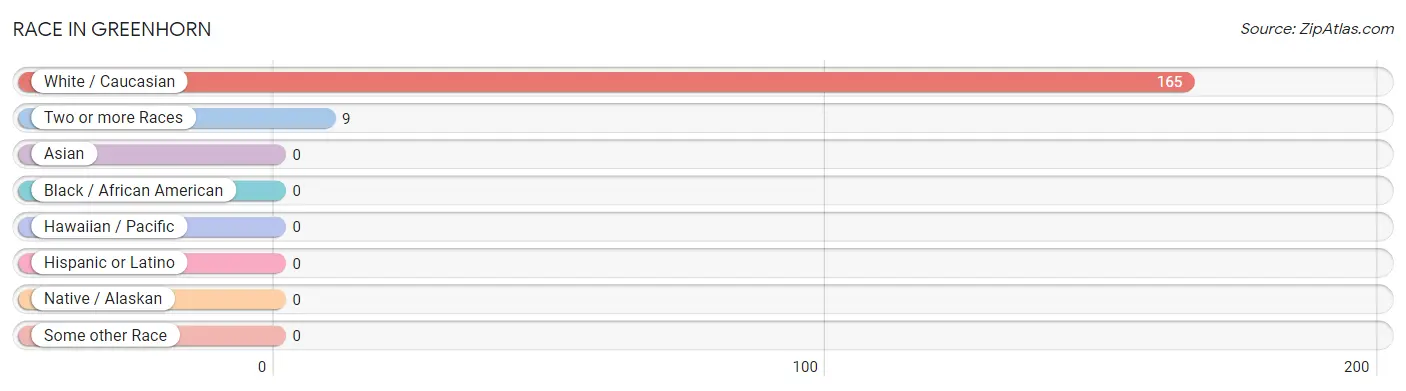
Race in Greenhorn
The most populous races in Greenhorn are White / Caucasian (165 | 94.8%), and Two or more Races (9 | 5.2%).
| Race | # Population | % Population |
| Asian | 0 | 0.0% |
| Black / African American | 0 | 0.0% |
| Hawaiian / Pacific | 0 | 0.0% |
| Hispanic or Latino | 0 | 0.0% |
| Native / Alaskan | 0 | 0.0% |
| White / Caucasian | 165 | 94.8% |
| Two or more Races | 9 | 5.2% |
| Some other Race | 0 | 0.0% |
| Total | 174 | 100.0% |
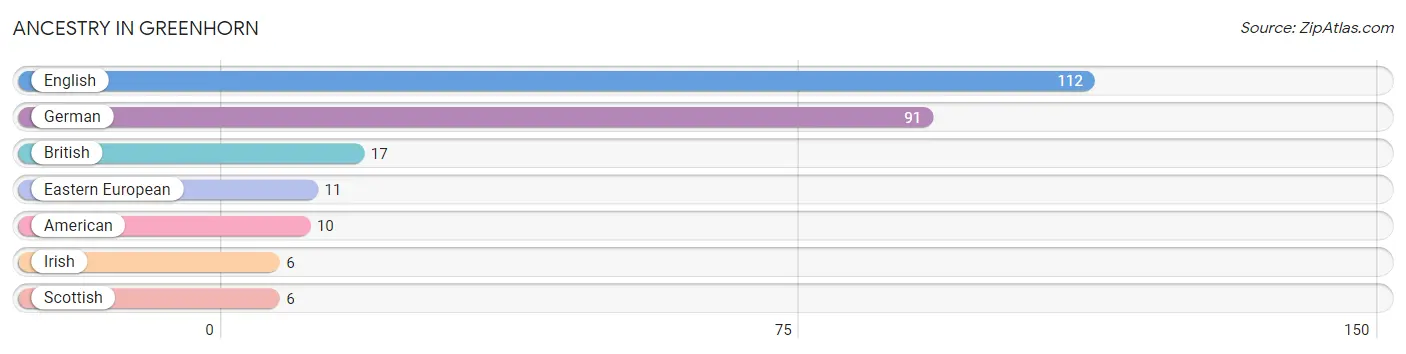
Ancestry in Greenhorn
The most populous ancestries reported in Greenhorn are English (112 | 64.4%), German (91 | 52.3%), British (17 | 9.8%), Eastern European (11 | 6.3%), and American (10 | 5.8%), together accounting for 138.5% of all Greenhorn residents.
| Ancestry | # Population | % Population |
| American | 10 | 5.8% |
| British | 17 | 9.8% |
| Eastern European | 11 | 6.3% |
| English | 112 | 64.4% |
| German | 91 | 52.3% |
| Irish | 6 | 3.5% |
| Scottish | 6 | 3.5% | View All 7 Rows |
Immigrants in Greenhorn

| Immigration Origin | # Population | % Population | View All 0 Rows |
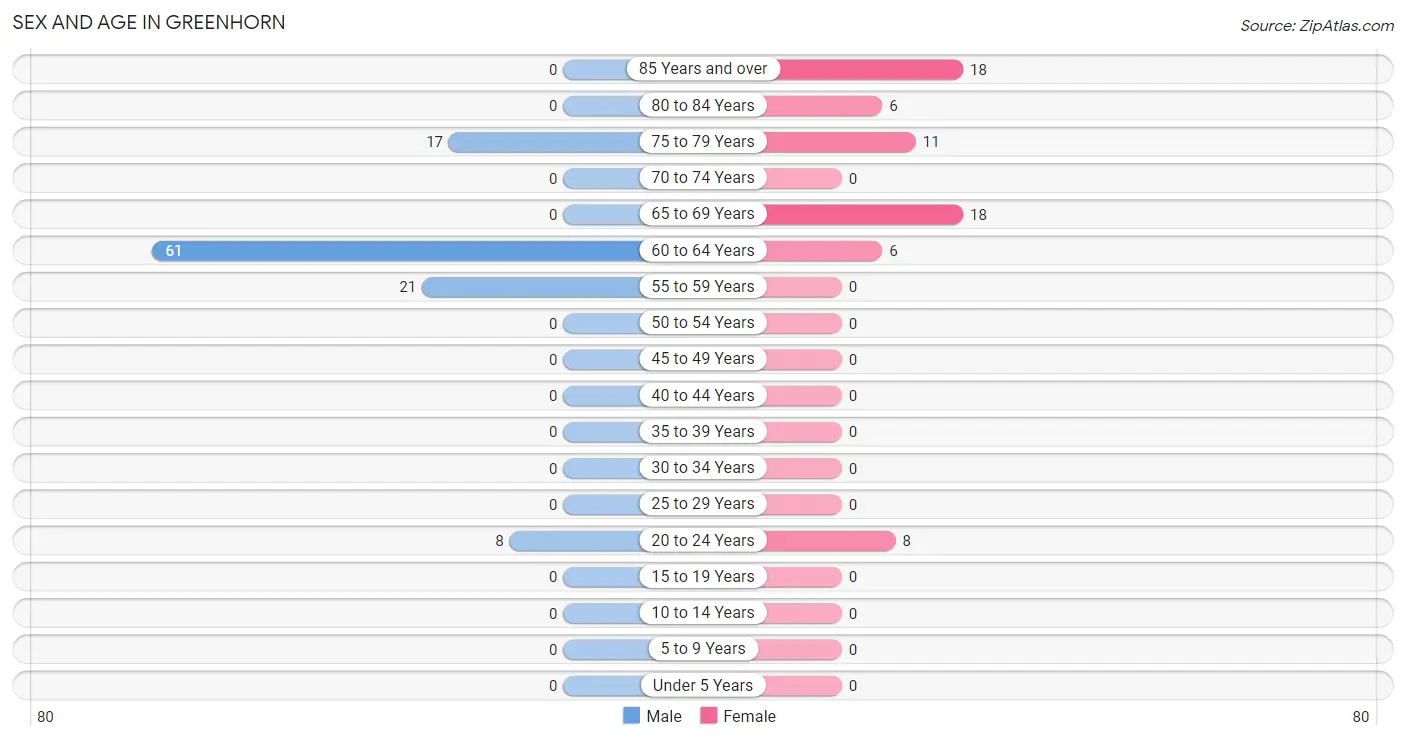
Sex and Age in Greenhorn
Sex and Age in Greenhorn
The most populous age groups in Greenhorn are 60 to 64 Years (61 | 57.0%) for men and 65 to 69 Years (18 | 26.9%) for women.
| Age Bracket | Male | Female |
| Under 5 Years | 0 (0.0%) | 0 (0.0%) |
| 5 to 9 Years | 0 (0.0%) | 0 (0.0%) |
| 10 to 14 Years | 0 (0.0%) | 0 (0.0%) |
| 15 to 19 Years | 0 (0.0%) | 0 (0.0%) |
| 20 to 24 Years | 8 (7.5%) | 8 (11.9%) |
| 25 to 29 Years | 0 (0.0%) | 0 (0.0%) |
| 30 to 34 Years | 0 (0.0%) | 0 (0.0%) |
| 35 to 39 Years | 0 (0.0%) | 0 (0.0%) |
| 40 to 44 Years | 0 (0.0%) | 0 (0.0%) |
| 45 to 49 Years | 0 (0.0%) | 0 (0.0%) |
| 50 to 54 Years | 0 (0.0%) | 0 (0.0%) |
| 55 to 59 Years | 21 (19.6%) | 0 (0.0%) |
| 60 to 64 Years | 61 (57.0%) | 6 (9.0%) |
| 65 to 69 Years | 0 (0.0%) | 18 (26.9%) |
| 70 to 74 Years | 0 (0.0%) | 0 (0.0%) |
| 75 to 79 Years | 17 (15.9%) | 11 (16.4%) |
| 80 to 84 Years | 0 (0.0%) | 6 (9.0%) |
| 85 Years and over | 0 (0.0%) | 18 (26.9%) |
| Total | 107 (100.0%) | 67 (100.0%) |
Families and Households in Greenhorn
Median Family Size in Greenhorn
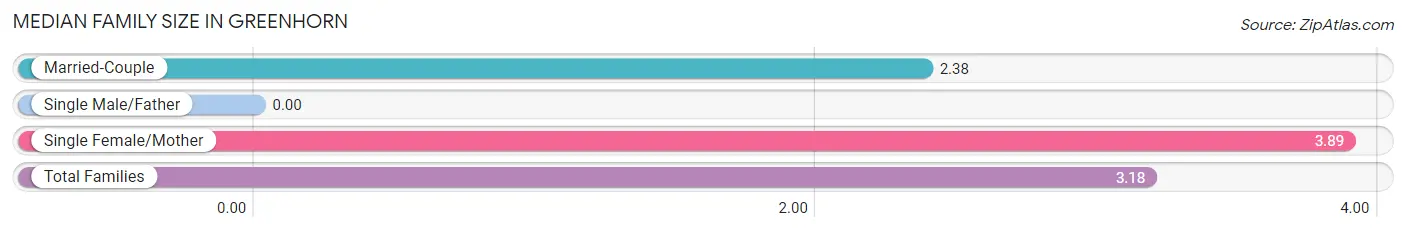
| Family Type | # Families | Family Size |
| Married-Couple | 16 (47.1%) | 2.38 |
| Single Male/Father | 0 (0.0%) | - |
| Single Female/Mother | 18 (52.9%) | 3.89 |
| Total Families | 34 (100.0%) | 3.18 |
Median Household Size in Greenhorn
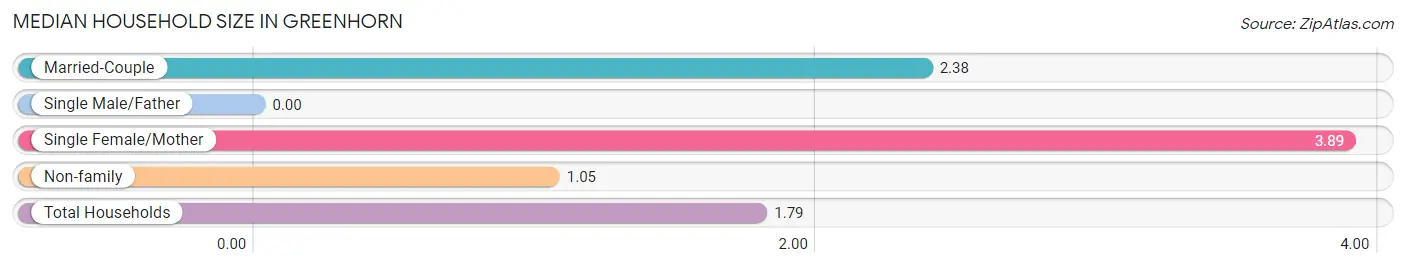
| Household Type | # Households | Household Size |
| Married-Couple | 16 (16.5%) | 2.38 |
| Single Male/Father | 0 (0.0%) | - |
| Single Female/Mother | 18 (18.6%) | 3.89 |
| Non-family | 63 (64.9%) | 1.05 |
| Total Households | 97 (100.0%) | 1.79 |
Household Size by Marriage Status in Greenhorn
Out of a total of 97 households in Greenhorn, 34 (35.0%) are family households, while 63 (64.9%) are nonfamily households. The most numerous type of family households are 3-person households, comprising 18, and the most common type of nonfamily households are 1-person households, comprising 60.
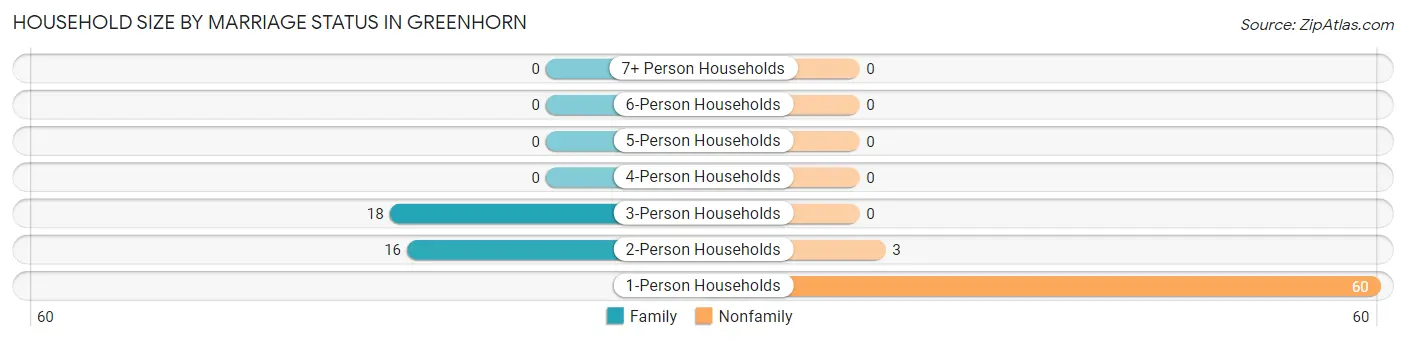
| Household Size | Family Households | Nonfamily Households |
| 1-Person Households | - | 60 (61.9%) |
| 2-Person Households | 16 (16.5%) | 3 (3.1%) |
| 3-Person Households | 18 (18.6%) | 0 (0.0%) |
| 4-Person Households | 0 (0.0%) | 0 (0.0%) |
| 5-Person Households | 0 (0.0%) | 0 (0.0%) |
| 6-Person Households | 0 (0.0%) | 0 (0.0%) |
| 7+ Person Households | 0 (0.0%) | 0 (0.0%) |
| Total | 34 (35.0%) | 63 (64.9%) |
Female Fertility in Greenhorn
Fertility by Age in Greenhorn
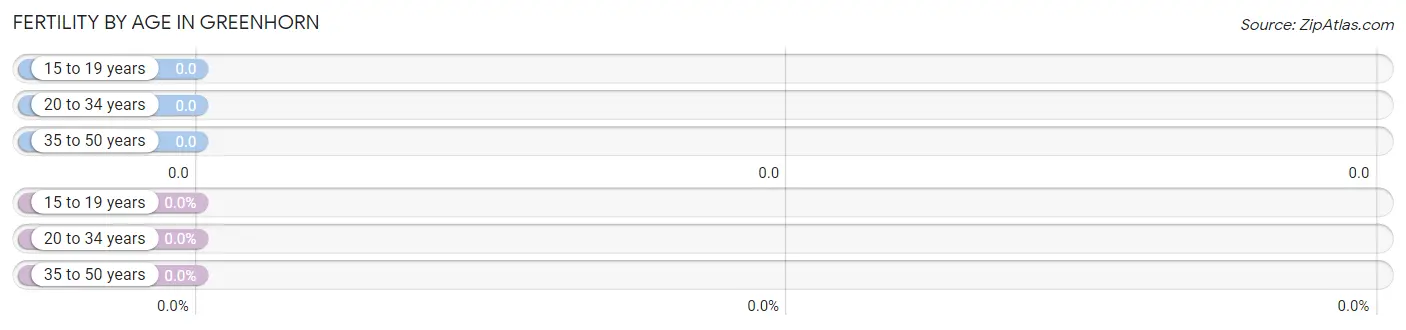
| Age Bracket | Women with Births | Births / 1,000 Women |
| 15 to 19 years | 0 (0.0%) | 0.0 |
| 20 to 34 years | 0 (0.0%) | 0.0 |
| 35 to 50 years | 0 (0.0%) | 0.0 |
| Total | 0 (0.0%) | 0.0 |
Fertility by Age by Marriage Status in Greenhorn
| Age Bracket | Married | Unmarried |
| 15 to 19 years | 0 (0.0%) | 0 (0.0%) |
| 20 to 34 years | 0 (0.0%) | 0 (0.0%) |
| 35 to 50 years | 0 (0.0%) | 0 (0.0%) |
| Total | 0 (0.0%) | 0 (0.0%) |
Fertility by Education in Greenhorn
| Educational Attainment | Women with Births | Births / 1,000 Women |
| Less than High School | 0 (0.0%) | 0.0 |
| High School Diploma | 0 (0.0%) | 0.0 |
| College or Associate's Degree | 0 (0.0%) | 0.0 |
| Bachelor's Degree | 0 (0.0%) | 0.0 |
| Graduate Degree | 0 (0.0%) | 0.0 |
| Total | 0 (0.0%) | 0.0 |
Fertility by Education by Marriage Status in Greenhorn
| Educational Attainment | Married | Unmarried |
| Less than High School | 0 (0.0%) | 0 (0.0%) |
| High School Diploma | 0 (0.0%) | 0 (0.0%) |
| College or Associate's Degree | 0 (0.0%) | 0 (0.0%) |
| Bachelor's Degree | 0 (0.0%) | 0 (0.0%) |
| Graduate Degree | 0 (0.0%) | 0 (0.0%) |
| Total | 0 (0.0%) | 0 (0.0%) |
Income in Greenhorn
Income Overview in Greenhorn
| Characteristic | Number | Measure |
| Per Capita Income | 174 | $22,467 |
| Median Family Income | 34 | $0 |
| Mean Family Income | 34 | $58,400 |
| Median Household Income | 97 | $28,984 |
| Mean Household Income | 97 | $37,866 |
| Income Deficit | 34 | $0 |
| Wage / Income Gap (%) | 174 | 0.00% |
| Wage / Income Gap ($) | 174 | 100.00¢ per $1 |
| Gini / Inequality Index | 174 | 0.45 |
Earnings by Sex in Greenhorn
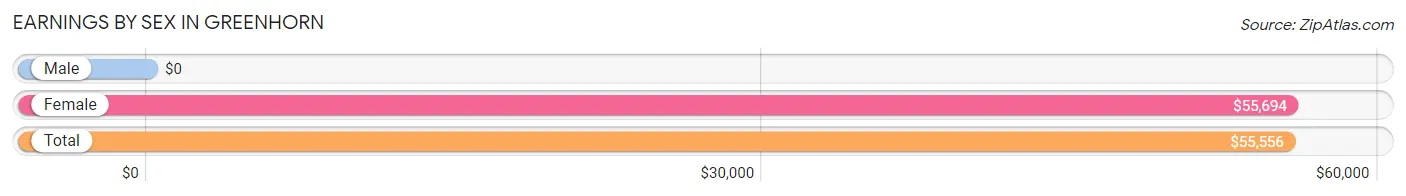
| Sex | Number | Average Earnings |
| Male | 32 (55.2%) | $0 |
| Female | 26 (44.8%) | $55,694 |
| Total | 58 (100.0%) | $55,556 |
Earnings by Sex by Income Bracket in Greenhorn
The most common earnings brackets in Greenhorn are $65,000 to $74,999 for men (15 | 46.9%) and $55,000 to $64,999 for women (18 | 69.2%).
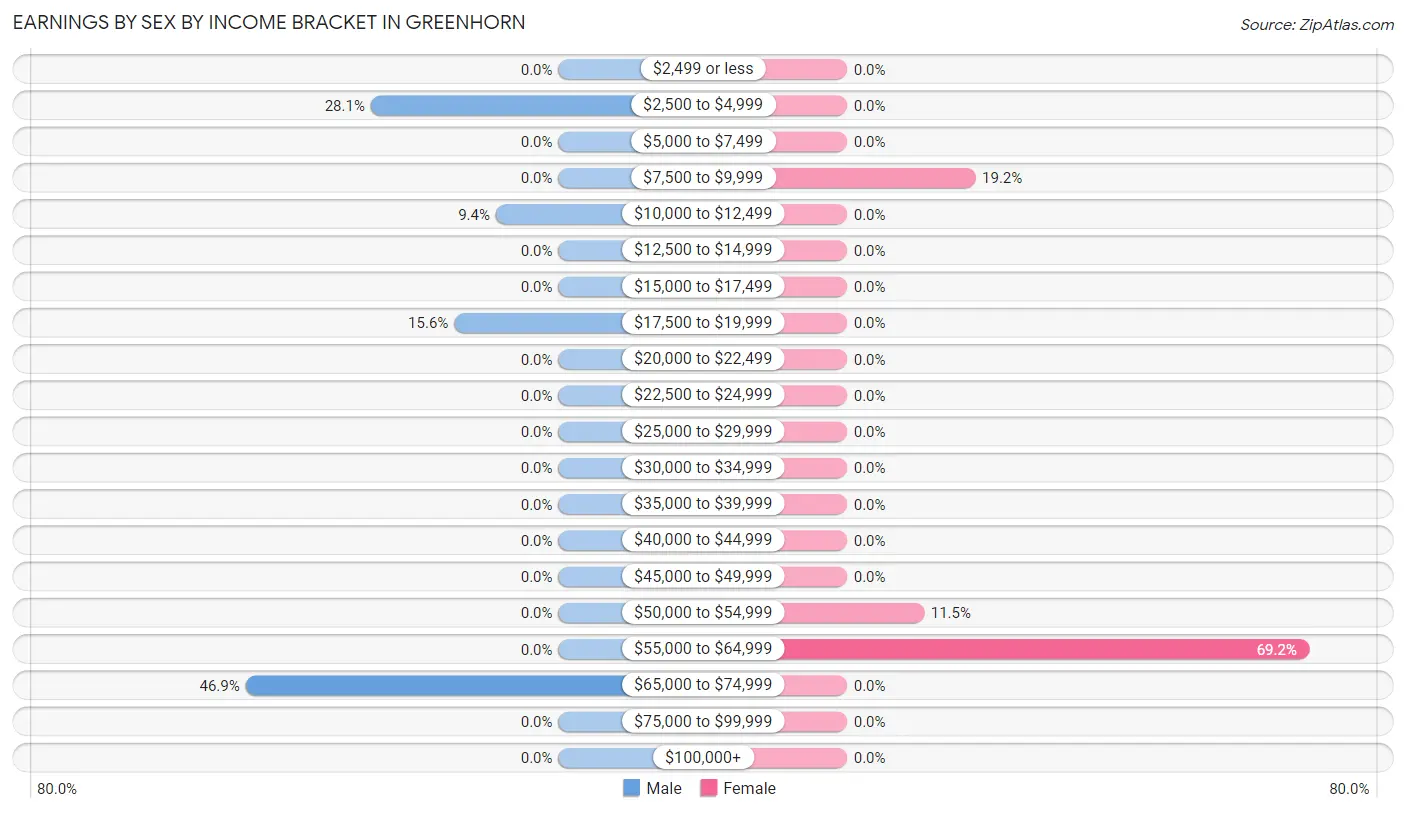
| Income | Male | Female |
| $2,499 or less | 0 (0.0%) | 0 (0.0%) |
| $2,500 to $4,999 | 9 (28.1%) | 0 (0.0%) |
| $5,000 to $7,499 | 0 (0.0%) | 0 (0.0%) |
| $7,500 to $9,999 | 0 (0.0%) | 5 (19.2%) |
| $10,000 to $12,499 | 3 (9.4%) | 0 (0.0%) |
| $12,500 to $14,999 | 0 (0.0%) | 0 (0.0%) |
| $15,000 to $17,499 | 0 (0.0%) | 0 (0.0%) |
| $17,500 to $19,999 | 5 (15.6%) | 0 (0.0%) |
| $20,000 to $22,499 | 0 (0.0%) | 0 (0.0%) |
| $22,500 to $24,999 | 0 (0.0%) | 0 (0.0%) |
| $25,000 to $29,999 | 0 (0.0%) | 0 (0.0%) |
| $30,000 to $34,999 | 0 (0.0%) | 0 (0.0%) |
| $35,000 to $39,999 | 0 (0.0%) | 0 (0.0%) |
| $40,000 to $44,999 | 0 (0.0%) | 0 (0.0%) |
| $45,000 to $49,999 | 0 (0.0%) | 0 (0.0%) |
| $50,000 to $54,999 | 0 (0.0%) | 3 (11.5%) |
| $55,000 to $64,999 | 0 (0.0%) | 18 (69.2%) |
| $65,000 to $74,999 | 15 (46.9%) | 0 (0.0%) |
| $75,000 to $99,999 | 0 (0.0%) | 0 (0.0%) |
| $100,000+ | 0 (0.0%) | 0 (0.0%) |
| Total | 32 (100.0%) | 26 (100.0%) |
Earnings by Sex by Educational Attainment in Greenhorn
| Educational Attainment | Male Income | Female Income |
| Less than High School | - | - |
| High School Diploma | - | - |
| College or Associate's Degree | - | - |
| Bachelor's Degree | - | - |
| Graduate Degree | - | - |
| Total | - | - |
Family Income in Greenhorn
Family Income Brackets in Greenhorn
According to the Greenhorn family income data, there are 18 families falling into the $75,000 to $99,999 income range, which is the most common income bracket and makes up 52.9% of all families.
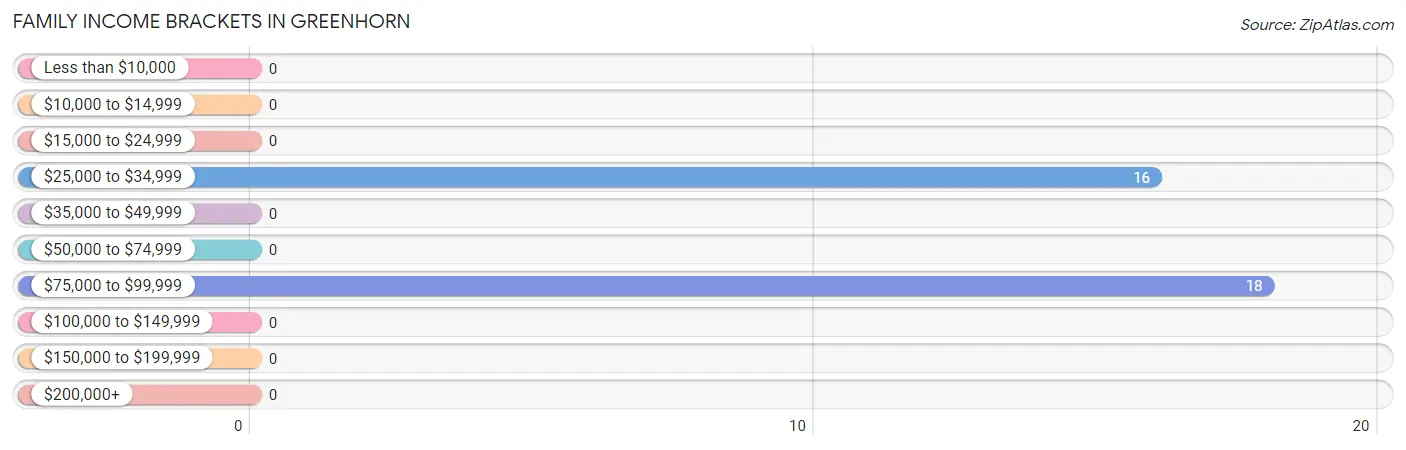
| Income Bracket | # Families | % Families |
| Less than $10,000 | 0 | 0.0% |
| $10,000 to $14,999 | 0 | 0.0% |
| $15,000 to $24,999 | 0 | 0.0% |
| $25,000 to $34,999 | 16 | 47.1% |
| $35,000 to $49,999 | 0 | 0.0% |
| $50,000 to $74,999 | 0 | 0.0% |
| $75,000 to $99,999 | 18 | 52.9% |
| $100,000 to $149,999 | 0 | 0.0% |
| $150,000 to $199,999 | 0 | 0.0% |
| $200,000+ | 0 | 0.0% |
Family Income by Famaliy Size in Greenhorn
| Income Bracket | # Families | Median Income |
| 2-Person Families | 16 (47.1%) | $0 |
| 3-Person Families | 18 (52.9%) | $0 |
| 4-Person Families | 0 (0.0%) | $0 |
| 5-Person Families | 0 (0.0%) | $0 |
| 6-Person Families | 0 (0.0%) | $0 |
| 7+ Person Families | 0 (0.0%) | $0 |
| Total | 34 (100.0%) | $0 |
Family Income by Number of Earners in Greenhorn
| Number of Earners | # Families | Median Income |
| No Earners | 11 (32.4%) | $0 |
| 1 Earner | 18 (52.9%) | $0 |
| 2 Earners | 5 (14.7%) | $0 |
| 3+ Earners | 0 (0.0%) | $0 |
| Total | 34 (100.0%) | $0 |
Household Income in Greenhorn
Household Income Brackets in Greenhorn
With 22 households falling in the category, the $25,000 to $34,999 income range is the most frequent in Greenhorn, accounting for 22.7% of all households.
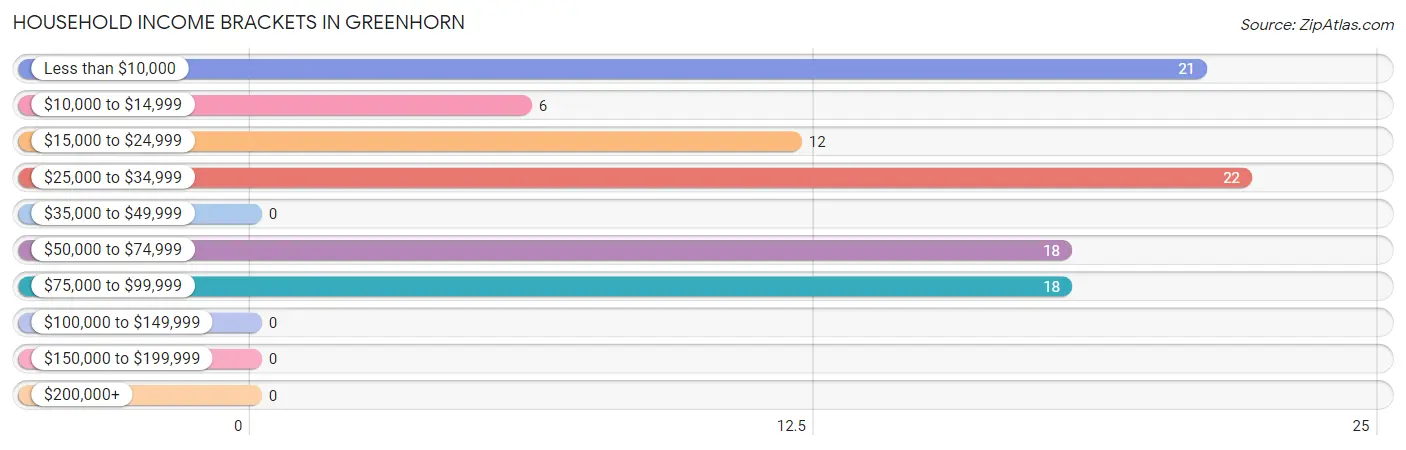
| Income Bracket | # Households | % Households |
| Less than $10,000 | 21 | 21.6% |
| $10,000 to $14,999 | 6 | 6.2% |
| $15,000 to $24,999 | 12 | 12.4% |
| $25,000 to $34,999 | 22 | 22.7% |
| $35,000 to $49,999 | 0 | 0.0% |
| $50,000 to $74,999 | 18 | 18.6% |
| $75,000 to $99,999 | 18 | 18.6% |
| $100,000 to $149,999 | 0 | 0.0% |
| $150,000 to $199,999 | 0 | 0.0% |
| $200,000+ | 0 | 0.0% |
Household Income by Householder Age in Greenhorn
| Income Bracket | # Households | Median Income |
| 15 to 24 Years | 8 (8.3%) | $0 |
| 25 to 44 Years | 0 (0.0%) | $0 |
| 45 to 64 Years | 54 (55.7%) | $0 |
| 65+ Years | 35 (36.1%) | $0 |
| Total | 97 (100.0%) | $28,984 |
Poverty in Greenhorn
Income Below Poverty by Sex and Age in Greenhorn
With 22.4% poverty level for males and 9.0% for females among the residents of Greenhorn, 18 to 24 year old males and 55 to 64 year old females are the most vulnerable to poverty, with 3 males (37.5%) and 6 females (100.0%) in their respective age groups living below the poverty level.
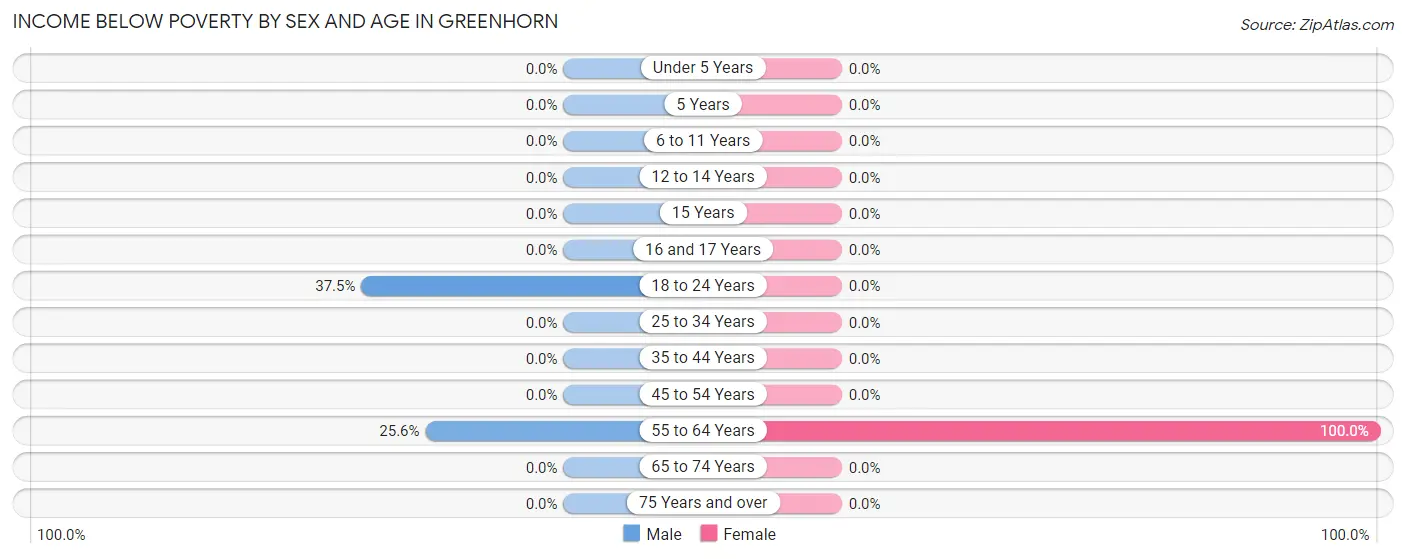
| Age Bracket | Male | Female |
| Under 5 Years | 0 (0.0%) | 0 (0.0%) |
| 5 Years | 0 (0.0%) | 0 (0.0%) |
| 6 to 11 Years | 0 (0.0%) | 0 (0.0%) |
| 12 to 14 Years | 0 (0.0%) | 0 (0.0%) |
| 15 Years | 0 (0.0%) | 0 (0.0%) |
| 16 and 17 Years | 0 (0.0%) | 0 (0.0%) |
| 18 to 24 Years | 3 (37.5%) | 0 (0.0%) |
| 25 to 34 Years | 0 (0.0%) | 0 (0.0%) |
| 35 to 44 Years | 0 (0.0%) | 0 (0.0%) |
| 45 to 54 Years | 0 (0.0%) | 0 (0.0%) |
| 55 to 64 Years | 21 (25.6%) | 6 (100.0%) |
| 65 to 74 Years | 0 (0.0%) | 0 (0.0%) |
| 75 Years and over | 0 (0.0%) | 0 (0.0%) |
| Total | 24 (22.4%) | 6 (9.0%) |
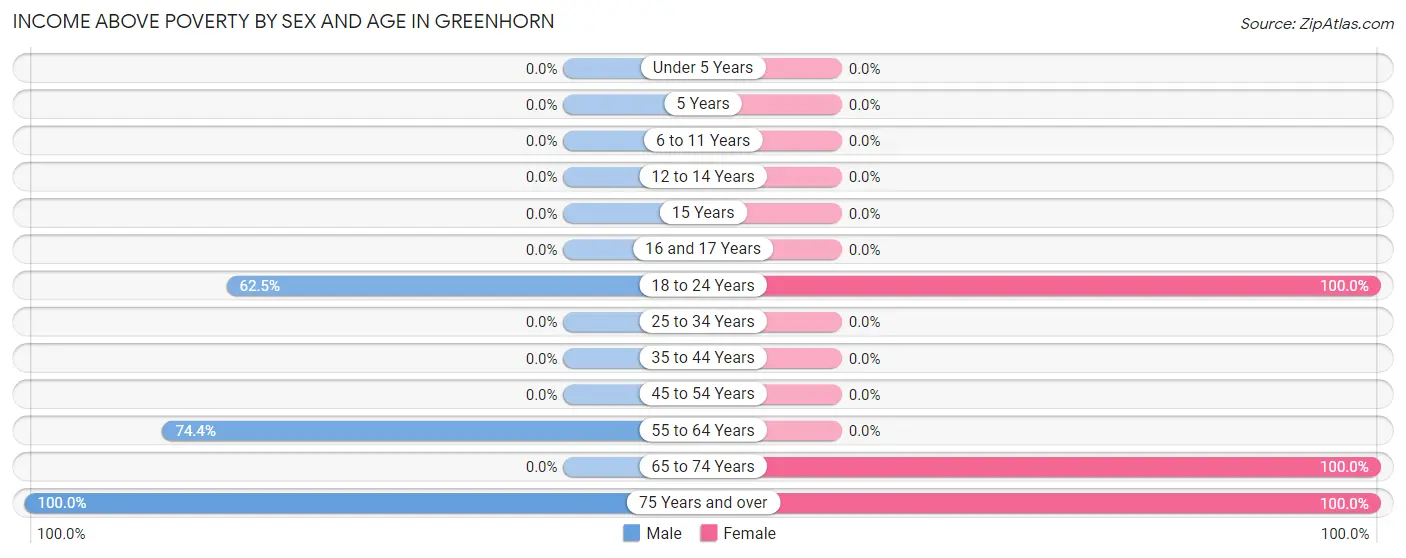
Income Above Poverty by Sex and Age in Greenhorn
According to the poverty statistics in Greenhorn, males aged 75 years and over and females aged 18 to 24 years are the age groups that are most secure financially, with 100.0% of males and 100.0% of females in these age groups living above the poverty line.
| Age Bracket | Male | Female |
| Under 5 Years | 0 (0.0%) | 0 (0.0%) |
| 5 Years | 0 (0.0%) | 0 (0.0%) |
| 6 to 11 Years | 0 (0.0%) | 0 (0.0%) |
| 12 to 14 Years | 0 (0.0%) | 0 (0.0%) |
| 15 Years | 0 (0.0%) | 0 (0.0%) |
| 16 and 17 Years | 0 (0.0%) | 0 (0.0%) |
| 18 to 24 Years | 5 (62.5%) | 8 (100.0%) |
| 25 to 34 Years | 0 (0.0%) | 0 (0.0%) |
| 35 to 44 Years | 0 (0.0%) | 0 (0.0%) |
| 45 to 54 Years | 0 (0.0%) | 0 (0.0%) |
| 55 to 64 Years | 61 (74.4%) | 0 (0.0%) |
| 65 to 74 Years | 0 (0.0%) | 18 (100.0%) |
| 75 Years and over | 17 (100.0%) | 35 (100.0%) |
| Total | 83 (77.6%) | 61 (91.0%) |
Income Below Poverty Among Married-Couple Families in Greenhorn
| Children | Above Poverty | Below Poverty |
| No Children | 16 (100.0%) | 0 (0.0%) |
| 1 or 2 Children | 0 (0.0%) | 0 (0.0%) |
| 3 or 4 Children | 0 (0.0%) | 0 (0.0%) |
| 5 or more Children | 0 (0.0%) | 0 (0.0%) |
| Total | 16 (100.0%) | 0 (0.0%) |
Income Below Poverty Among Single-Parent Households in Greenhorn
| Children | Single Father | Single Mother |
| No Children | 0 (0.0%) | 0 (0.0%) |
| 1 or 2 Children | 0 (0.0%) | 0 (0.0%) |
| 3 or 4 Children | 0 (0.0%) | 0 (0.0%) |
| 5 or more Children | 0 (0.0%) | 0 (0.0%) |
| Total | 0 (0.0%) | 0 (0.0%) |
Income Below Poverty Among Married-Couple vs Single-Parent Households in Greenhorn
| Children | Married-Couple Families | Single-Parent Households |
| No Children | 0 (0.0%) | 0 (0.0%) |
| 1 or 2 Children | 0 (0.0%) | 0 (0.0%) |
| 3 or 4 Children | 0 (0.0%) | 0 (0.0%) |
| 5 or more Children | 0 (0.0%) | 0 (0.0%) |
| Total | 0 (0.0%) | 0 (0.0%) |
Employment Characteristics in Greenhorn
Employment by Class of Employer in Greenhorn
Among the 53 employed individuals in Greenhorn, self-employed (not incorporated) (30 | 56.6%), private company employees (20 | 37.7%), and local government employees (3 | 5.7%) make up the most common classes of employment.
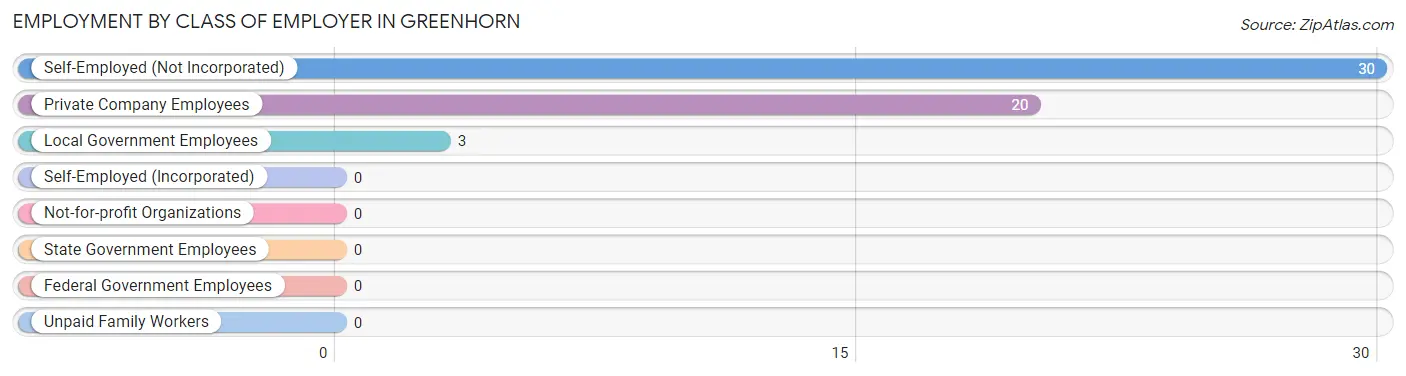
| Employer Class | # Employees | % Employees |
| Private Company Employees | 20 | 37.7% |
| Self-Employed (Incorporated) | 0 | 0.0% |
| Self-Employed (Not Incorporated) | 30 | 56.6% |
| Not-for-profit Organizations | 0 | 0.0% |
| Local Government Employees | 3 | 5.7% |
| State Government Employees | 0 | 0.0% |
| Federal Government Employees | 0 | 0.0% |
| Unpaid Family Workers | 0 | 0.0% |
| Total | 53 | 100.0% |
Employment Status by Age in Greenhorn
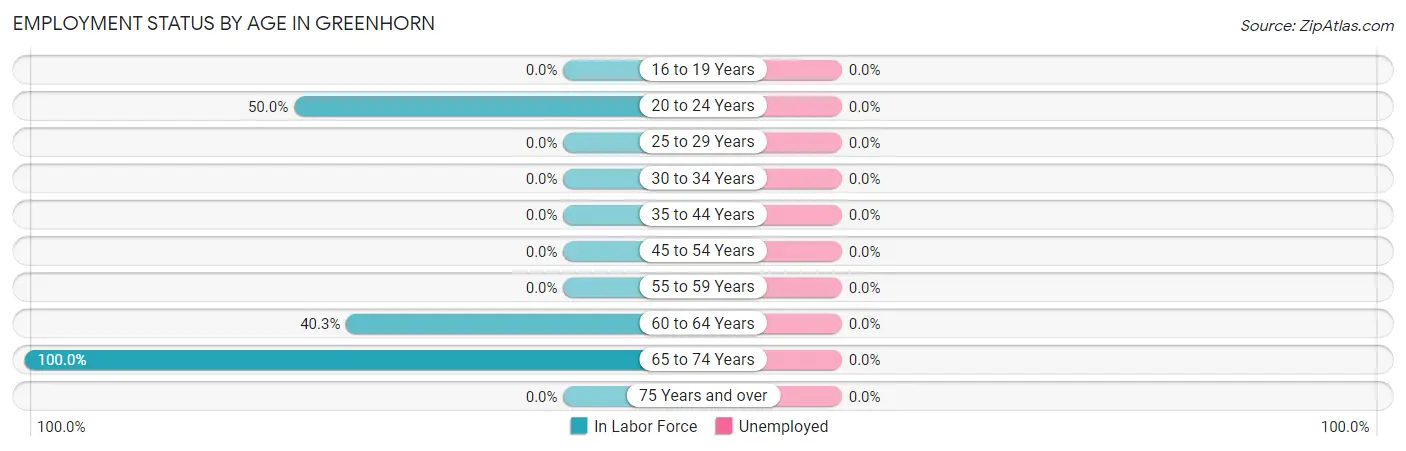
| Age Bracket | In Labor Force | Unemployed |
| 16 to 19 Years | 0 (0.0%) | 0 (0.0%) |
| 20 to 24 Years | 8 (50.0%) | 0 (0.0%) |
| 25 to 29 Years | 0 (0.0%) | 0 (0.0%) |
| 30 to 34 Years | 0 (0.0%) | 0 (0.0%) |
| 35 to 44 Years | 0 (0.0%) | 0 (0.0%) |
| 45 to 54 Years | 0 (0.0%) | 0 (0.0%) |
| 55 to 59 Years | 0 (0.0%) | 0 (0.0%) |
| 60 to 64 Years | 27 (40.3%) | 0 (0.0%) |
| 65 to 74 Years | 18 (100.0%) | 0 (0.0%) |
| 75 Years and over | 0 (0.0%) | 0 (0.0%) |
| Total | 53 (30.5%) | 0 (0.0%) |
Employment Status by Educational Attainment in Greenhorn
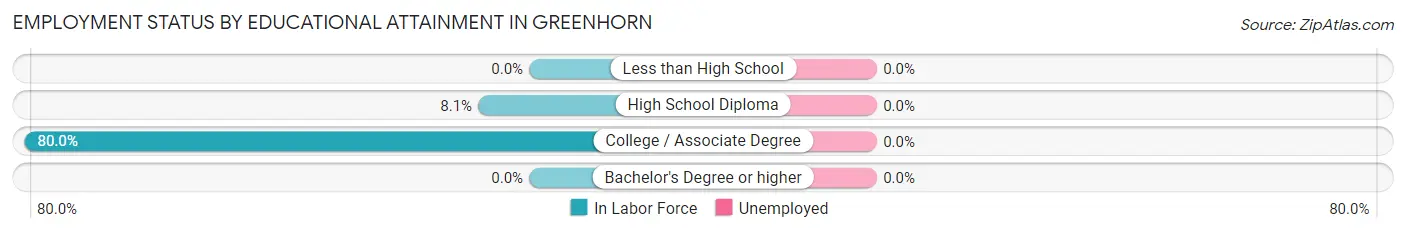
| Educational Attainment | In Labor Force | Unemployed |
| Less than High School | 0 (0.0%) | 0 (0.0%) |
| High School Diploma | 3 (8.1%) | 0 (0.0%) |
| College / Associate Degree | 24 (80.0%) | 0 (0.0%) |
| Bachelor's Degree or higher | 0 (0.0%) | 0 (0.0%) |
| Total | 27 (30.7%) | 0 (0.0%) |
Employment Occupations by Sex in Greenhorn
Management, Business, Science and Arts Occupations
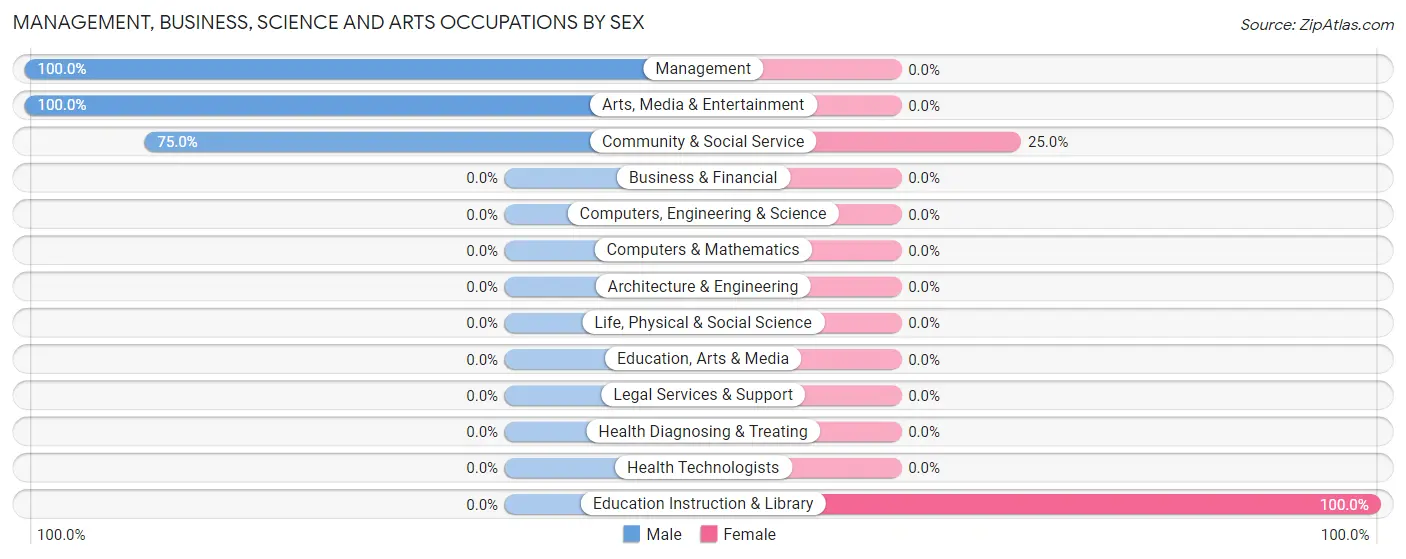
The most common Management, Business, Science and Arts occupations in Greenhorn are Management (15 | 28.3%), Community & Social Service (12 | 22.6%), Arts, Media & Entertainment (9 | 17.0%), and Education Instruction & Library (3 | 5.7%).
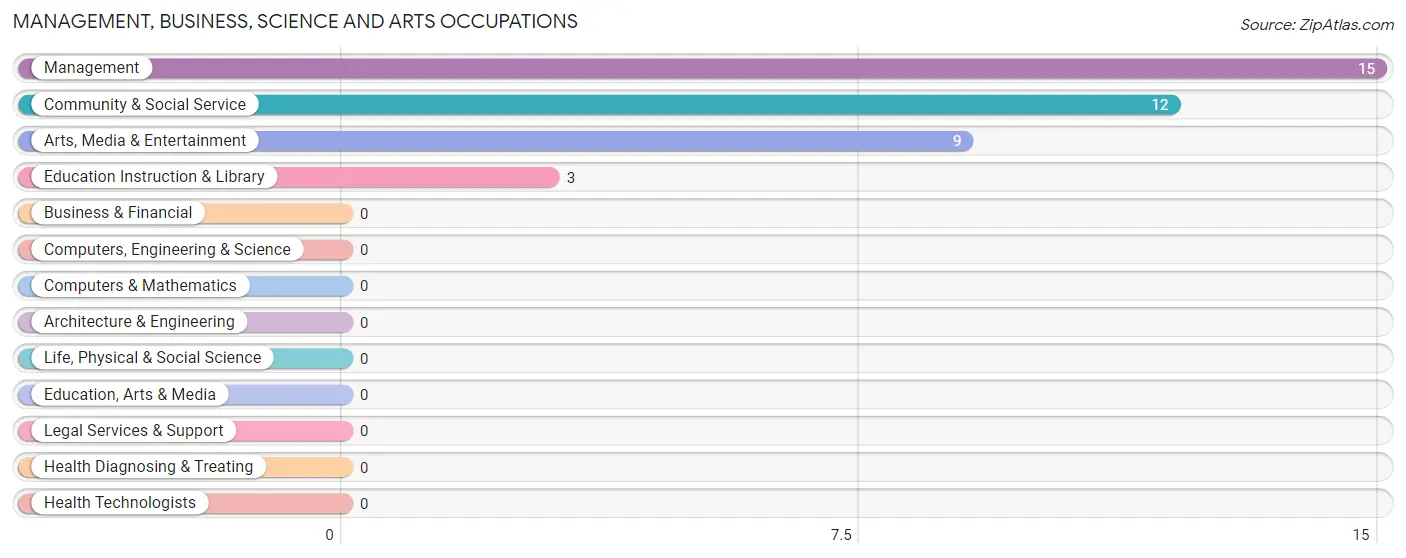
Management, Business, Science and Arts Occupations by Sex
Within the Management, Business, Science and Arts occupations in Greenhorn, the most male-oriented occupations are Management (100.0%), Arts, Media & Entertainment (100.0%), and Community & Social Service (75.0%), while the most female-oriented occupations are Education Instruction & Library (100.0%), and Community & Social Service (25.0%).
| Occupation | Male | Female |
| Management | 15 (100.0%) | 0 (0.0%) |
| Business & Financial | 0 (0.0%) | 0 (0.0%) |
| Computers, Engineering & Science | 0 (0.0%) | 0 (0.0%) |
| Computers & Mathematics | 0 (0.0%) | 0 (0.0%) |
| Architecture & Engineering | 0 (0.0%) | 0 (0.0%) |
| Life, Physical & Social Science | 0 (0.0%) | 0 (0.0%) |
| Community & Social Service | 9 (75.0%) | 3 (25.0%) |
| Education, Arts & Media | 0 (0.0%) | 0 (0.0%) |
| Legal Services & Support | 0 (0.0%) | 0 (0.0%) |
| Education Instruction & Library | 0 (0.0%) | 3 (100.0%) |
| Arts, Media & Entertainment | 9 (100.0%) | 0 (0.0%) |
| Health Diagnosing & Treating | 0 (0.0%) | 0 (0.0%) |
| Health Technologists | 0 (0.0%) | 0 (0.0%) |
| Total (Category) | 24 (88.9%) | 3 (11.1%) |
| Total (Overall) | 32 (60.4%) | 21 (39.6%) |
Services Occupations
Services Occupations by Sex
| Occupation | Male | Female |
| Healthcare Support | 0 (0.0%) | 0 (0.0%) |
| Security & Protection | 0 (0.0%) | 0 (0.0%) |
| Firefighting & Prevention | 0 (0.0%) | 0 (0.0%) |
| Law Enforcement | 0 (0.0%) | 0 (0.0%) |
| Food Preparation & Serving | 0 (0.0%) | 0 (0.0%) |
| Cleaning & Maintenance | 0 (0.0%) | 0 (0.0%) |
| Personal Care & Service | 0 (0.0%) | 0 (0.0%) |
| Total (Category) | 0 (0.0%) | 0 (0.0%) |
| Total (Overall) | 32 (60.4%) | 21 (39.6%) |
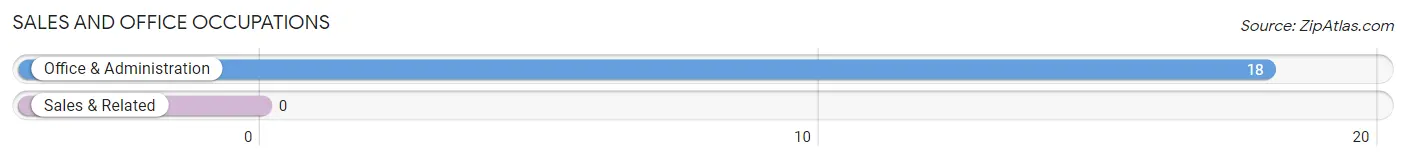
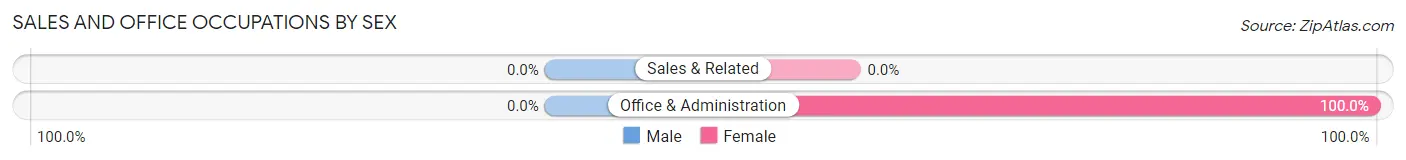
Sales and Office Occupations
The most common Sales and Office occupations in Greenhorn are , and Office & Administration (18 | 34.0%).
Sales and Office Occupations by Sex
| Occupation | Male | Female |
| Sales & Related | 0 (0.0%) | 0 (0.0%) |
| Office & Administration | 0 (0.0%) | 18 (100.0%) |
| Total (Category) | 0 (0.0%) | 18 (100.0%) |
| Total (Overall) | 32 (60.4%) | 21 (39.6%) |
Natural Resources, Construction and Maintenance Occupations
The most common Natural Resources, Construction and Maintenance occupations in Greenhorn are , and Installation, Maintenance & Repair (3 | 5.7%).
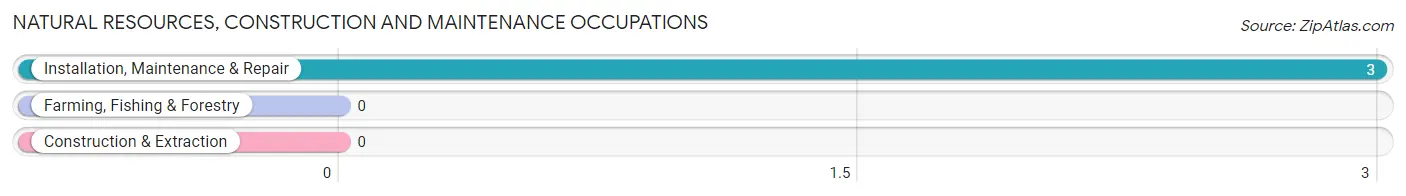
Natural Resources, Construction and Maintenance Occupations by Sex
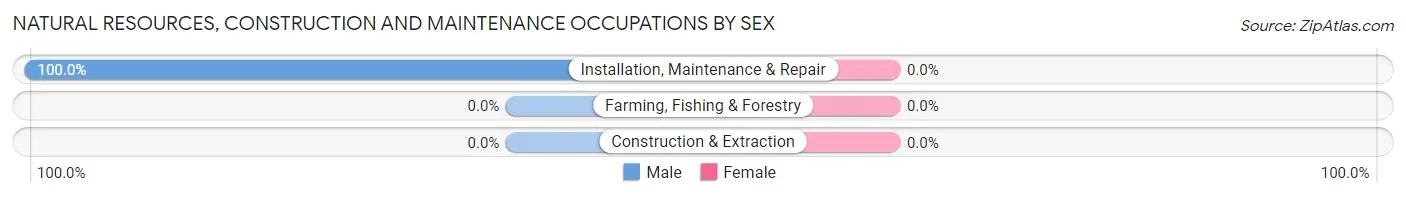
| Occupation | Male | Female |
| Farming, Fishing & Forestry | 0 (0.0%) | 0 (0.0%) |
| Construction & Extraction | 0 (0.0%) | 0 (0.0%) |
| Installation, Maintenance & Repair | 3 (100.0%) | 0 (0.0%) |
| Total (Category) | 3 (100.0%) | 0 (0.0%) |
| Total (Overall) | 32 (60.4%) | 21 (39.6%) |
Production, Transportation and Moving Occupations
The most common Production, Transportation and Moving occupations in Greenhorn are , and Material Moving (5 | 9.4%).
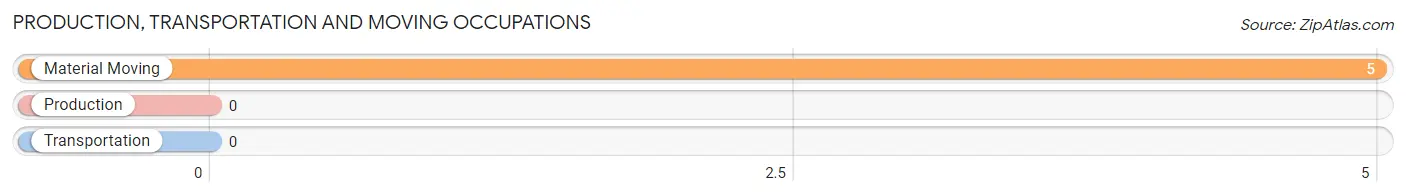
Production, Transportation and Moving Occupations by Sex
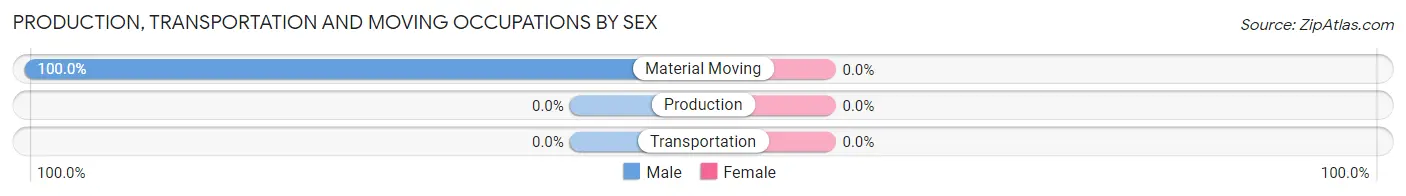
| Occupation | Male | Female |
| Production | 0 (0.0%) | 0 (0.0%) |
| Transportation | 0 (0.0%) | 0 (0.0%) |
| Material Moving | 5 (100.0%) | 0 (0.0%) |
| Total (Category) | 5 (100.0%) | 0 (0.0%) |
| Total (Overall) | 32 (60.4%) | 21 (39.6%) |
Employment Industries by Sex in Greenhorn
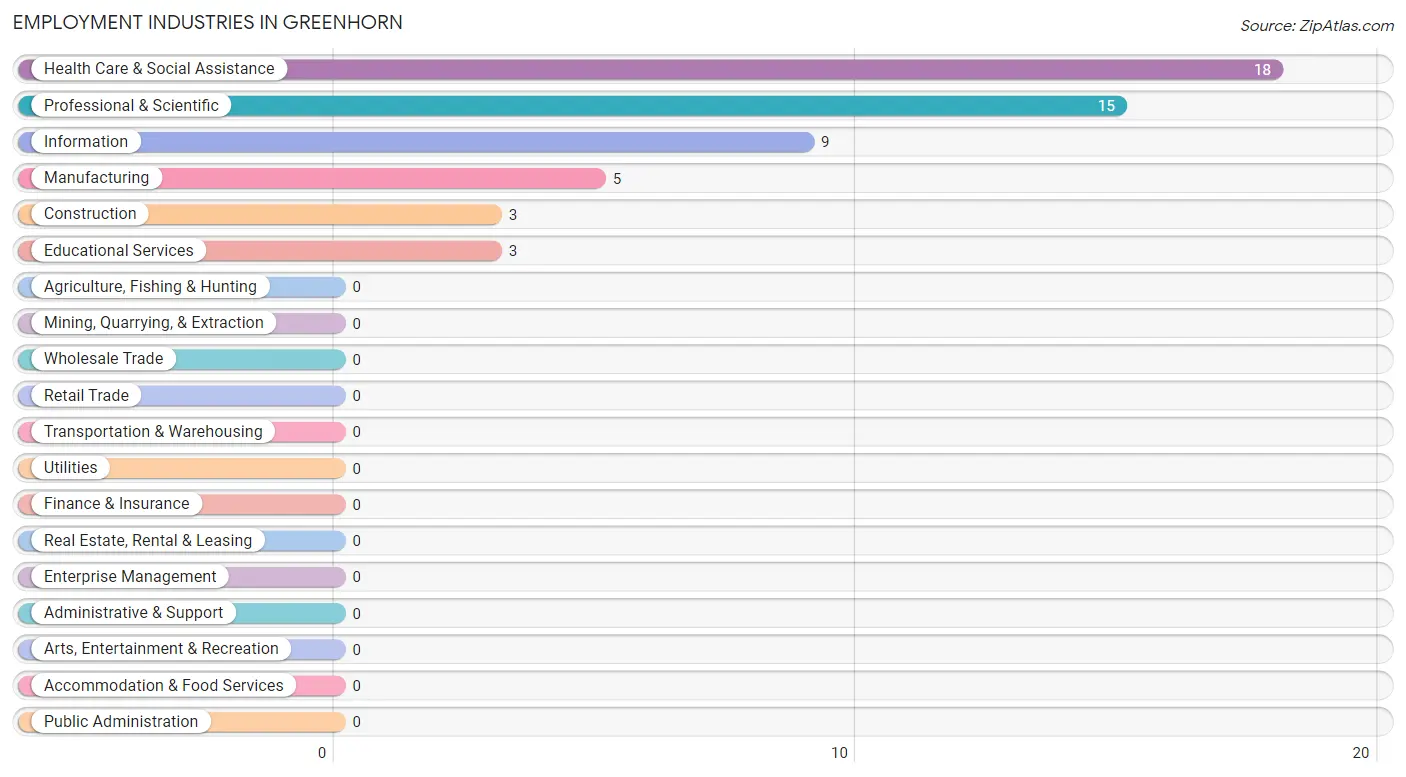
Employment Industries in Greenhorn
The major employment industries in Greenhorn include Health Care & Social Assistance (18 | 34.0%), Professional & Scientific (15 | 28.3%), Information (9 | 17.0%), Manufacturing (5 | 9.4%), and Construction (3 | 5.7%).
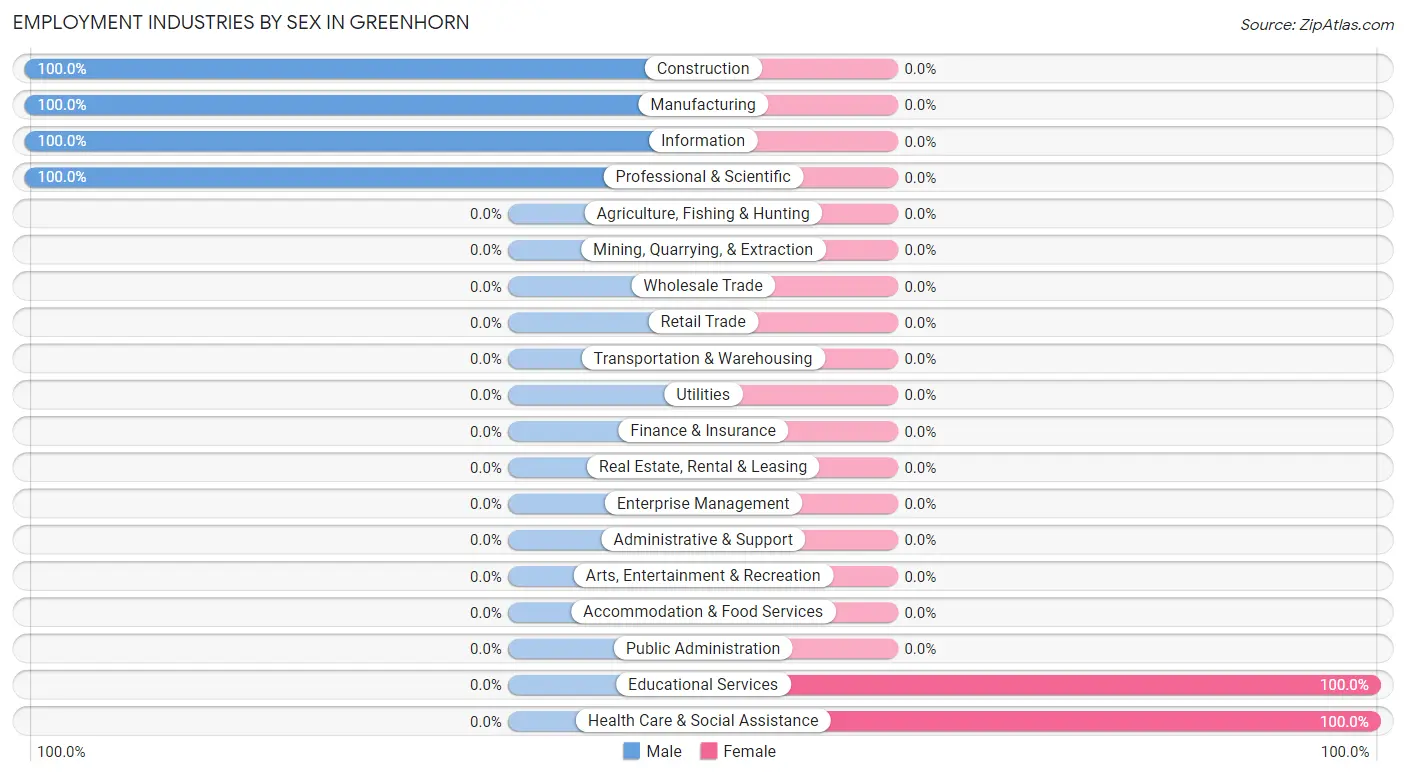
Employment Industries by Sex in Greenhorn
The Greenhorn industries that see more men than women are Construction (100.0%), Manufacturing (100.0%), and Information (100.0%), whereas the industries that tend to have a higher number of women are Educational Services (100.0%), and Health Care & Social Assistance (100.0%).
| Industry | Male | Female |
| Agriculture, Fishing & Hunting | 0 (0.0%) | 0 (0.0%) |
| Mining, Quarrying, & Extraction | 0 (0.0%) | 0 (0.0%) |
| Construction | 3 (100.0%) | 0 (0.0%) |
| Manufacturing | 5 (100.0%) | 0 (0.0%) |
| Wholesale Trade | 0 (0.0%) | 0 (0.0%) |
| Retail Trade | 0 (0.0%) | 0 (0.0%) |
| Transportation & Warehousing | 0 (0.0%) | 0 (0.0%) |
| Utilities | 0 (0.0%) | 0 (0.0%) |
| Information | 9 (100.0%) | 0 (0.0%) |
| Finance & Insurance | 0 (0.0%) | 0 (0.0%) |
| Real Estate, Rental & Leasing | 0 (0.0%) | 0 (0.0%) |
| Professional & Scientific | 15 (100.0%) | 0 (0.0%) |
| Enterprise Management | 0 (0.0%) | 0 (0.0%) |
| Administrative & Support | 0 (0.0%) | 0 (0.0%) |
| Educational Services | 0 (0.0%) | 3 (100.0%) |
| Health Care & Social Assistance | 0 (0.0%) | 18 (100.0%) |
| Arts, Entertainment & Recreation | 0 (0.0%) | 0 (0.0%) |
| Accommodation & Food Services | 0 (0.0%) | 0 (0.0%) |
| Public Administration | 0 (0.0%) | 0 (0.0%) |
| Total | 32 (60.4%) | 21 (39.6%) |
Education in Greenhorn
School Enrollment in Greenhorn
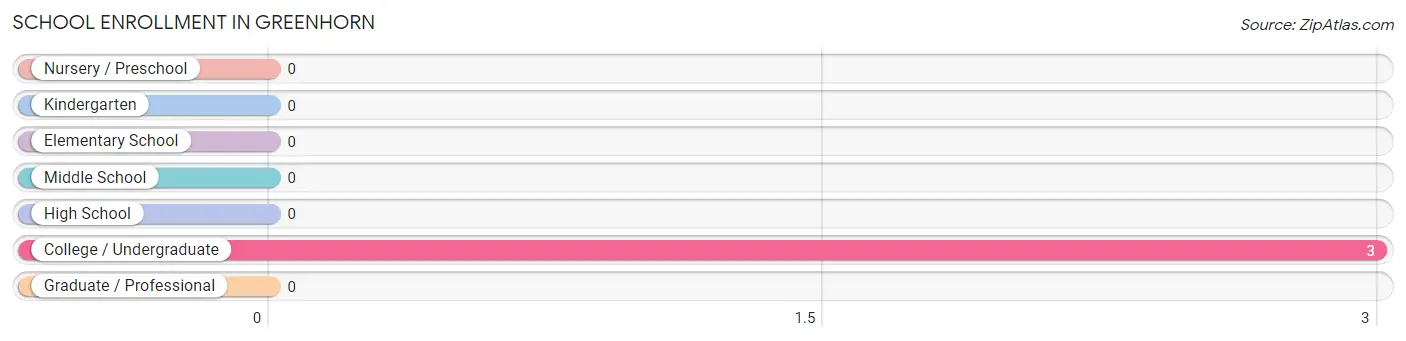
| School Level | # Students | % Students |
| Nursery / Preschool | 0 | 0.0% |
| Kindergarten | 0 | 0.0% |
| Elementary School | 0 | 0.0% |
| Middle School | 0 | 0.0% |
| High School | 0 | 0.0% |
| College / Undergraduate | 3 | 100.0% |
| Graduate / Professional | 0 | 0.0% |
| Total | 3 | 100.0% |
School Enrollment by Age by Funding Source in Greenhorn
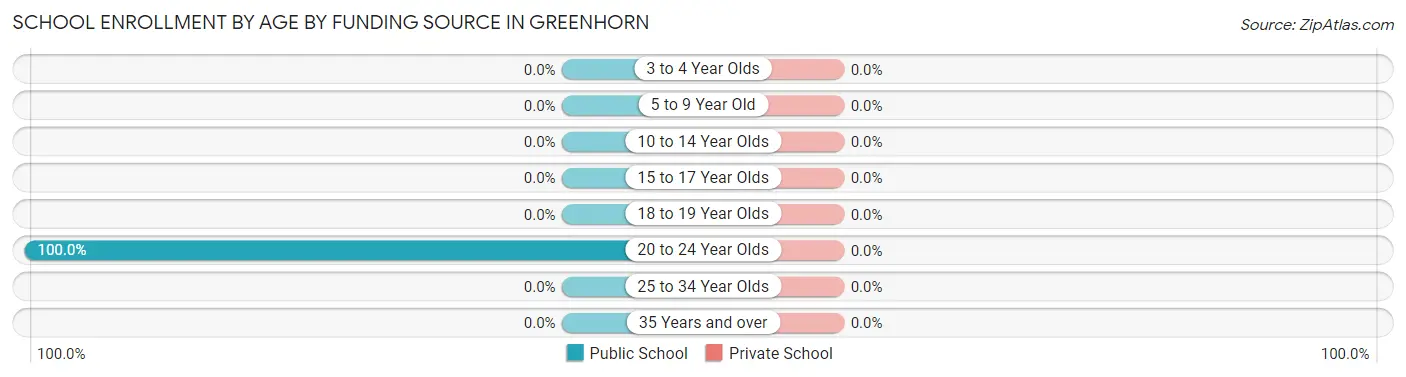
| Age Bracket | Public School | Private School |
| 3 to 4 Year Olds | 0 (0.0%) | 0 (0.0%) |
| 5 to 9 Year Old | 0 (0.0%) | 0 (0.0%) |
| 10 to 14 Year Olds | 0 (0.0%) | 0 (0.0%) |
| 15 to 17 Year Olds | 0 (0.0%) | 0 (0.0%) |
| 18 to 19 Year Olds | 0 (0.0%) | 0 (0.0%) |
| 20 to 24 Year Olds | 3 (100.0%) | 0 (0.0%) |
| 25 to 34 Year Olds | 0 (0.0%) | 0 (0.0%) |
| 35 Years and over | 0 (0.0%) | 0 (0.0%) |
| Total | 3 (100.0%) | 0 (0.0%) |
Educational Attainment by Field of Study in Greenhorn
Psychology (17 | 50.0%), and visual & performing arts (17 | 50.0%) are the most common fields of study among 34 individuals in Greenhorn who have obtained a bachelor's degree or higher.
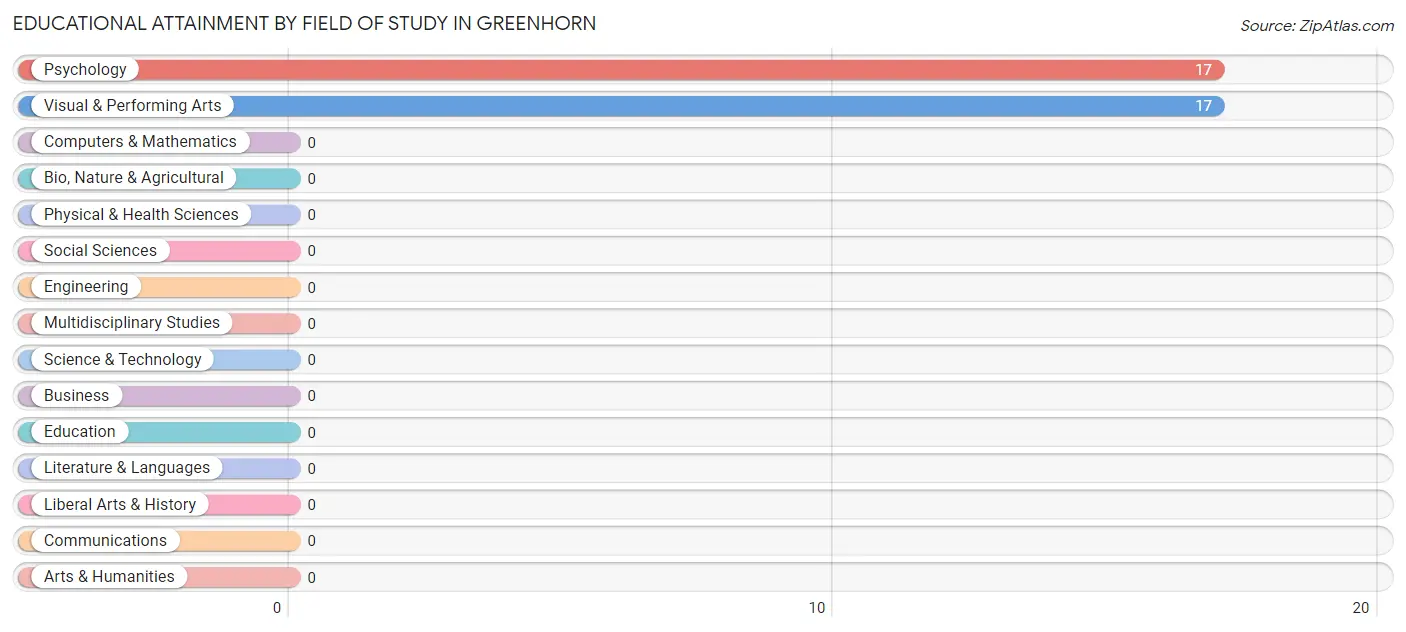
| Field of Study | # Graduates | % Graduates |
| Computers & Mathematics | 0 | 0.0% |
| Bio, Nature & Agricultural | 0 | 0.0% |
| Physical & Health Sciences | 0 | 0.0% |
| Psychology | 17 | 50.0% |
| Social Sciences | 0 | 0.0% |
| Engineering | 0 | 0.0% |
| Multidisciplinary Studies | 0 | 0.0% |
| Science & Technology | 0 | 0.0% |
| Business | 0 | 0.0% |
| Education | 0 | 0.0% |
| Literature & Languages | 0 | 0.0% |
| Liberal Arts & History | 0 | 0.0% |
| Visual & Performing Arts | 17 | 50.0% |
| Communications | 0 | 0.0% |
| Arts & Humanities | 0 | 0.0% |
| Total | 34 | 100.0% |
Transportation & Commute in Greenhorn
Vehicle Availability by Sex in Greenhorn
The most prevalent vehicle ownership categories in Greenhorn are males with 1 vehicle (20, accounting for 62.5%) and females with 1 vehicle (0, making up 95.2%).
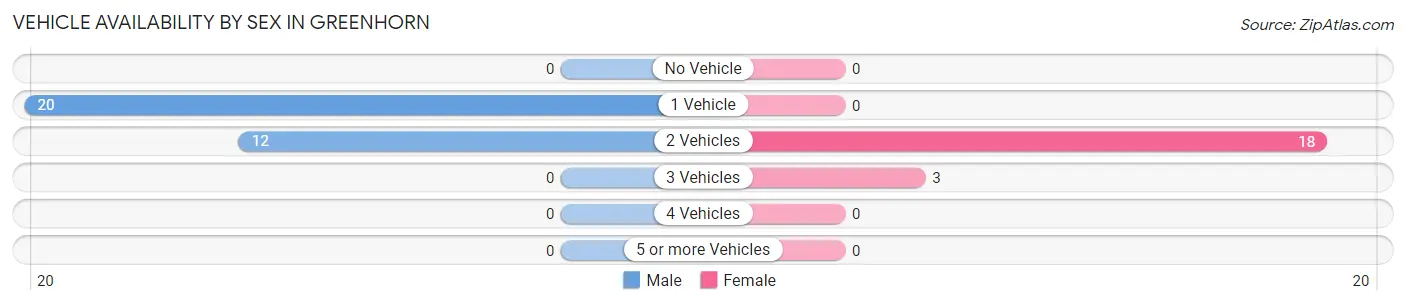
| Vehicles Available | Male | Female |
| No Vehicle | 0 (0.0%) | 0 (0.0%) |
| 1 Vehicle | 20 (62.5%) | 0 (0.0%) |
| 2 Vehicles | 12 (37.5%) | 18 (85.7%) |
| 3 Vehicles | 0 (0.0%) | 3 (14.3%) |
| 4 Vehicles | 0 (0.0%) | 0 (0.0%) |
| 5 or more Vehicles | 0 (0.0%) | 0 (0.0%) |
| Total | 32 (100.0%) | 21 (100.0%) |
Commute Time in Greenhorn
The most frequently occuring commute durations in Greenhorn are 15 to 19 minutes (23 commuters, 60.5%), 5 to 9 minutes (12 commuters, 31.6%), and less than 5 minutes (3 commuters, 7.9%).
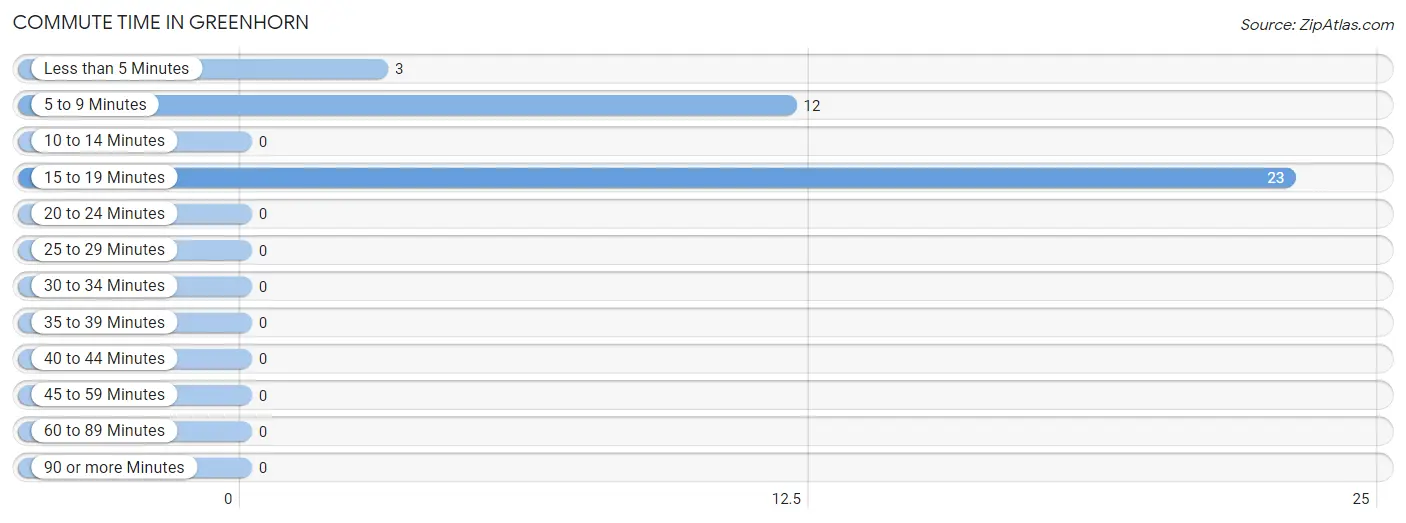
| Commute Time | # Commuters | % Commuters |
| Less than 5 Minutes | 3 | 7.9% |
| 5 to 9 Minutes | 12 | 31.6% |
| 10 to 14 Minutes | 0 | 0.0% |
| 15 to 19 Minutes | 23 | 60.5% |
| 20 to 24 Minutes | 0 | 0.0% |
| 25 to 29 Minutes | 0 | 0.0% |
| 30 to 34 Minutes | 0 | 0.0% |
| 35 to 39 Minutes | 0 | 0.0% |
| 40 to 44 Minutes | 0 | 0.0% |
| 45 to 59 Minutes | 0 | 0.0% |
| 60 to 89 Minutes | 0 | 0.0% |
| 90 or more Minutes | 0 | 0.0% |
Commute Time by Sex in Greenhorn
The most common commute times in Greenhorn are 5 to 9 minutes (12 commuters, 70.6%) for males and 15 to 19 minutes (18 commuters, 85.7%) for females.
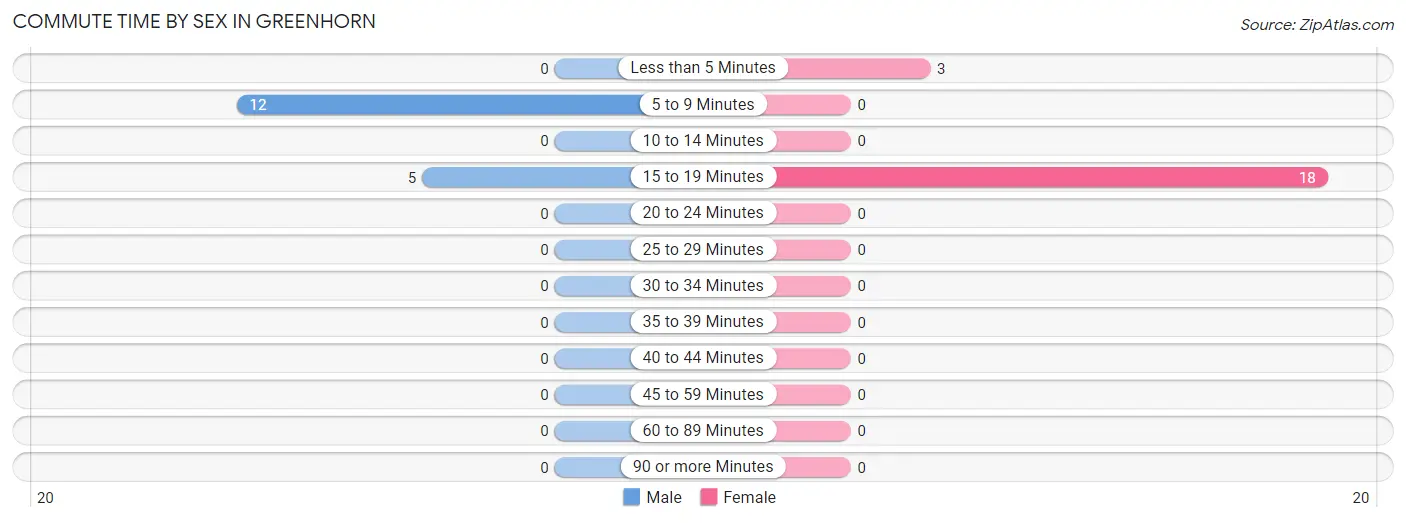
| Commute Time | Male | Female |
| Less than 5 Minutes | 0 (0.0%) | 3 (14.3%) |
| 5 to 9 Minutes | 12 (70.6%) | 0 (0.0%) |
| 10 to 14 Minutes | 0 (0.0%) | 0 (0.0%) |
| 15 to 19 Minutes | 5 (29.4%) | 18 (85.7%) |
| 20 to 24 Minutes | 0 (0.0%) | 0 (0.0%) |
| 25 to 29 Minutes | 0 (0.0%) | 0 (0.0%) |
| 30 to 34 Minutes | 0 (0.0%) | 0 (0.0%) |
| 35 to 39 Minutes | 0 (0.0%) | 0 (0.0%) |
| 40 to 44 Minutes | 0 (0.0%) | 0 (0.0%) |
| 45 to 59 Minutes | 0 (0.0%) | 0 (0.0%) |
| 60 to 89 Minutes | 0 (0.0%) | 0 (0.0%) |
| 90 or more Minutes | 0 (0.0%) | 0 (0.0%) |
Time of Departure to Work by Sex in Greenhorn
The most frequent times of departure to work in Greenhorn are 5:30 AM to 5:59 AM (9, 52.9%) for males and 8:30 AM to 8:59 AM (18, 85.7%) for females.
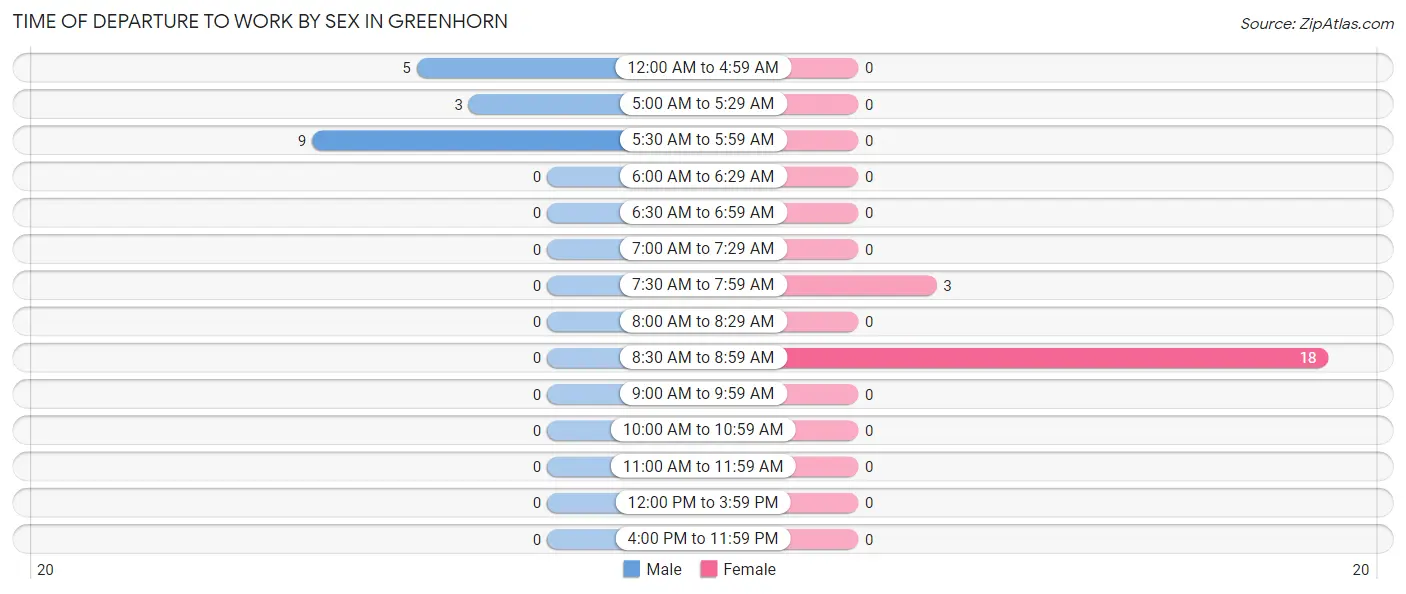
| Time of Departure | Male | Female |
| 12:00 AM to 4:59 AM | 5 (29.4%) | 0 (0.0%) |
| 5:00 AM to 5:29 AM | 3 (17.6%) | 0 (0.0%) |
| 5:30 AM to 5:59 AM | 9 (52.9%) | 0 (0.0%) |
| 6:00 AM to 6:29 AM | 0 (0.0%) | 0 (0.0%) |
| 6:30 AM to 6:59 AM | 0 (0.0%) | 0 (0.0%) |
| 7:00 AM to 7:29 AM | 0 (0.0%) | 0 (0.0%) |
| 7:30 AM to 7:59 AM | 0 (0.0%) | 3 (14.3%) |
| 8:00 AM to 8:29 AM | 0 (0.0%) | 0 (0.0%) |
| 8:30 AM to 8:59 AM | 0 (0.0%) | 18 (85.7%) |
| 9:00 AM to 9:59 AM | 0 (0.0%) | 0 (0.0%) |
| 10:00 AM to 10:59 AM | 0 (0.0%) | 0 (0.0%) |
| 11:00 AM to 11:59 AM | 0 (0.0%) | 0 (0.0%) |
| 12:00 PM to 3:59 PM | 0 (0.0%) | 0 (0.0%) |
| 4:00 PM to 11:59 PM | 0 (0.0%) | 0 (0.0%) |
| Total | 17 (100.0%) | 21 (100.0%) |
Housing Occupancy in Greenhorn
Occupancy by Ownership in Greenhorn
Of the total 97 dwellings in Greenhorn, owner-occupied units account for 86 (88.7%), while renter-occupied units make up 11 (11.3%).
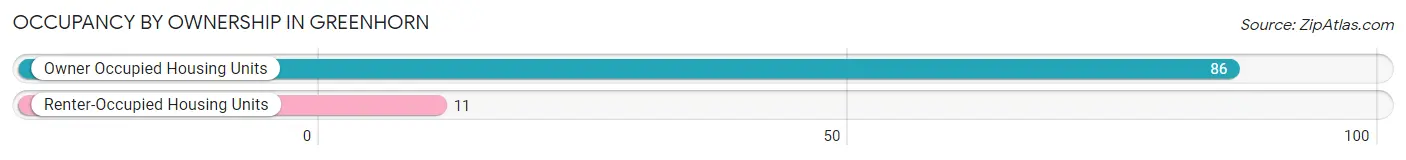
| Occupancy | # Housing Units | % Housing Units |
| Owner Occupied Housing Units | 86 | 88.7% |
| Renter-Occupied Housing Units | 11 | 11.3% |
| Total Occupied Housing Units | 97 | 100.0% |
Occupancy by Household Size in Greenhorn
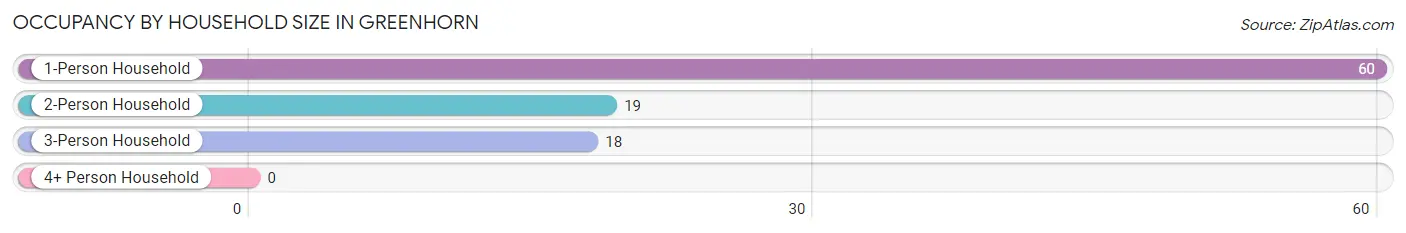
| Household Size | # Housing Units | % Housing Units |
| 1-Person Household | 60 | 61.9% |
| 2-Person Household | 19 | 19.6% |
| 3-Person Household | 18 | 18.6% |
| 4+ Person Household | 0 | 0.0% |
| Total Housing Units | 97 | 100.0% |
Occupancy by Ownership by Household Size in Greenhorn
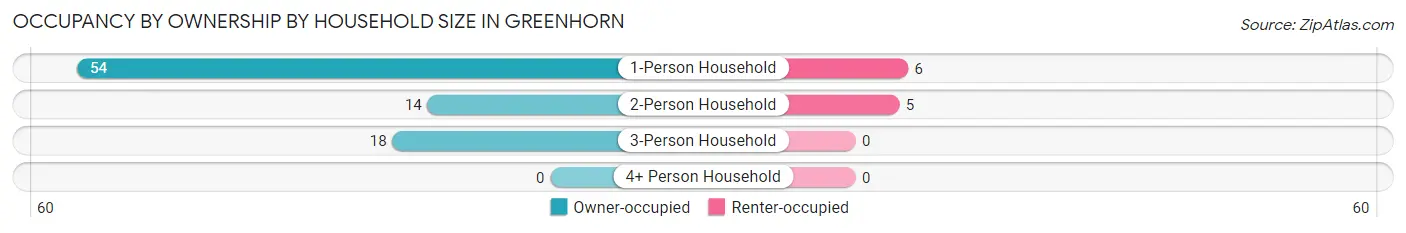
| Household Size | Owner-occupied | Renter-occupied |
| 1-Person Household | 54 (90.0%) | 6 (10.0%) |
| 2-Person Household | 14 (73.7%) | 5 (26.3%) |
| 3-Person Household | 18 (100.0%) | 0 (0.0%) |
| 4+ Person Household | 0 (0.0%) | 0 (0.0%) |
| Total Housing Units | 86 (88.7%) | 11 (11.3%) |
Occupancy by Educational Attainment in Greenhorn
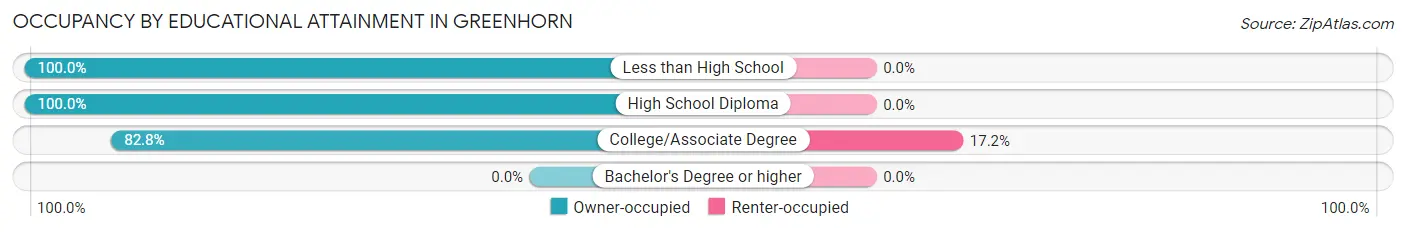
| Household Size | Owner-occupied | Renter-occupied |
| Less than High School | 21 (100.0%) | 0 (0.0%) |
| High School Diploma | 12 (100.0%) | 0 (0.0%) |
| College/Associate Degree | 53 (82.8%) | 11 (17.2%) |
| Bachelor's Degree or higher | 0 (0.0%) | 0 (0.0%) |
Occupancy by Age of Householder in Greenhorn
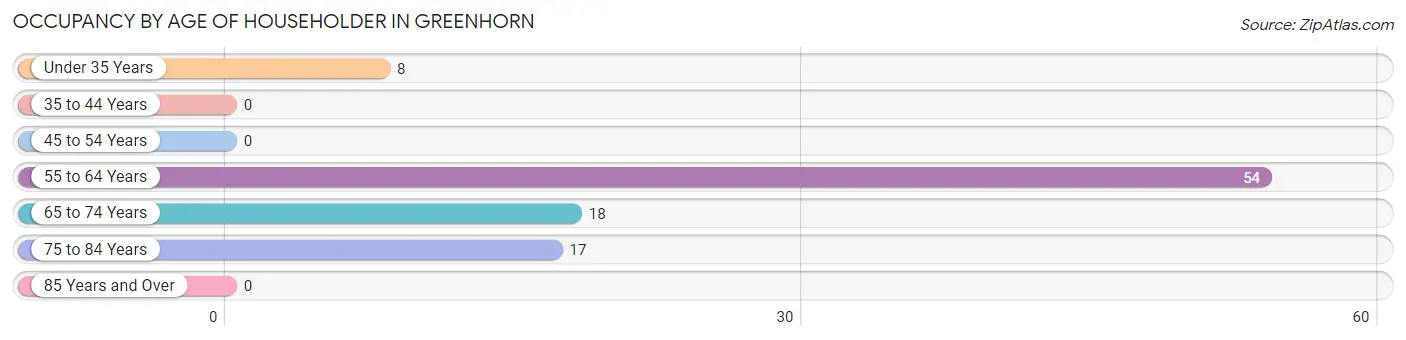
| Age Bracket | # Households | % Households |
| Under 35 Years | 8 | 8.3% |
| 35 to 44 Years | 0 | 0.0% |
| 45 to 54 Years | 0 | 0.0% |
| 55 to 64 Years | 54 | 55.7% |
| 65 to 74 Years | 18 | 18.6% |
| 75 to 84 Years | 17 | 17.5% |
| 85 Years and Over | 0 | 0.0% |
| Total | 97 | 100.0% |
Housing Finances in Greenhorn
Median Income by Occupancy in Greenhorn
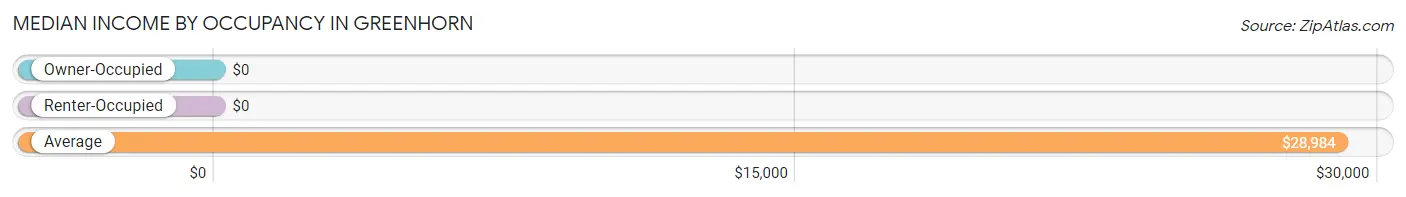
| Occupancy Type | # Households | Median Income |
| Owner-Occupied | 86 (88.7%) | $0 |
| Renter-Occupied | 11 (11.3%) | $0 |
| Average | 97 (100.0%) | $28,984 |
Occupancy by Householder Income Bracket in Greenhorn
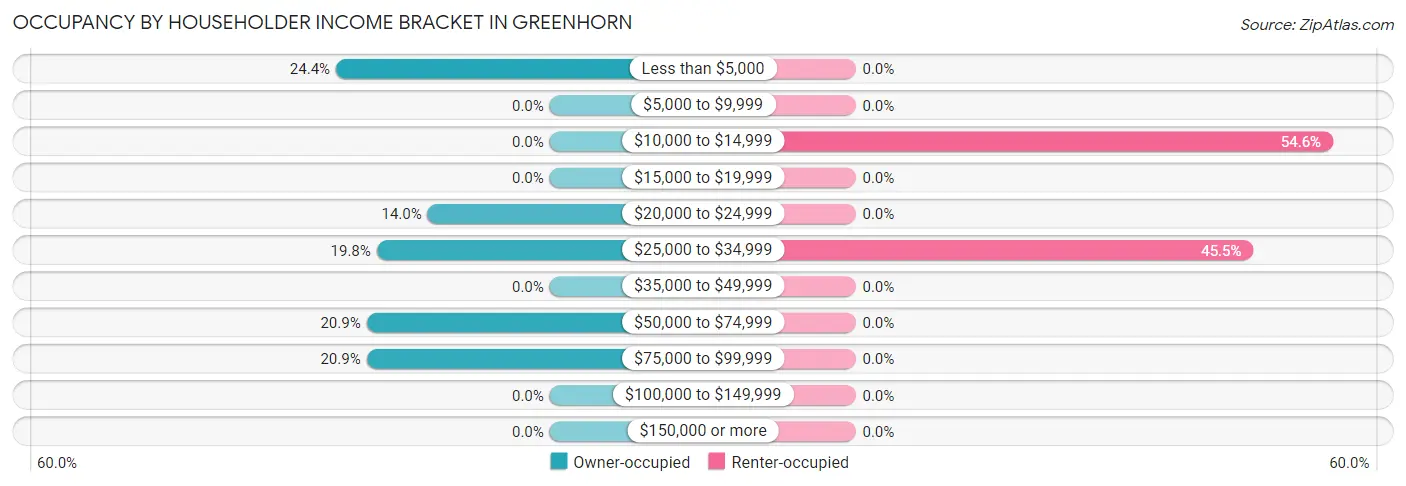
| Income Bracket | Owner-occupied | Renter-occupied |
| Less than $5,000 | 21 (24.4%) | 0 (0.0%) |
| $5,000 to $9,999 | 0 (0.0%) | 0 (0.0%) |
| $10,000 to $14,999 | 0 (0.0%) | 6 (54.5%) |
| $15,000 to $19,999 | 0 (0.0%) | 0 (0.0%) |
| $20,000 to $24,999 | 12 (14.0%) | 0 (0.0%) |
| $25,000 to $34,999 | 17 (19.8%) | 5 (45.5%) |
| $35,000 to $49,999 | 0 (0.0%) | 0 (0.0%) |
| $50,000 to $74,999 | 18 (20.9%) | 0 (0.0%) |
| $75,000 to $99,999 | 18 (20.9%) | 0 (0.0%) |
| $100,000 to $149,999 | 0 (0.0%) | 0 (0.0%) |
| $150,000 or more | 0 (0.0%) | 0 (0.0%) |
| Total | 86 (100.0%) | 11 (100.0%) |
Monthly Housing Cost Tiers in Greenhorn
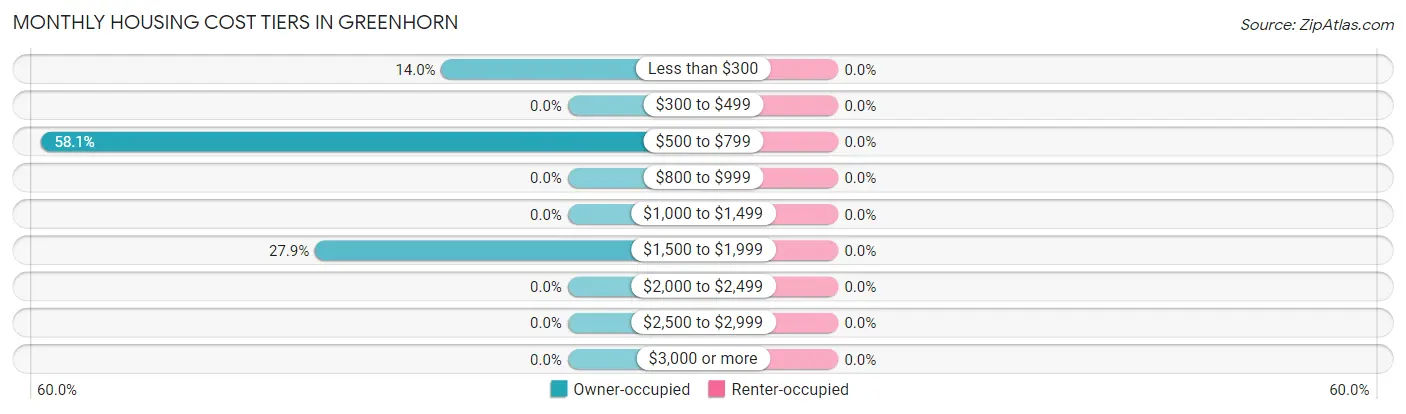
| Monthly Cost | Owner-occupied | Renter-occupied |
| Less than $300 | 12 (14.0%) | 0 (0.0%) |
| $300 to $499 | 0 (0.0%) | 0 (0.0%) |
| $500 to $799 | 50 (58.1%) | 0 (0.0%) |
| $800 to $999 | 0 (0.0%) | 0 (0.0%) |
| $1,000 to $1,499 | 0 (0.0%) | 0 (0.0%) |
| $1,500 to $1,999 | 24 (27.9%) | 0 (0.0%) |
| $2,000 to $2,499 | 0 (0.0%) | 0 (0.0%) |
| $2,500 to $2,999 | 0 (0.0%) | 0 (0.0%) |
| $3,000 or more | 0 (0.0%) | 0 (0.0%) |
| Total | 86 (100.0%) | 11 (100.0%) |
Physical Housing Characteristics in Greenhorn
Housing Structures in Greenhorn
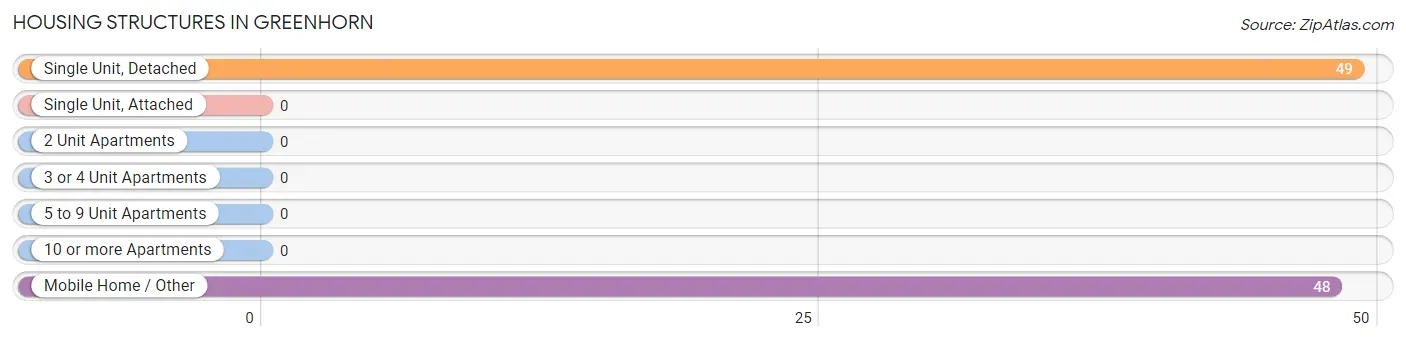
| Structure Type | # Housing Units | % Housing Units |
| Single Unit, Detached | 49 | 50.5% |
| Single Unit, Attached | 0 | 0.0% |
| 2 Unit Apartments | 0 | 0.0% |
| 3 or 4 Unit Apartments | 0 | 0.0% |
| 5 to 9 Unit Apartments | 0 | 0.0% |
| 10 or more Apartments | 0 | 0.0% |
| Mobile Home / Other | 48 | 49.5% |
| Total | 97 | 100.0% |
Housing Structures by Occupancy in Greenhorn
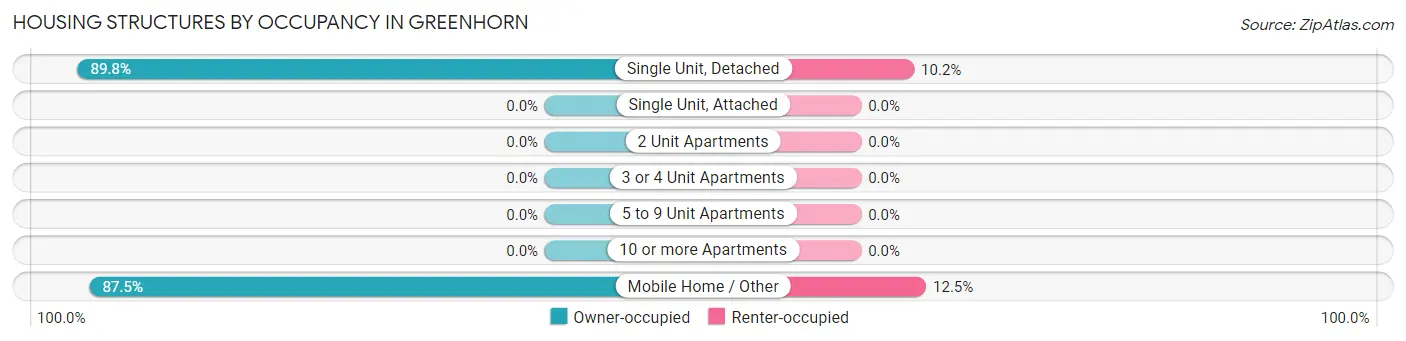
| Structure Type | Owner-occupied | Renter-occupied |
| Single Unit, Detached | 44 (89.8%) | 5 (10.2%) |
| Single Unit, Attached | 0 (0.0%) | 0 (0.0%) |
| 2 Unit Apartments | 0 (0.0%) | 0 (0.0%) |
| 3 or 4 Unit Apartments | 0 (0.0%) | 0 (0.0%) |
| 5 to 9 Unit Apartments | 0 (0.0%) | 0 (0.0%) |
| 10 or more Apartments | 0 (0.0%) | 0 (0.0%) |
| Mobile Home / Other | 42 (87.5%) | 6 (12.5%) |
| Total | 86 (88.7%) | 11 (11.3%) |
Housing Structures by Number of Rooms in Greenhorn
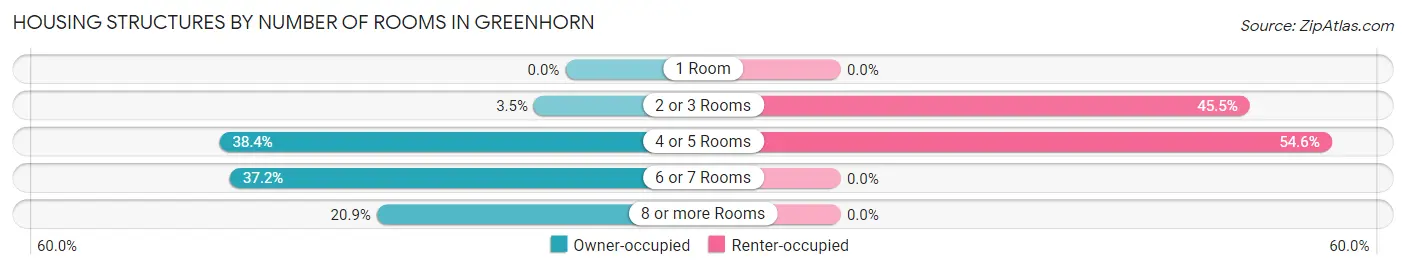
| Number of Rooms | Owner-occupied | Renter-occupied |
| 1 Room | 0 (0.0%) | 0 (0.0%) |
| 2 or 3 Rooms | 3 (3.5%) | 5 (45.5%) |
| 4 or 5 Rooms | 33 (38.4%) | 6 (54.5%) |
| 6 or 7 Rooms | 32 (37.2%) | 0 (0.0%) |
| 8 or more Rooms | 18 (20.9%) | 0 (0.0%) |
| Total | 86 (100.0%) | 11 (100.0%) |
Housing Structure by Heating Type in Greenhorn
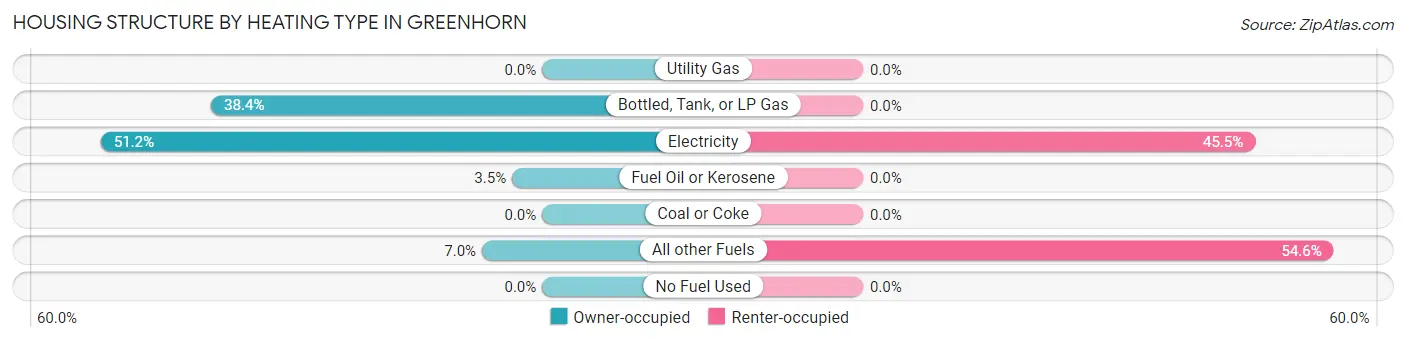
| Heating Type | Owner-occupied | Renter-occupied |
| Utility Gas | 0 (0.0%) | 0 (0.0%) |
| Bottled, Tank, or LP Gas | 33 (38.4%) | 0 (0.0%) |
| Electricity | 44 (51.2%) | 5 (45.5%) |
| Fuel Oil or Kerosene | 3 (3.5%) | 0 (0.0%) |
| Coal or Coke | 0 (0.0%) | 0 (0.0%) |
| All other Fuels | 6 (7.0%) | 6 (54.5%) |
| No Fuel Used | 0 (0.0%) | 0 (0.0%) |
| Total | 86 (100.0%) | 11 (100.0%) |
Household Vehicle Usage in Greenhorn
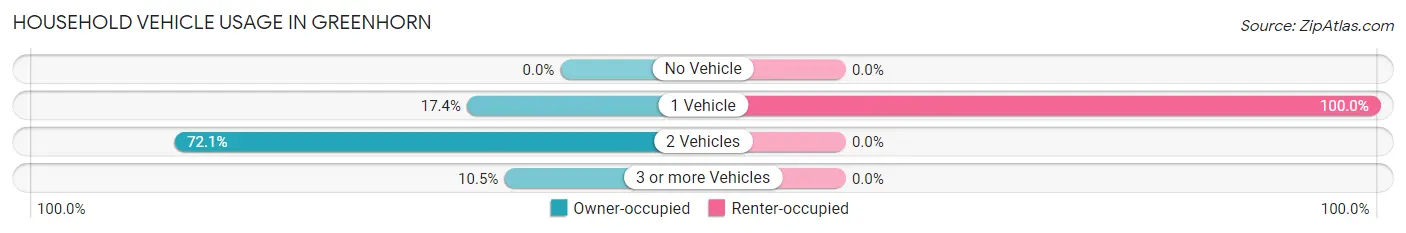
| Vehicles per Household | Owner-occupied | Renter-occupied |
| No Vehicle | 0 (0.0%) | 0 (0.0%) |
| 1 Vehicle | 15 (17.4%) | 11 (100.0%) |
| 2 Vehicles | 62 (72.1%) | 0 (0.0%) |
| 3 or more Vehicles | 9 (10.5%) | 0 (0.0%) |
| Total | 86 (100.0%) | 11 (100.0%) |
Real Estate & Mortgages in Greenhorn
Real Estate and Mortgage Overview in Greenhorn
| Characteristic | Without Mortgage | With Mortgage |
| Housing Units | 62 | 24 |
| Median Property Value | $258,300 | $0 |
| Median Household Income | - | - |
| Monthly Housing Costs | $549 | $0 |
| Real Estate Taxes | $1,722 | $0 |
Property Value by Mortgage Status in Greenhorn
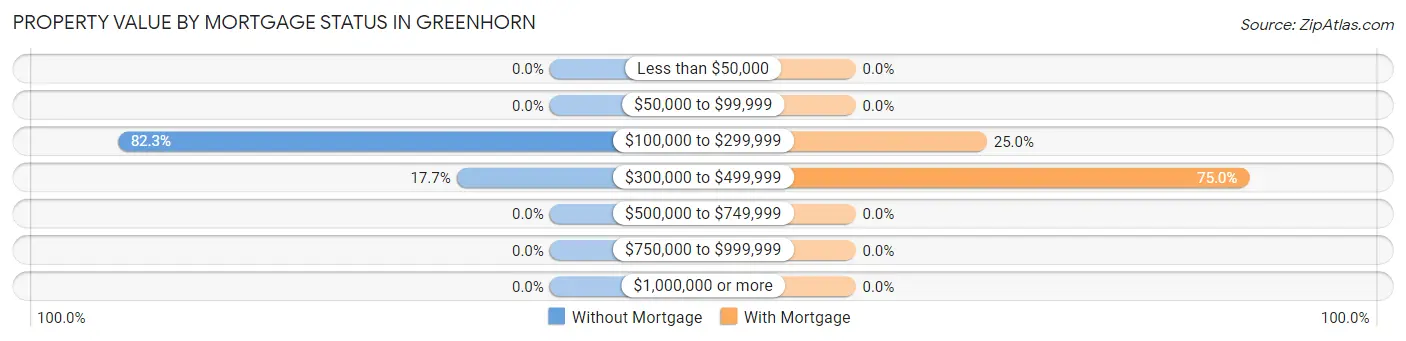
| Property Value | Without Mortgage | With Mortgage |
| Less than $50,000 | 0 (0.0%) | 0 (0.0%) |
| $50,000 to $99,999 | 0 (0.0%) | 0 (0.0%) |
| $100,000 to $299,999 | 51 (82.3%) | 6 (25.0%) |
| $300,000 to $499,999 | 11 (17.7%) | 18 (75.0%) |
| $500,000 to $749,999 | 0 (0.0%) | 0 (0.0%) |
| $750,000 to $999,999 | 0 (0.0%) | 0 (0.0%) |
| $1,000,000 or more | 0 (0.0%) | 0 (0.0%) |
| Total | 62 (100.0%) | 24 (100.0%) |
Household Income by Mortgage Status in Greenhorn
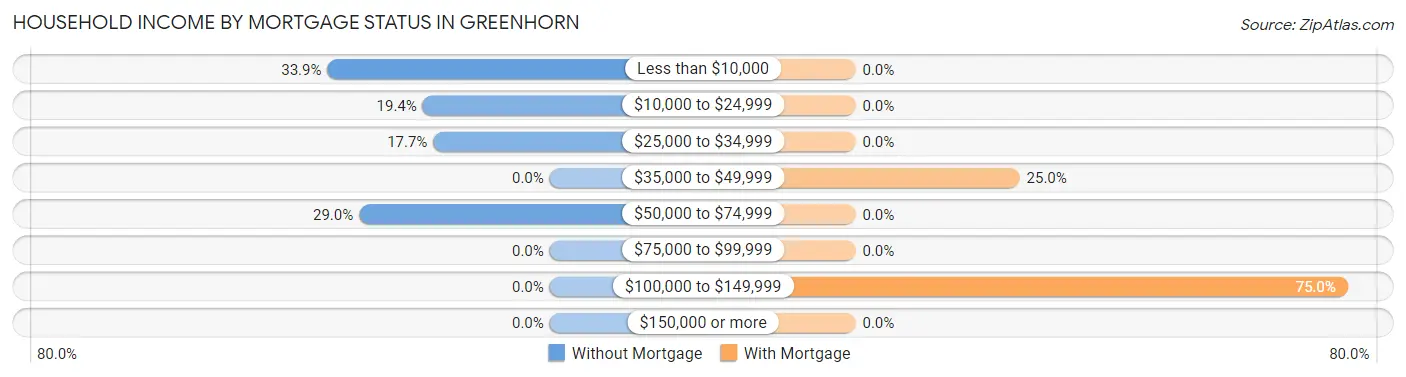
| Household Income | Without Mortgage | With Mortgage |
| Less than $10,000 | 21 (33.9%) | 0 (0.0%) |
| $10,000 to $24,999 | 12 (19.4%) | 0 (0.0%) |
| $25,000 to $34,999 | 11 (17.7%) | 0 (0.0%) |
| $35,000 to $49,999 | 0 (0.0%) | 6 (25.0%) |
| $50,000 to $74,999 | 18 (29.0%) | 0 (0.0%) |
| $75,000 to $99,999 | 0 (0.0%) | 0 (0.0%) |
| $100,000 to $149,999 | 0 (0.0%) | 18 (75.0%) |
| $150,000 or more | 0 (0.0%) | 0 (0.0%) |
| Total | 62 (100.0%) | 24 (100.0%) |
Property Value to Household Income Ratio in Greenhorn
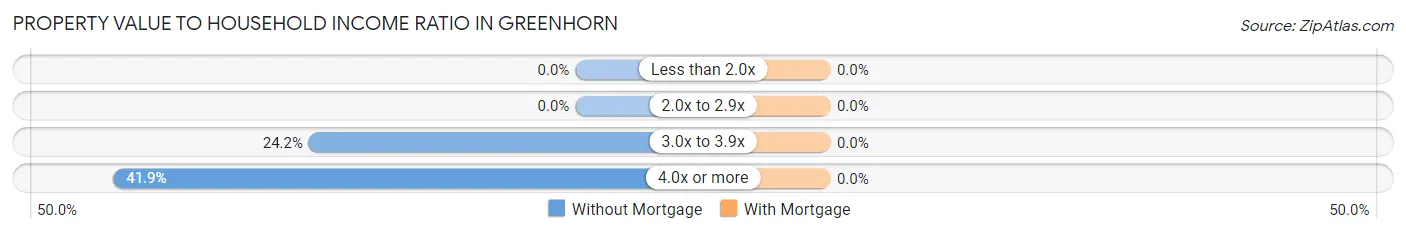
| Value-to-Income Ratio | Without Mortgage | With Mortgage |
| Less than 2.0x | 0 (0.0%) | 0 (0.0%) |
| 2.0x to 2.9x | 0 (0.0%) | 0 (0.0%) |
| 3.0x to 3.9x | 15 (24.2%) | 0 (0.0%) |
| 4.0x or more | 26 (41.9%) | 0 (0.0%) |
| Total | 62 (100.0%) | 24 (100.0%) |
Real Estate Taxes by Mortgage Status in Greenhorn
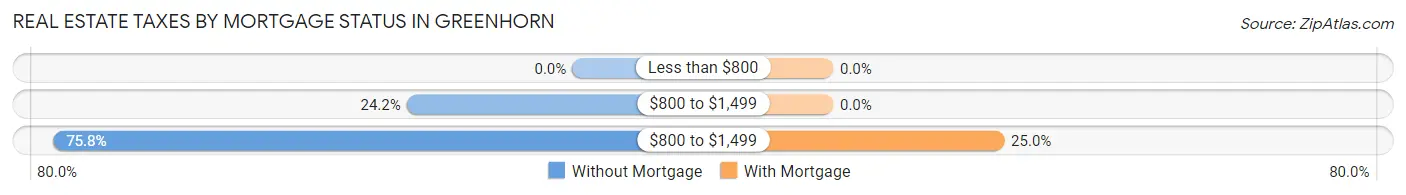
| Property Taxes | Without Mortgage | With Mortgage |
| Less than $800 | 0 (0.0%) | 0 (0.0%) |
| $800 to $1,499 | 15 (24.2%) | 0 (0.0%) |
| $800 to $1,499 | 47 (75.8%) | 6 (25.0%) |
| Total | 62 (100.0%) | 24 (100.0%) |
Health & Disability in Greenhorn
Health Insurance Coverage by Age in Greenhorn
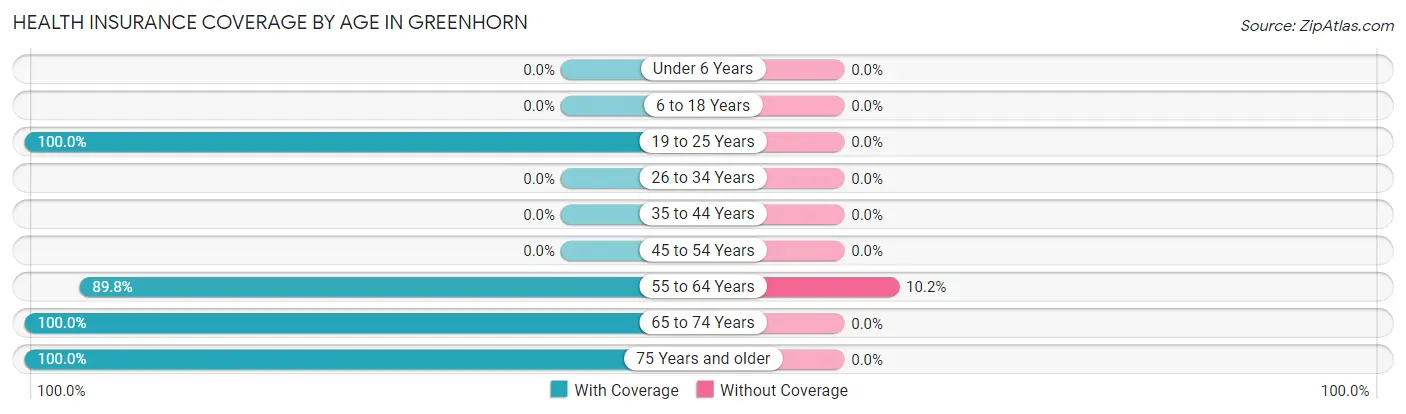
| Age Bracket | With Coverage | Without Coverage |
| Under 6 Years | 0 (0.0%) | 0 (0.0%) |
| 6 to 18 Years | 0 (0.0%) | 0 (0.0%) |
| 19 to 25 Years | 16 (100.0%) | 0 (0.0%) |
| 26 to 34 Years | 0 (0.0%) | 0 (0.0%) |
| 35 to 44 Years | 0 (0.0%) | 0 (0.0%) |
| 45 to 54 Years | 0 (0.0%) | 0 (0.0%) |
| 55 to 64 Years | 79 (89.8%) | 9 (10.2%) |
| 65 to 74 Years | 18 (100.0%) | 0 (0.0%) |
| 75 Years and older | 52 (100.0%) | 0 (0.0%) |
| Total | 165 (94.8%) | 9 (5.2%) |
Health Insurance Coverage by Citizenship Status in Greenhorn
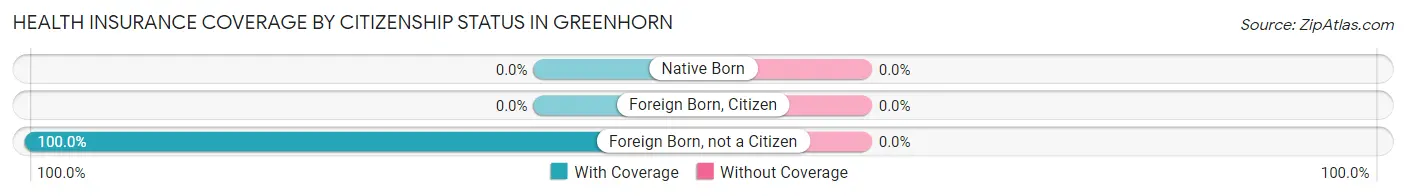
| Citizenship Status | With Coverage | Without Coverage |
| Native Born | 0 (0.0%) | 0 (0.0%) |
| Foreign Born, Citizen | 0 (0.0%) | 0 (0.0%) |
| Foreign Born, not a Citizen | 16 (100.0%) | 0 (0.0%) |
Health Insurance Coverage by Household Income in Greenhorn
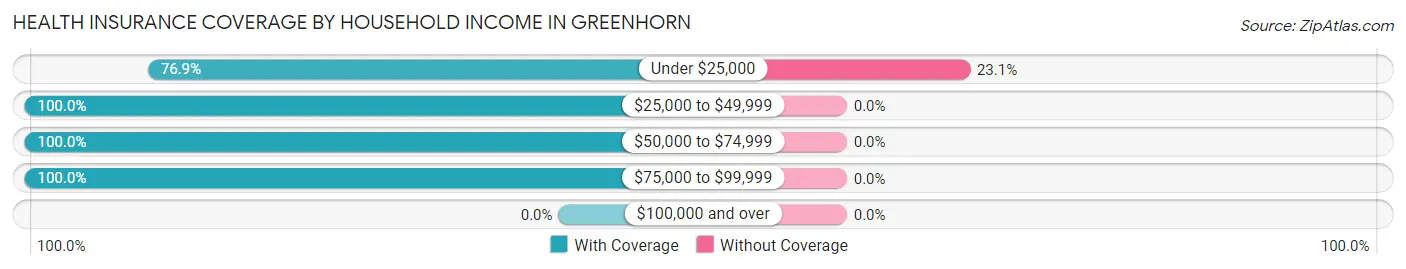
| Household Income | With Coverage | Without Coverage |
| Under $25,000 | 30 (76.9%) | 9 (23.1%) |
| $25,000 to $49,999 | 44 (100.0%) | 0 (0.0%) |
| $50,000 to $74,999 | 21 (100.0%) | 0 (0.0%) |
| $75,000 to $99,999 | 70 (100.0%) | 0 (0.0%) |
| $100,000 and over | 0 (0.0%) | 0 (0.0%) |
Public vs Private Health Insurance Coverage by Age in Greenhorn
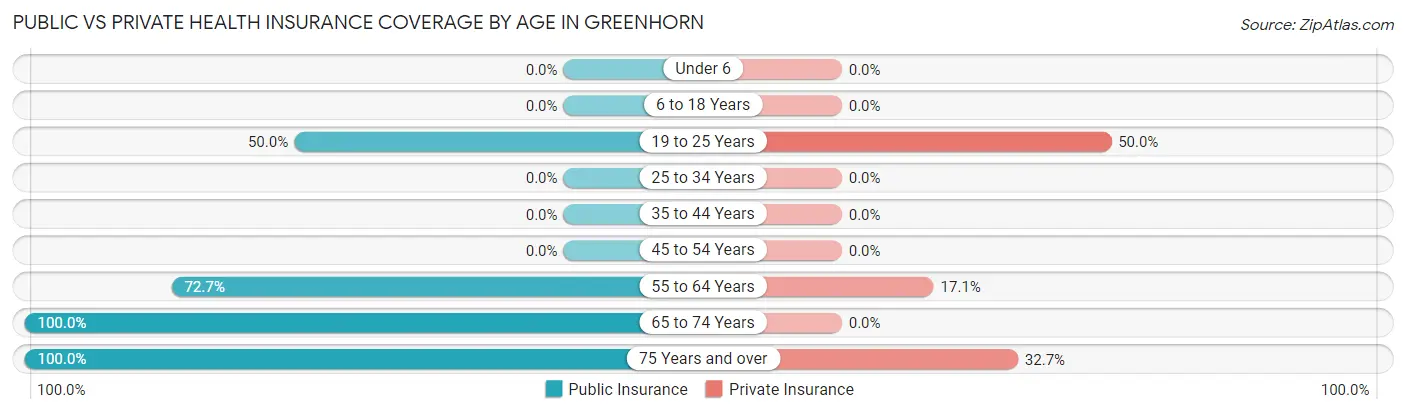
| Age Bracket | Public Insurance | Private Insurance |
| Under 6 | 0 (0.0%) | 0 (0.0%) |
| 6 to 18 Years | 0 (0.0%) | 0 (0.0%) |
| 19 to 25 Years | 8 (50.0%) | 8 (50.0%) |
| 25 to 34 Years | 0 (0.0%) | 0 (0.0%) |
| 35 to 44 Years | 0 (0.0%) | 0 (0.0%) |
| 45 to 54 Years | 0 (0.0%) | 0 (0.0%) |
| 55 to 64 Years | 64 (72.7%) | 15 (17.1%) |
| 65 to 74 Years | 18 (100.0%) | 0 (0.0%) |
| 75 Years and over | 52 (100.0%) | 17 (32.7%) |
| Total | 142 (81.6%) | 40 (23.0%) |
Disability Status by Sex by Age in Greenhorn
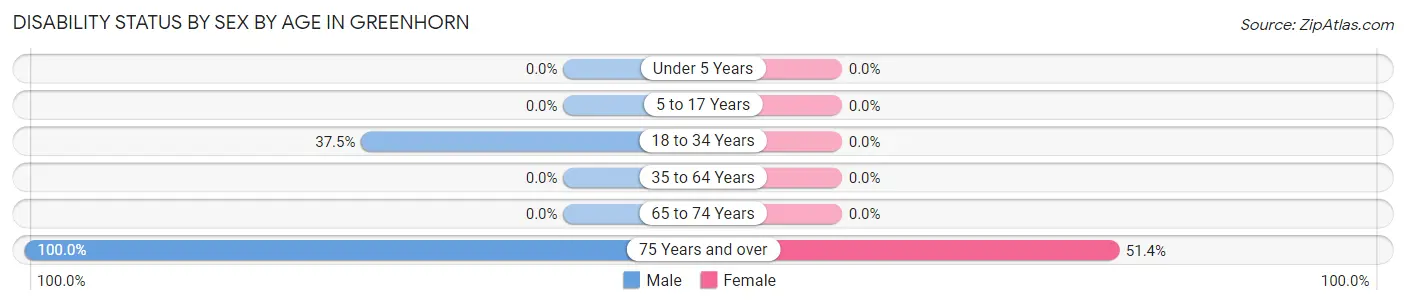
| Age Bracket | Male | Female |
| Under 5 Years | 0 (0.0%) | 0 (0.0%) |
| 5 to 17 Years | 0 (0.0%) | 0 (0.0%) |
| 18 to 34 Years | 3 (37.5%) | 0 (0.0%) |
| 35 to 64 Years | 0 (0.0%) | 0 (0.0%) |
| 65 to 74 Years | 0 (0.0%) | 0 (0.0%) |
| 75 Years and over | 17 (100.0%) | 18 (51.4%) |
Disability Class by Sex by Age in Greenhorn
Disability Class: Hearing Difficulty
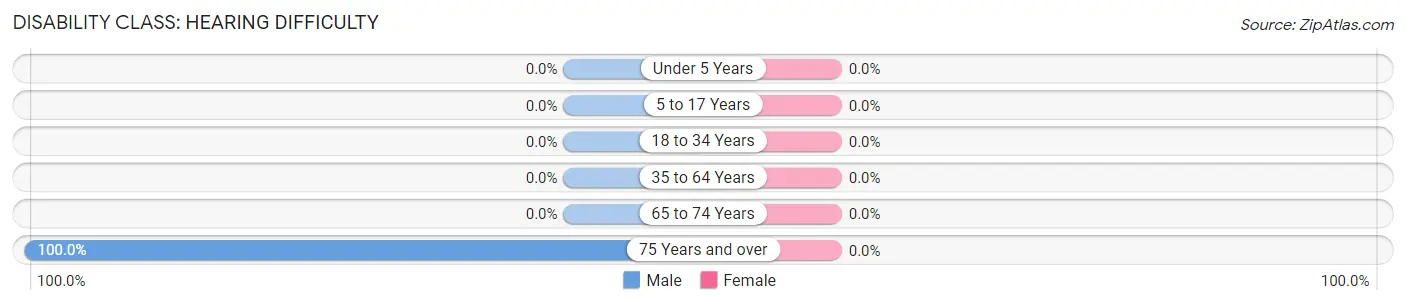
| Age Bracket | Male | Female |
| Under 5 Years | 0 (0.0%) | 0 (0.0%) |
| 5 to 17 Years | 0 (0.0%) | 0 (0.0%) |
| 18 to 34 Years | 0 (0.0%) | 0 (0.0%) |
| 35 to 64 Years | 0 (0.0%) | 0 (0.0%) |
| 65 to 74 Years | 0 (0.0%) | 0 (0.0%) |
| 75 Years and over | 17 (100.0%) | 0 (0.0%) |
Disability Class: Vision Difficulty
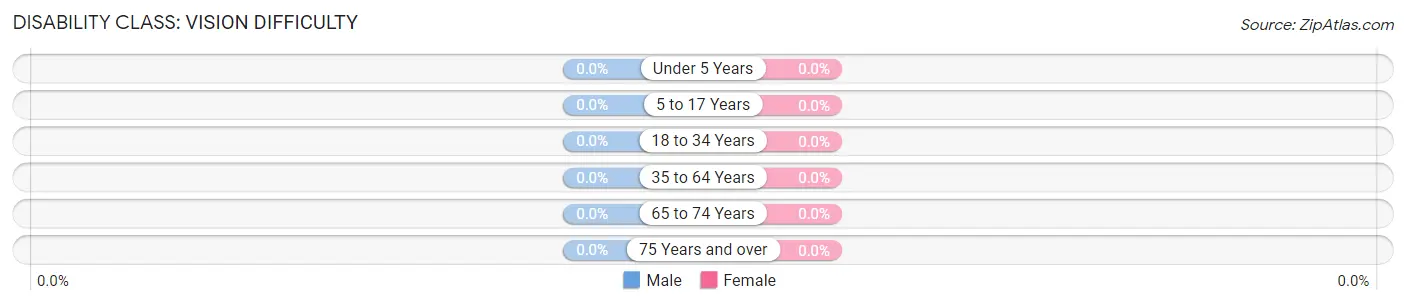
| Age Bracket | Male | Female |
| Under 5 Years | 0 (0.0%) | 0 (0.0%) |
| 5 to 17 Years | 0 (0.0%) | 0 (0.0%) |
| 18 to 34 Years | 0 (0.0%) | 0 (0.0%) |
| 35 to 64 Years | 0 (0.0%) | 0 (0.0%) |
| 65 to 74 Years | 0 (0.0%) | 0 (0.0%) |
| 75 Years and over | 0 (0.0%) | 0 (0.0%) |
Disability Class: Cognitive Difficulty
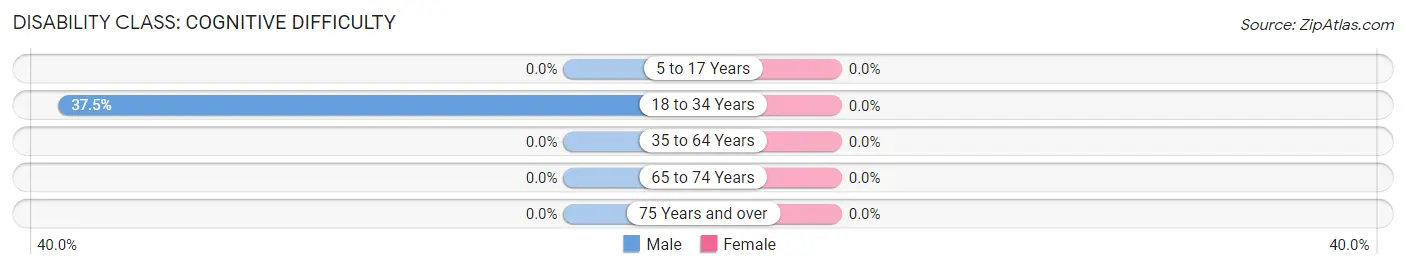
| Age Bracket | Male | Female |
| 5 to 17 Years | 0 (0.0%) | 0 (0.0%) |
| 18 to 34 Years | 3 (37.5%) | 0 (0.0%) |
| 35 to 64 Years | 0 (0.0%) | 0 (0.0%) |
| 65 to 74 Years | 0 (0.0%) | 0 (0.0%) |
| 75 Years and over | 0 (0.0%) | 0 (0.0%) |
Disability Class: Ambulatory Difficulty
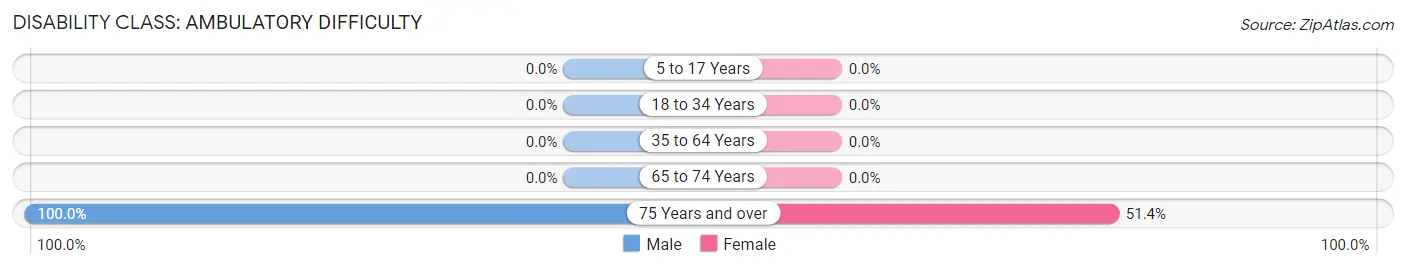
| Age Bracket | Male | Female |
| 5 to 17 Years | 0 (0.0%) | 0 (0.0%) |
| 18 to 34 Years | 0 (0.0%) | 0 (0.0%) |
| 35 to 64 Years | 0 (0.0%) | 0 (0.0%) |
| 65 to 74 Years | 0 (0.0%) | 0 (0.0%) |
| 75 Years and over | 17 (100.0%) | 18 (51.4%) |
Disability Class: Self-Care Difficulty
| Age Bracket | Male | Female |
| 5 to 17 Years | 0 (0.0%) | 0 (0.0%) |
| 18 to 34 Years | 0 (0.0%) | 0 (0.0%) |
| 35 to 64 Years | 0 (0.0%) | 0 (0.0%) |
| 65 to 74 Years | 0 (0.0%) | 0 (0.0%) |
| 75 Years and over | 0 (0.0%) | 0 (0.0%) |
Technology Access in Greenhorn
Computing Device Access in Greenhorn
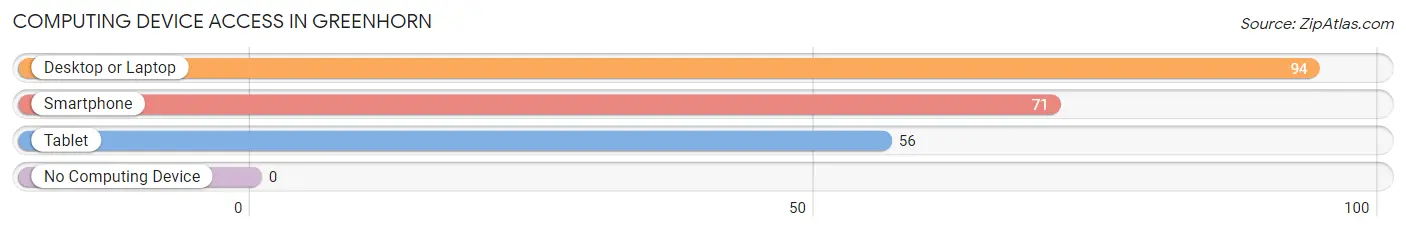
| Device Type | # Households | % Households |
| Desktop or Laptop | 94 | 96.9% |
| Smartphone | 71 | 73.2% |
| Tablet | 56 | 57.7% |
| No Computing Device | 0 | 0.0% |
| Total | 97 | 100.0% |
Internet Access in Greenhorn
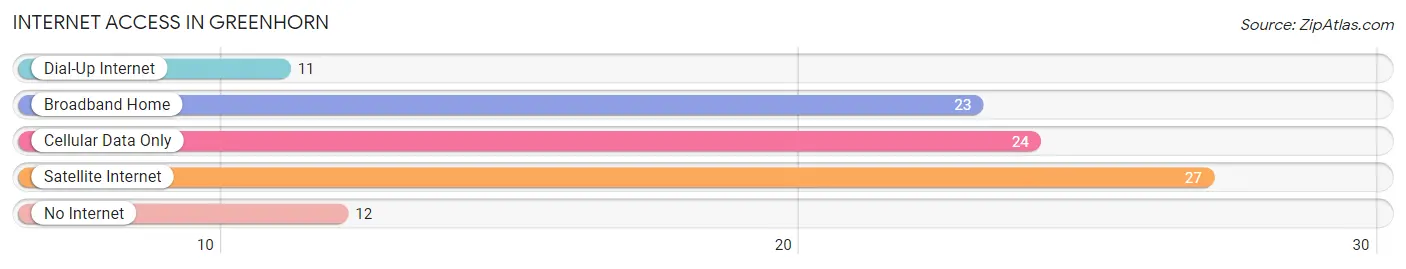
| Internet Type | # Households | % Households |
| Dial-Up Internet | 11 | 11.3% |
| Broadband Home | 23 | 23.7% |
| Cellular Data Only | 24 | 24.7% |
| Satellite Internet | 27 | 27.8% |
| No Internet | 12 | 12.4% |
| Total | 97 | 100.0% |
Greenhorn Summary
History
Greenhorn, California is a small unincorporated community located in the Sierra Nevada foothills of El Dorado County. It is situated in the Sierra Nevada mountain range, approximately 25 miles east of Placerville and 40 miles northeast of Sacramento. The area was first settled in the late 1800s by miners and ranchers who were drawn to the area by the gold rush. The town was officially established in 1891 and named after the nearby Greenhorn Creek.
Greenhorn was a thriving community in the early 1900s, with a population of over 500 people. The town had a post office, a general store, a blacksmith shop, a school, and several churches. The town was also home to a number of saloons and gambling halls, which were popular with the miners and ranchers in the area.
The town began to decline in the 1920s as the gold rush ended and the population began to move away. By the 1950s, the population had dwindled to just a few hundred people. The town was further impacted by the construction of the nearby Union Valley Reservoir in the 1960s, which flooded much of the surrounding area.
Today, Greenhorn is a small, rural community with a population of just over 200 people. The town is home to a few small businesses, including a general store, a post office, and a few restaurants. The town is also home to a number of historic buildings, including the old schoolhouse, which is now a museum.
Geography
Greenhorn is located in the Sierra Nevada foothills of El Dorado County, California. The town is situated in the Sierra Nevada mountain range, approximately 25 miles east of Placerville and 40 miles northeast of Sacramento. The town is located at an elevation of 2,400 feet and is surrounded by rolling hills and forests. The nearby Union Valley Reservoir is a popular destination for fishing, boating, and camping.
The climate in Greenhorn is typical of the Sierra Nevada foothills, with hot, dry summers and cold, wet winters. The average high temperature in the summer is around 90 degrees Fahrenheit, while the average low temperature in the winter is around 30 degrees Fahrenheit.
Economy
Greenhorn is a small, rural community with a population of just over 200 people. The town is home to a few small businesses, including a general store, a post office, and a few restaurants. The town is also home to a number of historic buildings, including the old schoolhouse, which is now a museum.
The economy of Greenhorn is largely based on tourism, with visitors coming to the area to enjoy the nearby Union Valley Reservoir and the surrounding forests and hills. The town is also home to a number of small businesses, including a general store, a post office, and a few restaurants.
Demographics
As of the 2010 census, the population of Greenhorn was 203 people. The racial makeup of the town was 94.6% White, 0.5% African American, 0.5% Native American, 0.5% Asian, 0.0% Pacific Islander, 2.0% from other races, and 2.0% from two or more races. Hispanic or Latino of any race were 4.9% of the population.
The median household income in Greenhorn was $45,833, and the median family income was $50,000. The per capita income for the town was $20,945. About 11.3% of families and 14.3% of the population were below the poverty line, including 18.2% of those under age 18 and none of those age 65 or over.
Common Questions
What is the Total Population of Greenhorn?
Total Population of Greenhorn is 174.
What is the Total Male Population of Greenhorn?
Total Male Population of Greenhorn is 107.
What is the Total Female Population of Greenhorn?
Total Female Population of Greenhorn is 67.
What is the Ratio of Males per 100 Females in Greenhorn?
There are 159.70 Males per 100 Females in Greenhorn.
What is the Ratio of Females per 100 Males in Greenhorn?
There are 62.62 Females per 100 Males in Greenhorn.
What is the Median Population Age in Greenhorn?
Median Population Age in Greenhorn is 64.6 Years.
What is the Average Family Size in Greenhorn
Average Family Size in Greenhorn is 3.2 People.
What is the Average Household Size in Greenhorn
Average Household Size in Greenhorn is 1.8 People.
What is Per Capita Income in Greenhorn?
Per Capita income in Greenhorn is $22,467.
What is the Median Household income in Greenhorn?
Median Household Income in Greenhorn is $28,984.
What is Inequality or Gini Index in Greenhorn?
Inequality or Gini Index in Greenhorn is 0.45.
How Large is the Labor Force in Greenhorn?
There are 53 People in the Labor Forcein in Greenhorn.
What is the Percentage of People in the Labor Force in Greenhorn?
30.5% of People are in the Labor Force in Greenhorn.