Goshen, CA
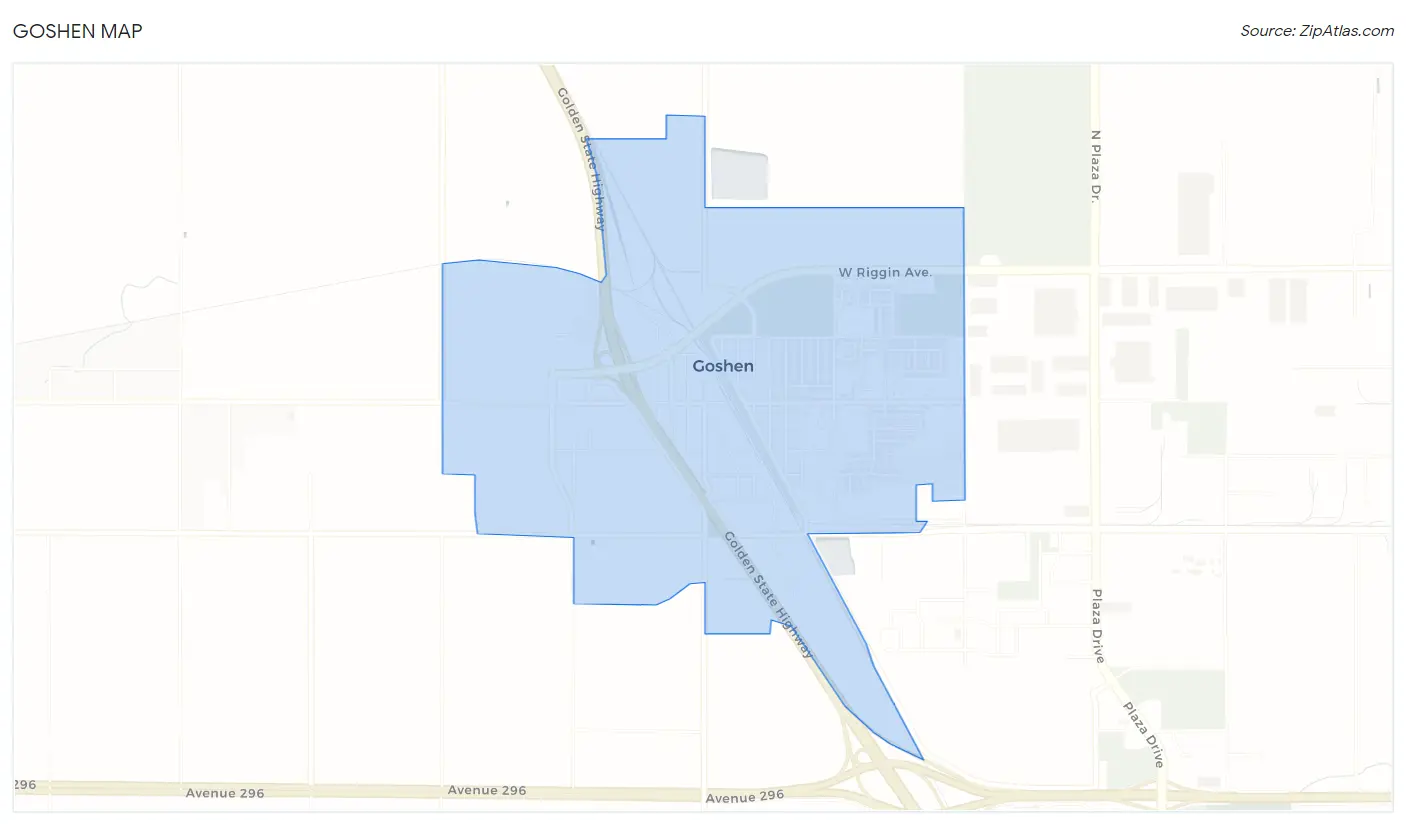
Goshen Map
Goshen Overview
4,974
TOTAL POPULATION
2,314
MALE POPULATION
2,660
FEMALE POPULATION
86.99
MALES / 100 FEMALES
114.95
FEMALES / 100 MALES
29.3
MEDIAN AGE
3.8
AVG FAMILY SIZE
3.9
AVG HOUSEHOLD SIZE
$20,088
PER CAPITA INCOME
$60,116
AVG FAMILY INCOME
$62,216
AVG HOUSEHOLD INCOME
21.7%
WAGE / INCOME GAP [ % ]
78.3¢/ $1
WAGE / INCOME GAP [ $ ]
0.42
INEQUALITY / GINI INDEX
2,353
LABOR FORCE [ PEOPLE ]
67.0%
PERCENT IN LABOR FORCE
4.4%
UNEMPLOYMENT RATE
Goshen Zip Codes
Goshen Area Codes
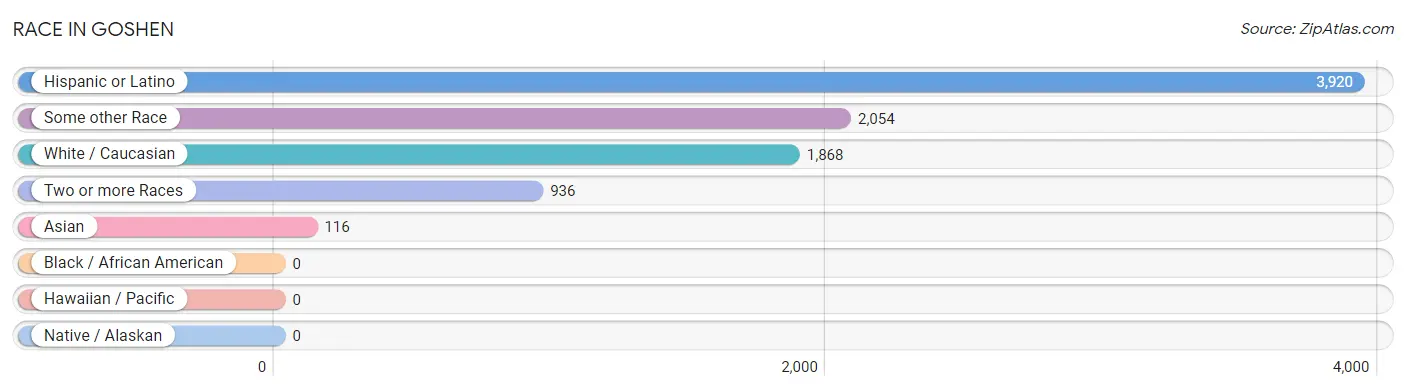
Race in Goshen
The most populous races in Goshen are Hispanic or Latino (3,920 | 78.8%), Some other Race (2,054 | 41.3%), and White / Caucasian (1,868 | 37.6%).
| Race | # Population | % Population |
| Asian | 116 | 2.3% |
| Black / African American | 0 | 0.0% |
| Hawaiian / Pacific | 0 | 0.0% |
| Hispanic or Latino | 3,920 | 78.8% |
| Native / Alaskan | 0 | 0.0% |
| White / Caucasian | 1,868 | 37.6% |
| Two or more Races | 936 | 18.8% |
| Some other Race | 2,054 | 41.3% |
| Total | 4,974 | 100.0% |
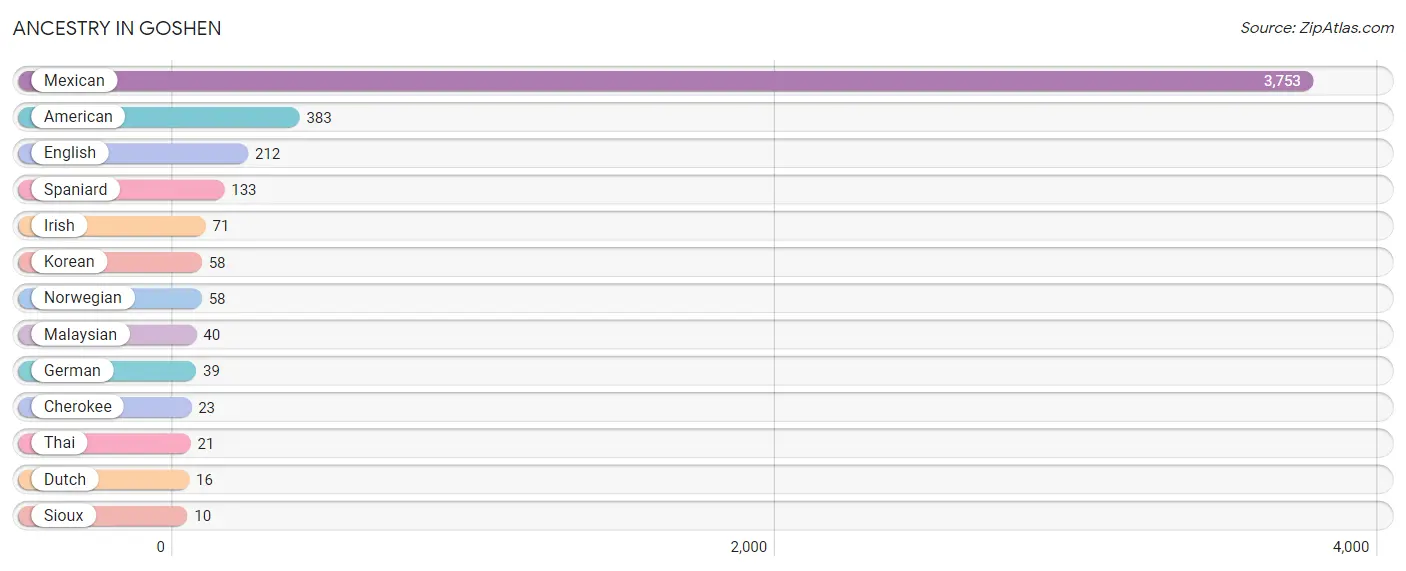
Ancestry in Goshen
The most populous ancestries reported in Goshen are Mexican (3,753 | 75.4%), American (383 | 7.7%), English (212 | 4.3%), Spaniard (133 | 2.7%), and Irish (71 | 1.4%), together accounting for 91.5% of all Goshen residents.
| Ancestry | # Population | % Population |
| American | 383 | 7.7% |
| Cherokee | 23 | 0.5% |
| Dutch | 16 | 0.3% |
| English | 212 | 4.3% |
| German | 39 | 0.8% |
| Irish | 71 | 1.4% |
| Korean | 58 | 1.2% |
| Malaysian | 40 | 0.8% |
| Mexican | 3,753 | 75.4% |
| Norwegian | 58 | 1.2% |
| Sioux | 10 | 0.2% |
| Spaniard | 133 | 2.7% |
| Thai | 21 | 0.4% | View All 13 Rows |
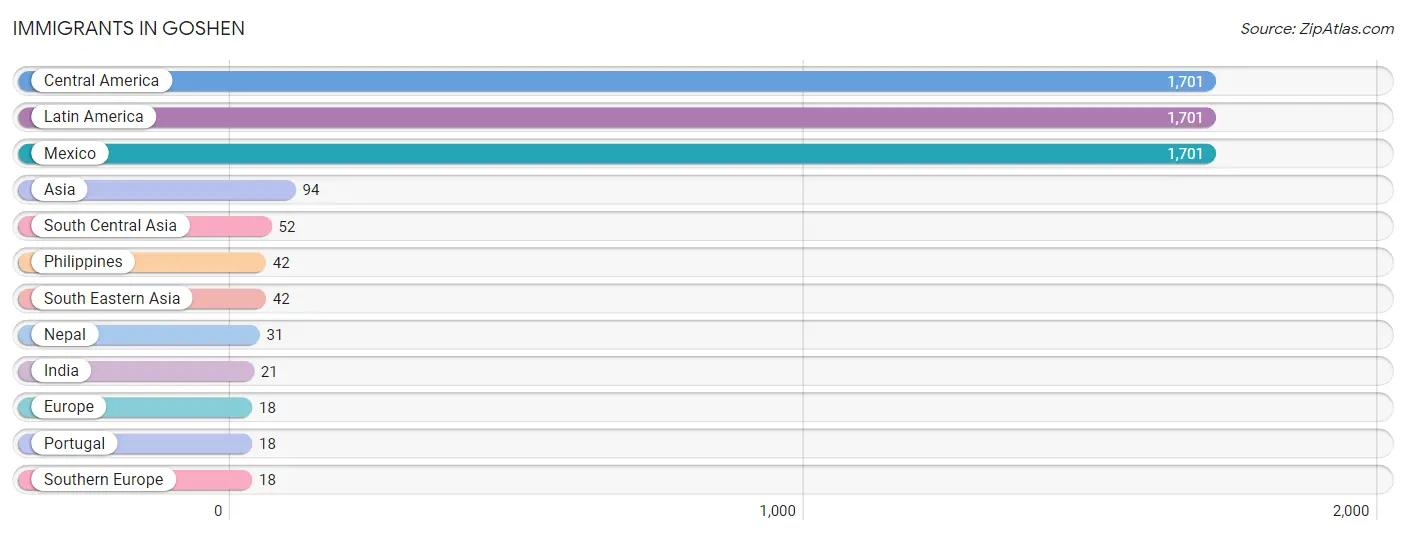
Immigrants in Goshen
The most numerous immigrant groups reported in Goshen came from Central America (1,701 | 34.2%), Latin America (1,701 | 34.2%), Mexico (1,701 | 34.2%), Asia (94 | 1.9%), and South Central Asia (52 | 1.1%), together accounting for 105.5% of all Goshen residents.
| Immigration Origin | # Population | % Population |
| Asia | 94 | 1.9% |
| Central America | 1,701 | 34.2% |
| Europe | 18 | 0.4% |
| India | 21 | 0.4% |
| Latin America | 1,701 | 34.2% |
| Mexico | 1,701 | 34.2% |
| Nepal | 31 | 0.6% |
| Philippines | 42 | 0.8% |
| Portugal | 18 | 0.4% |
| South Central Asia | 52 | 1.1% |
| South Eastern Asia | 42 | 0.8% |
| Southern Europe | 18 | 0.4% | View All 12 Rows |
Sex and Age in Goshen
Sex and Age in Goshen
The most populous age groups in Goshen are 10 to 14 Years (377 | 16.3%) for men and 35 to 39 Years (285 | 10.7%) for women.
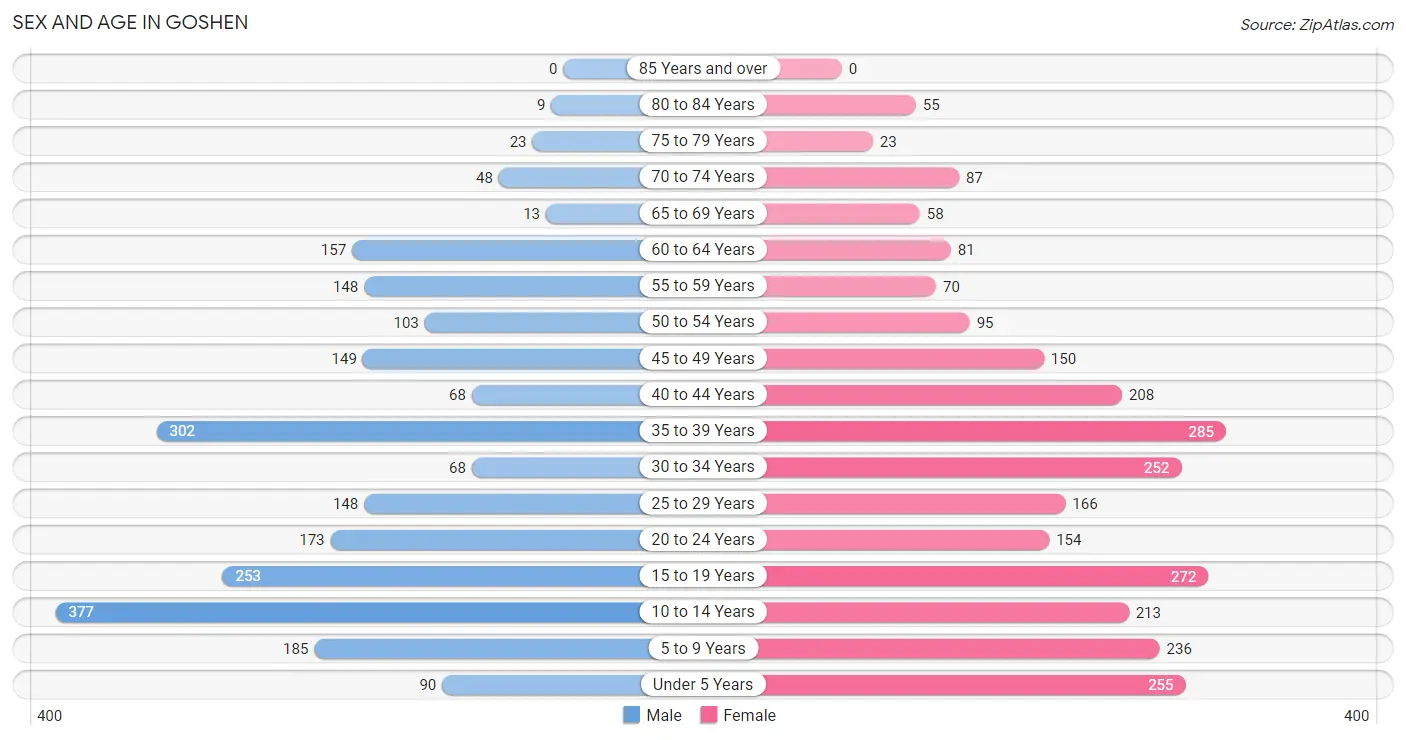
| Age Bracket | Male | Female |
| Under 5 Years | 90 (3.9%) | 255 (9.6%) |
| 5 to 9 Years | 185 (8.0%) | 236 (8.9%) |
| 10 to 14 Years | 377 (16.3%) | 213 (8.0%) |
| 15 to 19 Years | 253 (10.9%) | 272 (10.2%) |
| 20 to 24 Years | 173 (7.5%) | 154 (5.8%) |
| 25 to 29 Years | 148 (6.4%) | 166 (6.2%) |
| 30 to 34 Years | 68 (2.9%) | 252 (9.5%) |
| 35 to 39 Years | 302 (13.1%) | 285 (10.7%) |
| 40 to 44 Years | 68 (2.9%) | 208 (7.8%) |
| 45 to 49 Years | 149 (6.4%) | 150 (5.6%) |
| 50 to 54 Years | 103 (4.4%) | 95 (3.6%) |
| 55 to 59 Years | 148 (6.4%) | 70 (2.6%) |
| 60 to 64 Years | 157 (6.8%) | 81 (3.0%) |
| 65 to 69 Years | 13 (0.6%) | 58 (2.2%) |
| 70 to 74 Years | 48 (2.1%) | 87 (3.3%) |
| 75 to 79 Years | 23 (1.0%) | 23 (0.9%) |
| 80 to 84 Years | 9 (0.4%) | 55 (2.1%) |
| 85 Years and over | 0 (0.0%) | 0 (0.0%) |
| Total | 2,314 (100.0%) | 2,660 (100.0%) |
Families and Households in Goshen
Median Family Size in Goshen
The median family size in Goshen is 3.82 persons per family, with single female/mother families (380 | 32.2%) accounting for the largest median family size of 4.27 persons per family. On the other hand, single male/father families (239 | 20.3%) represent the smallest median family size with 3.38 persons per family.
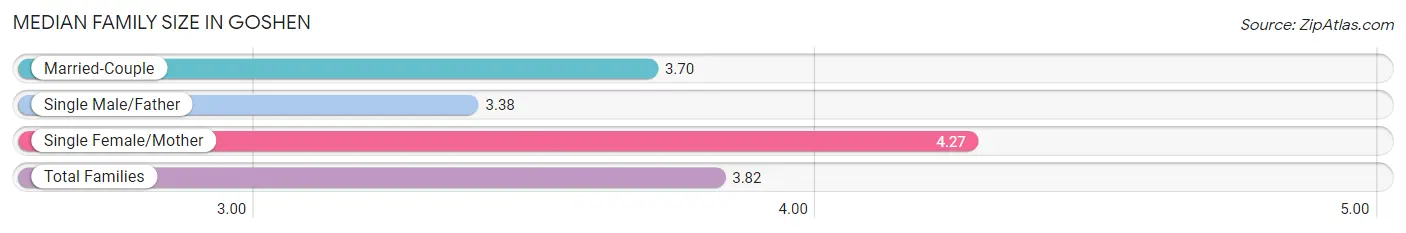
| Family Type | # Families | Family Size |
| Married-Couple | 560 (47.5%) | 3.70 |
| Single Male/Father | 239 (20.3%) | 3.38 |
| Single Female/Mother | 380 (32.2%) | 4.27 |
| Total Families | 1,179 (100.0%) | 3.82 |
Median Household Size in Goshen
The median household size in Goshen is 3.89 persons per household, with single female/mother households (380 | 29.7%) accounting for the largest median household size of 4.5 persons per household. non-family households (101 | 7.9%) represent the smallest median household size with 2.41 persons per household.
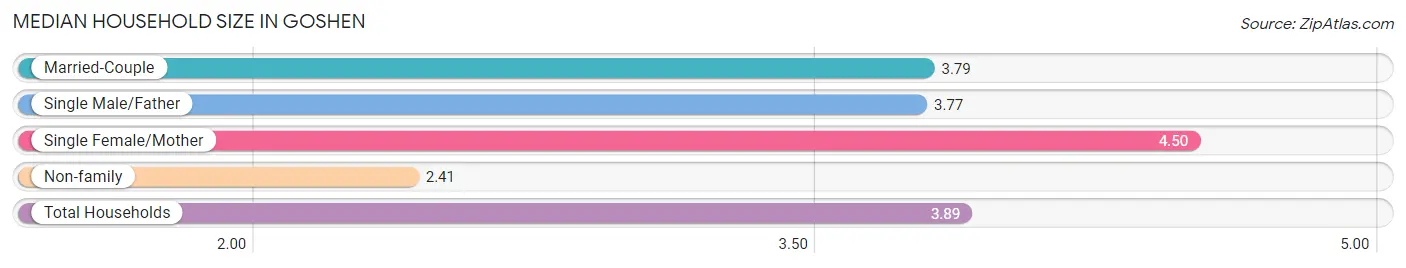
| Household Type | # Households | Household Size |
| Married-Couple | 560 (43.8%) | 3.79 |
| Single Male/Father | 239 (18.7%) | 3.77 |
| Single Female/Mother | 380 (29.7%) | 4.50 |
| Non-family | 101 (7.9%) | 2.41 |
| Total Households | 1,280 (100.0%) | 3.89 |
Household Size by Marriage Status in Goshen
Out of a total of 1,280 households in Goshen, 1,179 (92.1%) are family households, while 101 (7.9%) are nonfamily households. The most numerous type of family households are 4-person households, comprising 385, and the most common type of nonfamily households are 1-person households, comprising 37.
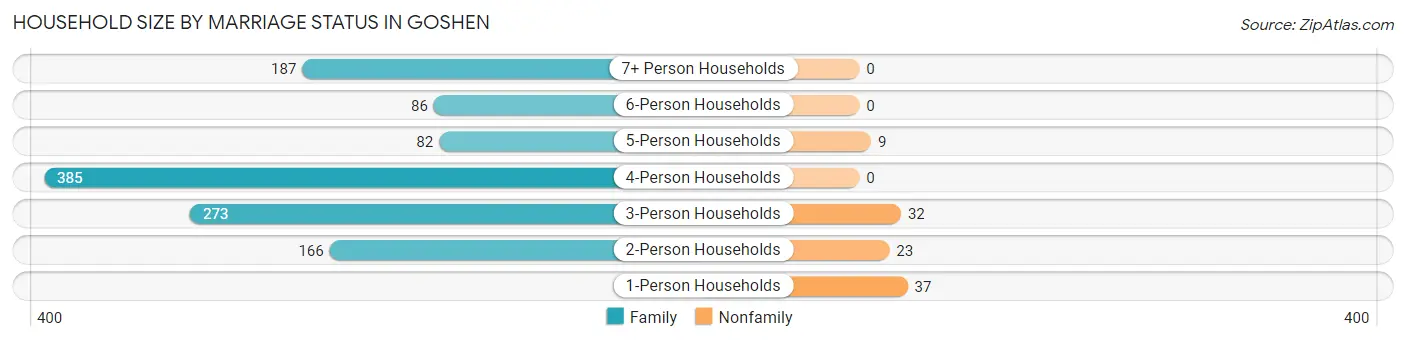
| Household Size | Family Households | Nonfamily Households |
| 1-Person Households | - | 37 (2.9%) |
| 2-Person Households | 166 (13.0%) | 23 (1.8%) |
| 3-Person Households | 273 (21.3%) | 32 (2.5%) |
| 4-Person Households | 385 (30.1%) | 0 (0.0%) |
| 5-Person Households | 82 (6.4%) | 9 (0.7%) |
| 6-Person Households | 86 (6.7%) | 0 (0.0%) |
| 7+ Person Households | 187 (14.6%) | 0 (0.0%) |
| Total | 1,179 (92.1%) | 101 (7.9%) |
Female Fertility in Goshen
Fertility by Age in Goshen
Average fertility rate in Goshen is 35.0 births per 1,000 women. Women in the age bracket of 20 to 34 years have the highest fertility rate with 94.0 births per 1,000 women. Women in the age bracket of 20 to 34 years acount for 100.0% of all women with births.
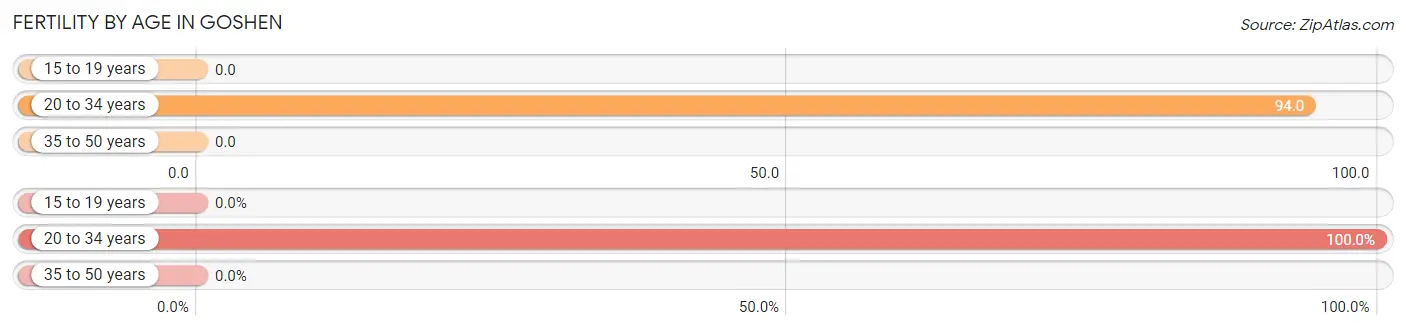
| Age Bracket | Women with Births | Births / 1,000 Women |
| 15 to 19 years | 0 (0.0%) | 0.0 |
| 20 to 34 years | 54 (100.0%) | 94.0 |
| 35 to 50 years | 0 (0.0%) | 0.0 |
| Total | 54 (100.0%) | 35.0 |
Fertility by Age by Marriage Status in Goshen
50.0% of women with births (54) in Goshen are married. The highest percentage of unmarried women with births falls into 20 to 34 years age bracket with 50.0% of them unmarried at the time of birth, while the lowest percentage of unmarried women with births belong to 20 to 34 years age bracket with 50.0% of them unmarried.
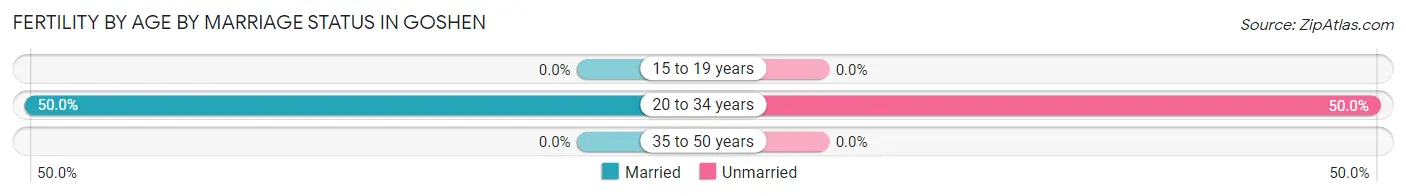
| Age Bracket | Married | Unmarried |
| 15 to 19 years | 0 (0.0%) | 0 (0.0%) |
| 20 to 34 years | 27 (50.0%) | 27 (50.0%) |
| 35 to 50 years | 0 (0.0%) | 0 (0.0%) |
| Total | 27 (50.0%) | 27 (50.0%) |
Fertility by Education in Goshen
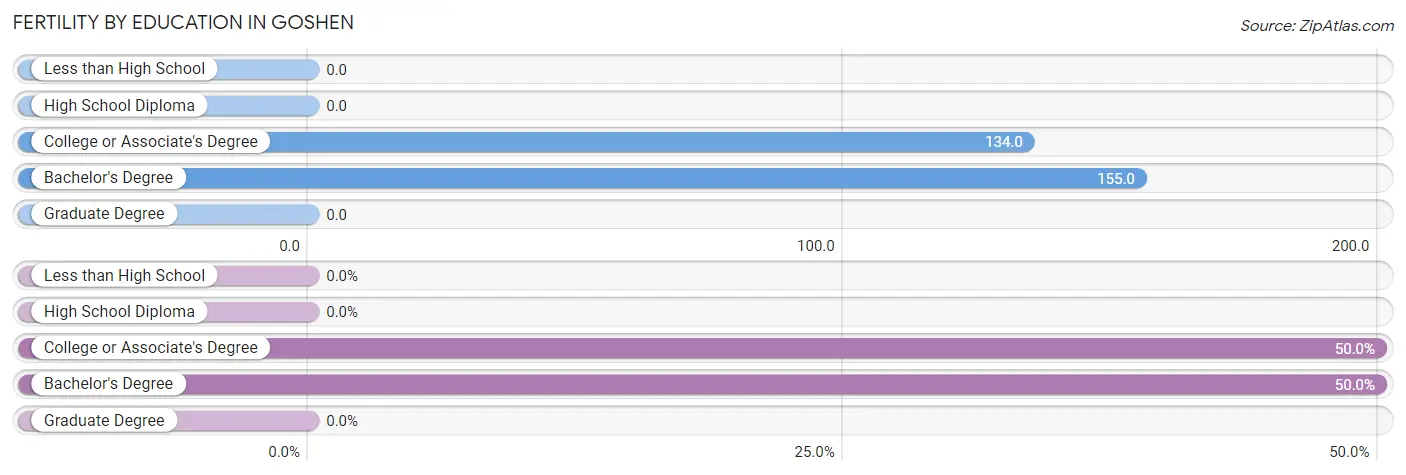
| Educational Attainment | Women with Births | Births / 1,000 Women |
| Less than High School | 0 (0.0%) | 0.0 |
| High School Diploma | 0 (0.0%) | 0.0 |
| College or Associate's Degree | 27 (50.0%) | 134.0 |
| Bachelor's Degree | 27 (50.0%) | 155.0 |
| Graduate Degree | 0 (0.0%) | 0.0 |
| Total | 54 (100.0%) | 35.0 |
Fertility by Education by Marriage Status in Goshen
50.0% of women with births in Goshen are unmarried. Women with the educational attainment of college or associate's degree are most likely to be married with 100.0% of them married at childbirth, while women with the educational attainment of bachelor's degree are least likely to be married with 100.0% of them unmarried at childbirth.
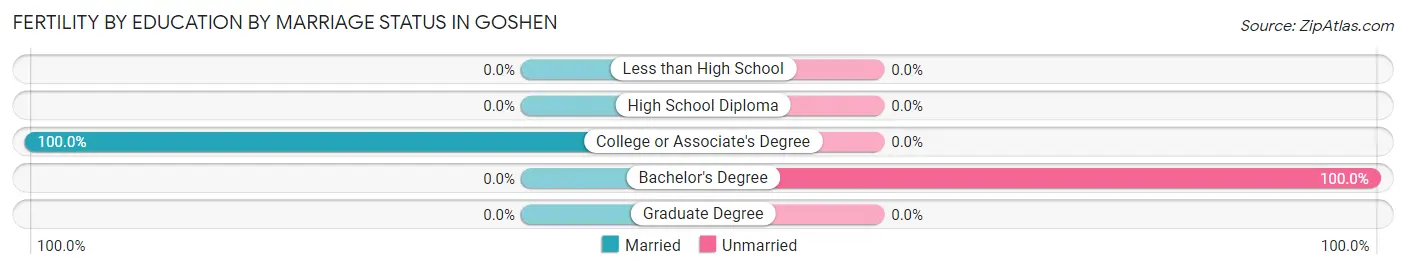
| Educational Attainment | Married | Unmarried |
| Less than High School | 0 (0.0%) | 0 (0.0%) |
| High School Diploma | 0 (0.0%) | 0 (0.0%) |
| College or Associate's Degree | 27 (100.0%) | 0 (0.0%) |
| Bachelor's Degree | 0 (0.0%) | 27 (100.0%) |
| Graduate Degree | 0 (0.0%) | 0 (0.0%) |
| Total | 27 (50.0%) | 27 (50.0%) |
Income in Goshen
Income Overview in Goshen
Per Capita Income in Goshen is $20,088, while median incomes of families and households are $60,116 and $62,216 respectively.
| Characteristic | Number | Measure |
| Per Capita Income | 4,974 | $20,088 |
| Median Family Income | 1,179 | $60,116 |
| Mean Family Income | 1,179 | $77,702 |
| Median Household Income | 1,280 | $62,216 |
| Mean Household Income | 1,280 | $82,782 |
| Income Deficit | 1,179 | $0 |
| Wage / Income Gap (%) | 4,974 | 21.71% |
| Wage / Income Gap ($) | 4,974 | 78.29¢ per $1 |
| Gini / Inequality Index | 4,974 | 0.42 |
Earnings by Sex in Goshen
Average Earnings in Goshen are $30,443, $35,467 for men and $27,766 for women, a difference of 21.7%.
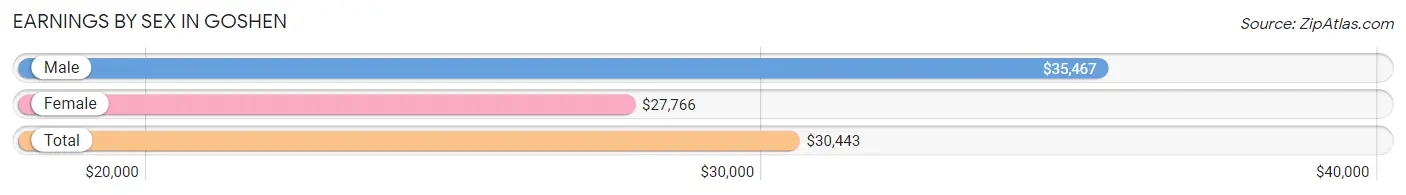
| Sex | Number | Average Earnings |
| Male | 1,292 (54.3%) | $35,467 |
| Female | 1,088 (45.7%) | $27,766 |
| Total | 2,380 (100.0%) | $30,443 |
Earnings by Sex by Income Bracket in Goshen
The most common earnings brackets in Goshen are $45,000 to $49,999 for men (217 | 16.8%) and $25,000 to $29,999 for women (193 | 17.7%).
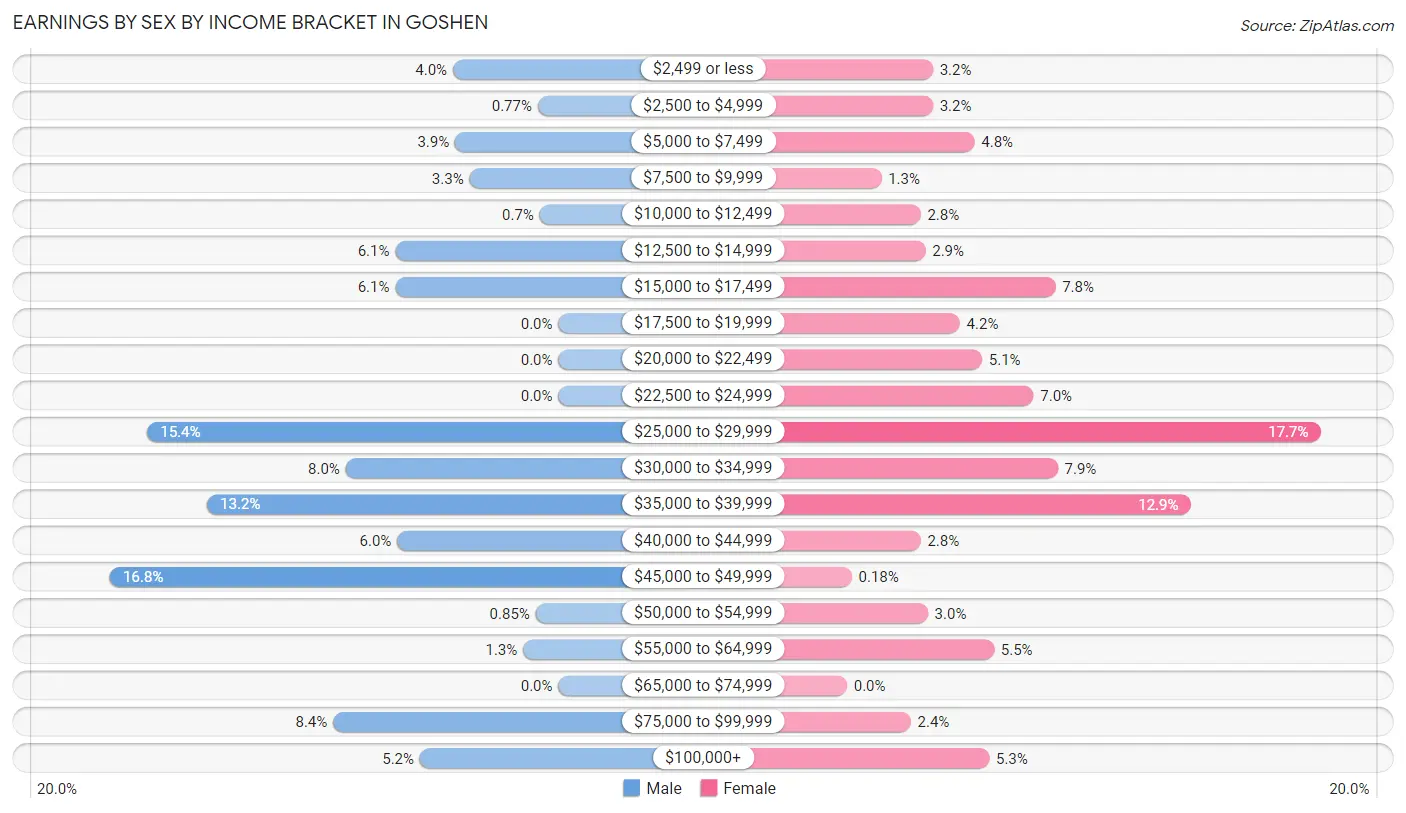
| Income | Male | Female |
| $2,499 or less | 51 (4.0%) | 35 (3.2%) |
| $2,500 to $4,999 | 10 (0.8%) | 35 (3.2%) |
| $5,000 to $7,499 | 50 (3.9%) | 52 (4.8%) |
| $7,500 to $9,999 | 43 (3.3%) | 14 (1.3%) |
| $10,000 to $12,499 | 9 (0.7%) | 30 (2.8%) |
| $12,500 to $14,999 | 79 (6.1%) | 32 (2.9%) |
| $15,000 to $17,499 | 79 (6.1%) | 85 (7.8%) |
| $17,500 to $19,999 | 0 (0.0%) | 46 (4.2%) |
| $20,000 to $22,499 | 0 (0.0%) | 55 (5.1%) |
| $22,500 to $24,999 | 0 (0.0%) | 76 (7.0%) |
| $25,000 to $29,999 | 199 (15.4%) | 193 (17.7%) |
| $30,000 to $34,999 | 103 (8.0%) | 86 (7.9%) |
| $35,000 to $39,999 | 170 (13.2%) | 140 (12.9%) |
| $40,000 to $44,999 | 78 (6.0%) | 30 (2.8%) |
| $45,000 to $49,999 | 217 (16.8%) | 2 (0.2%) |
| $50,000 to $54,999 | 11 (0.9%) | 33 (3.0%) |
| $55,000 to $64,999 | 17 (1.3%) | 60 (5.5%) |
| $65,000 to $74,999 | 0 (0.0%) | 0 (0.0%) |
| $75,000 to $99,999 | 109 (8.4%) | 26 (2.4%) |
| $100,000+ | 67 (5.2%) | 58 (5.3%) |
| Total | 1,292 (100.0%) | 1,088 (100.0%) |
Earnings by Sex by Educational Attainment in Goshen
Average earnings in Goshen are $35,113 for men and $26,708 for women, a difference of 23.9%. Men with an educational attainment of high school diploma enjoy the highest average annual earnings of $45,938, while those with college or associate's degree education earn the least with $31,875. Women with an educational attainment of graduate degree earn the most with the average annual earnings of $113,254, while those with less than high school education have the smallest earnings of $23,942.
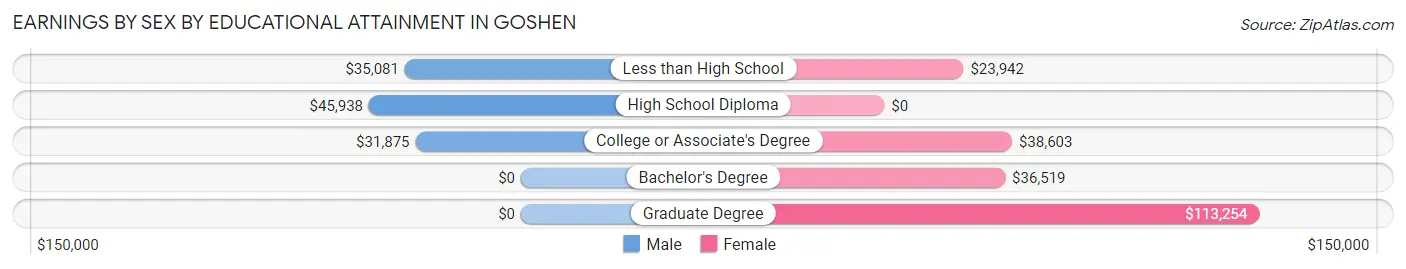
| Educational Attainment | Male Income | Female Income |
| Less than High School | $35,081 | $23,942 |
| High School Diploma | $45,938 | $0 |
| College or Associate's Degree | $31,875 | $38,603 |
| Bachelor's Degree | - | - |
| Graduate Degree | - | - |
| Total | $35,113 | $26,708 |
Family Income in Goshen
Family Income Brackets in Goshen
According to the Goshen family income data, there are 276 families falling into the $75,000 to $99,999 income range, which is the most common income bracket and makes up 23.4% of all families. Conversely, the $100,000 to $149,999 income bracket is the least frequent group with only 41 families (3.5%) belonging to this category.
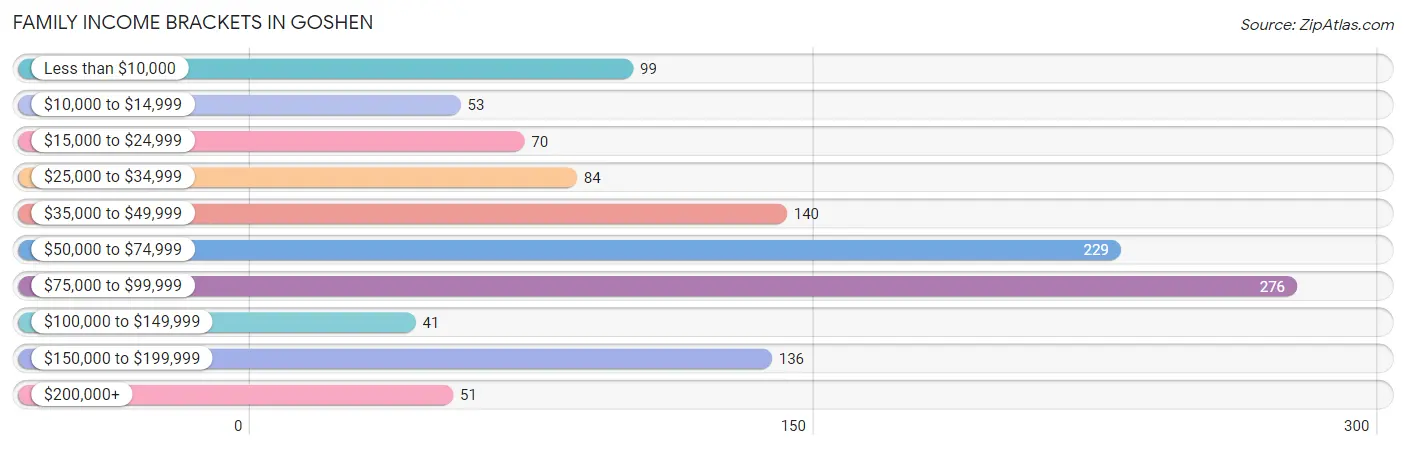
| Income Bracket | # Families | % Families |
| Less than $10,000 | 99 | 8.4% |
| $10,000 to $14,999 | 53 | 4.5% |
| $15,000 to $24,999 | 70 | 5.9% |
| $25,000 to $34,999 | 84 | 7.1% |
| $35,000 to $49,999 | 140 | 11.9% |
| $50,000 to $74,999 | 229 | 19.4% |
| $75,000 to $99,999 | 276 | 23.4% |
| $100,000 to $149,999 | 41 | 3.5% |
| $150,000 to $199,999 | 136 | 11.5% |
| $200,000+ | 51 | 4.3% |
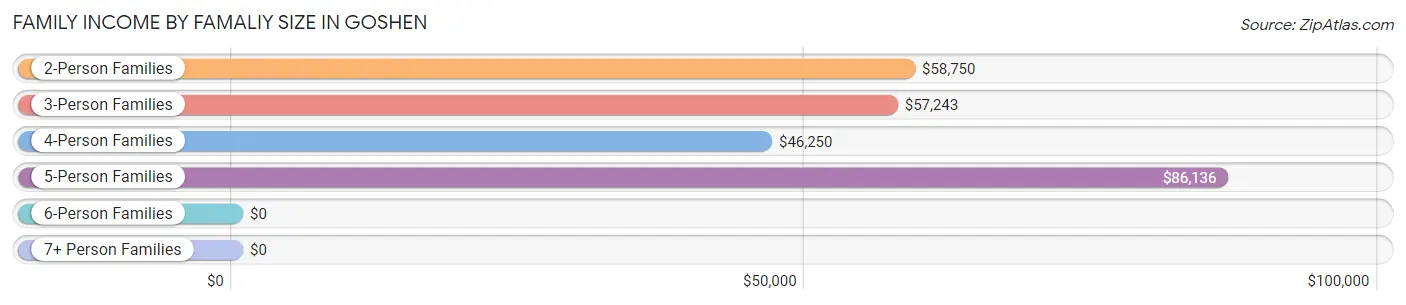
Family Income by Famaliy Size in Goshen
5-person families (74 | 6.3%) account for the highest median family income in Goshen with $86,136 per family, while 2-person families (255 | 21.6%) have the highest median income of $29,375 per family member.
| Income Bracket | # Families | Median Income |
| 2-Person Families | 255 (21.6%) | $58,750 |
| 3-Person Families | 279 (23.7%) | $57,243 |
| 4-Person Families | 298 (25.3%) | $46,250 |
| 5-Person Families | 74 (6.3%) | $86,136 |
| 6-Person Families | 86 (7.3%) | $0 |
| 7+ Person Families | 187 (15.9%) | $0 |
| Total | 1,179 (100.0%) | $60,116 |
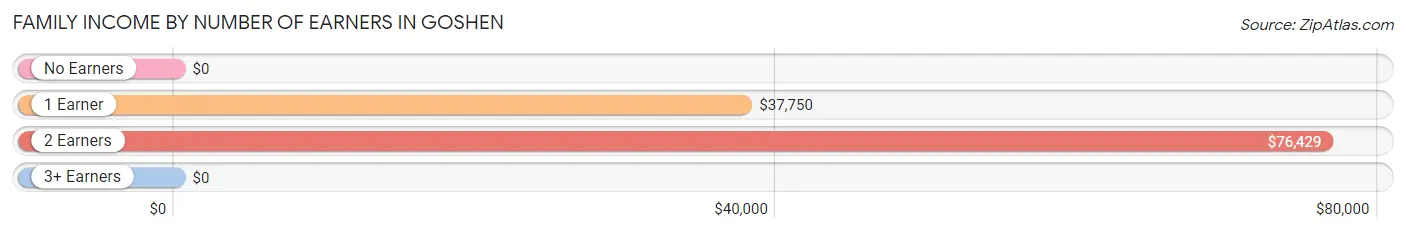
Family Income by Number of Earners in Goshen
| Number of Earners | # Families | Median Income |
| No Earners | 118 (10.0%) | $0 |
| 1 Earner | 372 (31.6%) | $37,750 |
| 2 Earners | 362 (30.7%) | $76,429 |
| 3+ Earners | 327 (27.7%) | $0 |
| Total | 1,179 (100.0%) | $60,116 |
Household Income in Goshen
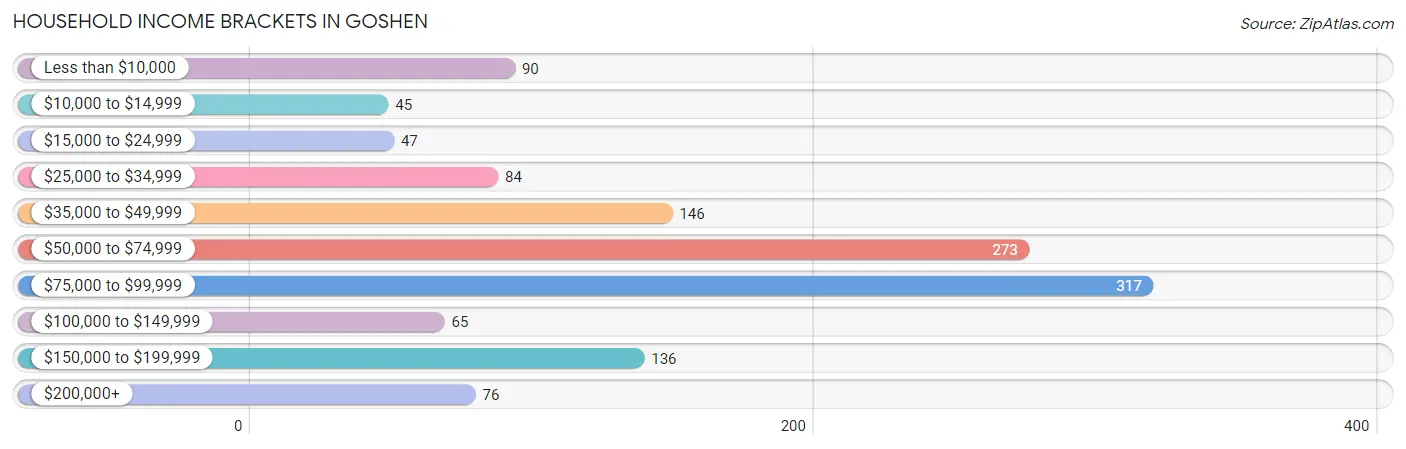
Household Income Brackets in Goshen
With 317 households falling in the category, the $75,000 to $99,999 income range is the most frequent in Goshen, accounting for 24.8% of all households. In contrast, only 45 households (3.5%) fall into the $10,000 to $14,999 income bracket, making it the least populous group.
| Income Bracket | # Households | % Households |
| Less than $10,000 | 90 | 7.0% |
| $10,000 to $14,999 | 45 | 3.5% |
| $15,000 to $24,999 | 47 | 3.7% |
| $25,000 to $34,999 | 84 | 6.6% |
| $35,000 to $49,999 | 146 | 11.4% |
| $50,000 to $74,999 | 273 | 21.3% |
| $75,000 to $99,999 | 317 | 24.8% |
| $100,000 to $149,999 | 65 | 5.1% |
| $150,000 to $199,999 | 136 | 10.6% |
| $200,000+ | 76 | 5.9% |
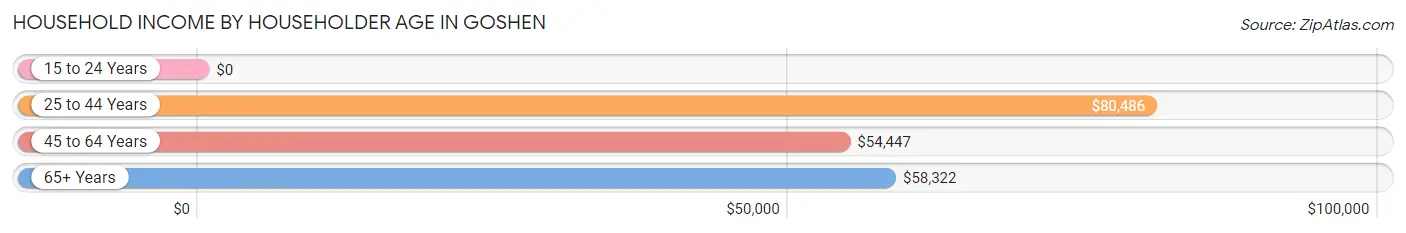
Household Income by Householder Age in Goshen
The median household income in Goshen is $62,216, with the highest median household income of $80,486 found in the 25 to 44 years age bracket for the primary householder. A total of 682 households (53.3%) fall into this category. Meanwhile, the 15 to 24 years age bracket for the primary householder has the lowest median household income of $0, with 60 households (4.7%) in this group.
| Income Bracket | # Households | Median Income |
| 15 to 24 Years | 60 (4.7%) | $0 |
| 25 to 44 Years | 682 (53.3%) | $80,486 |
| 45 to 64 Years | 423 (33.1%) | $54,447 |
| 65+ Years | 115 (9.0%) | $58,322 |
| Total | 1,280 (100.0%) | $62,216 |
Poverty in Goshen
Income Below Poverty by Sex and Age in Goshen
With 25.4% poverty level for males and 19.9% for females among the residents of Goshen, under 5 year old males and under 5 year old females are the most vulnerable to poverty, with 63 males (70.0%) and 123 females (59.4%) in their respective age groups living below the poverty level.
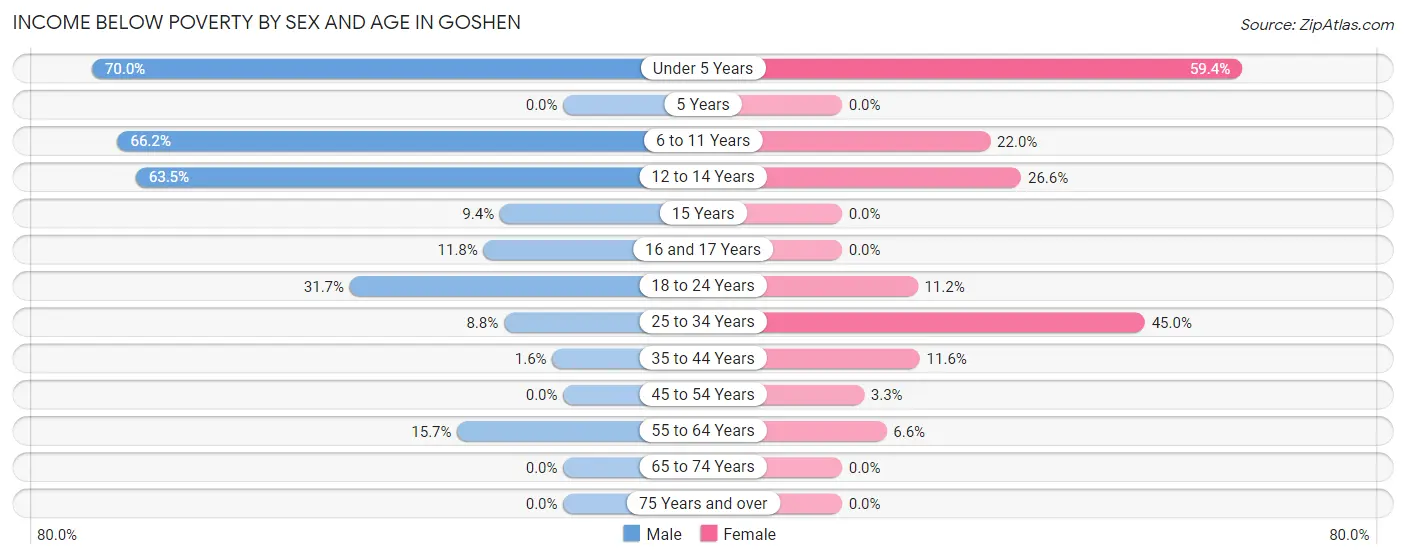
| Age Bracket | Male | Female |
| Under 5 Years | 63 (70.0%) | 123 (59.4%) |
| 5 Years | 0 (0.0%) | 0 (0.0%) |
| 6 to 11 Years | 139 (66.2%) | 65 (22.0%) |
| 12 to 14 Years | 212 (63.5%) | 41 (26.6%) |
| 15 Years | 8 (9.4%) | 0 (0.0%) |
| 16 and 17 Years | 9 (11.8%) | 0 (0.0%) |
| 18 to 24 Years | 84 (31.7%) | 28 (11.2%) |
| 25 to 34 Years | 19 (8.8%) | 188 (45.0%) |
| 35 to 44 Years | 6 (1.6%) | 57 (11.6%) |
| 45 to 54 Years | 0 (0.0%) | 8 (3.3%) |
| 55 to 64 Years | 48 (15.7%) | 10 (6.6%) |
| 65 to 74 Years | 0 (0.0%) | 0 (0.0%) |
| 75 Years and over | 0 (0.0%) | 0 (0.0%) |
| Total | 588 (25.4%) | 520 (19.9%) |
Income Above Poverty by Sex and Age in Goshen
According to the poverty statistics in Goshen, males aged 5 years and females aged 15 years are the age groups that are most secure financially, with 100.0% of males and 100.0% of females in these age groups living above the poverty line.
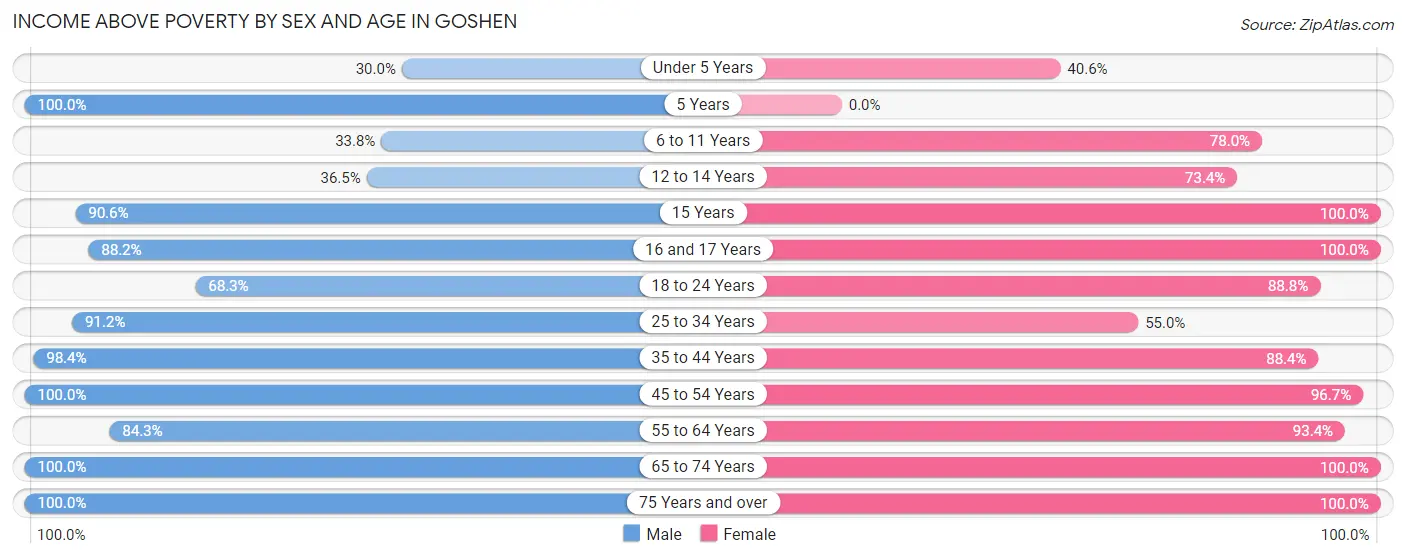
| Age Bracket | Male | Female |
| Under 5 Years | 27 (30.0%) | 84 (40.6%) |
| 5 Years | 18 (100.0%) | 0 (0.0%) |
| 6 to 11 Years | 71 (33.8%) | 230 (78.0%) |
| 12 to 14 Years | 122 (36.5%) | 113 (73.4%) |
| 15 Years | 77 (90.6%) | 21 (100.0%) |
| 16 and 17 Years | 67 (88.2%) | 156 (100.0%) |
| 18 to 24 Years | 181 (68.3%) | 221 (88.8%) |
| 25 to 34 Years | 197 (91.2%) | 230 (55.0%) |
| 35 to 44 Years | 364 (98.4%) | 436 (88.4%) |
| 45 to 54 Years | 252 (100.0%) | 237 (96.7%) |
| 55 to 64 Years | 257 (84.3%) | 141 (93.4%) |
| 65 to 74 Years | 61 (100.0%) | 145 (100.0%) |
| 75 Years and over | 32 (100.0%) | 78 (100.0%) |
| Total | 1,726 (74.6%) | 2,092 (80.1%) |
Income Below Poverty Among Married-Couple Families in Goshen
The poverty statistics for married-couple families in Goshen show that 2.5% or 14 of the total 560 families live below the poverty line. Families with 3 or 4 children have the highest poverty rate of 7.6%, comprising of 6 families. On the other hand, families with 1 or 2 children have the lowest poverty rate of 0.0%, which includes 0 families.
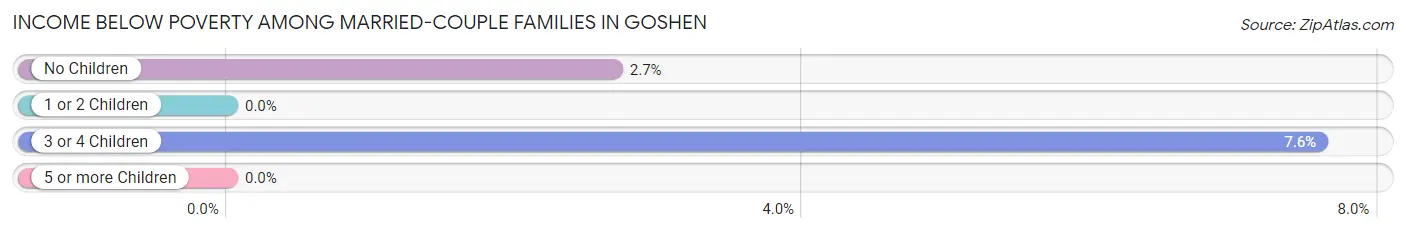
| Children | Above Poverty | Below Poverty |
| No Children | 291 (97.3%) | 8 (2.7%) |
| 1 or 2 Children | 182 (100.0%) | 0 (0.0%) |
| 3 or 4 Children | 73 (92.4%) | 6 (7.6%) |
| 5 or more Children | 0 (0.0%) | 0 (0.0%) |
| Total | 546 (97.5%) | 14 (2.5%) |
Income Below Poverty Among Single-Parent Households in Goshen
According to the poverty data in Goshen, 3.8% or 9 single-father households and 46.3% or 176 single-mother households are living below the poverty line. Among single-father households, those with 1 or 2 children have the highest poverty rate, with 9 households (3.8%) experiencing poverty. Likewise, among single-mother households, those with 3 or 4 children have the highest poverty rate, with 166 households (94.3%) falling below the poverty line.
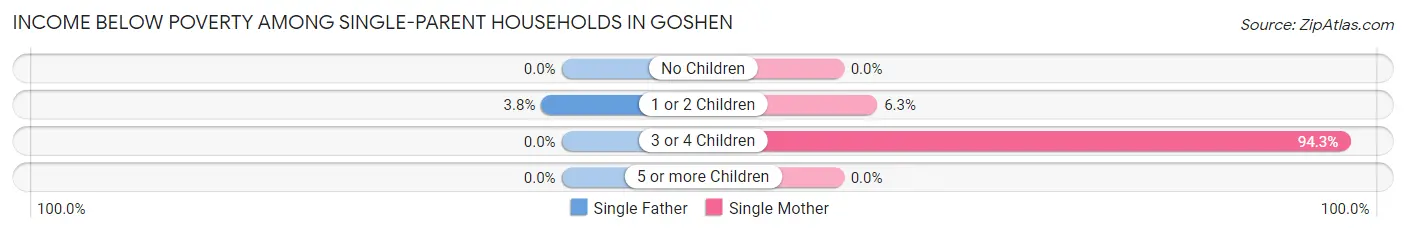
| Children | Single Father | Single Mother |
| No Children | 0 (0.0%) | 0 (0.0%) |
| 1 or 2 Children | 9 (3.8%) | 10 (6.2%) |
| 3 or 4 Children | 0 (0.0%) | 166 (94.3%) |
| 5 or more Children | 0 (0.0%) | 0 (0.0%) |
| Total | 9 (3.8%) | 176 (46.3%) |
Income Below Poverty Among Married-Couple vs Single-Parent Households in Goshen
The poverty data for Goshen shows that 14 of the married-couple family households (2.5%) and 185 of the single-parent households (29.9%) are living below the poverty level. Within the married-couple family households, those with 3 or 4 children have the highest poverty rate, with 6 households (7.6%) falling below the poverty line. Among the single-parent households, those with 3 or 4 children have the highest poverty rate, with 166 household (94.3%) living below poverty.
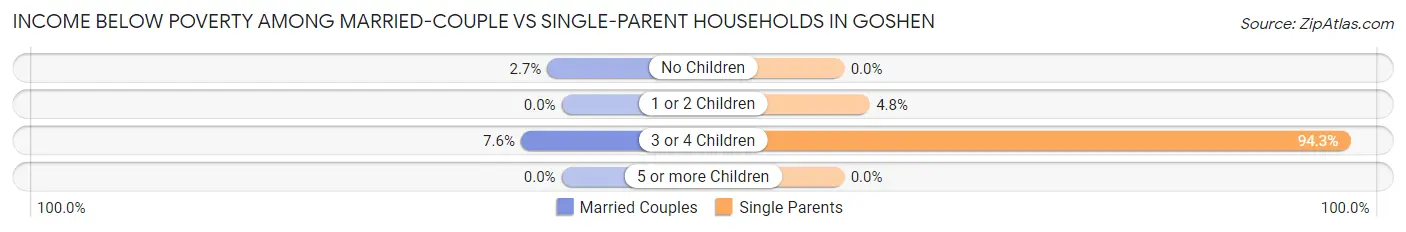
| Children | Married-Couple Families | Single-Parent Households |
| No Children | 8 (2.7%) | 0 (0.0%) |
| 1 or 2 Children | 0 (0.0%) | 19 (4.8%) |
| 3 or 4 Children | 6 (7.6%) | 166 (94.3%) |
| 5 or more Children | 0 (0.0%) | 0 (0.0%) |
| Total | 14 (2.5%) | 185 (29.9%) |
Employment Characteristics in Goshen
Employment by Class of Employer in Goshen
Among the 2,188 employed individuals in Goshen, private company employees (1,664 | 76.0%), local government employees (180 | 8.2%), and self-employed (not incorporated) (115 | 5.3%) make up the most common classes of employment.
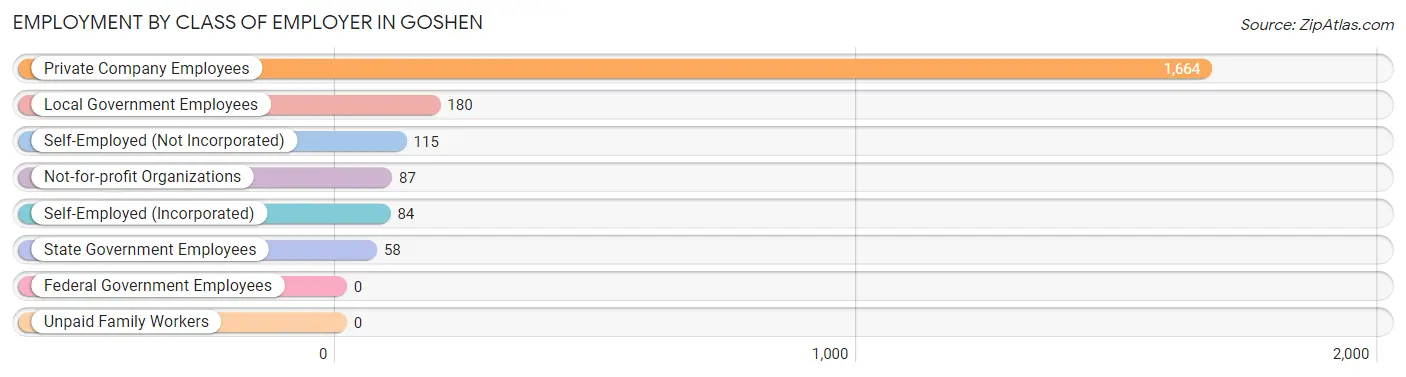
| Employer Class | # Employees | % Employees |
| Private Company Employees | 1,664 | 76.0% |
| Self-Employed (Incorporated) | 84 | 3.8% |
| Self-Employed (Not Incorporated) | 115 | 5.3% |
| Not-for-profit Organizations | 87 | 4.0% |
| Local Government Employees | 180 | 8.2% |
| State Government Employees | 58 | 2.6% |
| Federal Government Employees | 0 | 0.0% |
| Unpaid Family Workers | 0 | 0.0% |
| Total | 2,188 | 100.0% |
Employment Status by Age in Goshen
According to the labor force statistics for Goshen, out of the total population over 16 years of age (3,512), 67.0% or 2,353 individuals are in the labor force, with 4.4% or 104 of them unemployed. The age group with the highest labor force participation rate is 25 to 29 years, with 93.3% or 293 individuals in the labor force. Within the labor force, the 16 to 19 years age range has the highest percentage of unemployed individuals, with 80.8% or 59 of them being unemployed.
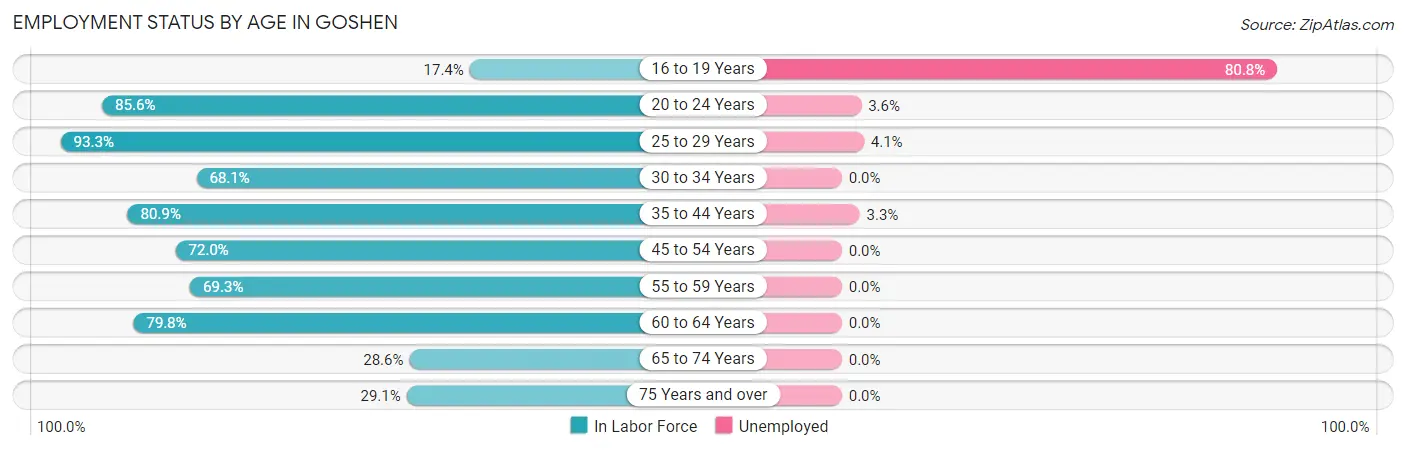
| Age Bracket | In Labor Force | Unemployed |
| 16 to 19 Years | 73 (17.4%) | 59 (80.8%) |
| 20 to 24 Years | 280 (85.6%) | 10 (3.6%) |
| 25 to 29 Years | 293 (93.3%) | 12 (4.1%) |
| 30 to 34 Years | 218 (68.1%) | 0 (0.0%) |
| 35 to 44 Years | 698 (80.9%) | 23 (3.3%) |
| 45 to 54 Years | 358 (72.0%) | 0 (0.0%) |
| 55 to 59 Years | 151 (69.3%) | 0 (0.0%) |
| 60 to 64 Years | 190 (79.8%) | 0 (0.0%) |
| 65 to 74 Years | 59 (28.6%) | 0 (0.0%) |
| 75 Years and over | 32 (29.1%) | 0 (0.0%) |
| Total | 2,353 (67.0%) | 104 (4.4%) |
Employment Status by Educational Attainment in Goshen
According to labor force statistics for Goshen, 77.9% of individuals (1,909) out of the total population between 25 and 64 years of age (2,450) are in the labor force, with 1.8% or 34 of them being unemployed. The group with the highest labor force participation rate are those with the educational attainment of bachelor's degree or higher, with 88.7% or 212 individuals in the labor force. Within the labor force, individuals with high school diploma education have the highest percentage of unemployment, with 4.7% or 23 of them being unemployed.
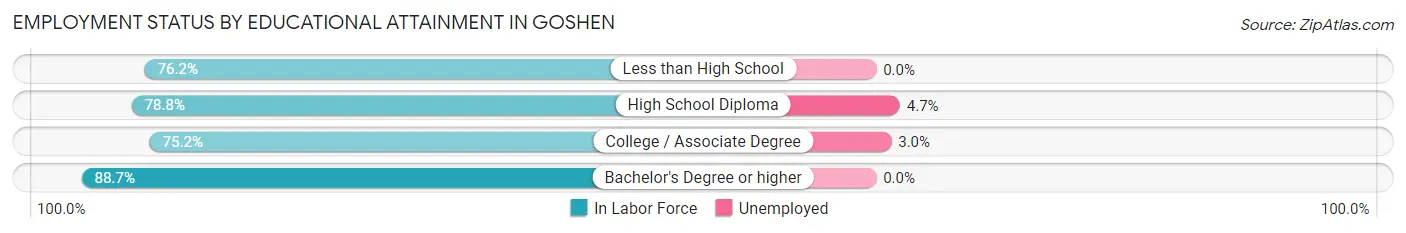
| Educational Attainment | In Labor Force | Unemployed |
| Less than High School | 802 (76.2%) | 0 (0.0%) |
| High School Diploma | 488 (78.8%) | 29 (4.7%) |
| College / Associate Degree | 406 (75.2%) | 16 (3.0%) |
| Bachelor's Degree or higher | 212 (88.7%) | 0 (0.0%) |
| Total | 1,909 (77.9%) | 44 (1.8%) |
Employment Occupations by Sex in Goshen
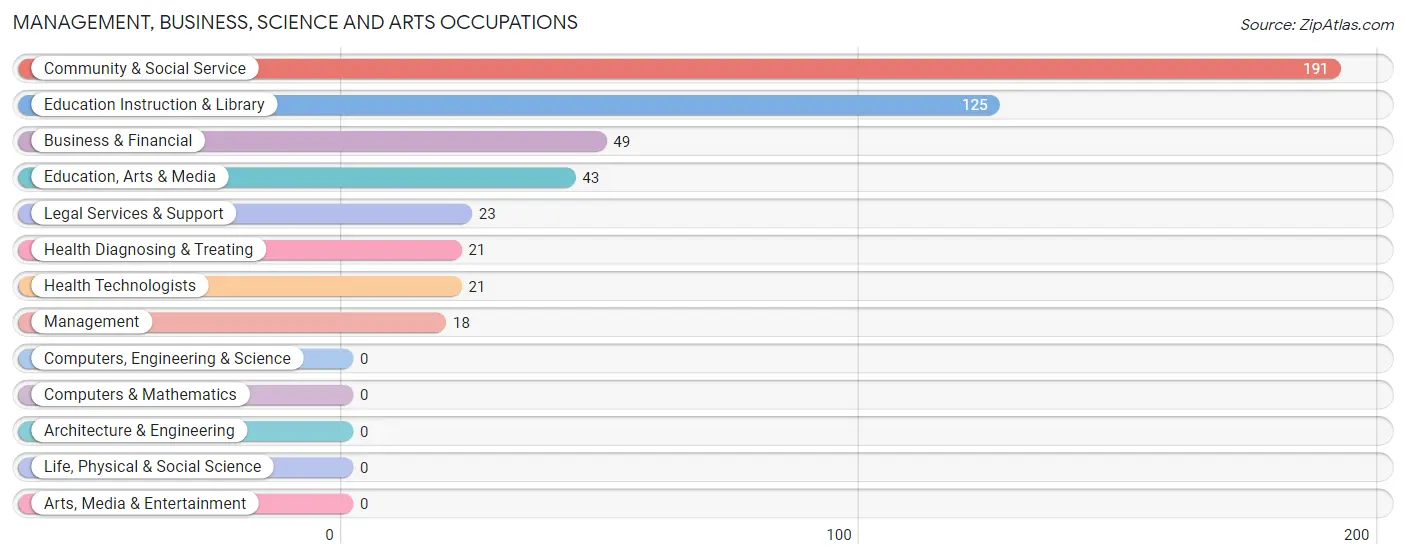
Management, Business, Science and Arts Occupations
The most common Management, Business, Science and Arts occupations in Goshen are Community & Social Service (191 | 8.5%), Education Instruction & Library (125 | 5.6%), Business & Financial (49 | 2.2%), Education, Arts & Media (43 | 1.9%), and Legal Services & Support (23 | 1.0%).
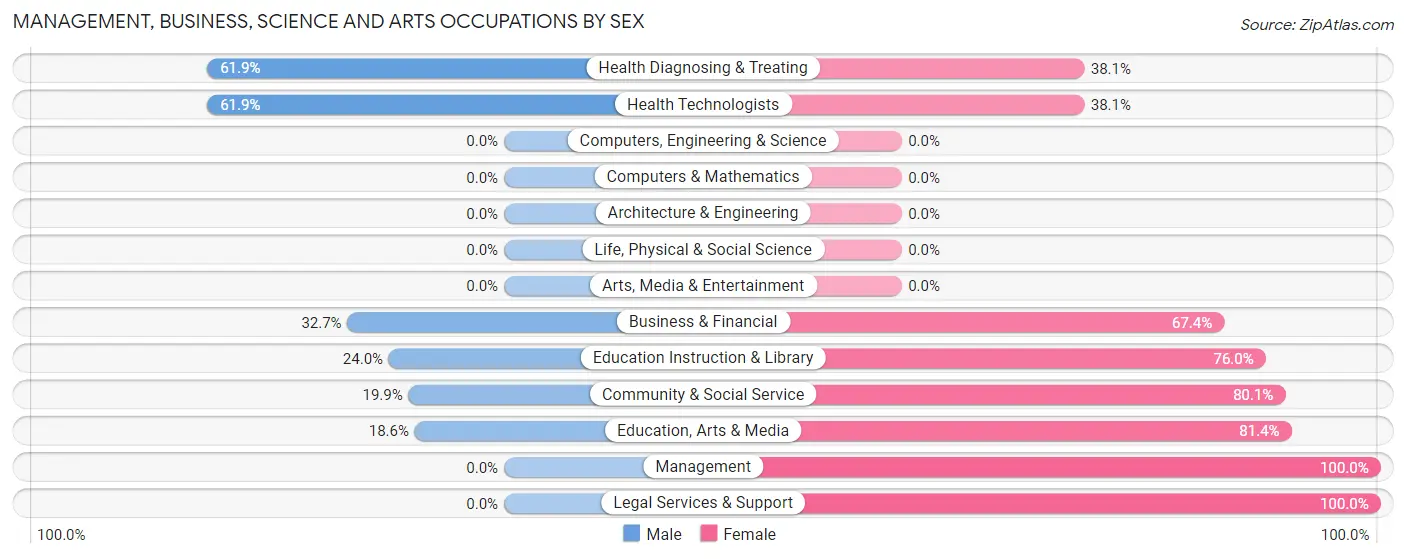
Management, Business, Science and Arts Occupations by Sex
Within the Management, Business, Science and Arts occupations in Goshen, the most male-oriented occupations are Health Diagnosing & Treating (61.9%), Health Technologists (61.9%), and Business & Financial (32.7%), while the most female-oriented occupations are Management (100.0%), Legal Services & Support (100.0%), and Education, Arts & Media (81.4%).
| Occupation | Male | Female |
| Management | 0 (0.0%) | 18 (100.0%) |
| Business & Financial | 16 (32.7%) | 33 (67.3%) |
| Computers, Engineering & Science | 0 (0.0%) | 0 (0.0%) |
| Computers & Mathematics | 0 (0.0%) | 0 (0.0%) |
| Architecture & Engineering | 0 (0.0%) | 0 (0.0%) |
| Life, Physical & Social Science | 0 (0.0%) | 0 (0.0%) |
| Community & Social Service | 38 (19.9%) | 153 (80.1%) |
| Education, Arts & Media | 8 (18.6%) | 35 (81.4%) |
| Legal Services & Support | 0 (0.0%) | 23 (100.0%) |
| Education Instruction & Library | 30 (24.0%) | 95 (76.0%) |
| Arts, Media & Entertainment | 0 (0.0%) | 0 (0.0%) |
| Health Diagnosing & Treating | 13 (61.9%) | 8 (38.1%) |
| Health Technologists | 13 (61.9%) | 8 (38.1%) |
| Total (Category) | 67 (24.0%) | 212 (76.0%) |
| Total (Overall) | 1,248 (55.5%) | 1,000 (44.5%) |
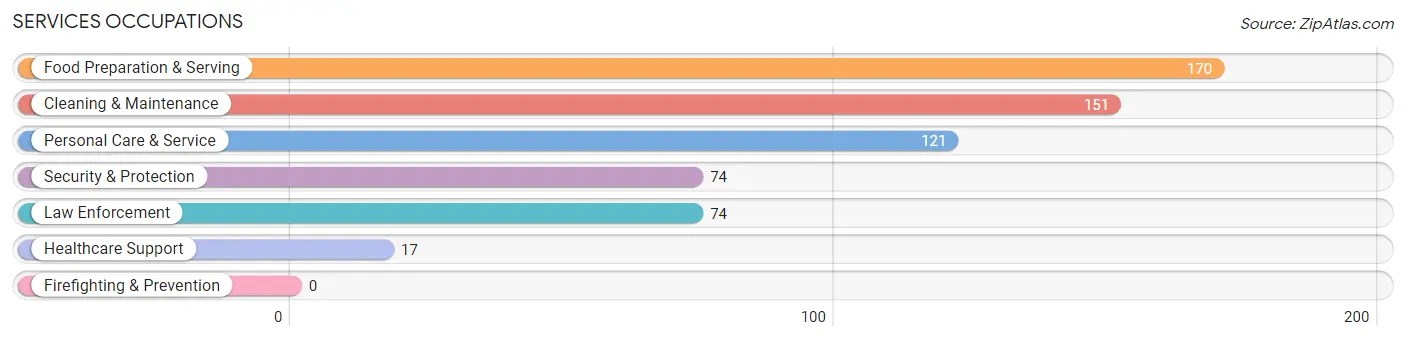
Services Occupations
The most common Services occupations in Goshen are Food Preparation & Serving (170 | 7.6%), Cleaning & Maintenance (151 | 6.7%), Personal Care & Service (121 | 5.4%), Security & Protection (74 | 3.3%), and Law Enforcement (74 | 3.3%).
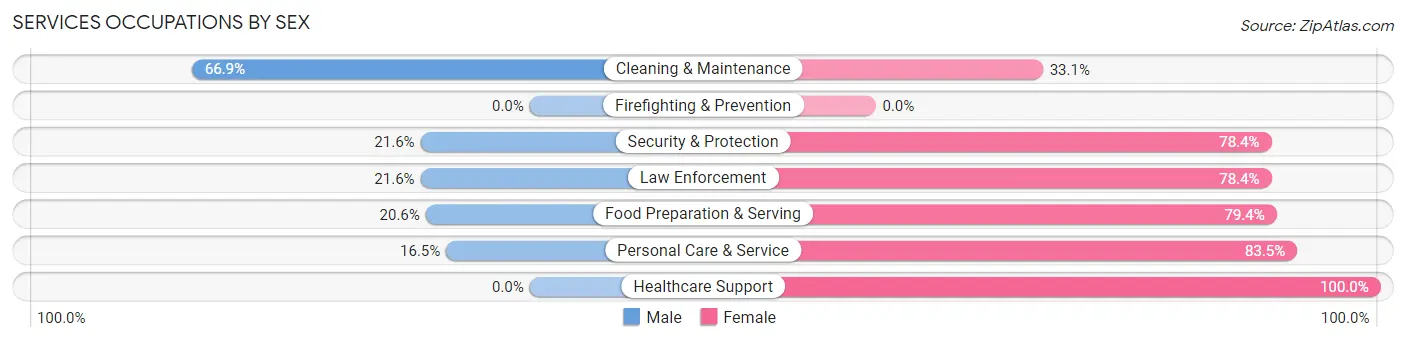
Services Occupations by Sex
Within the Services occupations in Goshen, the most male-oriented occupations are Cleaning & Maintenance (66.9%), Security & Protection (21.6%), and Law Enforcement (21.6%), while the most female-oriented occupations are Healthcare Support (100.0%), Personal Care & Service (83.5%), and Food Preparation & Serving (79.4%).
| Occupation | Male | Female |
| Healthcare Support | 0 (0.0%) | 17 (100.0%) |
| Security & Protection | 16 (21.6%) | 58 (78.4%) |
| Firefighting & Prevention | 0 (0.0%) | 0 (0.0%) |
| Law Enforcement | 16 (21.6%) | 58 (78.4%) |
| Food Preparation & Serving | 35 (20.6%) | 135 (79.4%) |
| Cleaning & Maintenance | 101 (66.9%) | 50 (33.1%) |
| Personal Care & Service | 20 (16.5%) | 101 (83.5%) |
| Total (Category) | 172 (32.3%) | 361 (67.7%) |
| Total (Overall) | 1,248 (55.5%) | 1,000 (44.5%) |
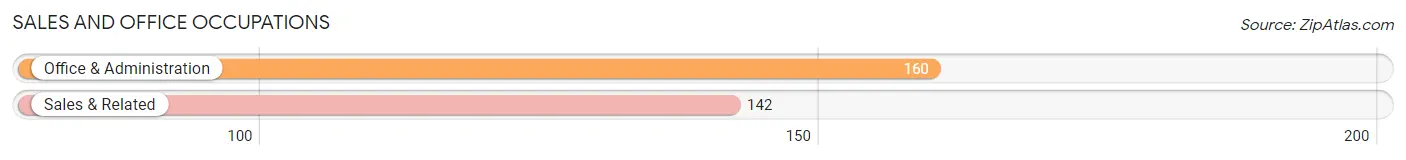
Sales and Office Occupations
The most common Sales and Office occupations in Goshen are Office & Administration (160 | 7.1%), and Sales & Related (142 | 6.3%).
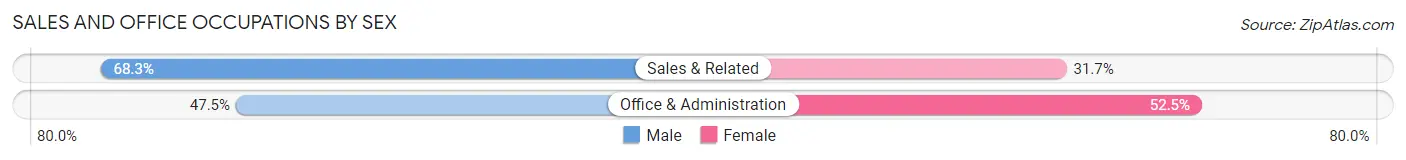
Sales and Office Occupations by Sex
| Occupation | Male | Female |
| Sales & Related | 97 (68.3%) | 45 (31.7%) |
| Office & Administration | 76 (47.5%) | 84 (52.5%) |
| Total (Category) | 173 (57.3%) | 129 (42.7%) |
| Total (Overall) | 1,248 (55.5%) | 1,000 (44.5%) |
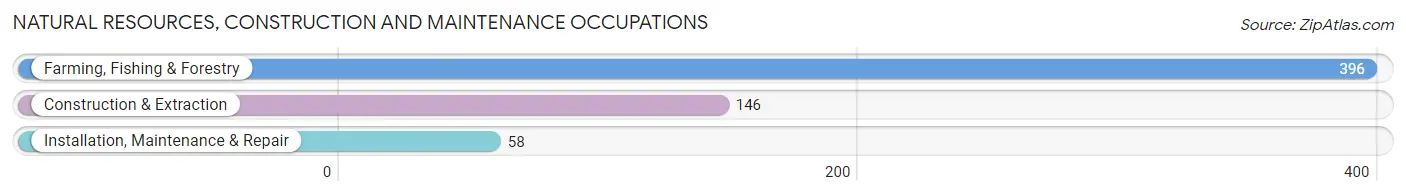
Natural Resources, Construction and Maintenance Occupations
The most common Natural Resources, Construction and Maintenance occupations in Goshen are Farming, Fishing & Forestry (396 | 17.6%), Construction & Extraction (146 | 6.5%), and Installation, Maintenance & Repair (58 | 2.6%).
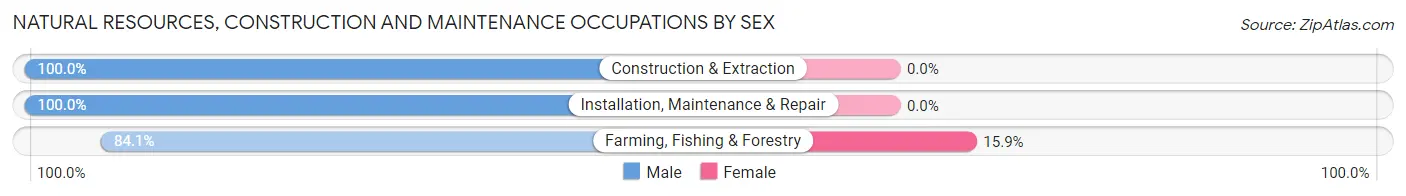
Natural Resources, Construction and Maintenance Occupations by Sex
| Occupation | Male | Female |
| Farming, Fishing & Forestry | 333 (84.1%) | 63 (15.9%) |
| Construction & Extraction | 146 (100.0%) | 0 (0.0%) |
| Installation, Maintenance & Repair | 58 (100.0%) | 0 (0.0%) |
| Total (Category) | 537 (89.5%) | 63 (10.5%) |
| Total (Overall) | 1,248 (55.5%) | 1,000 (44.5%) |
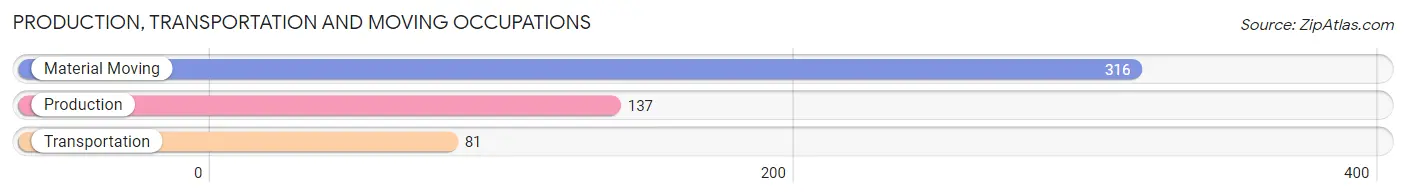
Production, Transportation and Moving Occupations
The most common Production, Transportation and Moving occupations in Goshen are Material Moving (316 | 14.1%), Production (137 | 6.1%), and Transportation (81 | 3.6%).
Production, Transportation and Moving Occupations by Sex
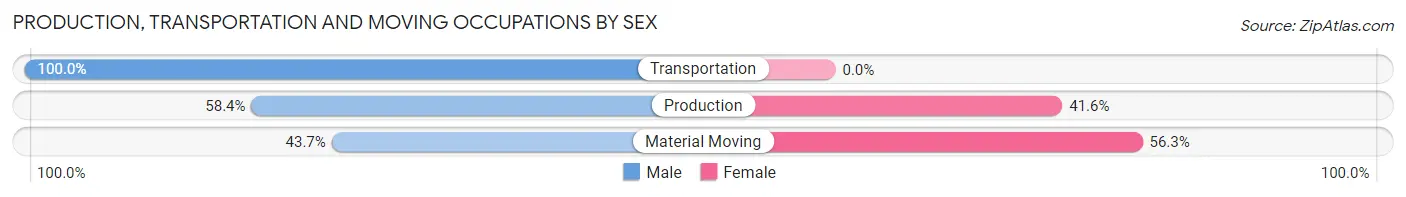
| Occupation | Male | Female |
| Production | 80 (58.4%) | 57 (41.6%) |
| Transportation | 81 (100.0%) | 0 (0.0%) |
| Material Moving | 138 (43.7%) | 178 (56.3%) |
| Total (Category) | 299 (56.0%) | 235 (44.0%) |
| Total (Overall) | 1,248 (55.5%) | 1,000 (44.5%) |
Employment Industries by Sex in Goshen
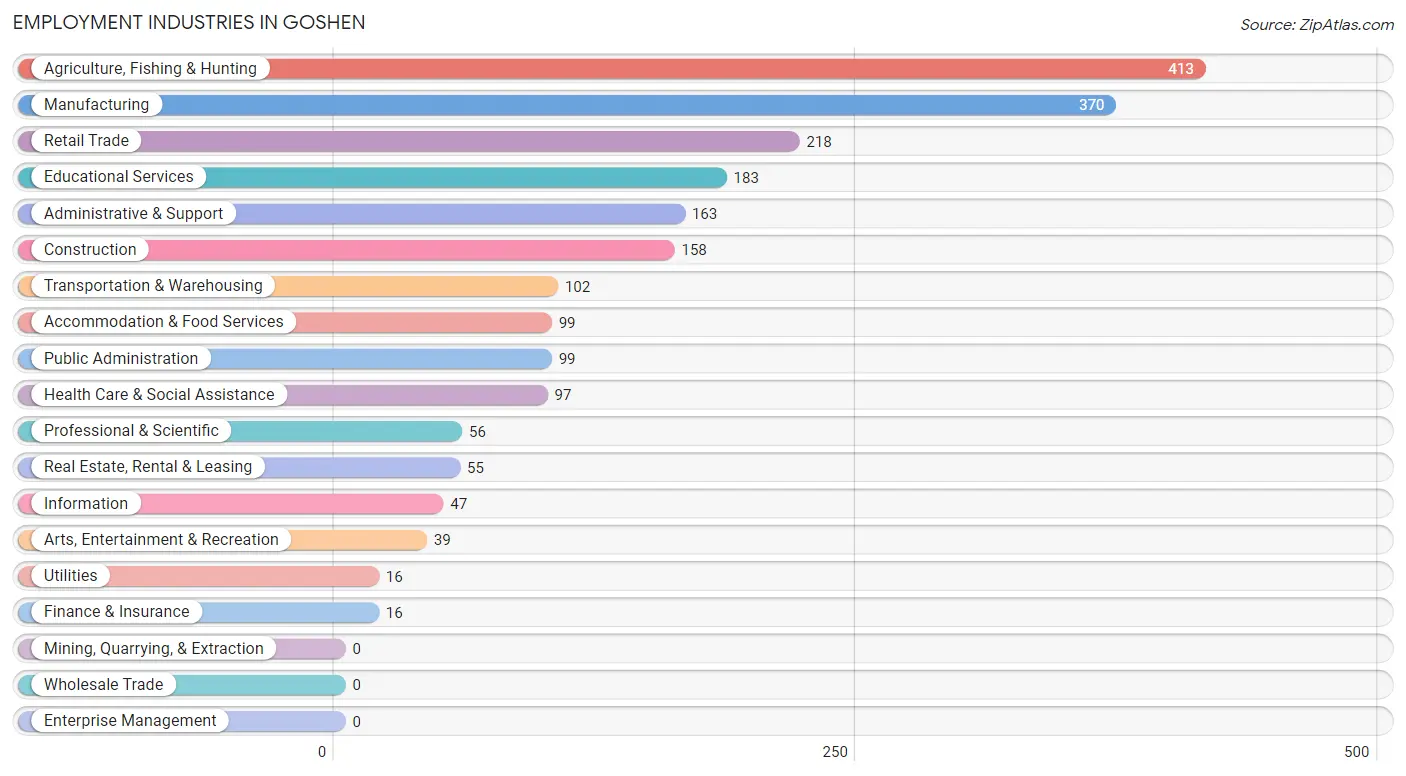
Employment Industries in Goshen
The major employment industries in Goshen include Agriculture, Fishing & Hunting (413 | 18.4%), Manufacturing (370 | 16.5%), Retail Trade (218 | 9.7%), Educational Services (183 | 8.1%), and Administrative & Support (163 | 7.2%).
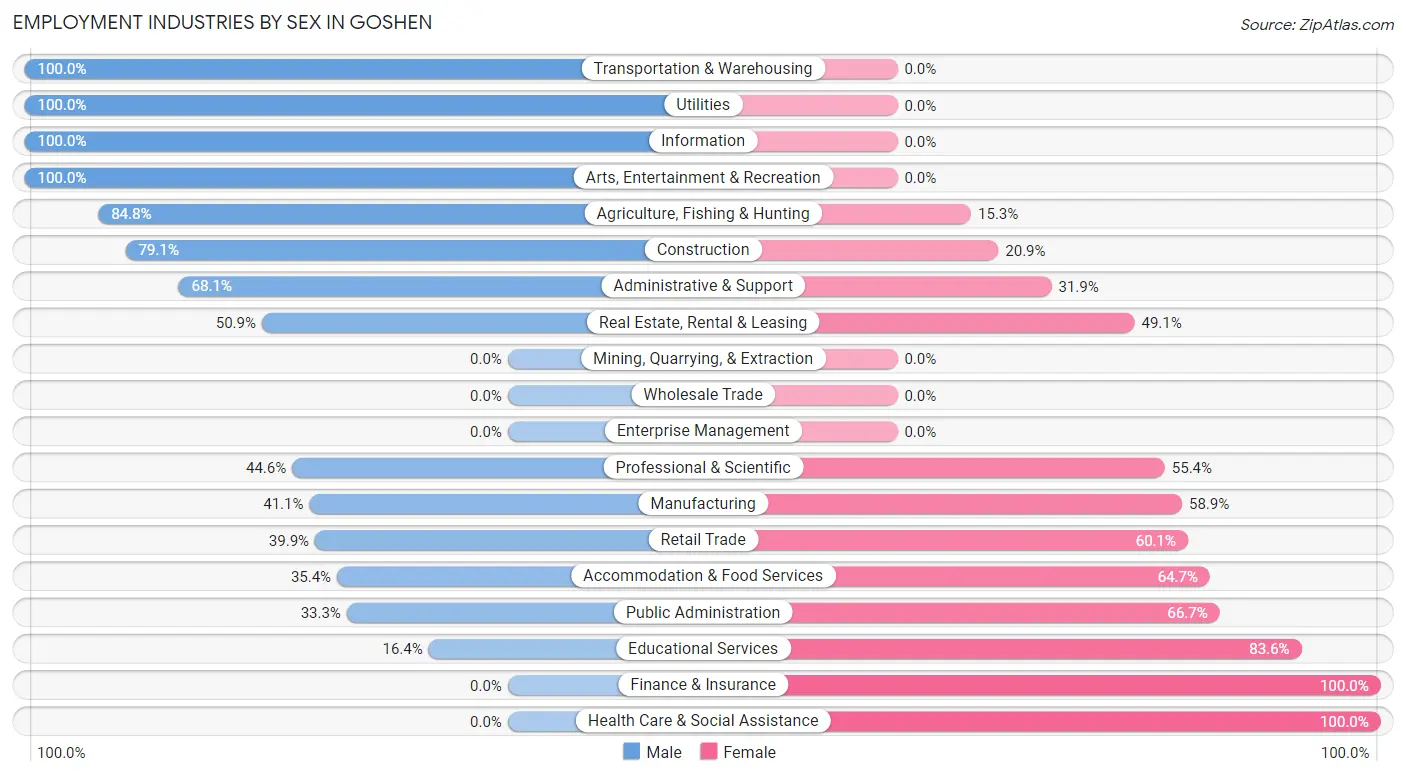
Employment Industries by Sex in Goshen
The Goshen industries that see more men than women are Transportation & Warehousing (100.0%), Utilities (100.0%), and Information (100.0%), whereas the industries that tend to have a higher number of women are Finance & Insurance (100.0%), Health Care & Social Assistance (100.0%), and Educational Services (83.6%).
| Industry | Male | Female |
| Agriculture, Fishing & Hunting | 350 (84.8%) | 63 (15.2%) |
| Mining, Quarrying, & Extraction | 0 (0.0%) | 0 (0.0%) |
| Construction | 125 (79.1%) | 33 (20.9%) |
| Manufacturing | 152 (41.1%) | 218 (58.9%) |
| Wholesale Trade | 0 (0.0%) | 0 (0.0%) |
| Retail Trade | 87 (39.9%) | 131 (60.1%) |
| Transportation & Warehousing | 102 (100.0%) | 0 (0.0%) |
| Utilities | 16 (100.0%) | 0 (0.0%) |
| Information | 47 (100.0%) | 0 (0.0%) |
| Finance & Insurance | 0 (0.0%) | 16 (100.0%) |
| Real Estate, Rental & Leasing | 28 (50.9%) | 27 (49.1%) |
| Professional & Scientific | 25 (44.6%) | 31 (55.4%) |
| Enterprise Management | 0 (0.0%) | 0 (0.0%) |
| Administrative & Support | 111 (68.1%) | 52 (31.9%) |
| Educational Services | 30 (16.4%) | 153 (83.6%) |
| Health Care & Social Assistance | 0 (0.0%) | 97 (100.0%) |
| Arts, Entertainment & Recreation | 39 (100.0%) | 0 (0.0%) |
| Accommodation & Food Services | 35 (35.3%) | 64 (64.6%) |
| Public Administration | 33 (33.3%) | 66 (66.7%) |
| Total | 1,248 (55.5%) | 1,000 (44.5%) |
Education in Goshen
School Enrollment in Goshen
The most common levels of schooling among the 1,640 students in Goshen are middle school (499 | 30.4%), high school (469 | 28.6%), and elementary school (354 | 21.6%).
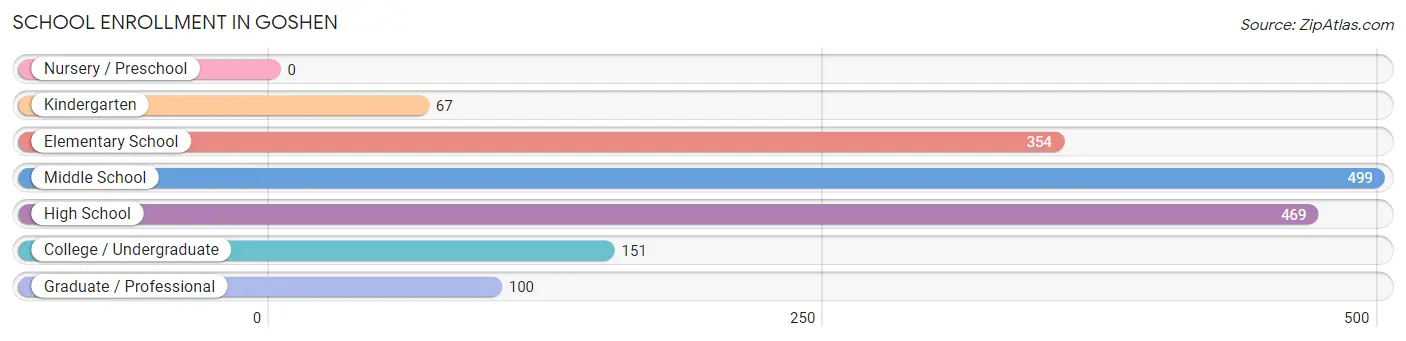
| School Level | # Students | % Students |
| Nursery / Preschool | 0 | 0.0% |
| Kindergarten | 67 | 4.1% |
| Elementary School | 354 | 21.6% |
| Middle School | 499 | 30.4% |
| High School | 469 | 28.6% |
| College / Undergraduate | 151 | 9.2% |
| Graduate / Professional | 100 | 6.1% |
| Total | 1,640 | 100.0% |
School Enrollment by Age by Funding Source in Goshen
Out of a total of 1,640 students who are enrolled in schools in Goshen, 118 (7.2%) attend a private institution, while the remaining 1,522 (92.8%) are enrolled in public schools. The age group of 35 years and over has the highest likelihood of being enrolled in private schools, with 27 (47.4% in the age bracket) enrolled. Conversely, the age group of 15 to 17 year olds has the lowest likelihood of being enrolled in a private school, with 303 (100.0% in the age bracket) attending a public institution.
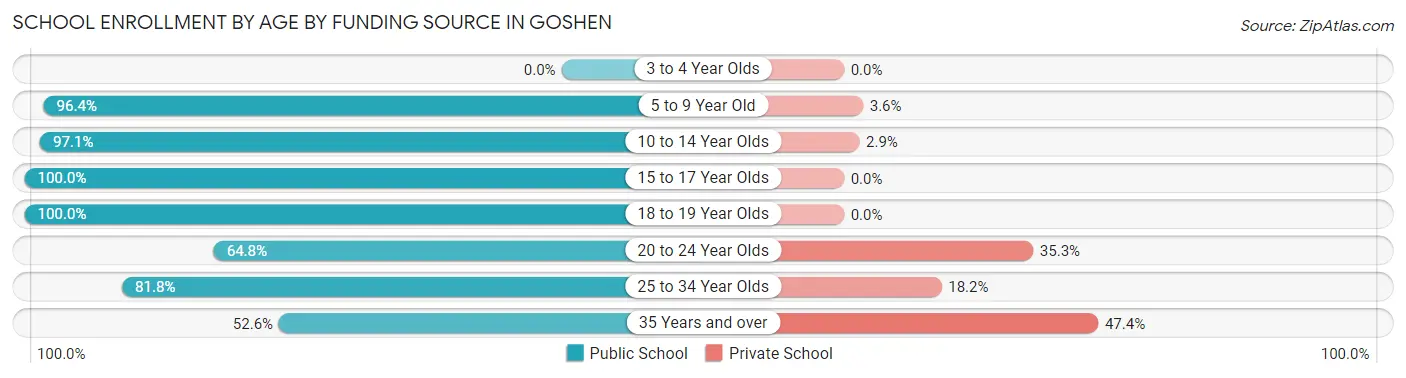
| Age Bracket | Public School | Private School |
| 3 to 4 Year Olds | 0 (0.0%) | 0 (0.0%) |
| 5 to 9 Year Old | 406 (96.4%) | 15 (3.6%) |
| 10 to 14 Year Olds | 573 (97.1%) | 17 (2.9%) |
| 15 to 17 Year Olds | 303 (100.0%) | 0 (0.0%) |
| 18 to 19 Year Olds | 75 (100.0%) | 0 (0.0%) |
| 20 to 24 Year Olds | 90 (64.7%) | 49 (35.2%) |
| 25 to 34 Year Olds | 45 (81.8%) | 10 (18.2%) |
| 35 Years and over | 30 (52.6%) | 27 (47.4%) |
| Total | 1,522 (92.8%) | 118 (7.2%) |
Educational Attainment by Field of Study in Goshen
Liberal arts & history (78 | 30.9%), business (75 | 29.8%), bio, nature & agricultural (58 | 23.0%), physical & health sciences (14 | 5.6%), and psychology (13 | 5.2%) are the most common fields of study among 252 individuals in Goshen who have obtained a bachelor's degree or higher.
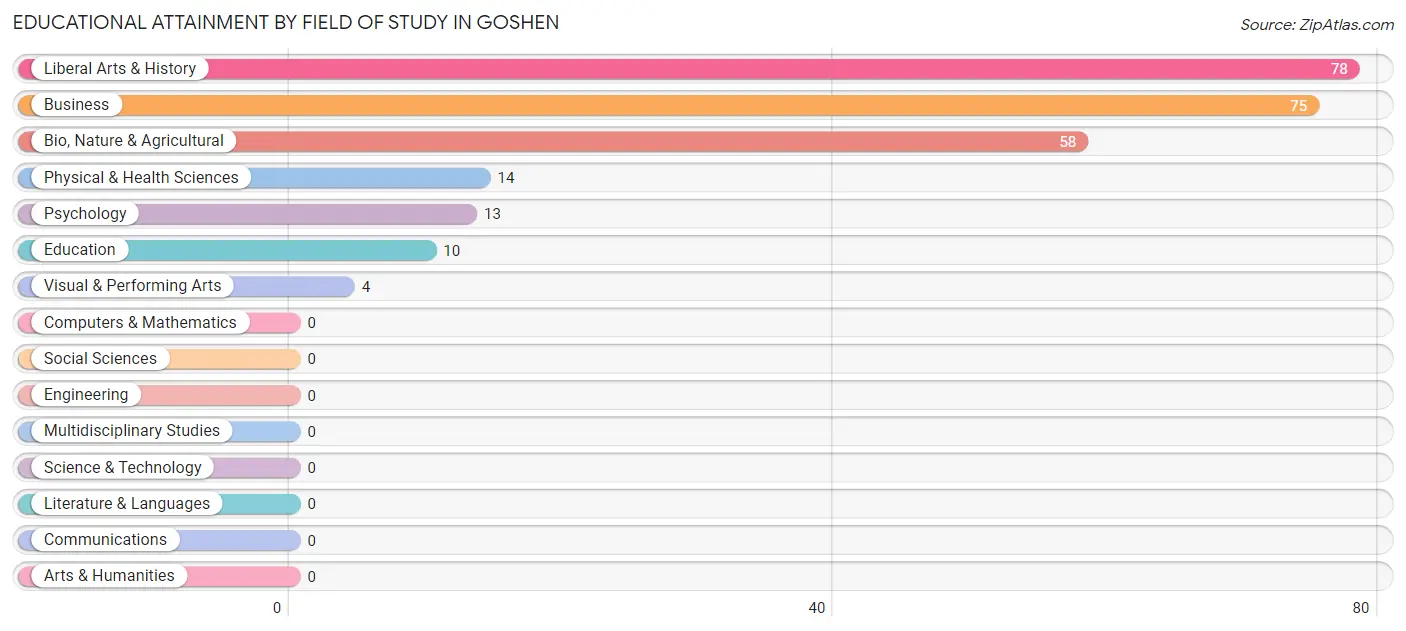
| Field of Study | # Graduates | % Graduates |
| Computers & Mathematics | 0 | 0.0% |
| Bio, Nature & Agricultural | 58 | 23.0% |
| Physical & Health Sciences | 14 | 5.6% |
| Psychology | 13 | 5.2% |
| Social Sciences | 0 | 0.0% |
| Engineering | 0 | 0.0% |
| Multidisciplinary Studies | 0 | 0.0% |
| Science & Technology | 0 | 0.0% |
| Business | 75 | 29.8% |
| Education | 10 | 4.0% |
| Literature & Languages | 0 | 0.0% |
| Liberal Arts & History | 78 | 30.9% |
| Visual & Performing Arts | 4 | 1.6% |
| Communications | 0 | 0.0% |
| Arts & Humanities | 0 | 0.0% |
| Total | 252 | 100.0% |
Transportation & Commute in Goshen
Vehicle Availability by Sex in Goshen
The most prevalent vehicle ownership categories in Goshen are males with 3 vehicles (386, accounting for 31.9%) and females with 3 vehicles (297, making up 39.5%).
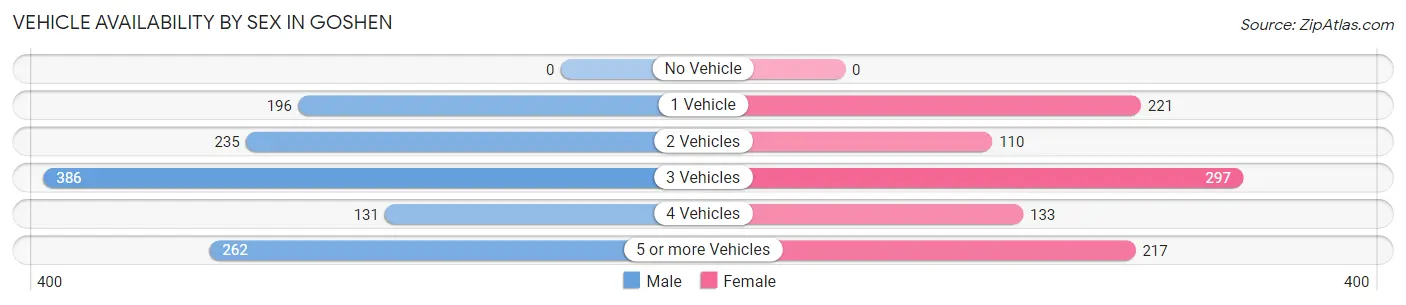
| Vehicles Available | Male | Female |
| No Vehicle | 0 (0.0%) | 0 (0.0%) |
| 1 Vehicle | 196 (16.2%) | 221 (22.6%) |
| 2 Vehicles | 235 (19.4%) | 110 (11.3%) |
| 3 Vehicles | 386 (31.9%) | 297 (30.4%) |
| 4 Vehicles | 131 (10.8%) | 133 (13.6%) |
| 5 or more Vehicles | 262 (21.6%) | 217 (22.2%) |
| Total | 1,210 (100.0%) | 978 (100.0%) |
Commute Time in Goshen
The most frequently occuring commute durations in Goshen are 20 to 24 minutes (611 commuters, 29.9%), 15 to 19 minutes (488 commuters, 23.9%), and 10 to 14 minutes (268 commuters, 13.1%).
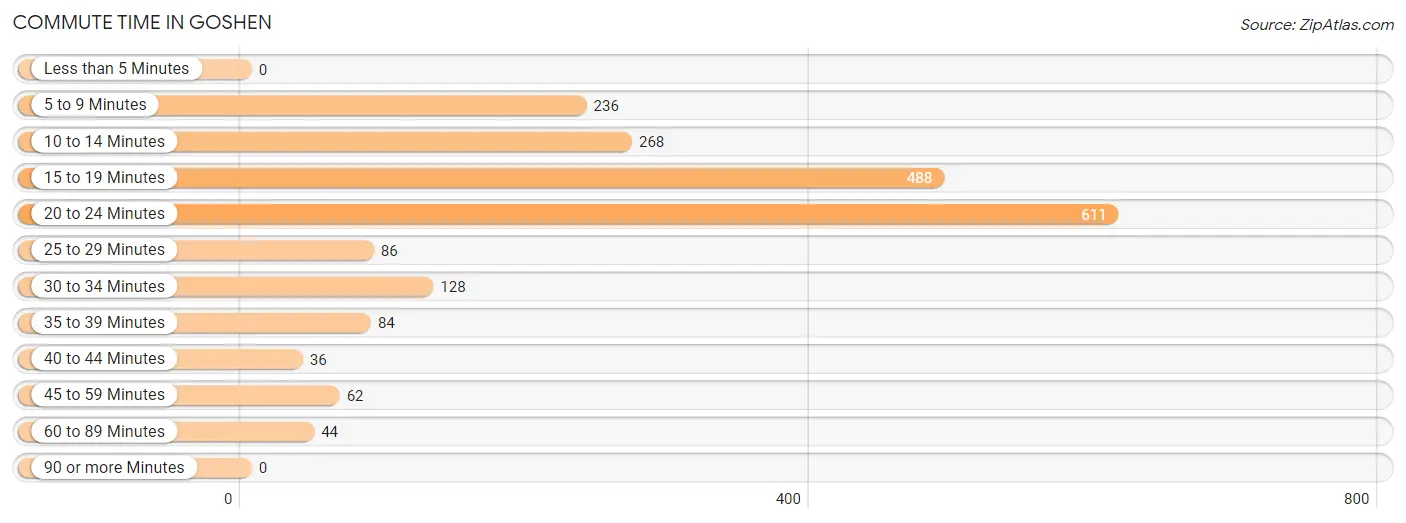
| Commute Time | # Commuters | % Commuters |
| Less than 5 Minutes | 0 | 0.0% |
| 5 to 9 Minutes | 236 | 11.6% |
| 10 to 14 Minutes | 268 | 13.1% |
| 15 to 19 Minutes | 488 | 23.9% |
| 20 to 24 Minutes | 611 | 29.9% |
| 25 to 29 Minutes | 86 | 4.2% |
| 30 to 34 Minutes | 128 | 6.3% |
| 35 to 39 Minutes | 84 | 4.1% |
| 40 to 44 Minutes | 36 | 1.8% |
| 45 to 59 Minutes | 62 | 3.0% |
| 60 to 89 Minutes | 44 | 2.1% |
| 90 or more Minutes | 0 | 0.0% |
Commute Time by Sex in Goshen
The most common commute times in Goshen are 20 to 24 minutes (334 commuters, 28.7%) for males and 20 to 24 minutes (277 commuters, 31.4%) for females.
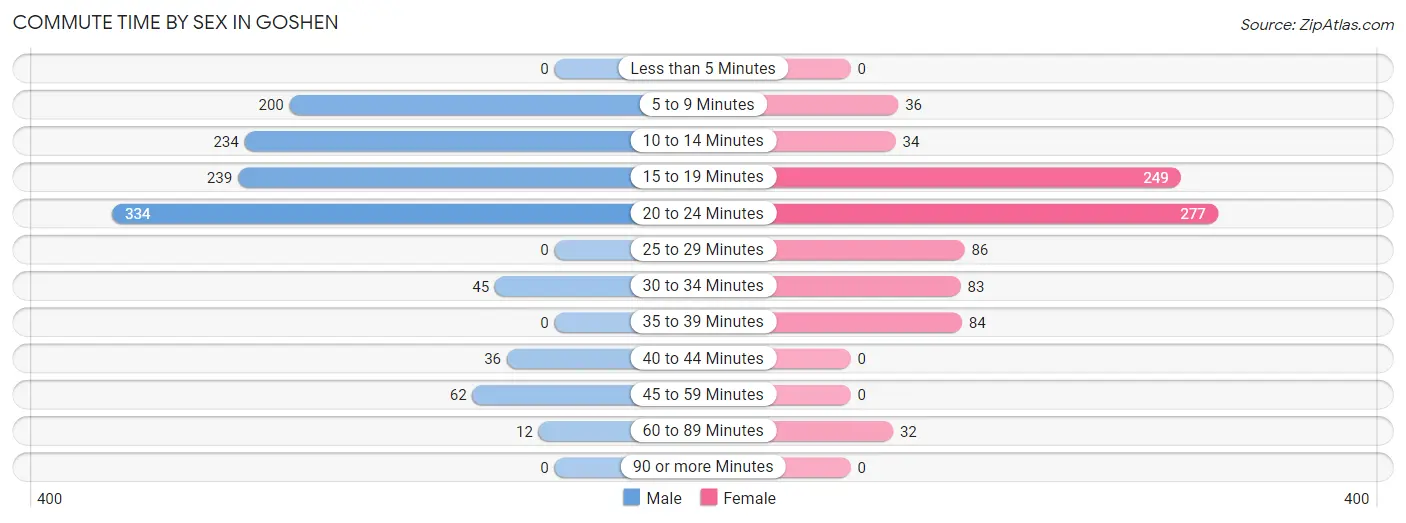
| Commute Time | Male | Female |
| Less than 5 Minutes | 0 (0.0%) | 0 (0.0%) |
| 5 to 9 Minutes | 200 (17.2%) | 36 (4.1%) |
| 10 to 14 Minutes | 234 (20.1%) | 34 (3.9%) |
| 15 to 19 Minutes | 239 (20.6%) | 249 (28.3%) |
| 20 to 24 Minutes | 334 (28.7%) | 277 (31.4%) |
| 25 to 29 Minutes | 0 (0.0%) | 86 (9.8%) |
| 30 to 34 Minutes | 45 (3.9%) | 83 (9.4%) |
| 35 to 39 Minutes | 0 (0.0%) | 84 (9.5%) |
| 40 to 44 Minutes | 36 (3.1%) | 0 (0.0%) |
| 45 to 59 Minutes | 62 (5.3%) | 0 (0.0%) |
| 60 to 89 Minutes | 12 (1.0%) | 32 (3.6%) |
| 90 or more Minutes | 0 (0.0%) | 0 (0.0%) |
Time of Departure to Work by Sex in Goshen
The most frequent times of departure to work in Goshen are 6:00 AM to 6:29 AM (315, 27.1%) for males and 7:00 AM to 7:29 AM (180, 20.4%) for females.
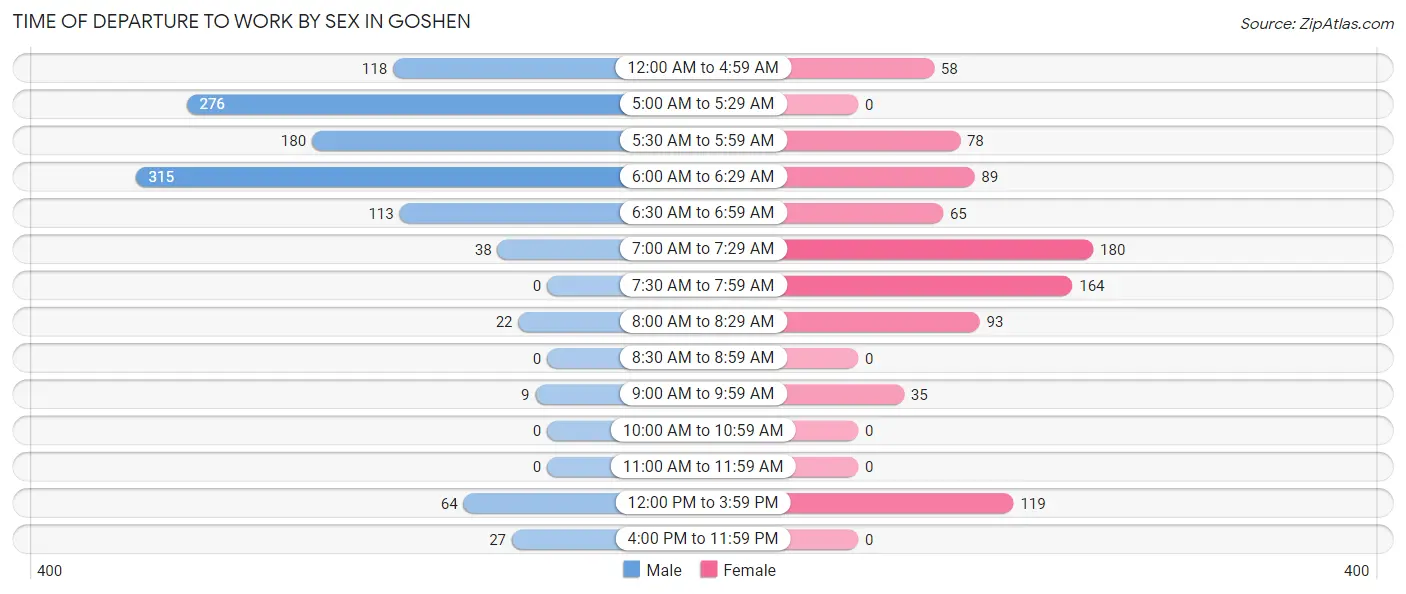
| Time of Departure | Male | Female |
| 12:00 AM to 4:59 AM | 118 (10.2%) | 58 (6.6%) |
| 5:00 AM to 5:29 AM | 276 (23.7%) | 0 (0.0%) |
| 5:30 AM to 5:59 AM | 180 (15.5%) | 78 (8.8%) |
| 6:00 AM to 6:29 AM | 315 (27.1%) | 89 (10.1%) |
| 6:30 AM to 6:59 AM | 113 (9.7%) | 65 (7.4%) |
| 7:00 AM to 7:29 AM | 38 (3.3%) | 180 (20.4%) |
| 7:30 AM to 7:59 AM | 0 (0.0%) | 164 (18.6%) |
| 8:00 AM to 8:29 AM | 22 (1.9%) | 93 (10.6%) |
| 8:30 AM to 8:59 AM | 0 (0.0%) | 0 (0.0%) |
| 9:00 AM to 9:59 AM | 9 (0.8%) | 35 (4.0%) |
| 10:00 AM to 10:59 AM | 0 (0.0%) | 0 (0.0%) |
| 11:00 AM to 11:59 AM | 0 (0.0%) | 0 (0.0%) |
| 12:00 PM to 3:59 PM | 64 (5.5%) | 119 (13.5%) |
| 4:00 PM to 11:59 PM | 27 (2.3%) | 0 (0.0%) |
| Total | 1,162 (100.0%) | 881 (100.0%) |
Housing Occupancy in Goshen
Occupancy by Ownership in Goshen
Of the total 1,280 dwellings in Goshen, owner-occupied units account for 684 (53.4%), while renter-occupied units make up 596 (46.6%).
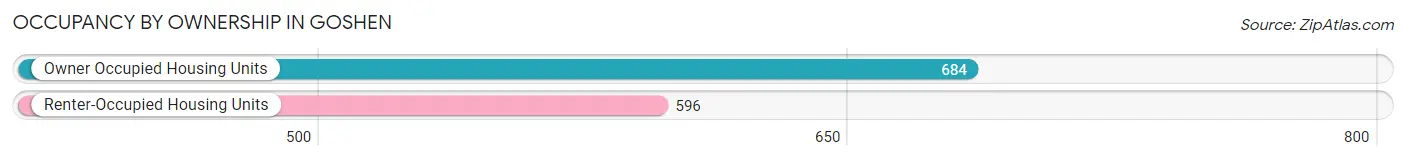
| Occupancy | # Housing Units | % Housing Units |
| Owner Occupied Housing Units | 684 | 53.4% |
| Renter-Occupied Housing Units | 596 | 46.6% |
| Total Occupied Housing Units | 1,280 | 100.0% |
Occupancy by Household Size in Goshen
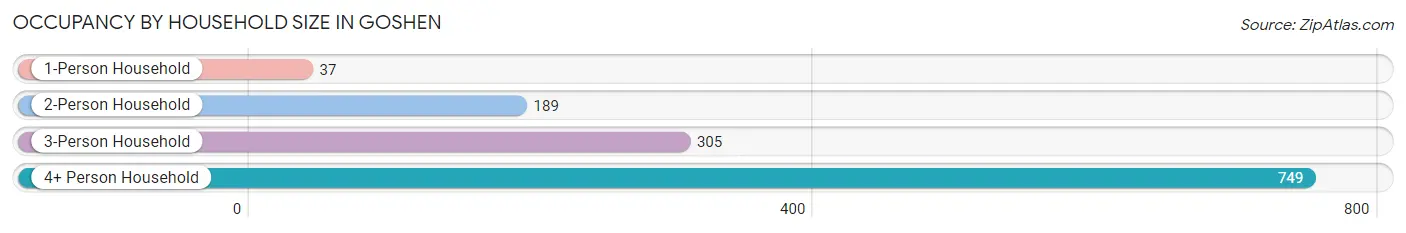
| Household Size | # Housing Units | % Housing Units |
| 1-Person Household | 37 | 2.9% |
| 2-Person Household | 189 | 14.8% |
| 3-Person Household | 305 | 23.8% |
| 4+ Person Household | 749 | 58.5% |
| Total Housing Units | 1,280 | 100.0% |
Occupancy by Ownership by Household Size in Goshen
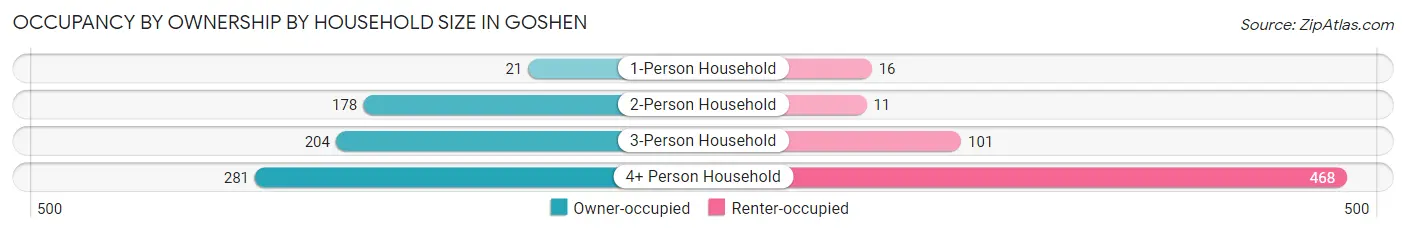
| Household Size | Owner-occupied | Renter-occupied |
| 1-Person Household | 21 (56.8%) | 16 (43.2%) |
| 2-Person Household | 178 (94.2%) | 11 (5.8%) |
| 3-Person Household | 204 (66.9%) | 101 (33.1%) |
| 4+ Person Household | 281 (37.5%) | 468 (62.5%) |
| Total Housing Units | 684 (53.4%) | 596 (46.6%) |
Occupancy by Educational Attainment in Goshen
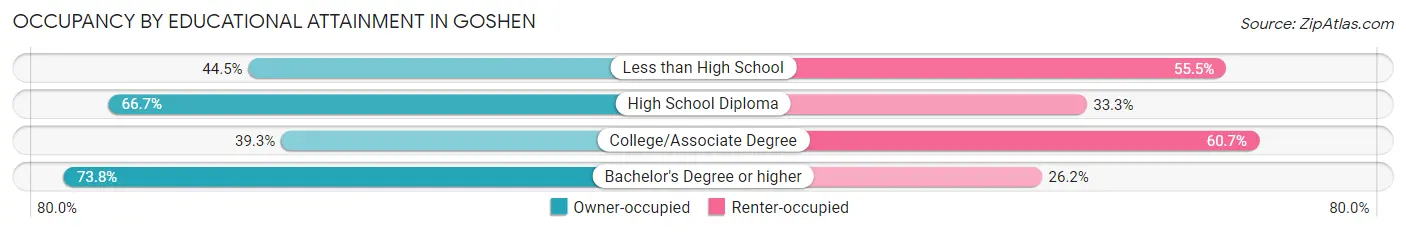
| Household Size | Owner-occupied | Renter-occupied |
| Less than High School | 247 (44.5%) | 308 (55.5%) |
| High School Diploma | 252 (66.7%) | 126 (33.3%) |
| College/Associate Degree | 81 (39.3%) | 125 (60.7%) |
| Bachelor's Degree or higher | 104 (73.8%) | 37 (26.2%) |
Occupancy by Age of Householder in Goshen
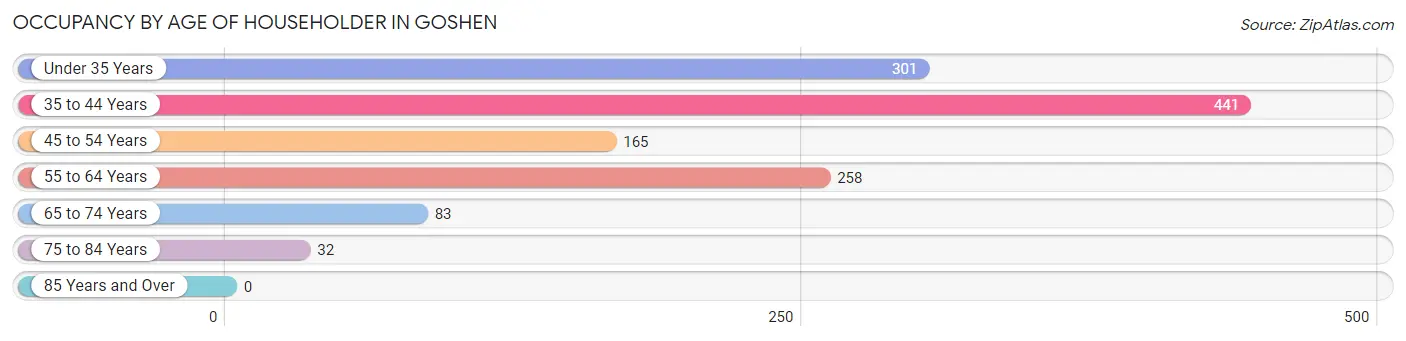
| Age Bracket | # Households | % Households |
| Under 35 Years | 301 | 23.5% |
| 35 to 44 Years | 441 | 34.4% |
| 45 to 54 Years | 165 | 12.9% |
| 55 to 64 Years | 258 | 20.2% |
| 65 to 74 Years | 83 | 6.5% |
| 75 to 84 Years | 32 | 2.5% |
| 85 Years and Over | 0 | 0.0% |
| Total | 1,280 | 100.0% |
Housing Finances in Goshen
Median Income by Occupancy in Goshen
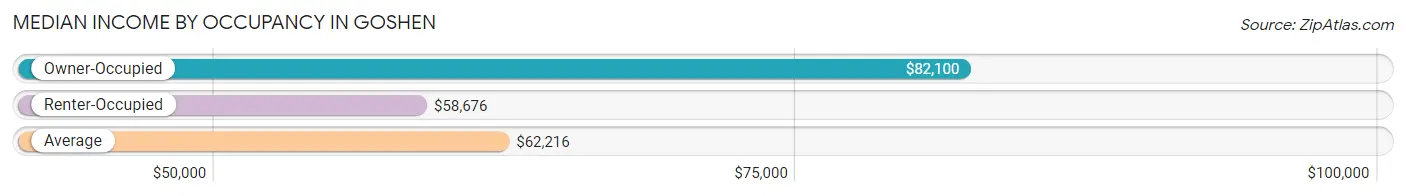
| Occupancy Type | # Households | Median Income |
| Owner-Occupied | 684 (53.4%) | $82,100 |
| Renter-Occupied | 596 (46.6%) | $58,676 |
| Average | 1,280 (100.0%) | $62,216 |
Occupancy by Householder Income Bracket in Goshen
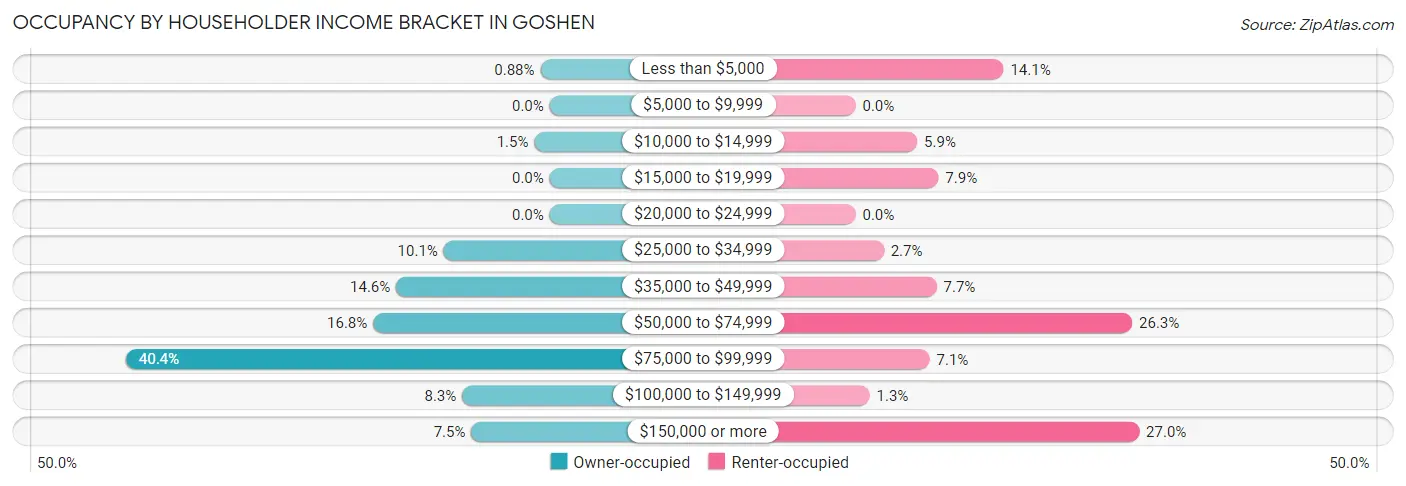
| Income Bracket | Owner-occupied | Renter-occupied |
| Less than $5,000 | 6 (0.9%) | 84 (14.1%) |
| $5,000 to $9,999 | 0 (0.0%) | 0 (0.0%) |
| $10,000 to $14,999 | 10 (1.5%) | 35 (5.9%) |
| $15,000 to $19,999 | 0 (0.0%) | 47 (7.9%) |
| $20,000 to $24,999 | 0 (0.0%) | 0 (0.0%) |
| $25,000 to $34,999 | 69 (10.1%) | 16 (2.7%) |
| $35,000 to $49,999 | 100 (14.6%) | 46 (7.7%) |
| $50,000 to $74,999 | 115 (16.8%) | 157 (26.3%) |
| $75,000 to $99,999 | 276 (40.4%) | 42 (7.0%) |
| $100,000 to $149,999 | 57 (8.3%) | 8 (1.3%) |
| $150,000 or more | 51 (7.5%) | 161 (27.0%) |
| Total | 684 (100.0%) | 596 (100.0%) |
Monthly Housing Cost Tiers in Goshen
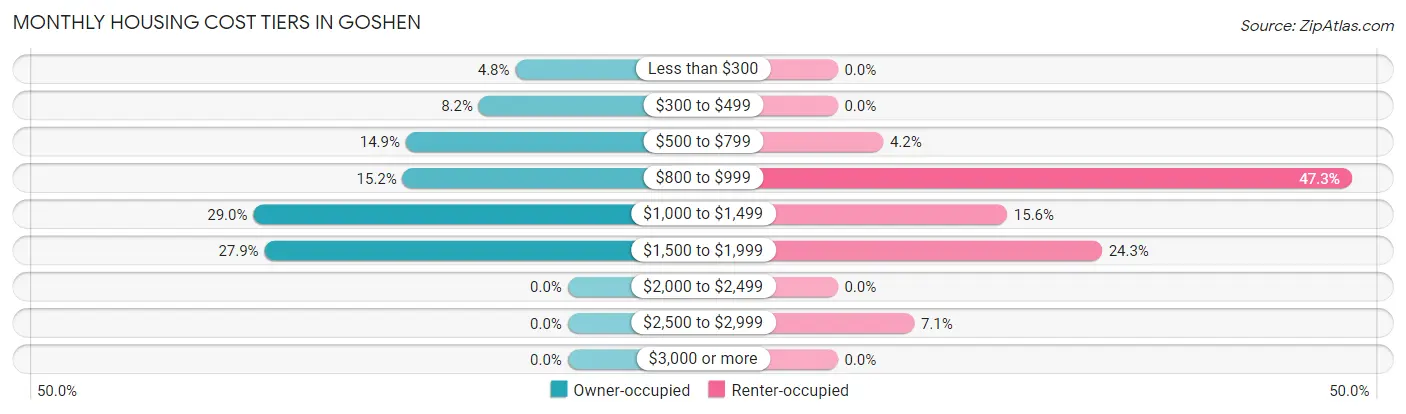
| Monthly Cost | Owner-occupied | Renter-occupied |
| Less than $300 | 33 (4.8%) | 0 (0.0%) |
| $300 to $499 | 56 (8.2%) | 0 (0.0%) |
| $500 to $799 | 102 (14.9%) | 25 (4.2%) |
| $800 to $999 | 104 (15.2%) | 282 (47.3%) |
| $1,000 to $1,499 | 198 (28.9%) | 93 (15.6%) |
| $1,500 to $1,999 | 191 (27.9%) | 145 (24.3%) |
| $2,000 to $2,499 | 0 (0.0%) | 0 (0.0%) |
| $2,500 to $2,999 | 0 (0.0%) | 42 (7.0%) |
| $3,000 or more | 0 (0.0%) | 0 (0.0%) |
| Total | 684 (100.0%) | 596 (100.0%) |
Physical Housing Characteristics in Goshen
Housing Structures in Goshen
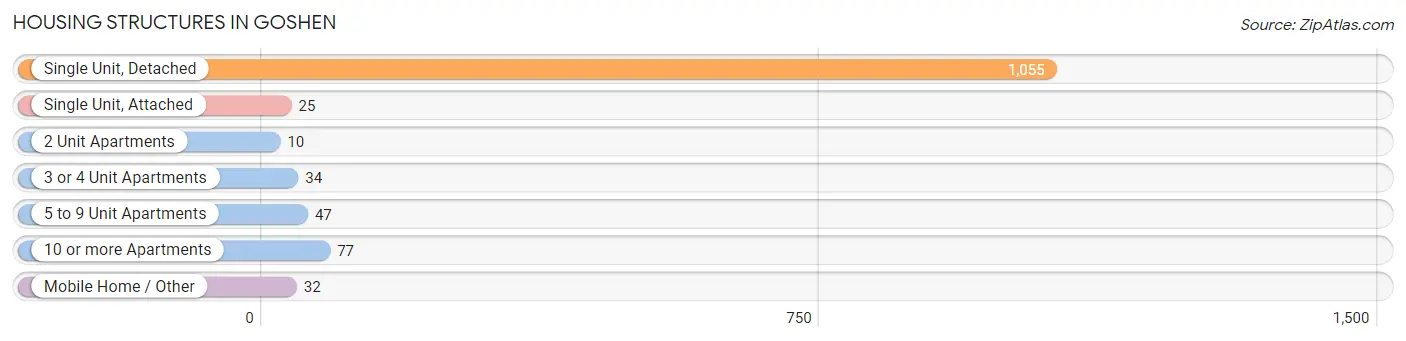
| Structure Type | # Housing Units | % Housing Units |
| Single Unit, Detached | 1,055 | 82.4% |
| Single Unit, Attached | 25 | 1.9% |
| 2 Unit Apartments | 10 | 0.8% |
| 3 or 4 Unit Apartments | 34 | 2.7% |
| 5 to 9 Unit Apartments | 47 | 3.7% |
| 10 or more Apartments | 77 | 6.0% |
| Mobile Home / Other | 32 | 2.5% |
| Total | 1,280 | 100.0% |
Housing Structures by Occupancy in Goshen
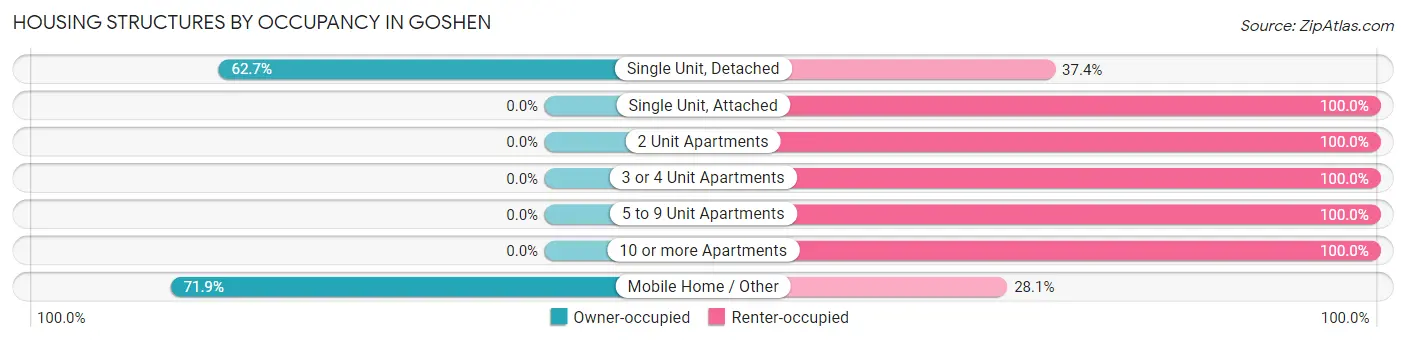
| Structure Type | Owner-occupied | Renter-occupied |
| Single Unit, Detached | 661 (62.6%) | 394 (37.3%) |
| Single Unit, Attached | 0 (0.0%) | 25 (100.0%) |
| 2 Unit Apartments | 0 (0.0%) | 10 (100.0%) |
| 3 or 4 Unit Apartments | 0 (0.0%) | 34 (100.0%) |
| 5 to 9 Unit Apartments | 0 (0.0%) | 47 (100.0%) |
| 10 or more Apartments | 0 (0.0%) | 77 (100.0%) |
| Mobile Home / Other | 23 (71.9%) | 9 (28.1%) |
| Total | 684 (53.4%) | 596 (46.6%) |
Housing Structures by Number of Rooms in Goshen
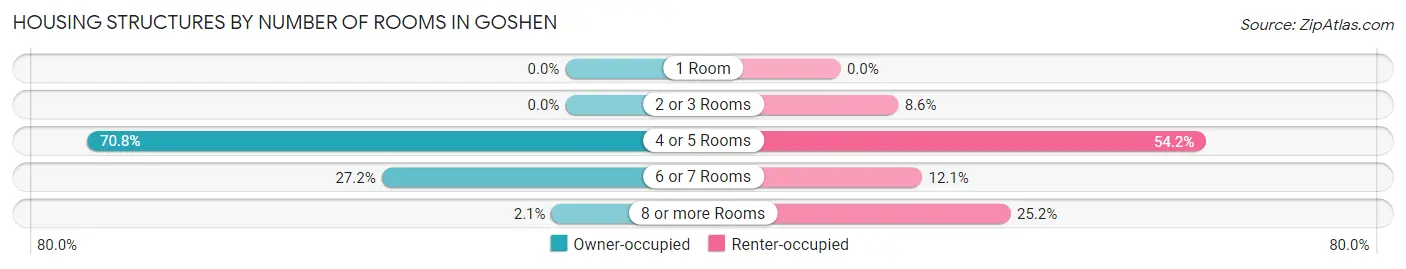
| Number of Rooms | Owner-occupied | Renter-occupied |
| 1 Room | 0 (0.0%) | 0 (0.0%) |
| 2 or 3 Rooms | 0 (0.0%) | 51 (8.6%) |
| 4 or 5 Rooms | 484 (70.8%) | 323 (54.2%) |
| 6 or 7 Rooms | 186 (27.2%) | 72 (12.1%) |
| 8 or more Rooms | 14 (2.1%) | 150 (25.2%) |
| Total | 684 (100.0%) | 596 (100.0%) |
Housing Structure by Heating Type in Goshen
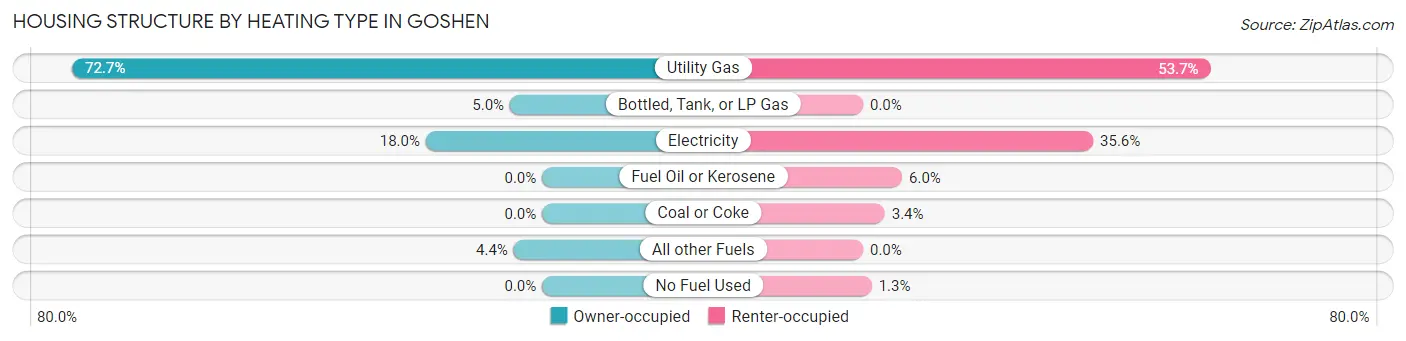
| Heating Type | Owner-occupied | Renter-occupied |
| Utility Gas | 497 (72.7%) | 320 (53.7%) |
| Bottled, Tank, or LP Gas | 34 (5.0%) | 0 (0.0%) |
| Electricity | 123 (18.0%) | 212 (35.6%) |
| Fuel Oil or Kerosene | 0 (0.0%) | 36 (6.0%) |
| Coal or Coke | 0 (0.0%) | 20 (3.4%) |
| All other Fuels | 30 (4.4%) | 0 (0.0%) |
| No Fuel Used | 0 (0.0%) | 8 (1.3%) |
| Total | 684 (100.0%) | 596 (100.0%) |
Household Vehicle Usage in Goshen
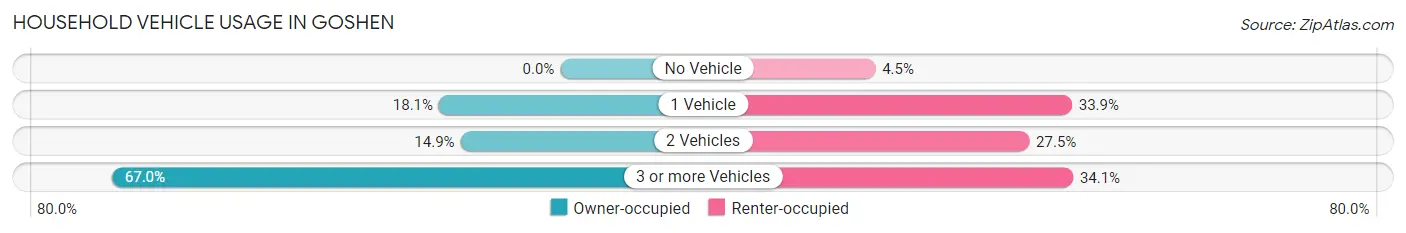
| Vehicles per Household | Owner-occupied | Renter-occupied |
| No Vehicle | 0 (0.0%) | 27 (4.5%) |
| 1 Vehicle | 124 (18.1%) | 202 (33.9%) |
| 2 Vehicles | 102 (14.9%) | 164 (27.5%) |
| 3 or more Vehicles | 458 (67.0%) | 203 (34.1%) |
| Total | 684 (100.0%) | 596 (100.0%) |
Real Estate & Mortgages in Goshen
Real Estate and Mortgage Overview in Goshen
| Characteristic | Without Mortgage | With Mortgage |
| Housing Units | 136 | 548 |
| Median Property Value | $228,800 | $224,500 |
| Median Household Income | - | - |
| Monthly Housing Costs | $463 | $0 |
| Real Estate Taxes | $1,754 | $0 |
Property Value by Mortgage Status in Goshen
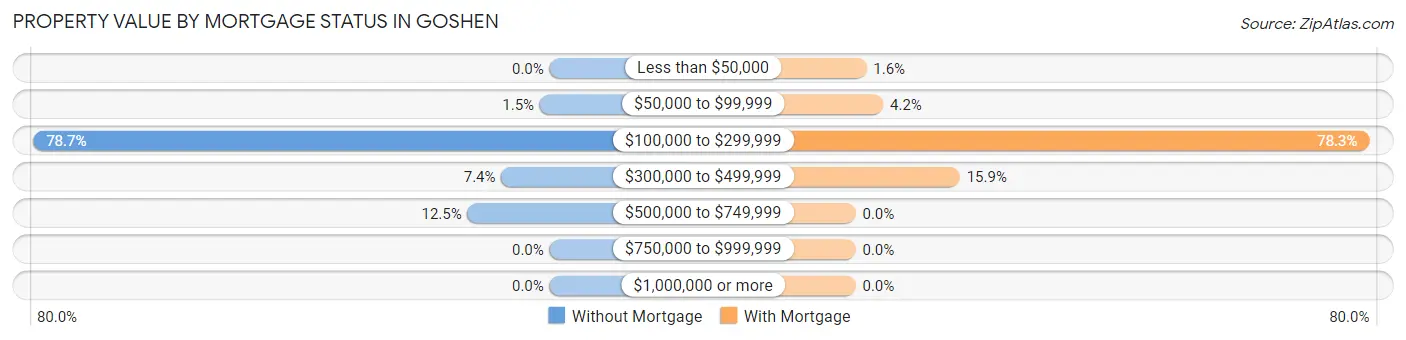
| Property Value | Without Mortgage | With Mortgage |
| Less than $50,000 | 0 (0.0%) | 9 (1.6%) |
| $50,000 to $99,999 | 2 (1.5%) | 23 (4.2%) |
| $100,000 to $299,999 | 107 (78.7%) | 429 (78.3%) |
| $300,000 to $499,999 | 10 (7.3%) | 87 (15.9%) |
| $500,000 to $749,999 | 17 (12.5%) | 0 (0.0%) |
| $750,000 to $999,999 | 0 (0.0%) | 0 (0.0%) |
| $1,000,000 or more | 0 (0.0%) | 0 (0.0%) |
| Total | 136 (100.0%) | 548 (100.0%) |
Household Income by Mortgage Status in Goshen
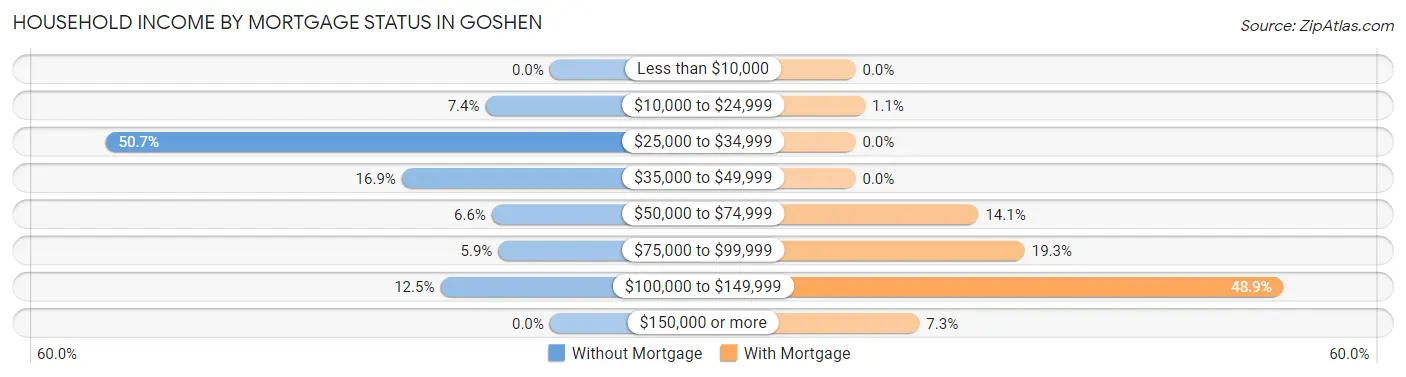
| Household Income | Without Mortgage | With Mortgage |
| Less than $10,000 | 0 (0.0%) | 0 (0.0%) |
| $10,000 to $24,999 | 10 (7.3%) | 6 (1.1%) |
| $25,000 to $34,999 | 69 (50.7%) | 0 (0.0%) |
| $35,000 to $49,999 | 23 (16.9%) | 0 (0.0%) |
| $50,000 to $74,999 | 9 (6.6%) | 77 (14.1%) |
| $75,000 to $99,999 | 8 (5.9%) | 106 (19.3%) |
| $100,000 to $149,999 | 17 (12.5%) | 268 (48.9%) |
| $150,000 or more | 0 (0.0%) | 40 (7.3%) |
| Total | 136 (100.0%) | 548 (100.0%) |
Property Value to Household Income Ratio in Goshen
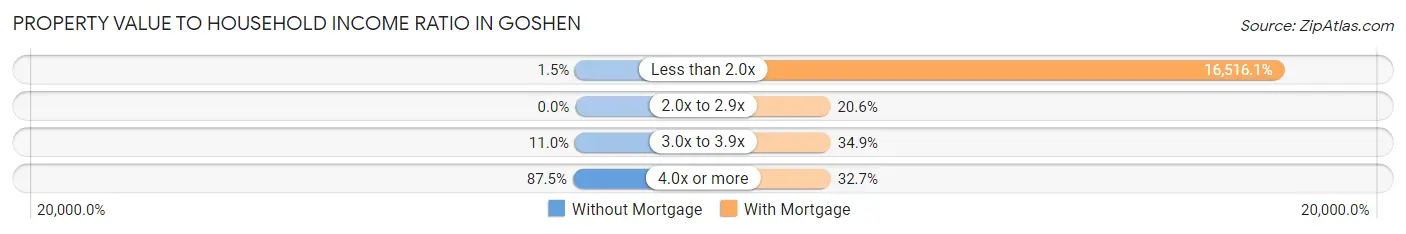
| Value-to-Income Ratio | Without Mortgage | With Mortgage |
| Less than 2.0x | 2 (1.5%) | 90,508 (16,516.1%) |
| 2.0x to 2.9x | 0 (0.0%) | 113 (20.6%) |
| 3.0x to 3.9x | 15 (11.0%) | 191 (34.8%) |
| 4.0x or more | 119 (87.5%) | 179 (32.7%) |
| Total | 136 (100.0%) | 548 (100.0%) |
Real Estate Taxes by Mortgage Status in Goshen
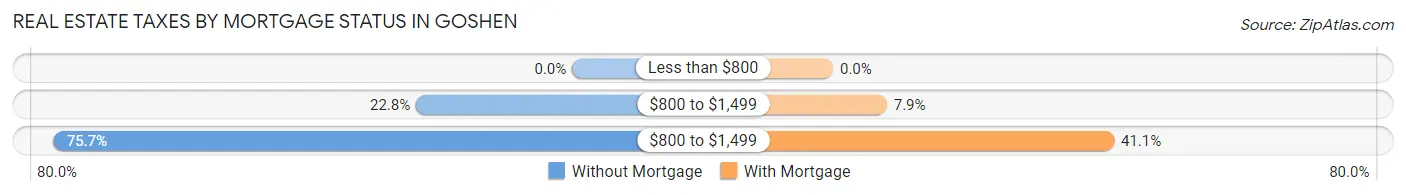
| Property Taxes | Without Mortgage | With Mortgage |
| Less than $800 | 0 (0.0%) | 0 (0.0%) |
| $800 to $1,499 | 31 (22.8%) | 43 (7.9%) |
| $800 to $1,499 | 103 (75.7%) | 225 (41.1%) |
| Total | 136 (100.0%) | 548 (100.0%) |
Health & Disability in Goshen
Health Insurance Coverage by Age in Goshen
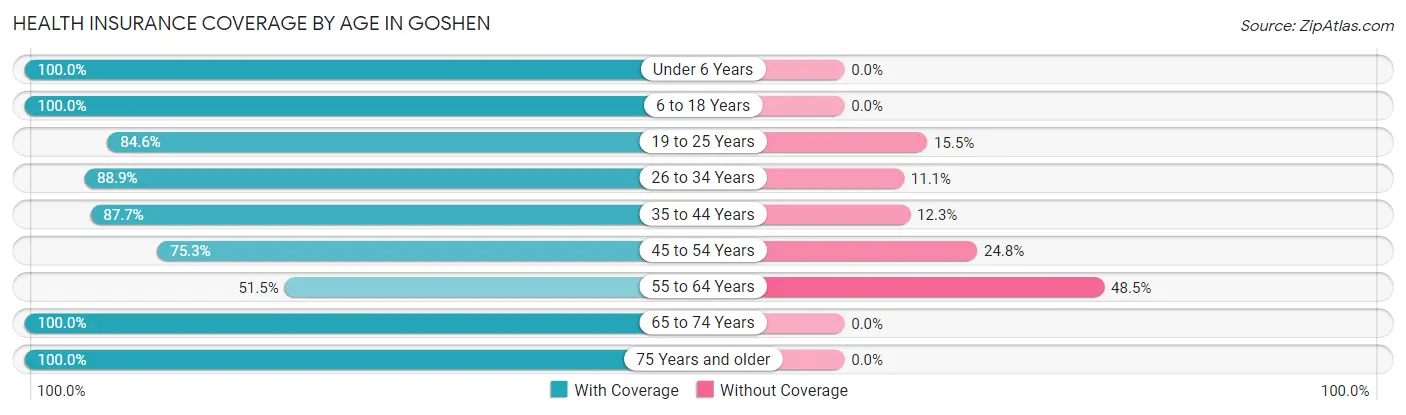
| Age Bracket | With Coverage | Without Coverage |
| Under 6 Years | 363 (100.0%) | 0 (0.0%) |
| 6 to 18 Years | 1,437 (100.0%) | 0 (0.0%) |
| 19 to 25 Years | 394 (84.6%) | 72 (15.4%) |
| 26 to 34 Years | 512 (88.9%) | 64 (11.1%) |
| 35 to 44 Years | 757 (87.7%) | 106 (12.3%) |
| 45 to 54 Years | 374 (75.2%) | 123 (24.7%) |
| 55 to 64 Years | 235 (51.5%) | 221 (48.5%) |
| 65 to 74 Years | 206 (100.0%) | 0 (0.0%) |
| 75 Years and older | 110 (100.0%) | 0 (0.0%) |
| Total | 4,388 (88.2%) | 586 (11.8%) |
Health Insurance Coverage by Citizenship Status in Goshen
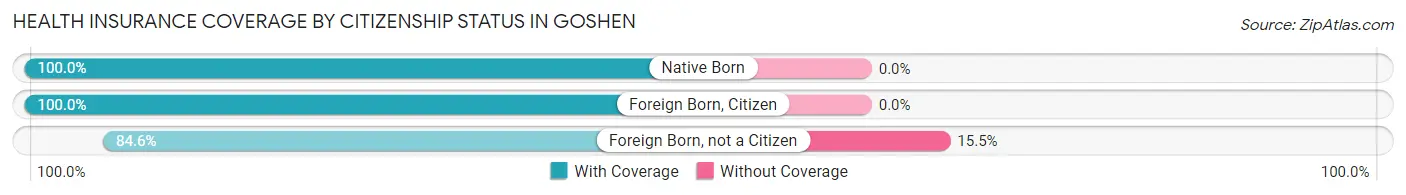
| Citizenship Status | With Coverage | Without Coverage |
| Native Born | 363 (100.0%) | 0 (0.0%) |
| Foreign Born, Citizen | 1,437 (100.0%) | 0 (0.0%) |
| Foreign Born, not a Citizen | 394 (84.6%) | 72 (15.4%) |
Health Insurance Coverage by Household Income in Goshen
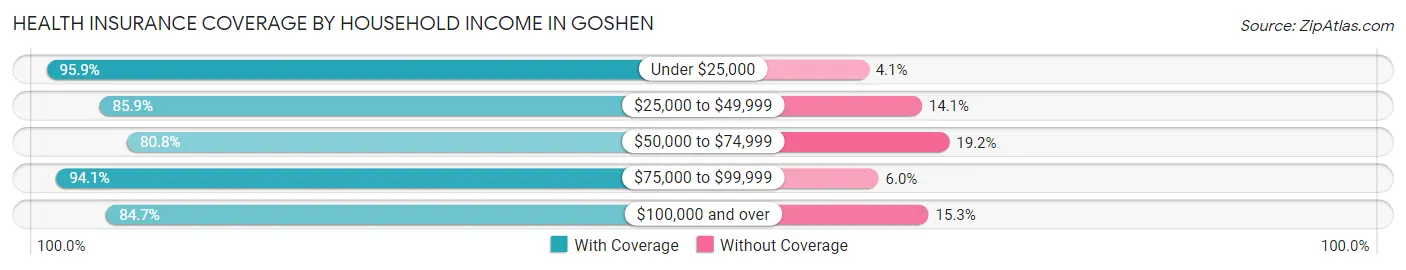
| Household Income | With Coverage | Without Coverage |
| Under $25,000 | 866 (95.9%) | 37 (4.1%) |
| $25,000 to $49,999 | 605 (85.9%) | 99 (14.1%) |
| $50,000 to $74,999 | 849 (80.8%) | 202 (19.2%) |
| $75,000 to $99,999 | 1,074 (94.1%) | 68 (5.9%) |
| $100,000 and over | 994 (84.7%) | 180 (15.3%) |
Public vs Private Health Insurance Coverage by Age in Goshen
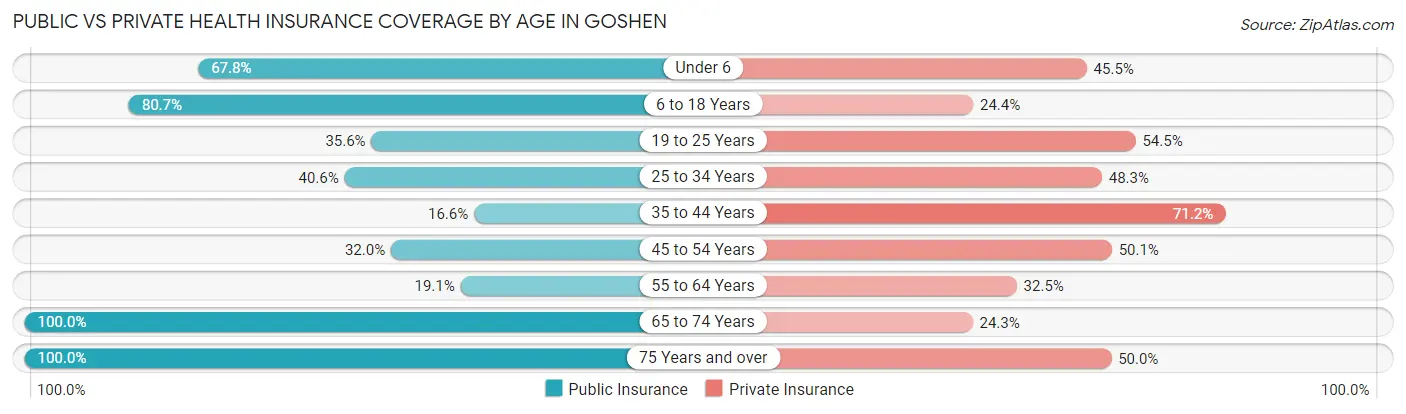
| Age Bracket | Public Insurance | Private Insurance |
| Under 6 | 246 (67.8%) | 165 (45.5%) |
| 6 to 18 Years | 1,159 (80.6%) | 350 (24.4%) |
| 19 to 25 Years | 166 (35.6%) | 254 (54.5%) |
| 25 to 34 Years | 234 (40.6%) | 278 (48.3%) |
| 35 to 44 Years | 143 (16.6%) | 614 (71.2%) |
| 45 to 54 Years | 159 (32.0%) | 249 (50.1%) |
| 55 to 64 Years | 87 (19.1%) | 148 (32.5%) |
| 65 to 74 Years | 206 (100.0%) | 50 (24.3%) |
| 75 Years and over | 110 (100.0%) | 55 (50.0%) |
| Total | 2,510 (50.5%) | 2,163 (43.5%) |
Disability Status by Sex by Age in Goshen
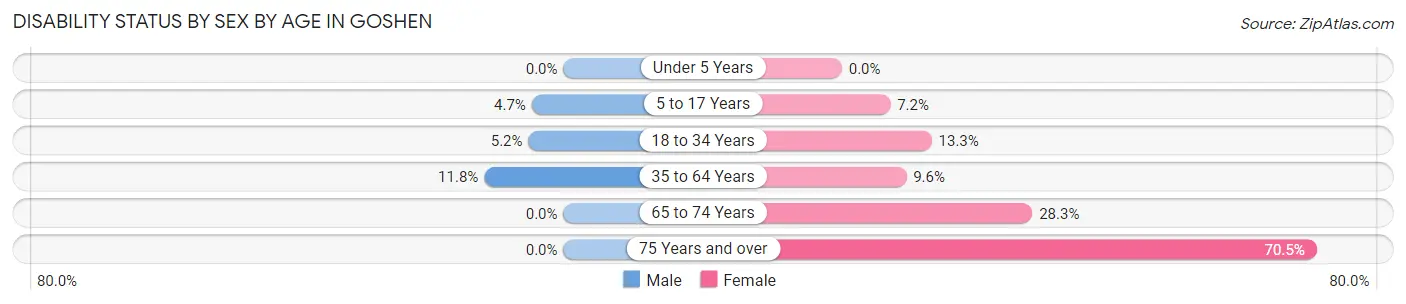
| Age Bracket | Male | Female |
| Under 5 Years | 0 (0.0%) | 0 (0.0%) |
| 5 to 17 Years | 34 (4.7%) | 45 (7.2%) |
| 18 to 34 Years | 25 (5.2%) | 89 (13.3%) |
| 35 to 64 Years | 109 (11.8%) | 85 (9.6%) |
| 65 to 74 Years | 0 (0.0%) | 41 (28.3%) |
| 75 Years and over | 0 (0.0%) | 55 (70.5%) |
Disability Class by Sex by Age in Goshen
Disability Class: Hearing Difficulty
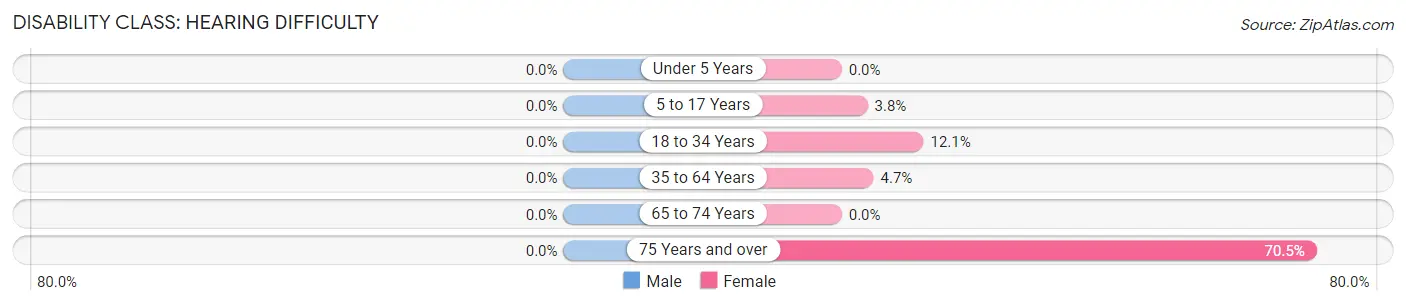
| Age Bracket | Male | Female |
| Under 5 Years | 0 (0.0%) | 0 (0.0%) |
| 5 to 17 Years | 0 (0.0%) | 24 (3.8%) |
| 18 to 34 Years | 0 (0.0%) | 81 (12.1%) |
| 35 to 64 Years | 0 (0.0%) | 42 (4.7%) |
| 65 to 74 Years | 0 (0.0%) | 0 (0.0%) |
| 75 Years and over | 0 (0.0%) | 55 (70.5%) |
Disability Class: Vision Difficulty
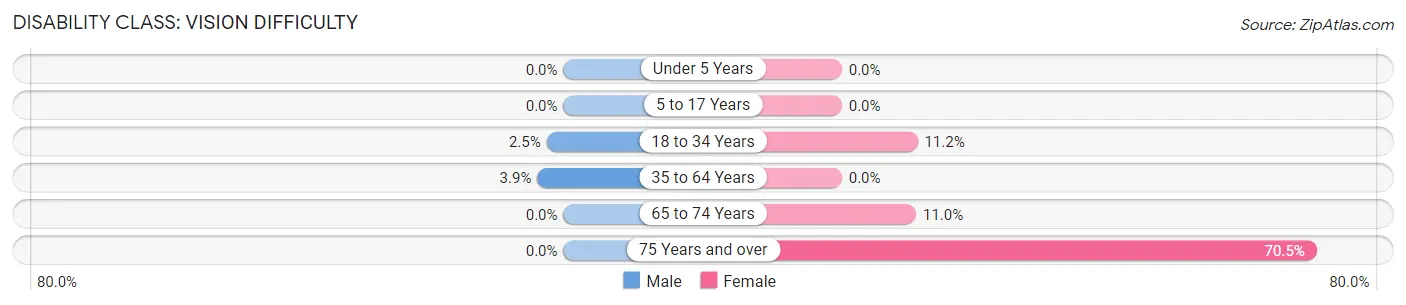
| Age Bracket | Male | Female |
| Under 5 Years | 0 (0.0%) | 0 (0.0%) |
| 5 to 17 Years | 0 (0.0%) | 0 (0.0%) |
| 18 to 34 Years | 12 (2.5%) | 75 (11.2%) |
| 35 to 64 Years | 36 (3.9%) | 0 (0.0%) |
| 65 to 74 Years | 0 (0.0%) | 16 (11.0%) |
| 75 Years and over | 0 (0.0%) | 55 (70.5%) |
Disability Class: Cognitive Difficulty
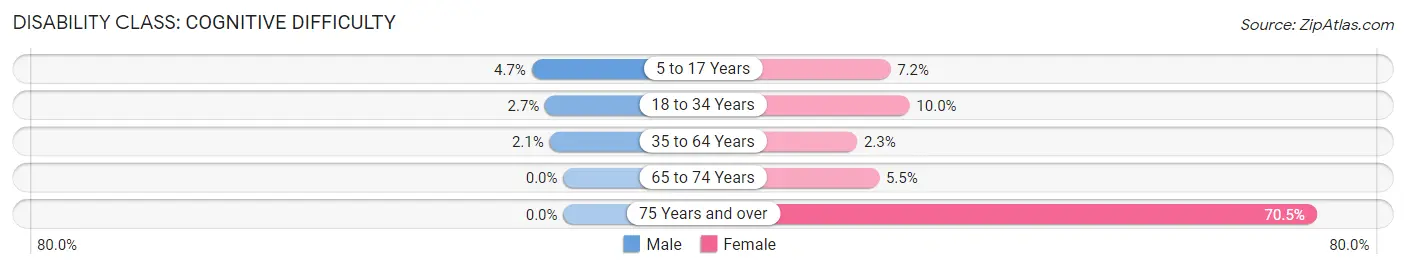
| Age Bracket | Male | Female |
| 5 to 17 Years | 34 (4.7%) | 45 (7.2%) |
| 18 to 34 Years | 13 (2.7%) | 67 (10.0%) |
| 35 to 64 Years | 19 (2.1%) | 20 (2.2%) |
| 65 to 74 Years | 0 (0.0%) | 8 (5.5%) |
| 75 Years and over | 0 (0.0%) | 55 (70.5%) |
Disability Class: Ambulatory Difficulty
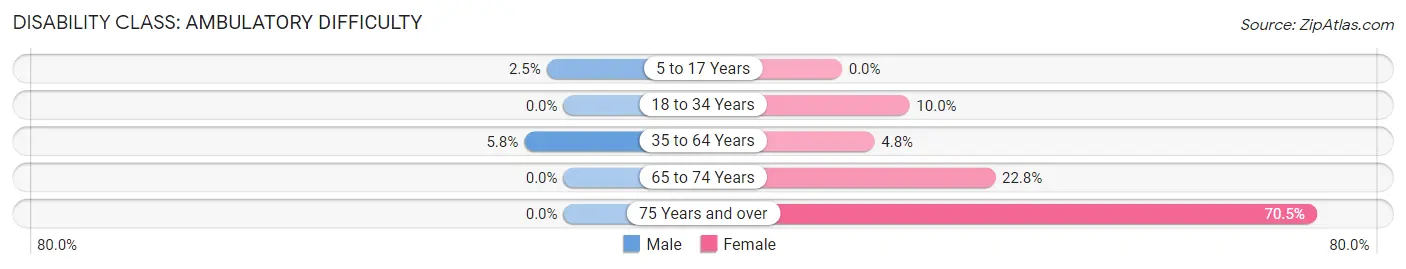
| Age Bracket | Male | Female |
| 5 to 17 Years | 18 (2.5%) | 0 (0.0%) |
| 18 to 34 Years | 0 (0.0%) | 67 (10.0%) |
| 35 to 64 Years | 54 (5.8%) | 43 (4.8%) |
| 65 to 74 Years | 0 (0.0%) | 33 (22.8%) |
| 75 Years and over | 0 (0.0%) | 55 (70.5%) |
Disability Class: Self-Care Difficulty
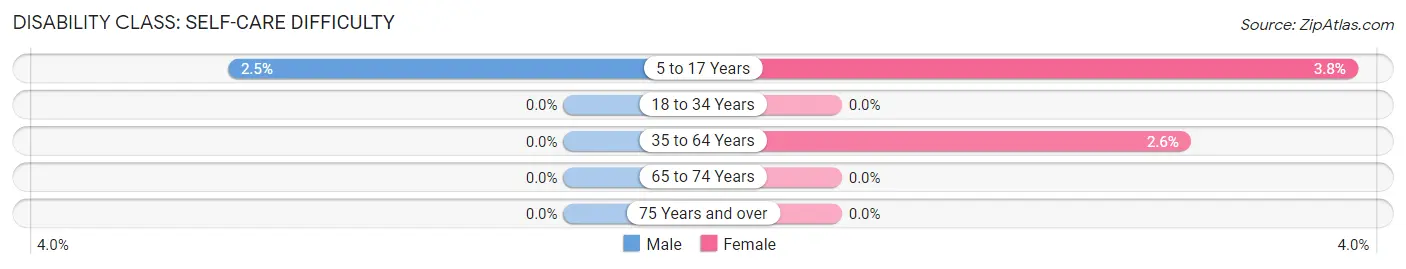
| Age Bracket | Male | Female |
| 5 to 17 Years | 18 (2.5%) | 24 (3.8%) |
| 18 to 34 Years | 0 (0.0%) | 0 (0.0%) |
| 35 to 64 Years | 0 (0.0%) | 23 (2.6%) |
| 65 to 74 Years | 0 (0.0%) | 0 (0.0%) |
| 75 Years and over | 0 (0.0%) | 0 (0.0%) |
Technology Access in Goshen
Computing Device Access in Goshen
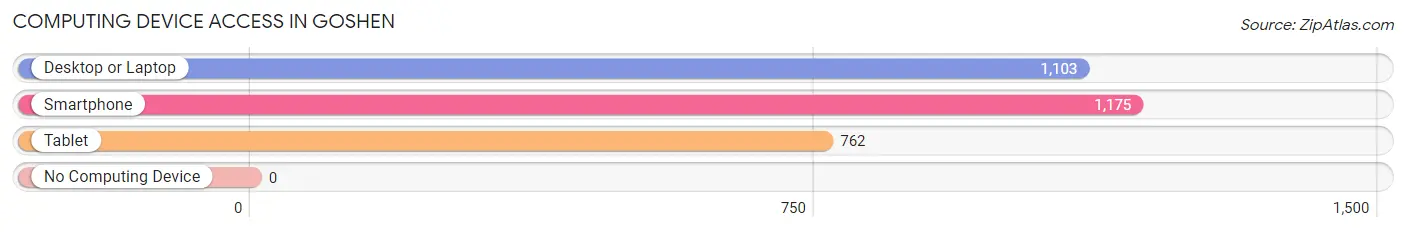
| Device Type | # Households | % Households |
| Desktop or Laptop | 1,103 | 86.2% |
| Smartphone | 1,175 | 91.8% |
| Tablet | 762 | 59.5% |
| No Computing Device | 0 | 0.0% |
| Total | 1,280 | 100.0% |
Internet Access in Goshen
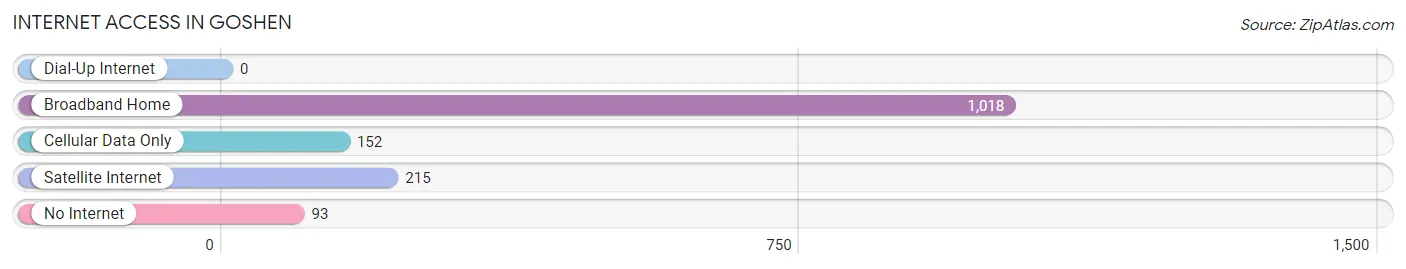
| Internet Type | # Households | % Households |
| Dial-Up Internet | 0 | 0.0% |
| Broadband Home | 1,018 | 79.5% |
| Cellular Data Only | 152 | 11.9% |
| Satellite Internet | 215 | 16.8% |
| No Internet | 93 | 7.3% |
| Total | 1,280 | 100.0% |
Goshen Summary
Goshen is a small unincorporated community located in Tulare County, California. It is situated in the San Joaquin Valley, approximately 8 miles south of Visalia and 8 miles north of Porterville. The population of Goshen was estimated to be 1,845 in 2019.
History
Goshen was founded in 1853 by a group of settlers from the Midwest. The settlers named the town after the biblical city of Goshen, which was located in Egypt. The town was originally a farming community, and the settlers grew wheat, barley, and other crops. The town was also home to a number of businesses, including a blacksmith shop, a general store, and a hotel.
In the late 19th century, the town began to grow and prosper. The railroad arrived in 1887, and the town was incorporated in 1888. The town was home to a number of churches, schools, and businesses.
In the early 20th century, the town began to decline. The railroad was abandoned in the 1920s, and the town's population began to decline. The Great Depression also had a negative impact on the town, and many of the businesses closed.
Geography
Goshen is located in the San Joaquin Valley, approximately 8 miles south of Visalia and 8 miles north of Porterville. The town is situated at an elevation of approximately 300 feet above sea level. The climate in Goshen is hot and dry, with temperatures ranging from the mid-90s in the summer to the mid-50s in the winter.
The town is surrounded by agricultural land, and the main crops grown in the area are cotton, alfalfa, and grapes. The town is also home to a number of small businesses, including a gas station, a grocery store, and a post office.
Economy
Goshen's economy is largely based on agriculture. The main crops grown in the area are cotton, alfalfa, and grapes. The town is also home to a number of small businesses, including a gas station, a grocery store, and a post office.
Demographics
Goshen has a population of approximately 1,845 people. The town is predominantly white, with approximately 75% of the population identifying as white. The remaining 25% of the population is made up of Hispanic, African American, and Asian residents. The median household income in Goshen is $45,000, and the median home value is $200,000. The town has a high rate of poverty, with approximately 25% of the population living below the poverty line.
Common Questions
What is the Total Population of Goshen?
Total Population of Goshen is 4,974.
What is the Total Male Population of Goshen?
Total Male Population of Goshen is 2,314.
What is the Total Female Population of Goshen?
Total Female Population of Goshen is 2,660.
What is the Ratio of Males per 100 Females in Goshen?
There are 86.99 Males per 100 Females in Goshen.
What is the Ratio of Females per 100 Males in Goshen?
There are 114.95 Females per 100 Males in Goshen.
What is the Median Population Age in Goshen?
Median Population Age in Goshen is 29.3 Years.
What is the Average Family Size in Goshen
Average Family Size in Goshen is 3.8 People.
What is the Average Household Size in Goshen
Average Household Size in Goshen is 3.9 People.
What is Per Capita Income in Goshen?
Per Capita income in Goshen is $20,088.
What is the Median Family Income in Goshen?
Median Family Income in Goshen is $60,116.
What is the Median Household income in Goshen?
Median Household Income in Goshen is $62,216.
What is Income or Wage Gap in Goshen?
Income or Wage Gap in Goshen is 21.7%.
Women in Goshen earn 78.3 cents for every dollar earned by a man.
What is Inequality or Gini Index in Goshen?
Inequality or Gini Index in Goshen is 0.42.
How Large is the Labor Force in Goshen?
There are 2,353 People in the Labor Forcein in Goshen.
What is the Percentage of People in the Labor Force in Goshen?
67.0% of People are in the Labor Force in Goshen.
What is the Unemployment Rate in Goshen?
Unemployment Rate in Goshen is 4.4%.