Golden Hills, CA
Golden Hills Map
Golden Hills Overview
9,892
TOTAL POPULATION
5,082
MALE POPULATION
4,810
FEMALE POPULATION
105.65
MALES / 100 FEMALES
94.65
FEMALES / 100 MALES
38.3
MEDIAN AGE
3.1
AVG FAMILY SIZE
2.7
AVG HOUSEHOLD SIZE
$41,968
PER CAPITA INCOME
$106,359
AVG FAMILY INCOME
$96,676
AVG HOUSEHOLD INCOME
69.2%
WAGE / INCOME GAP [ % ]
30.8¢/ $1
WAGE / INCOME GAP [ $ ]
$9,512
FAMILY INCOME DEFICIT
0.38
INEQUALITY / GINI INDEX
4,865
LABOR FORCE [ PEOPLE ]
63.1%
PERCENT IN LABOR FORCE
6.4%
UNEMPLOYMENT RATE
Golden Hills Area Codes
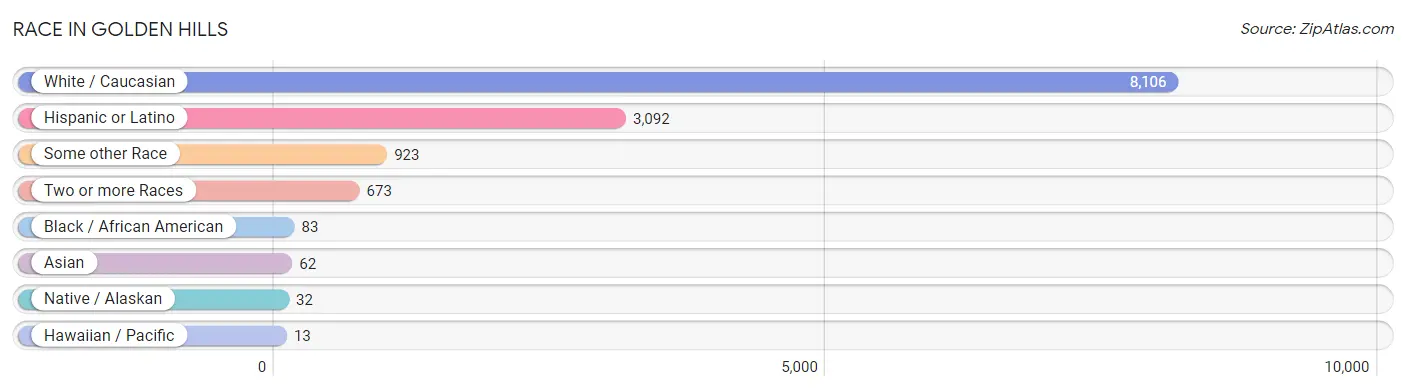
Race in Golden Hills
The most populous races in Golden Hills are White / Caucasian (8,106 | 82.0%), Hispanic or Latino (3,092 | 31.3%), and Some other Race (923 | 9.3%).
| Race | # Population | % Population |
| Asian | 62 | 0.6% |
| Black / African American | 83 | 0.8% |
| Hawaiian / Pacific | 13 | 0.1% |
| Hispanic or Latino | 3,092 | 31.3% |
| Native / Alaskan | 32 | 0.3% |
| White / Caucasian | 8,106 | 82.0% |
| Two or more Races | 673 | 6.8% |
| Some other Race | 923 | 9.3% |
| Total | 9,892 | 100.0% |
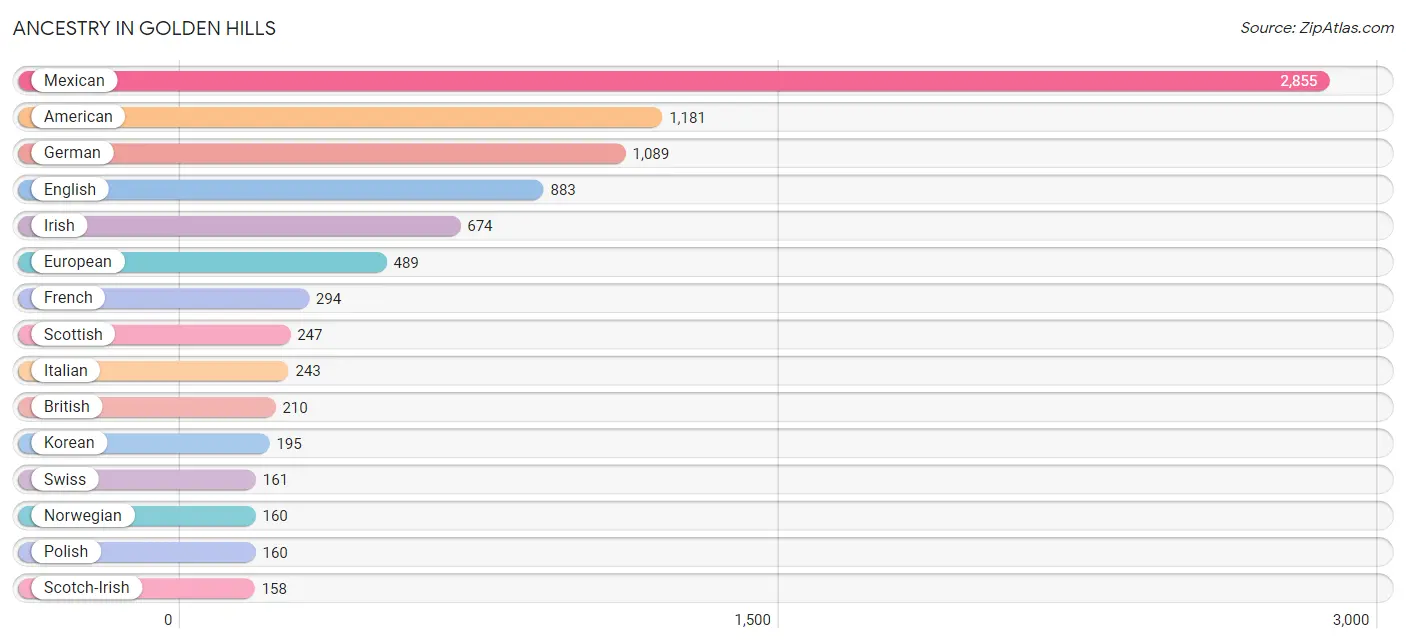
Ancestry in Golden Hills
The most populous ancestries reported in Golden Hills are Mexican (2,855 | 28.9%), American (1,181 | 11.9%), German (1,089 | 11.0%), English (883 | 8.9%), and Irish (674 | 6.8%), together accounting for 67.5% of all Golden Hills residents.
| Ancestry | # Population | % Population |
| American | 1,181 | 11.9% |
| Austrian | 20 | 0.2% |
| Blackfeet | 46 | 0.5% |
| British | 210 | 2.1% |
| Burmese | 33 | 0.3% |
| Canadian | 92 | 0.9% |
| Central American | 35 | 0.4% |
| Cherokee | 54 | 0.5% |
| Cree | 14 | 0.1% |
| Czech | 85 | 0.9% |
| Czechoslovakian | 8 | 0.1% |
| Dutch | 107 | 1.1% |
| Ecuadorian | 77 | 0.8% |
| English | 883 | 8.9% |
| European | 489 | 4.9% |
| Filipino | 15 | 0.2% |
| French | 294 | 3.0% |
| French Canadian | 48 | 0.5% |
| German | 1,089 | 11.0% |
| Guamanian / Chamorro | 13 | 0.1% |
| Indian (Asian) | 14 | 0.1% |
| Iranian | 18 | 0.2% |
| Irish | 674 | 6.8% |
| Italian | 243 | 2.5% |
| Korean | 195 | 2.0% |
| Laotian | 9 | 0.1% |
| Lithuanian | 10 | 0.1% |
| Mexican | 2,855 | 28.9% |
| Northern European | 19 | 0.2% |
| Norwegian | 160 | 1.6% |
| Polish | 160 | 1.6% |
| Portuguese | 60 | 0.6% |
| Puerto Rican | 10 | 0.1% |
| Romanian | 22 | 0.2% |
| Russian | 24 | 0.2% |
| Salvadoran | 35 | 0.4% |
| Scandinavian | 36 | 0.4% |
| Scotch-Irish | 158 | 1.6% |
| Scottish | 247 | 2.5% |
| South American | 77 | 0.8% |
| Spaniard | 71 | 0.7% |
| Swedish | 62 | 0.6% |
| Swiss | 161 | 1.6% |
| Welsh | 103 | 1.0% |
| Yaqui | 9 | 0.1% |
| Yuman | 10 | 0.1% | View All 46 Rows |
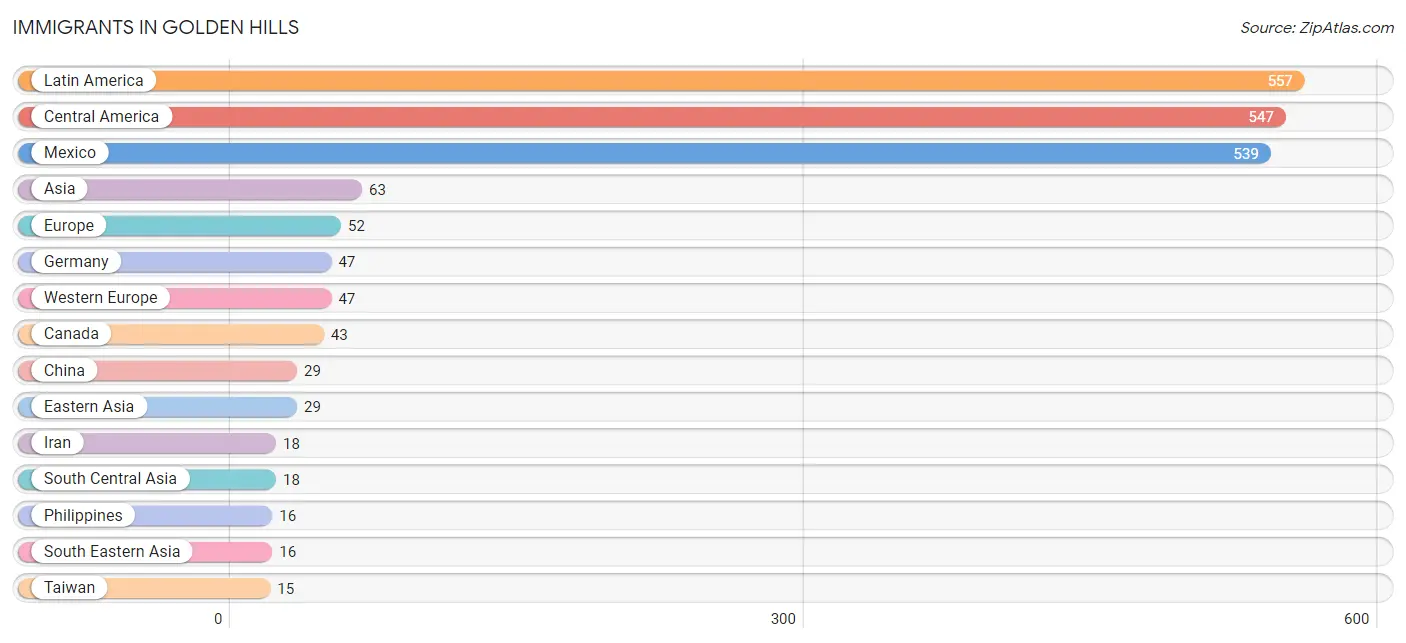
Immigrants in Golden Hills
The most numerous immigrant groups reported in Golden Hills came from Latin America (557 | 5.6%), Central America (547 | 5.5%), Mexico (539 | 5.4%), Asia (63 | 0.6%), and Europe (52 | 0.5%), together accounting for 17.8% of all Golden Hills residents.
| Immigration Origin | # Population | % Population |
| Asia | 63 | 0.6% |
| Canada | 43 | 0.4% |
| Central America | 547 | 5.5% |
| China | 29 | 0.3% |
| Eastern Asia | 29 | 0.3% |
| Ecuador | 10 | 0.1% |
| El Salvador | 8 | 0.1% |
| England | 5 | 0.1% |
| Europe | 52 | 0.5% |
| Germany | 47 | 0.5% |
| Iran | 18 | 0.2% |
| Latin America | 557 | 5.6% |
| Mexico | 539 | 5.4% |
| Northern Europe | 5 | 0.1% |
| Philippines | 16 | 0.2% |
| South America | 10 | 0.1% |
| South Central Asia | 18 | 0.2% |
| South Eastern Asia | 16 | 0.2% |
| Taiwan | 15 | 0.2% |
| Western Europe | 47 | 0.5% | View All 20 Rows |
Sex and Age in Golden Hills
Sex and Age in Golden Hills
The most populous age groups in Golden Hills are 65 to 69 Years (648 | 12.8%) for men and 65 to 69 Years (447 | 9.3%) for women.
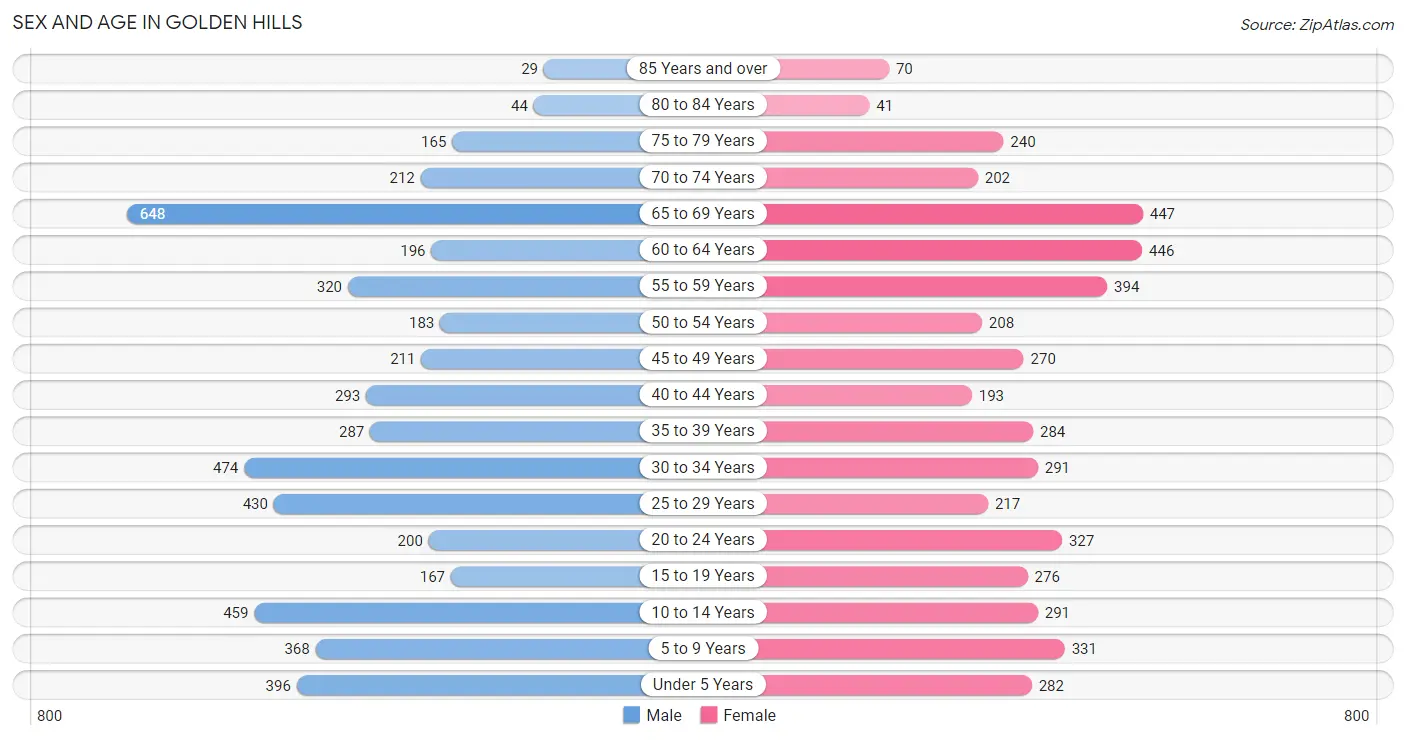
| Age Bracket | Male | Female |
| Under 5 Years | 396 (7.8%) | 282 (5.9%) |
| 5 to 9 Years | 368 (7.2%) | 331 (6.9%) |
| 10 to 14 Years | 459 (9.0%) | 291 (6.0%) |
| 15 to 19 Years | 167 (3.3%) | 276 (5.7%) |
| 20 to 24 Years | 200 (3.9%) | 327 (6.8%) |
| 25 to 29 Years | 430 (8.5%) | 217 (4.5%) |
| 30 to 34 Years | 474 (9.3%) | 291 (6.0%) |
| 35 to 39 Years | 287 (5.7%) | 284 (5.9%) |
| 40 to 44 Years | 293 (5.8%) | 193 (4.0%) |
| 45 to 49 Years | 211 (4.2%) | 270 (5.6%) |
| 50 to 54 Years | 183 (3.6%) | 208 (4.3%) |
| 55 to 59 Years | 320 (6.3%) | 394 (8.2%) |
| 60 to 64 Years | 196 (3.9%) | 446 (9.3%) |
| 65 to 69 Years | 648 (12.8%) | 447 (9.3%) |
| 70 to 74 Years | 212 (4.2%) | 202 (4.2%) |
| 75 to 79 Years | 165 (3.3%) | 240 (5.0%) |
| 80 to 84 Years | 44 (0.9%) | 41 (0.9%) |
| 85 Years and over | 29 (0.6%) | 70 (1.5%) |
| Total | 5,082 (100.0%) | 4,810 (100.0%) |
Families and Households in Golden Hills
Median Family Size in Golden Hills
The median family size in Golden Hills is 3.14 persons per family, with single male/father families (195 | 7.2%) accounting for the largest median family size of 3.44 persons per family. On the other hand, single female/mother families (483 | 17.8%) represent the smallest median family size with 2.60 persons per family.
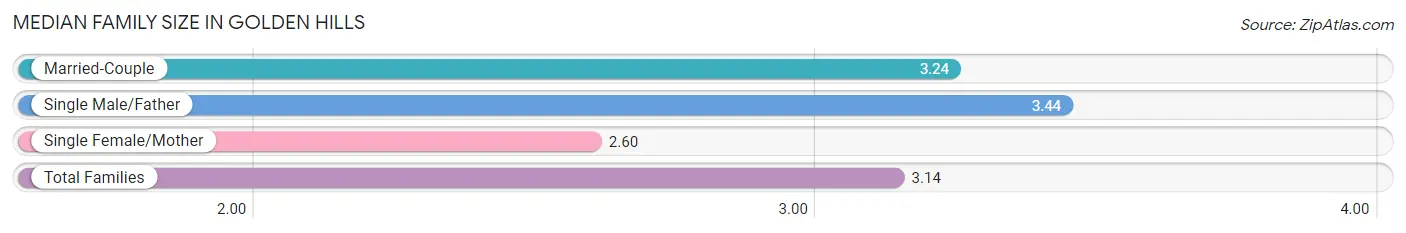
| Family Type | # Families | Family Size |
| Married-Couple | 2,036 (75.0%) | 3.24 |
| Single Male/Father | 195 (7.2%) | 3.44 |
| Single Female/Mother | 483 (17.8%) | 2.60 |
| Total Families | 2,714 (100.0%) | 3.14 |
Median Household Size in Golden Hills
The median household size in Golden Hills is 2.70 persons per household, with single male/father households (195 | 5.3%) accounting for the largest median household size of 3.75 persons per household. non-family households (943 | 25.8%) represent the smallest median household size with 1.23 persons per household.
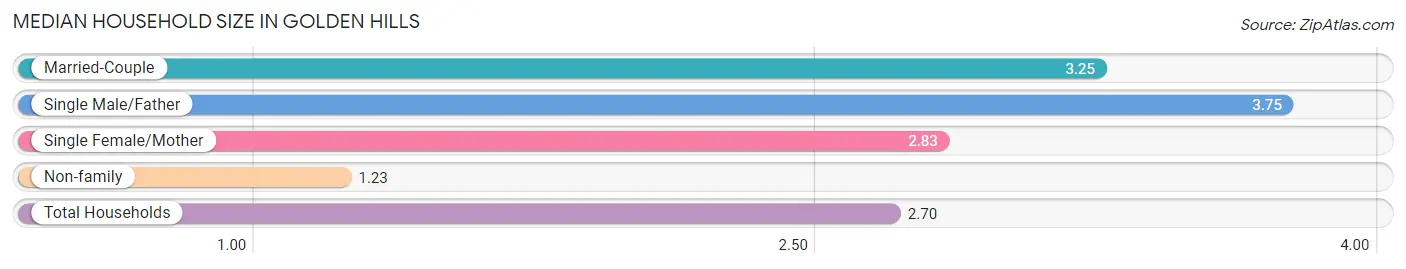
| Household Type | # Households | Household Size |
| Married-Couple | 2,036 (55.7%) | 3.25 |
| Single Male/Father | 195 (5.3%) | 3.75 |
| Single Female/Mother | 483 (13.2%) | 2.83 |
| Non-family | 943 (25.8%) | 1.23 |
| Total Households | 3,657 (100.0%) | 2.70 |
Household Size by Marriage Status in Golden Hills
Out of a total of 3,657 households in Golden Hills, 2,714 (74.2%) are family households, while 943 (25.8%) are nonfamily households. The most numerous type of family households are 2-person households, comprising 1,284, and the most common type of nonfamily households are 1-person households, comprising 776.
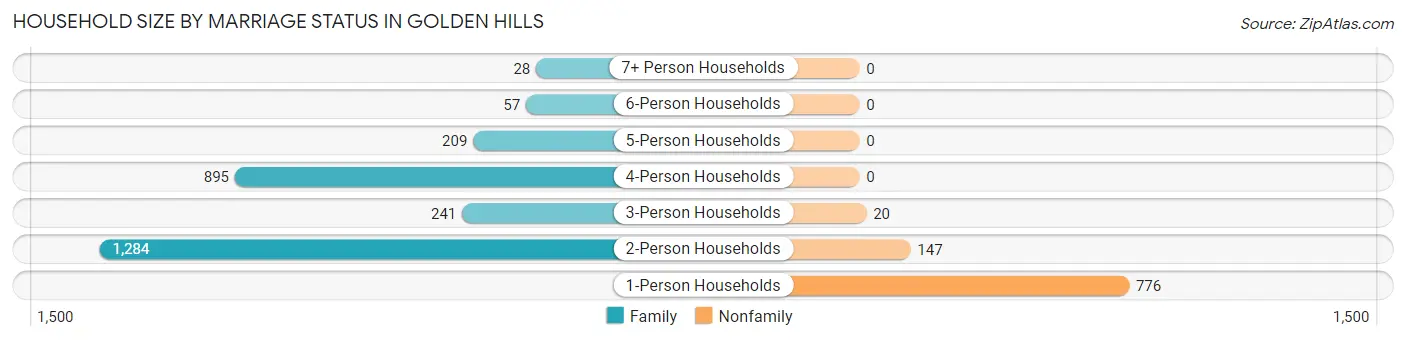
| Household Size | Family Households | Nonfamily Households |
| 1-Person Households | - | 776 (21.2%) |
| 2-Person Households | 1,284 (35.1%) | 147 (4.0%) |
| 3-Person Households | 241 (6.6%) | 20 (0.5%) |
| 4-Person Households | 895 (24.5%) | 0 (0.0%) |
| 5-Person Households | 209 (5.7%) | 0 (0.0%) |
| 6-Person Households | 57 (1.6%) | 0 (0.0%) |
| 7+ Person Households | 28 (0.8%) | 0 (0.0%) |
| Total | 2,714 (74.2%) | 943 (25.8%) |
Female Fertility in Golden Hills
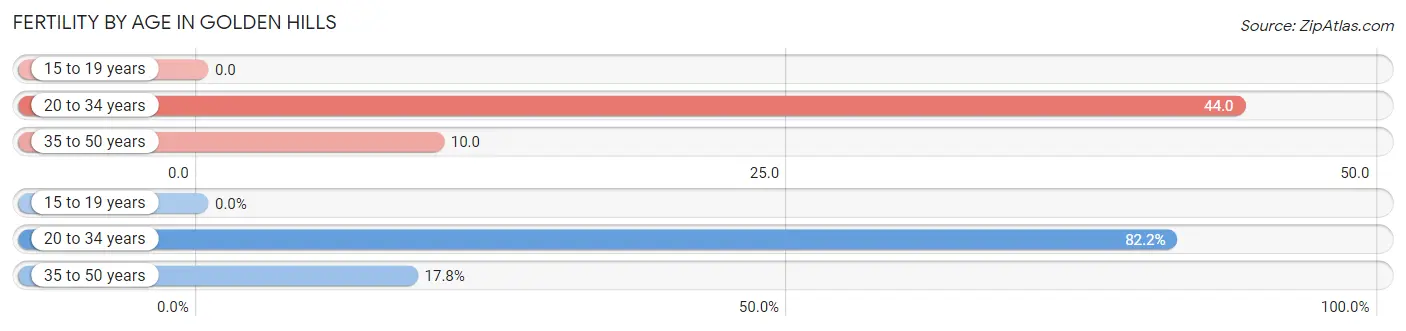
Fertility by Age in Golden Hills
Average fertility rate in Golden Hills is 23.0 births per 1,000 women. Women in the age bracket of 20 to 34 years have the highest fertility rate with 44.0 births per 1,000 women. Women in the age bracket of 20 to 34 years acount for 82.2% of all women with births.
| Age Bracket | Women with Births | Births / 1,000 Women |
| 15 to 19 years | 0 (0.0%) | 0.0 |
| 20 to 34 years | 37 (82.2%) | 44.0 |
| 35 to 50 years | 8 (17.8%) | 10.0 |
| Total | 45 (100.0%) | 23.0 |
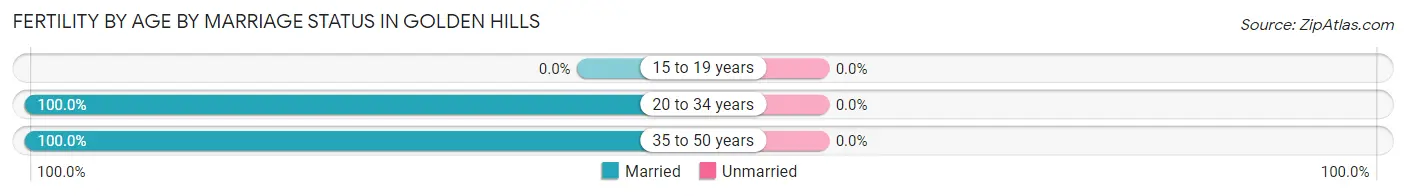
Fertility by Age by Marriage Status in Golden Hills
| Age Bracket | Married | Unmarried |
| 15 to 19 years | 0 (0.0%) | 0 (0.0%) |
| 20 to 34 years | 37 (100.0%) | 0 (0.0%) |
| 35 to 50 years | 8 (100.0%) | 0 (0.0%) |
| Total | 45 (100.0%) | 0 (0.0%) |
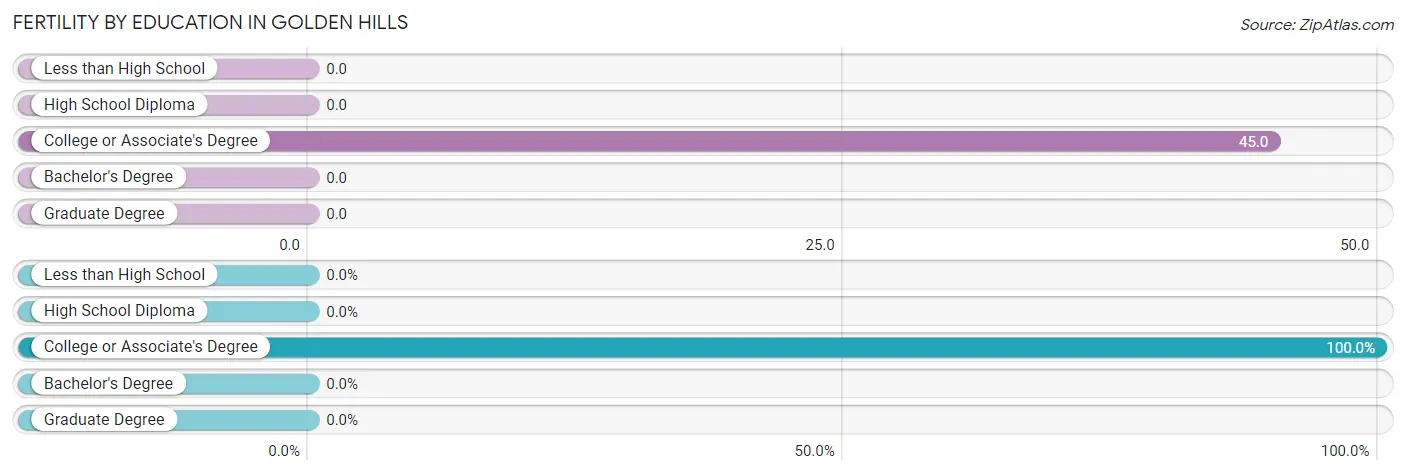
Fertility by Education in Golden Hills
| Educational Attainment | Women with Births | Births / 1,000 Women |
| Less than High School | 0 (0.0%) | 0.0 |
| High School Diploma | 0 (0.0%) | 0.0 |
| College or Associate's Degree | 45 (100.0%) | 45.0 |
| Bachelor's Degree | 0 (0.0%) | 0.0 |
| Graduate Degree | 0 (0.0%) | 0.0 |
| Total | 45 (100.0%) | 23.0 |
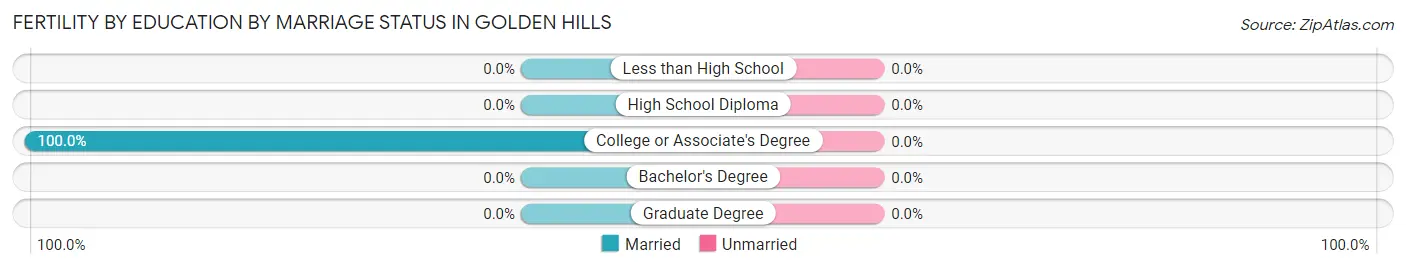
Fertility by Education by Marriage Status in Golden Hills
| Educational Attainment | Married | Unmarried |
| Less than High School | 0 (0.0%) | 0 (0.0%) |
| High School Diploma | 0 (0.0%) | 0 (0.0%) |
| College or Associate's Degree | 45 (100.0%) | 0 (0.0%) |
| Bachelor's Degree | 0 (0.0%) | 0 (0.0%) |
| Graduate Degree | 0 (0.0%) | 0 (0.0%) |
| Total | 45 (100.0%) | 0 (0.0%) |
Income in Golden Hills
Income Overview in Golden Hills
Per Capita Income in Golden Hills is $41,968, while median incomes of families and households are $106,359 and $96,676 respectively.
| Characteristic | Number | Measure |
| Per Capita Income | 9,892 | $41,968 |
| Median Family Income | 2,714 | $106,359 |
| Mean Family Income | 2,714 | $119,396 |
| Median Household Income | 3,657 | $96,676 |
| Mean Household Income | 3,657 | $112,521 |
| Income Deficit | 2,714 | $9,512 |
| Wage / Income Gap (%) | 9,892 | 69.19% |
| Wage / Income Gap ($) | 9,892 | 30.81¢ per $1 |
| Gini / Inequality Index | 9,892 | 0.38 |
Earnings by Sex in Golden Hills
Average Earnings in Golden Hills are $55,046, $77,895 for men and $24,000 for women, a difference of 69.2%.
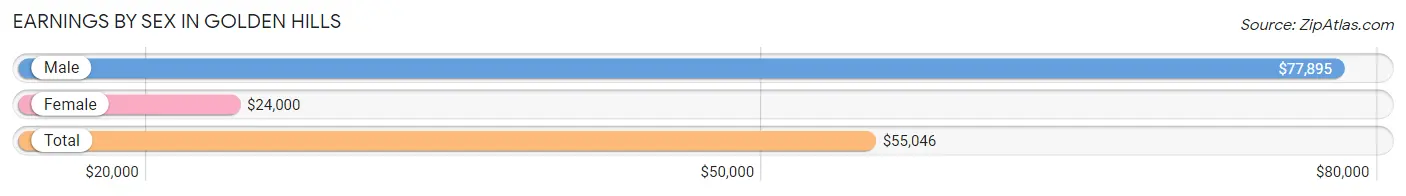
| Sex | Number | Average Earnings |
| Male | 2,820 (57.6%) | $77,895 |
| Female | 2,074 (42.4%) | $24,000 |
| Total | 4,894 (100.0%) | $55,046 |
Earnings by Sex by Income Bracket in Golden Hills
The most common earnings brackets in Golden Hills are $100,000+ for men (755 | 26.8%) and $22,500 to $24,999 for women (295 | 14.2%).
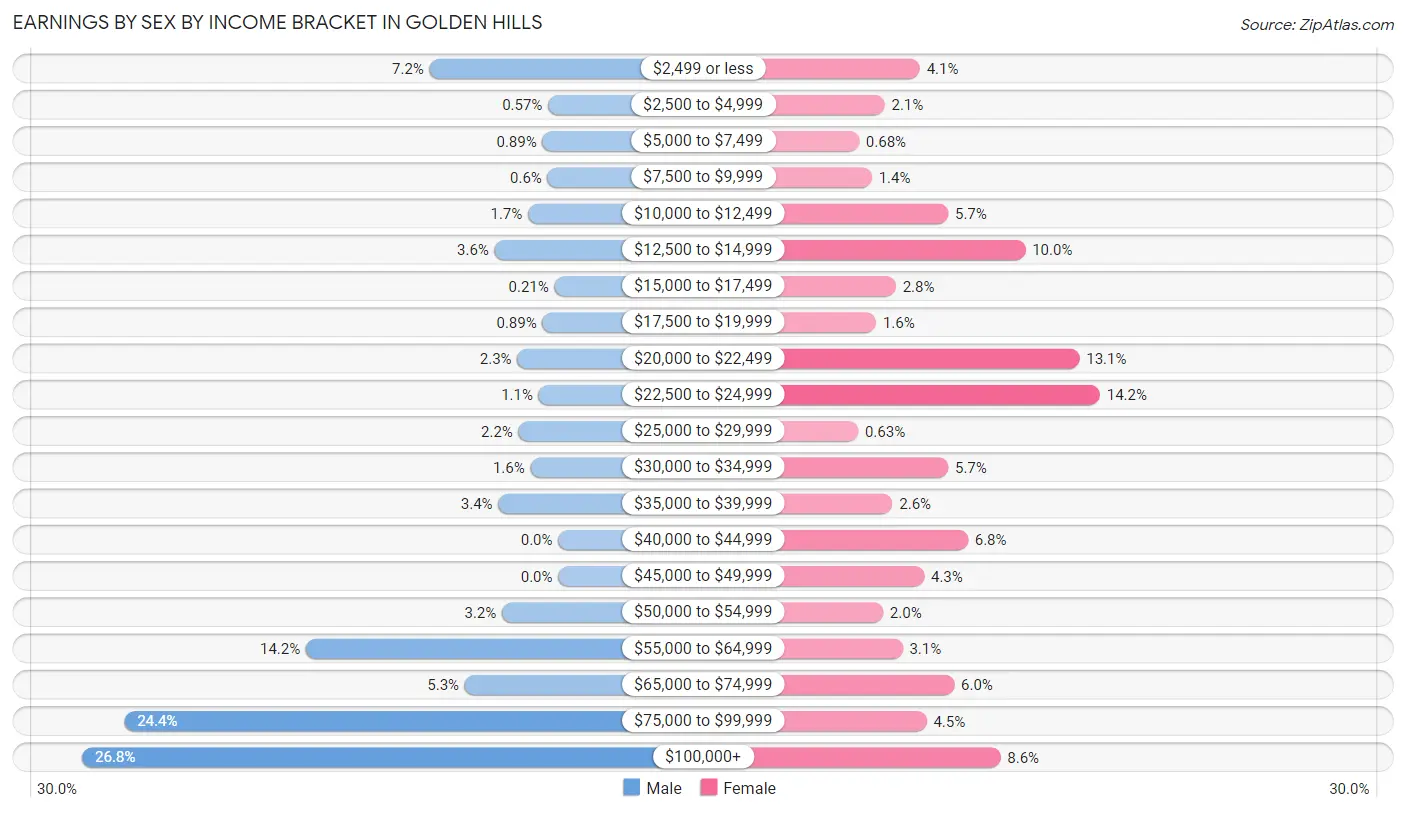
| Income | Male | Female |
| $2,499 or less | 204 (7.2%) | 85 (4.1%) |
| $2,500 to $4,999 | 16 (0.6%) | 44 (2.1%) |
| $5,000 to $7,499 | 25 (0.9%) | 14 (0.7%) |
| $7,500 to $9,999 | 17 (0.6%) | 29 (1.4%) |
| $10,000 to $12,499 | 48 (1.7%) | 118 (5.7%) |
| $12,500 to $14,999 | 101 (3.6%) | 208 (10.0%) |
| $15,000 to $17,499 | 6 (0.2%) | 57 (2.8%) |
| $17,500 to $19,999 | 25 (0.9%) | 34 (1.6%) |
| $20,000 to $22,499 | 65 (2.3%) | 271 (13.1%) |
| $22,500 to $24,999 | 31 (1.1%) | 295 (14.2%) |
| $25,000 to $29,999 | 63 (2.2%) | 13 (0.6%) |
| $30,000 to $34,999 | 44 (1.6%) | 118 (5.7%) |
| $35,000 to $39,999 | 95 (3.4%) | 53 (2.6%) |
| $40,000 to $44,999 | 0 (0.0%) | 141 (6.8%) |
| $45,000 to $49,999 | 0 (0.0%) | 90 (4.3%) |
| $50,000 to $54,999 | 89 (3.2%) | 42 (2.0%) |
| $55,000 to $64,999 | 400 (14.2%) | 65 (3.1%) |
| $65,000 to $74,999 | 148 (5.2%) | 125 (6.0%) |
| $75,000 to $99,999 | 688 (24.4%) | 93 (4.5%) |
| $100,000+ | 755 (26.8%) | 179 (8.6%) |
| Total | 2,820 (100.0%) | 2,074 (100.0%) |
Earnings by Sex by Educational Attainment in Golden Hills
Average earnings in Golden Hills are $86,138 for men and $31,420 for women, a difference of 63.5%. Men with an educational attainment of graduate degree enjoy the highest average annual earnings of $102,829, while those with college or associate's degree education earn the least with $58,125. Women with an educational attainment of bachelor's degree earn the most with the average annual earnings of $80,188, while those with less than high school education have the smallest earnings of $23,667.
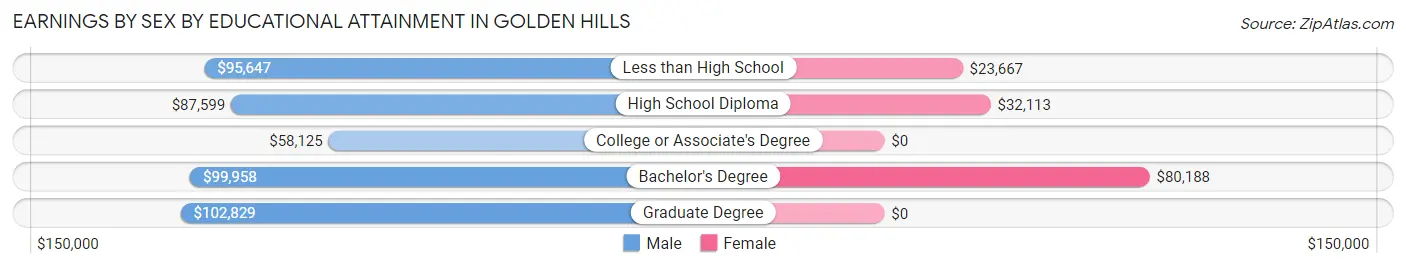
| Educational Attainment | Male Income | Female Income |
| Less than High School | $95,647 | $23,667 |
| High School Diploma | $87,599 | $32,113 |
| College or Associate's Degree | $58,125 | $0 |
| Bachelor's Degree | $99,958 | $80,188 |
| Graduate Degree | $102,829 | $0 |
| Total | $86,138 | $31,420 |
Family Income in Golden Hills
Family Income Brackets in Golden Hills
According to the Golden Hills family income data, there are 611 families falling into the $100,000 to $149,999 income range, which is the most common income bracket and makes up 22.5% of all families.
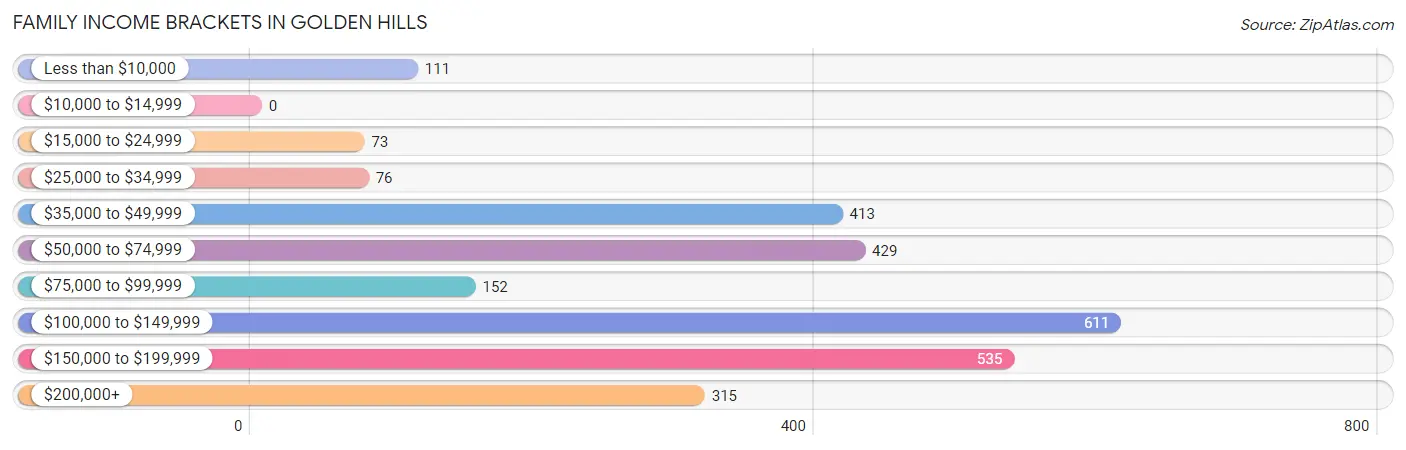
| Income Bracket | # Families | % Families |
| Less than $10,000 | 111 | 4.1% |
| $10,000 to $14,999 | 0 | 0.0% |
| $15,000 to $24,999 | 73 | 2.7% |
| $25,000 to $34,999 | 76 | 2.8% |
| $35,000 to $49,999 | 413 | 15.2% |
| $50,000 to $74,999 | 429 | 15.8% |
| $75,000 to $99,999 | 152 | 5.6% |
| $100,000 to $149,999 | 611 | 22.5% |
| $150,000 to $199,999 | 535 | 19.7% |
| $200,000+ | 315 | 11.6% |
Family Income by Famaliy Size in Golden Hills
4-person families (704 | 25.9%) account for the highest median family income in Golden Hills with $182,759 per family, while 4-person families (704 | 25.9%) have the highest median income of $45,690 per family member.
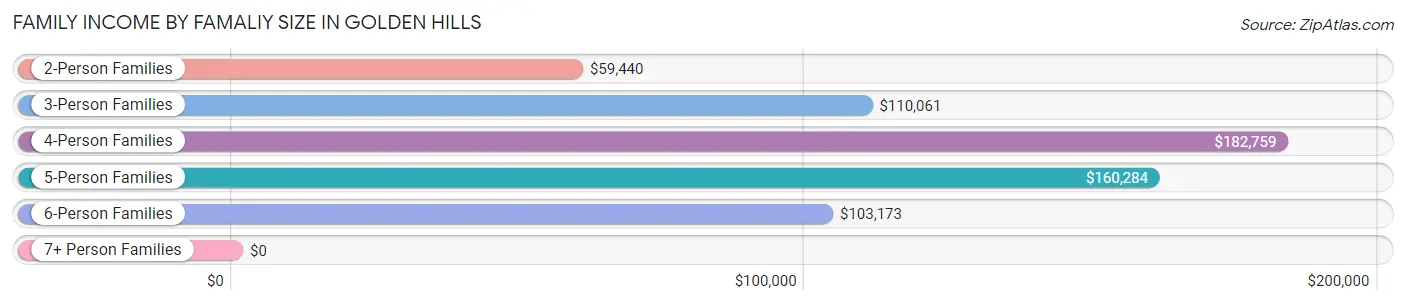
| Income Bracket | # Families | Median Income |
| 2-Person Families | 1,290 (47.5%) | $59,440 |
| 3-Person Families | 426 (15.7%) | $110,061 |
| 4-Person Families | 704 (25.9%) | $182,759 |
| 5-Person Families | 209 (7.7%) | $160,284 |
| 6-Person Families | 57 (2.1%) | $103,173 |
| 7+ Person Families | 28 (1.0%) | $0 |
| Total | 2,714 (100.0%) | $106,359 |
Family Income by Number of Earners in Golden Hills
The median family income in Golden Hills is $106,359, with families comprising 3+ earners (432) having the highest median family income of $184,064, while families with no earners (461) have the lowest median family income of $63,005, accounting for 15.9% and 17.0% of families, respectively.
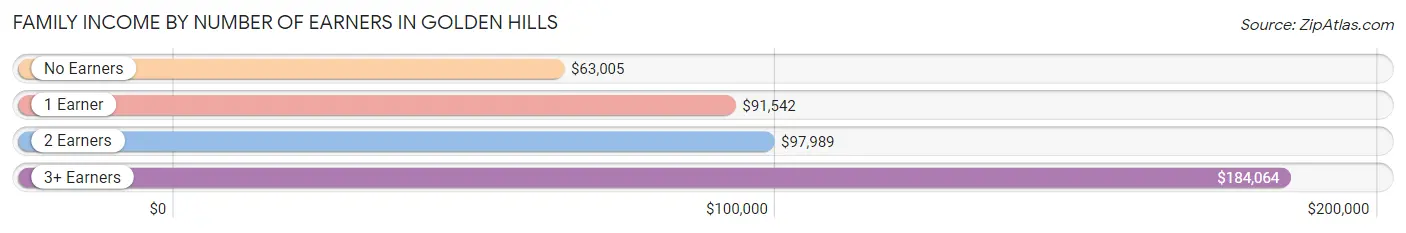
| Number of Earners | # Families | Median Income |
| No Earners | 461 (17.0%) | $63,005 |
| 1 Earner | 964 (35.5%) | $91,542 |
| 2 Earners | 857 (31.6%) | $97,989 |
| 3+ Earners | 432 (15.9%) | $184,064 |
| Total | 2,714 (100.0%) | $106,359 |
Household Income in Golden Hills
Household Income Brackets in Golden Hills
With 812 households falling in the category, the $100,000 to $149,999 income range is the most frequent in Golden Hills, accounting for 22.2% of all households. In contrast, only 22 households (0.6%) fall into the $10,000 to $14,999 income bracket, making it the least populous group.
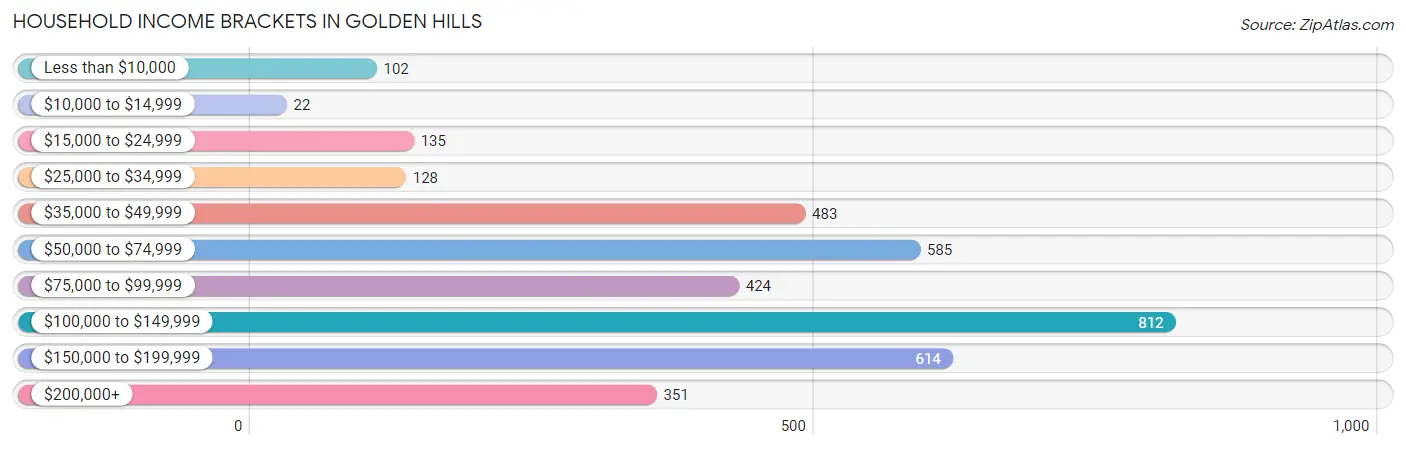
| Income Bracket | # Households | % Households |
| Less than $10,000 | 102 | 2.8% |
| $10,000 to $14,999 | 22 | 0.6% |
| $15,000 to $24,999 | 135 | 3.7% |
| $25,000 to $34,999 | 128 | 3.5% |
| $35,000 to $49,999 | 483 | 13.2% |
| $50,000 to $74,999 | 585 | 16.0% |
| $75,000 to $99,999 | 424 | 11.6% |
| $100,000 to $149,999 | 812 | 22.2% |
| $150,000 to $199,999 | 614 | 16.8% |
| $200,000+ | 351 | 9.6% |
Household Income by Householder Age in Golden Hills
The median household income in Golden Hills is $96,676, with the highest median household income of $122,333 found in the 25 to 44 years age bracket for the primary householder. A total of 994 households (27.2%) fall into this category. Meanwhile, the 15 to 24 years age bracket for the primary householder has the lowest median household income of $39,385, with 231 households (6.3%) in this group.
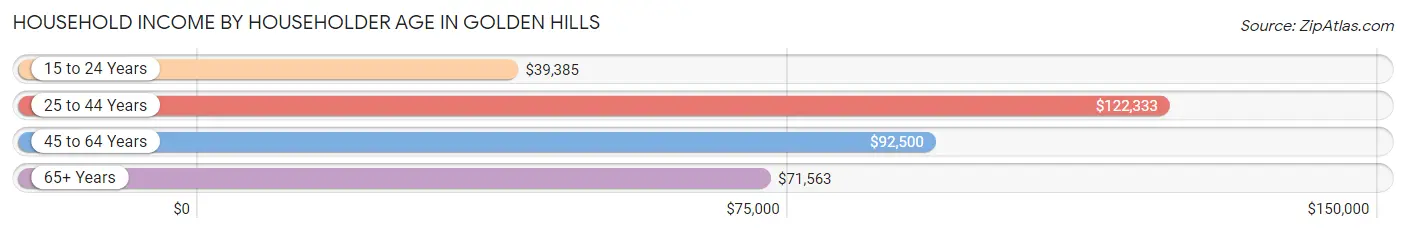
| Income Bracket | # Households | Median Income |
| 15 to 24 Years | 231 (6.3%) | $39,385 |
| 25 to 44 Years | 994 (27.2%) | $122,333 |
| 45 to 64 Years | 1,186 (32.4%) | $92,500 |
| 65+ Years | 1,246 (34.1%) | $71,563 |
| Total | 3,657 (100.0%) | $96,676 |
Poverty in Golden Hills
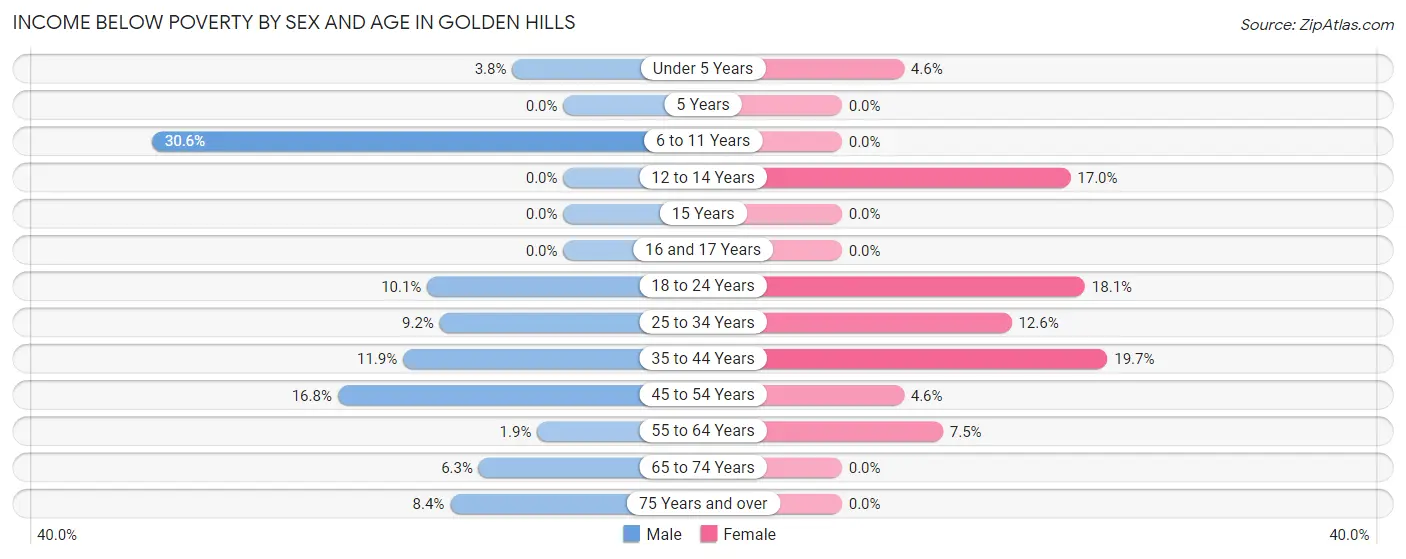
Income Below Poverty by Sex and Age in Golden Hills
With 10.3% poverty level for males and 7.9% for females among the residents of Golden Hills, 6 to 11 year old males and 35 to 44 year old females are the most vulnerable to poverty, with 179 males (30.5%) and 94 females (19.7%) in their respective age groups living below the poverty level.
| Age Bracket | Male | Female |
| Under 5 Years | 15 (3.8%) | 13 (4.6%) |
| 5 Years | 0 (0.0%) | 0 (0.0%) |
| 6 to 11 Years | 179 (30.5%) | 0 (0.0%) |
| 12 to 14 Years | 0 (0.0%) | 28 (17.0%) |
| 15 Years | 0 (0.0%) | 0 (0.0%) |
| 16 and 17 Years | 0 (0.0%) | 0 (0.0%) |
| 18 to 24 Years | 28 (10.1%) | 96 (18.0%) |
| 25 to 34 Years | 83 (9.2%) | 64 (12.6%) |
| 35 to 44 Years | 69 (11.9%) | 94 (19.7%) |
| 45 to 54 Years | 66 (16.8%) | 22 (4.6%) |
| 55 to 64 Years | 10 (1.9%) | 63 (7.5%) |
| 65 to 74 Years | 54 (6.3%) | 0 (0.0%) |
| 75 Years and over | 20 (8.4%) | 0 (0.0%) |
| Total | 524 (10.3%) | 380 (7.9%) |
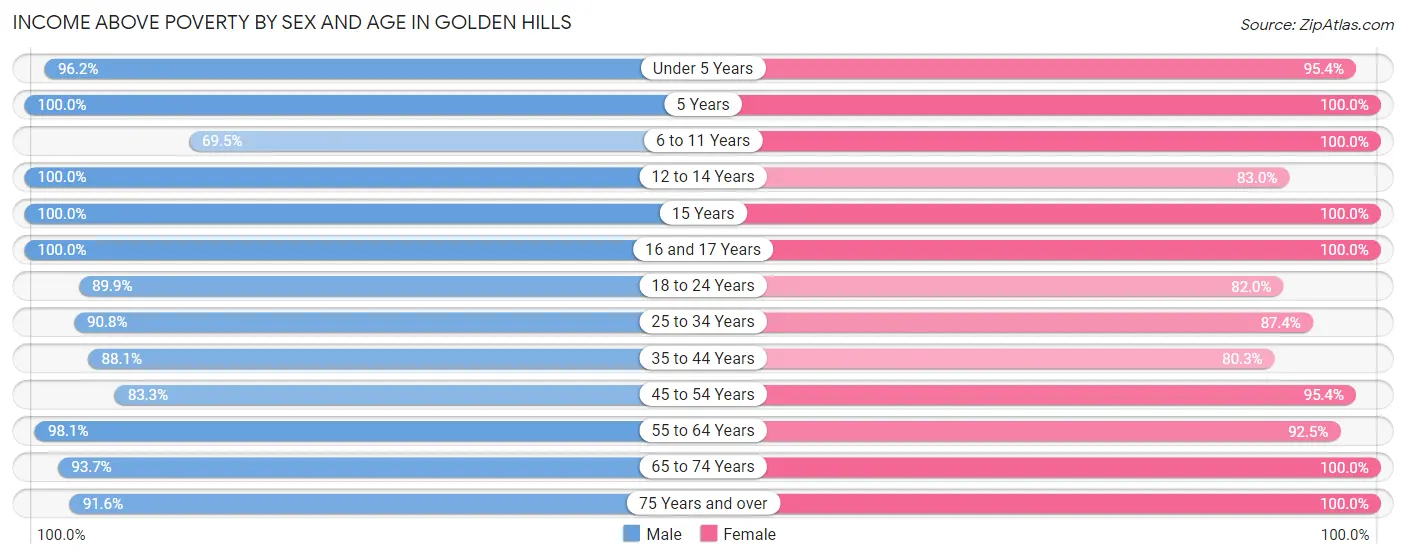
Income Above Poverty by Sex and Age in Golden Hills
According to the poverty statistics in Golden Hills, males aged 5 years and females aged 5 years are the age groups that are most secure financially, with 100.0% of males and 100.0% of females in these age groups living above the poverty line.
| Age Bracket | Male | Female |
| Under 5 Years | 381 (96.2%) | 269 (95.4%) |
| 5 Years | 56 (100.0%) | 113 (100.0%) |
| 6 to 11 Years | 407 (69.5%) | 344 (100.0%) |
| 12 to 14 Years | 185 (100.0%) | 137 (83.0%) |
| 15 Years | 47 (100.0%) | 8 (100.0%) |
| 16 and 17 Years | 40 (100.0%) | 63 (100.0%) |
| 18 to 24 Years | 249 (89.9%) | 436 (82.0%) |
| 25 to 34 Years | 821 (90.8%) | 444 (87.4%) |
| 35 to 44 Years | 511 (88.1%) | 383 (80.3%) |
| 45 to 54 Years | 328 (83.3%) | 456 (95.4%) |
| 55 to 64 Years | 506 (98.1%) | 777 (92.5%) |
| 65 to 74 Years | 806 (93.7%) | 649 (100.0%) |
| 75 Years and over | 218 (91.6%) | 351 (100.0%) |
| Total | 4,555 (89.7%) | 4,430 (92.1%) |
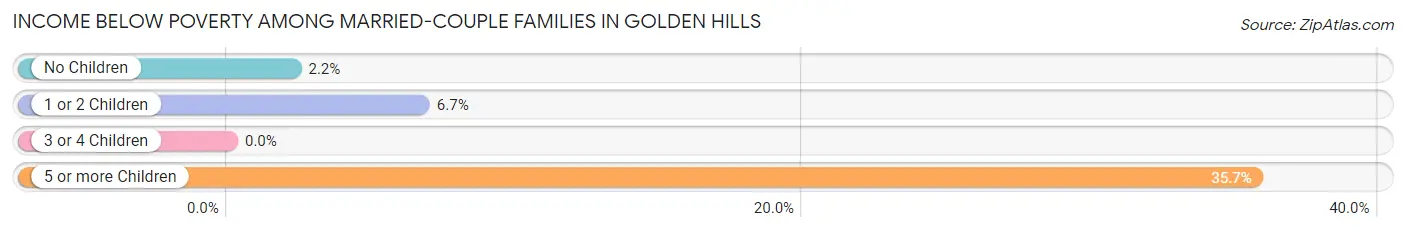
Income Below Poverty Among Married-Couple Families in Golden Hills
The poverty statistics for married-couple families in Golden Hills show that 4.0% or 81 of the total 2,036 families live below the poverty line. Families with 5 or more children have the highest poverty rate of 35.7%, comprising of 10 families. On the other hand, families with 3 or 4 children have the lowest poverty rate of 0.0%, which includes 0 families.
| Children | Above Poverty | Below Poverty |
| No Children | 1,193 (97.8%) | 27 (2.2%) |
| 1 or 2 Children | 615 (93.3%) | 44 (6.7%) |
| 3 or 4 Children | 129 (100.0%) | 0 (0.0%) |
| 5 or more Children | 18 (64.3%) | 10 (35.7%) |
| Total | 1,955 (96.0%) | 81 (4.0%) |
Income Below Poverty Among Single-Parent Households in Golden Hills
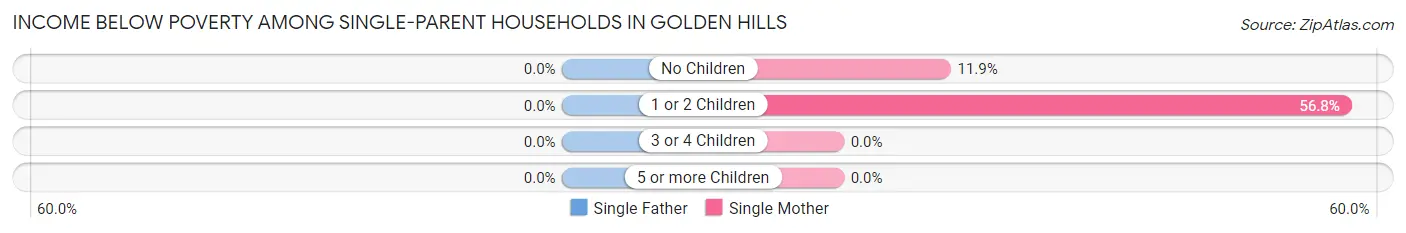
| Children | Single Father | Single Mother |
| No Children | 0 (0.0%) | 40 (11.9%) |
| 1 or 2 Children | 0 (0.0%) | 84 (56.8%) |
| 3 or 4 Children | 0 (0.0%) | 0 (0.0%) |
| 5 or more Children | 0 (0.0%) | 0 (0.0%) |
| Total | 0 (0.0%) | 124 (25.7%) |
Income Below Poverty Among Married-Couple vs Single-Parent Households in Golden Hills
The poverty data for Golden Hills shows that 81 of the married-couple family households (4.0%) and 124 of the single-parent households (18.3%) are living below the poverty level. Within the married-couple family households, those with 5 or more children have the highest poverty rate, with 10 households (35.7%) falling below the poverty line. Among the single-parent households, those with 1 or 2 children have the highest poverty rate, with 84 household (31.7%) living below poverty.
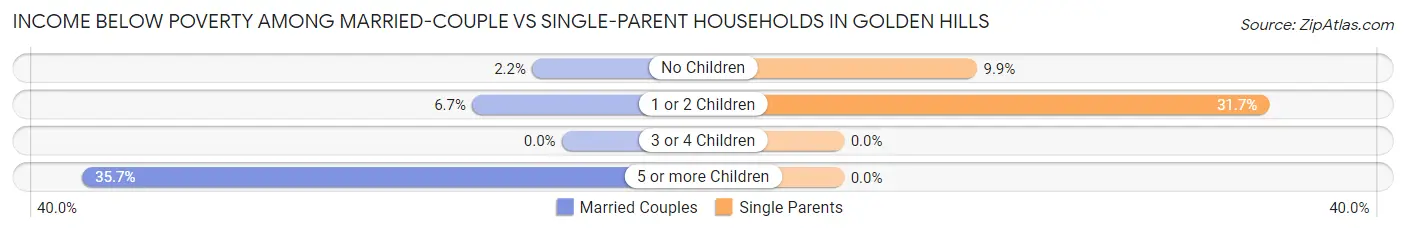
| Children | Married-Couple Families | Single-Parent Households |
| No Children | 27 (2.2%) | 40 (9.9%) |
| 1 or 2 Children | 44 (6.7%) | 84 (31.7%) |
| 3 or 4 Children | 0 (0.0%) | 0 (0.0%) |
| 5 or more Children | 10 (35.7%) | 0 (0.0%) |
| Total | 81 (4.0%) | 124 (18.3%) |
Employment Characteristics in Golden Hills
Employment by Class of Employer in Golden Hills
Among the 4,412 employed individuals in Golden Hills, private company employees (2,631 | 59.6%), local government employees (538 | 12.2%), and not-for-profit organizations (347 | 7.9%) make up the most common classes of employment.
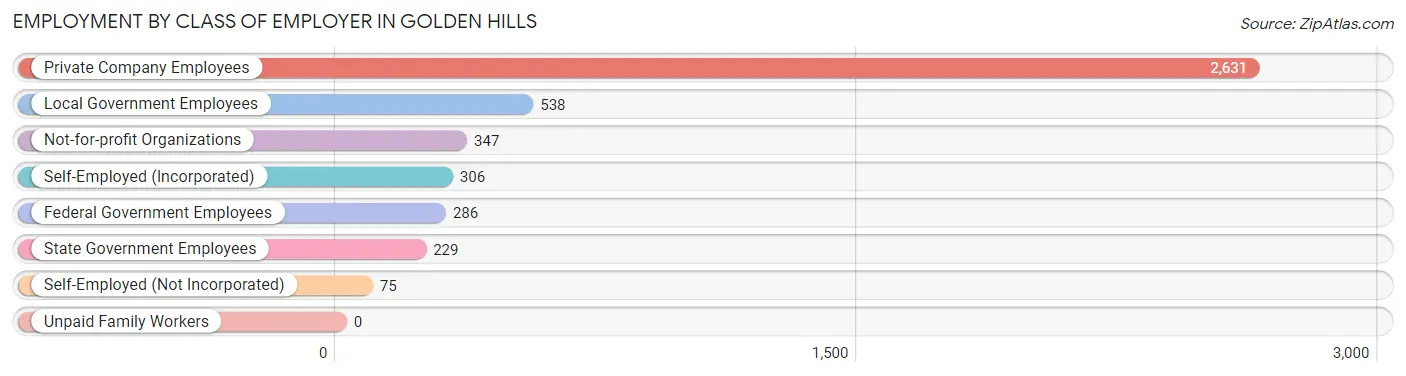
| Employer Class | # Employees | % Employees |
| Private Company Employees | 2,631 | 59.6% |
| Self-Employed (Incorporated) | 306 | 6.9% |
| Self-Employed (Not Incorporated) | 75 | 1.7% |
| Not-for-profit Organizations | 347 | 7.9% |
| Local Government Employees | 538 | 12.2% |
| State Government Employees | 229 | 5.2% |
| Federal Government Employees | 286 | 6.5% |
| Unpaid Family Workers | 0 | 0.0% |
| Total | 4,412 | 100.0% |
Employment Status by Age in Golden Hills
According to the labor force statistics for Golden Hills, out of the total population over 16 years of age (7,710), 63.1% or 4,865 individuals are in the labor force, with 6.4% or 311 of them unemployed. The age group with the highest labor force participation rate is 25 to 29 years, with 90.3% or 584 individuals in the labor force. Within the labor force, the 16 to 19 years age range has the highest percentage of unemployed individuals, with 20.1% or 46 of them being unemployed.
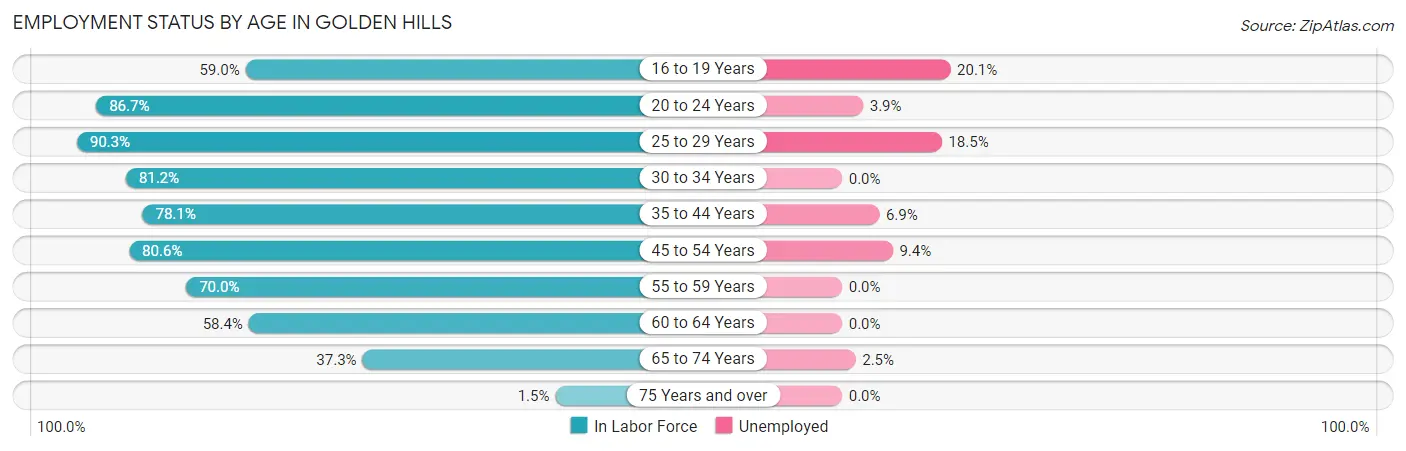
| Age Bracket | In Labor Force | Unemployed |
| 16 to 19 Years | 229 (59.0%) | 46 (20.1%) |
| 20 to 24 Years | 457 (86.7%) | 18 (3.9%) |
| 25 to 29 Years | 584 (90.3%) | 108 (18.5%) |
| 30 to 34 Years | 621 (81.2%) | 0 (0.0%) |
| 35 to 44 Years | 826 (78.1%) | 57 (6.9%) |
| 45 to 54 Years | 703 (80.6%) | 66 (9.4%) |
| 55 to 59 Years | 500 (70.0%) | 0 (0.0%) |
| 60 to 64 Years | 375 (58.4%) | 0 (0.0%) |
| 65 to 74 Years | 563 (37.3%) | 14 (2.5%) |
| 75 Years and over | 9 (1.5%) | 0 (0.0%) |
| Total | 4,865 (63.1%) | 311 (6.4%) |
Employment Status by Educational Attainment in Golden Hills
According to labor force statistics for Golden Hills, 76.8% of individuals (3,607) out of the total population between 25 and 64 years of age (4,697) are in the labor force, with 6.4% or 231 of them being unemployed. The group with the highest labor force participation rate are those with the educational attainment of bachelor's degree or higher, with 83.9% or 1,140 individuals in the labor force. Within the labor force, individuals with high school diploma education have the highest percentage of unemployment, with 18.0% or 196 of them being unemployed.
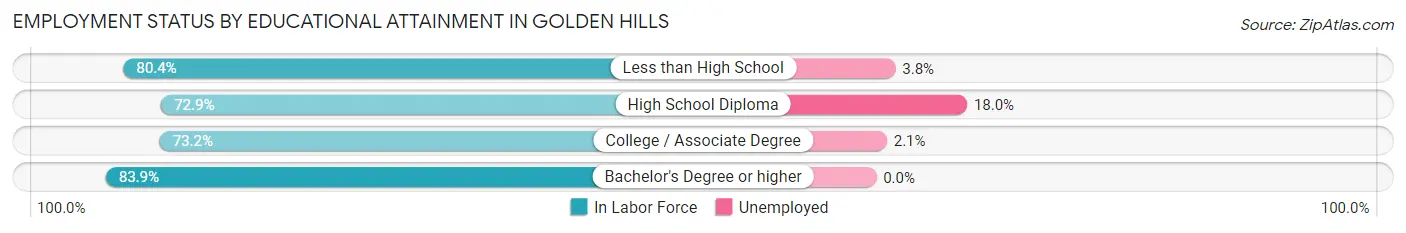
| Educational Attainment | In Labor Force | Unemployed |
| Less than High School | 312 (80.4%) | 15 (3.8%) |
| High School Diploma | 1,091 (72.9%) | 269 (18.0%) |
| College / Associate Degree | 1,064 (73.2%) | 31 (2.1%) |
| Bachelor's Degree or higher | 1,140 (83.9%) | 0 (0.0%) |
| Total | 3,607 (76.8%) | 301 (6.4%) |
Employment Occupations by Sex in Golden Hills
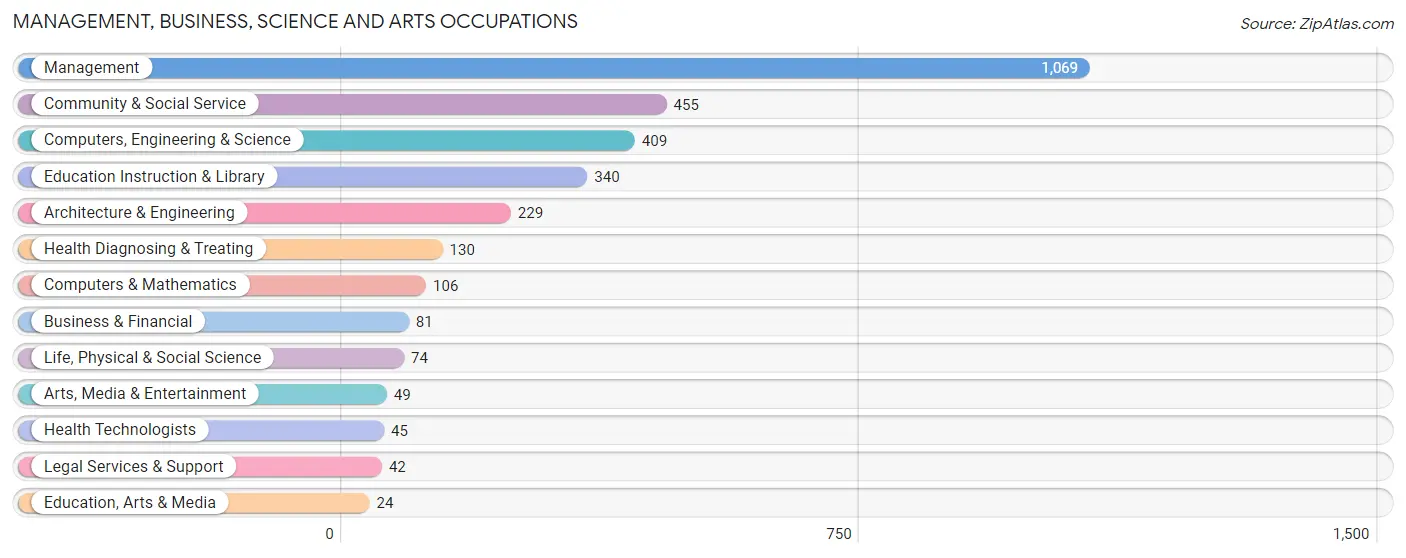
Management, Business, Science and Arts Occupations
The most common Management, Business, Science and Arts occupations in Golden Hills are Management (1,069 | 23.5%), Community & Social Service (455 | 10.0%), Computers, Engineering & Science (409 | 9.0%), Education Instruction & Library (340 | 7.5%), and Architecture & Engineering (229 | 5.0%).
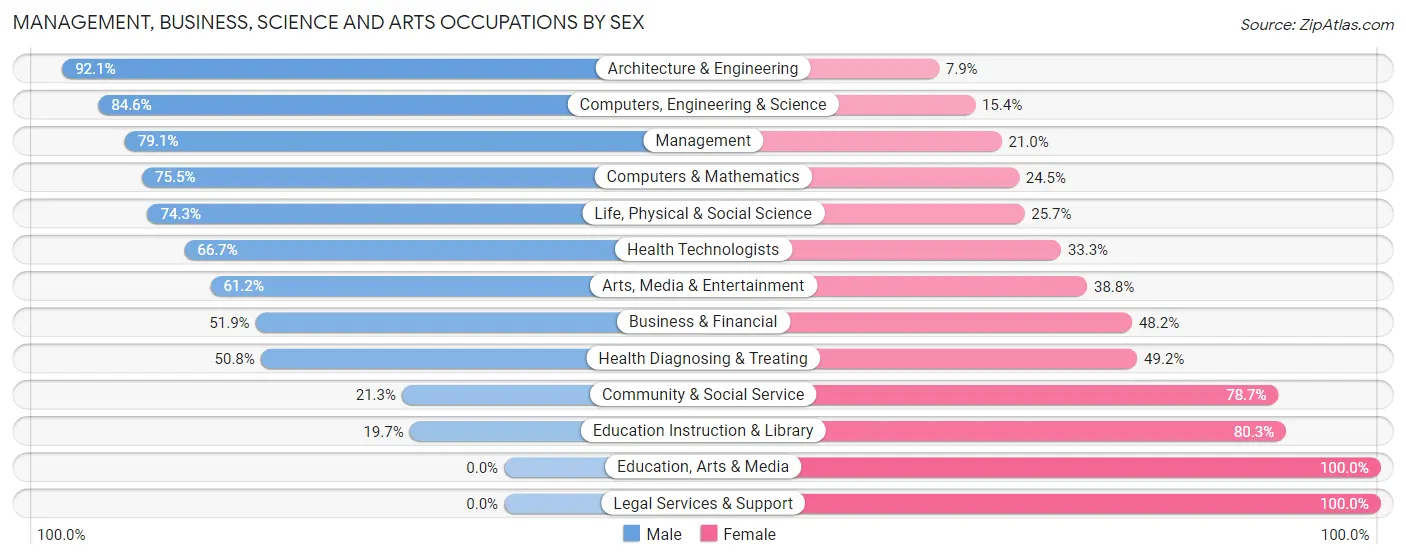
Management, Business, Science and Arts Occupations by Sex
Within the Management, Business, Science and Arts occupations in Golden Hills, the most male-oriented occupations are Architecture & Engineering (92.1%), Computers, Engineering & Science (84.6%), and Management (79.0%), while the most female-oriented occupations are Education, Arts & Media (100.0%), Legal Services & Support (100.0%), and Education Instruction & Library (80.3%).
| Occupation | Male | Female |
| Management | 845 (79.0%) | 224 (20.9%) |
| Business & Financial | 42 (51.8%) | 39 (48.1%) |
| Computers, Engineering & Science | 346 (84.6%) | 63 (15.4%) |
| Computers & Mathematics | 80 (75.5%) | 26 (24.5%) |
| Architecture & Engineering | 211 (92.1%) | 18 (7.9%) |
| Life, Physical & Social Science | 55 (74.3%) | 19 (25.7%) |
| Community & Social Service | 97 (21.3%) | 358 (78.7%) |
| Education, Arts & Media | 0 (0.0%) | 24 (100.0%) |
| Legal Services & Support | 0 (0.0%) | 42 (100.0%) |
| Education Instruction & Library | 67 (19.7%) | 273 (80.3%) |
| Arts, Media & Entertainment | 30 (61.2%) | 19 (38.8%) |
| Health Diagnosing & Treating | 66 (50.8%) | 64 (49.2%) |
| Health Technologists | 30 (66.7%) | 15 (33.3%) |
| Total (Category) | 1,396 (65.1%) | 748 (34.9%) |
| Total (Overall) | 2,567 (56.3%) | 1,990 (43.7%) |
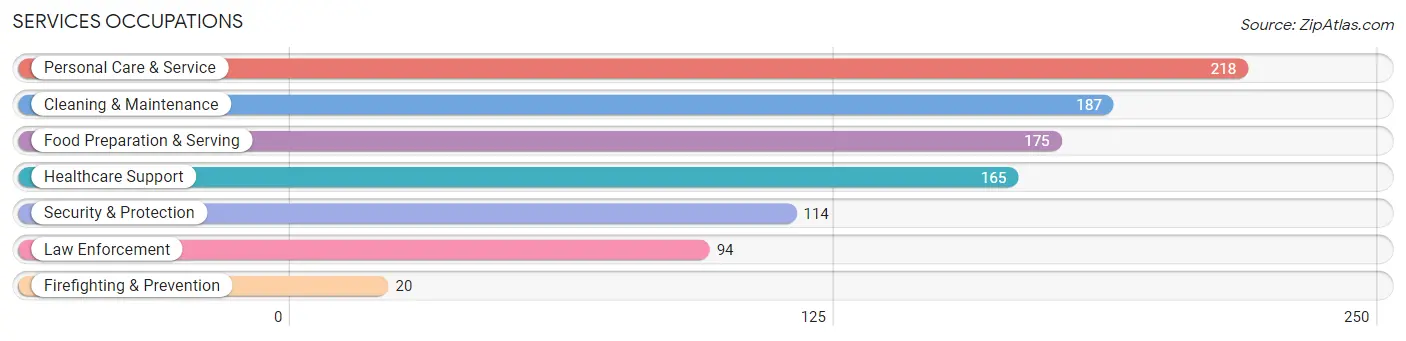
Services Occupations
The most common Services occupations in Golden Hills are Personal Care & Service (218 | 4.8%), Cleaning & Maintenance (187 | 4.1%), Food Preparation & Serving (175 | 3.8%), Healthcare Support (165 | 3.6%), and Security & Protection (114 | 2.5%).
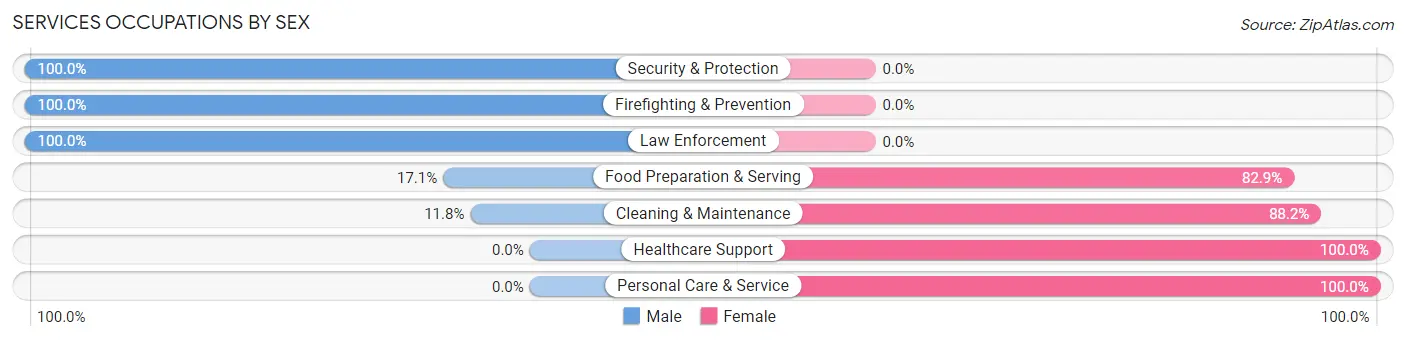
Services Occupations by Sex
Within the Services occupations in Golden Hills, the most male-oriented occupations are Security & Protection (100.0%), Firefighting & Prevention (100.0%), and Law Enforcement (100.0%), while the most female-oriented occupations are Healthcare Support (100.0%), Personal Care & Service (100.0%), and Cleaning & Maintenance (88.2%).
| Occupation | Male | Female |
| Healthcare Support | 0 (0.0%) | 165 (100.0%) |
| Security & Protection | 114 (100.0%) | 0 (0.0%) |
| Firefighting & Prevention | 20 (100.0%) | 0 (0.0%) |
| Law Enforcement | 94 (100.0%) | 0 (0.0%) |
| Food Preparation & Serving | 30 (17.1%) | 145 (82.9%) |
| Cleaning & Maintenance | 22 (11.8%) | 165 (88.2%) |
| Personal Care & Service | 0 (0.0%) | 218 (100.0%) |
| Total (Category) | 166 (19.3%) | 693 (80.7%) |
| Total (Overall) | 2,567 (56.3%) | 1,990 (43.7%) |
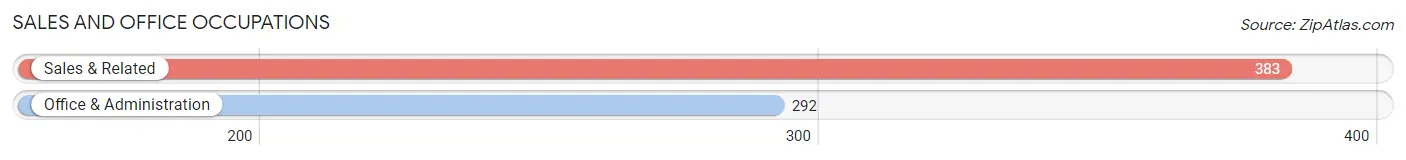
Sales and Office Occupations
The most common Sales and Office occupations in Golden Hills are Sales & Related (383 | 8.4%), and Office & Administration (292 | 6.4%).
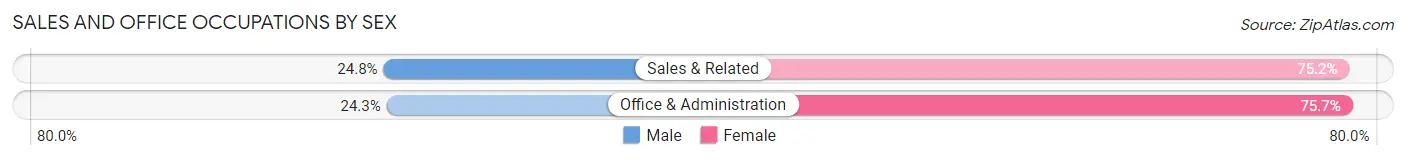
Sales and Office Occupations by Sex
| Occupation | Male | Female |
| Sales & Related | 95 (24.8%) | 288 (75.2%) |
| Office & Administration | 71 (24.3%) | 221 (75.7%) |
| Total (Category) | 166 (24.6%) | 509 (75.4%) |
| Total (Overall) | 2,567 (56.3%) | 1,990 (43.7%) |
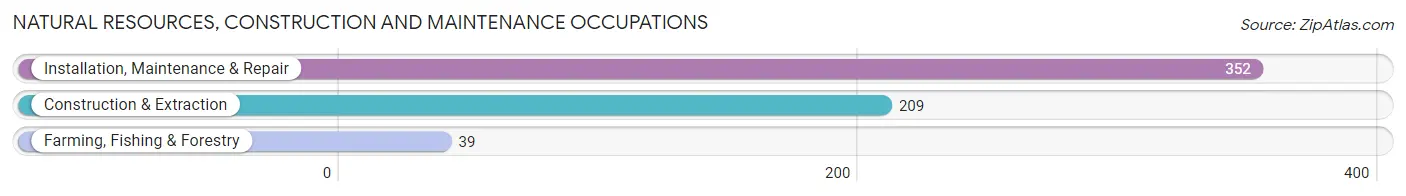
Natural Resources, Construction and Maintenance Occupations
The most common Natural Resources, Construction and Maintenance occupations in Golden Hills are Installation, Maintenance & Repair (352 | 7.7%), Construction & Extraction (209 | 4.6%), and Farming, Fishing & Forestry (39 | 0.9%).
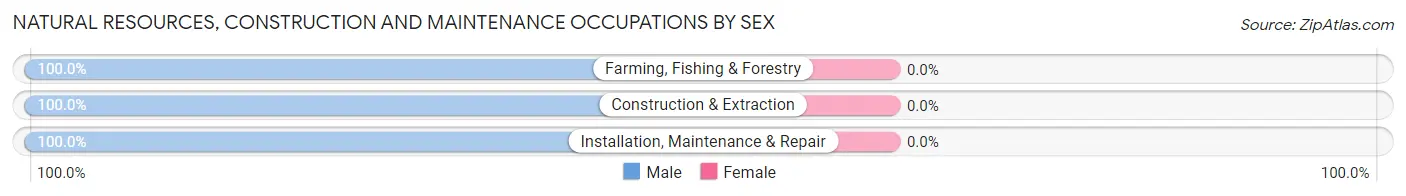
Natural Resources, Construction and Maintenance Occupations by Sex
| Occupation | Male | Female |
| Farming, Fishing & Forestry | 39 (100.0%) | 0 (0.0%) |
| Construction & Extraction | 209 (100.0%) | 0 (0.0%) |
| Installation, Maintenance & Repair | 352 (100.0%) | 0 (0.0%) |
| Total (Category) | 600 (100.0%) | 0 (0.0%) |
| Total (Overall) | 2,567 (56.3%) | 1,990 (43.7%) |
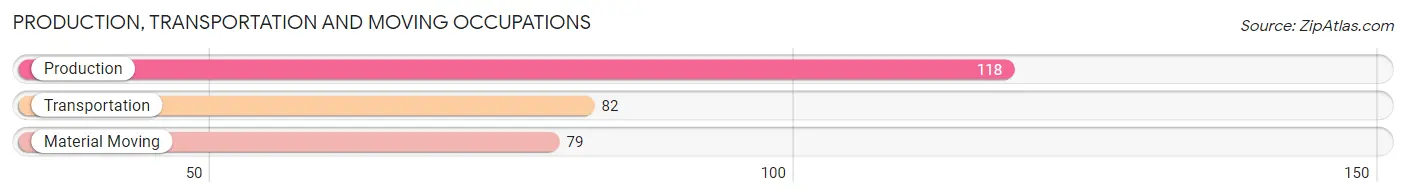
Production, Transportation and Moving Occupations
The most common Production, Transportation and Moving occupations in Golden Hills are Production (118 | 2.6%), Transportation (82 | 1.8%), and Material Moving (79 | 1.7%).
Production, Transportation and Moving Occupations by Sex
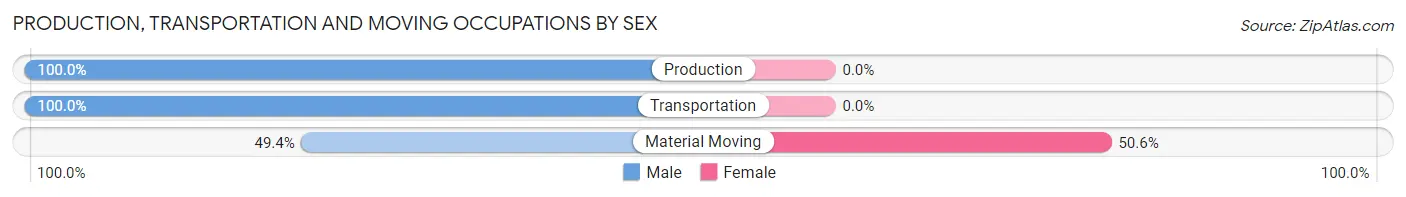
| Occupation | Male | Female |
| Production | 118 (100.0%) | 0 (0.0%) |
| Transportation | 82 (100.0%) | 0 (0.0%) |
| Material Moving | 39 (49.4%) | 40 (50.6%) |
| Total (Category) | 239 (85.7%) | 40 (14.3%) |
| Total (Overall) | 2,567 (56.3%) | 1,990 (43.7%) |
Employment Industries by Sex in Golden Hills
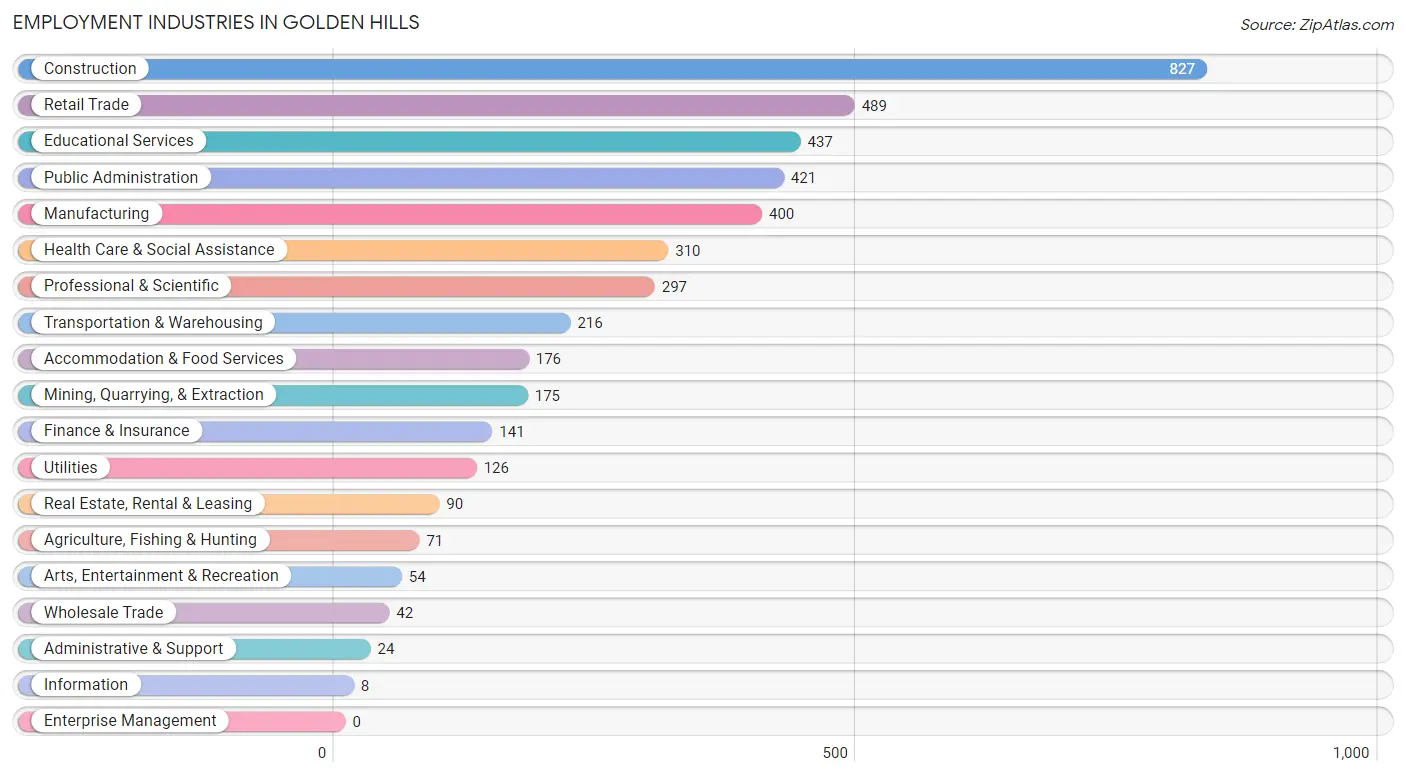
Employment Industries in Golden Hills
The major employment industries in Golden Hills include Construction (827 | 18.1%), Retail Trade (489 | 10.7%), Educational Services (437 | 9.6%), Public Administration (421 | 9.2%), and Manufacturing (400 | 8.8%).
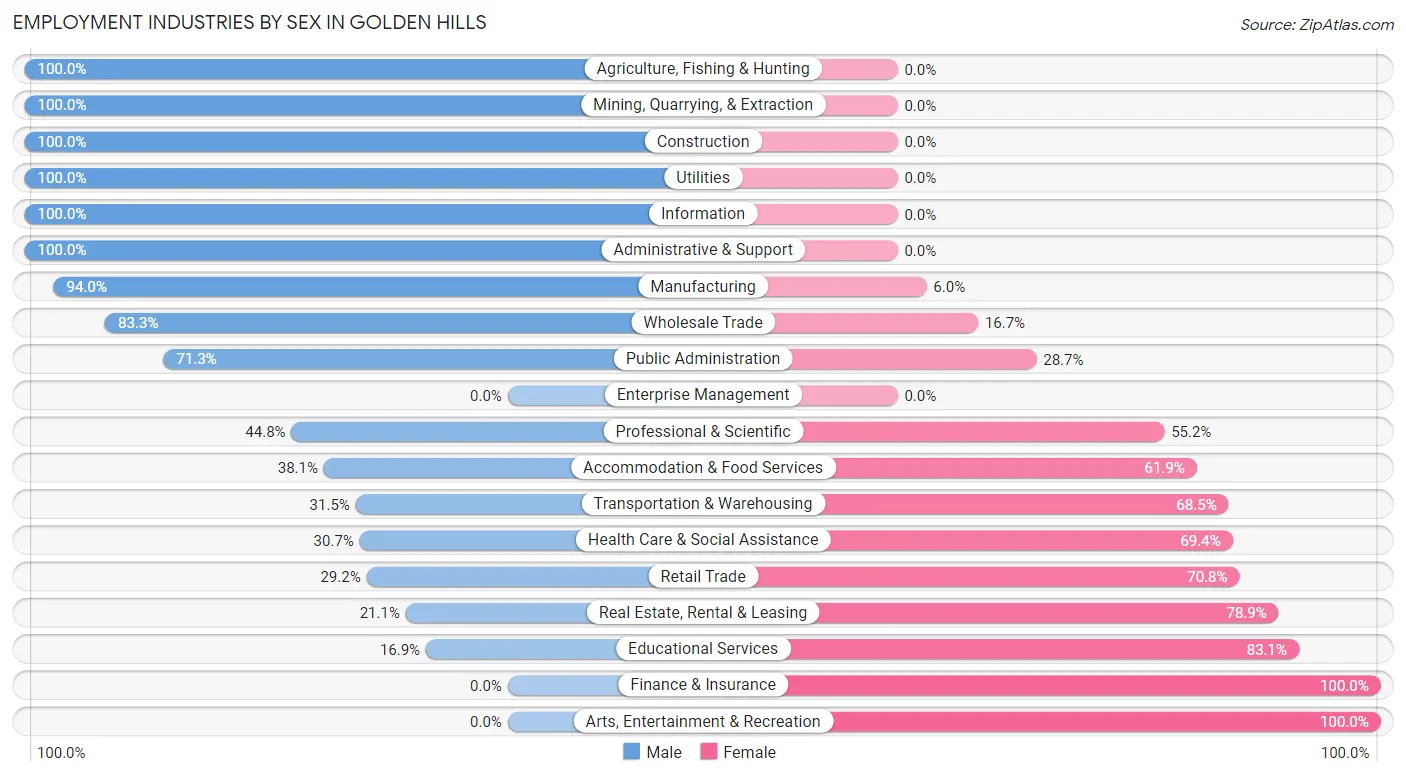
Employment Industries by Sex in Golden Hills
The Golden Hills industries that see more men than women are Agriculture, Fishing & Hunting (100.0%), Mining, Quarrying, & Extraction (100.0%), and Construction (100.0%), whereas the industries that tend to have a higher number of women are Finance & Insurance (100.0%), Arts, Entertainment & Recreation (100.0%), and Educational Services (83.1%).
| Industry | Male | Female |
| Agriculture, Fishing & Hunting | 71 (100.0%) | 0 (0.0%) |
| Mining, Quarrying, & Extraction | 175 (100.0%) | 0 (0.0%) |
| Construction | 827 (100.0%) | 0 (0.0%) |
| Manufacturing | 376 (94.0%) | 24 (6.0%) |
| Wholesale Trade | 35 (83.3%) | 7 (16.7%) |
| Retail Trade | 143 (29.2%) | 346 (70.8%) |
| Transportation & Warehousing | 68 (31.5%) | 148 (68.5%) |
| Utilities | 126 (100.0%) | 0 (0.0%) |
| Information | 8 (100.0%) | 0 (0.0%) |
| Finance & Insurance | 0 (0.0%) | 141 (100.0%) |
| Real Estate, Rental & Leasing | 19 (21.1%) | 71 (78.9%) |
| Professional & Scientific | 133 (44.8%) | 164 (55.2%) |
| Enterprise Management | 0 (0.0%) | 0 (0.0%) |
| Administrative & Support | 24 (100.0%) | 0 (0.0%) |
| Educational Services | 74 (16.9%) | 363 (83.1%) |
| Health Care & Social Assistance | 95 (30.6%) | 215 (69.4%) |
| Arts, Entertainment & Recreation | 0 (0.0%) | 54 (100.0%) |
| Accommodation & Food Services | 67 (38.1%) | 109 (61.9%) |
| Public Administration | 300 (71.3%) | 121 (28.7%) |
| Total | 2,567 (56.3%) | 1,990 (43.7%) |
Education in Golden Hills
School Enrollment in Golden Hills
The most common levels of schooling among the 2,374 students in Golden Hills are elementary school (609 | 25.7%), middle school (546 | 23.0%), and college / undergraduate (492 | 20.7%).
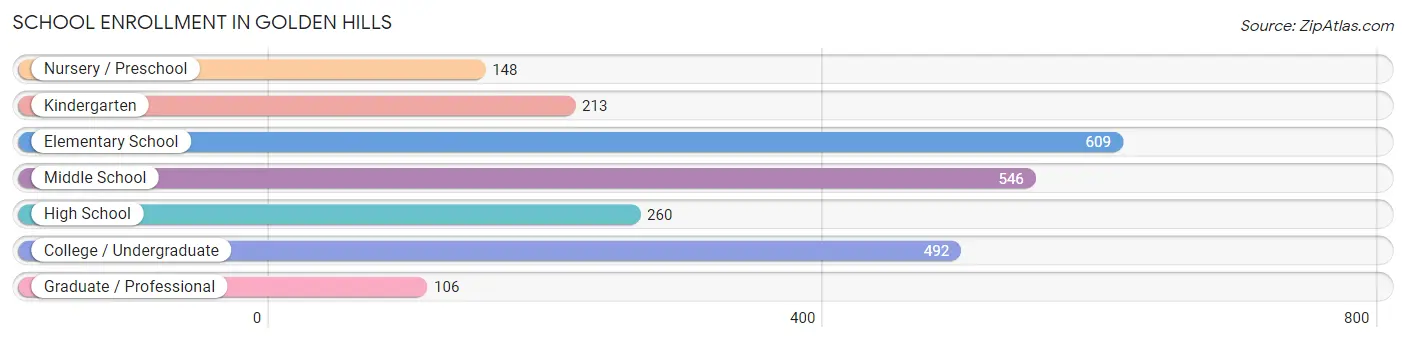
| School Level | # Students | % Students |
| Nursery / Preschool | 148 | 6.2% |
| Kindergarten | 213 | 9.0% |
| Elementary School | 609 | 25.7% |
| Middle School | 546 | 23.0% |
| High School | 260 | 11.0% |
| College / Undergraduate | 492 | 20.7% |
| Graduate / Professional | 106 | 4.5% |
| Total | 2,374 | 100.0% |
School Enrollment by Age by Funding Source in Golden Hills
Out of a total of 2,374 students who are enrolled in schools in Golden Hills, 463 (19.5%) attend a private institution, while the remaining 1,911 (80.5%) are enrolled in public schools. The age group of 3 to 4 year olds has the highest likelihood of being enrolled in private schools, with 65 (61.3% in the age bracket) enrolled. Conversely, the age group of 15 to 17 year olds has the lowest likelihood of being enrolled in a private school, with 160 (100.0% in the age bracket) attending a public institution.
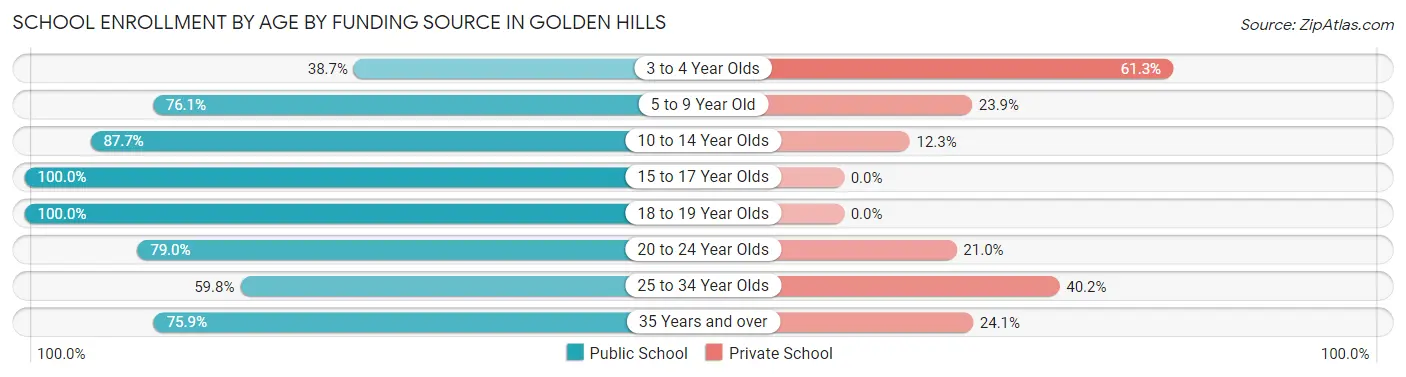
| Age Bracket | Public School | Private School |
| 3 to 4 Year Olds | 41 (38.7%) | 65 (61.3%) |
| 5 to 9 Year Old | 529 (76.1%) | 166 (23.9%) |
| 10 to 14 Year Olds | 658 (87.7%) | 92 (12.3%) |
| 15 to 17 Year Olds | 160 (100.0%) | 0 (0.0%) |
| 18 to 19 Year Olds | 127 (100.0%) | 0 (0.0%) |
| 20 to 24 Year Olds | 222 (79.0%) | 59 (21.0%) |
| 25 to 34 Year Olds | 73 (59.8%) | 49 (40.2%) |
| 35 Years and over | 101 (75.9%) | 32 (24.1%) |
| Total | 1,911 (80.5%) | 463 (19.5%) |
Educational Attainment by Field of Study in Golden Hills
Social sciences (247 | 13.9%), business (222 | 12.5%), bio, nature & agricultural (199 | 11.2%), engineering (165 | 9.3%), and arts & humanities (146 | 8.2%) are the most common fields of study among 1,775 individuals in Golden Hills who have obtained a bachelor's degree or higher.
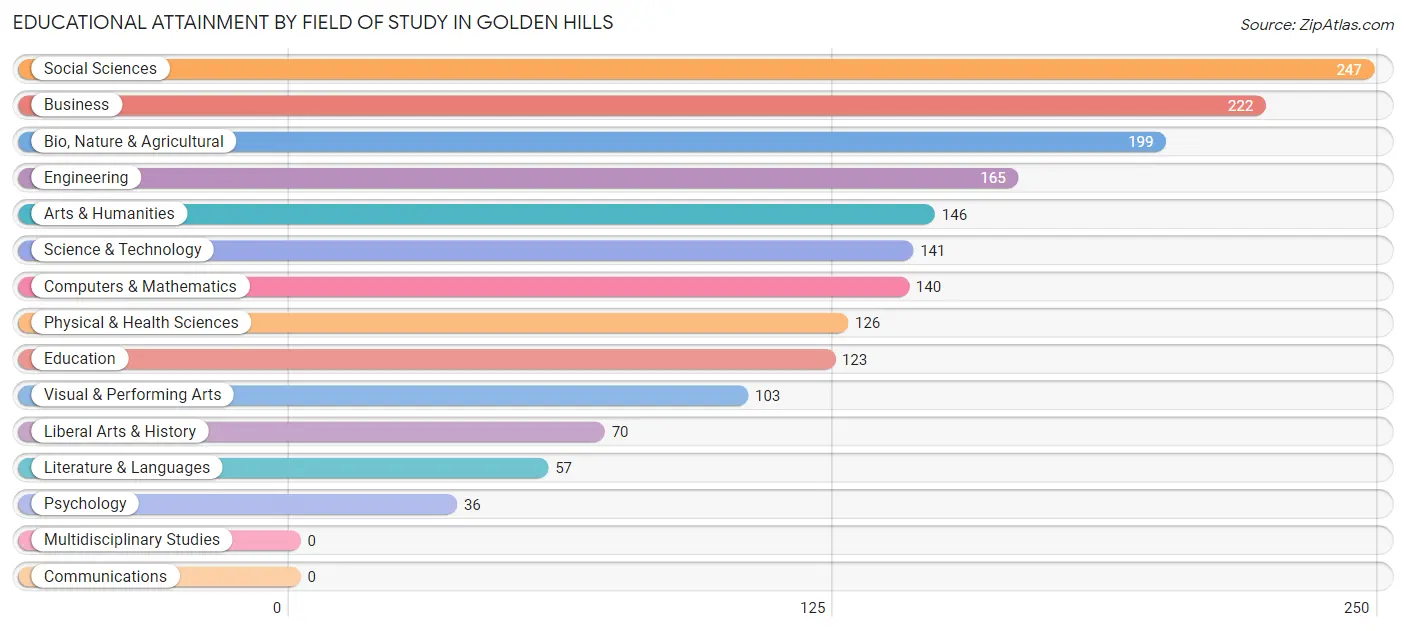
| Field of Study | # Graduates | % Graduates |
| Computers & Mathematics | 140 | 7.9% |
| Bio, Nature & Agricultural | 199 | 11.2% |
| Physical & Health Sciences | 126 | 7.1% |
| Psychology | 36 | 2.0% |
| Social Sciences | 247 | 13.9% |
| Engineering | 165 | 9.3% |
| Multidisciplinary Studies | 0 | 0.0% |
| Science & Technology | 141 | 7.9% |
| Business | 222 | 12.5% |
| Education | 123 | 6.9% |
| Literature & Languages | 57 | 3.2% |
| Liberal Arts & History | 70 | 3.9% |
| Visual & Performing Arts | 103 | 5.8% |
| Communications | 0 | 0.0% |
| Arts & Humanities | 146 | 8.2% |
| Total | 1,775 | 100.0% |
Transportation & Commute in Golden Hills
Vehicle Availability by Sex in Golden Hills
The most prevalent vehicle ownership categories in Golden Hills are males with 2 vehicles (740, accounting for 30.5%) and females with 2 vehicles (778, making up 37.3%).
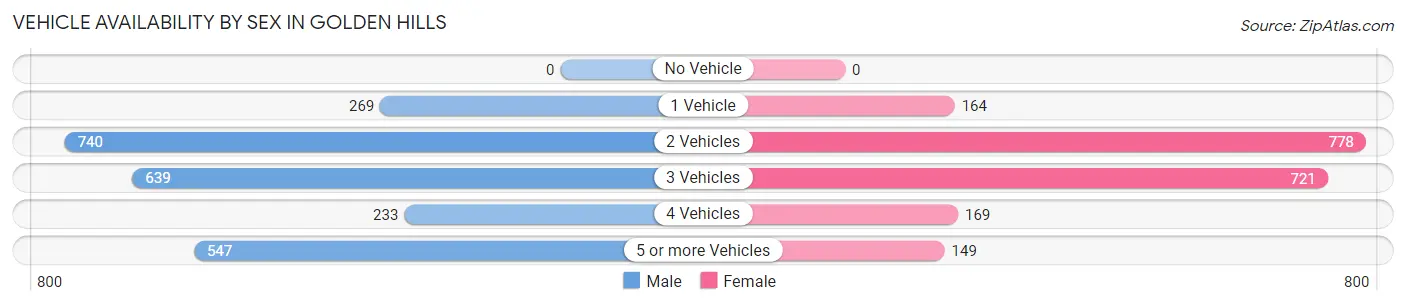
| Vehicles Available | Male | Female |
| No Vehicle | 0 (0.0%) | 0 (0.0%) |
| 1 Vehicle | 269 (11.1%) | 164 (8.3%) |
| 2 Vehicles | 740 (30.5%) | 778 (39.3%) |
| 3 Vehicles | 639 (26.3%) | 721 (36.4%) |
| 4 Vehicles | 233 (9.6%) | 169 (8.5%) |
| 5 or more Vehicles | 547 (22.5%) | 149 (7.5%) |
| Total | 2,428 (100.0%) | 1,981 (100.0%) |
Commute Time in Golden Hills
The most frequently occuring commute durations in Golden Hills are 5 to 9 minutes (795 commuters, 19.7%), 10 to 14 minutes (634 commuters, 15.7%), and 45 to 59 minutes (578 commuters, 14.3%).
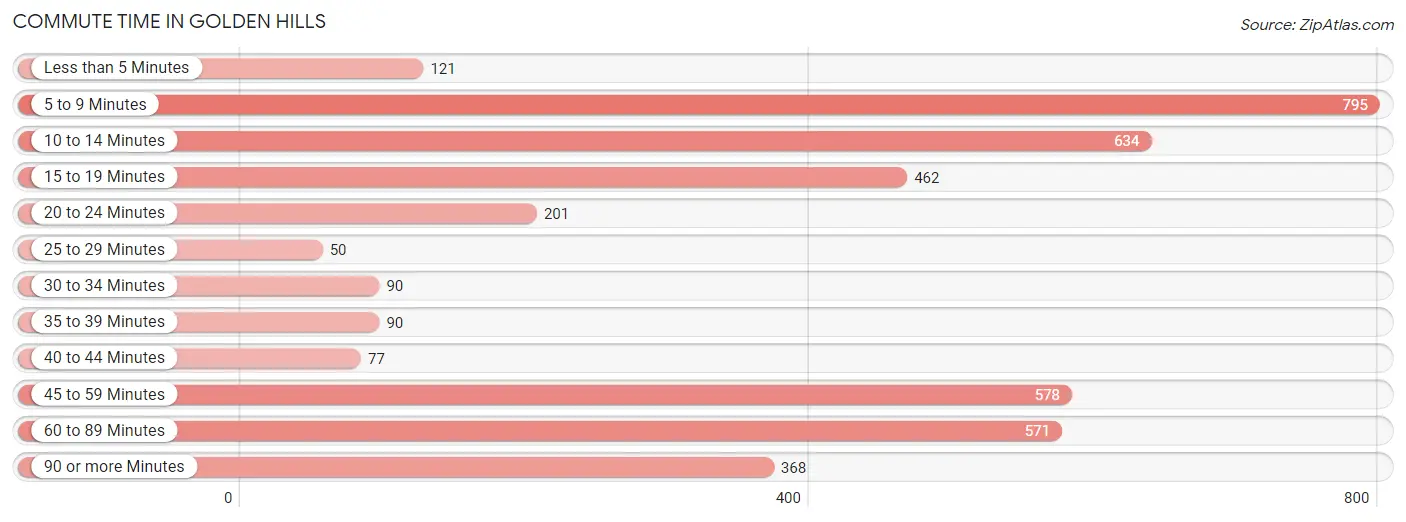
| Commute Time | # Commuters | % Commuters |
| Less than 5 Minutes | 121 | 3.0% |
| 5 to 9 Minutes | 795 | 19.7% |
| 10 to 14 Minutes | 634 | 15.7% |
| 15 to 19 Minutes | 462 | 11.4% |
| 20 to 24 Minutes | 201 | 5.0% |
| 25 to 29 Minutes | 50 | 1.2% |
| 30 to 34 Minutes | 90 | 2.2% |
| 35 to 39 Minutes | 90 | 2.2% |
| 40 to 44 Minutes | 77 | 1.9% |
| 45 to 59 Minutes | 578 | 14.3% |
| 60 to 89 Minutes | 571 | 14.1% |
| 90 or more Minutes | 368 | 9.1% |
Commute Time by Sex in Golden Hills
The most common commute times in Golden Hills are 60 to 89 minutes (517 commuters, 23.3%) for males and 10 to 14 minutes (541 commuters, 29.8%) for females.
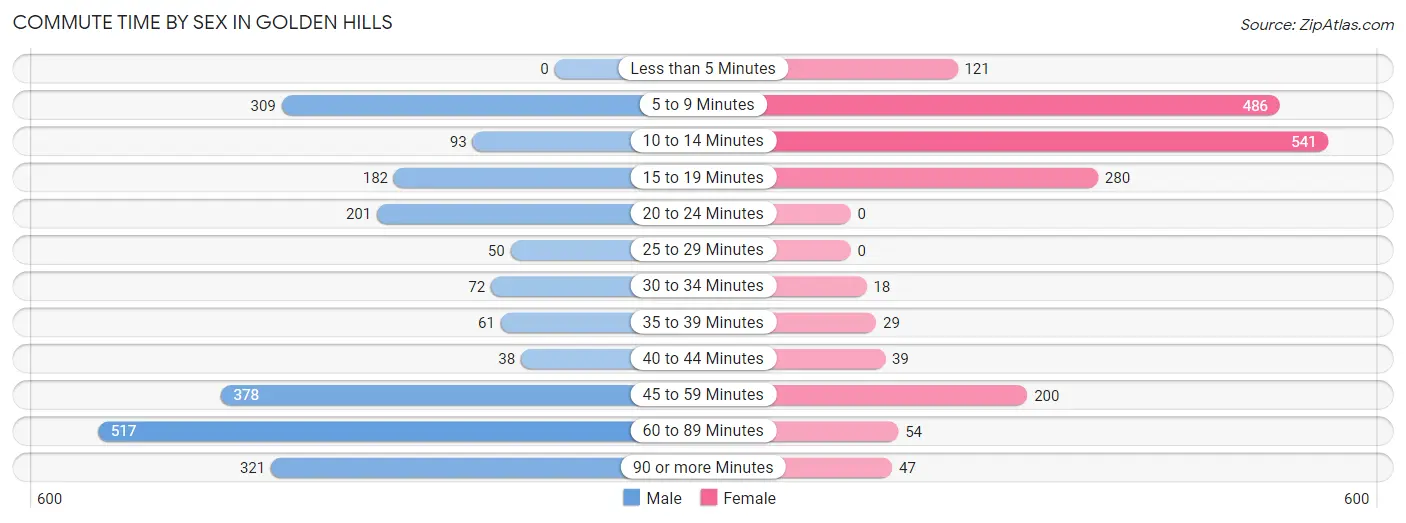
| Commute Time | Male | Female |
| Less than 5 Minutes | 0 (0.0%) | 121 (6.7%) |
| 5 to 9 Minutes | 309 (13.9%) | 486 (26.8%) |
| 10 to 14 Minutes | 93 (4.2%) | 541 (29.8%) |
| 15 to 19 Minutes | 182 (8.2%) | 280 (15.4%) |
| 20 to 24 Minutes | 201 (9.0%) | 0 (0.0%) |
| 25 to 29 Minutes | 50 (2.2%) | 0 (0.0%) |
| 30 to 34 Minutes | 72 (3.2%) | 18 (1.0%) |
| 35 to 39 Minutes | 61 (2.8%) | 29 (1.6%) |
| 40 to 44 Minutes | 38 (1.7%) | 39 (2.1%) |
| 45 to 59 Minutes | 378 (17.0%) | 200 (11.0%) |
| 60 to 89 Minutes | 517 (23.3%) | 54 (3.0%) |
| 90 or more Minutes | 321 (14.4%) | 47 (2.6%) |
Time of Departure to Work by Sex in Golden Hills
The most frequent times of departure to work in Golden Hills are 12:00 AM to 4:59 AM (566, 25.5%) for males and 8:00 AM to 8:29 AM (383, 21.1%) for females.
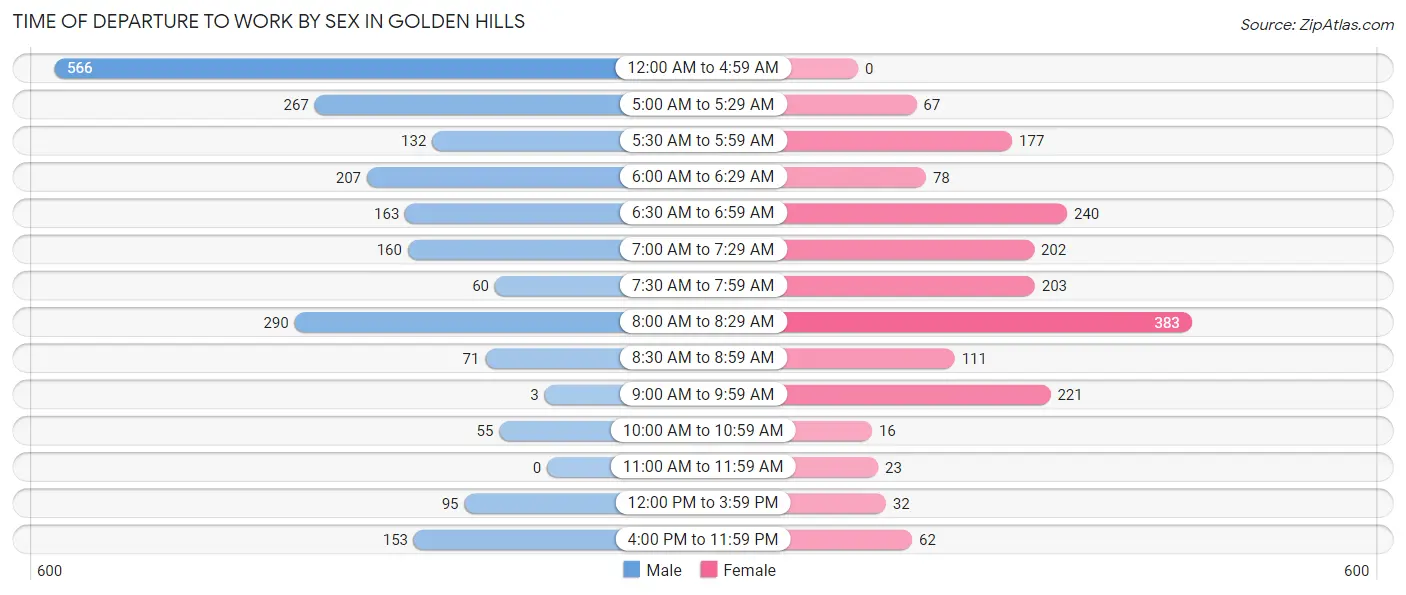
| Time of Departure | Male | Female |
| 12:00 AM to 4:59 AM | 566 (25.5%) | 0 (0.0%) |
| 5:00 AM to 5:29 AM | 267 (12.0%) | 67 (3.7%) |
| 5:30 AM to 5:59 AM | 132 (5.9%) | 177 (9.8%) |
| 6:00 AM to 6:29 AM | 207 (9.3%) | 78 (4.3%) |
| 6:30 AM to 6:59 AM | 163 (7.3%) | 240 (13.2%) |
| 7:00 AM to 7:29 AM | 160 (7.2%) | 202 (11.1%) |
| 7:30 AM to 7:59 AM | 60 (2.7%) | 203 (11.2%) |
| 8:00 AM to 8:29 AM | 290 (13.1%) | 383 (21.1%) |
| 8:30 AM to 8:59 AM | 71 (3.2%) | 111 (6.1%) |
| 9:00 AM to 9:59 AM | 3 (0.1%) | 221 (12.2%) |
| 10:00 AM to 10:59 AM | 55 (2.5%) | 16 (0.9%) |
| 11:00 AM to 11:59 AM | 0 (0.0%) | 23 (1.3%) |
| 12:00 PM to 3:59 PM | 95 (4.3%) | 32 (1.8%) |
| 4:00 PM to 11:59 PM | 153 (6.9%) | 62 (3.4%) |
| Total | 2,222 (100.0%) | 1,815 (100.0%) |
Housing Occupancy in Golden Hills
Occupancy by Ownership in Golden Hills
Of the total 3,657 dwellings in Golden Hills, owner-occupied units account for 2,952 (80.7%), while renter-occupied units make up 705 (19.3%).
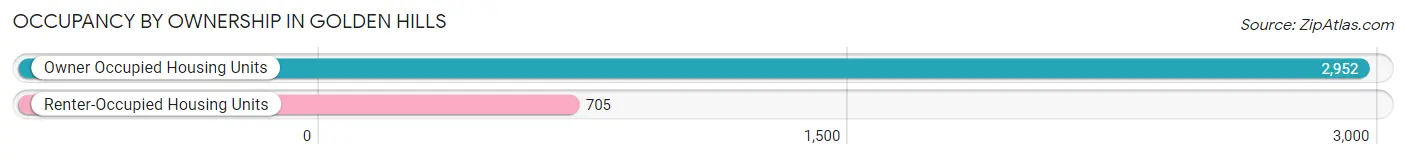
| Occupancy | # Housing Units | % Housing Units |
| Owner Occupied Housing Units | 2,952 | 80.7% |
| Renter-Occupied Housing Units | 705 | 19.3% |
| Total Occupied Housing Units | 3,657 | 100.0% |
Occupancy by Household Size in Golden Hills
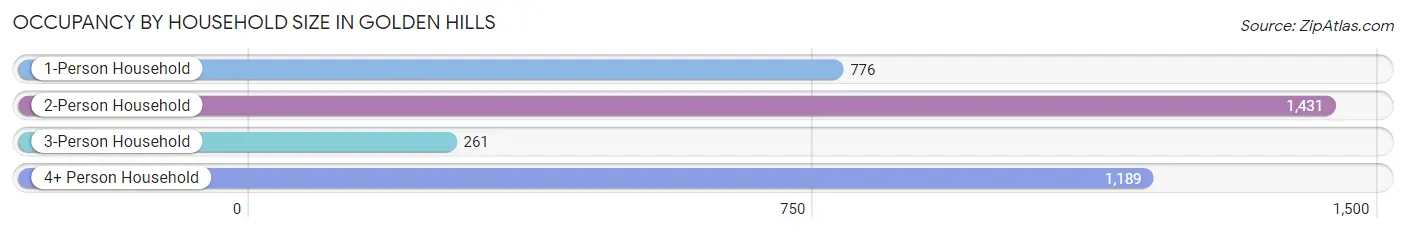
| Household Size | # Housing Units | % Housing Units |
| 1-Person Household | 776 | 21.2% |
| 2-Person Household | 1,431 | 39.1% |
| 3-Person Household | 261 | 7.1% |
| 4+ Person Household | 1,189 | 32.5% |
| Total Housing Units | 3,657 | 100.0% |
Occupancy by Ownership by Household Size in Golden Hills
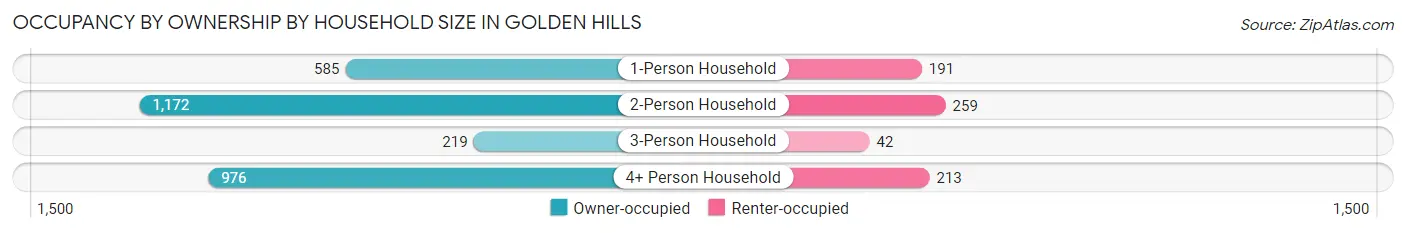
| Household Size | Owner-occupied | Renter-occupied |
| 1-Person Household | 585 (75.4%) | 191 (24.6%) |
| 2-Person Household | 1,172 (81.9%) | 259 (18.1%) |
| 3-Person Household | 219 (83.9%) | 42 (16.1%) |
| 4+ Person Household | 976 (82.1%) | 213 (17.9%) |
| Total Housing Units | 2,952 (80.7%) | 705 (19.3%) |
Occupancy by Educational Attainment in Golden Hills
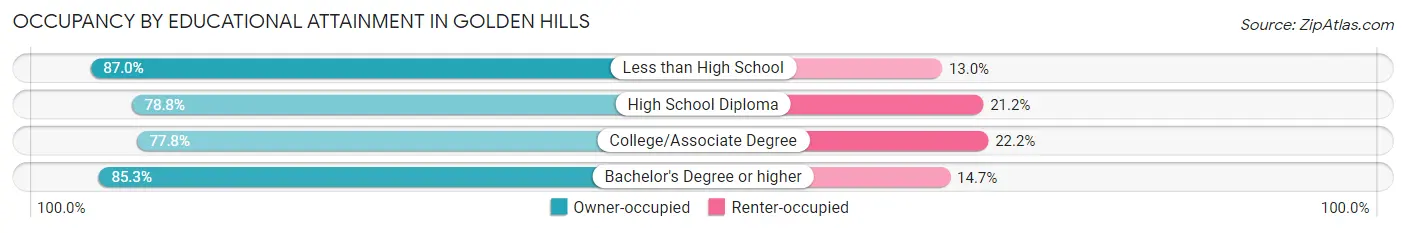
| Household Size | Owner-occupied | Renter-occupied |
| Less than High School | 260 (87.0%) | 39 (13.0%) |
| High School Diploma | 609 (78.8%) | 164 (21.2%) |
| College/Associate Degree | 1,268 (77.8%) | 362 (22.2%) |
| Bachelor's Degree or higher | 815 (85.3%) | 140 (14.7%) |
Occupancy by Age of Householder in Golden Hills
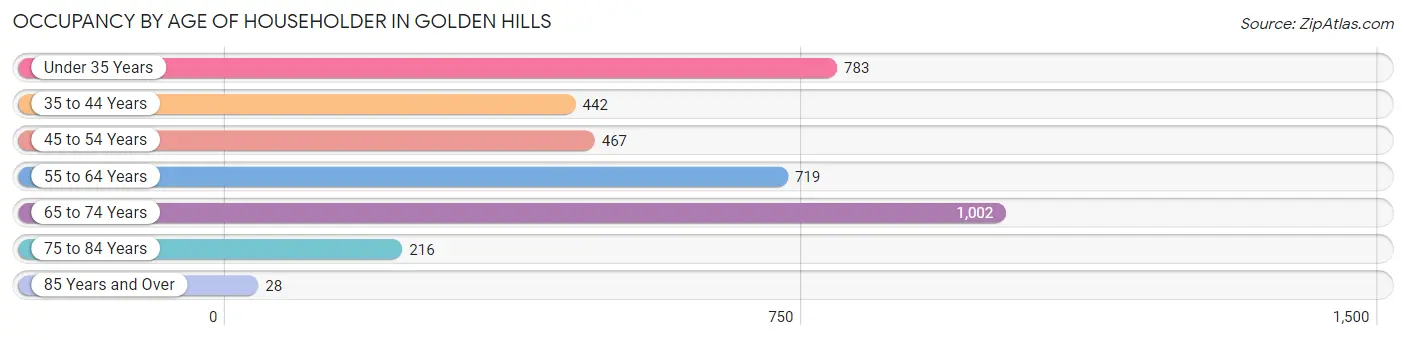
| Age Bracket | # Households | % Households |
| Under 35 Years | 783 | 21.4% |
| 35 to 44 Years | 442 | 12.1% |
| 45 to 54 Years | 467 | 12.8% |
| 55 to 64 Years | 719 | 19.7% |
| 65 to 74 Years | 1,002 | 27.4% |
| 75 to 84 Years | 216 | 5.9% |
| 85 Years and Over | 28 | 0.8% |
| Total | 3,657 | 100.0% |
Housing Finances in Golden Hills
Median Income by Occupancy in Golden Hills
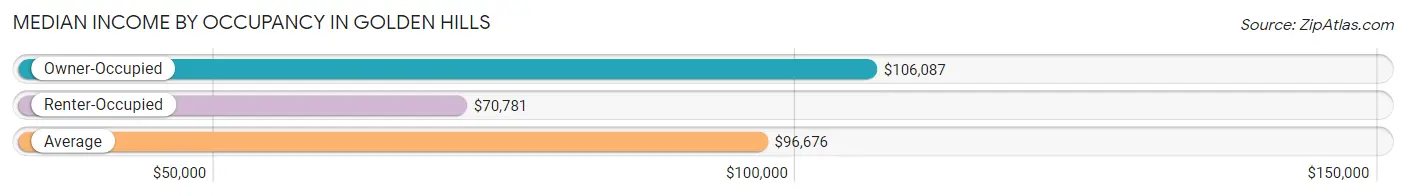
| Occupancy Type | # Households | Median Income |
| Owner-Occupied | 2,952 (80.7%) | $106,087 |
| Renter-Occupied | 705 (19.3%) | $70,781 |
| Average | 3,657 (100.0%) | $96,676 |
Occupancy by Householder Income Bracket in Golden Hills
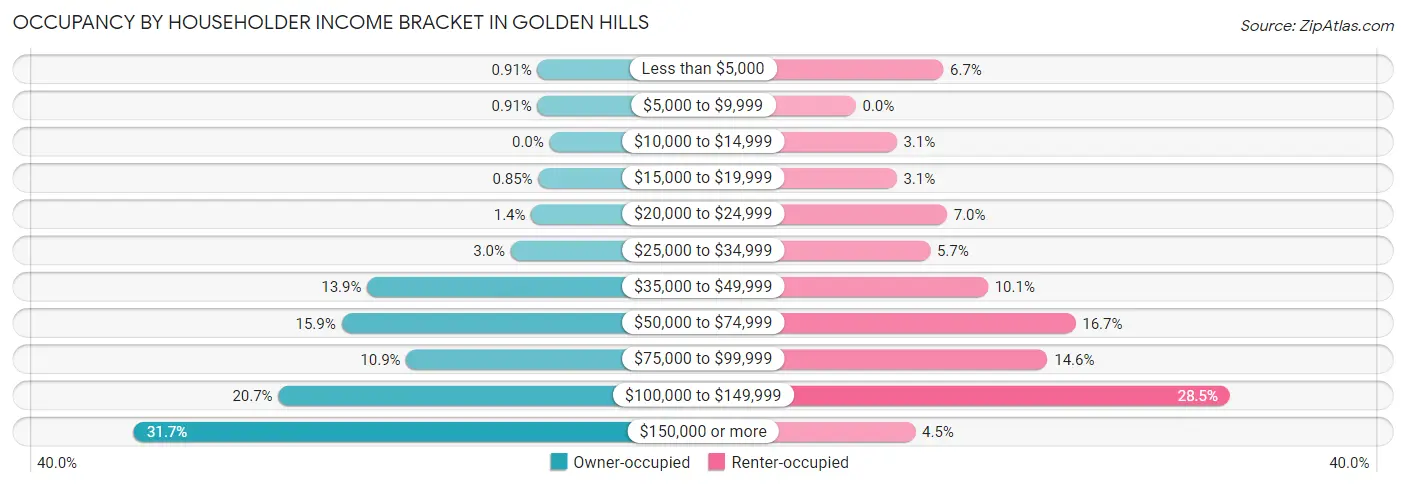
| Income Bracket | Owner-occupied | Renter-occupied |
| Less than $5,000 | 27 (0.9%) | 47 (6.7%) |
| $5,000 to $9,999 | 27 (0.9%) | 0 (0.0%) |
| $10,000 to $14,999 | 0 (0.0%) | 22 (3.1%) |
| $15,000 to $19,999 | 25 (0.9%) | 22 (3.1%) |
| $20,000 to $24,999 | 41 (1.4%) | 49 (7.0%) |
| $25,000 to $34,999 | 87 (2.9%) | 40 (5.7%) |
| $35,000 to $49,999 | 410 (13.9%) | 71 (10.1%) |
| $50,000 to $74,999 | 468 (15.9%) | 118 (16.7%) |
| $75,000 to $99,999 | 322 (10.9%) | 103 (14.6%) |
| $100,000 to $149,999 | 610 (20.7%) | 201 (28.5%) |
| $150,000 or more | 935 (31.7%) | 32 (4.5%) |
| Total | 2,952 (100.0%) | 705 (100.0%) |
Monthly Housing Cost Tiers in Golden Hills
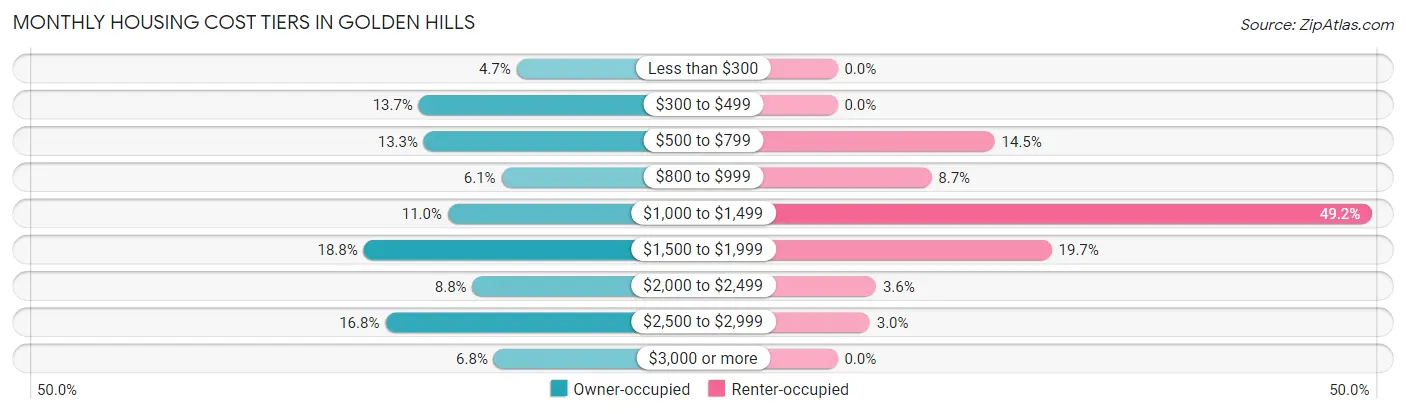
| Monthly Cost | Owner-occupied | Renter-occupied |
| Less than $300 | 139 (4.7%) | 0 (0.0%) |
| $300 to $499 | 405 (13.7%) | 0 (0.0%) |
| $500 to $799 | 391 (13.3%) | 102 (14.5%) |
| $800 to $999 | 180 (6.1%) | 61 (8.6%) |
| $1,000 to $1,499 | 326 (11.0%) | 347 (49.2%) |
| $1,500 to $1,999 | 555 (18.8%) | 139 (19.7%) |
| $2,000 to $2,499 | 259 (8.8%) | 25 (3.5%) |
| $2,500 to $2,999 | 496 (16.8%) | 21 (3.0%) |
| $3,000 or more | 201 (6.8%) | 0 (0.0%) |
| Total | 2,952 (100.0%) | 705 (100.0%) |
Physical Housing Characteristics in Golden Hills
Housing Structures in Golden Hills
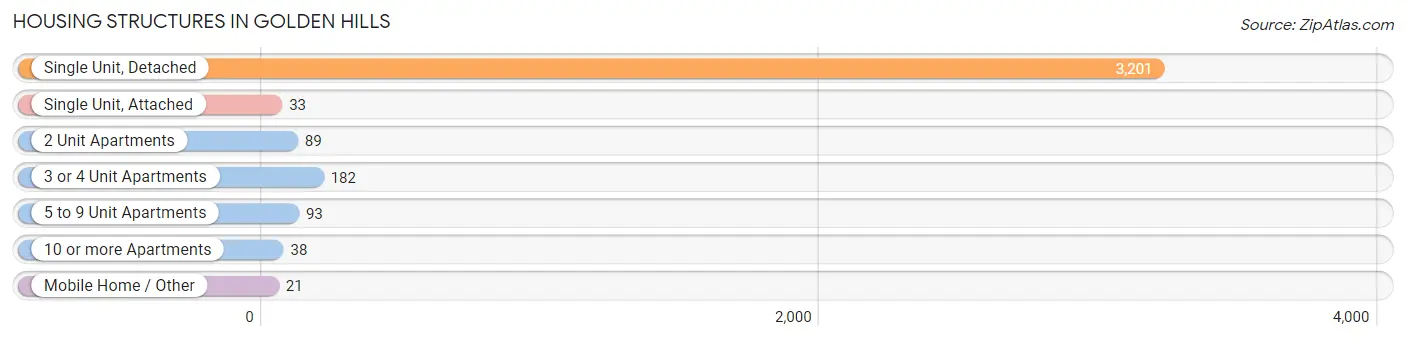
| Structure Type | # Housing Units | % Housing Units |
| Single Unit, Detached | 3,201 | 87.5% |
| Single Unit, Attached | 33 | 0.9% |
| 2 Unit Apartments | 89 | 2.4% |
| 3 or 4 Unit Apartments | 182 | 5.0% |
| 5 to 9 Unit Apartments | 93 | 2.5% |
| 10 or more Apartments | 38 | 1.0% |
| Mobile Home / Other | 21 | 0.6% |
| Total | 3,657 | 100.0% |
Housing Structures by Occupancy in Golden Hills
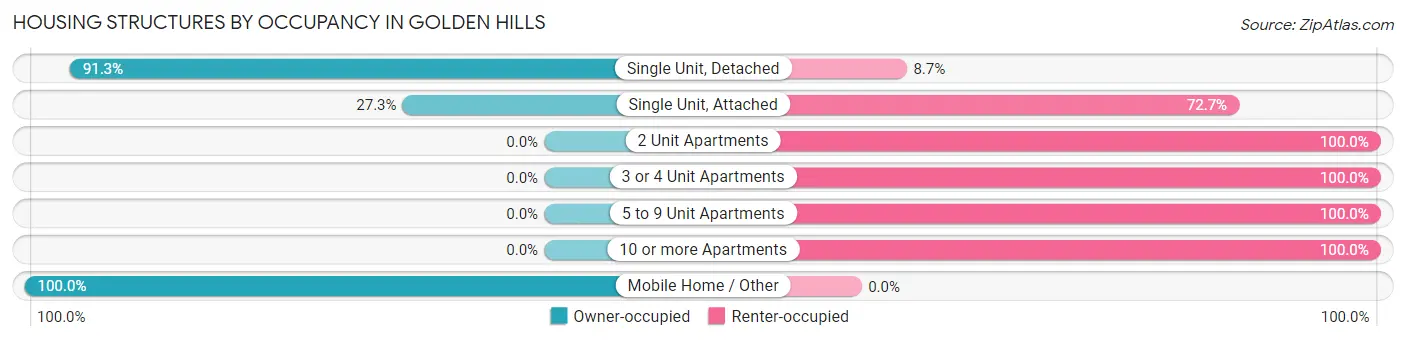
| Structure Type | Owner-occupied | Renter-occupied |
| Single Unit, Detached | 2,922 (91.3%) | 279 (8.7%) |
| Single Unit, Attached | 9 (27.3%) | 24 (72.7%) |
| 2 Unit Apartments | 0 (0.0%) | 89 (100.0%) |
| 3 or 4 Unit Apartments | 0 (0.0%) | 182 (100.0%) |
| 5 to 9 Unit Apartments | 0 (0.0%) | 93 (100.0%) |
| 10 or more Apartments | 0 (0.0%) | 38 (100.0%) |
| Mobile Home / Other | 21 (100.0%) | 0 (0.0%) |
| Total | 2,952 (80.7%) | 705 (19.3%) |
Housing Structures by Number of Rooms in Golden Hills
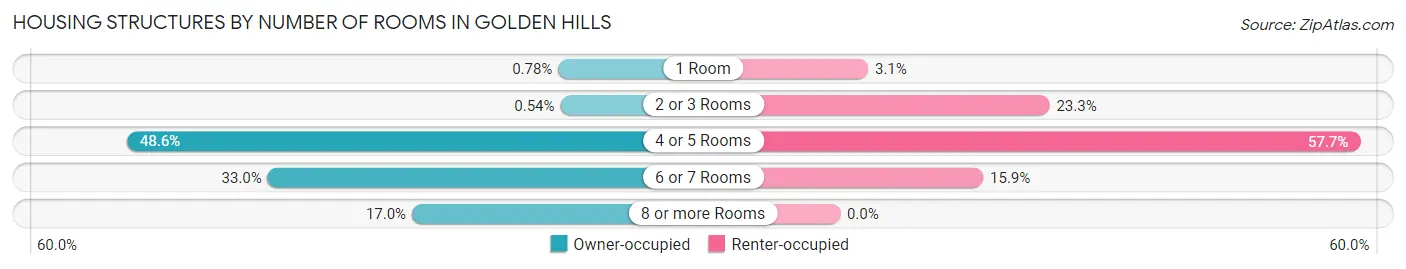
| Number of Rooms | Owner-occupied | Renter-occupied |
| 1 Room | 23 (0.8%) | 22 (3.1%) |
| 2 or 3 Rooms | 16 (0.5%) | 164 (23.3%) |
| 4 or 5 Rooms | 1,436 (48.6%) | 407 (57.7%) |
| 6 or 7 Rooms | 975 (33.0%) | 112 (15.9%) |
| 8 or more Rooms | 502 (17.0%) | 0 (0.0%) |
| Total | 2,952 (100.0%) | 705 (100.0%) |
Housing Structure by Heating Type in Golden Hills
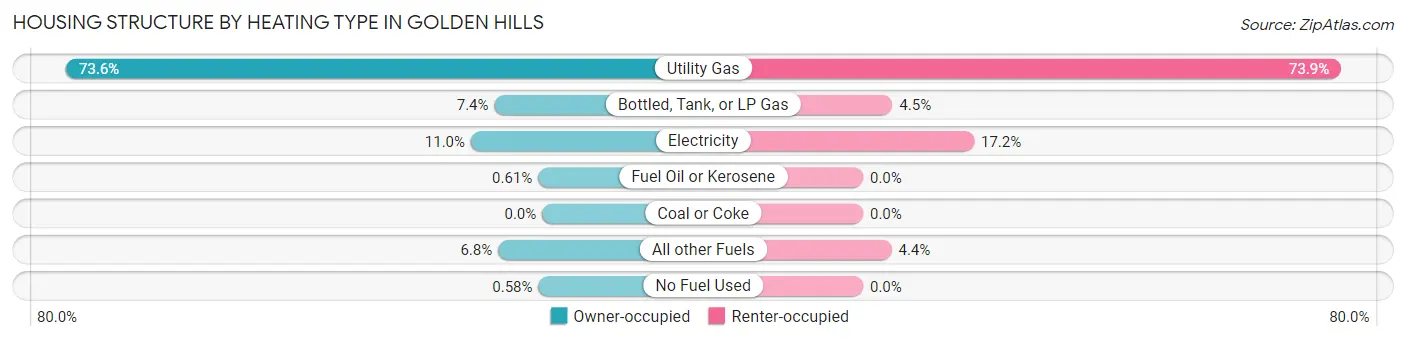
| Heating Type | Owner-occupied | Renter-occupied |
| Utility Gas | 2,173 (73.6%) | 521 (73.9%) |
| Bottled, Tank, or LP Gas | 218 (7.4%) | 32 (4.5%) |
| Electricity | 325 (11.0%) | 121 (17.2%) |
| Fuel Oil or Kerosene | 18 (0.6%) | 0 (0.0%) |
| Coal or Coke | 0 (0.0%) | 0 (0.0%) |
| All other Fuels | 201 (6.8%) | 31 (4.4%) |
| No Fuel Used | 17 (0.6%) | 0 (0.0%) |
| Total | 2,952 (100.0%) | 705 (100.0%) |
Household Vehicle Usage in Golden Hills
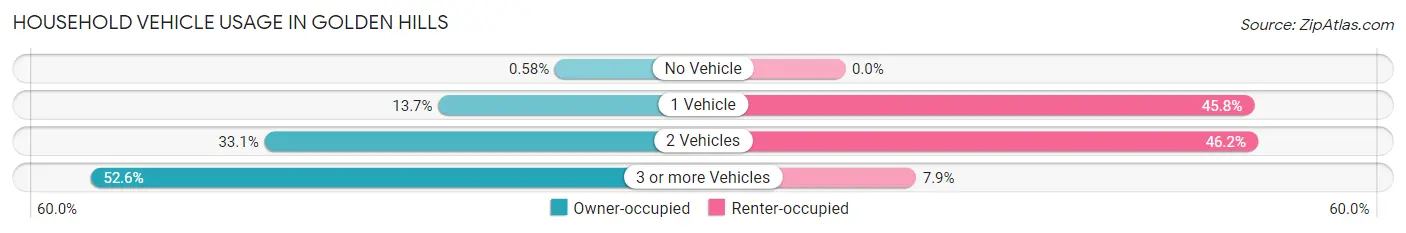
| Vehicles per Household | Owner-occupied | Renter-occupied |
| No Vehicle | 17 (0.6%) | 0 (0.0%) |
| 1 Vehicle | 403 (13.7%) | 323 (45.8%) |
| 2 Vehicles | 978 (33.1%) | 326 (46.2%) |
| 3 or more Vehicles | 1,554 (52.6%) | 56 (7.9%) |
| Total | 2,952 (100.0%) | 705 (100.0%) |
Real Estate & Mortgages in Golden Hills
Real Estate and Mortgage Overview in Golden Hills
| Characteristic | Without Mortgage | With Mortgage |
| Housing Units | 1,065 | 1,887 |
| Median Property Value | $305,100 | $390,900 |
| Median Household Income | $58,199 | $766 |
| Monthly Housing Costs | $497 | $201 |
| Real Estate Taxes | $2,709 | $67 |
Property Value by Mortgage Status in Golden Hills
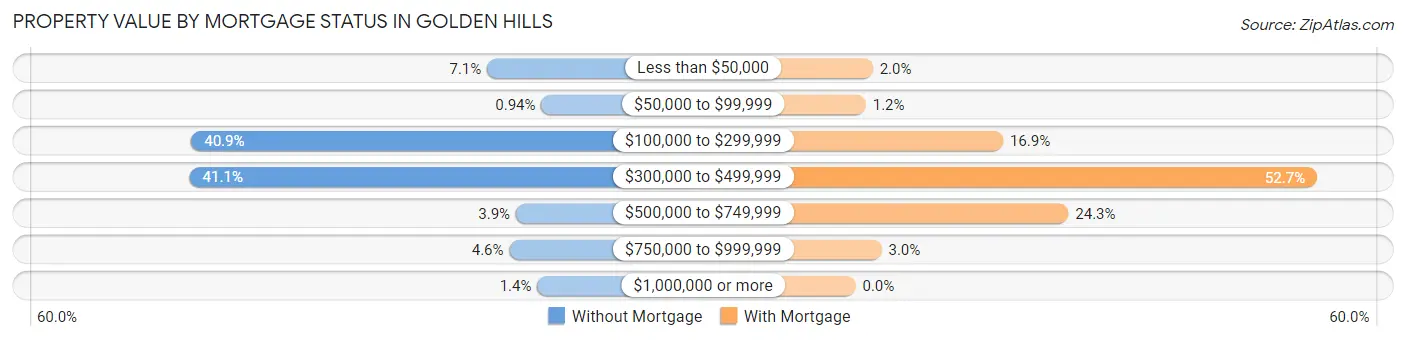
| Property Value | Without Mortgage | With Mortgage |
| Less than $50,000 | 76 (7.1%) | 37 (2.0%) |
| $50,000 to $99,999 | 10 (0.9%) | 22 (1.2%) |
| $100,000 to $299,999 | 436 (40.9%) | 318 (16.9%) |
| $300,000 to $499,999 | 438 (41.1%) | 995 (52.7%) |
| $500,000 to $749,999 | 41 (3.8%) | 459 (24.3%) |
| $750,000 to $999,999 | 49 (4.6%) | 56 (3.0%) |
| $1,000,000 or more | 15 (1.4%) | 0 (0.0%) |
| Total | 1,065 (100.0%) | 1,887 (100.0%) |
Household Income by Mortgage Status in Golden Hills
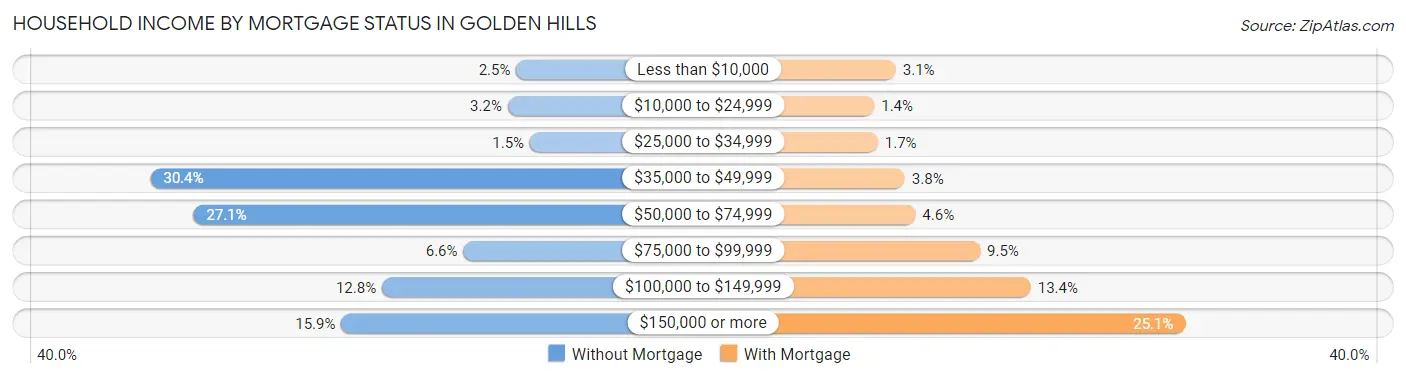
| Household Income | Without Mortgage | With Mortgage |
| Less than $10,000 | 27 (2.5%) | 58 (3.1%) |
| $10,000 to $24,999 | 34 (3.2%) | 27 (1.4%) |
| $25,000 to $34,999 | 16 (1.5%) | 32 (1.7%) |
| $35,000 to $49,999 | 324 (30.4%) | 71 (3.8%) |
| $50,000 to $74,999 | 289 (27.1%) | 86 (4.6%) |
| $75,000 to $99,999 | 70 (6.6%) | 179 (9.5%) |
| $100,000 to $149,999 | 136 (12.8%) | 252 (13.4%) |
| $150,000 or more | 169 (15.9%) | 474 (25.1%) |
| Total | 1,065 (100.0%) | 1,887 (100.0%) |
Property Value to Household Income Ratio in Golden Hills
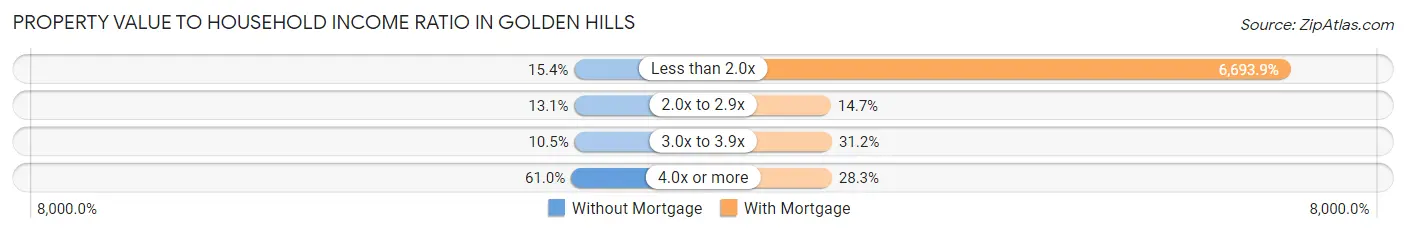
| Value-to-Income Ratio | Without Mortgage | With Mortgage |
| Less than 2.0x | 164 (15.4%) | 126,313 (6,693.9%) |
| 2.0x to 2.9x | 139 (13.1%) | 277 (14.7%) |
| 3.0x to 3.9x | 112 (10.5%) | 588 (31.2%) |
| 4.0x or more | 650 (61.0%) | 534 (28.3%) |
| Total | 1,065 (100.0%) | 1,887 (100.0%) |
Real Estate Taxes by Mortgage Status in Golden Hills
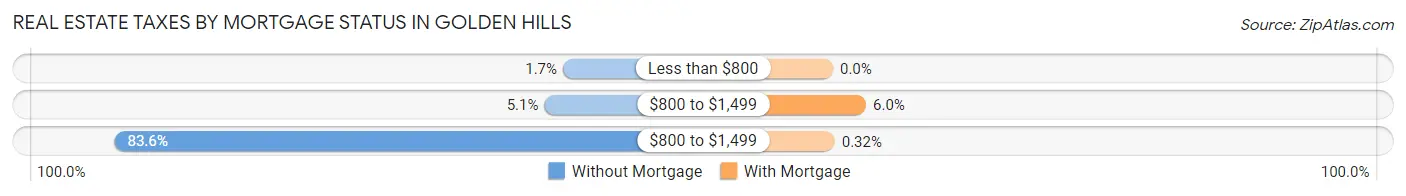
| Property Taxes | Without Mortgage | With Mortgage |
| Less than $800 | 18 (1.7%) | 0 (0.0%) |
| $800 to $1,499 | 54 (5.1%) | 114 (6.0%) |
| $800 to $1,499 | 890 (83.6%) | 6 (0.3%) |
| Total | 1,065 (100.0%) | 1,887 (100.0%) |
Health & Disability in Golden Hills
Health Insurance Coverage by Age in Golden Hills
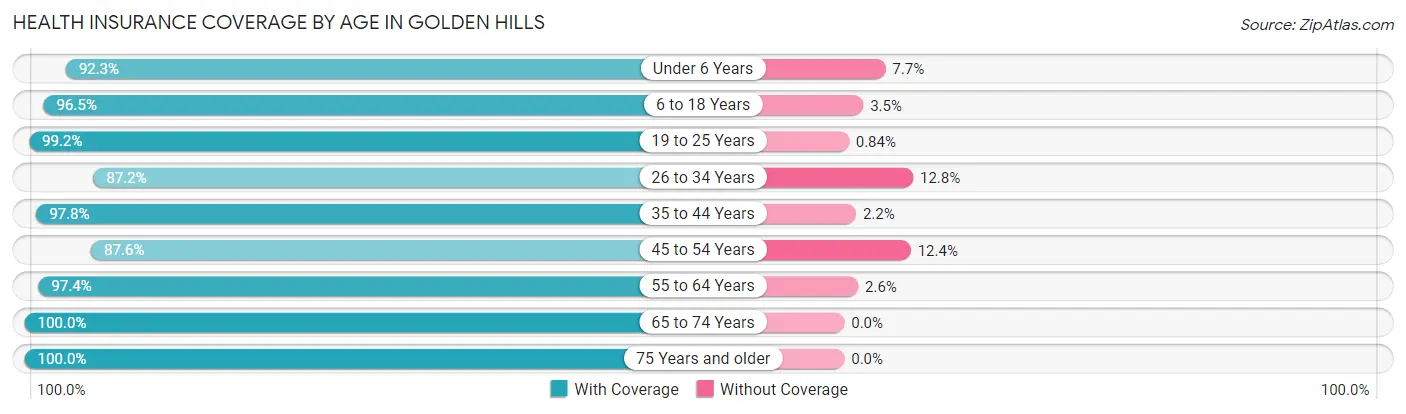
| Age Bracket | With Coverage | Without Coverage |
| Under 6 Years | 782 (92.3%) | 65 (7.7%) |
| 6 to 18 Years | 1,502 (96.5%) | 55 (3.5%) |
| 19 to 25 Years | 708 (99.2%) | 6 (0.8%) |
| 26 to 34 Years | 1,210 (87.2%) | 178 (12.8%) |
| 35 to 44 Years | 1,034 (97.8%) | 23 (2.2%) |
| 45 to 54 Years | 764 (87.6%) | 108 (12.4%) |
| 55 to 64 Years | 1,321 (97.4%) | 35 (2.6%) |
| 65 to 74 Years | 1,509 (100.0%) | 0 (0.0%) |
| 75 Years and older | 589 (100.0%) | 0 (0.0%) |
| Total | 9,419 (95.3%) | 470 (4.8%) |
Health Insurance Coverage by Citizenship Status in Golden Hills
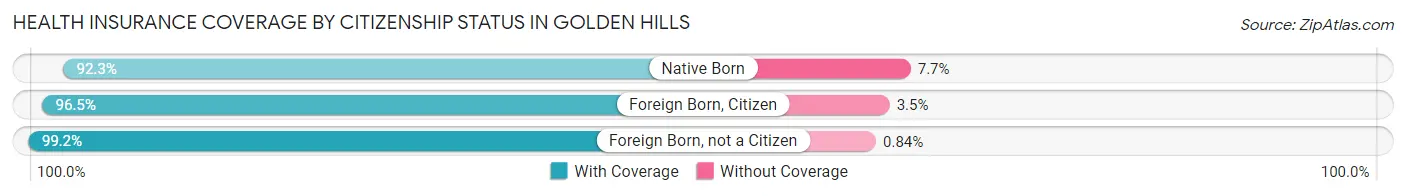
| Citizenship Status | With Coverage | Without Coverage |
| Native Born | 782 (92.3%) | 65 (7.7%) |
| Foreign Born, Citizen | 1,502 (96.5%) | 55 (3.5%) |
| Foreign Born, not a Citizen | 708 (99.2%) | 6 (0.8%) |
Health Insurance Coverage by Household Income in Golden Hills
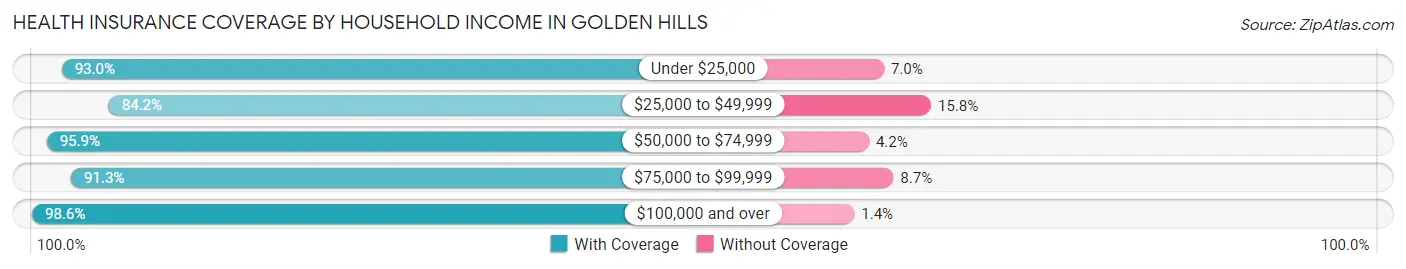
| Household Income | With Coverage | Without Coverage |
| Under $25,000 | 468 (93.0%) | 35 (7.0%) |
| $25,000 to $49,999 | 1,179 (84.2%) | 221 (15.8%) |
| $50,000 to $74,999 | 1,317 (95.9%) | 57 (4.2%) |
| $75,000 to $99,999 | 795 (91.3%) | 76 (8.7%) |
| $100,000 and over | 5,657 (98.6%) | 81 (1.4%) |
Public vs Private Health Insurance Coverage by Age in Golden Hills
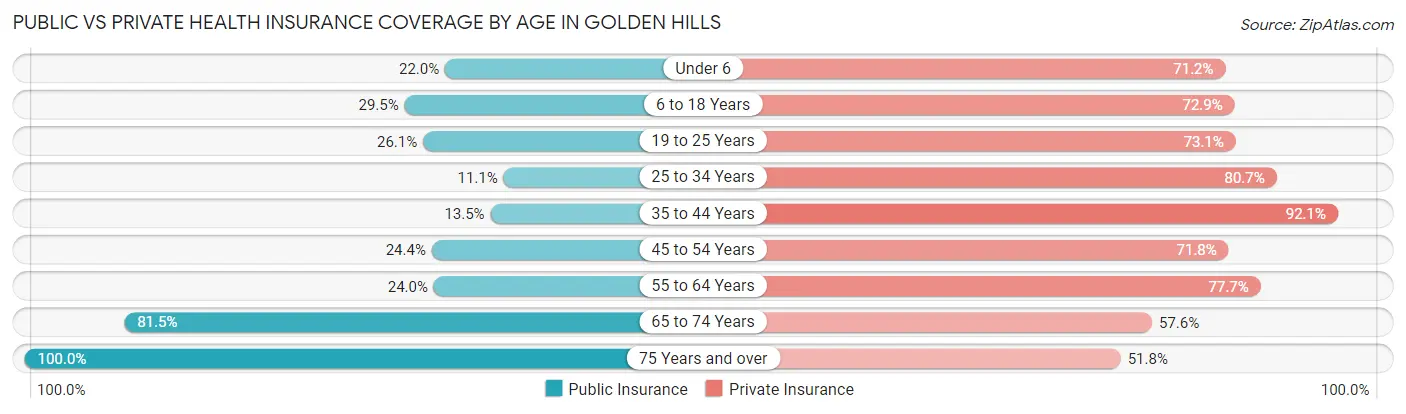
| Age Bracket | Public Insurance | Private Insurance |
| Under 6 | 186 (22.0%) | 603 (71.2%) |
| 6 to 18 Years | 459 (29.5%) | 1,135 (72.9%) |
| 19 to 25 Years | 186 (26.1%) | 522 (73.1%) |
| 25 to 34 Years | 154 (11.1%) | 1,120 (80.7%) |
| 35 to 44 Years | 143 (13.5%) | 973 (92.0%) |
| 45 to 54 Years | 213 (24.4%) | 626 (71.8%) |
| 55 to 64 Years | 326 (24.0%) | 1,054 (77.7%) |
| 65 to 74 Years | 1,230 (81.5%) | 869 (57.6%) |
| 75 Years and over | 589 (100.0%) | 305 (51.8%) |
| Total | 3,486 (35.2%) | 7,207 (72.9%) |
Disability Status by Sex by Age in Golden Hills
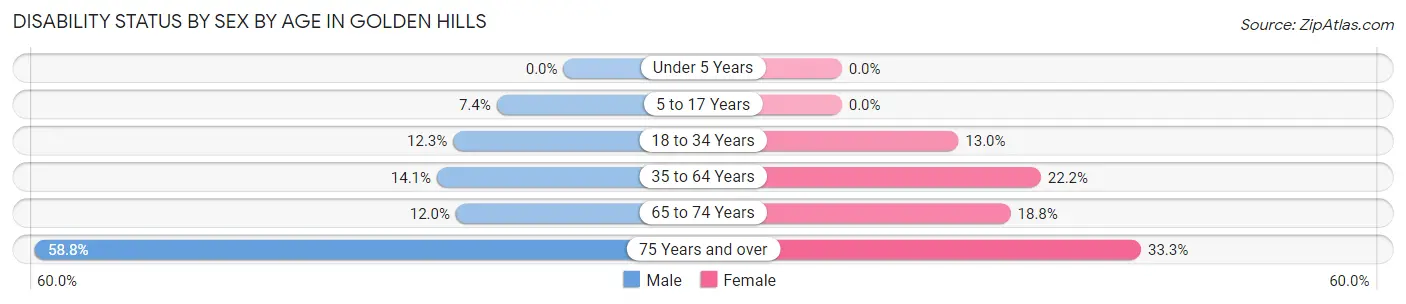
| Age Bracket | Male | Female |
| Under 5 Years | 0 (0.0%) | 0 (0.0%) |
| 5 to 17 Years | 68 (7.4%) | 0 (0.0%) |
| 18 to 34 Years | 145 (12.3%) | 135 (13.0%) |
| 35 to 64 Years | 210 (14.1%) | 398 (22.2%) |
| 65 to 74 Years | 103 (12.0%) | 122 (18.8%) |
| 75 Years and over | 140 (58.8%) | 117 (33.3%) |
Disability Class by Sex by Age in Golden Hills
Disability Class: Hearing Difficulty
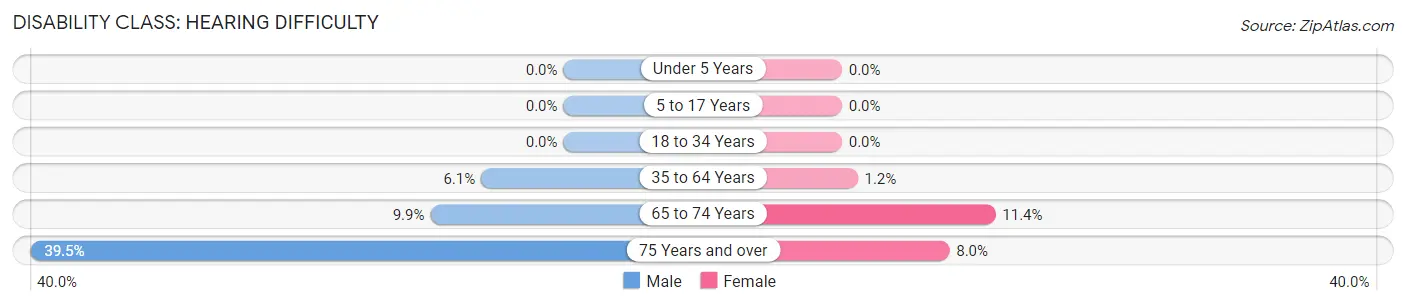
| Age Bracket | Male | Female |
| Under 5 Years | 0 (0.0%) | 0 (0.0%) |
| 5 to 17 Years | 0 (0.0%) | 0 (0.0%) |
| 18 to 34 Years | 0 (0.0%) | 0 (0.0%) |
| 35 to 64 Years | 91 (6.1%) | 21 (1.2%) |
| 65 to 74 Years | 85 (9.9%) | 74 (11.4%) |
| 75 Years and over | 94 (39.5%) | 28 (8.0%) |
Disability Class: Vision Difficulty
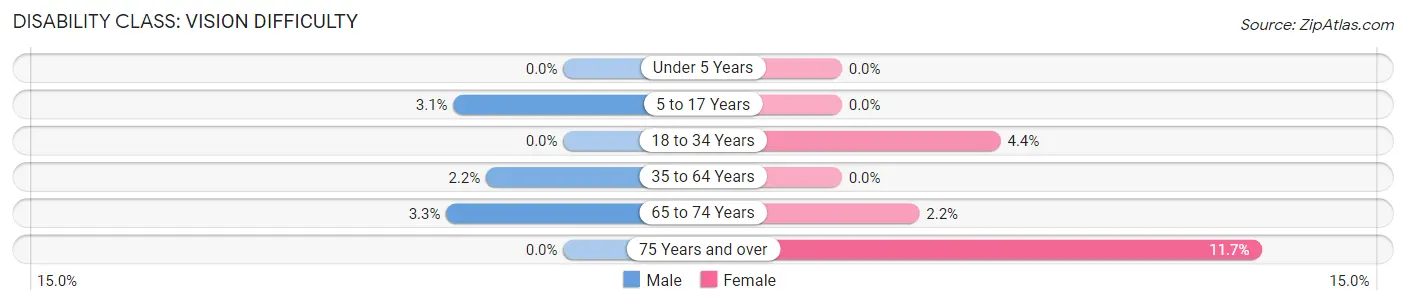
| Age Bracket | Male | Female |
| Under 5 Years | 0 (0.0%) | 0 (0.0%) |
| 5 to 17 Years | 28 (3.1%) | 0 (0.0%) |
| 18 to 34 Years | 0 (0.0%) | 46 (4.4%) |
| 35 to 64 Years | 32 (2.1%) | 0 (0.0%) |
| 65 to 74 Years | 28 (3.3%) | 14 (2.2%) |
| 75 Years and over | 0 (0.0%) | 41 (11.7%) |
Disability Class: Cognitive Difficulty
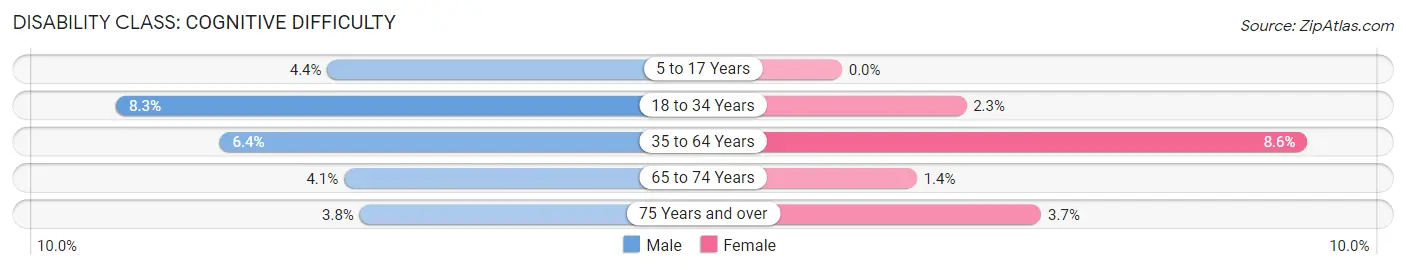
| Age Bracket | Male | Female |
| 5 to 17 Years | 40 (4.4%) | 0 (0.0%) |
| 18 to 34 Years | 98 (8.3%) | 24 (2.3%) |
| 35 to 64 Years | 95 (6.4%) | 155 (8.6%) |
| 65 to 74 Years | 35 (4.1%) | 9 (1.4%) |
| 75 Years and over | 9 (3.8%) | 13 (3.7%) |
Disability Class: Ambulatory Difficulty
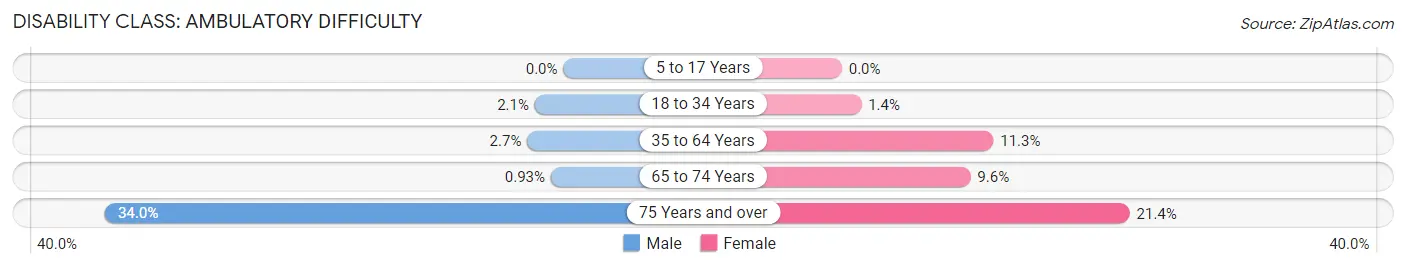
| Age Bracket | Male | Female |
| 5 to 17 Years | 0 (0.0%) | 0 (0.0%) |
| 18 to 34 Years | 25 (2.1%) | 15 (1.4%) |
| 35 to 64 Years | 40 (2.7%) | 202 (11.3%) |
| 65 to 74 Years | 8 (0.9%) | 62 (9.6%) |
| 75 Years and over | 81 (34.0%) | 75 (21.4%) |
Disability Class: Self-Care Difficulty
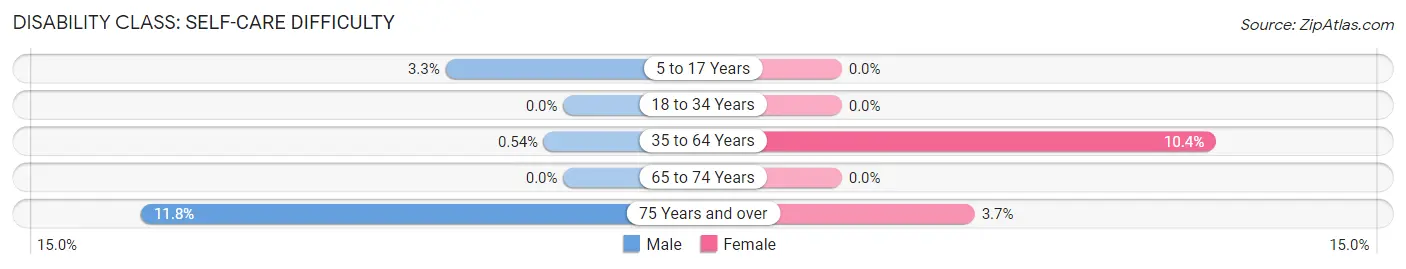
| Age Bracket | Male | Female |
| 5 to 17 Years | 30 (3.3%) | 0 (0.0%) |
| 18 to 34 Years | 0 (0.0%) | 0 (0.0%) |
| 35 to 64 Years | 8 (0.5%) | 187 (10.4%) |
| 65 to 74 Years | 0 (0.0%) | 0 (0.0%) |
| 75 Years and over | 28 (11.8%) | 13 (3.7%) |
Technology Access in Golden Hills
Computing Device Access in Golden Hills
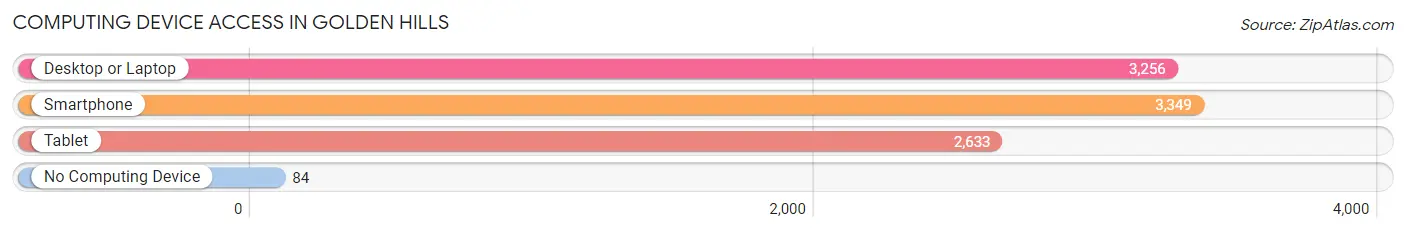
| Device Type | # Households | % Households |
| Desktop or Laptop | 3,256 | 89.0% |
| Smartphone | 3,349 | 91.6% |
| Tablet | 2,633 | 72.0% |
| No Computing Device | 84 | 2.3% |
| Total | 3,657 | 100.0% |
Internet Access in Golden Hills
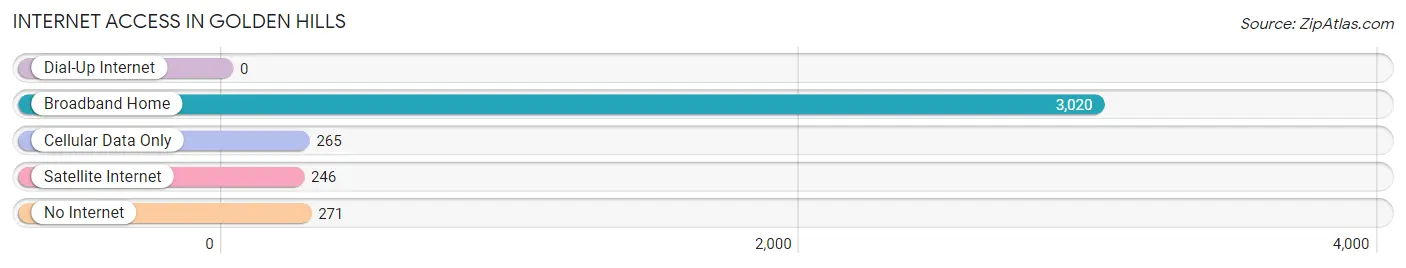
| Internet Type | # Households | % Households |
| Dial-Up Internet | 0 | 0.0% |
| Broadband Home | 3,020 | 82.6% |
| Cellular Data Only | 265 | 7.2% |
| Satellite Internet | 246 | 6.7% |
| No Internet | 271 | 7.4% |
| Total | 3,657 | 100.0% |
Golden Hills Summary
Hills, CA is a small city located in the foothills of the Sierra Nevada Mountains in California. It is situated in the western part of the state, about 30 miles east of Sacramento. The city is home to a population of approximately 8,000 people, and is known for its rural atmosphere and stunning views of the surrounding mountains.
History
The area that is now known as Golden Hills was first settled by Native Americans, who lived in the area for thousands of years before the arrival of Europeans. The first Europeans to settle in the area were Spanish missionaries, who established a mission in the area in the late 1700s. The mission was abandoned in the early 1800s, and the area was largely uninhabited until the mid-1800s, when gold was discovered in the nearby hills. This led to a gold rush, and the area quickly became populated with miners and prospectors.
The town of Golden Hills was officially founded in 1854, and was named after the nearby hills that were rich in gold. The town quickly grew, and by the late 1800s it had become a bustling center of commerce and industry. The town was home to several gold mines, as well as a number of other businesses, including a sawmill, a flour mill, and a brickyard.
Geography
Golden Hills is located in the foothills of the Sierra Nevada Mountains, about 30 miles east of Sacramento. The city is situated at an elevation of about 1,000 feet, and is surrounded by rolling hills and lush forests. The city is located in a valley, and is bordered by the American River to the north and the Cosumnes River to the south.
The climate in Golden Hills is mild and temperate, with warm summers and cool winters. The average annual temperature is around 60 degrees Fahrenheit, and the average annual precipitation is around 20 inches.
Economy
The economy of Golden Hills is largely based on tourism and agriculture. The city is home to several wineries, and is a popular destination for wine tasting and other activities. The city is also home to a number of small businesses, including restaurants, shops, and art galleries.
The city is also home to a number of manufacturing and industrial businesses, including a paper mill, a metal fabrication plant, and a plastics factory. The city is also home to a number of government offices, including a post office, a courthouse, and a police station.
Demographics
As of the 2010 census, the population of Golden Hills was 8,000. The racial makeup of the city was 79.3% White, 8.2% Hispanic or Latino, 6.2% Asian, 4.2% African American, and 2.1% other. The median household income was $50,000, and the median home value was $250,000.
The city is home to a number of churches, including Catholic, Methodist, and Baptist. The city is also home to a number of schools, including a public elementary school, a middle school, and a high school. The city is served by a number of public transportation options, including buses and light rail.
Common Questions
What is the Total Population of Golden Hills?
Total Population of Golden Hills is 9,892.
What is the Total Male Population of Golden Hills?
Total Male Population of Golden Hills is 5,082.
What is the Total Female Population of Golden Hills?
Total Female Population of Golden Hills is 4,810.
What is the Ratio of Males per 100 Females in Golden Hills?
There are 105.65 Males per 100 Females in Golden Hills.
What is the Ratio of Females per 100 Males in Golden Hills?
There are 94.65 Females per 100 Males in Golden Hills.
What is the Median Population Age in Golden Hills?
Median Population Age in Golden Hills is 38.3 Years.
What is the Average Family Size in Golden Hills
Average Family Size in Golden Hills is 3.1 People.
What is the Average Household Size in Golden Hills
Average Household Size in Golden Hills is 2.7 People.
What is Per Capita Income in Golden Hills?
Per Capita income in Golden Hills is $41,968.
What is the Median Family Income in Golden Hills?
Median Family Income in Golden Hills is $106,359.
What is the Median Household income in Golden Hills?
Median Household Income in Golden Hills is $96,676.
What is Income or Wage Gap in Golden Hills?
Income or Wage Gap in Golden Hills is 69.2%.
Women in Golden Hills earn 30.8 cents for every dollar earned by a man.
What is Family Income Deficit in Golden Hills?
Family Income Deficit in Golden Hills is $9,512.
Families that are below poverty line in Golden Hills earn $9,512 less on average than the poverty threshold level.
What is Inequality or Gini Index in Golden Hills?
Inequality or Gini Index in Golden Hills is 0.38.
How Large is the Labor Force in Golden Hills?
There are 4,865 People in the Labor Forcein in Golden Hills.
What is the Percentage of People in the Labor Force in Golden Hills?
63.1% of People are in the Labor Force in Golden Hills.
What is the Unemployment Rate in Golden Hills?
Unemployment Rate in Golden Hills is 6.4%.