Fruitdale, CA
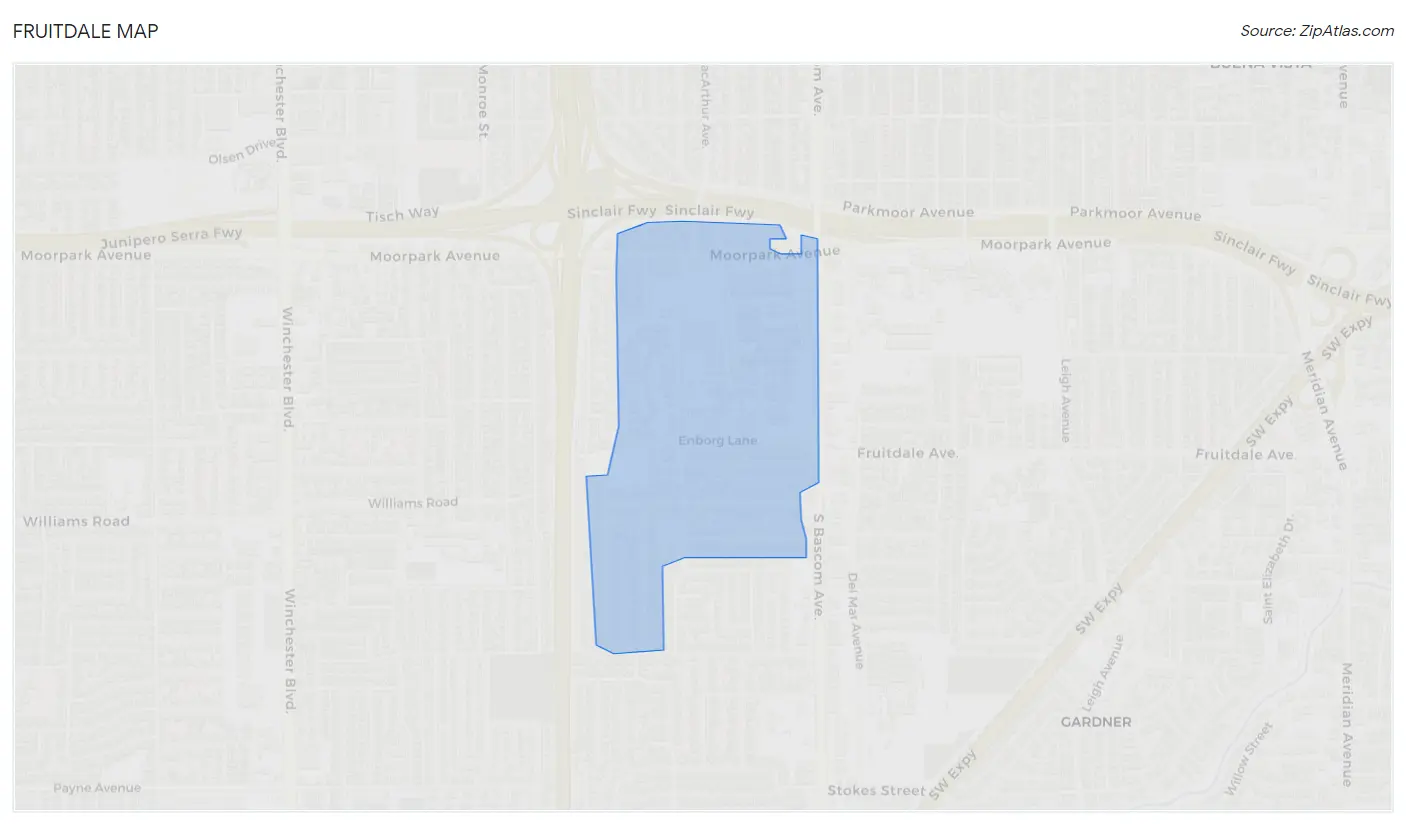
Fruitdale Map
Fruitdale Overview
1,219
TOTAL POPULATION
585
MALE POPULATION
634
FEMALE POPULATION
92.27
MALES / 100 FEMALES
108.38
FEMALES / 100 MALES
30.8
MEDIAN AGE
2.7
AVG FAMILY SIZE
2.5
AVG HOUSEHOLD SIZE
$73,246
PER CAPITA INCOME
$165,632
AVG FAMILY INCOME
$161,250
AVG HOUSEHOLD INCOME
0.51
INEQUALITY / GINI INDEX
818
LABOR FORCE [ PEOPLE ]
74.3%
PERCENT IN LABOR FORCE
4.6%
UNEMPLOYMENT RATE
Race in Fruitdale
The most populous races in Fruitdale are White / Caucasian (774 | 63.5%), Asian (267 | 21.9%), and Hispanic or Latino (209 | 17.2%).
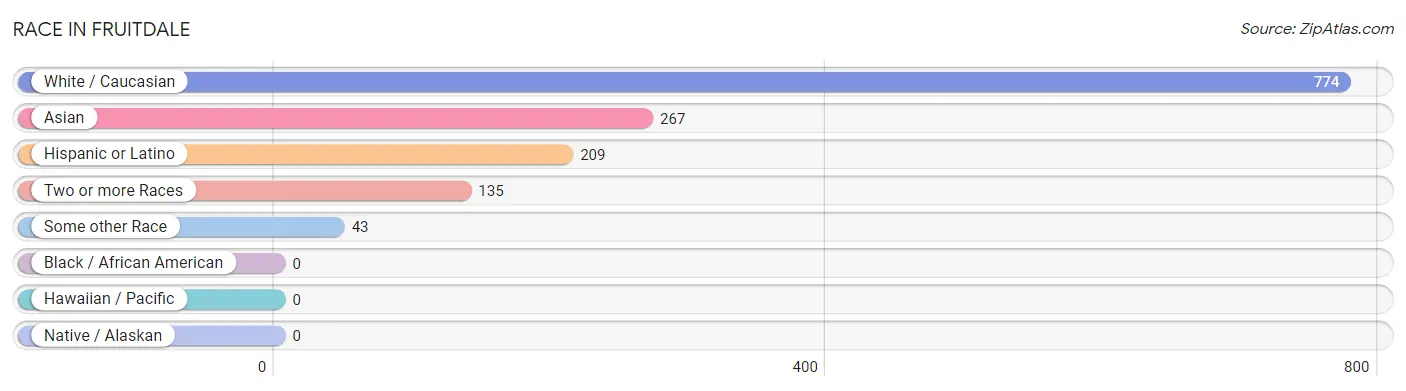
| Race | # Population | % Population |
| Asian | 267 | 21.9% |
| Black / African American | 0 | 0.0% |
| Hawaiian / Pacific | 0 | 0.0% |
| Hispanic or Latino | 209 | 17.2% |
| Native / Alaskan | 0 | 0.0% |
| White / Caucasian | 774 | 63.5% |
| Two or more Races | 135 | 11.1% |
| Some other Race | 43 | 3.5% |
| Total | 1,219 | 100.0% |
Ancestry in Fruitdale
The most populous ancestries reported in Fruitdale are English (289 | 23.7%), German (289 | 23.7%), Indian (Asian) (185 | 15.2%), Mexican (157 | 12.9%), and American (136 | 11.2%), together accounting for 86.6% of all Fruitdale residents.
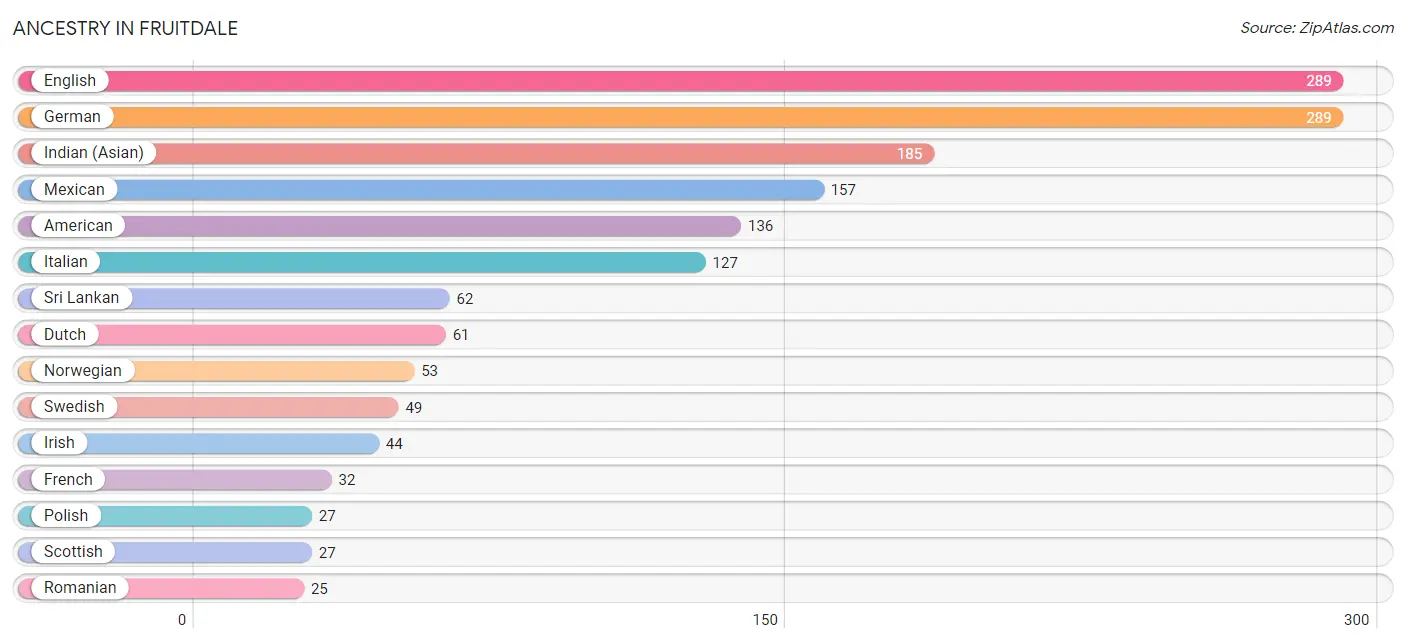
| Ancestry | # Population | % Population |
| American | 136 | 11.2% |
| Austrian | 14 | 1.1% |
| Bhutanese | 13 | 1.1% |
| Central American | 23 | 1.9% |
| Cuban | 15 | 1.2% |
| Czech | 13 | 1.1% |
| Danish | 6 | 0.5% |
| Dutch | 61 | 5.0% |
| English | 289 | 23.7% |
| French | 32 | 2.6% |
| French Canadian | 11 | 0.9% |
| German | 289 | 23.7% |
| Honduran | 23 | 1.9% |
| Indian (Asian) | 185 | 15.2% |
| Irish | 44 | 3.6% |
| Italian | 127 | 10.4% |
| Korean | 5 | 0.4% |
| Lithuanian | 10 | 0.8% |
| Mexican | 157 | 12.9% |
| Native Hawaiian | 5 | 0.4% |
| Northern European | 5 | 0.4% |
| Norwegian | 53 | 4.3% |
| Polish | 27 | 2.2% |
| Portuguese | 12 | 1.0% |
| Romanian | 25 | 2.1% |
| Scottish | 27 | 2.2% |
| Spaniard | 14 | 1.1% |
| Sri Lankan | 62 | 5.1% |
| Swedish | 49 | 4.0% |
| Thai | 20 | 1.6% |
| Ukrainian | 8 | 0.7% |
| Welsh | 7 | 0.6% |
| Yugoslavian | 6 | 0.5% | View All 33 Rows |
Immigrants in Fruitdale
The most numerous immigrant groups reported in Fruitdale came from Asia (163 | 13.4%), China (130 | 10.7%), Eastern Asia (130 | 10.7%), Europe (39 | 3.2%), and South Eastern Asia (33 | 2.7%), together accounting for 40.6% of all Fruitdale residents.
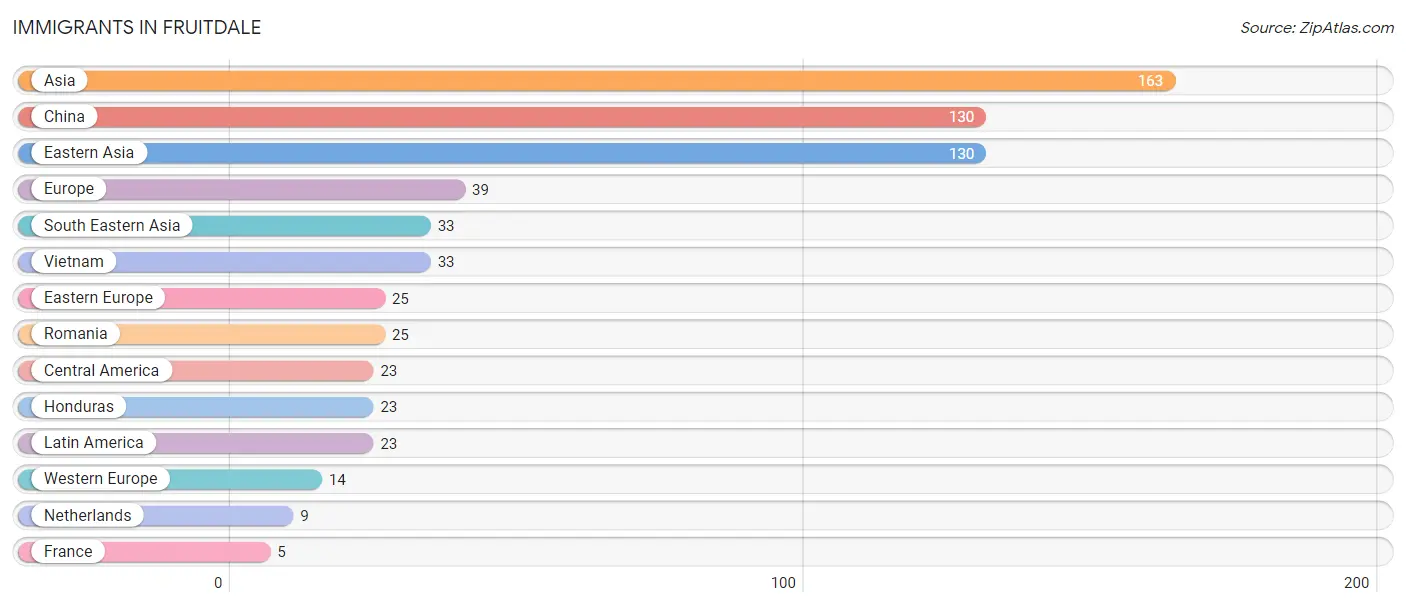
| Immigration Origin | # Population | % Population |
| Asia | 163 | 13.4% |
| Central America | 23 | 1.9% |
| China | 130 | 10.7% |
| Eastern Asia | 130 | 10.7% |
| Eastern Europe | 25 | 2.1% |
| Europe | 39 | 3.2% |
| France | 5 | 0.4% |
| Honduras | 23 | 1.9% |
| Latin America | 23 | 1.9% |
| Netherlands | 9 | 0.7% |
| Romania | 25 | 2.1% |
| South Eastern Asia | 33 | 2.7% |
| Vietnam | 33 | 2.7% |
| Western Europe | 14 | 1.1% | View All 14 Rows |
Sex and Age in Fruitdale
Sex and Age in Fruitdale
The most populous age groups in Fruitdale are 30 to 34 Years (146 | 25.0%) for men and 20 to 24 Years (239 | 37.7%) for women.
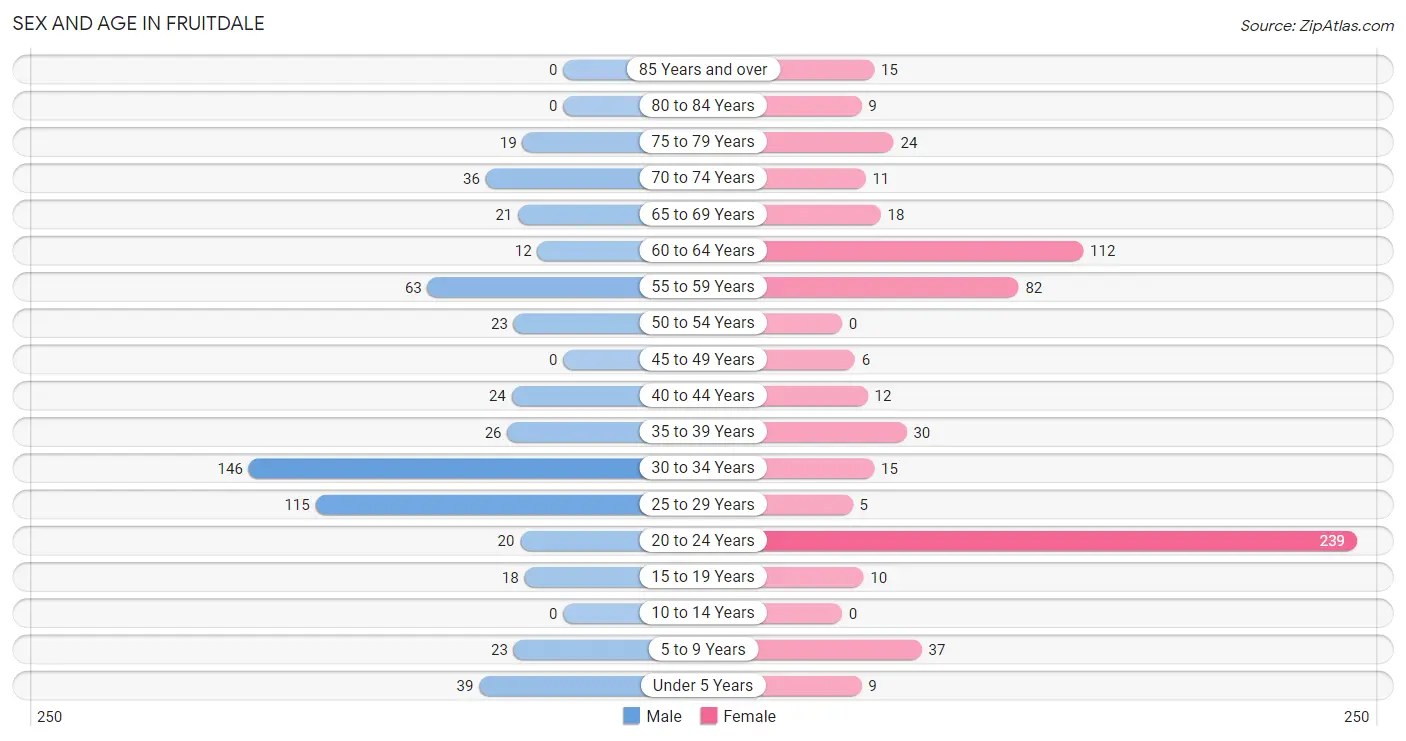
| Age Bracket | Male | Female |
| Under 5 Years | 39 (6.7%) | 9 (1.4%) |
| 5 to 9 Years | 23 (3.9%) | 37 (5.8%) |
| 10 to 14 Years | 0 (0.0%) | 0 (0.0%) |
| 15 to 19 Years | 18 (3.1%) | 10 (1.6%) |
| 20 to 24 Years | 20 (3.4%) | 239 (37.7%) |
| 25 to 29 Years | 115 (19.7%) | 5 (0.8%) |
| 30 to 34 Years | 146 (25.0%) | 15 (2.4%) |
| 35 to 39 Years | 26 (4.4%) | 30 (4.7%) |
| 40 to 44 Years | 24 (4.1%) | 12 (1.9%) |
| 45 to 49 Years | 0 (0.0%) | 6 (0.9%) |
| 50 to 54 Years | 23 (3.9%) | 0 (0.0%) |
| 55 to 59 Years | 63 (10.8%) | 82 (12.9%) |
| 60 to 64 Years | 12 (2.1%) | 112 (17.7%) |
| 65 to 69 Years | 21 (3.6%) | 18 (2.8%) |
| 70 to 74 Years | 36 (6.1%) | 11 (1.7%) |
| 75 to 79 Years | 19 (3.3%) | 24 (3.8%) |
| 80 to 84 Years | 0 (0.0%) | 9 (1.4%) |
| 85 Years and over | 0 (0.0%) | 15 (2.4%) |
| Total | 585 (100.0%) | 634 (100.0%) |
Families and Households in Fruitdale
Median Family Size in Fruitdale
The median family size in Fruitdale is 2.71 persons per family, with single male/father families (47 | 19.0%) accounting for the largest median family size of 3.32 persons per family. On the other hand, single female/mother families (115 | 46.4%) represent the smallest median family size with 2.37 persons per family.
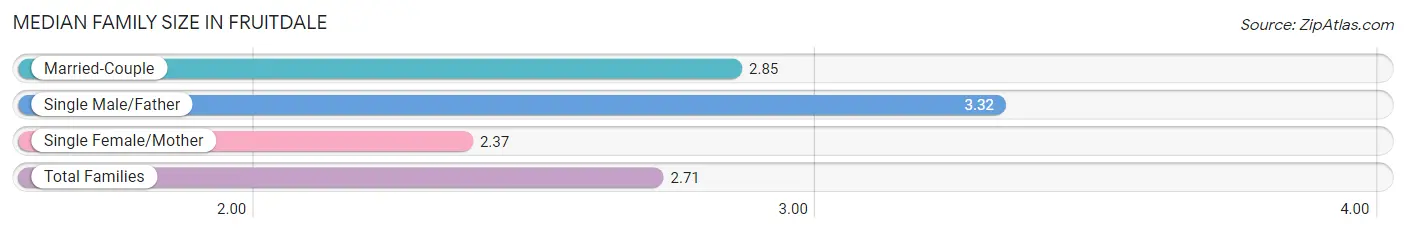
| Family Type | # Families | Family Size |
| Married-Couple | 86 (34.7%) | 2.85 |
| Single Male/Father | 47 (19.0%) | 3.32 |
| Single Female/Mother | 115 (46.4%) | 2.37 |
| Total Families | 248 (100.0%) | 2.71 |
Median Household Size in Fruitdale
The median household size in Fruitdale is 2.51 persons per household, with single male/father households (47 | 10.1%) accounting for the largest median household size of 3.57 persons per household. non-family households (217 | 46.7%) represent the smallest median household size with 1.74 persons per household.
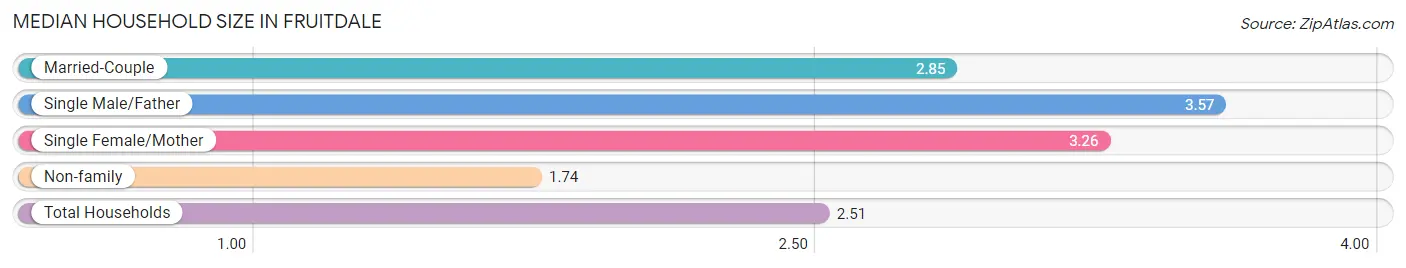
| Household Type | # Households | Household Size |
| Married-Couple | 86 (18.5%) | 2.85 |
| Single Male/Father | 47 (10.1%) | 3.57 |
| Single Female/Mother | 115 (24.7%) | 3.26 |
| Non-family | 217 (46.7%) | 1.74 |
| Total Households | 465 (100.0%) | 2.51 |
Household Size by Marriage Status in Fruitdale
Out of a total of 465 households in Fruitdale, 248 (53.3%) are family households, while 217 (46.7%) are nonfamily households. The most numerous type of family households are 3-person households, comprising 140, and the most common type of nonfamily households are 1-person households, comprising 130.
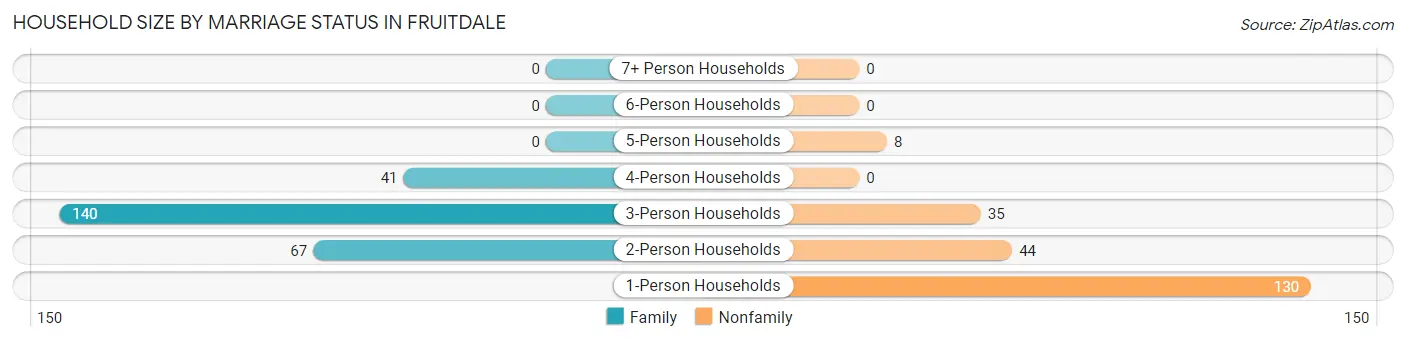
| Household Size | Family Households | Nonfamily Households |
| 1-Person Households | - | 130 (28.0%) |
| 2-Person Households | 67 (14.4%) | 44 (9.5%) |
| 3-Person Households | 140 (30.1%) | 35 (7.5%) |
| 4-Person Households | 41 (8.8%) | 0 (0.0%) |
| 5-Person Households | 0 (0.0%) | 8 (1.7%) |
| 6-Person Households | 0 (0.0%) | 0 (0.0%) |
| 7+ Person Households | 0 (0.0%) | 0 (0.0%) |
| Total | 248 (53.3%) | 217 (46.7%) |
Female Fertility in Fruitdale
Fertility by Age in Fruitdale
Average fertility rate in Fruitdale is 16.0 births per 1,000 women. Women in the age bracket of 20 to 34 years have the highest fertility rate with 19.0 births per 1,000 women. Women in the age bracket of 20 to 34 years acount for 100.0% of all women with births.
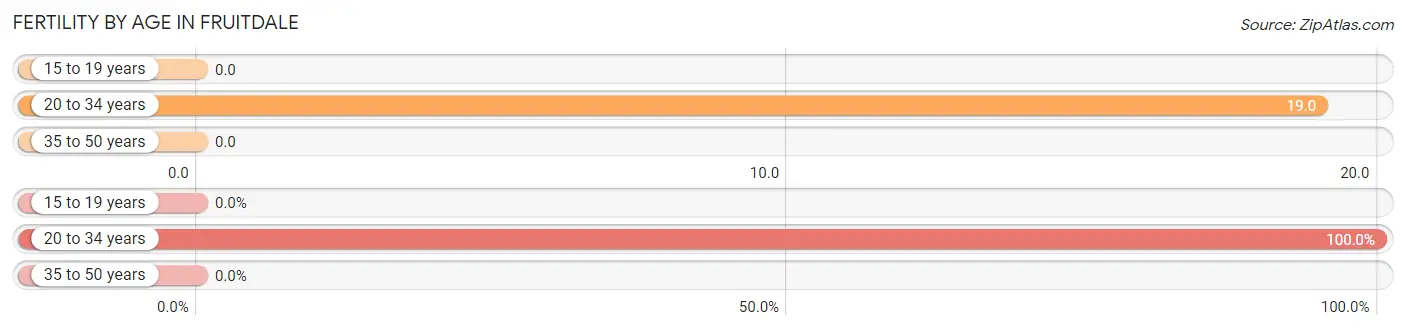
| Age Bracket | Women with Births | Births / 1,000 Women |
| 15 to 19 years | 0 (0.0%) | 0.0 |
| 20 to 34 years | 5 (100.0%) | 19.0 |
| 35 to 50 years | 0 (0.0%) | 0.0 |
| Total | 5 (100.0%) | 16.0 |
Fertility by Age by Marriage Status in Fruitdale
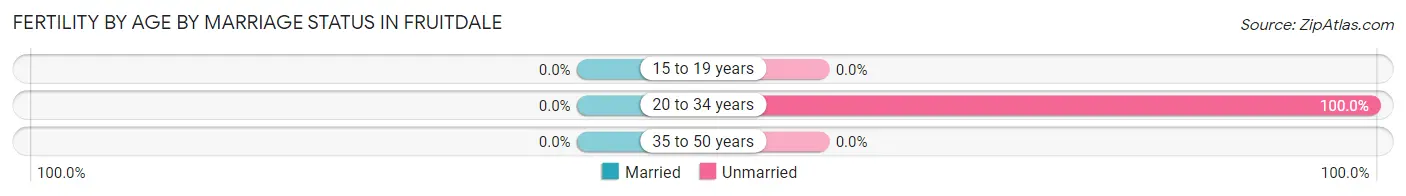
| Age Bracket | Married | Unmarried |
| 15 to 19 years | 0 (0.0%) | 0 (0.0%) |
| 20 to 34 years | 0 (0.0%) | 5 (100.0%) |
| 35 to 50 years | 0 (0.0%) | 0 (0.0%) |
| Total | 0 (0.0%) | 5 (100.0%) |
Fertility by Education in Fruitdale
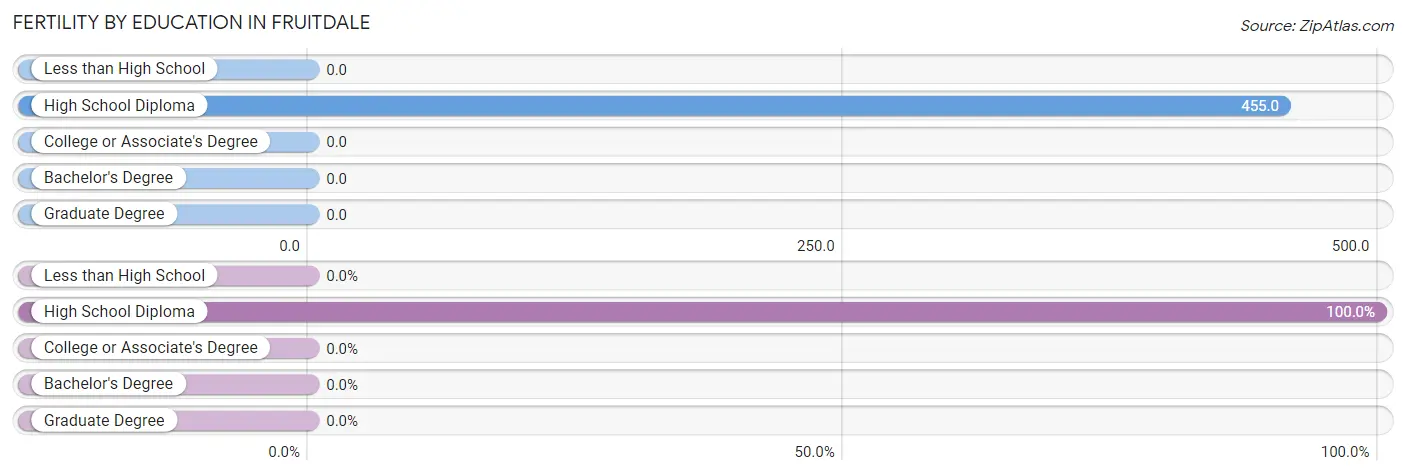
| Educational Attainment | Women with Births | Births / 1,000 Women |
| Less than High School | 0 (0.0%) | 0.0 |
| High School Diploma | 5 (100.0%) | 455.0 |
| College or Associate's Degree | 0 (0.0%) | 0.0 |
| Bachelor's Degree | 0 (0.0%) | 0.0 |
| Graduate Degree | 0 (0.0%) | 0.0 |
| Total | 5 (100.0%) | 16.0 |
Fertility by Education by Marriage Status in Fruitdale
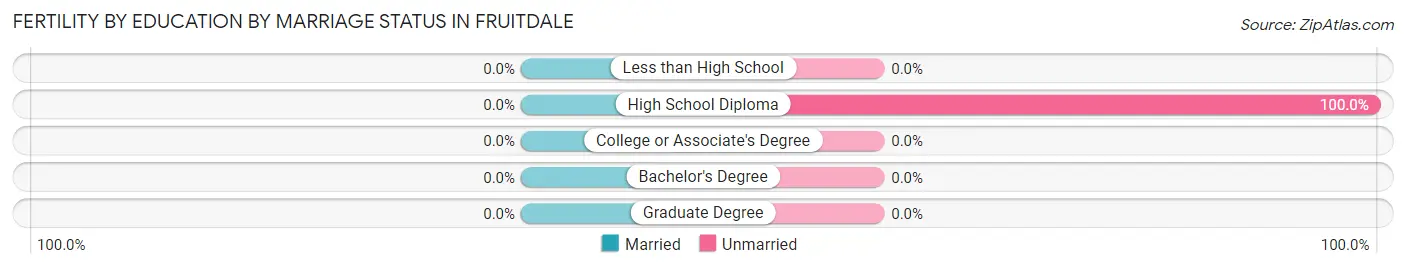
| Educational Attainment | Married | Unmarried |
| Less than High School | 0 (0.0%) | 0 (0.0%) |
| High School Diploma | 0 (0.0%) | 5 (100.0%) |
| College or Associate's Degree | 0 (0.0%) | 0 (0.0%) |
| Bachelor's Degree | 0 (0.0%) | 0 (0.0%) |
| Graduate Degree | 0 (0.0%) | 0 (0.0%) |
| Total | 0 (0.0%) | 5 (100.0%) |
Income in Fruitdale
Income Overview in Fruitdale
Per Capita Income in Fruitdale is $73,246, while median incomes of families and households are $165,632 and $161,250 respectively.
| Characteristic | Number | Measure |
| Per Capita Income | 1,219 | $73,246 |
| Median Family Income | 248 | $165,632 |
| Mean Family Income | 248 | $151,038 |
| Median Household Income | 465 | $161,250 |
| Mean Household Income | 465 | $181,890 |
| Income Deficit | 248 | $0 |
| Wage / Income Gap (%) | 1,219 | 0.00% |
| Wage / Income Gap ($) | 1,219 | 100.00¢ per $1 |
| Gini / Inequality Index | 1,219 | 0.51 |
Earnings by Sex in Fruitdale
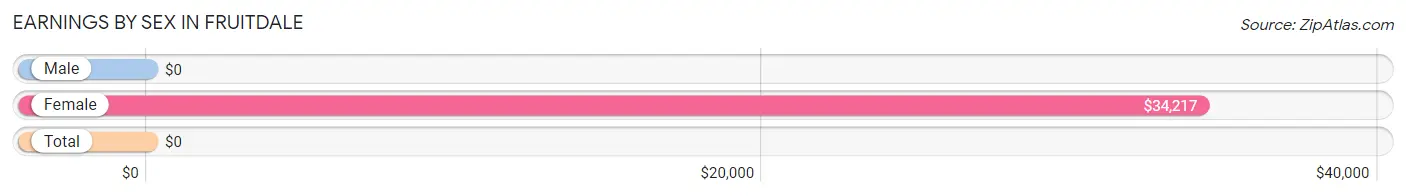
| Sex | Number | Average Earnings |
| Male | 380 (46.7%) | $0 |
| Female | 434 (53.3%) | $34,217 |
| Total | 814 (100.0%) | $0 |
Earnings by Sex by Income Bracket in Fruitdale
The most common earnings brackets in Fruitdale are $100,000+ for men (193 | 50.8%) and $100,000+ for women (132 | 30.4%).
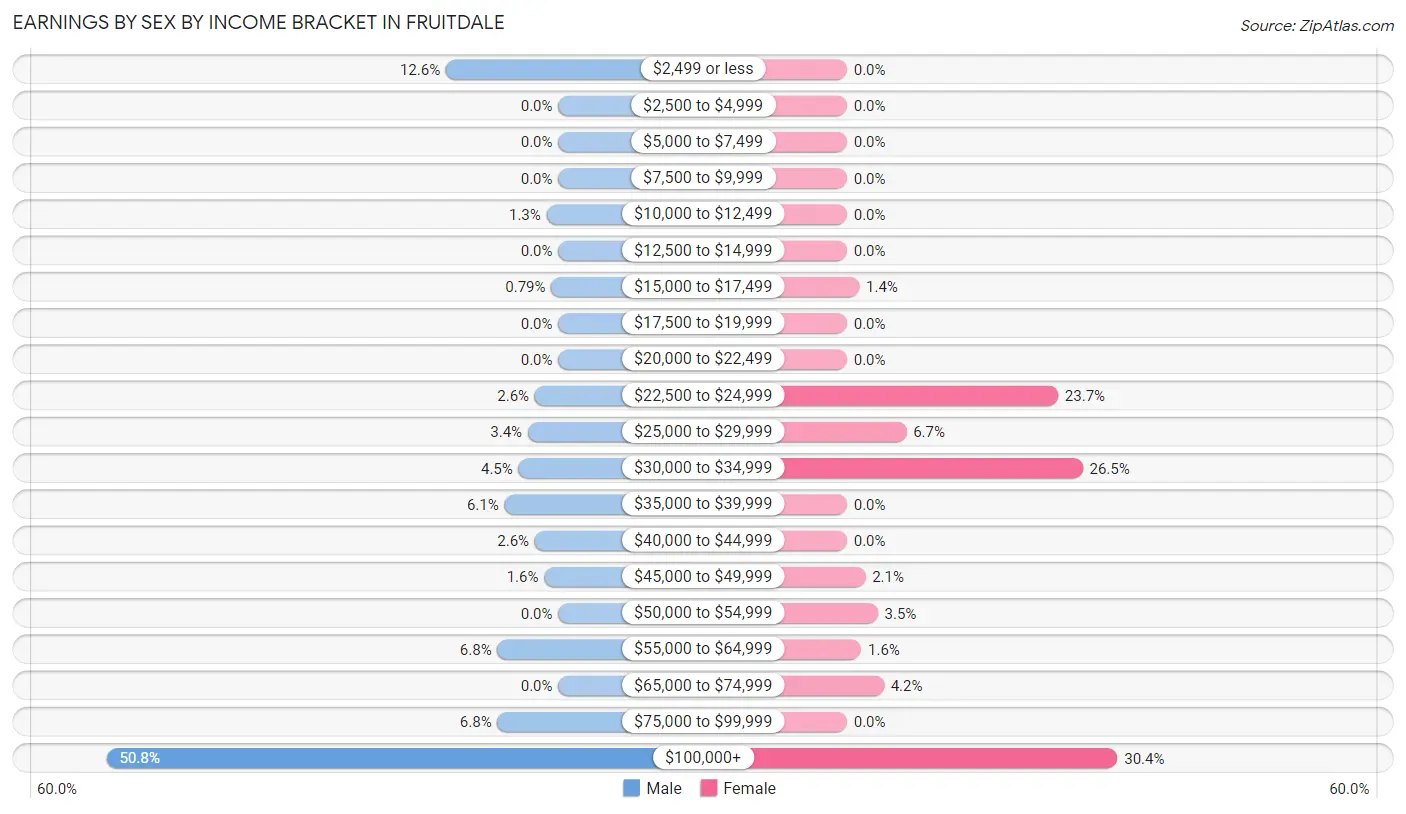
| Income | Male | Female |
| $2,499 or less | 48 (12.6%) | 0 (0.0%) |
| $2,500 to $4,999 | 0 (0.0%) | 0 (0.0%) |
| $5,000 to $7,499 | 0 (0.0%) | 0 (0.0%) |
| $7,500 to $9,999 | 0 (0.0%) | 0 (0.0%) |
| $10,000 to $12,499 | 5 (1.3%) | 0 (0.0%) |
| $12,500 to $14,999 | 0 (0.0%) | 0 (0.0%) |
| $15,000 to $17,499 | 3 (0.8%) | 6 (1.4%) |
| $17,500 to $19,999 | 0 (0.0%) | 0 (0.0%) |
| $20,000 to $22,499 | 0 (0.0%) | 0 (0.0%) |
| $22,500 to $24,999 | 10 (2.6%) | 103 (23.7%) |
| $25,000 to $29,999 | 13 (3.4%) | 29 (6.7%) |
| $30,000 to $34,999 | 17 (4.5%) | 115 (26.5%) |
| $35,000 to $39,999 | 23 (6.0%) | 0 (0.0%) |
| $40,000 to $44,999 | 10 (2.6%) | 0 (0.0%) |
| $45,000 to $49,999 | 6 (1.6%) | 9 (2.1%) |
| $50,000 to $54,999 | 0 (0.0%) | 15 (3.5%) |
| $55,000 to $64,999 | 26 (6.8%) | 7 (1.6%) |
| $65,000 to $74,999 | 0 (0.0%) | 18 (4.2%) |
| $75,000 to $99,999 | 26 (6.8%) | 0 (0.0%) |
| $100,000+ | 193 (50.8%) | 132 (30.4%) |
| Total | 380 (100.0%) | 434 (100.0%) |
Earnings by Sex by Educational Attainment in Fruitdale
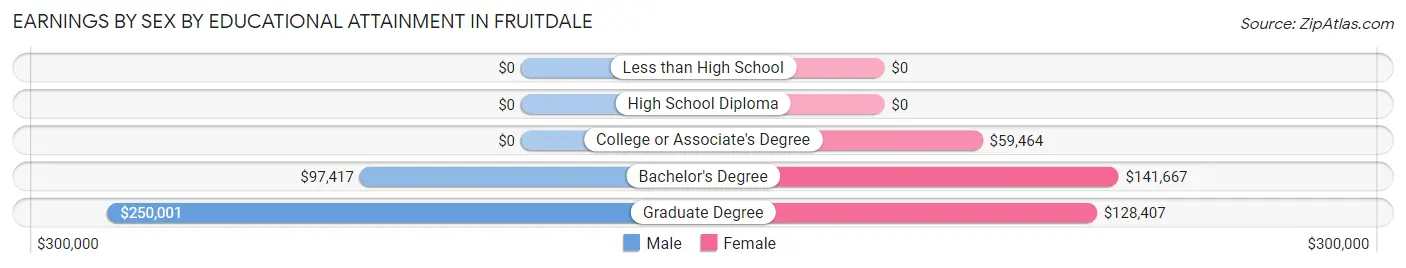
| Educational Attainment | Male Income | Female Income |
| Less than High School | - | - |
| High School Diploma | - | - |
| College or Associate's Degree | - | - |
| Bachelor's Degree | $97,417 | $141,667 |
| Graduate Degree | $250,001 | $128,407 |
| Total | - | - |
Family Income in Fruitdale
Family Income Brackets in Fruitdale
According to the Fruitdale family income data, there are 97 families falling into the $150,000 to $199,999 income range, which is the most common income bracket and makes up 39.1% of all families.
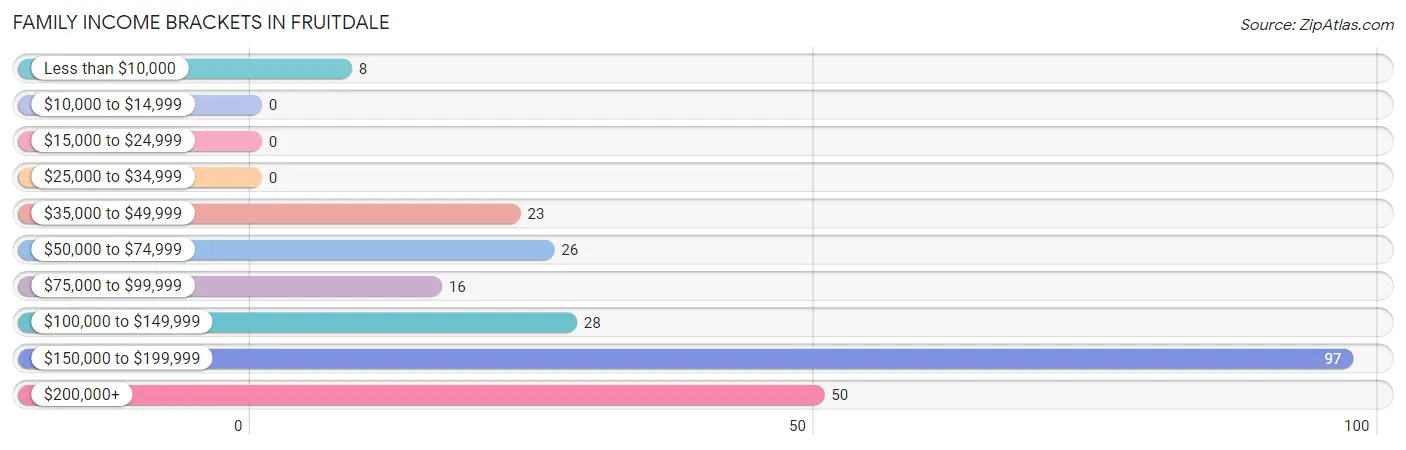
| Income Bracket | # Families | % Families |
| Less than $10,000 | 8 | 3.2% |
| $10,000 to $14,999 | 0 | 0.0% |
| $15,000 to $24,999 | 0 | 0.0% |
| $25,000 to $34,999 | 0 | 0.0% |
| $35,000 to $49,999 | 23 | 9.3% |
| $50,000 to $74,999 | 26 | 10.5% |
| $75,000 to $99,999 | 16 | 6.5% |
| $100,000 to $149,999 | 28 | 11.3% |
| $150,000 to $199,999 | 97 | 39.1% |
| $200,000+ | 50 | 20.2% |
Family Income by Famaliy Size in Fruitdale
3-person families (49 | 19.8%) account for the highest median family income in Fruitdale with $250,001 per family, while 3-person families (49 | 19.8%) have the highest median income of $83,334 per family member.
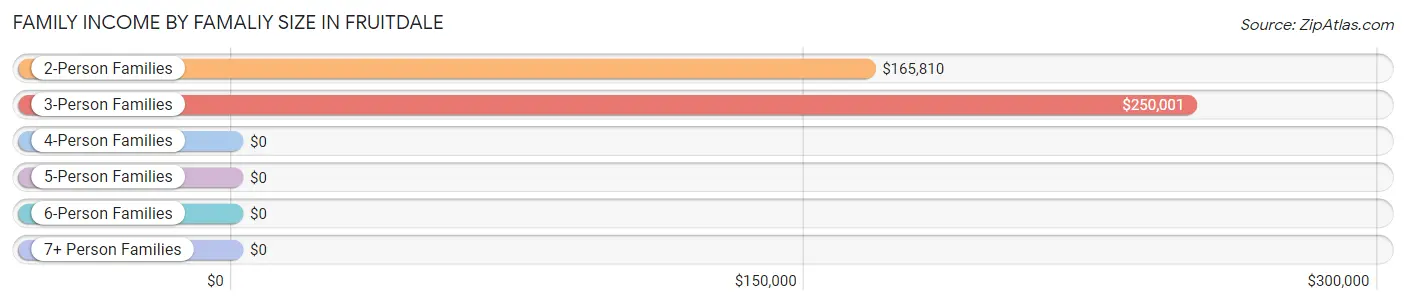
| Income Bracket | # Families | Median Income |
| 2-Person Families | 165 (66.5%) | $165,810 |
| 3-Person Families | 49 (19.8%) | $250,001 |
| 4-Person Families | 34 (13.7%) | $0 |
| 5-Person Families | 0 (0.0%) | $0 |
| 6-Person Families | 0 (0.0%) | $0 |
| 7+ Person Families | 0 (0.0%) | $0 |
| Total | 248 (100.0%) | $165,632 |
Family Income by Number of Earners in Fruitdale
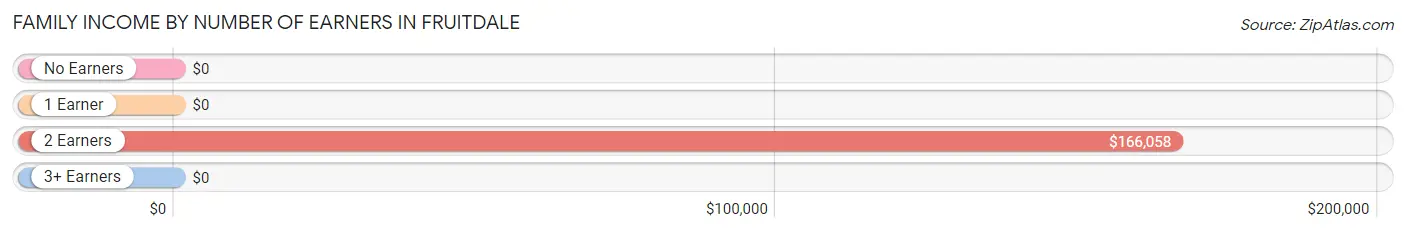
| Number of Earners | # Families | Median Income |
| No Earners | 21 (8.5%) | $0 |
| 1 Earner | 65 (26.2%) | $0 |
| 2 Earners | 135 (54.4%) | $166,058 |
| 3+ Earners | 27 (10.9%) | $0 |
| Total | 248 (100.0%) | $165,632 |
Household Income in Fruitdale
Household Income Brackets in Fruitdale
With 128 households falling in the category, the $150,000 to $199,999 income range is the most frequent in Fruitdale, accounting for 27.5% of all households. In contrast, only 9 households (1.9%) fall into the $15,000 to $24,999 income bracket, making it the least populous group.
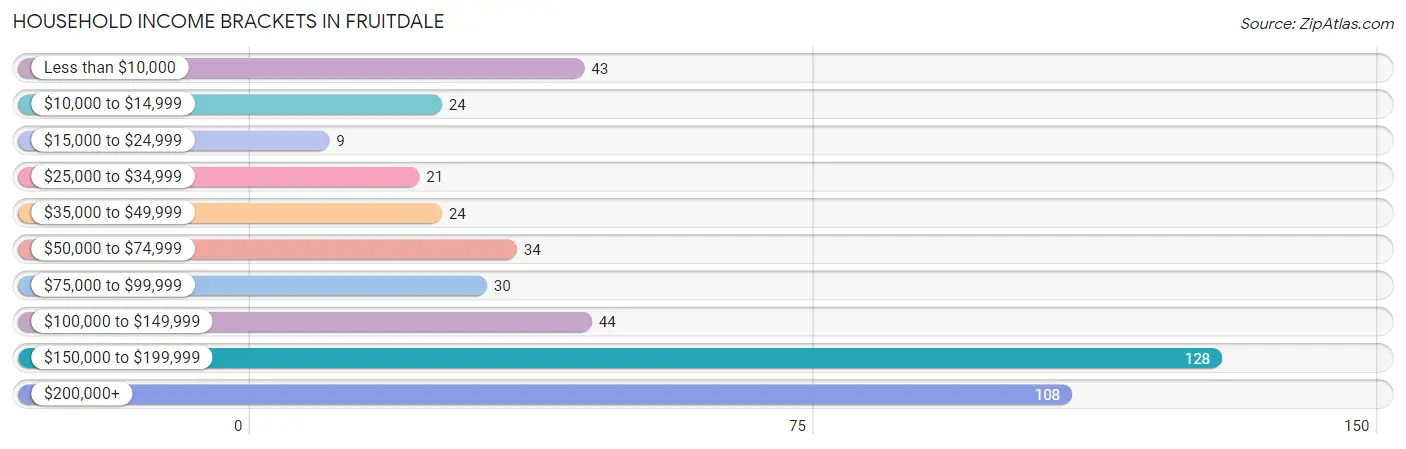
| Income Bracket | # Households | % Households |
| Less than $10,000 | 43 | 9.2% |
| $10,000 to $14,999 | 24 | 5.2% |
| $15,000 to $24,999 | 9 | 1.9% |
| $25,000 to $34,999 | 21 | 4.5% |
| $35,000 to $49,999 | 24 | 5.2% |
| $50,000 to $74,999 | 34 | 7.3% |
| $75,000 to $99,999 | 30 | 6.5% |
| $100,000 to $149,999 | 44 | 9.5% |
| $150,000 to $199,999 | 128 | 27.5% |
| $200,000+ | 108 | 23.2% |
Household Income by Householder Age in Fruitdale
The median household income in Fruitdale is $161,250, with the highest median household income of $250,001 found in the 25 to 44 years age bracket for the primary householder. A total of 120 households (25.8%) fall into this category. Meanwhile, the 15 to 24 years age bracket for the primary householder has the lowest median household income of $0, with 31 households (6.7%) in this group.
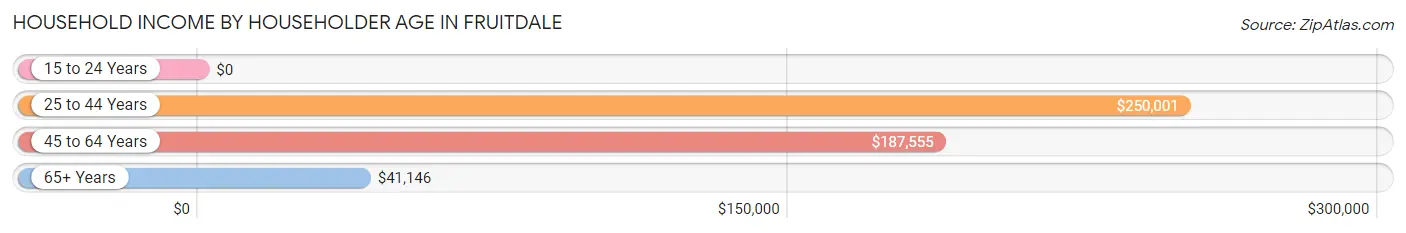
| Income Bracket | # Households | Median Income |
| 15 to 24 Years | 31 (6.7%) | $0 |
| 25 to 44 Years | 120 (25.8%) | $250,001 |
| 45 to 64 Years | 200 (43.0%) | $187,555 |
| 65+ Years | 114 (24.5%) | $41,146 |
| Total | 465 (100.0%) | $161,250 |
Poverty in Fruitdale
Income Below Poverty by Sex and Age in Fruitdale
With 5.9% poverty level for males and 11.6% for females among the residents of Fruitdale, 75 year old and over males and 15 year old females are the most vulnerable to poverty, with 10 males (52.6%) and 10 females (100.0%) in their respective age groups living below the poverty level.
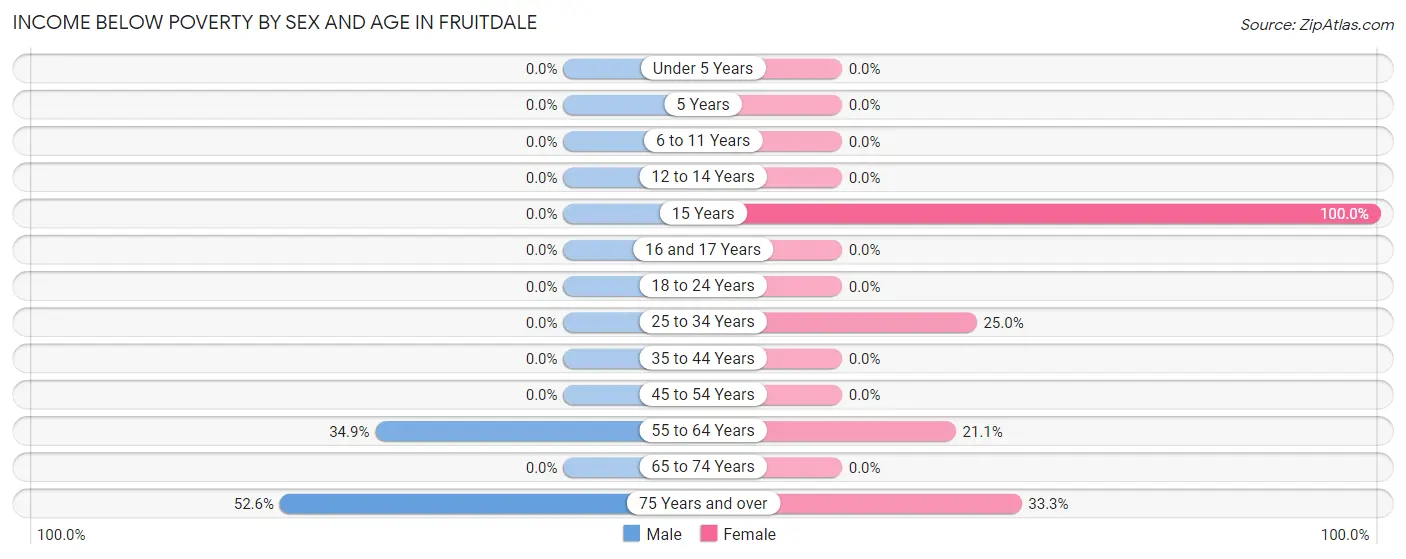
| Age Bracket | Male | Female |
| Under 5 Years | 0 (0.0%) | 0 (0.0%) |
| 5 Years | 0 (0.0%) | 0 (0.0%) |
| 6 to 11 Years | 0 (0.0%) | 0 (0.0%) |
| 12 to 14 Years | 0 (0.0%) | 0 (0.0%) |
| 15 Years | 0 (0.0%) | 10 (100.0%) |
| 16 and 17 Years | 0 (0.0%) | 0 (0.0%) |
| 18 to 24 Years | 0 (0.0%) | 0 (0.0%) |
| 25 to 34 Years | 0 (0.0%) | 5 (25.0%) |
| 35 to 44 Years | 0 (0.0%) | 0 (0.0%) |
| 45 to 54 Years | 0 (0.0%) | 0 (0.0%) |
| 55 to 64 Years | 22 (34.9%) | 41 (21.1%) |
| 65 to 74 Years | 0 (0.0%) | 0 (0.0%) |
| 75 Years and over | 10 (52.6%) | 16 (33.3%) |
| Total | 32 (5.9%) | 72 (11.6%) |
Income Above Poverty by Sex and Age in Fruitdale
According to the poverty statistics in Fruitdale, males aged under 5 years and females aged 5 years are the age groups that are most secure financially, with 100.0% of males and 100.0% of females in these age groups living above the poverty line.
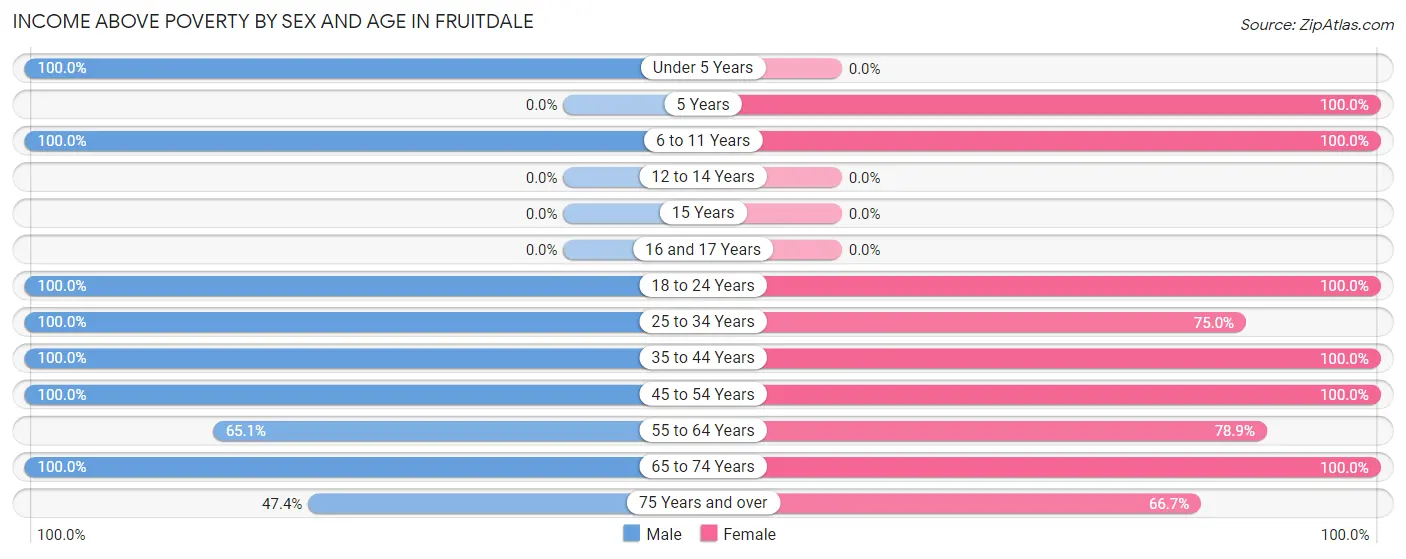
| Age Bracket | Male | Female |
| Under 5 Years | 15 (100.0%) | 0 (0.0%) |
| 5 Years | 0 (0.0%) | 14 (100.0%) |
| 6 to 11 Years | 23 (100.0%) | 23 (100.0%) |
| 12 to 14 Years | 0 (0.0%) | 0 (0.0%) |
| 15 Years | 0 (0.0%) | 0 (0.0%) |
| 16 and 17 Years | 0 (0.0%) | 0 (0.0%) |
| 18 to 24 Years | 38 (100.0%) | 239 (100.0%) |
| 25 to 34 Years | 255 (100.0%) | 15 (75.0%) |
| 35 to 44 Years | 50 (100.0%) | 42 (100.0%) |
| 45 to 54 Years | 23 (100.0%) | 6 (100.0%) |
| 55 to 64 Years | 41 (65.1%) | 153 (78.9%) |
| 65 to 74 Years | 57 (100.0%) | 24 (100.0%) |
| 75 Years and over | 9 (47.4%) | 32 (66.7%) |
| Total | 511 (94.1%) | 548 (88.4%) |
Income Below Poverty Among Married-Couple Families in Fruitdale
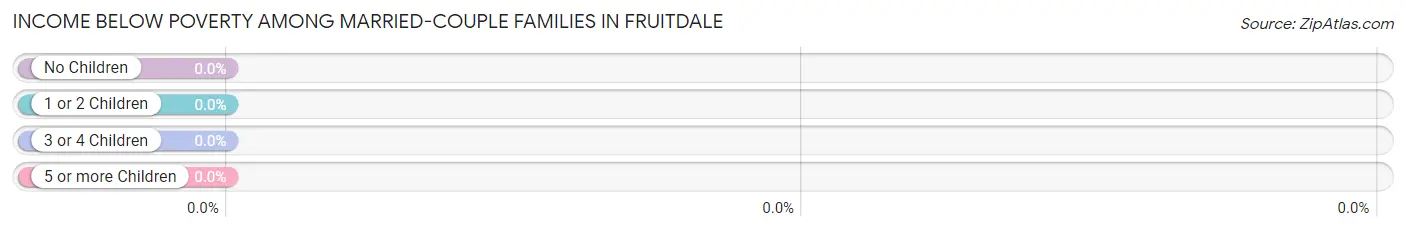
| Children | Above Poverty | Below Poverty |
| No Children | 73 (100.0%) | 0 (0.0%) |
| 1 or 2 Children | 13 (100.0%) | 0 (0.0%) |
| 3 or 4 Children | 0 (0.0%) | 0 (0.0%) |
| 5 or more Children | 0 (0.0%) | 0 (0.0%) |
| Total | 86 (100.0%) | 0 (0.0%) |
Income Below Poverty Among Single-Parent Households in Fruitdale
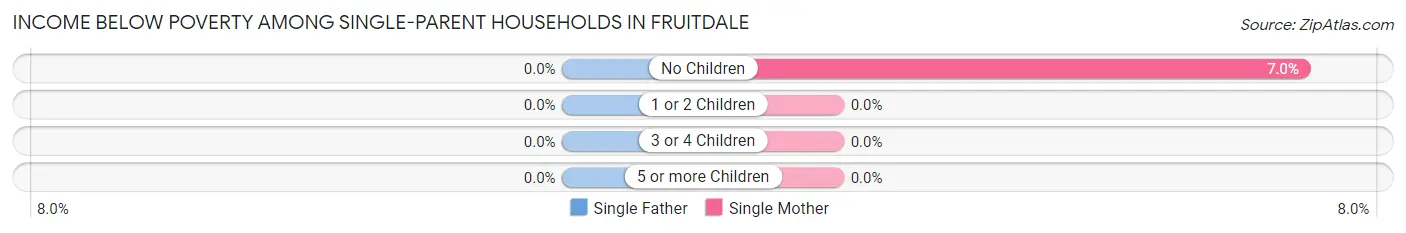
| Children | Single Father | Single Mother |
| No Children | 0 (0.0%) | 8 (7.0%) |
| 1 or 2 Children | 0 (0.0%) | 0 (0.0%) |
| 3 or 4 Children | 0 (0.0%) | 0 (0.0%) |
| 5 or more Children | 0 (0.0%) | 0 (0.0%) |
| Total | 0 (0.0%) | 8 (7.0%) |
Income Below Poverty Among Married-Couple vs Single-Parent Households in Fruitdale
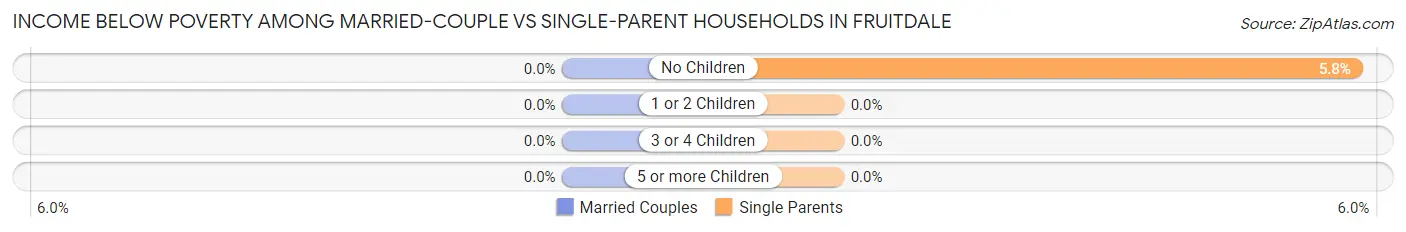
| Children | Married-Couple Families | Single-Parent Households |
| No Children | 0 (0.0%) | 8 (5.8%) |
| 1 or 2 Children | 0 (0.0%) | 0 (0.0%) |
| 3 or 4 Children | 0 (0.0%) | 0 (0.0%) |
| 5 or more Children | 0 (0.0%) | 0 (0.0%) |
| Total | 0 (0.0%) | 8 (4.9%) |
Employment Characteristics in Fruitdale
Employment by Class of Employer in Fruitdale
Among the 780 employed individuals in Fruitdale, private company employees (430 | 55.1%), not-for-profit organizations (139 | 17.8%), and local government employees (116 | 14.9%) make up the most common classes of employment.
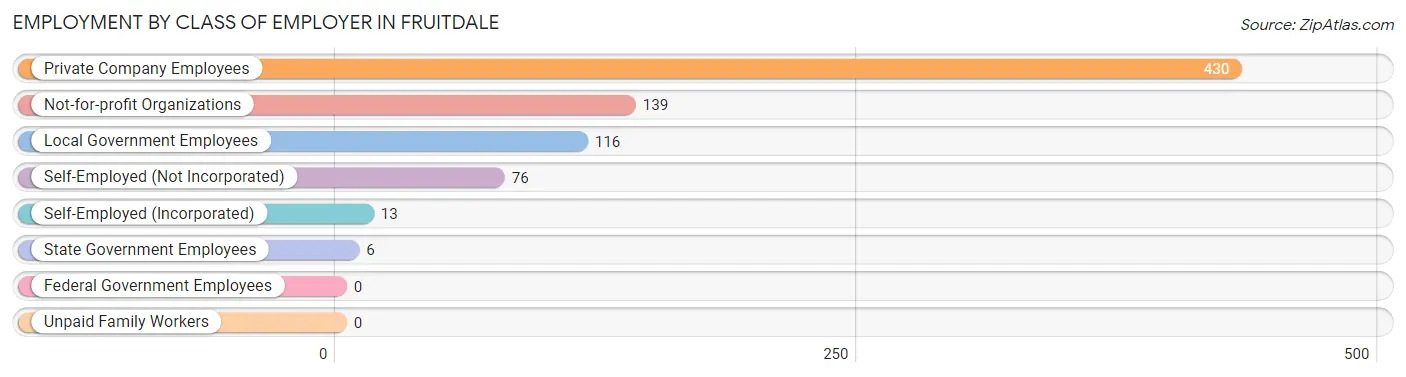
| Employer Class | # Employees | % Employees |
| Private Company Employees | 430 | 55.1% |
| Self-Employed (Incorporated) | 13 | 1.7% |
| Self-Employed (Not Incorporated) | 76 | 9.7% |
| Not-for-profit Organizations | 139 | 17.8% |
| Local Government Employees | 116 | 14.9% |
| State Government Employees | 6 | 0.8% |
| Federal Government Employees | 0 | 0.0% |
| Unpaid Family Workers | 0 | 0.0% |
| Total | 780 | 100.0% |
Employment Status by Age in Fruitdale
According to the labor force statistics for Fruitdale, out of the total population over 16 years of age (1,101), 74.3% or 818 individuals are in the labor force, with 4.6% or 38 of them unemployed. The age group with the highest labor force participation rate is 16 to 19 years, with 100.0% or 18 individuals in the labor force. Within the labor force, the 16 to 19 years age range has the highest percentage of unemployed individuals, with 100.0% or 18 of them being unemployed.
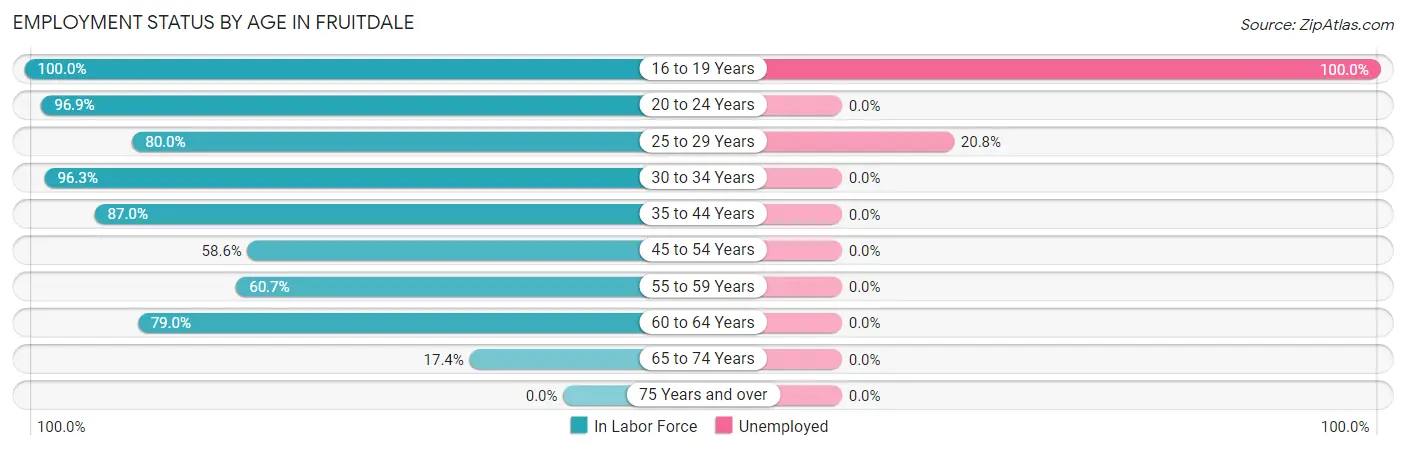
| Age Bracket | In Labor Force | Unemployed |
| 16 to 19 Years | 18 (100.0%) | 18 (100.0%) |
| 20 to 24 Years | 251 (96.9%) | 0 (0.0%) |
| 25 to 29 Years | 96 (80.0%) | 20 (20.8%) |
| 30 to 34 Years | 155 (96.3%) | 0 (0.0%) |
| 35 to 44 Years | 80 (87.0%) | 0 (0.0%) |
| 45 to 54 Years | 17 (58.6%) | 0 (0.0%) |
| 55 to 59 Years | 88 (60.7%) | 0 (0.0%) |
| 60 to 64 Years | 98 (79.0%) | 0 (0.0%) |
| 65 to 74 Years | 15 (17.4%) | 0 (0.0%) |
| 75 Years and over | 0 (0.0%) | 0 (0.0%) |
| Total | 818 (74.3%) | 38 (4.6%) |
Employment Status by Educational Attainment in Fruitdale
According to labor force statistics for Fruitdale, 79.6% of individuals (534) out of the total population between 25 and 64 years of age (671) are in the labor force, with 3.7% or 20 of them being unemployed. The group with the highest labor force participation rate are those with the educational attainment of bachelor's degree or higher, with 81.3% or 382 individuals in the labor force. Within the labor force, individuals with bachelor's degree or higher education have the highest percentage of unemployment, with 5.2% or 20 of them being unemployed.
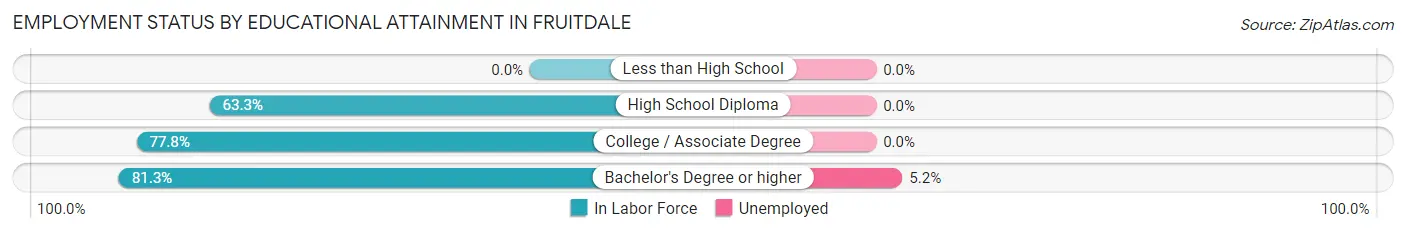
| Educational Attainment | In Labor Force | Unemployed |
| Less than High School | 0 (0.0%) | 0 (0.0%) |
| High School Diploma | 19 (63.3%) | 0 (0.0%) |
| College / Associate Degree | 133 (77.8%) | 0 (0.0%) |
| Bachelor's Degree or higher | 382 (81.3%) | 24 (5.2%) |
| Total | 534 (79.6%) | 25 (3.7%) |
Employment Occupations by Sex in Fruitdale
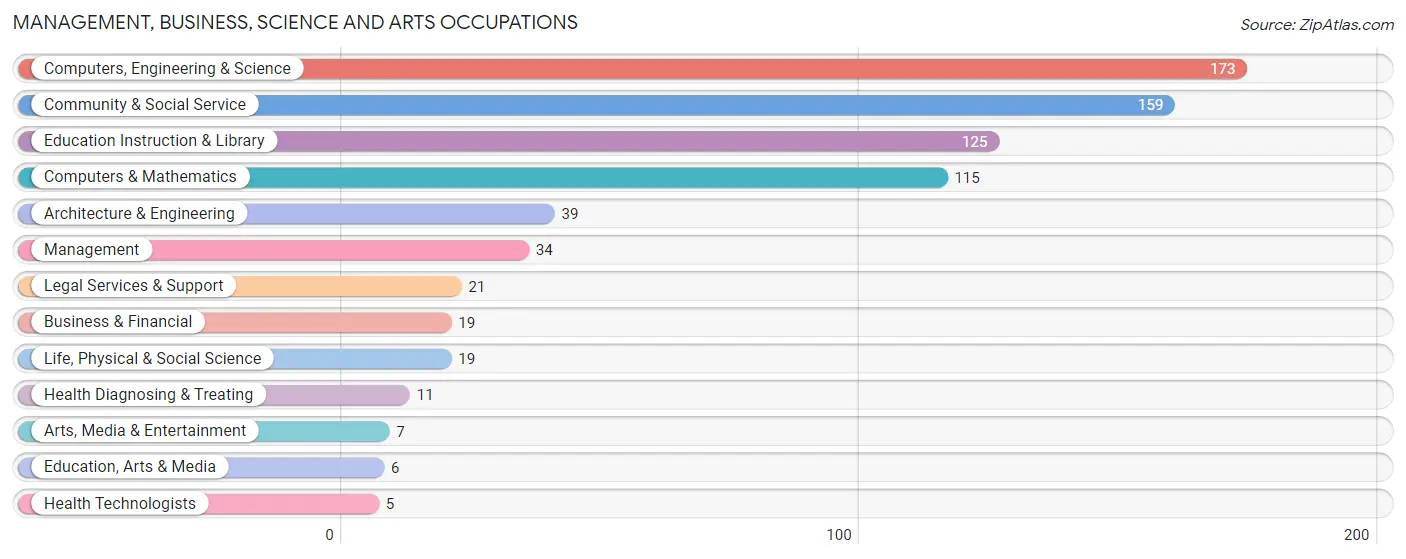
Management, Business, Science and Arts Occupations
The most common Management, Business, Science and Arts occupations in Fruitdale are Computers, Engineering & Science (173 | 22.2%), Community & Social Service (159 | 20.4%), Education Instruction & Library (125 | 16.0%), Computers & Mathematics (115 | 14.7%), and Architecture & Engineering (39 | 5.0%).
Management, Business, Science and Arts Occupations by Sex
Within the Management, Business, Science and Arts occupations in Fruitdale, the most male-oriented occupations are Business & Financial (100.0%), Computers & Mathematics (100.0%), and Architecture & Engineering (100.0%), while the most female-oriented occupations are Legal Services & Support (100.0%), Health Technologists (100.0%), and Education Instruction & Library (95.2%).
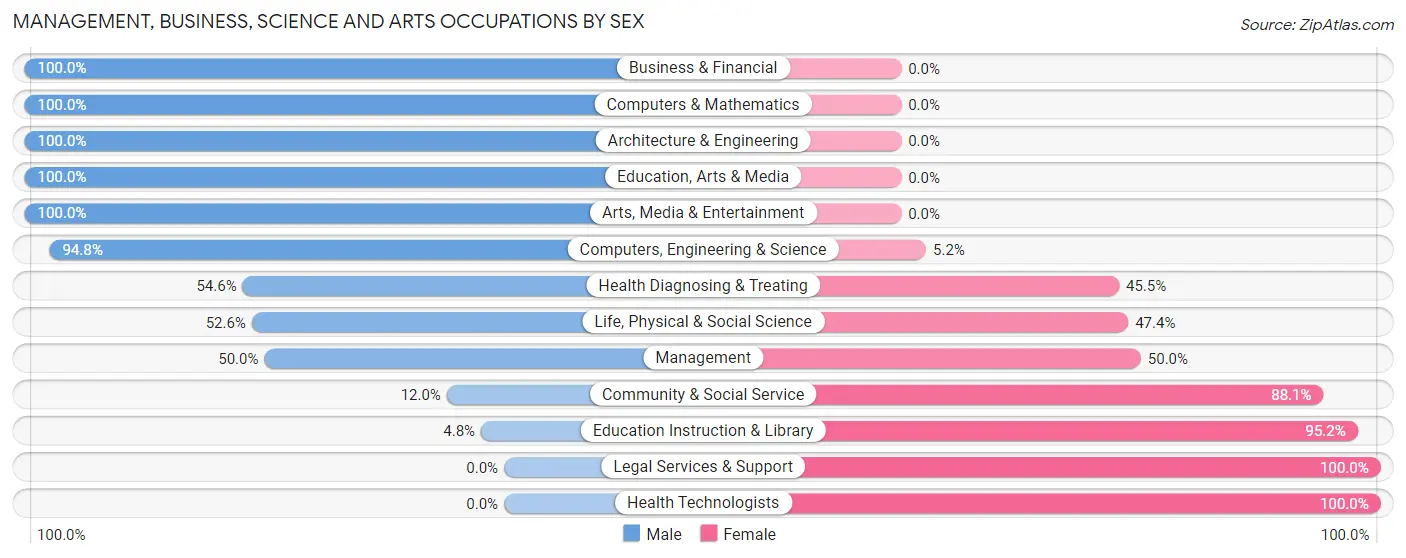
| Occupation | Male | Female |
| Management | 17 (50.0%) | 17 (50.0%) |
| Business & Financial | 19 (100.0%) | 0 (0.0%) |
| Computers, Engineering & Science | 164 (94.8%) | 9 (5.2%) |
| Computers & Mathematics | 115 (100.0%) | 0 (0.0%) |
| Architecture & Engineering | 39 (100.0%) | 0 (0.0%) |
| Life, Physical & Social Science | 10 (52.6%) | 9 (47.4%) |
| Community & Social Service | 19 (11.9%) | 140 (88.0%) |
| Education, Arts & Media | 6 (100.0%) | 0 (0.0%) |
| Legal Services & Support | 0 (0.0%) | 21 (100.0%) |
| Education Instruction & Library | 6 (4.8%) | 119 (95.2%) |
| Arts, Media & Entertainment | 7 (100.0%) | 0 (0.0%) |
| Health Diagnosing & Treating | 6 (54.5%) | 5 (45.5%) |
| Health Technologists | 0 (0.0%) | 5 (100.0%) |
| Total (Category) | 225 (56.8%) | 171 (43.2%) |
| Total (Overall) | 346 (44.4%) | 434 (55.6%) |
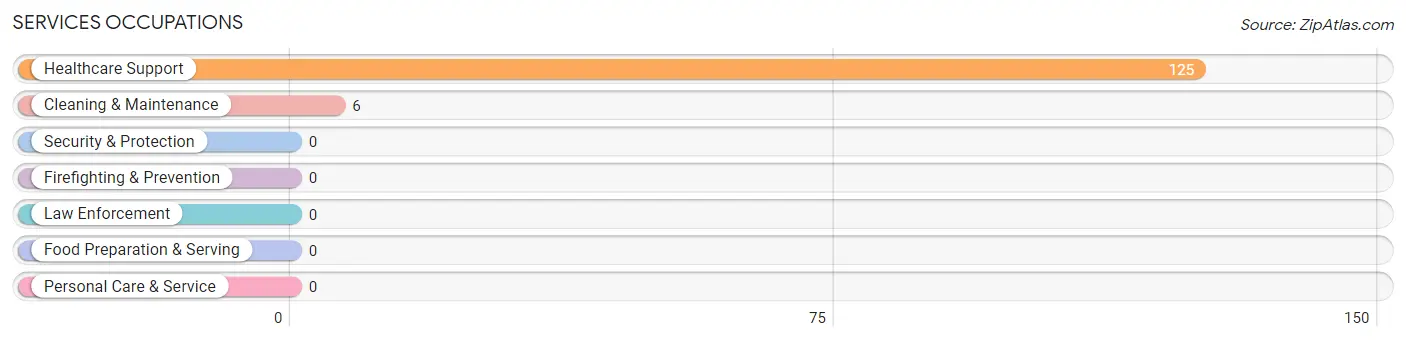
Services Occupations
The most common Services occupations in Fruitdale are Healthcare Support (125 | 16.0%), and Cleaning & Maintenance (6 | 0.8%).
Services Occupations by Sex
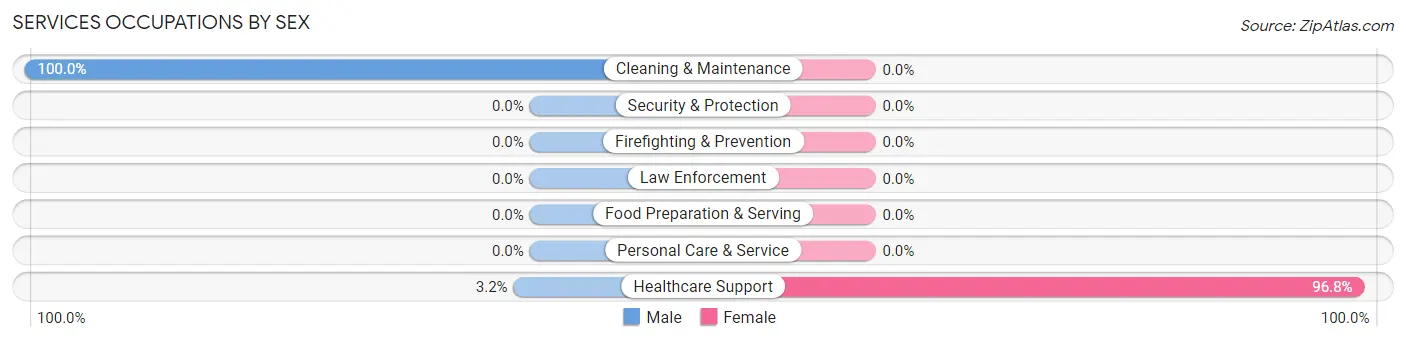
| Occupation | Male | Female |
| Healthcare Support | 4 (3.2%) | 121 (96.8%) |
| Security & Protection | 0 (0.0%) | 0 (0.0%) |
| Firefighting & Prevention | 0 (0.0%) | 0 (0.0%) |
| Law Enforcement | 0 (0.0%) | 0 (0.0%) |
| Food Preparation & Serving | 0 (0.0%) | 0 (0.0%) |
| Cleaning & Maintenance | 6 (100.0%) | 0 (0.0%) |
| Personal Care & Service | 0 (0.0%) | 0 (0.0%) |
| Total (Category) | 10 (7.6%) | 121 (92.4%) |
| Total (Overall) | 346 (44.4%) | 434 (55.6%) |
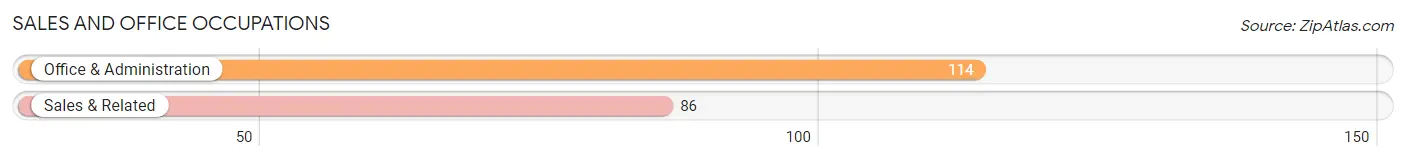
Sales and Office Occupations
The most common Sales and Office occupations in Fruitdale are Office & Administration (114 | 14.6%), and Sales & Related (86 | 11.0%).
Sales and Office Occupations by Sex
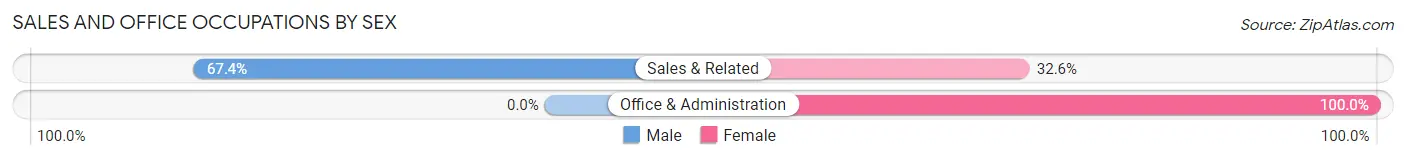
| Occupation | Male | Female |
| Sales & Related | 58 (67.4%) | 28 (32.6%) |
| Office & Administration | 0 (0.0%) | 114 (100.0%) |
| Total (Category) | 58 (29.0%) | 142 (71.0%) |
| Total (Overall) | 346 (44.4%) | 434 (55.6%) |
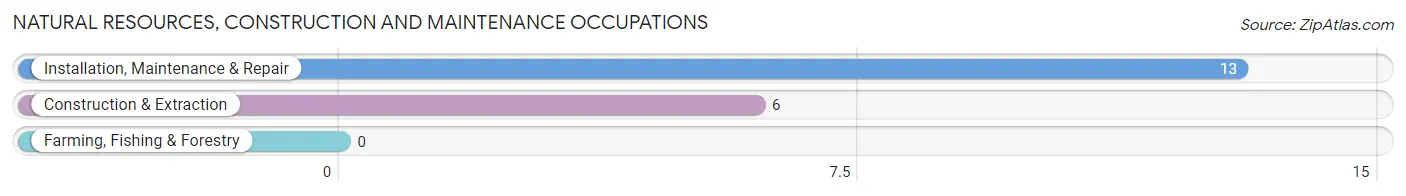
Natural Resources, Construction and Maintenance Occupations
The most common Natural Resources, Construction and Maintenance occupations in Fruitdale are Installation, Maintenance & Repair (13 | 1.7%), and Construction & Extraction (6 | 0.8%).
Natural Resources, Construction and Maintenance Occupations by Sex
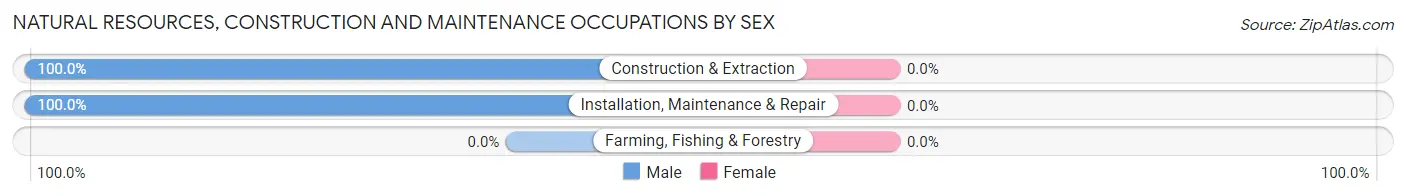
| Occupation | Male | Female |
| Farming, Fishing & Forestry | 0 (0.0%) | 0 (0.0%) |
| Construction & Extraction | 6 (100.0%) | 0 (0.0%) |
| Installation, Maintenance & Repair | 13 (100.0%) | 0 (0.0%) |
| Total (Category) | 19 (100.0%) | 0 (0.0%) |
| Total (Overall) | 346 (44.4%) | 434 (55.6%) |
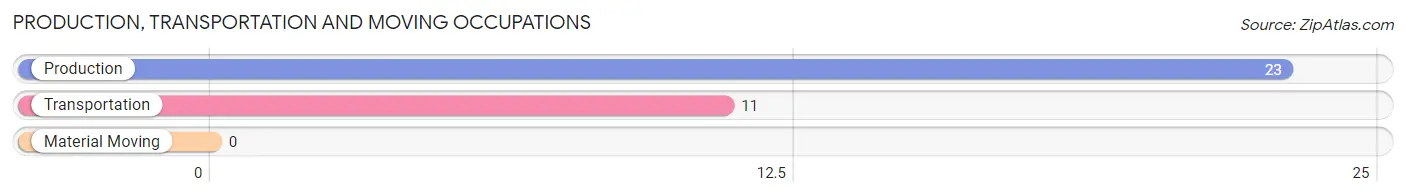
Production, Transportation and Moving Occupations
The most common Production, Transportation and Moving occupations in Fruitdale are Production (23 | 2.9%), and Transportation (11 | 1.4%).
Production, Transportation and Moving Occupations by Sex
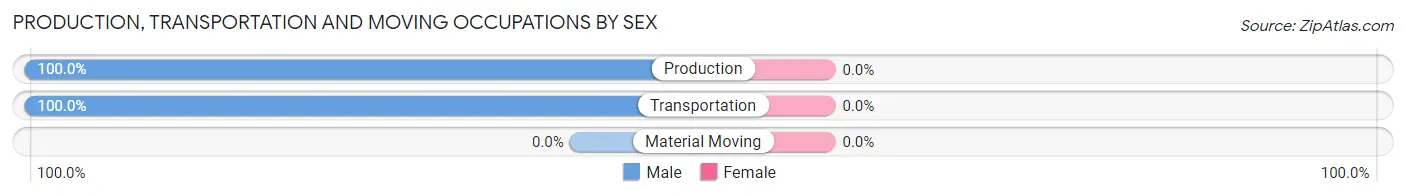
| Occupation | Male | Female |
| Production | 23 (100.0%) | 0 (0.0%) |
| Transportation | 11 (100.0%) | 0 (0.0%) |
| Material Moving | 0 (0.0%) | 0 (0.0%) |
| Total (Category) | 34 (100.0%) | 0 (0.0%) |
| Total (Overall) | 346 (44.4%) | 434 (55.6%) |
Employment Industries by Sex in Fruitdale
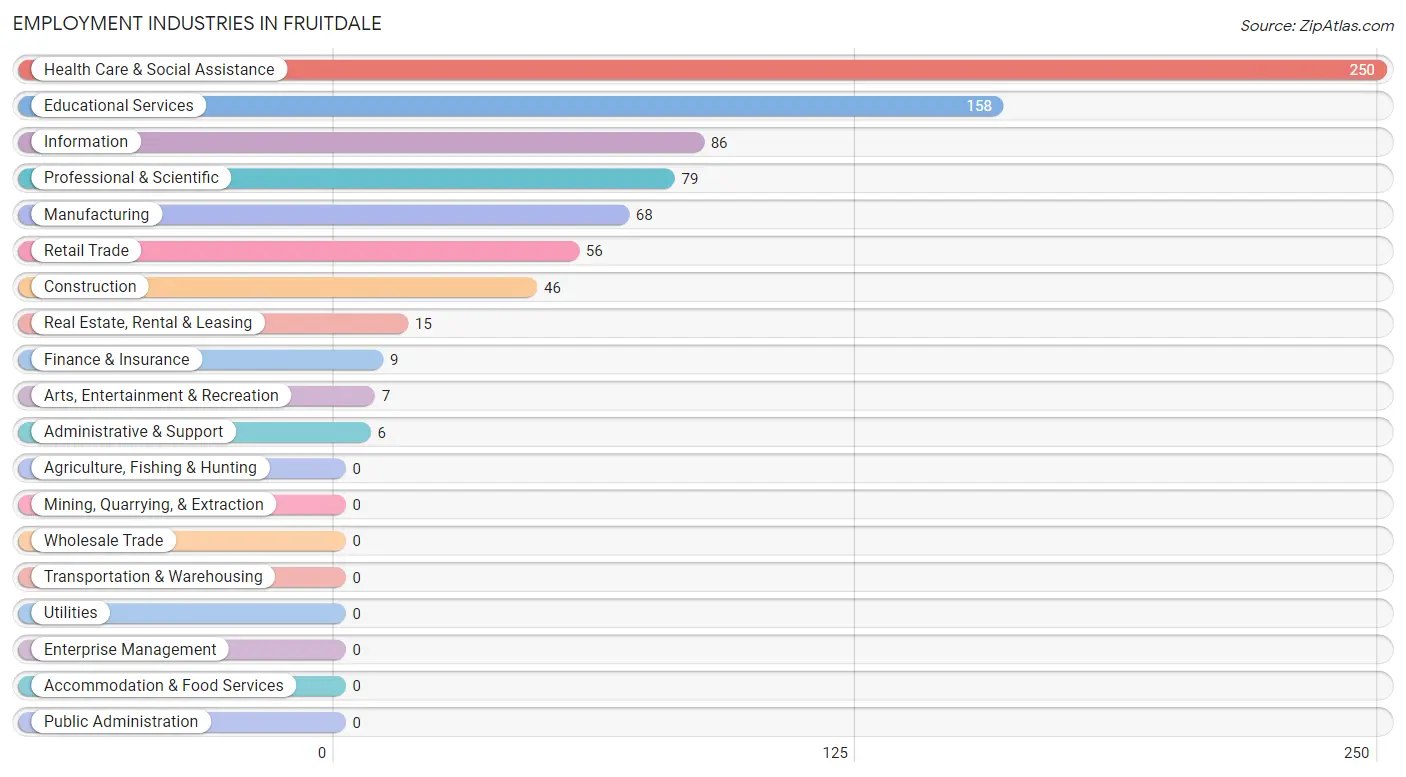
Employment Industries in Fruitdale
The major employment industries in Fruitdale include Health Care & Social Assistance (250 | 32.1%), Educational Services (158 | 20.3%), Information (86 | 11.0%), Professional & Scientific (79 | 10.1%), and Manufacturing (68 | 8.7%).
Employment Industries by Sex in Fruitdale
The Fruitdale industries that see more men than women are Construction (100.0%), Manufacturing (100.0%), and Information (100.0%), whereas the industries that tend to have a higher number of women are Finance & Insurance (100.0%), Health Care & Social Assistance (93.6%), and Educational Services (84.8%).
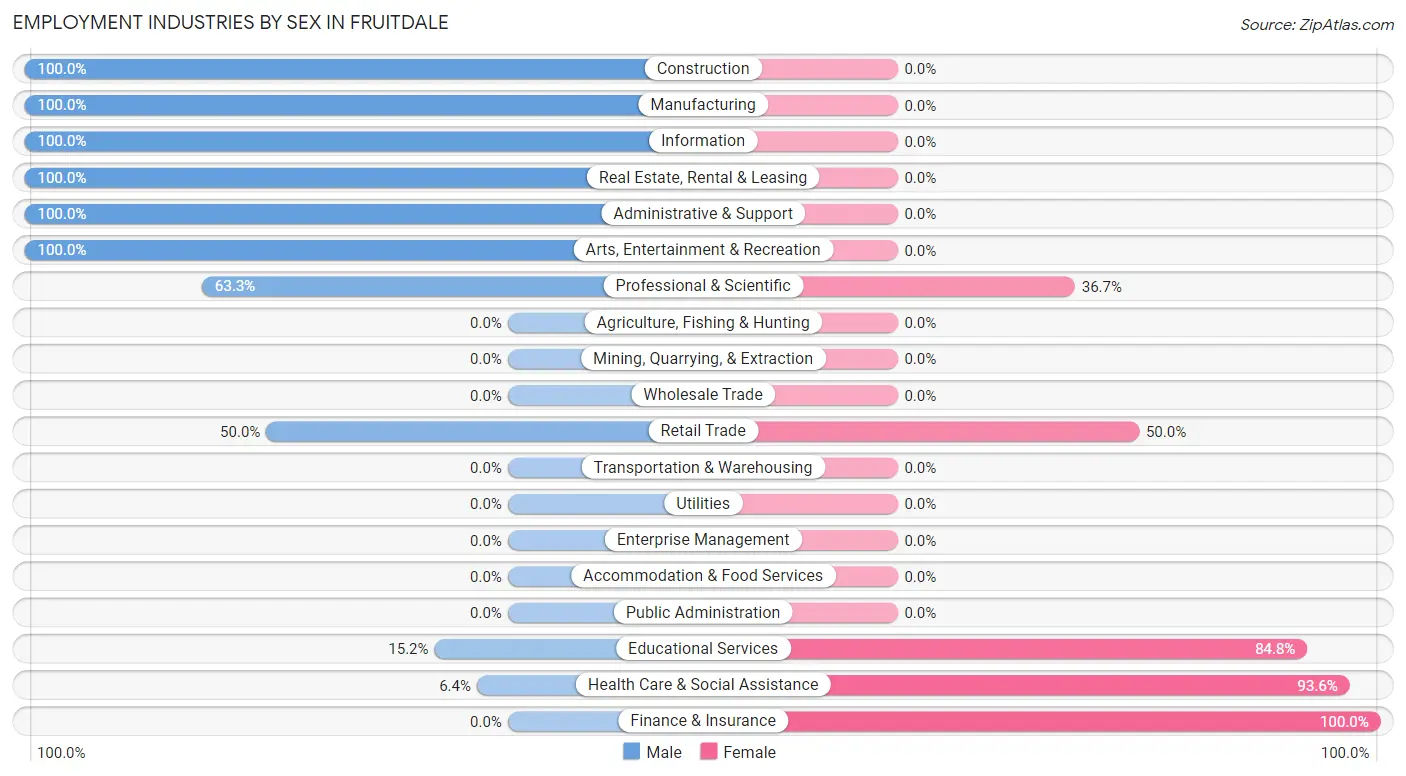
| Industry | Male | Female |
| Agriculture, Fishing & Hunting | 0 (0.0%) | 0 (0.0%) |
| Mining, Quarrying, & Extraction | 0 (0.0%) | 0 (0.0%) |
| Construction | 46 (100.0%) | 0 (0.0%) |
| Manufacturing | 68 (100.0%) | 0 (0.0%) |
| Wholesale Trade | 0 (0.0%) | 0 (0.0%) |
| Retail Trade | 28 (50.0%) | 28 (50.0%) |
| Transportation & Warehousing | 0 (0.0%) | 0 (0.0%) |
| Utilities | 0 (0.0%) | 0 (0.0%) |
| Information | 86 (100.0%) | 0 (0.0%) |
| Finance & Insurance | 0 (0.0%) | 9 (100.0%) |
| Real Estate, Rental & Leasing | 15 (100.0%) | 0 (0.0%) |
| Professional & Scientific | 50 (63.3%) | 29 (36.7%) |
| Enterprise Management | 0 (0.0%) | 0 (0.0%) |
| Administrative & Support | 6 (100.0%) | 0 (0.0%) |
| Educational Services | 24 (15.2%) | 134 (84.8%) |
| Health Care & Social Assistance | 16 (6.4%) | 234 (93.6%) |
| Arts, Entertainment & Recreation | 7 (100.0%) | 0 (0.0%) |
| Accommodation & Food Services | 0 (0.0%) | 0 (0.0%) |
| Public Administration | 0 (0.0%) | 0 (0.0%) |
| Total | 346 (44.4%) | 434 (55.6%) |
Education in Fruitdale
School Enrollment in Fruitdale
The most common levels of schooling among the 107 students in Fruitdale are elementary school (46 | 43.0%), college / undergraduate (21 | 19.6%), and high school (18 | 16.8%).
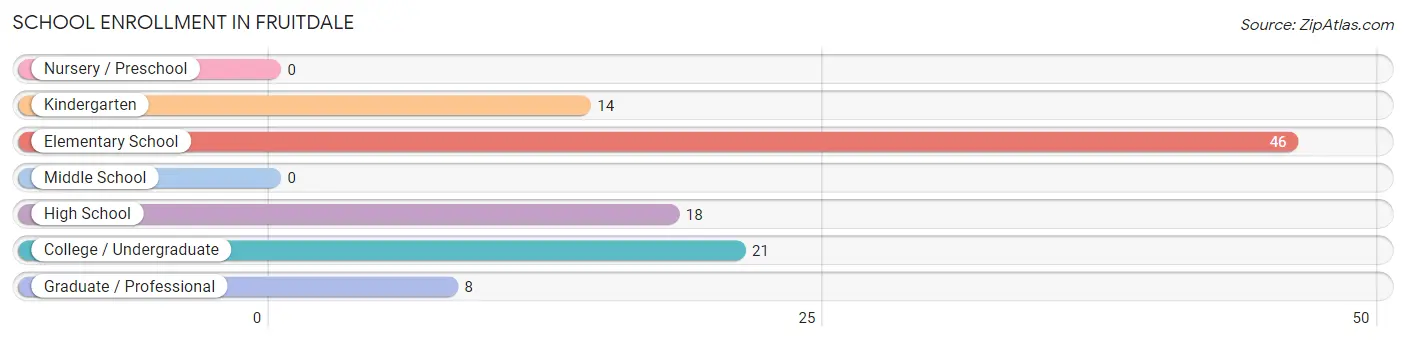
| School Level | # Students | % Students |
| Nursery / Preschool | 0 | 0.0% |
| Kindergarten | 14 | 13.1% |
| Elementary School | 46 | 43.0% |
| Middle School | 0 | 0.0% |
| High School | 18 | 16.8% |
| College / Undergraduate | 21 | 19.6% |
| Graduate / Professional | 8 | 7.5% |
| Total | 107 | 100.0% |
School Enrollment by Age by Funding Source in Fruitdale
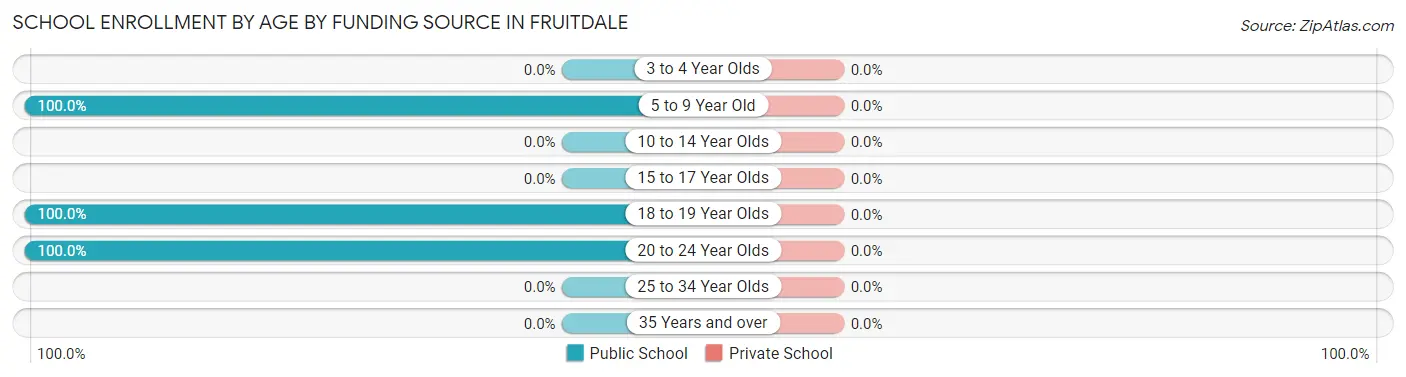
| Age Bracket | Public School | Private School |
| 3 to 4 Year Olds | 0 (0.0%) | 0 (0.0%) |
| 5 to 9 Year Old | 60 (100.0%) | 0 (0.0%) |
| 10 to 14 Year Olds | 0 (0.0%) | 0 (0.0%) |
| 15 to 17 Year Olds | 0 (0.0%) | 0 (0.0%) |
| 18 to 19 Year Olds | 18 (100.0%) | 0 (0.0%) |
| 20 to 24 Year Olds | 29 (100.0%) | 0 (0.0%) |
| 25 to 34 Year Olds | 0 (0.0%) | 0 (0.0%) |
| 35 Years and over | 0 (0.0%) | 0 (0.0%) |
| Total | 107 (100.0%) | 0 (0.0%) |
Educational Attainment by Field of Study in Fruitdale
Engineering (124 | 21.4%), psychology (108 | 18.6%), computers & mathematics (71 | 12.3%), business (55 | 9.5%), and social sciences (40 | 6.9%) are the most common fields of study among 579 individuals in Fruitdale who have obtained a bachelor's degree or higher.
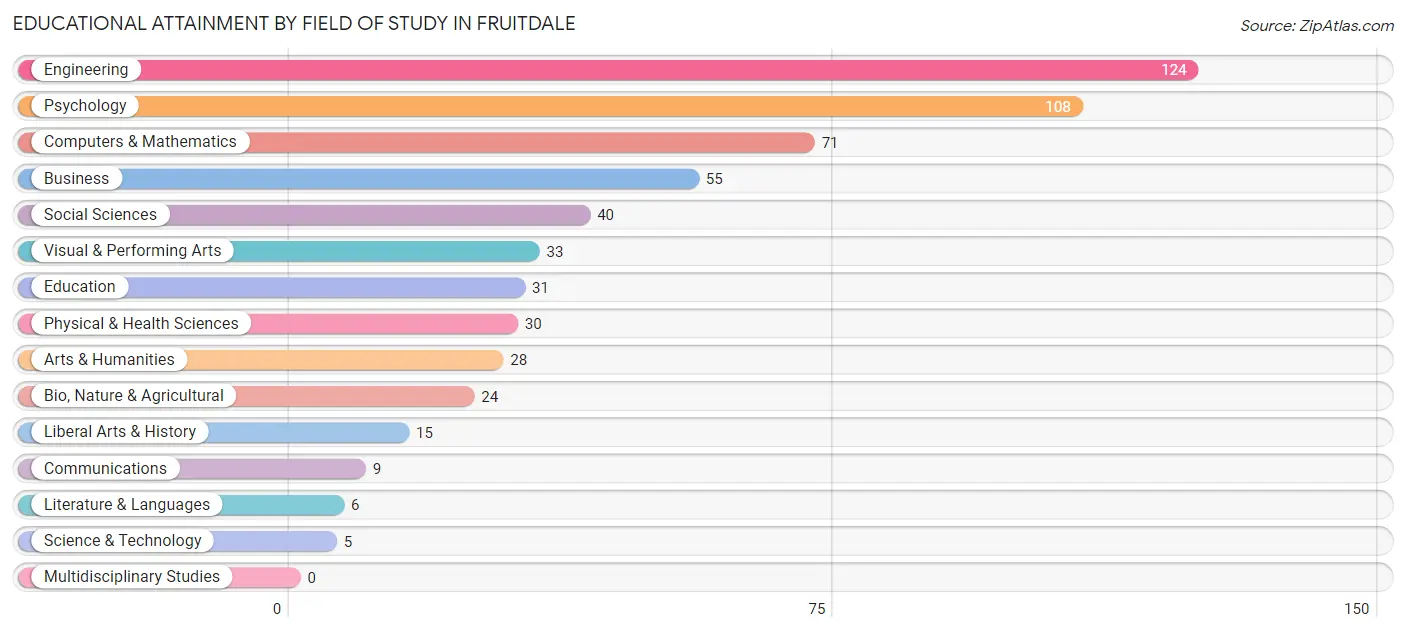
| Field of Study | # Graduates | % Graduates |
| Computers & Mathematics | 71 | 12.3% |
| Bio, Nature & Agricultural | 24 | 4.2% |
| Physical & Health Sciences | 30 | 5.2% |
| Psychology | 108 | 18.6% |
| Social Sciences | 40 | 6.9% |
| Engineering | 124 | 21.4% |
| Multidisciplinary Studies | 0 | 0.0% |
| Science & Technology | 5 | 0.9% |
| Business | 55 | 9.5% |
| Education | 31 | 5.3% |
| Literature & Languages | 6 | 1.0% |
| Liberal Arts & History | 15 | 2.6% |
| Visual & Performing Arts | 33 | 5.7% |
| Communications | 9 | 1.5% |
| Arts & Humanities | 28 | 4.8% |
| Total | 579 | 100.0% |
Transportation & Commute in Fruitdale
Vehicle Availability by Sex in Fruitdale
The most prevalent vehicle ownership categories in Fruitdale are males with 3 vehicles (207, accounting for 61.6%) and females with 3 vehicles (356, making up 47.7%).
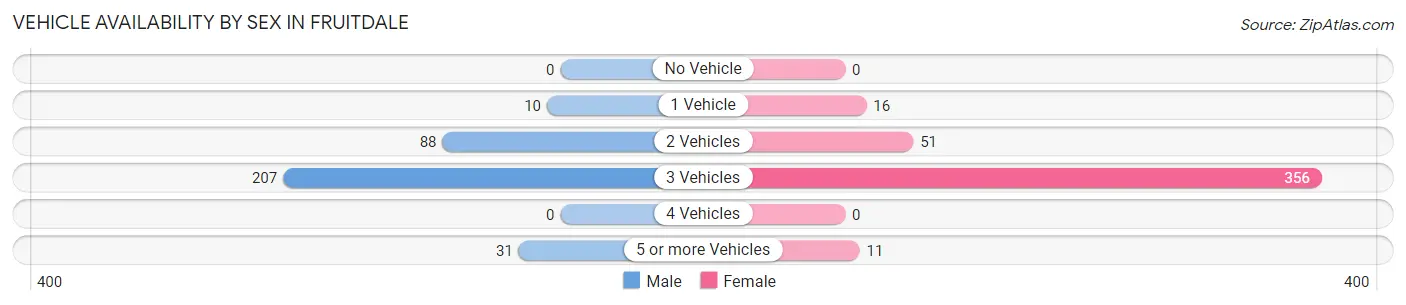
| Vehicles Available | Male | Female |
| No Vehicle | 0 (0.0%) | 0 (0.0%) |
| 1 Vehicle | 10 (3.0%) | 16 (3.7%) |
| 2 Vehicles | 88 (26.2%) | 51 (11.7%) |
| 3 Vehicles | 207 (61.6%) | 356 (82.0%) |
| 4 Vehicles | 0 (0.0%) | 0 (0.0%) |
| 5 or more Vehicles | 31 (9.2%) | 11 (2.5%) |
| Total | 336 (100.0%) | 434 (100.0%) |
Commute Time in Fruitdale
The most frequently occuring commute durations in Fruitdale are 20 to 24 minutes (154 commuters, 33.5%), 15 to 19 minutes (109 commuters, 23.7%), and 30 to 34 minutes (88 commuters, 19.1%).
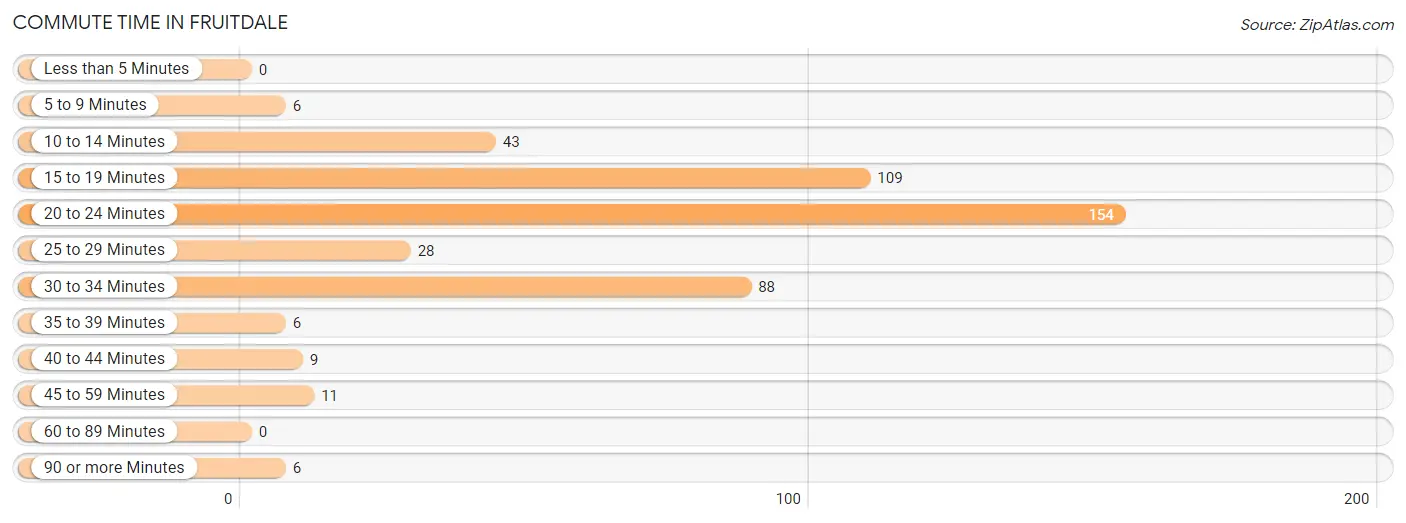
| Commute Time | # Commuters | % Commuters |
| Less than 5 Minutes | 0 | 0.0% |
| 5 to 9 Minutes | 6 | 1.3% |
| 10 to 14 Minutes | 43 | 9.3% |
| 15 to 19 Minutes | 109 | 23.7% |
| 20 to 24 Minutes | 154 | 33.5% |
| 25 to 29 Minutes | 28 | 6.1% |
| 30 to 34 Minutes | 88 | 19.1% |
| 35 to 39 Minutes | 6 | 1.3% |
| 40 to 44 Minutes | 9 | 2.0% |
| 45 to 59 Minutes | 11 | 2.4% |
| 60 to 89 Minutes | 0 | 0.0% |
| 90 or more Minutes | 6 | 1.3% |
Commute Time by Sex in Fruitdale
The most common commute times in Fruitdale are 15 to 19 minutes (96 commuters, 36.2%) for males and 20 to 24 minutes (110 commuters, 56.4%) for females.
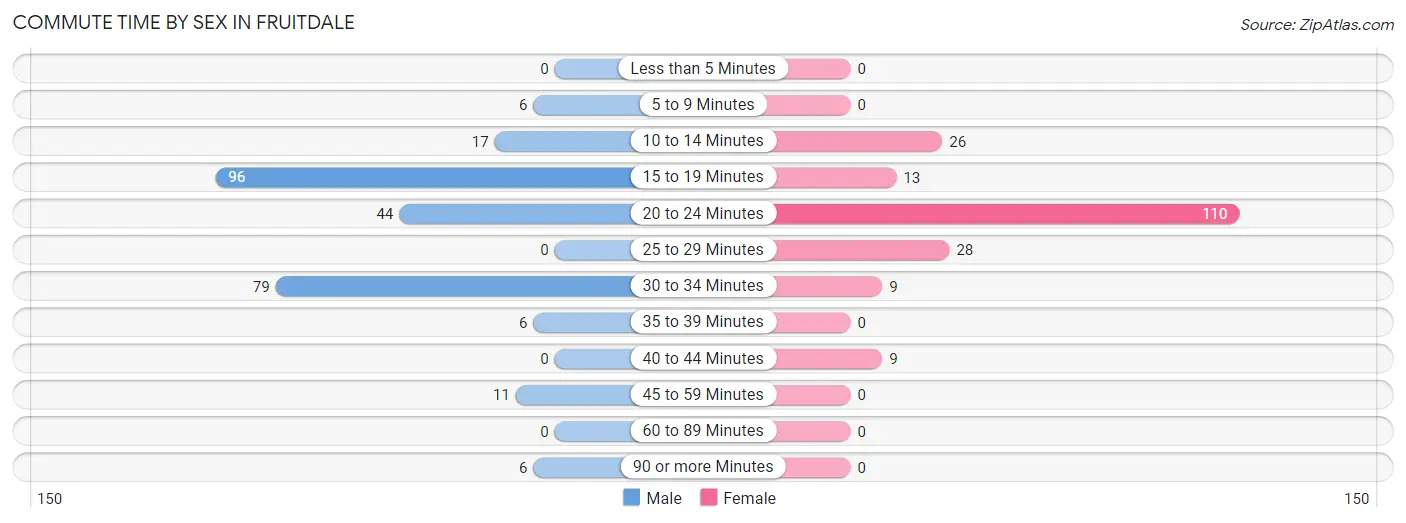
| Commute Time | Male | Female |
| Less than 5 Minutes | 0 (0.0%) | 0 (0.0%) |
| 5 to 9 Minutes | 6 (2.3%) | 0 (0.0%) |
| 10 to 14 Minutes | 17 (6.4%) | 26 (13.3%) |
| 15 to 19 Minutes | 96 (36.2%) | 13 (6.7%) |
| 20 to 24 Minutes | 44 (16.6%) | 110 (56.4%) |
| 25 to 29 Minutes | 0 (0.0%) | 28 (14.4%) |
| 30 to 34 Minutes | 79 (29.8%) | 9 (4.6%) |
| 35 to 39 Minutes | 6 (2.3%) | 0 (0.0%) |
| 40 to 44 Minutes | 0 (0.0%) | 9 (4.6%) |
| 45 to 59 Minutes | 11 (4.2%) | 0 (0.0%) |
| 60 to 89 Minutes | 0 (0.0%) | 0 (0.0%) |
| 90 or more Minutes | 6 (2.3%) | 0 (0.0%) |
Time of Departure to Work by Sex in Fruitdale
The most frequent times of departure to work in Fruitdale are 7:30 AM to 7:59 AM (178, 67.2%) for males and 7:30 AM to 7:59 AM (138, 70.8%) for females.
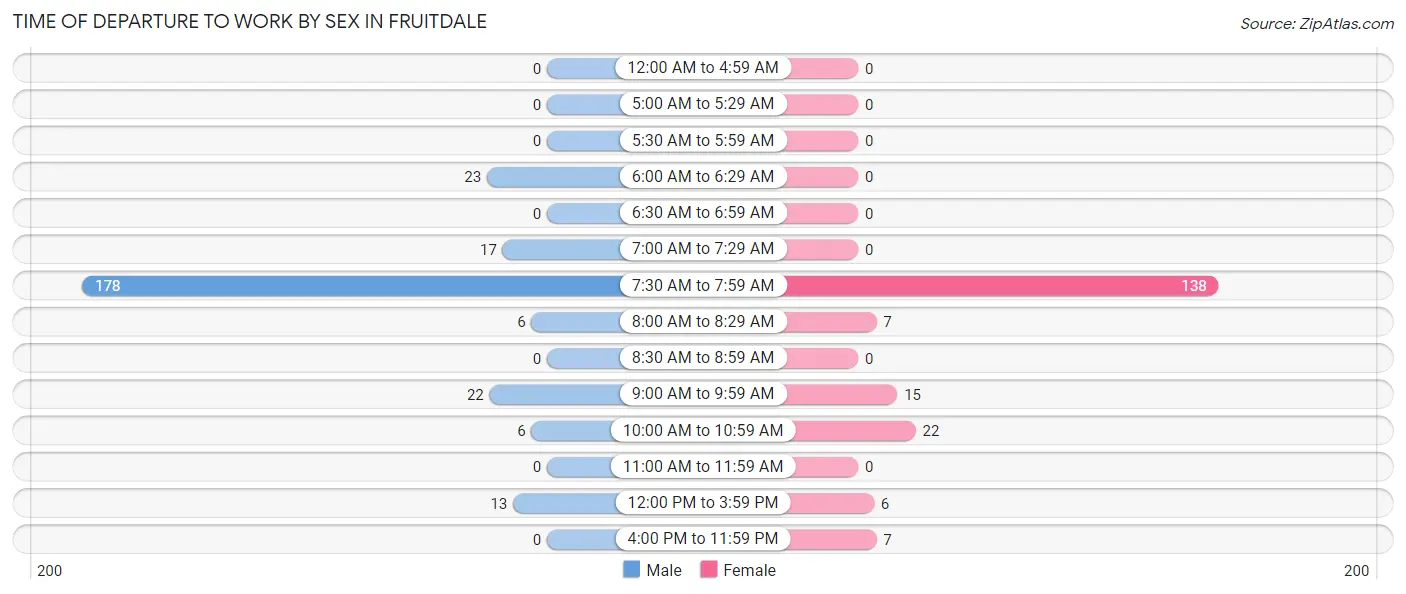
| Time of Departure | Male | Female |
| 12:00 AM to 4:59 AM | 0 (0.0%) | 0 (0.0%) |
| 5:00 AM to 5:29 AM | 0 (0.0%) | 0 (0.0%) |
| 5:30 AM to 5:59 AM | 0 (0.0%) | 0 (0.0%) |
| 6:00 AM to 6:29 AM | 23 (8.7%) | 0 (0.0%) |
| 6:30 AM to 6:59 AM | 0 (0.0%) | 0 (0.0%) |
| 7:00 AM to 7:29 AM | 17 (6.4%) | 0 (0.0%) |
| 7:30 AM to 7:59 AM | 178 (67.2%) | 138 (70.8%) |
| 8:00 AM to 8:29 AM | 6 (2.3%) | 7 (3.6%) |
| 8:30 AM to 8:59 AM | 0 (0.0%) | 0 (0.0%) |
| 9:00 AM to 9:59 AM | 22 (8.3%) | 15 (7.7%) |
| 10:00 AM to 10:59 AM | 6 (2.3%) | 22 (11.3%) |
| 11:00 AM to 11:59 AM | 0 (0.0%) | 0 (0.0%) |
| 12:00 PM to 3:59 PM | 13 (4.9%) | 6 (3.1%) |
| 4:00 PM to 11:59 PM | 0 (0.0%) | 7 (3.6%) |
| Total | 265 (100.0%) | 195 (100.0%) |
Housing Occupancy in Fruitdale
Occupancy by Ownership in Fruitdale
Of the total 465 dwellings in Fruitdale, owner-occupied units account for 307 (66.0%), while renter-occupied units make up 158 (34.0%).
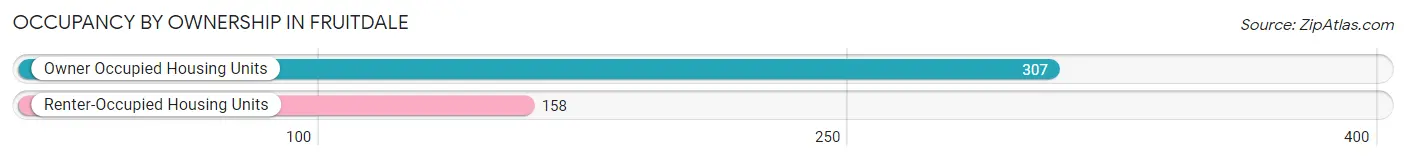
| Occupancy | # Housing Units | % Housing Units |
| Owner Occupied Housing Units | 307 | 66.0% |
| Renter-Occupied Housing Units | 158 | 34.0% |
| Total Occupied Housing Units | 465 | 100.0% |
Occupancy by Household Size in Fruitdale
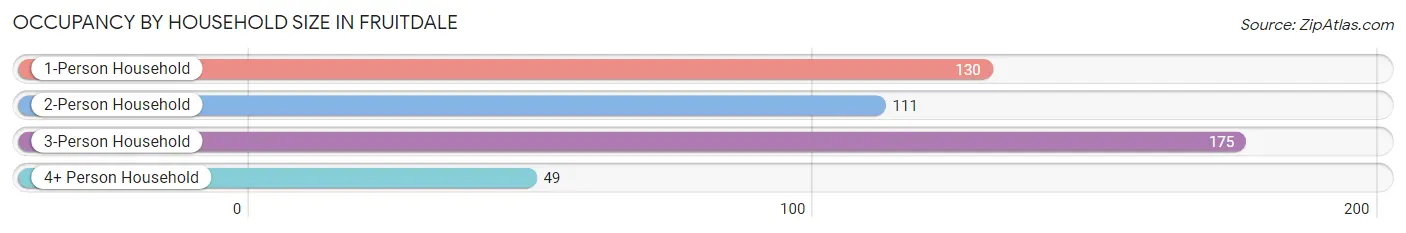
| Household Size | # Housing Units | % Housing Units |
| 1-Person Household | 130 | 28.0% |
| 2-Person Household | 111 | 23.9% |
| 3-Person Household | 175 | 37.6% |
| 4+ Person Household | 49 | 10.5% |
| Total Housing Units | 465 | 100.0% |
Occupancy by Ownership by Household Size in Fruitdale
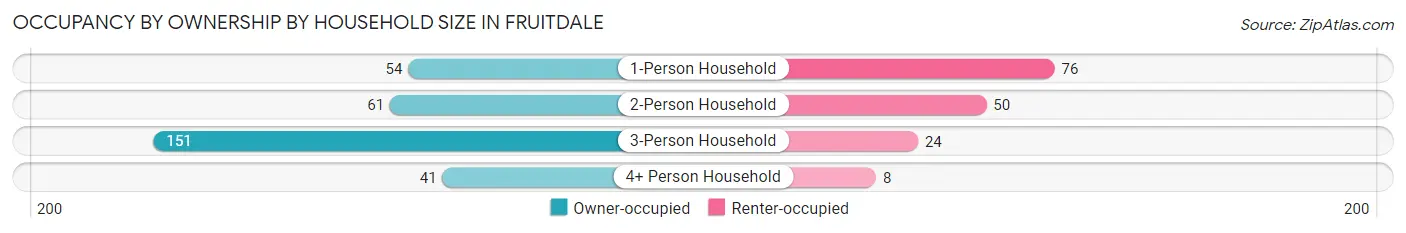
| Household Size | Owner-occupied | Renter-occupied |
| 1-Person Household | 54 (41.5%) | 76 (58.5%) |
| 2-Person Household | 61 (54.9%) | 50 (45.1%) |
| 3-Person Household | 151 (86.3%) | 24 (13.7%) |
| 4+ Person Household | 41 (83.7%) | 8 (16.3%) |
| Total Housing Units | 307 (66.0%) | 158 (34.0%) |
Occupancy by Educational Attainment in Fruitdale
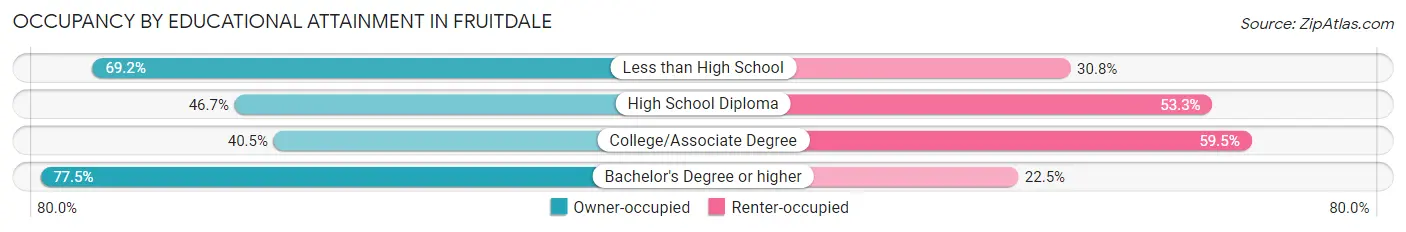
| Household Size | Owner-occupied | Renter-occupied |
| Less than High School | 18 (69.2%) | 8 (30.8%) |
| High School Diploma | 7 (46.7%) | 8 (53.3%) |
| College/Associate Degree | 51 (40.5%) | 75 (59.5%) |
| Bachelor's Degree or higher | 231 (77.5%) | 67 (22.5%) |
Occupancy by Age of Householder in Fruitdale
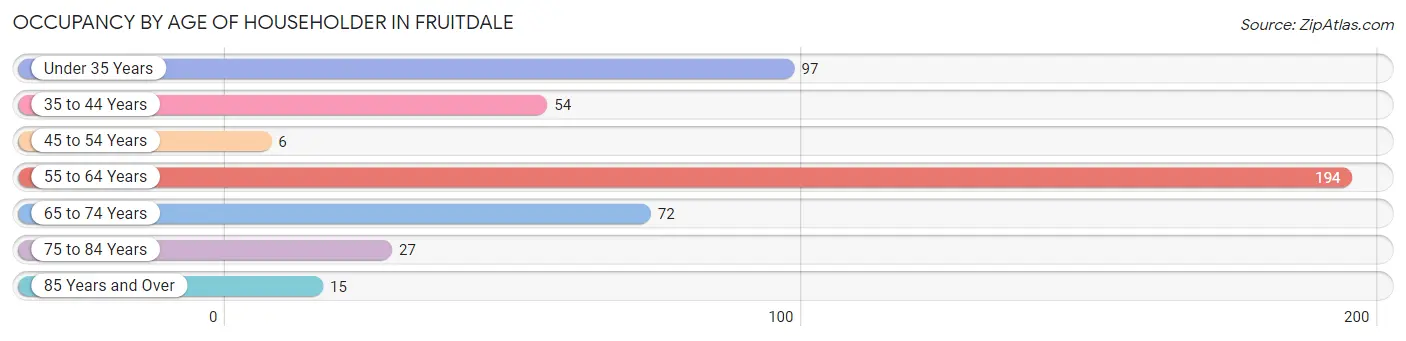
| Age Bracket | # Households | % Households |
| Under 35 Years | 97 | 20.9% |
| 35 to 44 Years | 54 | 11.6% |
| 45 to 54 Years | 6 | 1.3% |
| 55 to 64 Years | 194 | 41.7% |
| 65 to 74 Years | 72 | 15.5% |
| 75 to 84 Years | 27 | 5.8% |
| 85 Years and Over | 15 | 3.2% |
| Total | 465 | 100.0% |
Housing Finances in Fruitdale
Median Income by Occupancy in Fruitdale
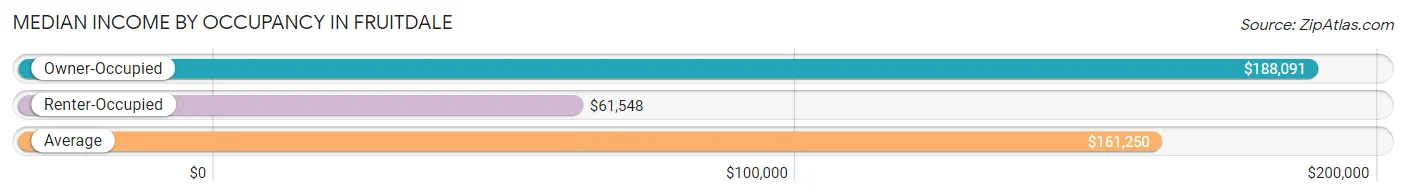
| Occupancy Type | # Households | Median Income |
| Owner-Occupied | 307 (66.0%) | $188,091 |
| Renter-Occupied | 158 (34.0%) | $61,548 |
| Average | 465 (100.0%) | $161,250 |
Occupancy by Householder Income Bracket in Fruitdale
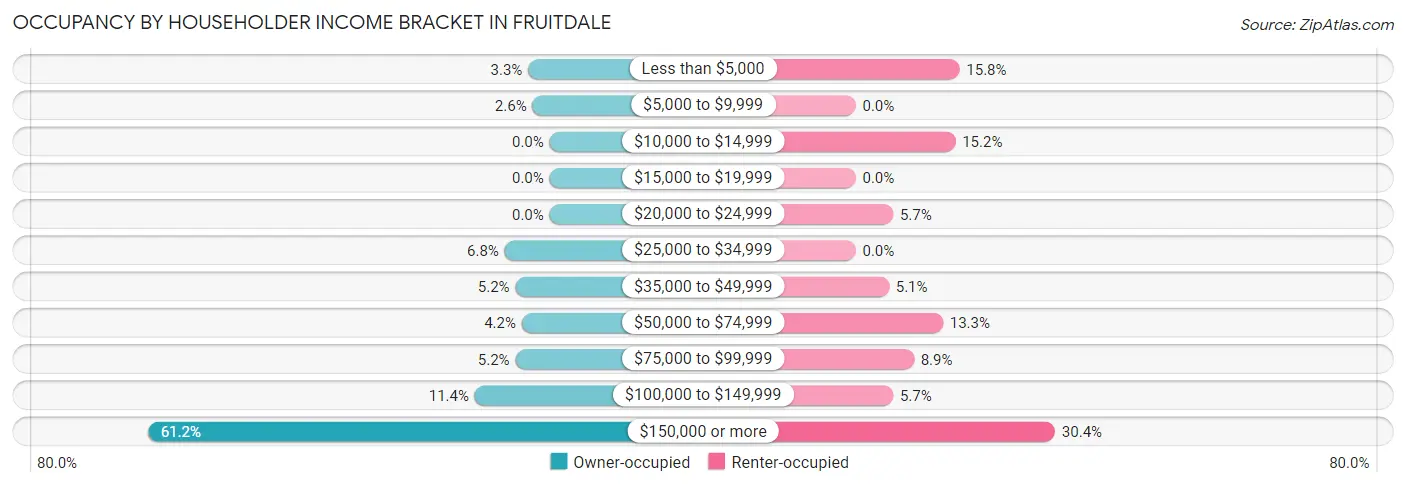
| Income Bracket | Owner-occupied | Renter-occupied |
| Less than $5,000 | 10 (3.3%) | 25 (15.8%) |
| $5,000 to $9,999 | 8 (2.6%) | 0 (0.0%) |
| $10,000 to $14,999 | 0 (0.0%) | 24 (15.2%) |
| $15,000 to $19,999 | 0 (0.0%) | 0 (0.0%) |
| $20,000 to $24,999 | 0 (0.0%) | 9 (5.7%) |
| $25,000 to $34,999 | 21 (6.8%) | 0 (0.0%) |
| $35,000 to $49,999 | 16 (5.2%) | 8 (5.1%) |
| $50,000 to $74,999 | 13 (4.2%) | 21 (13.3%) |
| $75,000 to $99,999 | 16 (5.2%) | 14 (8.9%) |
| $100,000 to $149,999 | 35 (11.4%) | 9 (5.7%) |
| $150,000 or more | 188 (61.2%) | 48 (30.4%) |
| Total | 307 (100.0%) | 158 (100.0%) |
Monthly Housing Cost Tiers in Fruitdale
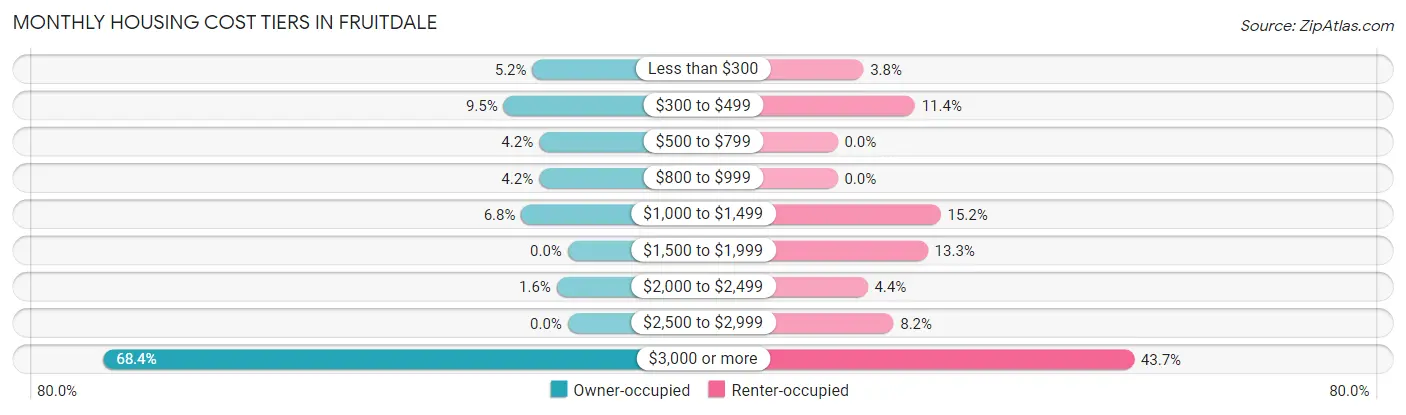
| Monthly Cost | Owner-occupied | Renter-occupied |
| Less than $300 | 16 (5.2%) | 6 (3.8%) |
| $300 to $499 | 29 (9.5%) | 18 (11.4%) |
| $500 to $799 | 13 (4.2%) | 0 (0.0%) |
| $800 to $999 | 13 (4.2%) | 0 (0.0%) |
| $1,000 to $1,499 | 21 (6.8%) | 24 (15.2%) |
| $1,500 to $1,999 | 0 (0.0%) | 21 (13.3%) |
| $2,000 to $2,499 | 5 (1.6%) | 7 (4.4%) |
| $2,500 to $2,999 | 0 (0.0%) | 13 (8.2%) |
| $3,000 or more | 210 (68.4%) | 69 (43.7%) |
| Total | 307 (100.0%) | 158 (100.0%) |
Physical Housing Characteristics in Fruitdale
Housing Structures in Fruitdale
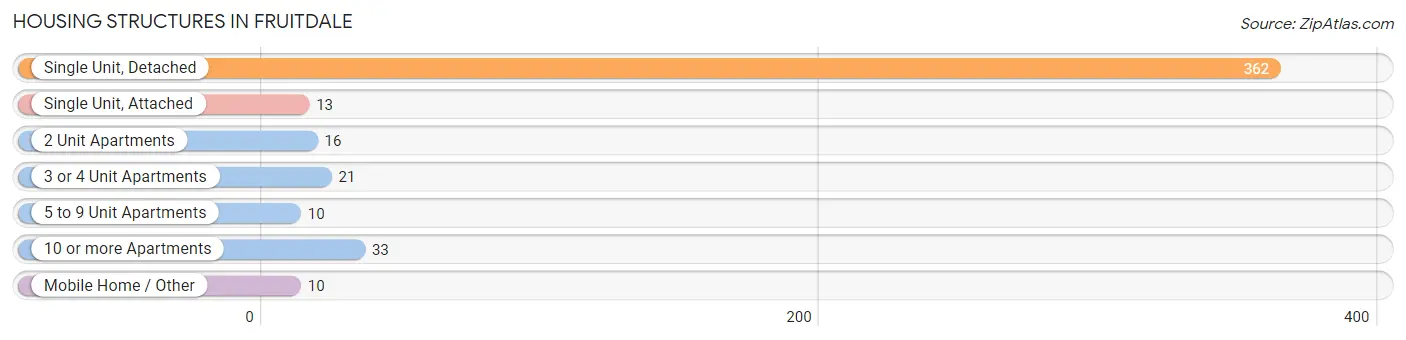
| Structure Type | # Housing Units | % Housing Units |
| Single Unit, Detached | 362 | 77.8% |
| Single Unit, Attached | 13 | 2.8% |
| 2 Unit Apartments | 16 | 3.4% |
| 3 or 4 Unit Apartments | 21 | 4.5% |
| 5 to 9 Unit Apartments | 10 | 2.1% |
| 10 or more Apartments | 33 | 7.1% |
| Mobile Home / Other | 10 | 2.1% |
| Total | 465 | 100.0% |
Housing Structures by Occupancy in Fruitdale
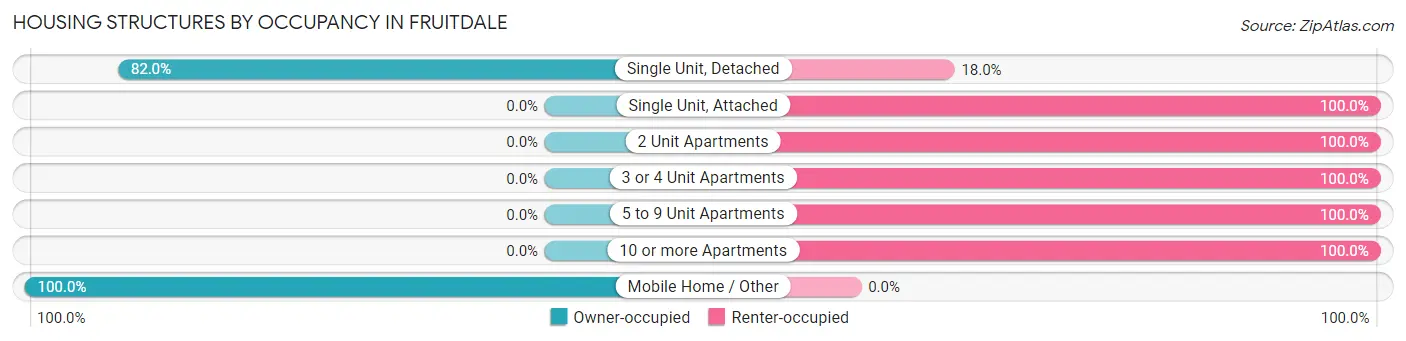
| Structure Type | Owner-occupied | Renter-occupied |
| Single Unit, Detached | 297 (82.0%) | 65 (18.0%) |
| Single Unit, Attached | 0 (0.0%) | 13 (100.0%) |
| 2 Unit Apartments | 0 (0.0%) | 16 (100.0%) |
| 3 or 4 Unit Apartments | 0 (0.0%) | 21 (100.0%) |
| 5 to 9 Unit Apartments | 0 (0.0%) | 10 (100.0%) |
| 10 or more Apartments | 0 (0.0%) | 33 (100.0%) |
| Mobile Home / Other | 10 (100.0%) | 0 (0.0%) |
| Total | 307 (66.0%) | 158 (34.0%) |
Housing Structures by Number of Rooms in Fruitdale
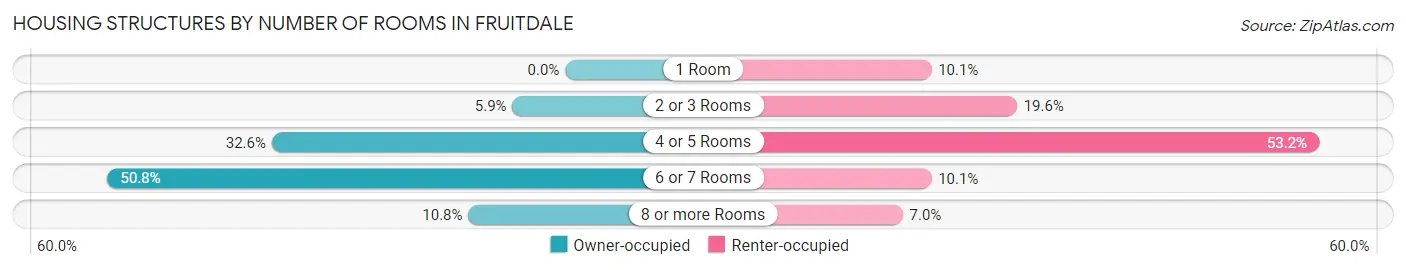
| Number of Rooms | Owner-occupied | Renter-occupied |
| 1 Room | 0 (0.0%) | 16 (10.1%) |
| 2 or 3 Rooms | 18 (5.9%) | 31 (19.6%) |
| 4 or 5 Rooms | 100 (32.6%) | 84 (53.2%) |
| 6 or 7 Rooms | 156 (50.8%) | 16 (10.1%) |
| 8 or more Rooms | 33 (10.7%) | 11 (7.0%) |
| Total | 307 (100.0%) | 158 (100.0%) |
Housing Structure by Heating Type in Fruitdale
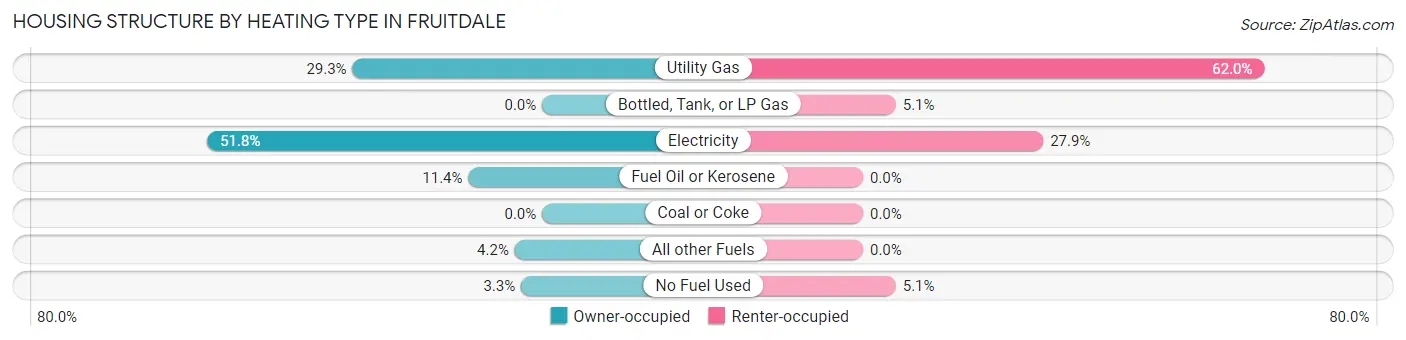
| Heating Type | Owner-occupied | Renter-occupied |
| Utility Gas | 90 (29.3%) | 98 (62.0%) |
| Bottled, Tank, or LP Gas | 0 (0.0%) | 8 (5.1%) |
| Electricity | 159 (51.8%) | 44 (27.9%) |
| Fuel Oil or Kerosene | 35 (11.4%) | 0 (0.0%) |
| Coal or Coke | 0 (0.0%) | 0 (0.0%) |
| All other Fuels | 13 (4.2%) | 0 (0.0%) |
| No Fuel Used | 10 (3.3%) | 8 (5.1%) |
| Total | 307 (100.0%) | 158 (100.0%) |
Household Vehicle Usage in Fruitdale
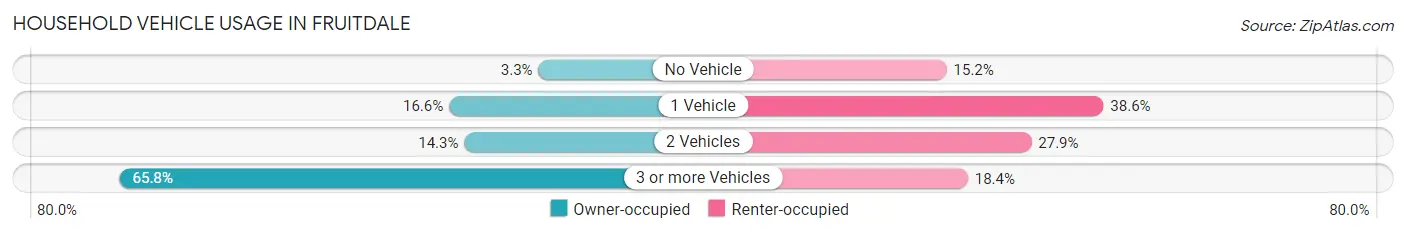
| Vehicles per Household | Owner-occupied | Renter-occupied |
| No Vehicle | 10 (3.3%) | 24 (15.2%) |
| 1 Vehicle | 51 (16.6%) | 61 (38.6%) |
| 2 Vehicles | 44 (14.3%) | 44 (27.9%) |
| 3 or more Vehicles | 202 (65.8%) | 29 (18.3%) |
| Total | 307 (100.0%) | 158 (100.0%) |
Real Estate & Mortgages in Fruitdale
Real Estate and Mortgage Overview in Fruitdale
| Characteristic | Without Mortgage | With Mortgage |
| Housing Units | 92 | 215 |
| Median Property Value | $1,173,900 | $1,369,900 |
| Median Household Income | - | - |
| Monthly Housing Costs | $617 | $210 |
| Real Estate Taxes | $2,931 | $0 |
Property Value by Mortgage Status in Fruitdale
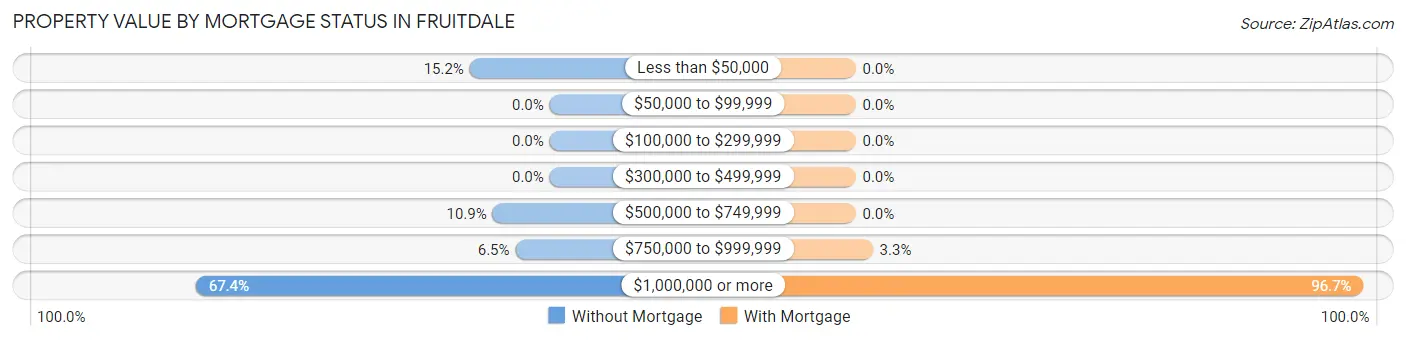
| Property Value | Without Mortgage | With Mortgage |
| Less than $50,000 | 14 (15.2%) | 0 (0.0%) |
| $50,000 to $99,999 | 0 (0.0%) | 0 (0.0%) |
| $100,000 to $299,999 | 0 (0.0%) | 0 (0.0%) |
| $300,000 to $499,999 | 0 (0.0%) | 0 (0.0%) |
| $500,000 to $749,999 | 10 (10.9%) | 0 (0.0%) |
| $750,000 to $999,999 | 6 (6.5%) | 7 (3.3%) |
| $1,000,000 or more | 62 (67.4%) | 208 (96.7%) |
| Total | 92 (100.0%) | 215 (100.0%) |
Household Income by Mortgage Status in Fruitdale
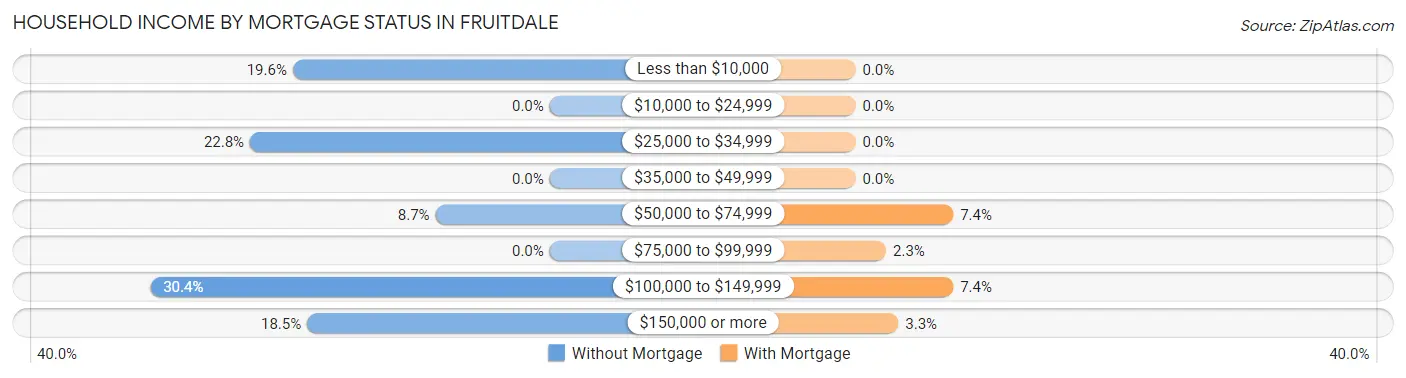
| Household Income | Without Mortgage | With Mortgage |
| Less than $10,000 | 18 (19.6%) | 0 (0.0%) |
| $10,000 to $24,999 | 0 (0.0%) | 0 (0.0%) |
| $25,000 to $34,999 | 21 (22.8%) | 0 (0.0%) |
| $35,000 to $49,999 | 0 (0.0%) | 0 (0.0%) |
| $50,000 to $74,999 | 8 (8.7%) | 16 (7.4%) |
| $75,000 to $99,999 | 0 (0.0%) | 5 (2.3%) |
| $100,000 to $149,999 | 28 (30.4%) | 16 (7.4%) |
| $150,000 or more | 17 (18.5%) | 7 (3.3%) |
| Total | 92 (100.0%) | 215 (100.0%) |
Property Value to Household Income Ratio in Fruitdale
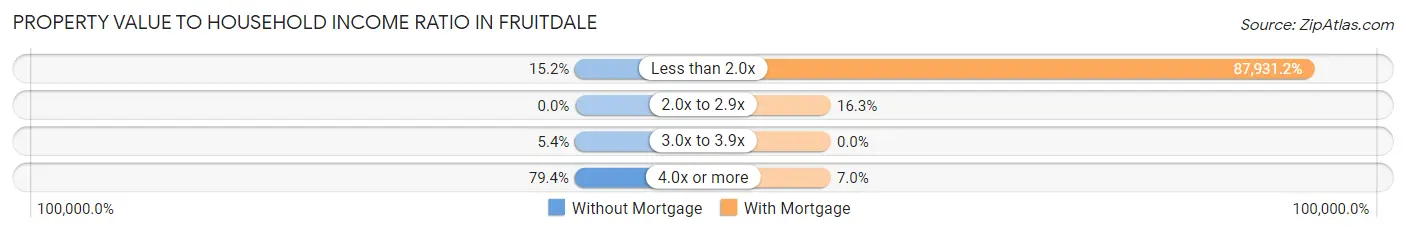
| Value-to-Income Ratio | Without Mortgage | With Mortgage |
| Less than 2.0x | 14 (15.2%) | 189,052 (87,931.2%) |
| 2.0x to 2.9x | 0 (0.0%) | 35 (16.3%) |
| 3.0x to 3.9x | 5 (5.4%) | 0 (0.0%) |
| 4.0x or more | 73 (79.3%) | 15 (7.0%) |
| Total | 92 (100.0%) | 215 (100.0%) |
Real Estate Taxes by Mortgage Status in Fruitdale
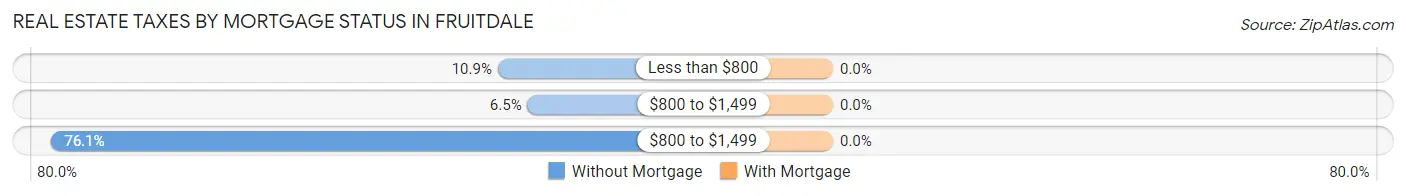
| Property Taxes | Without Mortgage | With Mortgage |
| Less than $800 | 10 (10.9%) | 0 (0.0%) |
| $800 to $1,499 | 6 (6.5%) | 0 (0.0%) |
| $800 to $1,499 | 70 (76.1%) | 0 (0.0%) |
| Total | 92 (100.0%) | 215 (100.0%) |
Health & Disability in Fruitdale
Health Insurance Coverage by Age in Fruitdale
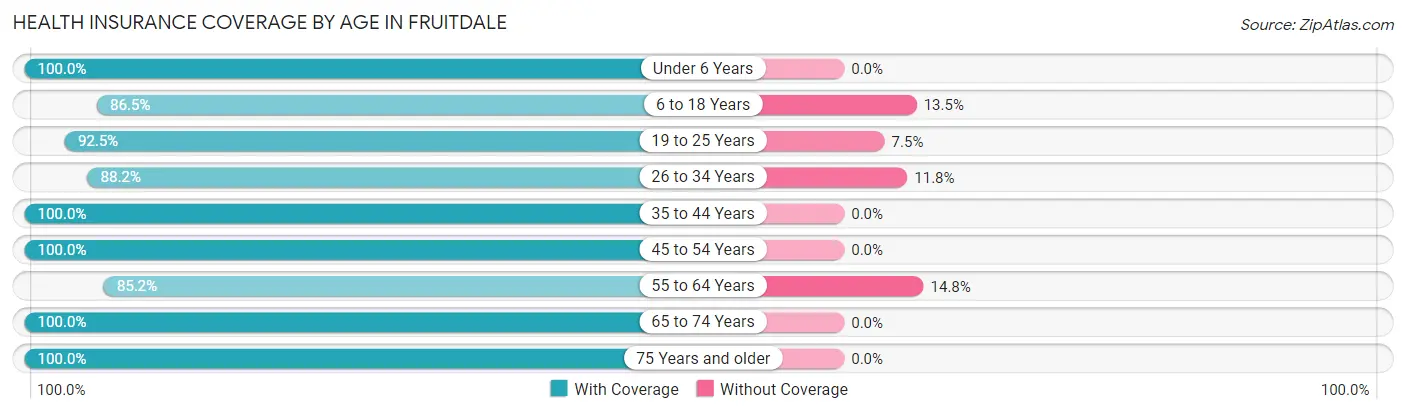
| Age Bracket | With Coverage | Without Coverage |
| Under 6 Years | 62 (100.0%) | 0 (0.0%) |
| 6 to 18 Years | 64 (86.5%) | 10 (13.5%) |
| 19 to 25 Years | 258 (92.5%) | 21 (7.5%) |
| 26 to 34 Years | 225 (88.2%) | 30 (11.8%) |
| 35 to 44 Years | 92 (100.0%) | 0 (0.0%) |
| 45 to 54 Years | 29 (100.0%) | 0 (0.0%) |
| 55 to 64 Years | 219 (85.2%) | 38 (14.8%) |
| 65 to 74 Years | 81 (100.0%) | 0 (0.0%) |
| 75 Years and older | 67 (100.0%) | 0 (0.0%) |
| Total | 1,097 (91.7%) | 99 (8.3%) |
Health Insurance Coverage by Citizenship Status in Fruitdale
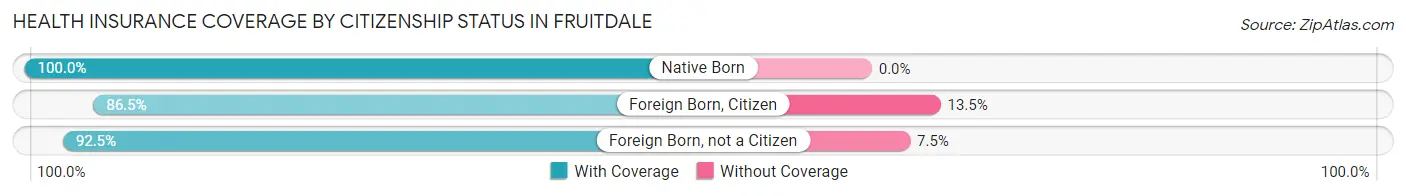
| Citizenship Status | With Coverage | Without Coverage |
| Native Born | 62 (100.0%) | 0 (0.0%) |
| Foreign Born, Citizen | 64 (86.5%) | 10 (13.5%) |
| Foreign Born, not a Citizen | 258 (92.5%) | 21 (7.5%) |
Health Insurance Coverage by Household Income in Fruitdale
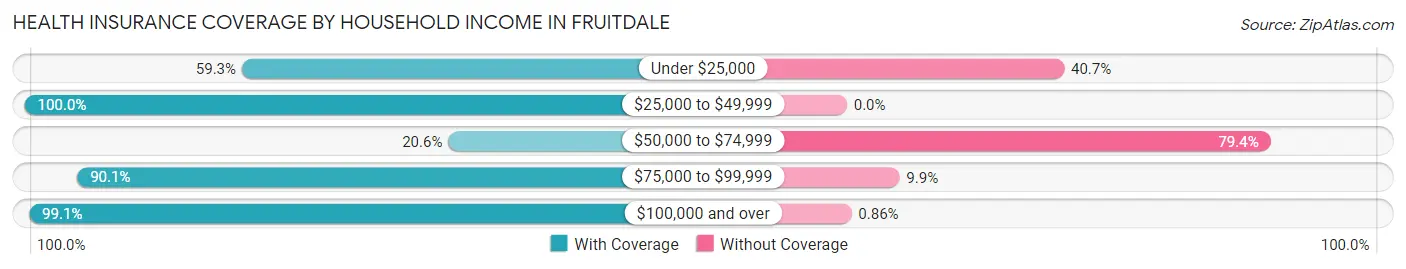
| Household Income | With Coverage | Without Coverage |
| Under $25,000 | 51 (59.3%) | 35 (40.7%) |
| $25,000 to $49,999 | 135 (100.0%) | 0 (0.0%) |
| $50,000 to $74,999 | 13 (20.6%) | 50 (79.4%) |
| $75,000 to $99,999 | 64 (90.1%) | 7 (9.9%) |
| $100,000 and over | 803 (99.1%) | 7 (0.9%) |
Public vs Private Health Insurance Coverage by Age in Fruitdale
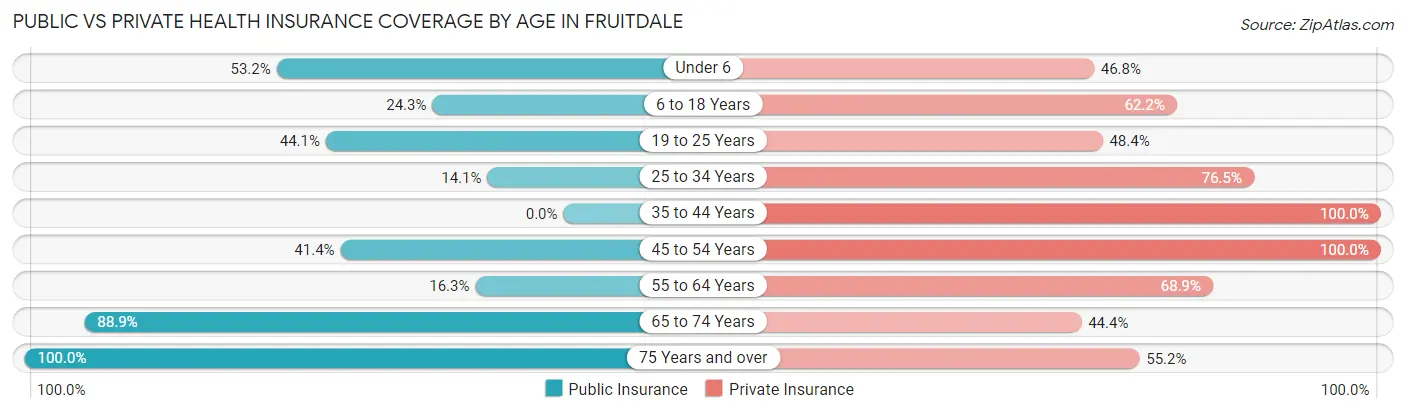
| Age Bracket | Public Insurance | Private Insurance |
| Under 6 | 33 (53.2%) | 29 (46.8%) |
| 6 to 18 Years | 18 (24.3%) | 46 (62.2%) |
| 19 to 25 Years | 123 (44.1%) | 135 (48.4%) |
| 25 to 34 Years | 36 (14.1%) | 195 (76.5%) |
| 35 to 44 Years | 0 (0.0%) | 92 (100.0%) |
| 45 to 54 Years | 12 (41.4%) | 29 (100.0%) |
| 55 to 64 Years | 42 (16.3%) | 177 (68.9%) |
| 65 to 74 Years | 72 (88.9%) | 36 (44.4%) |
| 75 Years and over | 67 (100.0%) | 37 (55.2%) |
| Total | 403 (33.7%) | 776 (64.9%) |
Disability Status by Sex by Age in Fruitdale
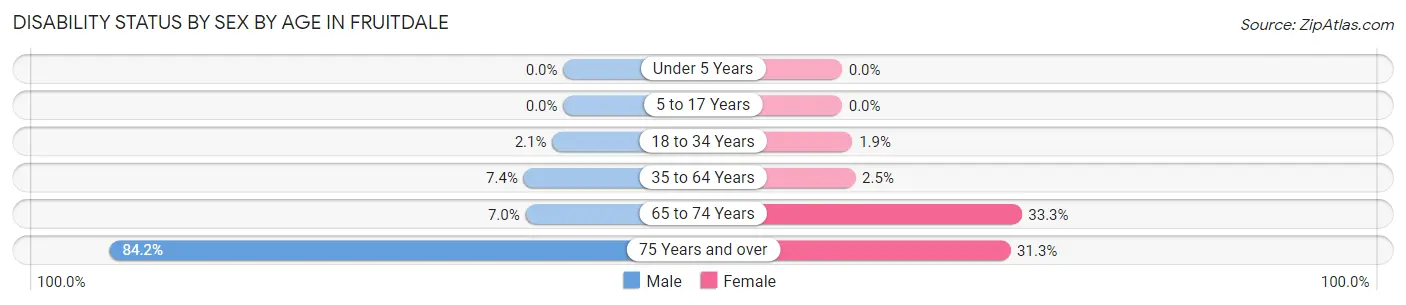
| Age Bracket | Male | Female |
| Under 5 Years | 0 (0.0%) | 0 (0.0%) |
| 5 to 17 Years | 0 (0.0%) | 0 (0.0%) |
| 18 to 34 Years | 6 (2.1%) | 5 (1.9%) |
| 35 to 64 Years | 10 (7.3%) | 6 (2.5%) |
| 65 to 74 Years | 4 (7.0%) | 8 (33.3%) |
| 75 Years and over | 16 (84.2%) | 15 (31.2%) |
Disability Class by Sex by Age in Fruitdale
Disability Class: Hearing Difficulty
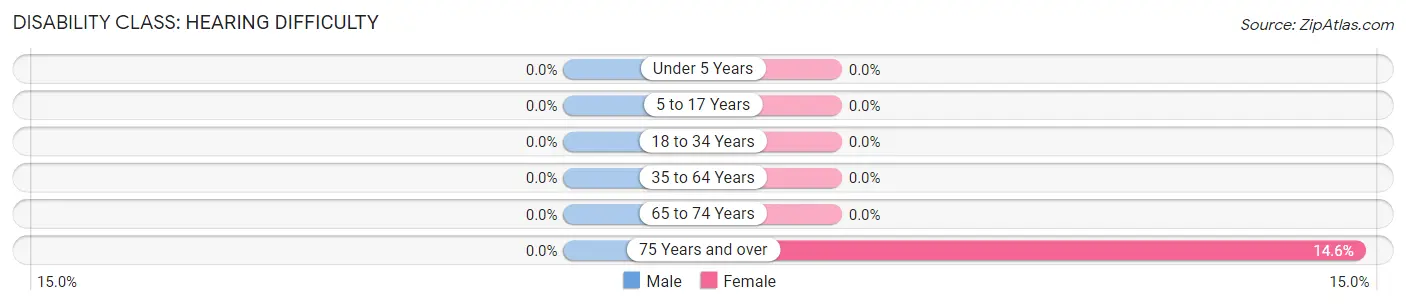
| Age Bracket | Male | Female |
| Under 5 Years | 0 (0.0%) | 0 (0.0%) |
| 5 to 17 Years | 0 (0.0%) | 0 (0.0%) |
| 18 to 34 Years | 0 (0.0%) | 0 (0.0%) |
| 35 to 64 Years | 0 (0.0%) | 0 (0.0%) |
| 65 to 74 Years | 0 (0.0%) | 0 (0.0%) |
| 75 Years and over | 0 (0.0%) | 7 (14.6%) |
Disability Class: Vision Difficulty
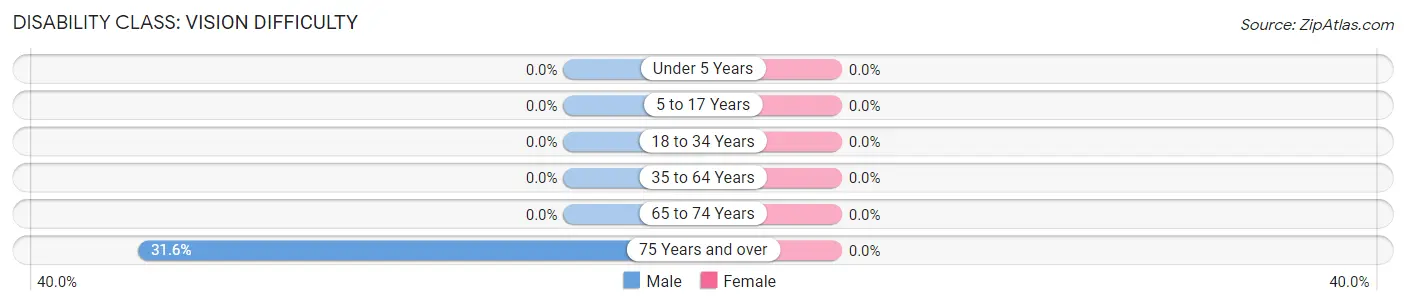
| Age Bracket | Male | Female |
| Under 5 Years | 0 (0.0%) | 0 (0.0%) |
| 5 to 17 Years | 0 (0.0%) | 0 (0.0%) |
| 18 to 34 Years | 0 (0.0%) | 0 (0.0%) |
| 35 to 64 Years | 0 (0.0%) | 0 (0.0%) |
| 65 to 74 Years | 0 (0.0%) | 0 (0.0%) |
| 75 Years and over | 6 (31.6%) | 0 (0.0%) |
Disability Class: Cognitive Difficulty
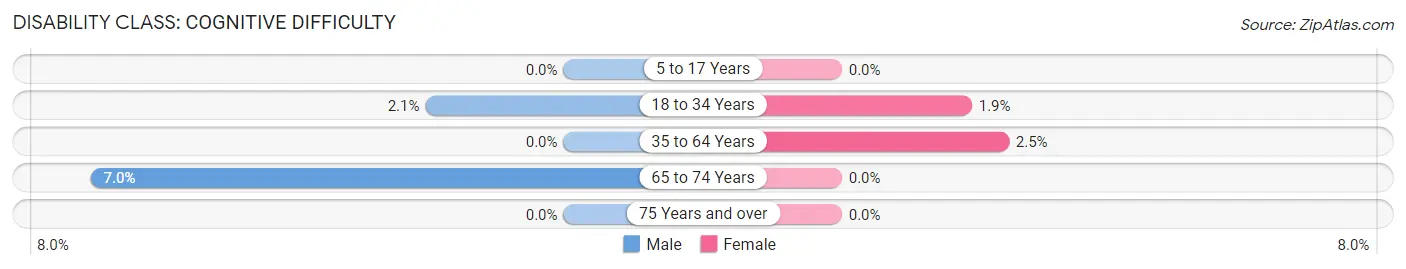
| Age Bracket | Male | Female |
| 5 to 17 Years | 0 (0.0%) | 0 (0.0%) |
| 18 to 34 Years | 6 (2.1%) | 5 (1.9%) |
| 35 to 64 Years | 0 (0.0%) | 6 (2.5%) |
| 65 to 74 Years | 4 (7.0%) | 0 (0.0%) |
| 75 Years and over | 0 (0.0%) | 0 (0.0%) |
Disability Class: Ambulatory Difficulty
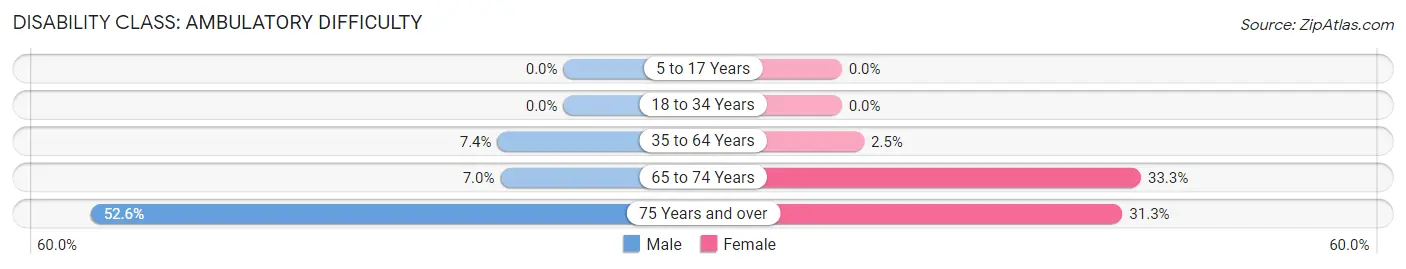
| Age Bracket | Male | Female |
| 5 to 17 Years | 0 (0.0%) | 0 (0.0%) |
| 18 to 34 Years | 0 (0.0%) | 0 (0.0%) |
| 35 to 64 Years | 10 (7.3%) | 6 (2.5%) |
| 65 to 74 Years | 4 (7.0%) | 8 (33.3%) |
| 75 Years and over | 10 (52.6%) | 15 (31.2%) |
Disability Class: Self-Care Difficulty
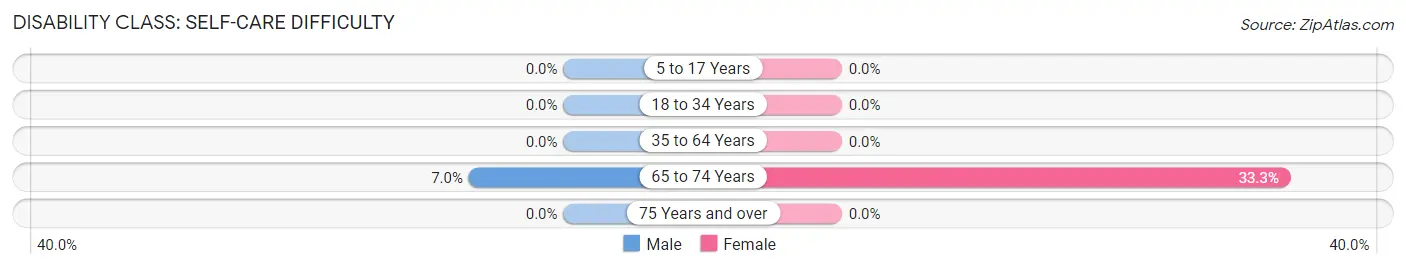
| Age Bracket | Male | Female |
| 5 to 17 Years | 0 (0.0%) | 0 (0.0%) |
| 18 to 34 Years | 0 (0.0%) | 0 (0.0%) |
| 35 to 64 Years | 0 (0.0%) | 0 (0.0%) |
| 65 to 74 Years | 4 (7.0%) | 8 (33.3%) |
| 75 Years and over | 0 (0.0%) | 0 (0.0%) |
Technology Access in Fruitdale
Computing Device Access in Fruitdale
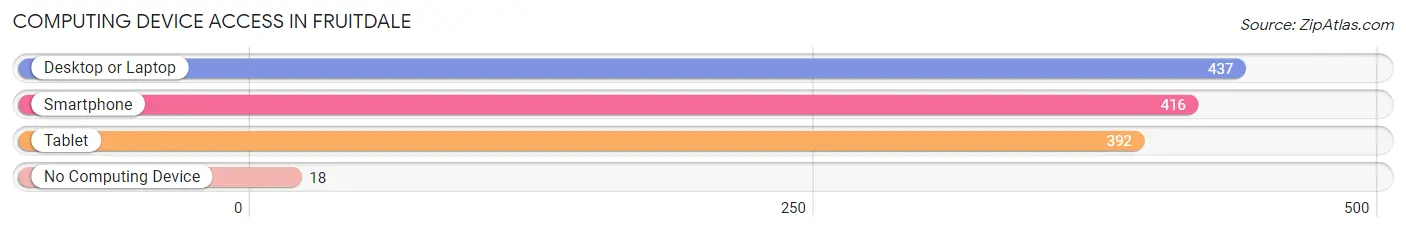
| Device Type | # Households | % Households |
| Desktop or Laptop | 437 | 94.0% |
| Smartphone | 416 | 89.5% |
| Tablet | 392 | 84.3% |
| No Computing Device | 18 | 3.9% |
| Total | 465 | 100.0% |
Internet Access in Fruitdale
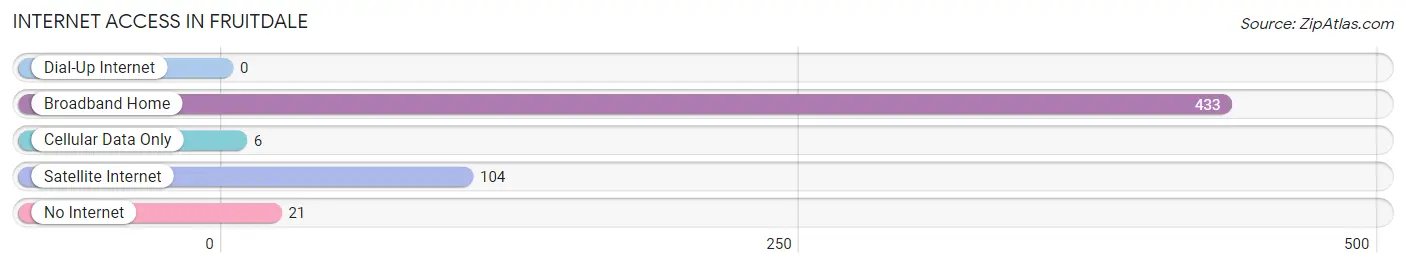
| Internet Type | # Households | % Households |
| Dial-Up Internet | 0 | 0.0% |
| Broadband Home | 433 | 93.1% |
| Cellular Data Only | 6 | 1.3% |
| Satellite Internet | 104 | 22.4% |
| No Internet | 21 | 4.5% |
| Total | 465 | 100.0% |
Fruitdale Summary
Fruitdale is a small unincorporated community located in San Joaquin County, California. It is situated in the foothills of the Sierra Nevada Mountains, approximately 25 miles east of Stockton. The population of Fruitdale was estimated to be 1,845 in the year 2000.
History
Fruitdale was founded in the late 1800s by a group of settlers from the Midwest. The settlers were attracted to the area due to its fertile soil and abundant water supply. The first settlers grew a variety of crops, including wheat, barley, and fruit. The town was named after the abundance of fruit trees in the area.
In the early 1900s, Fruitdale began to grow and develop. The town was home to a post office, a general store, a blacksmith shop, and a school. The town also had a train station, which allowed for easy access to the nearby cities of Stockton and Sacramento.
In the 1950s, Fruitdale began to experience a decline in population as many of the residents moved away in search of better job opportunities. The town was also affected by the construction of the nearby Interstate 5, which caused many of the businesses to close.
Geography
Fruitdale is located in the foothills of the Sierra Nevada Mountains, approximately 25 miles east of Stockton. The town is situated at an elevation of approximately 500 feet above sea level. The climate in Fruitdale is mild, with temperatures ranging from the mid-50s in the winter to the mid-90s in the summer.
The town is surrounded by rolling hills and farmland. The nearby Mokelumne River provides a source of water for the area. The town is also home to several parks, including the Fruitdale Community Park and the Fruitdale Nature Preserve.
Economy
Fruitdale’s economy is largely based on agriculture. The town is home to several farms, which produce a variety of crops, including wheat, barley, and fruit. The town is also home to several small businesses, including a general store, a gas station, and a restaurant.
Demographics
As of the year 2000, the population of Fruitdale was estimated to be 1,845. The racial makeup of the town was 79.3% White, 0.7% African American, 0.3% Native American, 0.2% Asian, 0.1% Pacific Islander, 16.2% from other races, and 3.4% from two or more races. The median household income in Fruitdale was $37,917, and the median family income was $41,917. The per capita income in Fruitdale was $15,917.
Common Questions
What is the Total Population of Fruitdale?
Total Population of Fruitdale is 1,219.
What is the Total Male Population of Fruitdale?
Total Male Population of Fruitdale is 585.
What is the Total Female Population of Fruitdale?
Total Female Population of Fruitdale is 634.
What is the Ratio of Males per 100 Females in Fruitdale?
There are 92.27 Males per 100 Females in Fruitdale.
What is the Ratio of Females per 100 Males in Fruitdale?
There are 108.38 Females per 100 Males in Fruitdale.
What is the Median Population Age in Fruitdale?
Median Population Age in Fruitdale is 30.8 Years.
What is the Average Family Size in Fruitdale
Average Family Size in Fruitdale is 2.7 People.
What is the Average Household Size in Fruitdale
Average Household Size in Fruitdale is 2.5 People.
What is Per Capita Income in Fruitdale?
Per Capita income in Fruitdale is $73,246.
What is the Median Family Income in Fruitdale?
Median Family Income in Fruitdale is $165,632.
What is the Median Household income in Fruitdale?
Median Household Income in Fruitdale is $161,250.
What is Inequality or Gini Index in Fruitdale?
Inequality or Gini Index in Fruitdale is 0.51.
How Large is the Labor Force in Fruitdale?
There are 818 People in the Labor Forcein in Fruitdale.
What is the Percentage of People in the Labor Force in Fruitdale?
74.3% of People are in the Labor Force in Fruitdale.
What is the Unemployment Rate in Fruitdale?
Unemployment Rate in Fruitdale is 4.6%.