Fort Irwin, CA
Fort Irwin Map
Fort Irwin Overview
8,967
TOTAL POPULATION
5,538
MALE POPULATION
3,429
FEMALE POPULATION
161.50
MALES / 100 FEMALES
61.92
FEMALES / 100 MALES
23.1
MEDIAN AGE
3.1
AVG FAMILY SIZE
2.6
AVG HOUSEHOLD SIZE
$26,142
PER CAPITA INCOME
$63,072
AVG FAMILY INCOME
$63,369
AVG HOUSEHOLD INCOME
33.1%
WAGE / INCOME GAP [ % ]
66.9¢/ $1
WAGE / INCOME GAP [ $ ]
0.29
INEQUALITY / GINI INDEX
5,465
LABOR FORCE [ PEOPLE ]
86.8%
PERCENT IN LABOR FORCE
15.4%
UNEMPLOYMENT RATE
Fort Irwin Zip Codes
Fort Irwin Area Codes
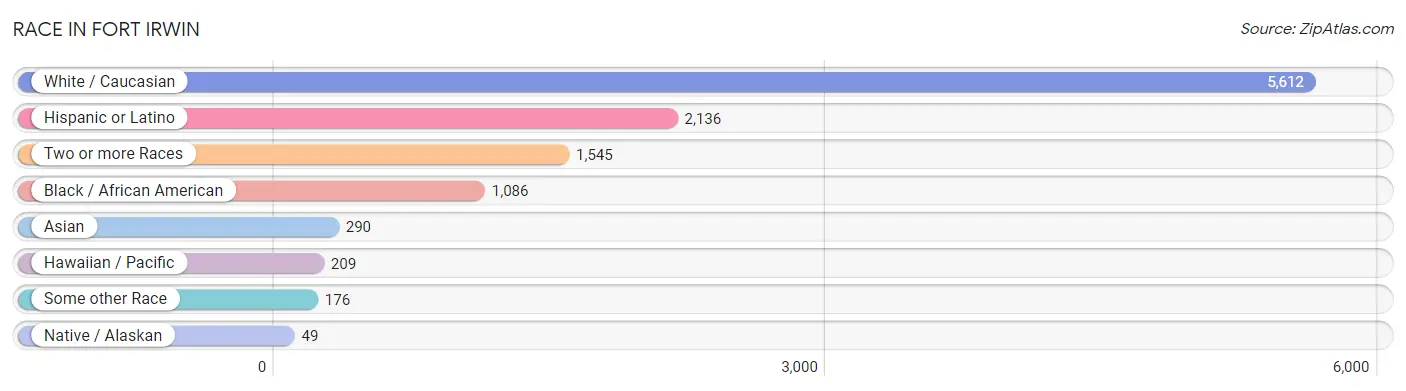
Race in Fort Irwin
The most populous races in Fort Irwin are White / Caucasian (5,612 | 62.6%), Hispanic or Latino (2,136 | 23.8%), and Two or more Races (1,545 | 17.2%).
| Race | # Population | % Population |
| Asian | 290 | 3.2% |
| Black / African American | 1,086 | 12.1% |
| Hawaiian / Pacific | 209 | 2.3% |
| Hispanic or Latino | 2,136 | 23.8% |
| Native / Alaskan | 49 | 0.5% |
| White / Caucasian | 5,612 | 62.6% |
| Two or more Races | 1,545 | 17.2% |
| Some other Race | 176 | 2.0% |
| Total | 8,967 | 100.0% |
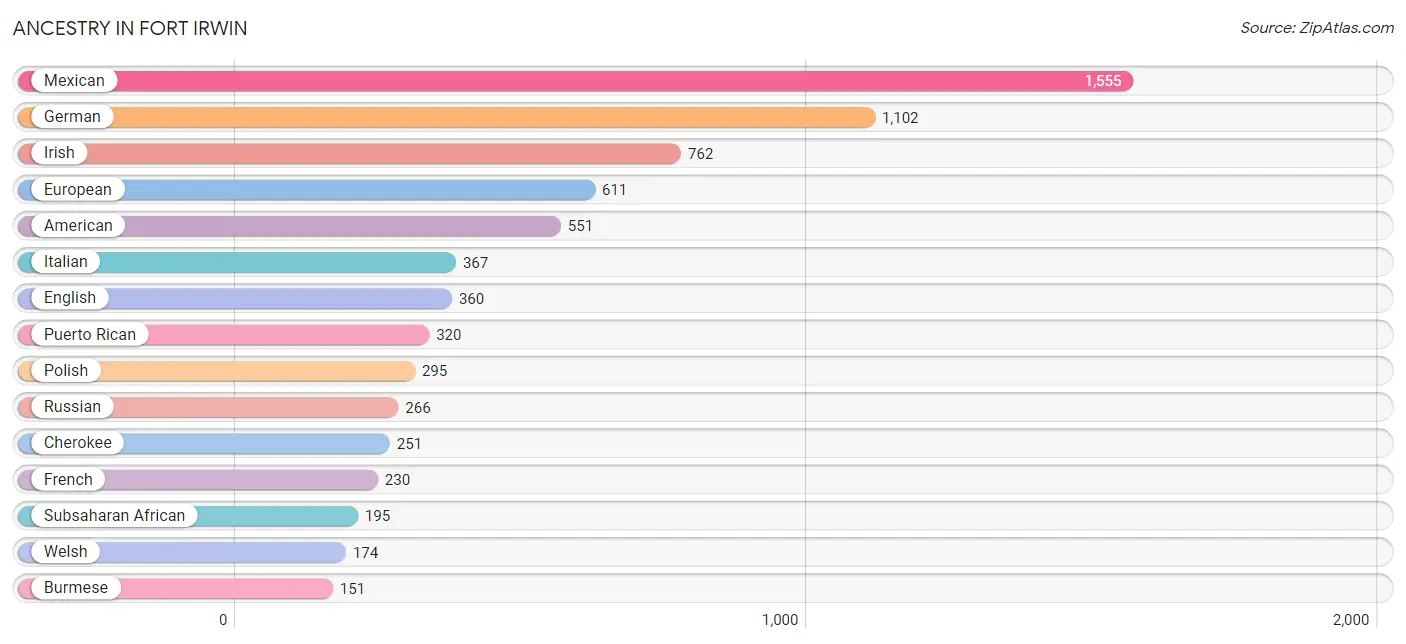
Ancestry in Fort Irwin
The most populous ancestries reported in Fort Irwin are Mexican (1,555 | 17.3%), German (1,102 | 12.3%), Irish (762 | 8.5%), European (611 | 6.8%), and American (551 | 6.1%), together accounting for 51.1% of all Fort Irwin residents.
| Ancestry | # Population | % Population |
| Afghan | 20 | 0.2% |
| African | 117 | 1.3% |
| American | 551 | 6.1% |
| Apache | 55 | 0.6% |
| Arab | 120 | 1.3% |
| Argentinean | 1 | 0.0% |
| Austrian | 3 | 0.0% |
| Belizean | 63 | 0.7% |
| Bhutanese | 19 | 0.2% |
| Blackfeet | 16 | 0.2% |
| Brazilian | 31 | 0.4% |
| British | 101 | 1.1% |
| Burmese | 151 | 1.7% |
| Canadian | 8 | 0.1% |
| Central American | 18 | 0.2% |
| Central American Indian | 3 | 0.0% |
| Cherokee | 251 | 2.8% |
| Colombian | 3 | 0.0% |
| Comanche | 15 | 0.2% |
| Costa Rican | 7 | 0.1% |
| Czech | 22 | 0.3% |
| Danish | 15 | 0.2% |
| Dominican | 65 | 0.7% |
| Dutch | 29 | 0.3% |
| Ecuadorian | 3 | 0.0% |
| Egyptian | 107 | 1.2% |
| English | 360 | 4.0% |
| European | 611 | 6.8% |
| French | 230 | 2.6% |
| German | 1,102 | 12.3% |
| Ghanaian | 16 | 0.2% |
| Guatemalan | 7 | 0.1% |
| Guyanese | 17 | 0.2% |
| Haitian | 21 | 0.2% |
| Honduran | 4 | 0.0% |
| Hungarian | 7 | 0.1% |
| Indian (Asian) | 37 | 0.4% |
| Irish | 762 | 8.5% |
| Iroquois | 6 | 0.1% |
| Italian | 367 | 4.1% |
| Jamaican | 11 | 0.1% |
| Korean | 146 | 1.6% |
| Liberian | 43 | 0.5% |
| Lithuanian | 11 | 0.1% |
| Malaysian | 14 | 0.2% |
| Mexican | 1,555 | 17.3% |
| Navajo | 44 | 0.5% |
| Norwegian | 129 | 1.4% |
| Pakistani | 10 | 0.1% |
| Polish | 295 | 3.3% |
| Portuguese | 8 | 0.1% |
| Puerto Rican | 320 | 3.6% |
| Russian | 266 | 3.0% |
| Scotch-Irish | 18 | 0.2% |
| Scottish | 134 | 1.5% |
| Seminole | 23 | 0.3% |
| Slovene | 5 | 0.1% |
| South American | 7 | 0.1% |
| Spaniard | 40 | 0.4% |
| Sri Lankan | 53 | 0.6% |
| Subsaharan African | 195 | 2.2% |
| Swedish | 32 | 0.4% |
| Syrian | 8 | 0.1% |
| Thai | 30 | 0.3% |
| Welsh | 174 | 1.9% |
| West Indian | 35 | 0.4% | View All 66 Rows |
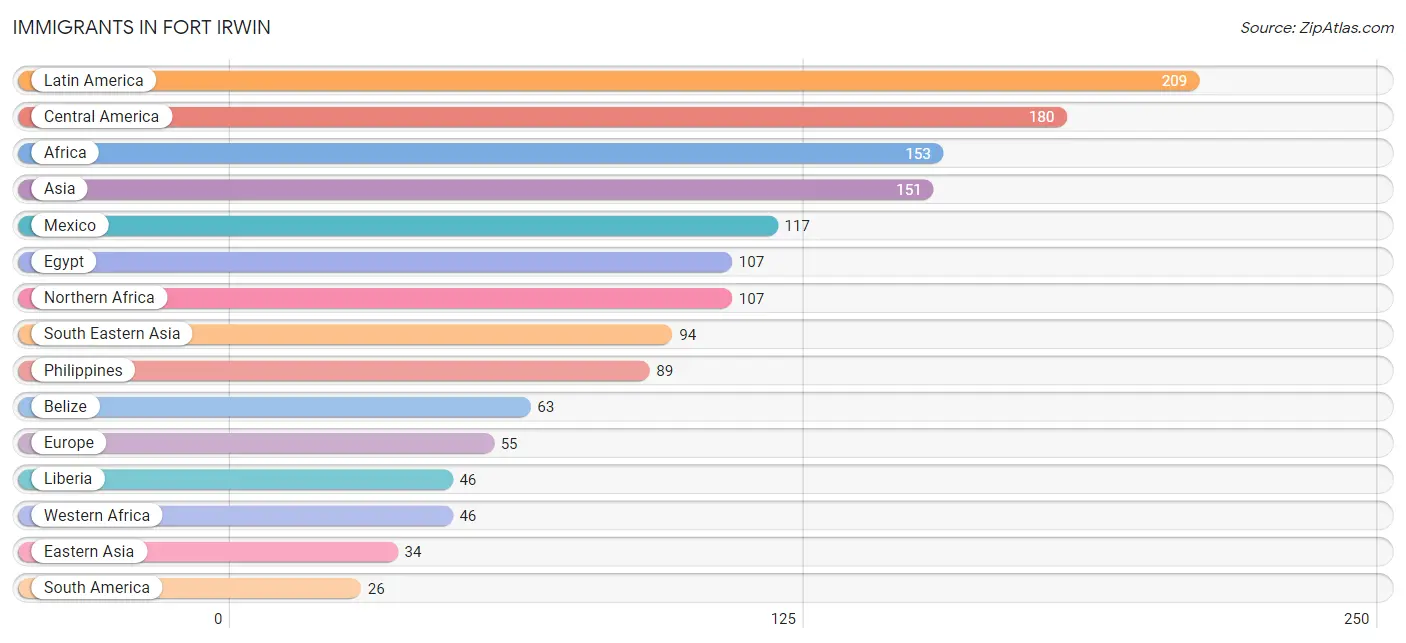
Immigrants in Fort Irwin
The most numerous immigrant groups reported in Fort Irwin came from Latin America (209 | 2.3%), Central America (180 | 2.0%), Africa (153 | 1.7%), Asia (151 | 1.7%), and Mexico (117 | 1.3%), together accounting for 9.0% of all Fort Irwin residents.
| Immigration Origin | # Population | % Population |
| Afghanistan | 20 | 0.2% |
| Africa | 153 | 1.7% |
| Asia | 151 | 1.7% |
| Belize | 63 | 0.7% |
| Brazil | 11 | 0.1% |
| Canada | 8 | 0.1% |
| Caribbean | 3 | 0.0% |
| Central America | 180 | 2.0% |
| China | 12 | 0.1% |
| Colombia | 9 | 0.1% |
| Eastern Asia | 34 | 0.4% |
| Egypt | 107 | 1.2% |
| England | 23 | 0.3% |
| Europe | 55 | 0.6% |
| Germany | 18 | 0.2% |
| Greece | 14 | 0.2% |
| Guyana | 6 | 0.1% |
| Hong Kong | 6 | 0.1% |
| India | 3 | 0.0% |
| Jamaica | 3 | 0.0% |
| Korea | 22 | 0.3% |
| Latin America | 209 | 2.3% |
| Liberia | 46 | 0.5% |
| Mexico | 117 | 1.3% |
| Micronesia | 6 | 0.1% |
| Northern Africa | 107 | 1.2% |
| Northern Europe | 23 | 0.3% |
| Oceania | 6 | 0.1% |
| Philippines | 89 | 1.0% |
| South America | 26 | 0.3% |
| South Central Asia | 23 | 0.3% |
| South Eastern Asia | 94 | 1.1% |
| Southern Europe | 14 | 0.2% |
| Vietnam | 5 | 0.1% |
| Western Africa | 46 | 0.5% |
| Western Europe | 18 | 0.2% | View All 36 Rows |
Sex and Age in Fort Irwin
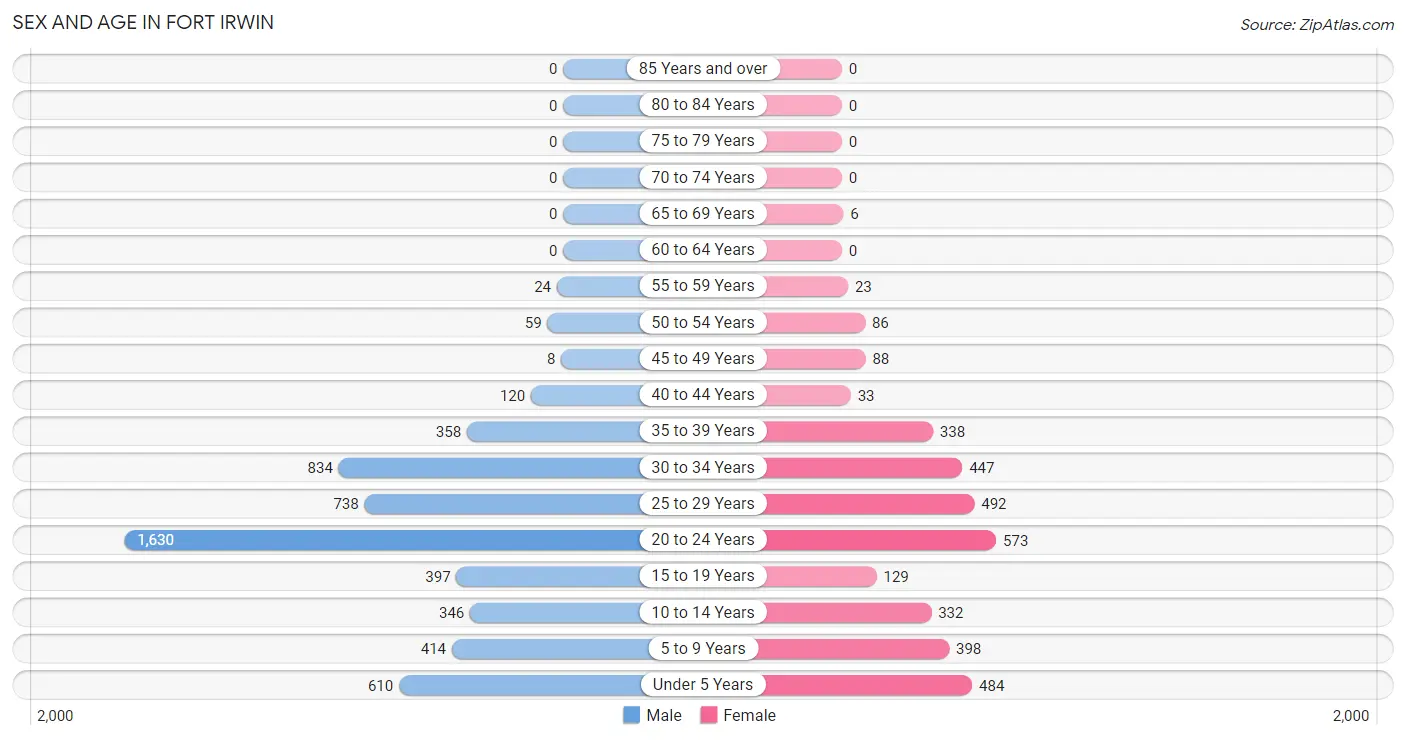
Sex and Age in Fort Irwin
The most populous age groups in Fort Irwin are 20 to 24 Years (1,630 | 29.4%) for men and 20 to 24 Years (573 | 16.7%) for women.
| Age Bracket | Male | Female |
| Under 5 Years | 610 (11.0%) | 484 (14.1%) |
| 5 to 9 Years | 414 (7.5%) | 398 (11.6%) |
| 10 to 14 Years | 346 (6.2%) | 332 (9.7%) |
| 15 to 19 Years | 397 (7.2%) | 129 (3.8%) |
| 20 to 24 Years | 1,630 (29.4%) | 573 (16.7%) |
| 25 to 29 Years | 738 (13.3%) | 492 (14.3%) |
| 30 to 34 Years | 834 (15.1%) | 447 (13.0%) |
| 35 to 39 Years | 358 (6.5%) | 338 (9.9%) |
| 40 to 44 Years | 120 (2.2%) | 33 (1.0%) |
| 45 to 49 Years | 8 (0.1%) | 88 (2.6%) |
| 50 to 54 Years | 59 (1.1%) | 86 (2.5%) |
| 55 to 59 Years | 24 (0.4%) | 23 (0.7%) |
| 60 to 64 Years | 0 (0.0%) | 0 (0.0%) |
| 65 to 69 Years | 0 (0.0%) | 6 (0.2%) |
| 70 to 74 Years | 0 (0.0%) | 0 (0.0%) |
| 75 to 79 Years | 0 (0.0%) | 0 (0.0%) |
| 80 to 84 Years | 0 (0.0%) | 0 (0.0%) |
| 85 Years and over | 0 (0.0%) | 0 (0.0%) |
| Total | 5,538 (100.0%) | 3,429 (100.0%) |
Families and Households in Fort Irwin
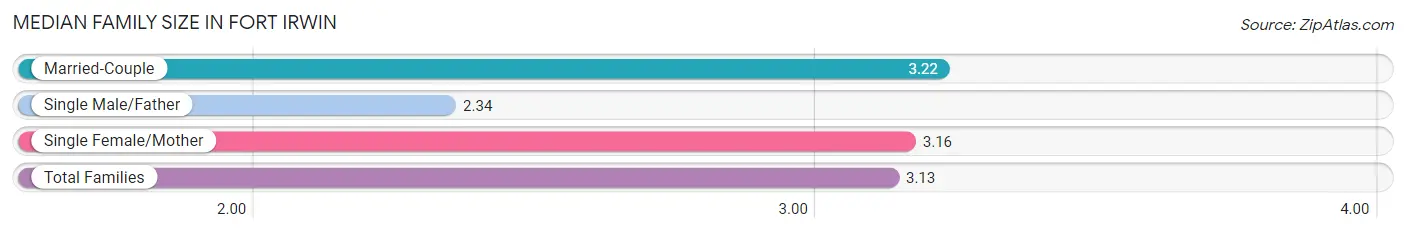
Median Family Size in Fort Irwin
The median family size in Fort Irwin is 3.13 persons per family, with married-couple families (1,683 | 79.9%) accounting for the largest median family size of 3.22 persons per family. On the other hand, single male/father families (213 | 10.1%) represent the smallest median family size with 2.34 persons per family.
| Family Type | # Families | Family Size |
| Married-Couple | 1,683 (79.9%) | 3.22 |
| Single Male/Father | 213 (10.1%) | 2.34 |
| Single Female/Mother | 209 (9.9%) | 3.16 |
| Total Families | 2,105 (100.0%) | 3.13 |
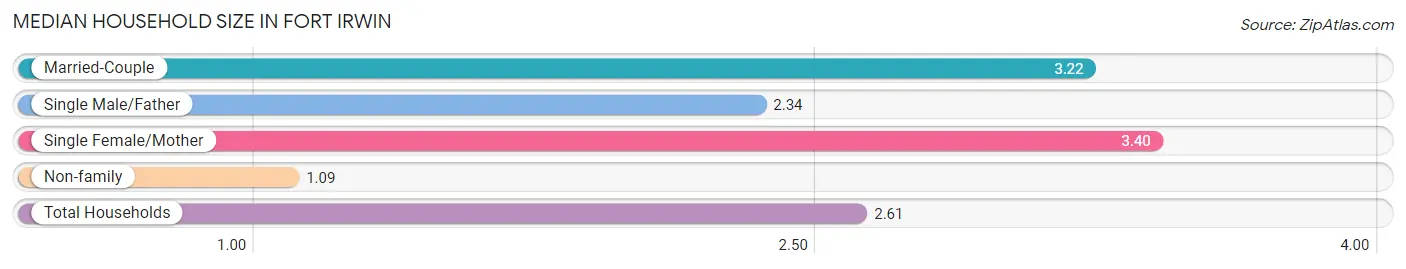
Median Household Size in Fort Irwin
The median household size in Fort Irwin is 2.61 persons per household, with single female/mother households (209 | 7.3%) accounting for the largest median household size of 3.4 persons per household. non-family households (748 | 26.2%) represent the smallest median household size with 1.09 persons per household.
| Household Type | # Households | Household Size |
| Married-Couple | 1,683 (59.0%) | 3.22 |
| Single Male/Father | 213 (7.5%) | 2.34 |
| Single Female/Mother | 209 (7.3%) | 3.40 |
| Non-family | 748 (26.2%) | 1.09 |
| Total Households | 2,853 (100.0%) | 2.61 |
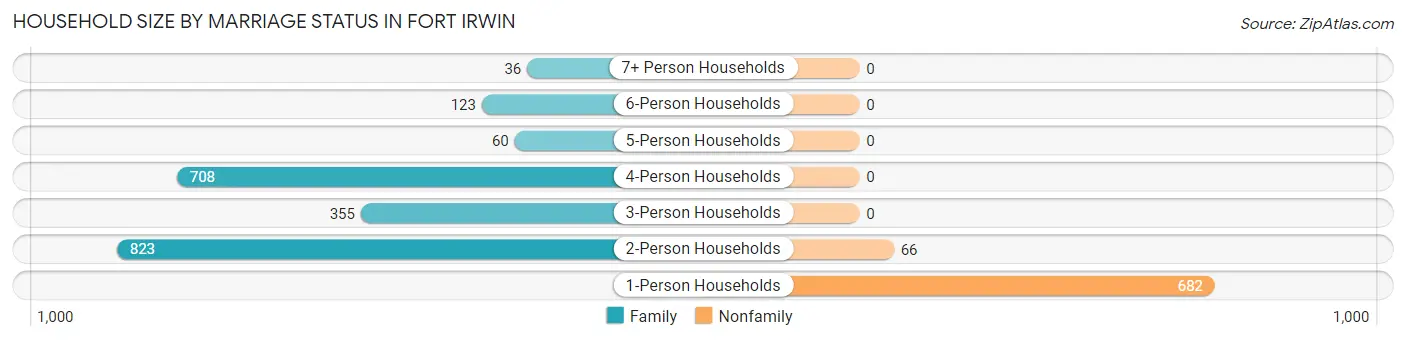
Household Size by Marriage Status in Fort Irwin
Out of a total of 2,853 households in Fort Irwin, 2,105 (73.8%) are family households, while 748 (26.2%) are nonfamily households. The most numerous type of family households are 2-person households, comprising 823, and the most common type of nonfamily households are 1-person households, comprising 682.
| Household Size | Family Households | Nonfamily Households |
| 1-Person Households | - | 682 (23.9%) |
| 2-Person Households | 823 (28.8%) | 66 (2.3%) |
| 3-Person Households | 355 (12.4%) | 0 (0.0%) |
| 4-Person Households | 708 (24.8%) | 0 (0.0%) |
| 5-Person Households | 60 (2.1%) | 0 (0.0%) |
| 6-Person Households | 123 (4.3%) | 0 (0.0%) |
| 7+ Person Households | 36 (1.3%) | 0 (0.0%) |
| Total | 2,105 (73.8%) | 748 (26.2%) |
Female Fertility in Fort Irwin
Fertility by Age in Fort Irwin
Average fertility rate in Fort Irwin is 148.0 births per 1,000 women. Women in the age bracket of 20 to 34 years have the highest fertility rate with 163.0 births per 1,000 women. Women in the age bracket of 20 to 34 years acount for 77.6% of all women with births.
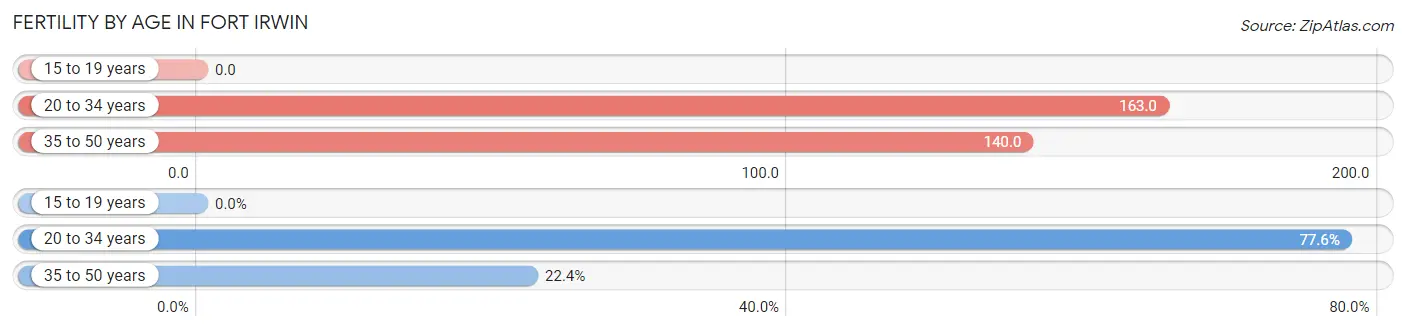
| Age Bracket | Women with Births | Births / 1,000 Women |
| 15 to 19 years | 0 (0.0%) | 0.0 |
| 20 to 34 years | 246 (77.6%) | 163.0 |
| 35 to 50 years | 71 (22.4%) | 140.0 |
| Total | 317 (100.0%) | 148.0 |
Fertility by Age by Marriage Status in Fort Irwin
52.1% of women with births (317) in Fort Irwin are married. The highest percentage of unmarried women with births falls into 35 to 50 years age bracket with 71.8% of them unmarried at the time of birth, while the lowest percentage of unmarried women with births belong to 20 to 34 years age bracket with 41.1% of them unmarried.
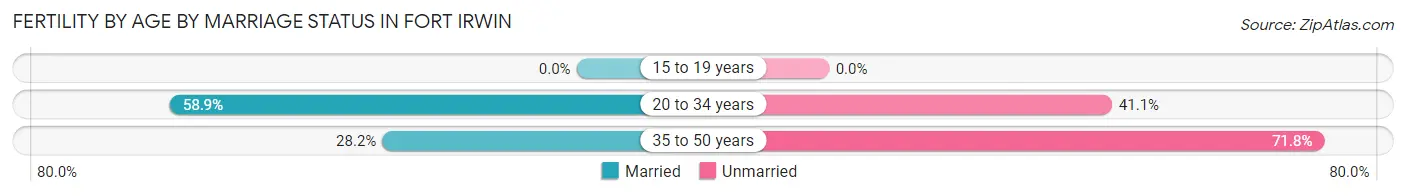
| Age Bracket | Married | Unmarried |
| 15 to 19 years | 0 (0.0%) | 0 (0.0%) |
| 20 to 34 years | 145 (58.9%) | 101 (41.1%) |
| 35 to 50 years | 20 (28.2%) | 51 (71.8%) |
| Total | 165 (52.0%) | 152 (47.9%) |
Fertility by Education in Fort Irwin
Average fertility rate in Fort Irwin is 148.0 births per 1,000 women. Women with the education attainment of college or associate's degree have the highest fertility rate of 202.0 births per 1,000 women, while women with the education attainment of graduate degree have the lowest fertility at 67.0 births per 1,000 women. Women with the education attainment of college or associate's degree represent 52.7% of all women with births.
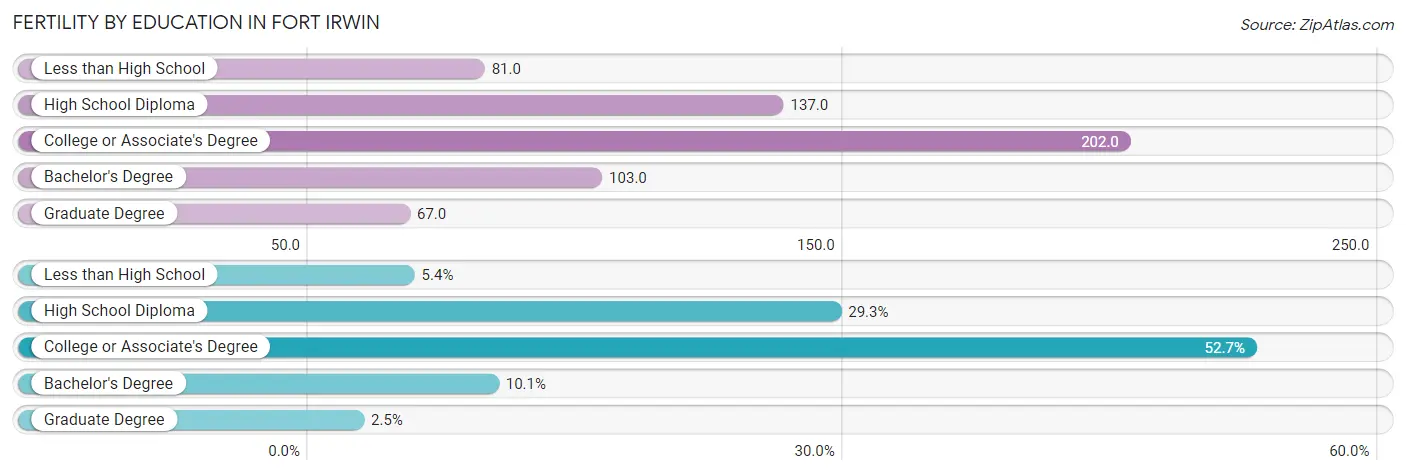
| Educational Attainment | Women with Births | Births / 1,000 Women |
| Less than High School | 17 (5.4%) | 81.0 |
| High School Diploma | 93 (29.3%) | 137.0 |
| College or Associate's Degree | 167 (52.7%) | 202.0 |
| Bachelor's Degree | 32 (10.1%) | 103.0 |
| Graduate Degree | 8 (2.5%) | 67.0 |
| Total | 317 (100.0%) | 148.0 |
Fertility by Education by Marriage Status in Fort Irwin
47.9% of women with births in Fort Irwin are unmarried. Women with the educational attainment of less than high school are most likely to be married with 100.0% of them married at childbirth, while women with the educational attainment of college or associate's degree are least likely to be married with 58.7% of them unmarried at childbirth.
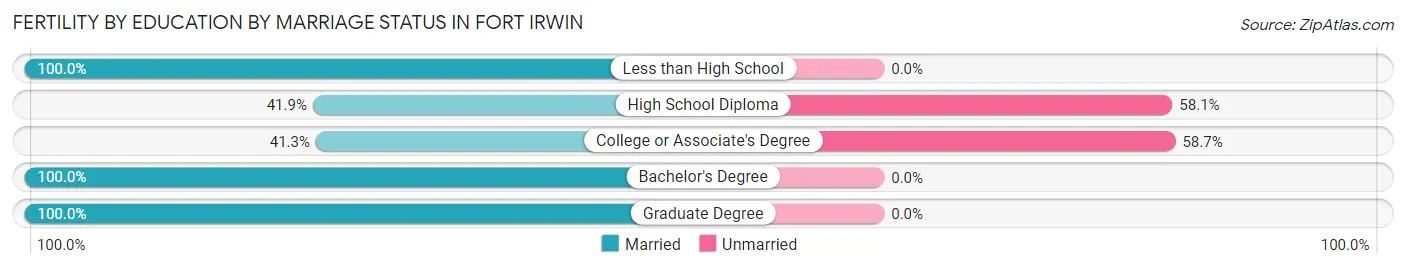
| Educational Attainment | Married | Unmarried |
| Less than High School | 17 (100.0%) | 0 (0.0%) |
| High School Diploma | 39 (41.9%) | 54 (58.1%) |
| College or Associate's Degree | 69 (41.3%) | 98 (58.7%) |
| Bachelor's Degree | 32 (100.0%) | 0 (0.0%) |
| Graduate Degree | 8 (100.0%) | 0 (0.0%) |
| Total | 165 (52.0%) | 152 (47.9%) |
Income in Fort Irwin
Income Overview in Fort Irwin
Per Capita Income in Fort Irwin is $26,142, while median incomes of families and households are $63,072 and $63,369 respectively.
| Characteristic | Number | Measure |
| Per Capita Income | 8,967 | $26,142 |
| Median Family Income | 2,105 | $63,072 |
| Mean Family Income | 2,105 | $70,746 |
| Median Household Income | 2,853 | $63,369 |
| Mean Household Income | 2,853 | $68,837 |
| Income Deficit | 2,105 | $0 |
| Wage / Income Gap (%) | 8,967 | 33.08% |
| Wage / Income Gap ($) | 8,967 | 66.92¢ per $1 |
| Gini / Inequality Index | 8,967 | 0.29 |
Earnings by Sex in Fort Irwin
Average Earnings in Fort Irwin are $35,917, $39,178 for men and $26,216 for women, a difference of 33.1%.
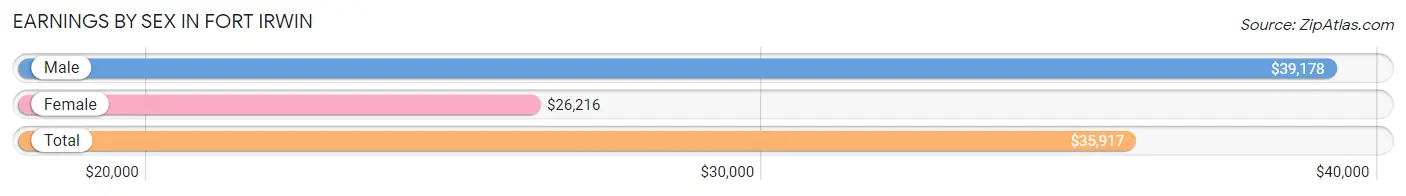
| Sex | Number | Average Earnings |
| Male | 4,041 (75.1%) | $39,178 |
| Female | 1,341 (24.9%) | $26,216 |
| Total | 5,382 (100.0%) | $35,917 |
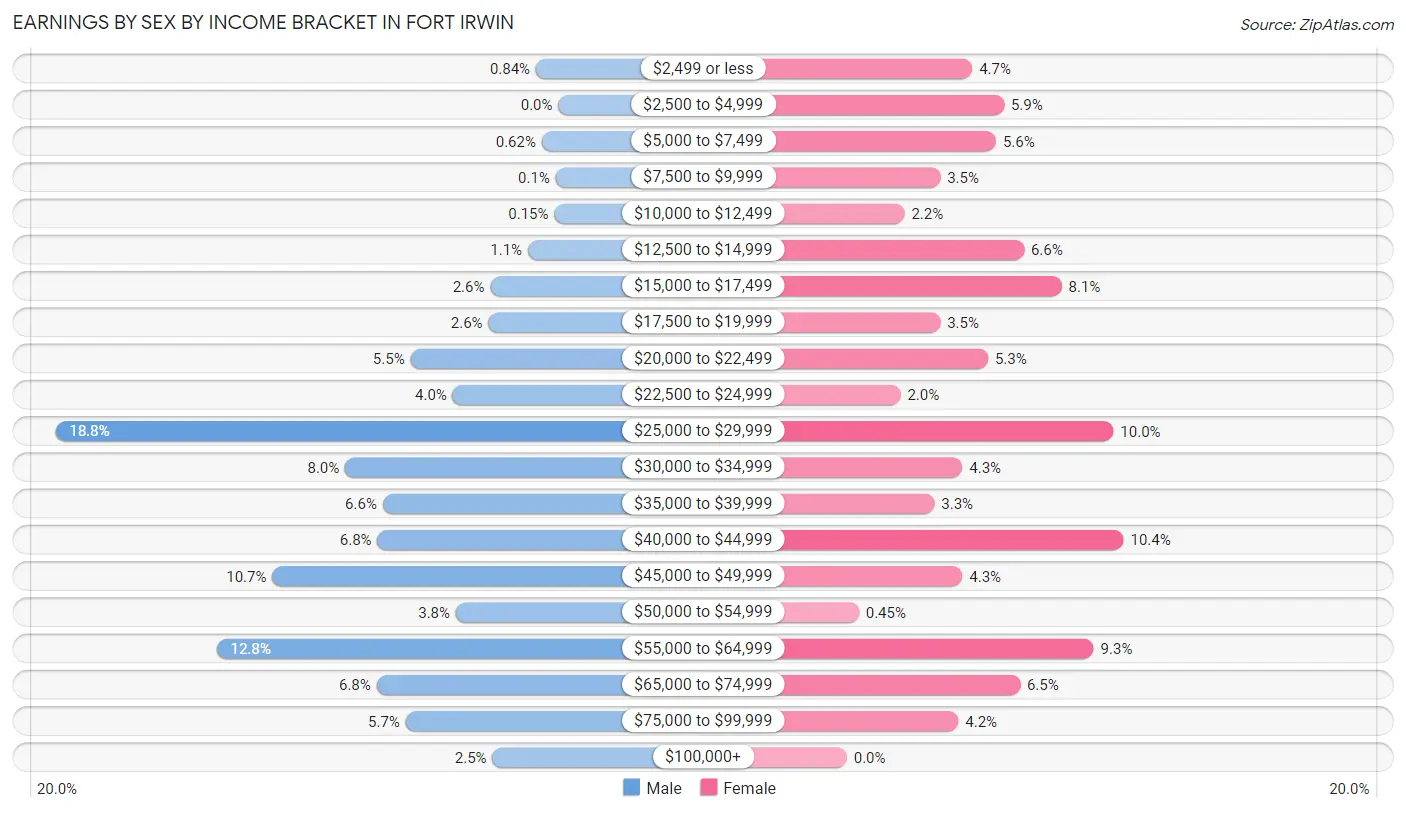
Earnings by Sex by Income Bracket in Fort Irwin
The most common earnings brackets in Fort Irwin are $25,000 to $29,999 for men (760 | 18.8%) and $40,000 to $44,999 for women (139 | 10.4%).
| Income | Male | Female |
| $2,499 or less | 34 (0.8%) | 63 (4.7%) |
| $2,500 to $4,999 | 0 (0.0%) | 79 (5.9%) |
| $5,000 to $7,499 | 25 (0.6%) | 75 (5.6%) |
| $7,500 to $9,999 | 4 (0.1%) | 47 (3.5%) |
| $10,000 to $12,499 | 6 (0.2%) | 29 (2.2%) |
| $12,500 to $14,999 | 46 (1.1%) | 89 (6.6%) |
| $15,000 to $17,499 | 103 (2.5%) | 108 (8.1%) |
| $17,500 to $19,999 | 106 (2.6%) | 47 (3.5%) |
| $20,000 to $22,499 | 224 (5.5%) | 71 (5.3%) |
| $22,500 to $24,999 | 160 (4.0%) | 27 (2.0%) |
| $25,000 to $29,999 | 760 (18.8%) | 134 (10.0%) |
| $30,000 to $34,999 | 323 (8.0%) | 58 (4.3%) |
| $35,000 to $39,999 | 266 (6.6%) | 44 (3.3%) |
| $40,000 to $44,999 | 274 (6.8%) | 139 (10.4%) |
| $45,000 to $49,999 | 433 (10.7%) | 58 (4.3%) |
| $50,000 to $54,999 | 155 (3.8%) | 6 (0.4%) |
| $55,000 to $64,999 | 516 (12.8%) | 124 (9.2%) |
| $65,000 to $74,999 | 275 (6.8%) | 87 (6.5%) |
| $75,000 to $99,999 | 231 (5.7%) | 56 (4.2%) |
| $100,000+ | 100 (2.5%) | 0 (0.0%) |
| Total | 4,041 (100.0%) | 1,341 (100.0%) |
Earnings by Sex by Educational Attainment in Fort Irwin
Average earnings in Fort Irwin are $48,397 for men and $36,165 for women, a difference of 25.3%. Men with an educational attainment of graduate degree enjoy the highest average annual earnings of $110,284, while those with college or associate's degree education earn the least with $45,922. Women with an educational attainment of high school diploma earn the most with the average annual earnings of $60,399, while those with less than high school education have the smallest earnings of $20,000.
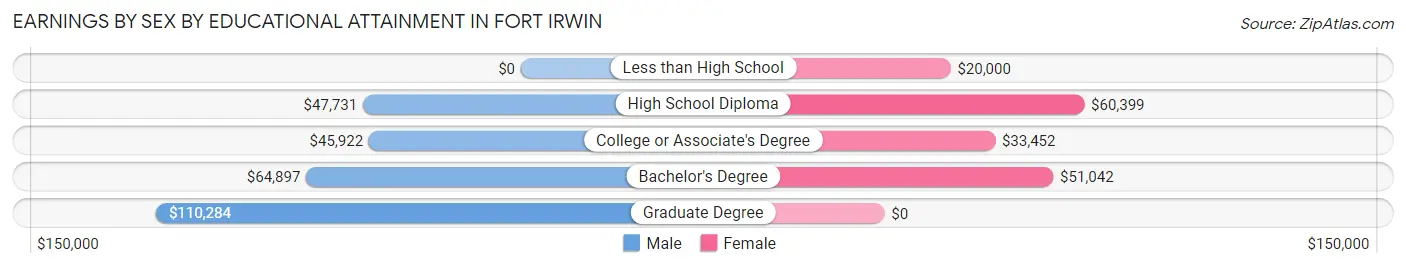
| Educational Attainment | Male Income | Female Income |
| Less than High School | - | - |
| High School Diploma | $47,731 | $60,399 |
| College or Associate's Degree | $45,922 | $33,452 |
| Bachelor's Degree | $64,897 | $51,042 |
| Graduate Degree | $110,284 | $0 |
| Total | $48,397 | $36,165 |
Family Income in Fort Irwin
Family Income Brackets in Fort Irwin
According to the Fort Irwin family income data, there are 703 families falling into the $50,000 to $74,999 income range, which is the most common income bracket and makes up 33.4% of all families.
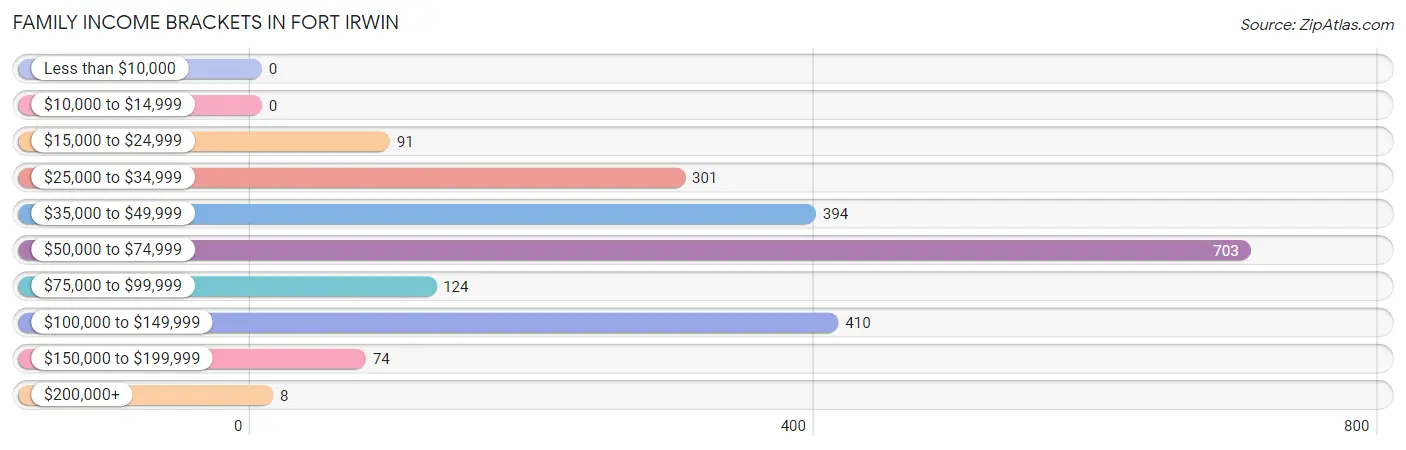
| Income Bracket | # Families | % Families |
| Less than $10,000 | 0 | 0.0% |
| $10,000 to $14,999 | 0 | 0.0% |
| $15,000 to $24,999 | 91 | 4.3% |
| $25,000 to $34,999 | 301 | 14.3% |
| $35,000 to $49,999 | 394 | 18.7% |
| $50,000 to $74,999 | 703 | 33.4% |
| $75,000 to $99,999 | 124 | 5.9% |
| $100,000 to $149,999 | 410 | 19.5% |
| $150,000 to $199,999 | 74 | 3.5% |
| $200,000+ | 8 | 0.4% |
Family Income by Famaliy Size in Fort Irwin
3-person families (304 | 14.4%) account for the highest median family income in Fort Irwin with $72,133 per family, while 2-person families (874 | 41.5%) have the highest median income of $31,270 per family member.
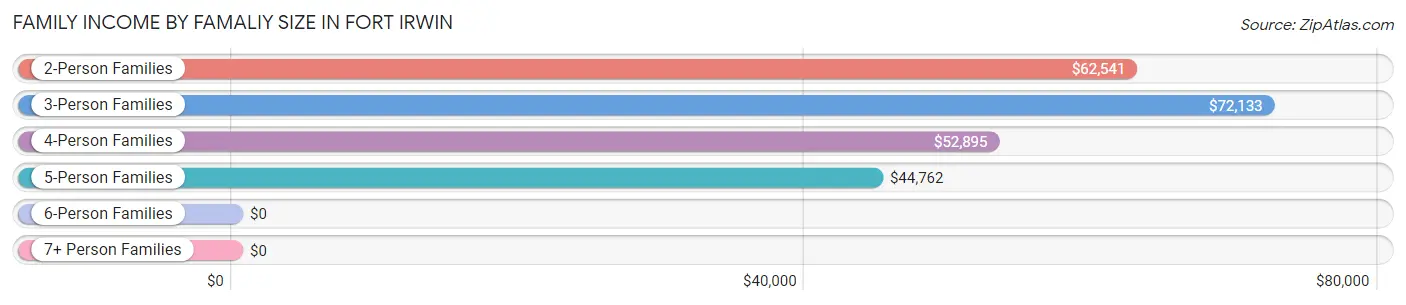
| Income Bracket | # Families | Median Income |
| 2-Person Families | 874 (41.5%) | $62,541 |
| 3-Person Families | 304 (14.4%) | $72,133 |
| 4-Person Families | 708 (33.6%) | $52,895 |
| 5-Person Families | 60 (2.9%) | $44,762 |
| 6-Person Families | 123 (5.8%) | $0 |
| 7+ Person Families | 36 (1.7%) | $0 |
| Total | 2,105 (100.0%) | $63,072 |
Family Income by Number of Earners in Fort Irwin
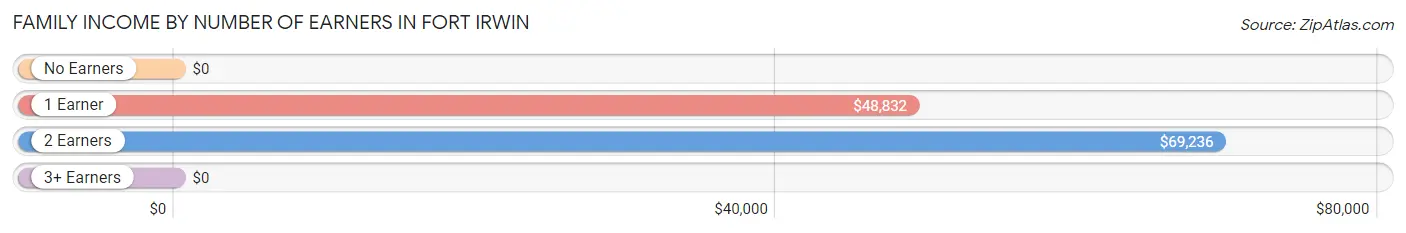
| Number of Earners | # Families | Median Income |
| No Earners | 0 (0.0%) | $0 |
| 1 Earner | 1,026 (48.7%) | $48,832 |
| 2 Earners | 1,015 (48.2%) | $69,236 |
| 3+ Earners | 64 (3.0%) | $0 |
| Total | 2,105 (100.0%) | $63,072 |
Household Income in Fort Irwin
Household Income Brackets in Fort Irwin
With 847 households falling in the category, the $50,000 to $74,999 income range is the most frequent in Fort Irwin, accounting for 29.7% of all households.
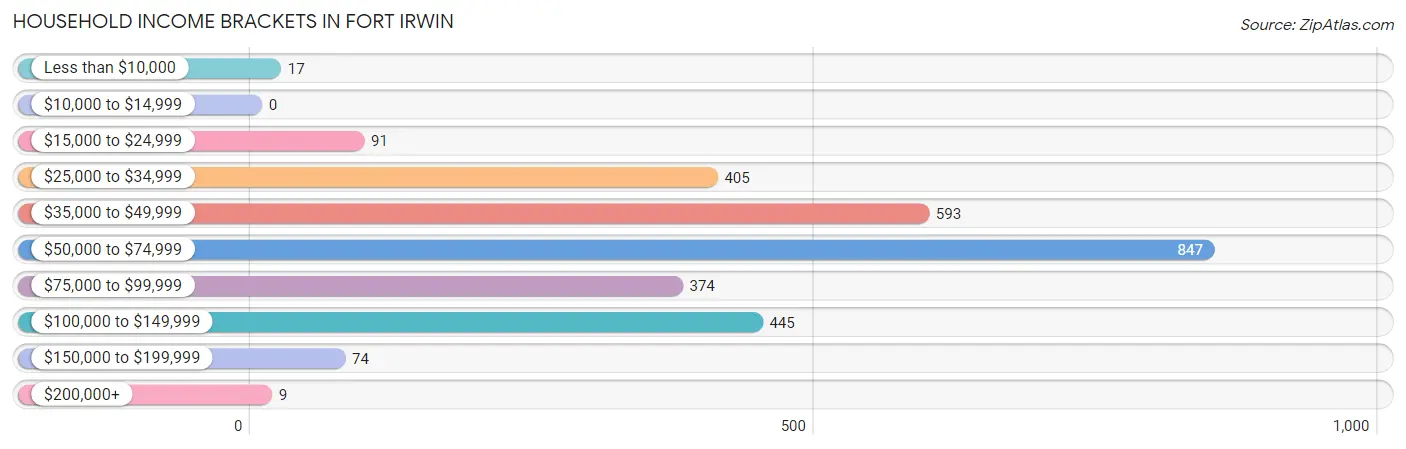
| Income Bracket | # Households | % Households |
| Less than $10,000 | 17 | 0.6% |
| $10,000 to $14,999 | 0 | 0.0% |
| $15,000 to $24,999 | 91 | 3.2% |
| $25,000 to $34,999 | 405 | 14.2% |
| $35,000 to $49,999 | 593 | 20.8% |
| $50,000 to $74,999 | 847 | 29.7% |
| $75,000 to $99,999 | 374 | 13.1% |
| $100,000 to $149,999 | 445 | 15.6% |
| $150,000 to $199,999 | 74 | 2.6% |
| $200,000+ | 9 | 0.3% |
Household Income by Householder Age in Fort Irwin
The median household income in Fort Irwin is $63,369, with the highest median household income of $90,438 found in the 45 to 64 years age bracket for the primary householder. A total of 138 households (4.8%) fall into this category.
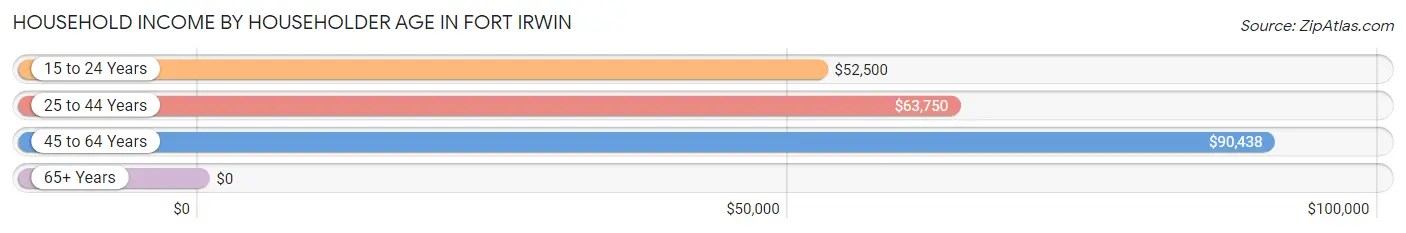
| Income Bracket | # Households | Median Income |
| 15 to 24 Years | 672 (23.5%) | $52,500 |
| 25 to 44 Years | 2,043 (71.6%) | $63,750 |
| 45 to 64 Years | 138 (4.8%) | $90,438 |
| 65+ Years | 0 (0.0%) | $0 |
| Total | 2,853 (100.0%) | $63,369 |
Poverty in Fort Irwin
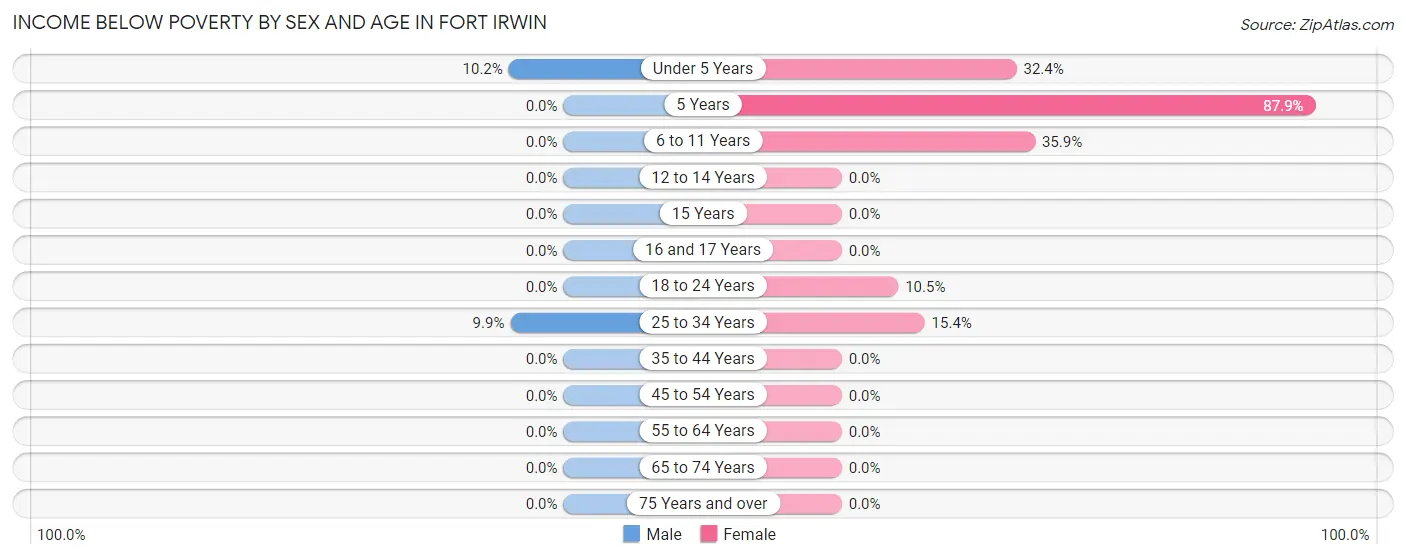
Income Below Poverty by Sex and Age in Fort Irwin
With 5.0% poverty level for males and 19.9% for females among the residents of Fort Irwin, under 5 year old males and 5 year old females are the most vulnerable to poverty, with 62 males (10.2%) and 138 females (87.9%) in their respective age groups living below the poverty level.
| Age Bracket | Male | Female |
| Under 5 Years | 62 (10.2%) | 157 (32.4%) |
| 5 Years | 0 (0.0%) | 138 (87.9%) |
| 6 to 11 Years | 0 (0.0%) | 170 (35.9%) |
| 12 to 14 Years | 0 (0.0%) | 0 (0.0%) |
| 15 Years | 0 (0.0%) | 0 (0.0%) |
| 16 and 17 Years | 0 (0.0%) | 0 (0.0%) |
| 18 to 24 Years | 0 (0.0%) | 57 (10.5%) |
| 25 to 34 Years | 146 (9.9%) | 135 (15.4%) |
| 35 to 44 Years | 0 (0.0%) | 0 (0.0%) |
| 45 to 54 Years | 0 (0.0%) | 0 (0.0%) |
| 55 to 64 Years | 0 (0.0%) | 0 (0.0%) |
| 65 to 74 Years | 0 (0.0%) | 0 (0.0%) |
| 75 Years and over | 0 (0.0%) | 0 (0.0%) |
| Total | 208 (5.0%) | 657 (19.9%) |
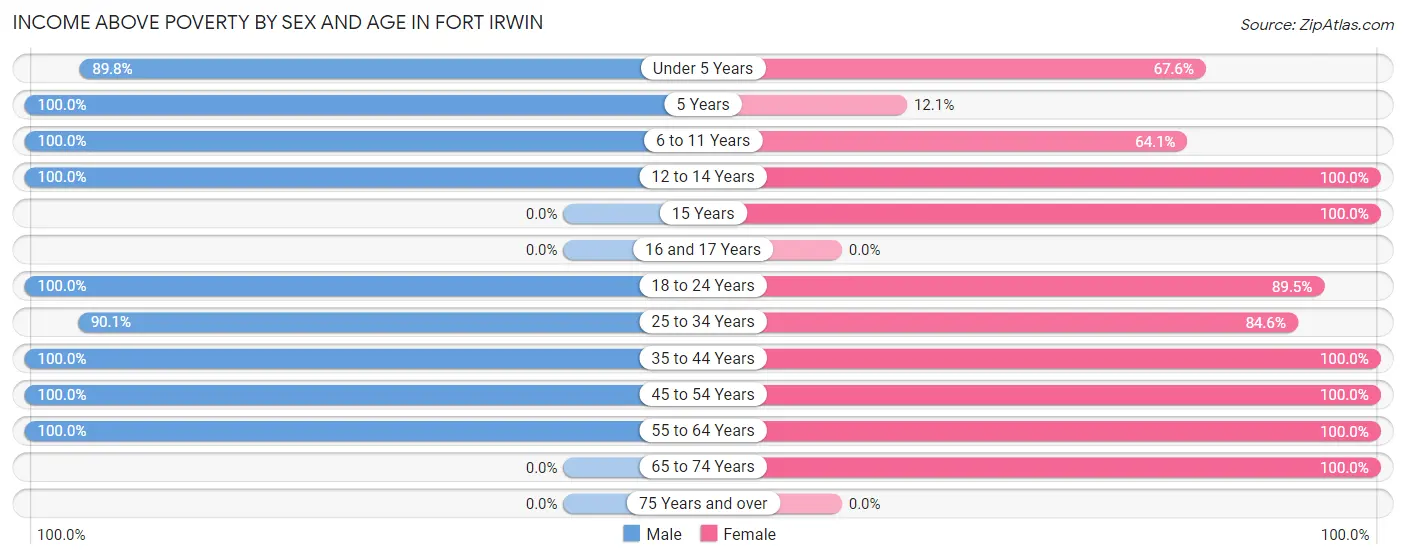
Income Above Poverty by Sex and Age in Fort Irwin
According to the poverty statistics in Fort Irwin, males aged 5 years and females aged 12 to 14 years are the age groups that are most secure financially, with 100.0% of males and 100.0% of females in these age groups living above the poverty line.
| Age Bracket | Male | Female |
| Under 5 Years | 548 (89.8%) | 327 (67.6%) |
| 5 Years | 5 (100.0%) | 19 (12.1%) |
| 6 to 11 Years | 558 (100.0%) | 304 (64.1%) |
| 12 to 14 Years | 197 (100.0%) | 99 (100.0%) |
| 15 Years | 0 (0.0%) | 87 (100.0%) |
| 16 and 17 Years | 0 (0.0%) | 0 (0.0%) |
| 18 to 24 Years | 737 (100.0%) | 487 (89.5%) |
| 25 to 34 Years | 1,334 (90.1%) | 743 (84.6%) |
| 35 to 44 Years | 478 (100.0%) | 371 (100.0%) |
| 45 to 54 Years | 67 (100.0%) | 174 (100.0%) |
| 55 to 64 Years | 24 (100.0%) | 23 (100.0%) |
| 65 to 74 Years | 0 (0.0%) | 6 (100.0%) |
| 75 Years and over | 0 (0.0%) | 0 (0.0%) |
| Total | 3,948 (95.0%) | 2,640 (80.1%) |
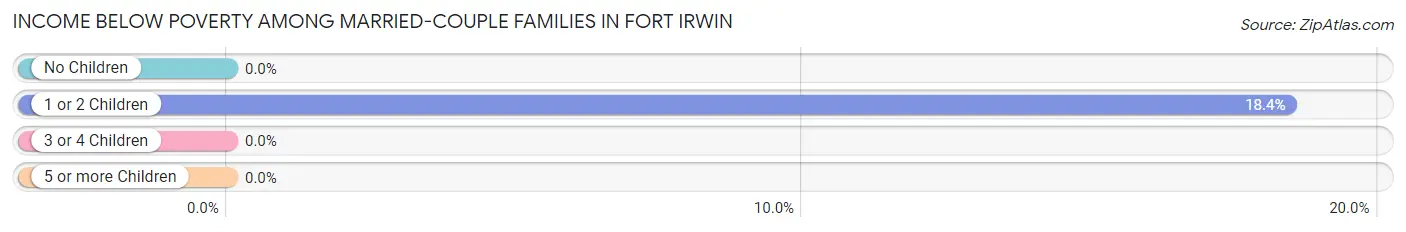
Income Below Poverty Among Married-Couple Families in Fort Irwin
The poverty statistics for married-couple families in Fort Irwin show that 7.7% or 130 of the total 1,683 families live below the poverty line. Families with 1 or 2 children have the highest poverty rate of 18.4%, comprising of 130 families. On the other hand, families with no children have the lowest poverty rate of 0.0%, which includes 0 families.
| Children | Above Poverty | Below Poverty |
| No Children | 803 (100.0%) | 0 (0.0%) |
| 1 or 2 Children | 575 (81.6%) | 130 (18.4%) |
| 3 or 4 Children | 139 (100.0%) | 0 (0.0%) |
| 5 or more Children | 36 (100.0%) | 0 (0.0%) |
| Total | 1,553 (92.3%) | 130 (7.7%) |
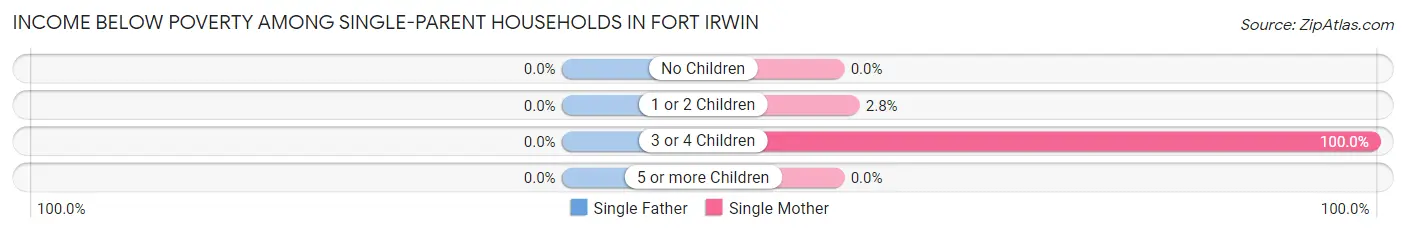
Income Below Poverty Among Single-Parent Households in Fort Irwin
| Children | Single Father | Single Mother |
| No Children | 0 (0.0%) | 0 (0.0%) |
| 1 or 2 Children | 0 (0.0%) | 4 (2.8%) |
| 3 or 4 Children | 0 (0.0%) | 67 (100.0%) |
| 5 or more Children | 0 (0.0%) | 0 (0.0%) |
| Total | 0 (0.0%) | 71 (34.0%) |
Income Below Poverty Among Married-Couple vs Single-Parent Households in Fort Irwin
The poverty data for Fort Irwin shows that 130 of the married-couple family households (7.7%) and 71 of the single-parent households (16.8%) are living below the poverty level. Within the married-couple family households, those with 1 or 2 children have the highest poverty rate, with 130 households (18.4%) falling below the poverty line. Among the single-parent households, those with 3 or 4 children have the highest poverty rate, with 67 household (100.0%) living below poverty.
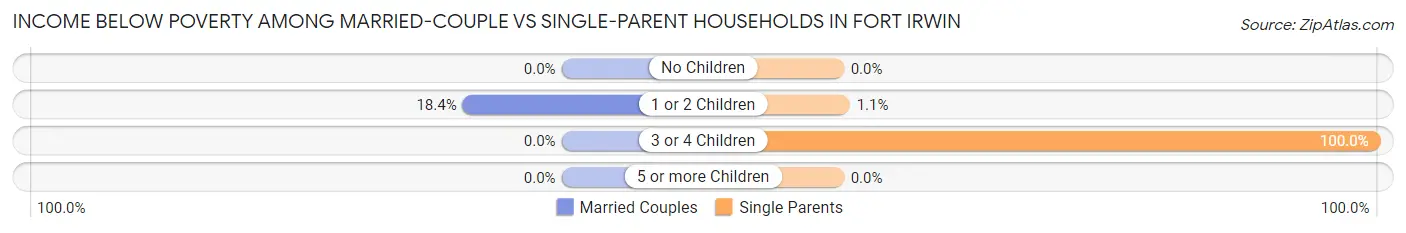
| Children | Married-Couple Families | Single-Parent Households |
| No Children | 0 (0.0%) | 0 (0.0%) |
| 1 or 2 Children | 130 (18.4%) | 4 (1.1%) |
| 3 or 4 Children | 0 (0.0%) | 67 (100.0%) |
| 5 or more Children | 0 (0.0%) | 0 (0.0%) |
| Total | 130 (7.7%) | 71 (16.8%) |
Employment Characteristics in Fort Irwin
Employment by Class of Employer in Fort Irwin
Among the 5,164 employed individuals in Fort Irwin, federal government employees (4,362 | 84.5%), private company employees (564 | 10.9%), and local government employees (125 | 2.4%) make up the most common classes of employment.
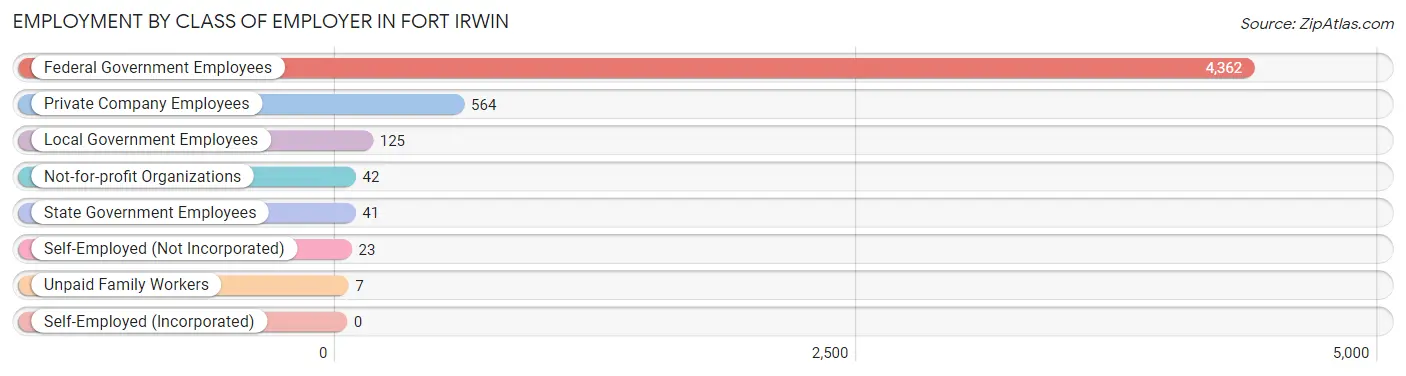
| Employer Class | # Employees | % Employees |
| Private Company Employees | 564 | 10.9% |
| Self-Employed (Incorporated) | 0 | 0.0% |
| Self-Employed (Not Incorporated) | 23 | 0.4% |
| Not-for-profit Organizations | 42 | 0.8% |
| Local Government Employees | 125 | 2.4% |
| State Government Employees | 41 | 0.8% |
| Federal Government Employees | 4,362 | 84.5% |
| Unpaid Family Workers | 7 | 0.1% |
| Total | 5,164 | 100.0% |
Employment Status by Age in Fort Irwin
According to the labor force statistics for Fort Irwin, out of the total population over 16 years of age (6,296), 86.8% or 5,465 individuals are in the labor force, with 15.4% or 842 of them unemployed. The age group with the highest labor force participation rate is 16 to 19 years, with 97.3% or 427 individuals in the labor force. Within the labor force, the 35 to 44 years age range has the highest percentage of unemployed individuals, with 31.0% or 207 of them being unemployed.
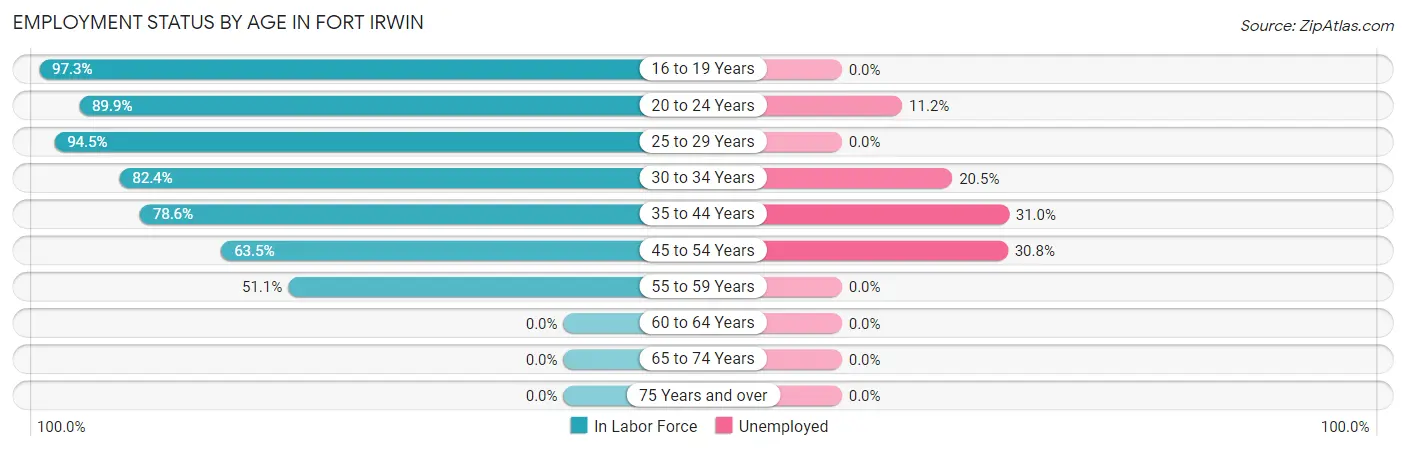
| Age Bracket | In Labor Force | Unemployed |
| 16 to 19 Years | 427 (97.3%) | 0 (0.0%) |
| 20 to 24 Years | 1,980 (89.9%) | 222 (11.2%) |
| 25 to 29 Years | 1,162 (94.5%) | 0 (0.0%) |
| 30 to 34 Years | 1,056 (82.4%) | 216 (20.5%) |
| 35 to 44 Years | 667 (78.6%) | 207 (31.0%) |
| 45 to 54 Years | 153 (63.5%) | 47 (30.8%) |
| 55 to 59 Years | 24 (51.1%) | 0 (0.0%) |
| 60 to 64 Years | 0 (0.0%) | 0 (0.0%) |
| 65 to 74 Years | 0 (0.0%) | 0 (0.0%) |
| 75 Years and over | 0 (0.0%) | 0 (0.0%) |
| Total | 5,465 (86.8%) | 842 (15.4%) |
Employment Status by Educational Attainment in Fort Irwin
According to labor force statistics for Fort Irwin, 83.9% of individuals (3,061) out of the total population between 25 and 64 years of age (3,648) are in the labor force, with 17.0% or 520 of them being unemployed. The group with the highest labor force participation rate are those with the educational attainment of bachelor's degree or higher, with 96.5% or 1,020 individuals in the labor force. Within the labor force, individuals with high school diploma education have the highest percentage of unemployment, with 39.9% or 236 of them being unemployed.
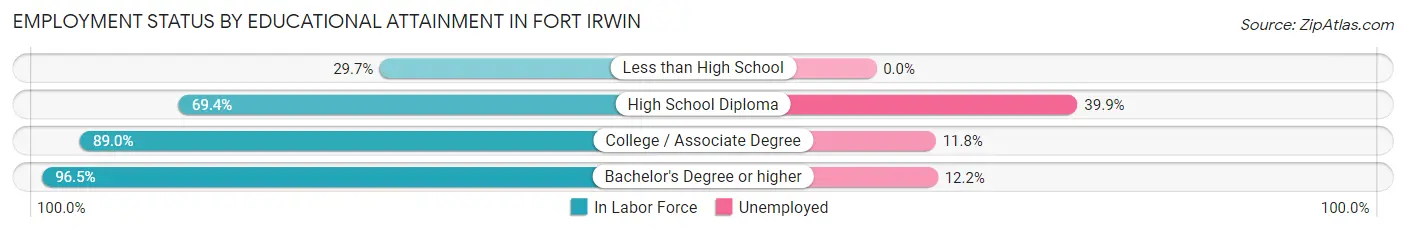
| Educational Attainment | In Labor Force | Unemployed |
| Less than High School | 49 (29.7%) | 0 (0.0%) |
| High School Diploma | 591 (69.4%) | 340 (39.9%) |
| College / Associate Degree | 1,401 (89.0%) | 186 (11.8%) |
| Bachelor's Degree or higher | 1,020 (96.5%) | 129 (12.2%) |
| Total | 3,061 (83.9%) | 620 (17.0%) |
Employment Occupations by Sex in Fort Irwin
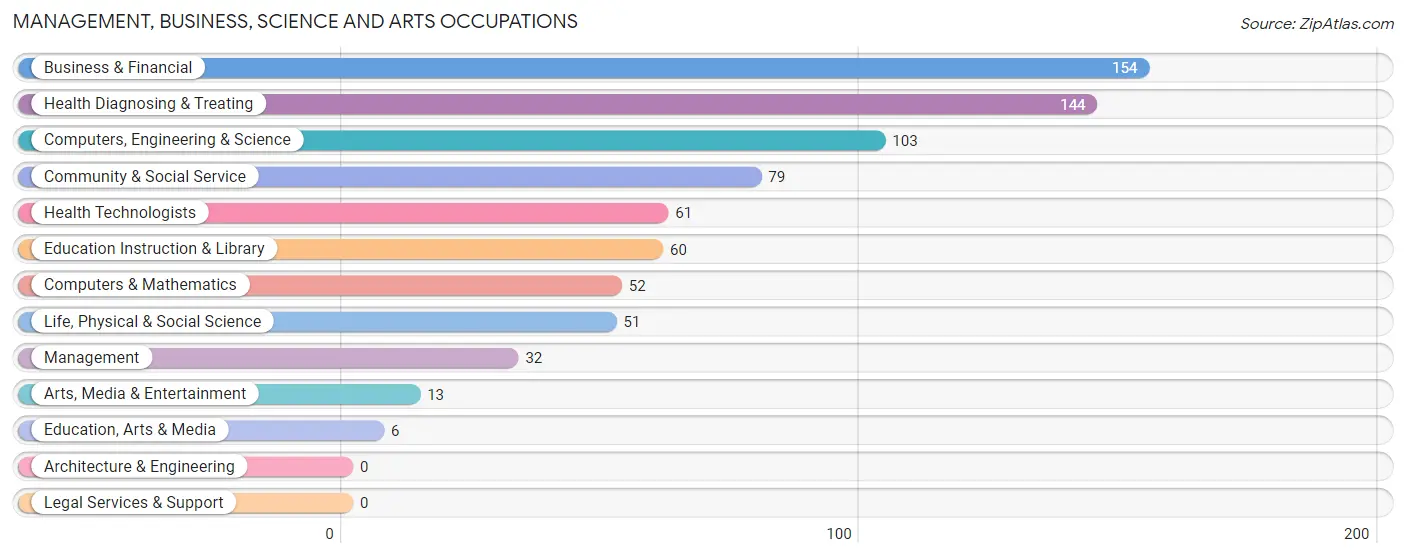
Management, Business, Science and Arts Occupations
The most common Management, Business, Science and Arts occupations in Fort Irwin are Business & Financial (154 | 12.0%), Health Diagnosing & Treating (144 | 11.2%), Computers, Engineering & Science (103 | 8.0%), Community & Social Service (79 | 6.1%), and Health Technologists (61 | 4.8%).
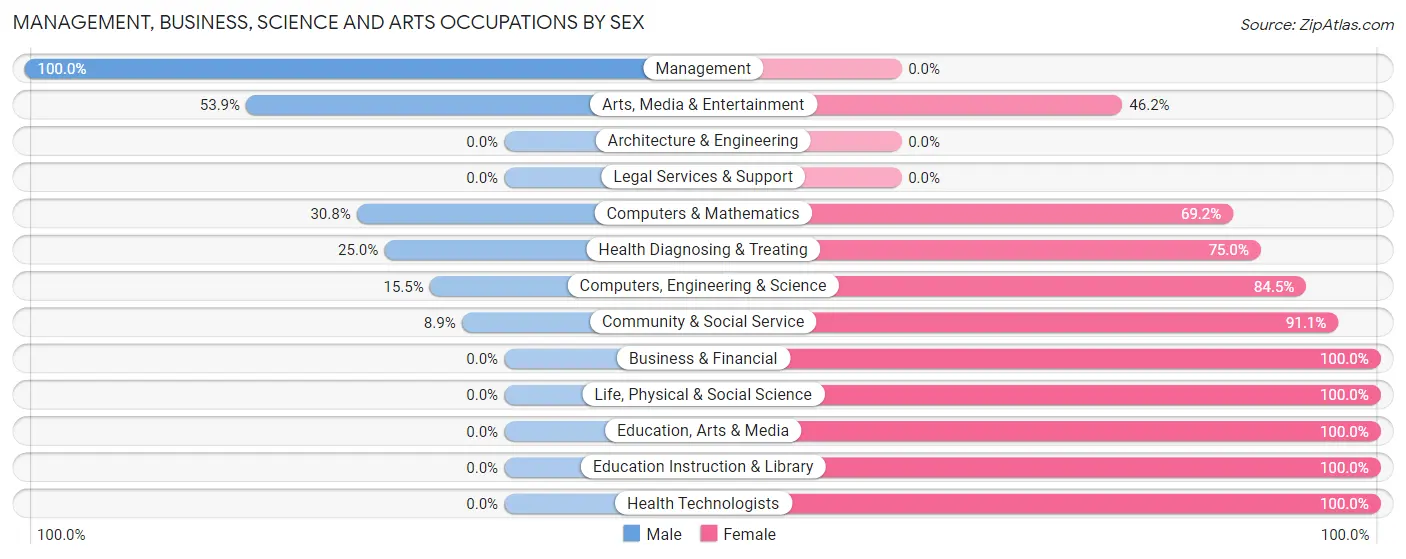
Management, Business, Science and Arts Occupations by Sex
Within the Management, Business, Science and Arts occupations in Fort Irwin, the most male-oriented occupations are Management (100.0%), Arts, Media & Entertainment (53.8%), and Computers & Mathematics (30.8%), while the most female-oriented occupations are Business & Financial (100.0%), Life, Physical & Social Science (100.0%), and Education, Arts & Media (100.0%).
| Occupation | Male | Female |
| Management | 32 (100.0%) | 0 (0.0%) |
| Business & Financial | 0 (0.0%) | 154 (100.0%) |
| Computers, Engineering & Science | 16 (15.5%) | 87 (84.5%) |
| Computers & Mathematics | 16 (30.8%) | 36 (69.2%) |
| Architecture & Engineering | 0 (0.0%) | 0 (0.0%) |
| Life, Physical & Social Science | 0 (0.0%) | 51 (100.0%) |
| Community & Social Service | 7 (8.9%) | 72 (91.1%) |
| Education, Arts & Media | 0 (0.0%) | 6 (100.0%) |
| Legal Services & Support | 0 (0.0%) | 0 (0.0%) |
| Education Instruction & Library | 0 (0.0%) | 60 (100.0%) |
| Arts, Media & Entertainment | 7 (53.8%) | 6 (46.2%) |
| Health Diagnosing & Treating | 36 (25.0%) | 108 (75.0%) |
| Health Technologists | 0 (0.0%) | 61 (100.0%) |
| Total (Category) | 91 (17.8%) | 421 (82.2%) |
| Total (Overall) | 406 (31.6%) | 878 (68.4%) |
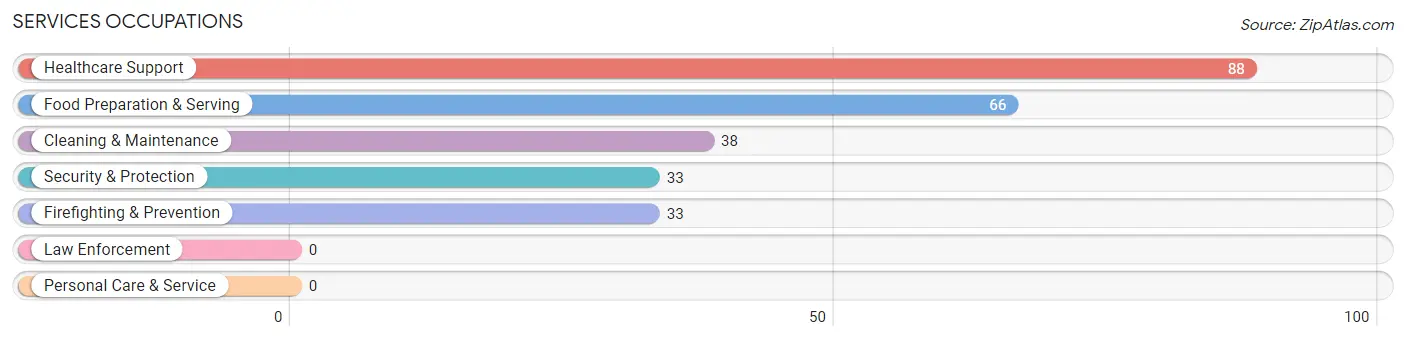
Services Occupations
The most common Services occupations in Fort Irwin are Healthcare Support (88 | 6.9%), Food Preparation & Serving (66 | 5.1%), Cleaning & Maintenance (38 | 3.0%), Security & Protection (33 | 2.6%), and Firefighting & Prevention (33 | 2.6%).
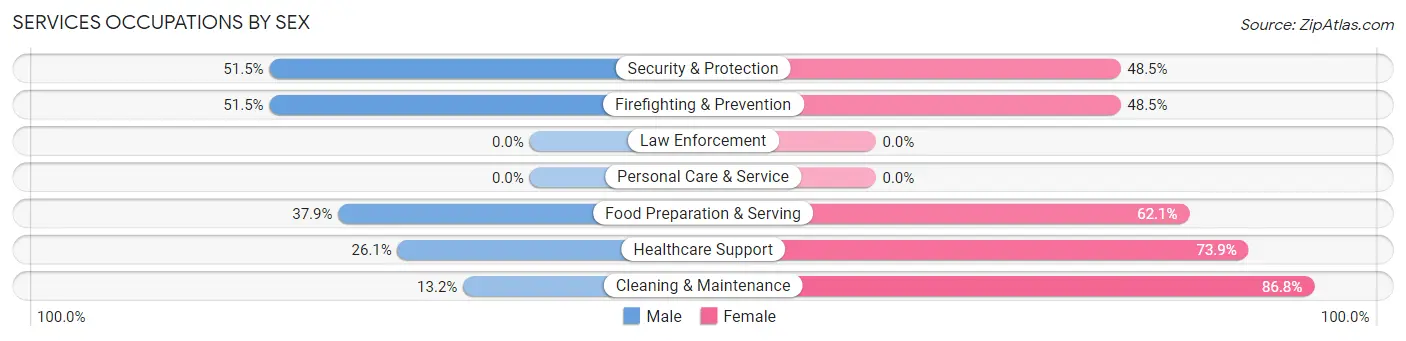
Services Occupations by Sex
Within the Services occupations in Fort Irwin, the most male-oriented occupations are Security & Protection (51.5%), Firefighting & Prevention (51.5%), and Food Preparation & Serving (37.9%), while the most female-oriented occupations are Cleaning & Maintenance (86.8%), Healthcare Support (73.9%), and Food Preparation & Serving (62.1%).
| Occupation | Male | Female |
| Healthcare Support | 23 (26.1%) | 65 (73.9%) |
| Security & Protection | 17 (51.5%) | 16 (48.5%) |
| Firefighting & Prevention | 17 (51.5%) | 16 (48.5%) |
| Law Enforcement | 0 (0.0%) | 0 (0.0%) |
| Food Preparation & Serving | 25 (37.9%) | 41 (62.1%) |
| Cleaning & Maintenance | 5 (13.2%) | 33 (86.8%) |
| Personal Care & Service | 0 (0.0%) | 0 (0.0%) |
| Total (Category) | 70 (31.1%) | 155 (68.9%) |
| Total (Overall) | 406 (31.6%) | 878 (68.4%) |
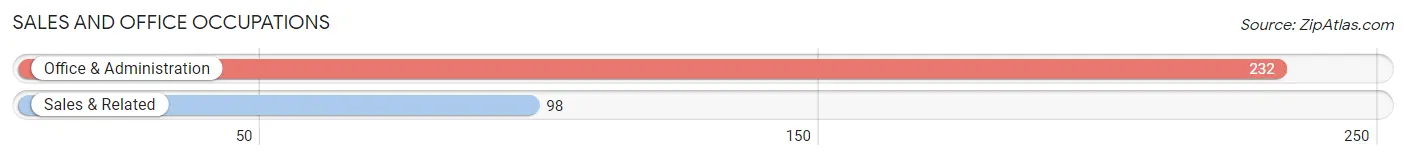
Sales and Office Occupations
The most common Sales and Office occupations in Fort Irwin are Office & Administration (232 | 18.1%), and Sales & Related (98 | 7.6%).
Sales and Office Occupations by Sex
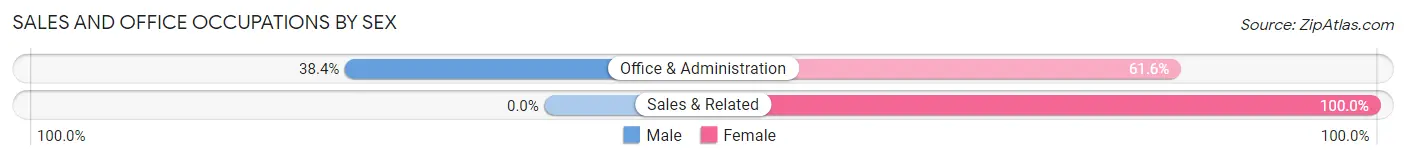
| Occupation | Male | Female |
| Sales & Related | 0 (0.0%) | 98 (100.0%) |
| Office & Administration | 89 (38.4%) | 143 (61.6%) |
| Total (Category) | 89 (27.0%) | 241 (73.0%) |
| Total (Overall) | 406 (31.6%) | 878 (68.4%) |
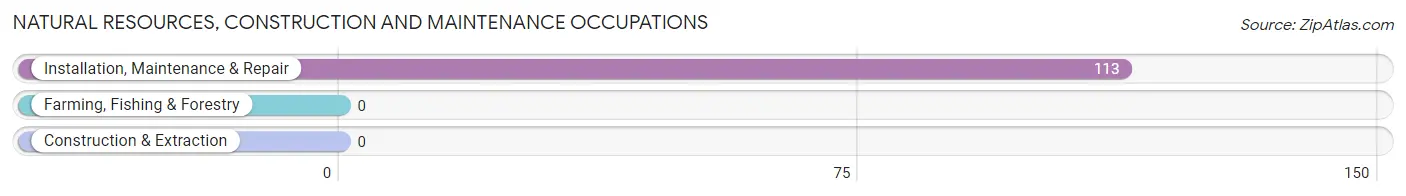
Natural Resources, Construction and Maintenance Occupations
The most common Natural Resources, Construction and Maintenance occupations in Fort Irwin are , and Installation, Maintenance & Repair (113 | 8.8%).
Natural Resources, Construction and Maintenance Occupations by Sex
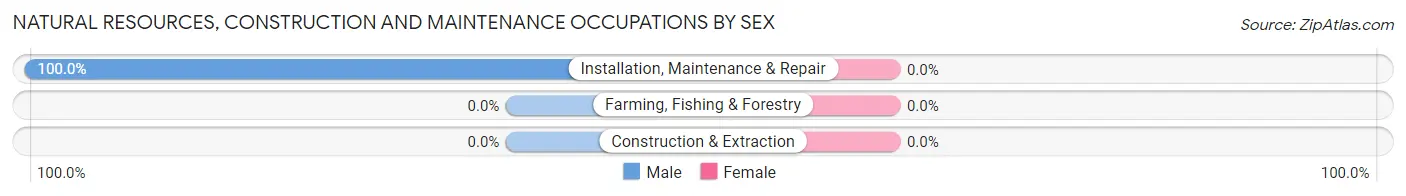
| Occupation | Male | Female |
| Farming, Fishing & Forestry | 0 (0.0%) | 0 (0.0%) |
| Construction & Extraction | 0 (0.0%) | 0 (0.0%) |
| Installation, Maintenance & Repair | 113 (100.0%) | 0 (0.0%) |
| Total (Category) | 113 (100.0%) | 0 (0.0%) |
| Total (Overall) | 406 (31.6%) | 878 (68.4%) |
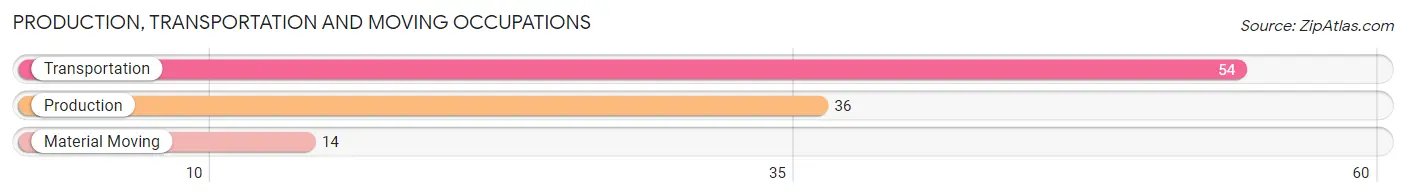
Production, Transportation and Moving Occupations
The most common Production, Transportation and Moving occupations in Fort Irwin are Transportation (54 | 4.2%), Production (36 | 2.8%), and Material Moving (14 | 1.1%).
Production, Transportation and Moving Occupations by Sex
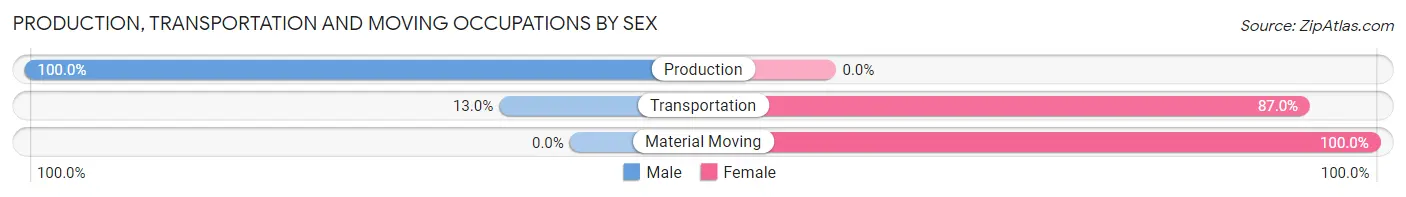
| Occupation | Male | Female |
| Production | 36 (100.0%) | 0 (0.0%) |
| Transportation | 7 (13.0%) | 47 (87.0%) |
| Material Moving | 0 (0.0%) | 14 (100.0%) |
| Total (Category) | 43 (41.3%) | 61 (58.7%) |
| Total (Overall) | 406 (31.6%) | 878 (68.4%) |
Employment Industries by Sex in Fort Irwin
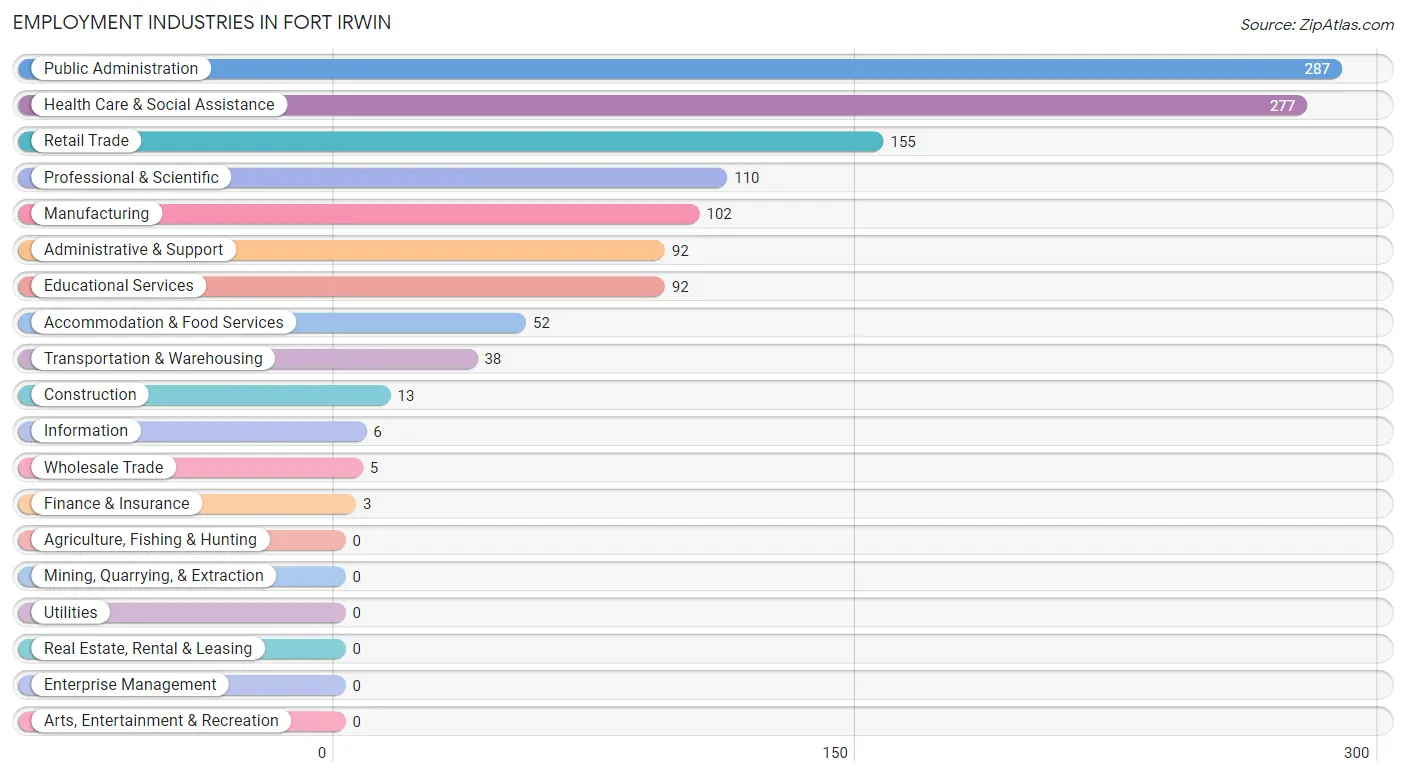
Employment Industries in Fort Irwin
The major employment industries in Fort Irwin include Public Administration (287 | 22.4%), Health Care & Social Assistance (277 | 21.6%), Retail Trade (155 | 12.1%), Professional & Scientific (110 | 8.6%), and Manufacturing (102 | 7.9%).
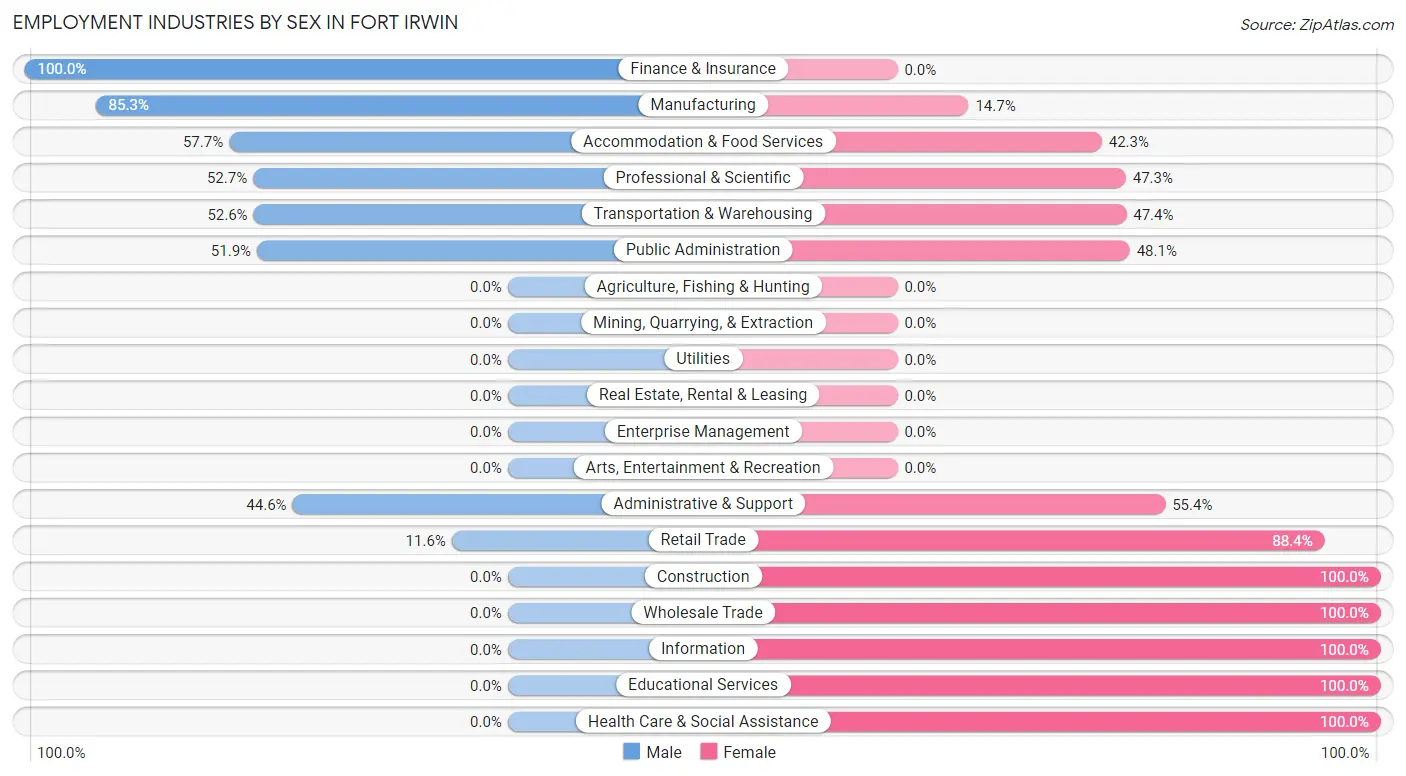
Employment Industries by Sex in Fort Irwin
The Fort Irwin industries that see more men than women are Finance & Insurance (100.0%), Manufacturing (85.3%), and Accommodation & Food Services (57.7%), whereas the industries that tend to have a higher number of women are Construction (100.0%), Wholesale Trade (100.0%), and Information (100.0%).
| Industry | Male | Female |
| Agriculture, Fishing & Hunting | 0 (0.0%) | 0 (0.0%) |
| Mining, Quarrying, & Extraction | 0 (0.0%) | 0 (0.0%) |
| Construction | 0 (0.0%) | 13 (100.0%) |
| Manufacturing | 87 (85.3%) | 15 (14.7%) |
| Wholesale Trade | 0 (0.0%) | 5 (100.0%) |
| Retail Trade | 18 (11.6%) | 137 (88.4%) |
| Transportation & Warehousing | 20 (52.6%) | 18 (47.4%) |
| Utilities | 0 (0.0%) | 0 (0.0%) |
| Information | 0 (0.0%) | 6 (100.0%) |
| Finance & Insurance | 3 (100.0%) | 0 (0.0%) |
| Real Estate, Rental & Leasing | 0 (0.0%) | 0 (0.0%) |
| Professional & Scientific | 58 (52.7%) | 52 (47.3%) |
| Enterprise Management | 0 (0.0%) | 0 (0.0%) |
| Administrative & Support | 41 (44.6%) | 51 (55.4%) |
| Educational Services | 0 (0.0%) | 92 (100.0%) |
| Health Care & Social Assistance | 0 (0.0%) | 277 (100.0%) |
| Arts, Entertainment & Recreation | 0 (0.0%) | 0 (0.0%) |
| Accommodation & Food Services | 30 (57.7%) | 22 (42.3%) |
| Public Administration | 149 (51.9%) | 138 (48.1%) |
| Total | 406 (31.6%) | 878 (68.4%) |
Education in Fort Irwin
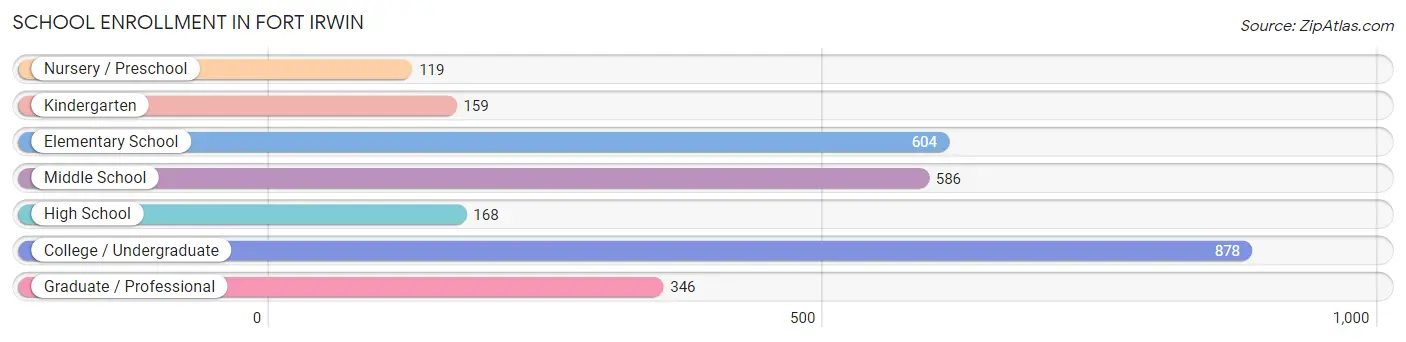
School Enrollment in Fort Irwin
The most common levels of schooling among the 2,860 students in Fort Irwin are college / undergraduate (878 | 30.7%), elementary school (604 | 21.1%), and middle school (586 | 20.5%).
| School Level | # Students | % Students |
| Nursery / Preschool | 119 | 4.2% |
| Kindergarten | 159 | 5.6% |
| Elementary School | 604 | 21.1% |
| Middle School | 586 | 20.5% |
| High School | 168 | 5.9% |
| College / Undergraduate | 878 | 30.7% |
| Graduate / Professional | 346 | 12.1% |
| Total | 2,860 | 100.0% |
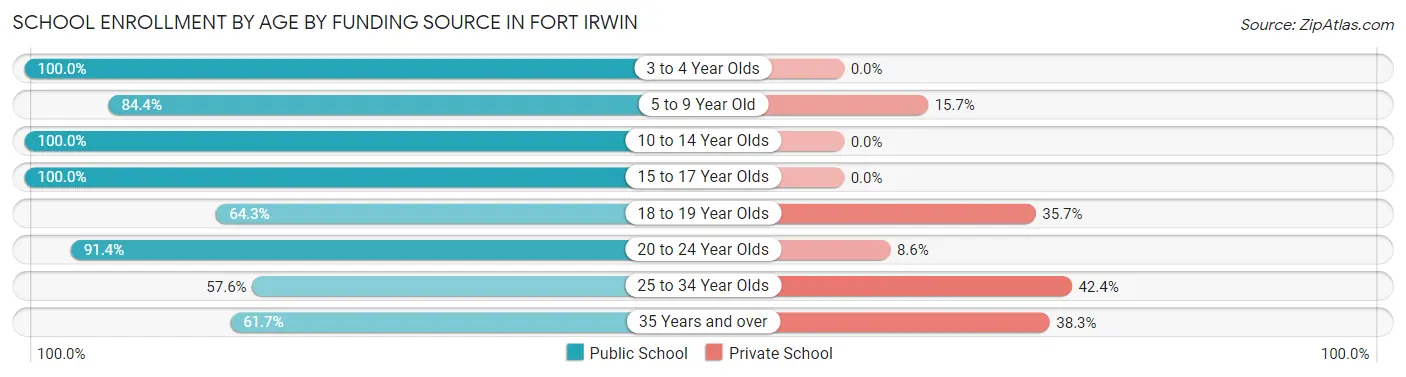
School Enrollment by Age by Funding Source in Fort Irwin
Out of a total of 2,860 students who are enrolled in schools in Fort Irwin, 500 (17.5%) attend a private institution, while the remaining 2,360 (82.5%) are enrolled in public schools. The age group of 25 to 34 year olds has the highest likelihood of being enrolled in private schools, with 255 (42.4% in the age bracket) enrolled. Conversely, the age group of 3 to 4 year olds has the lowest likelihood of being enrolled in a private school, with 113 (100.0% in the age bracket) attending a public institution.
| Age Bracket | Public School | Private School |
| 3 to 4 Year Olds | 113 (100.0%) | 0 (0.0%) |
| 5 to 9 Year Old | 625 (84.4%) | 116 (15.7%) |
| 10 to 14 Year Olds | 678 (100.0%) | 0 (0.0%) |
| 15 to 17 Year Olds | 87 (100.0%) | 0 (0.0%) |
| 18 to 19 Year Olds | 36 (64.3%) | 20 (35.7%) |
| 20 to 24 Year Olds | 350 (91.4%) | 33 (8.6%) |
| 25 to 34 Year Olds | 346 (57.6%) | 255 (42.4%) |
| 35 Years and over | 124 (61.7%) | 77 (38.3%) |
| Total | 2,360 (82.5%) | 500 (17.5%) |
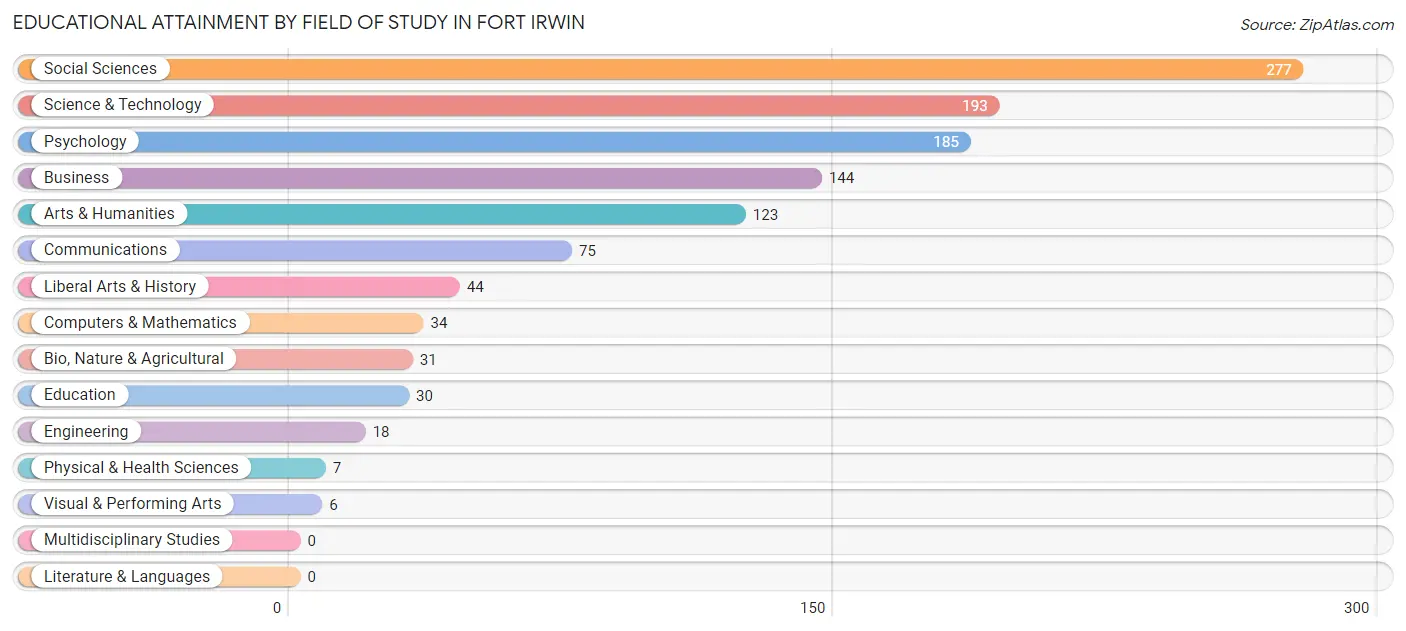
Educational Attainment by Field of Study in Fort Irwin
Social sciences (277 | 23.7%), science & technology (193 | 16.5%), psychology (185 | 15.9%), business (144 | 12.3%), and arts & humanities (123 | 10.5%) are the most common fields of study among 1,167 individuals in Fort Irwin who have obtained a bachelor's degree or higher.
| Field of Study | # Graduates | % Graduates |
| Computers & Mathematics | 34 | 2.9% |
| Bio, Nature & Agricultural | 31 | 2.7% |
| Physical & Health Sciences | 7 | 0.6% |
| Psychology | 185 | 15.9% |
| Social Sciences | 277 | 23.7% |
| Engineering | 18 | 1.5% |
| Multidisciplinary Studies | 0 | 0.0% |
| Science & Technology | 193 | 16.5% |
| Business | 144 | 12.3% |
| Education | 30 | 2.6% |
| Literature & Languages | 0 | 0.0% |
| Liberal Arts & History | 44 | 3.8% |
| Visual & Performing Arts | 6 | 0.5% |
| Communications | 75 | 6.4% |
| Arts & Humanities | 123 | 10.5% |
| Total | 1,167 | 100.0% |
Transportation & Commute in Fort Irwin
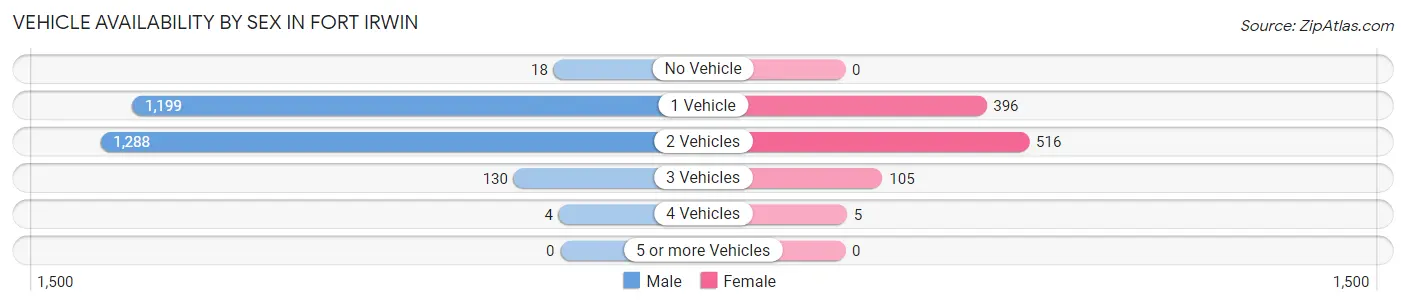
Vehicle Availability by Sex in Fort Irwin
The most prevalent vehicle ownership categories in Fort Irwin are males with 2 vehicles (1,288, accounting for 48.8%) and females with 2 vehicles (516, making up 126.0%).
| Vehicles Available | Male | Female |
| No Vehicle | 18 (0.7%) | 0 (0.0%) |
| 1 Vehicle | 1,199 (45.4%) | 396 (38.8%) |
| 2 Vehicles | 1,288 (48.8%) | 516 (50.5%) |
| 3 Vehicles | 130 (4.9%) | 105 (10.3%) |
| 4 Vehicles | 4 (0.2%) | 5 (0.5%) |
| 5 or more Vehicles | 0 (0.0%) | 0 (0.0%) |
| Total | 2,639 (100.0%) | 1,022 (100.0%) |
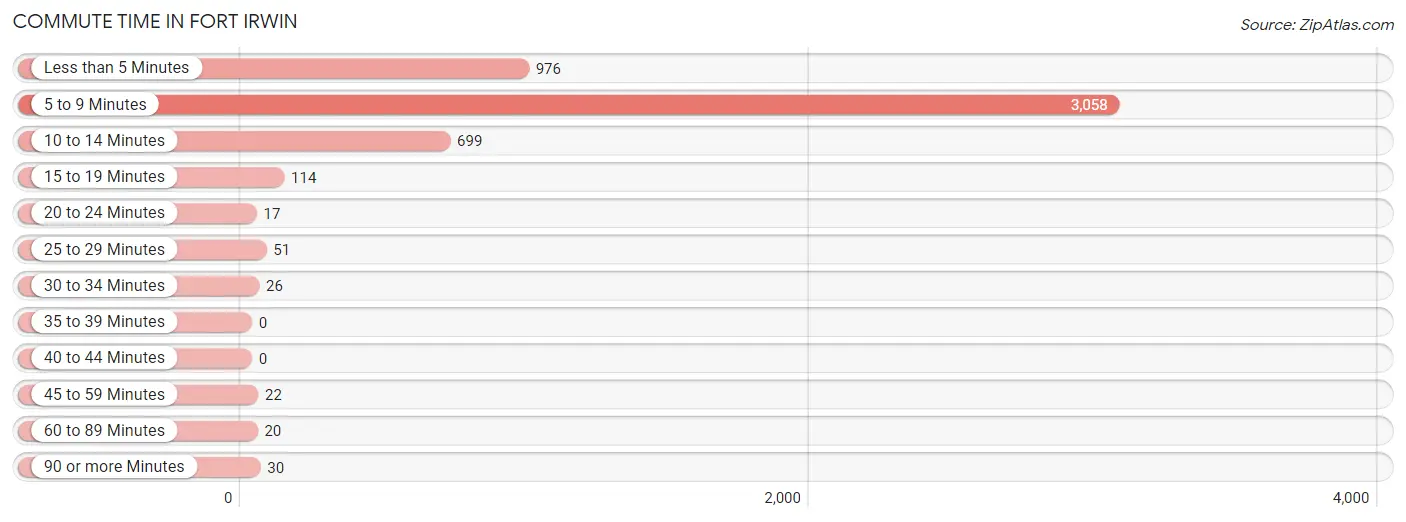
Commute Time in Fort Irwin
The most frequently occuring commute durations in Fort Irwin are 5 to 9 minutes (3,058 commuters, 61.0%), less than 5 minutes (976 commuters, 19.5%), and 10 to 14 minutes (699 commuters, 13.9%).
| Commute Time | # Commuters | % Commuters |
| Less than 5 Minutes | 976 | 19.5% |
| 5 to 9 Minutes | 3,058 | 61.0% |
| 10 to 14 Minutes | 699 | 13.9% |
| 15 to 19 Minutes | 114 | 2.3% |
| 20 to 24 Minutes | 17 | 0.3% |
| 25 to 29 Minutes | 51 | 1.0% |
| 30 to 34 Minutes | 26 | 0.5% |
| 35 to 39 Minutes | 0 | 0.0% |
| 40 to 44 Minutes | 0 | 0.0% |
| 45 to 59 Minutes | 22 | 0.4% |
| 60 to 89 Minutes | 20 | 0.4% |
| 90 or more Minutes | 30 | 0.6% |
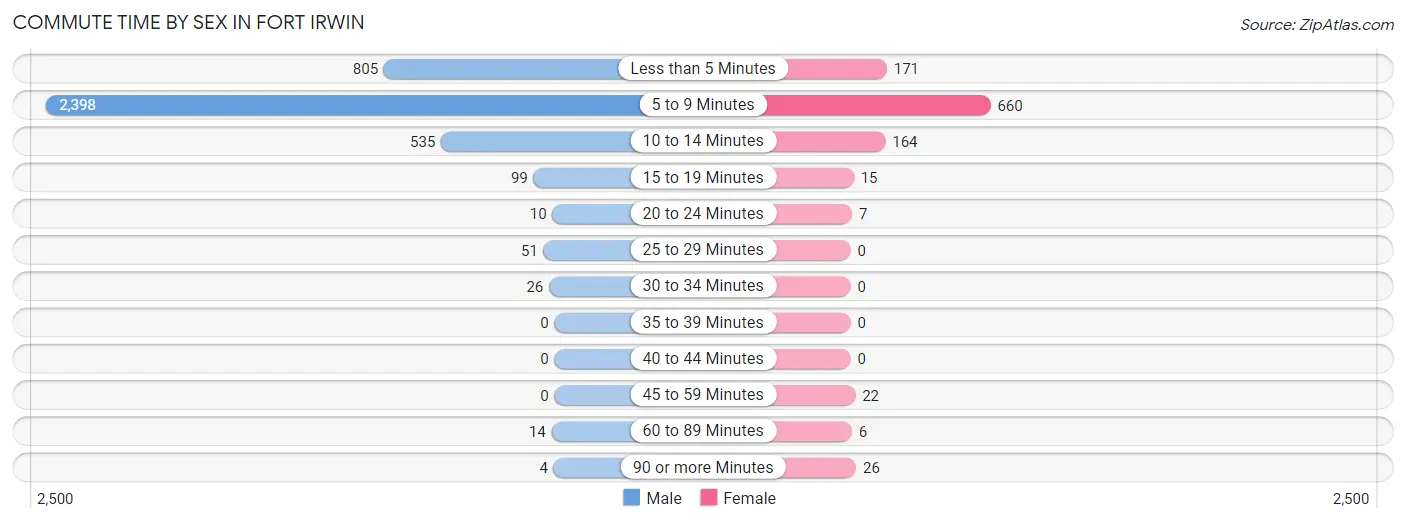
Commute Time by Sex in Fort Irwin
The most common commute times in Fort Irwin are 5 to 9 minutes (2,398 commuters, 60.8%) for males and 5 to 9 minutes (660 commuters, 61.6%) for females.
| Commute Time | Male | Female |
| Less than 5 Minutes | 805 (20.4%) | 171 (16.0%) |
| 5 to 9 Minutes | 2,398 (60.8%) | 660 (61.6%) |
| 10 to 14 Minutes | 535 (13.6%) | 164 (15.3%) |
| 15 to 19 Minutes | 99 (2.5%) | 15 (1.4%) |
| 20 to 24 Minutes | 10 (0.3%) | 7 (0.6%) |
| 25 to 29 Minutes | 51 (1.3%) | 0 (0.0%) |
| 30 to 34 Minutes | 26 (0.7%) | 0 (0.0%) |
| 35 to 39 Minutes | 0 (0.0%) | 0 (0.0%) |
| 40 to 44 Minutes | 0 (0.0%) | 0 (0.0%) |
| 45 to 59 Minutes | 0 (0.0%) | 22 (2.1%) |
| 60 to 89 Minutes | 14 (0.4%) | 6 (0.6%) |
| 90 or more Minutes | 4 (0.1%) | 26 (2.4%) |
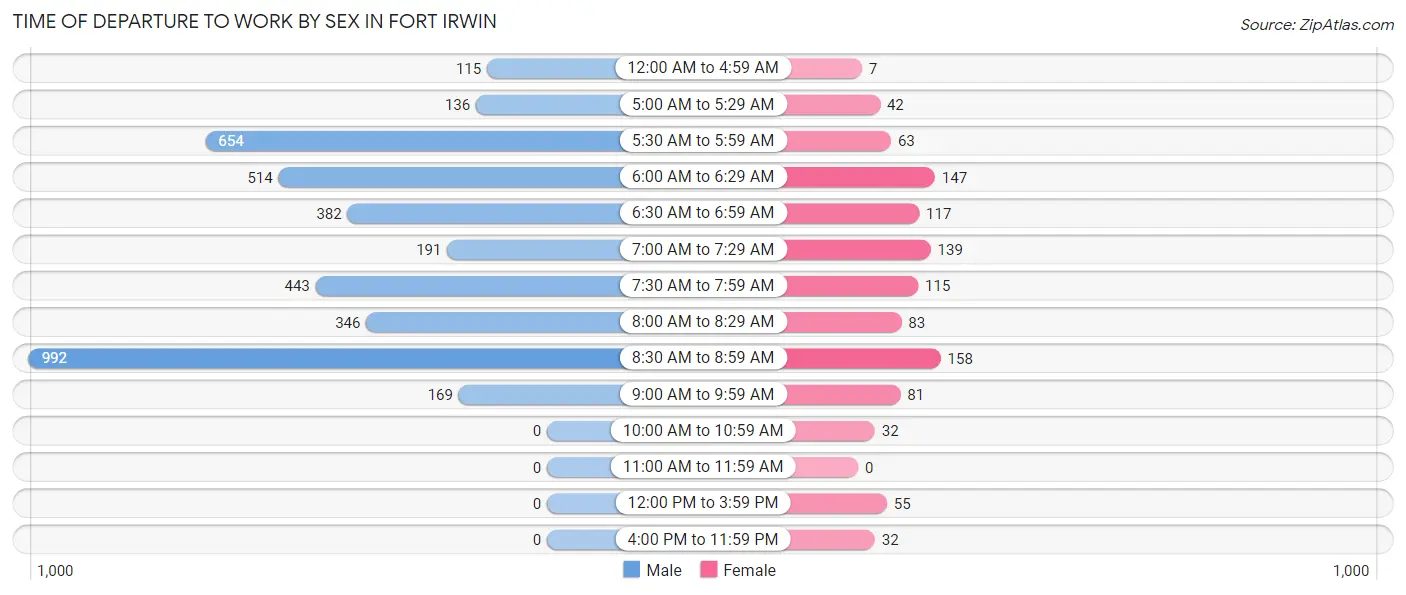
Time of Departure to Work by Sex in Fort Irwin
The most frequent times of departure to work in Fort Irwin are 8:30 AM to 8:59 AM (992, 25.2%) for males and 8:30 AM to 8:59 AM (158, 14.7%) for females.
| Time of Departure | Male | Female |
| 12:00 AM to 4:59 AM | 115 (2.9%) | 7 (0.6%) |
| 5:00 AM to 5:29 AM | 136 (3.5%) | 42 (3.9%) |
| 5:30 AM to 5:59 AM | 654 (16.6%) | 63 (5.9%) |
| 6:00 AM to 6:29 AM | 514 (13.0%) | 147 (13.7%) |
| 6:30 AM to 6:59 AM | 382 (9.7%) | 117 (10.9%) |
| 7:00 AM to 7:29 AM | 191 (4.9%) | 139 (13.0%) |
| 7:30 AM to 7:59 AM | 443 (11.2%) | 115 (10.7%) |
| 8:00 AM to 8:29 AM | 346 (8.8%) | 83 (7.7%) |
| 8:30 AM to 8:59 AM | 992 (25.2%) | 158 (14.7%) |
| 9:00 AM to 9:59 AM | 169 (4.3%) | 81 (7.6%) |
| 10:00 AM to 10:59 AM | 0 (0.0%) | 32 (3.0%) |
| 11:00 AM to 11:59 AM | 0 (0.0%) | 0 (0.0%) |
| 12:00 PM to 3:59 PM | 0 (0.0%) | 55 (5.1%) |
| 4:00 PM to 11:59 PM | 0 (0.0%) | 32 (3.0%) |
| Total | 3,942 (100.0%) | 1,071 (100.0%) |
Housing Occupancy in Fort Irwin
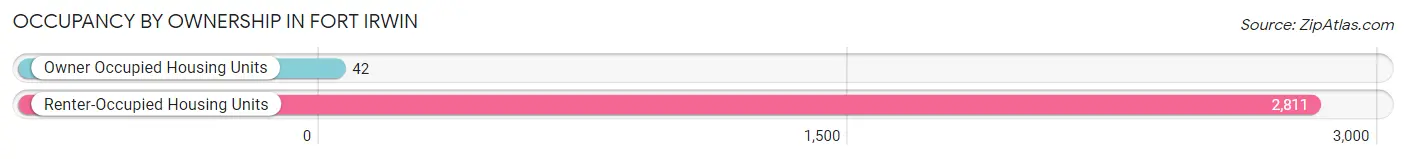
Occupancy by Ownership in Fort Irwin
Of the total 2,853 dwellings in Fort Irwin, owner-occupied units account for 42 (1.5%), while renter-occupied units make up 2,811 (98.5%).
| Occupancy | # Housing Units | % Housing Units |
| Owner Occupied Housing Units | 42 | 1.5% |
| Renter-Occupied Housing Units | 2,811 | 98.5% |
| Total Occupied Housing Units | 2,853 | 100.0% |
Occupancy by Household Size in Fort Irwin
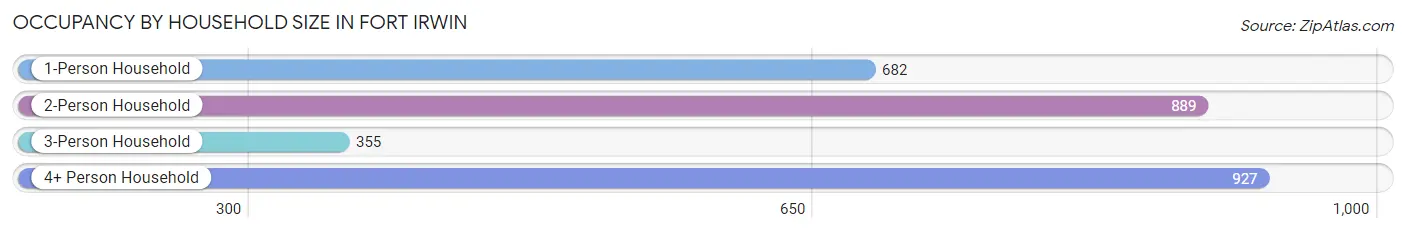
| Household Size | # Housing Units | % Housing Units |
| 1-Person Household | 682 | 23.9% |
| 2-Person Household | 889 | 31.2% |
| 3-Person Household | 355 | 12.4% |
| 4+ Person Household | 927 | 32.5% |
| Total Housing Units | 2,853 | 100.0% |
Occupancy by Ownership by Household Size in Fort Irwin
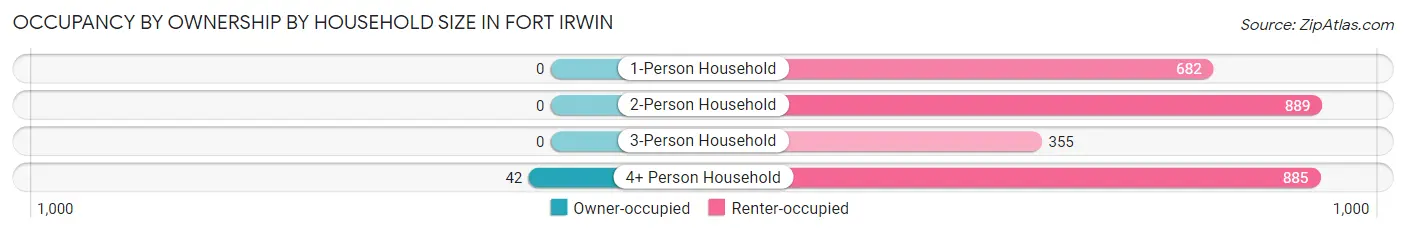
| Household Size | Owner-occupied | Renter-occupied |
| 1-Person Household | 0 (0.0%) | 682 (100.0%) |
| 2-Person Household | 0 (0.0%) | 889 (100.0%) |
| 3-Person Household | 0 (0.0%) | 355 (100.0%) |
| 4+ Person Household | 42 (4.5%) | 885 (95.5%) |
| Total Housing Units | 42 (1.5%) | 2,811 (98.5%) |
Occupancy by Educational Attainment in Fort Irwin
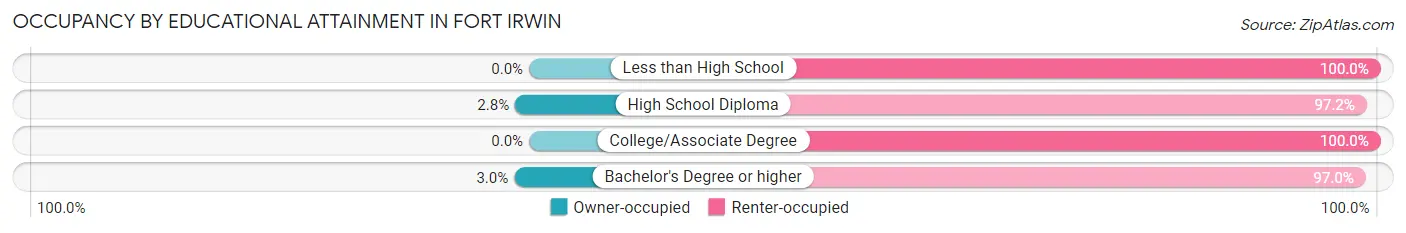
| Household Size | Owner-occupied | Renter-occupied |
| Less than High School | 0 (0.0%) | 39 (100.0%) |
| High School Diploma | 18 (2.8%) | 632 (97.2%) |
| College/Associate Degree | 0 (0.0%) | 1,353 (100.0%) |
| Bachelor's Degree or higher | 24 (3.0%) | 787 (97.0%) |
Occupancy by Age of Householder in Fort Irwin
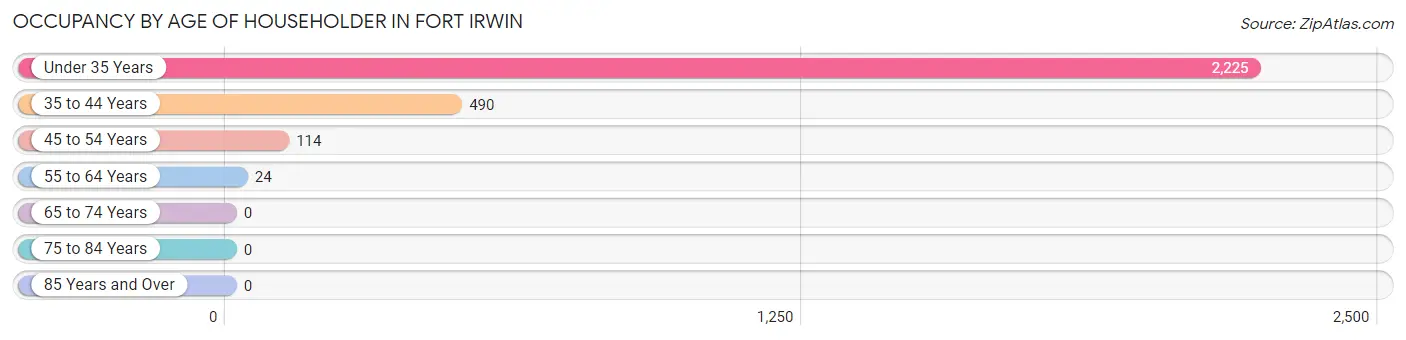
| Age Bracket | # Households | % Households |
| Under 35 Years | 2,225 | 78.0% |
| 35 to 44 Years | 490 | 17.2% |
| 45 to 54 Years | 114 | 4.0% |
| 55 to 64 Years | 24 | 0.8% |
| 65 to 74 Years | 0 | 0.0% |
| 75 to 84 Years | 0 | 0.0% |
| 85 Years and Over | 0 | 0.0% |
| Total | 2,853 | 100.0% |
Housing Finances in Fort Irwin
Median Income by Occupancy in Fort Irwin
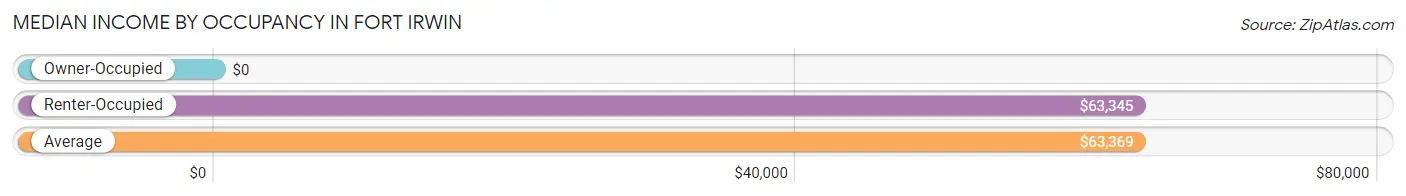
| Occupancy Type | # Households | Median Income |
| Owner-Occupied | 42 (1.5%) | $0 |
| Renter-Occupied | 2,811 (98.5%) | $63,345 |
| Average | 2,853 (100.0%) | $63,369 |
Occupancy by Householder Income Bracket in Fort Irwin
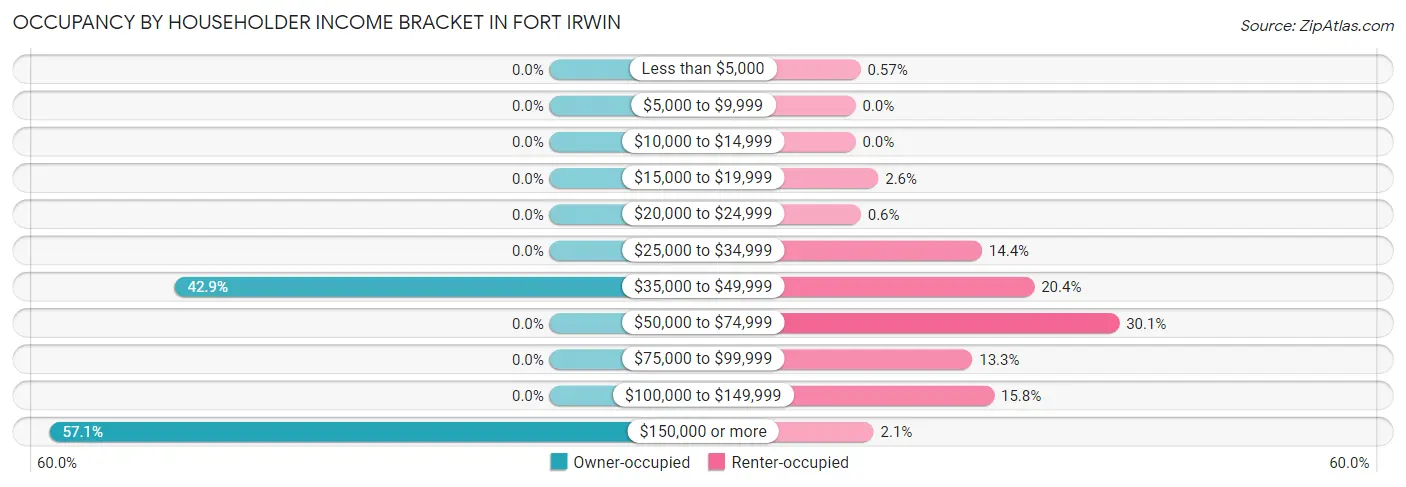
| Income Bracket | Owner-occupied | Renter-occupied |
| Less than $5,000 | 0 (0.0%) | 16 (0.6%) |
| $5,000 to $9,999 | 0 (0.0%) | 0 (0.0%) |
| $10,000 to $14,999 | 0 (0.0%) | 0 (0.0%) |
| $15,000 to $19,999 | 0 (0.0%) | 73 (2.6%) |
| $20,000 to $24,999 | 0 (0.0%) | 17 (0.6%) |
| $25,000 to $34,999 | 0 (0.0%) | 406 (14.4%) |
| $35,000 to $49,999 | 18 (42.9%) | 574 (20.4%) |
| $50,000 to $74,999 | 0 (0.0%) | 847 (30.1%) |
| $75,000 to $99,999 | 0 (0.0%) | 375 (13.3%) |
| $100,000 to $149,999 | 0 (0.0%) | 445 (15.8%) |
| $150,000 or more | 24 (57.1%) | 58 (2.1%) |
| Total | 42 (100.0%) | 2,811 (100.0%) |
Monthly Housing Cost Tiers in Fort Irwin
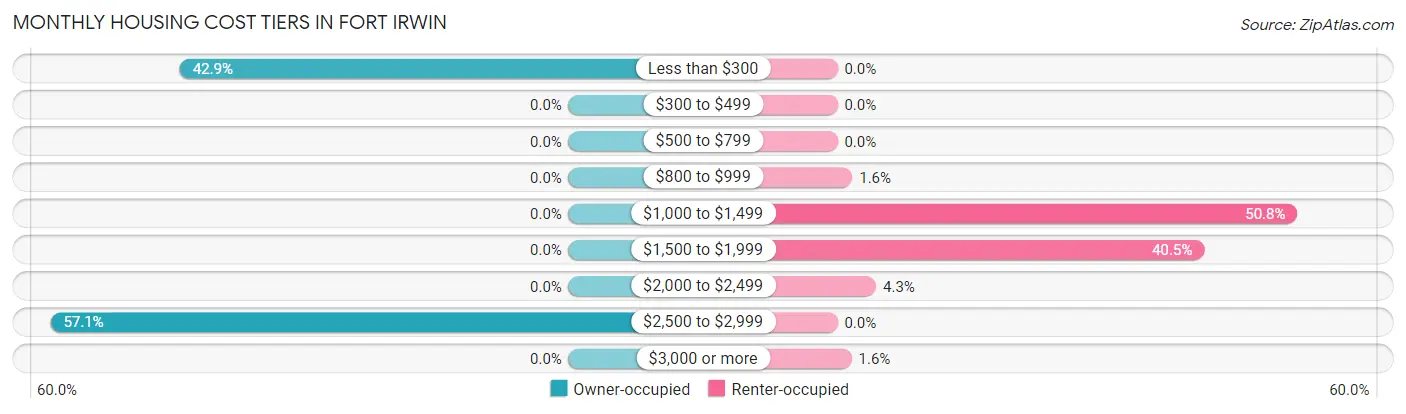
| Monthly Cost | Owner-occupied | Renter-occupied |
| Less than $300 | 18 (42.9%) | 0 (0.0%) |
| $300 to $499 | 0 (0.0%) | 0 (0.0%) |
| $500 to $799 | 0 (0.0%) | 0 (0.0%) |
| $800 to $999 | 0 (0.0%) | 46 (1.6%) |
| $1,000 to $1,499 | 0 (0.0%) | 1,428 (50.8%) |
| $1,500 to $1,999 | 0 (0.0%) | 1,139 (40.5%) |
| $2,000 to $2,499 | 0 (0.0%) | 120 (4.3%) |
| $2,500 to $2,999 | 24 (57.1%) | 0 (0.0%) |
| $3,000 or more | 0 (0.0%) | 44 (1.6%) |
| Total | 42 (100.0%) | 2,811 (100.0%) |
Physical Housing Characteristics in Fort Irwin
Housing Structures in Fort Irwin
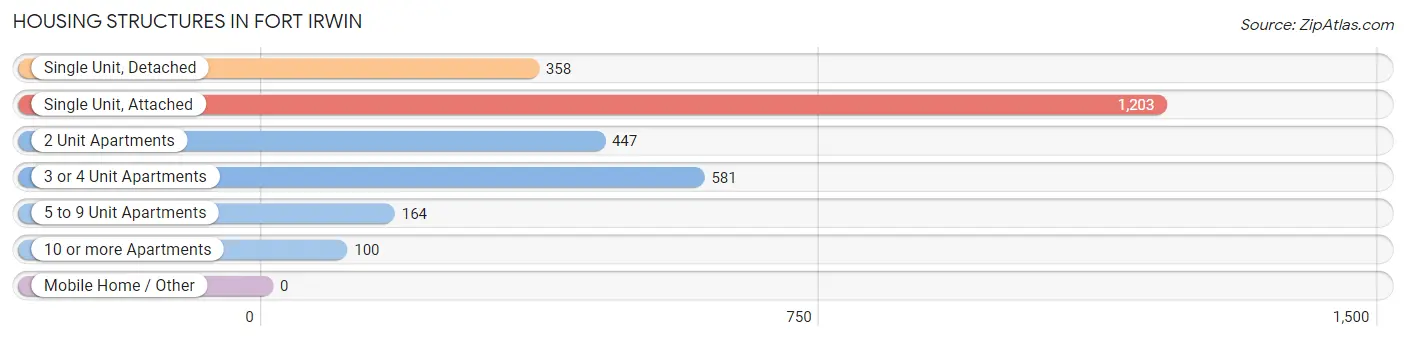
| Structure Type | # Housing Units | % Housing Units |
| Single Unit, Detached | 358 | 12.6% |
| Single Unit, Attached | 1,203 | 42.2% |
| 2 Unit Apartments | 447 | 15.7% |
| 3 or 4 Unit Apartments | 581 | 20.4% |
| 5 to 9 Unit Apartments | 164 | 5.8% |
| 10 or more Apartments | 100 | 3.5% |
| Mobile Home / Other | 0 | 0.0% |
| Total | 2,853 | 100.0% |
Housing Structures by Occupancy in Fort Irwin
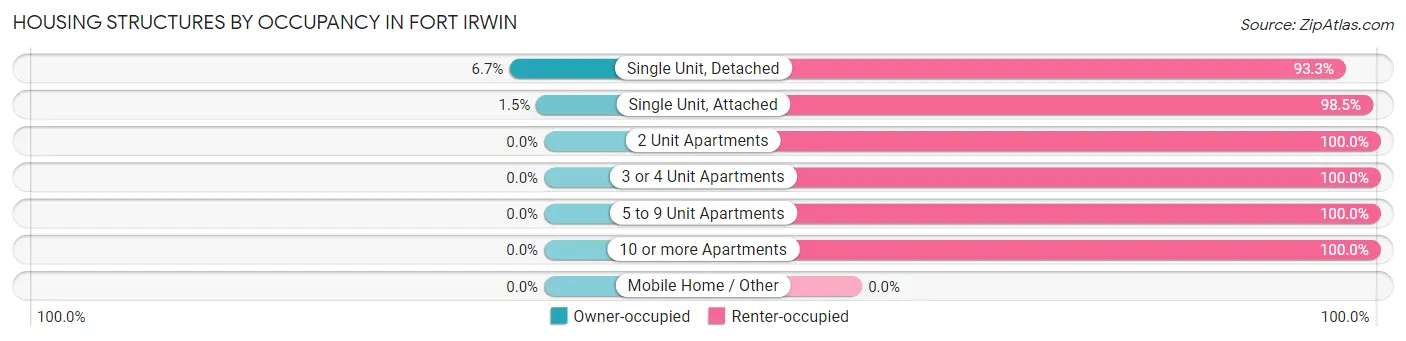
| Structure Type | Owner-occupied | Renter-occupied |
| Single Unit, Detached | 24 (6.7%) | 334 (93.3%) |
| Single Unit, Attached | 18 (1.5%) | 1,185 (98.5%) |
| 2 Unit Apartments | 0 (0.0%) | 447 (100.0%) |
| 3 or 4 Unit Apartments | 0 (0.0%) | 581 (100.0%) |
| 5 to 9 Unit Apartments | 0 (0.0%) | 164 (100.0%) |
| 10 or more Apartments | 0 (0.0%) | 100 (100.0%) |
| Mobile Home / Other | 0 (0.0%) | 0 (0.0%) |
| Total | 42 (1.5%) | 2,811 (98.5%) |
Housing Structures by Number of Rooms in Fort Irwin
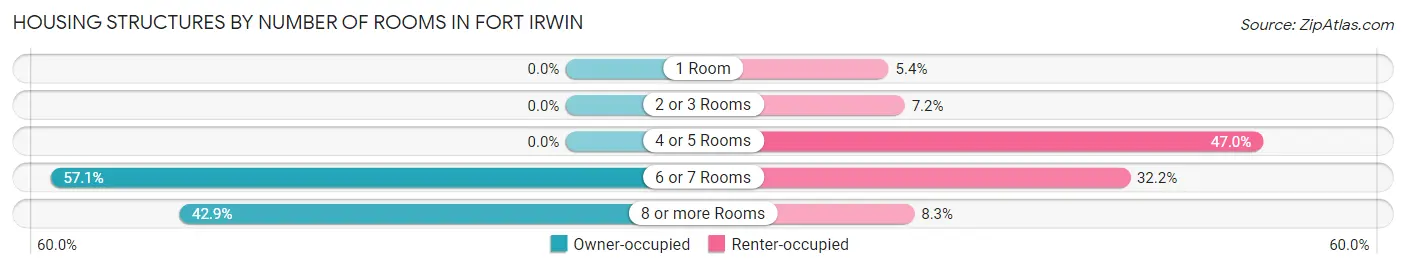
| Number of Rooms | Owner-occupied | Renter-occupied |
| 1 Room | 0 (0.0%) | 152 (5.4%) |
| 2 or 3 Rooms | 0 (0.0%) | 202 (7.2%) |
| 4 or 5 Rooms | 0 (0.0%) | 1,320 (47.0%) |
| 6 or 7 Rooms | 24 (57.1%) | 905 (32.2%) |
| 8 or more Rooms | 18 (42.9%) | 232 (8.3%) |
| Total | 42 (100.0%) | 2,811 (100.0%) |
Housing Structure by Heating Type in Fort Irwin
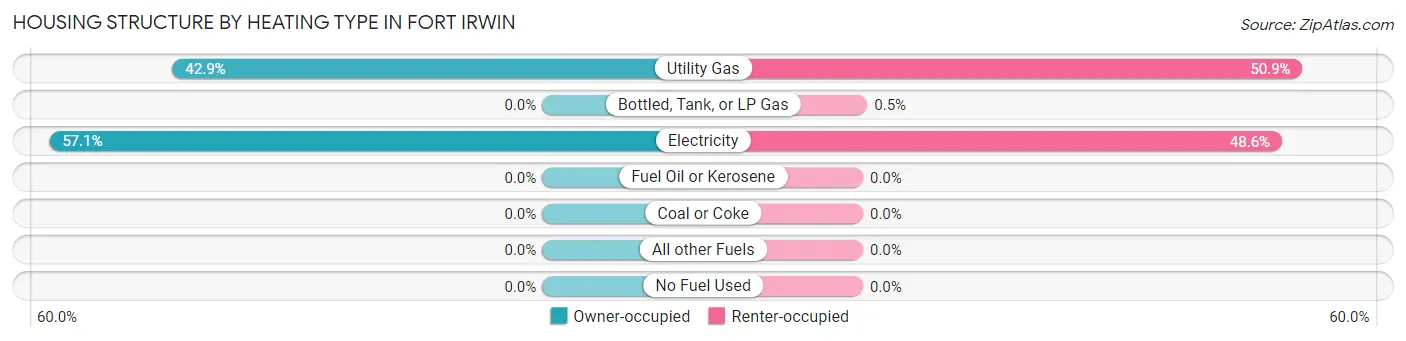
| Heating Type | Owner-occupied | Renter-occupied |
| Utility Gas | 18 (42.9%) | 1,432 (50.9%) |
| Bottled, Tank, or LP Gas | 0 (0.0%) | 14 (0.5%) |
| Electricity | 24 (57.1%) | 1,365 (48.6%) |
| Fuel Oil or Kerosene | 0 (0.0%) | 0 (0.0%) |
| Coal or Coke | 0 (0.0%) | 0 (0.0%) |
| All other Fuels | 0 (0.0%) | 0 (0.0%) |
| No Fuel Used | 0 (0.0%) | 0 (0.0%) |
| Total | 42 (100.0%) | 2,811 (100.0%) |
Household Vehicle Usage in Fort Irwin
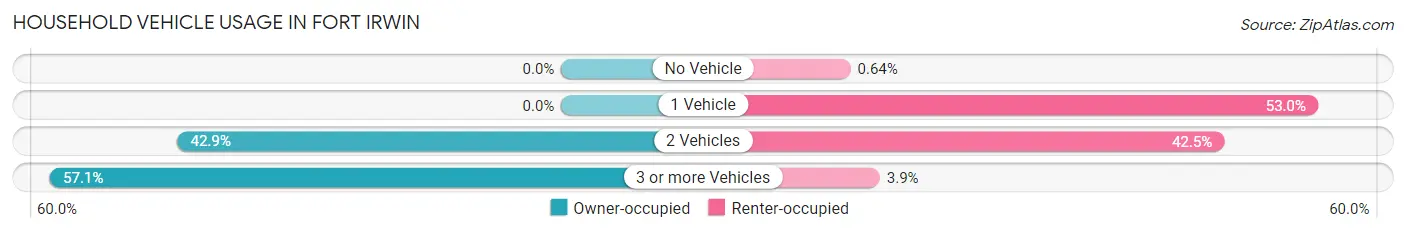
| Vehicles per Household | Owner-occupied | Renter-occupied |
| No Vehicle | 0 (0.0%) | 18 (0.6%) |
| 1 Vehicle | 0 (0.0%) | 1,489 (53.0%) |
| 2 Vehicles | 18 (42.9%) | 1,194 (42.5%) |
| 3 or more Vehicles | 24 (57.1%) | 110 (3.9%) |
| Total | 42 (100.0%) | 2,811 (100.0%) |
Real Estate & Mortgages in Fort Irwin
Real Estate and Mortgage Overview in Fort Irwin
| Characteristic | Without Mortgage | With Mortgage |
| Housing Units | 18 | 24 |
| Median Property Value | - | - |
| Median Household Income | - | - |
| Monthly Housing Costs | - | - |
| Real Estate Taxes | - | - |
Property Value by Mortgage Status in Fort Irwin
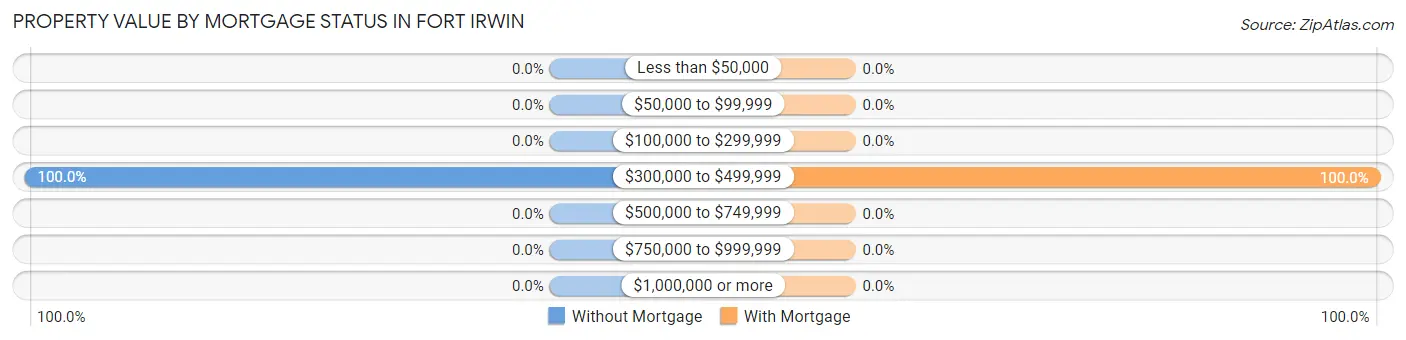
| Property Value | Without Mortgage | With Mortgage |
| Less than $50,000 | 0 (0.0%) | 0 (0.0%) |
| $50,000 to $99,999 | 0 (0.0%) | 0 (0.0%) |
| $100,000 to $299,999 | 0 (0.0%) | 0 (0.0%) |
| $300,000 to $499,999 | 18 (100.0%) | 24 (100.0%) |
| $500,000 to $749,999 | 0 (0.0%) | 0 (0.0%) |
| $750,000 to $999,999 | 0 (0.0%) | 0 (0.0%) |
| $1,000,000 or more | 0 (0.0%) | 0 (0.0%) |
| Total | 18 (100.0%) | 24 (100.0%) |
Household Income by Mortgage Status in Fort Irwin
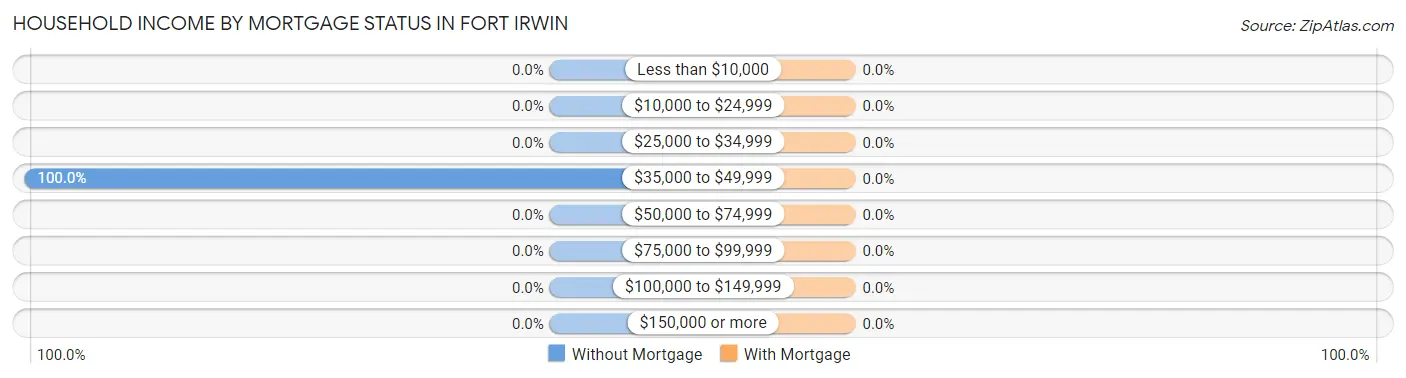
| Household Income | Without Mortgage | With Mortgage |
| Less than $10,000 | 0 (0.0%) | 0 (0.0%) |
| $10,000 to $24,999 | 0 (0.0%) | 0 (0.0%) |
| $25,000 to $34,999 | 0 (0.0%) | 0 (0.0%) |
| $35,000 to $49,999 | 18 (100.0%) | 0 (0.0%) |
| $50,000 to $74,999 | 0 (0.0%) | 0 (0.0%) |
| $75,000 to $99,999 | 0 (0.0%) | 0 (0.0%) |
| $100,000 to $149,999 | 0 (0.0%) | 0 (0.0%) |
| $150,000 or more | 0 (0.0%) | 0 (0.0%) |
| Total | 18 (100.0%) | 24 (100.0%) |
Property Value to Household Income Ratio in Fort Irwin
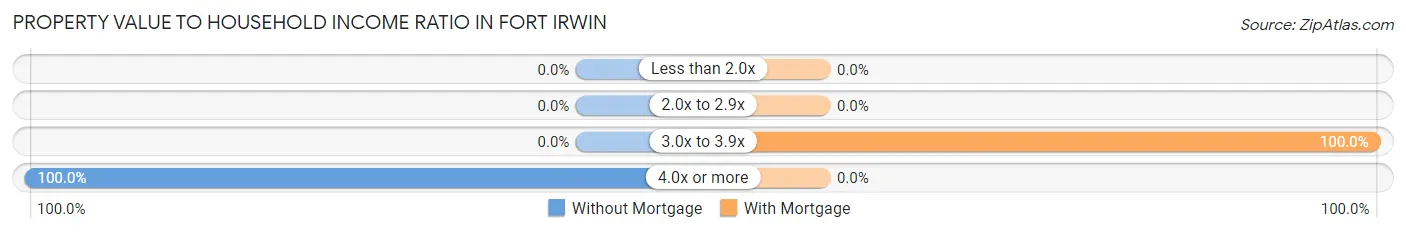
| Value-to-Income Ratio | Without Mortgage | With Mortgage |
| Less than 2.0x | 0 (0.0%) | 0 (0.0%) |
| 2.0x to 2.9x | 0 (0.0%) | 0 (0.0%) |
| 3.0x to 3.9x | 0 (0.0%) | 24 (100.0%) |
| 4.0x or more | 18 (100.0%) | 0 (0.0%) |
| Total | 18 (100.0%) | 24 (100.0%) |
Real Estate Taxes by Mortgage Status in Fort Irwin
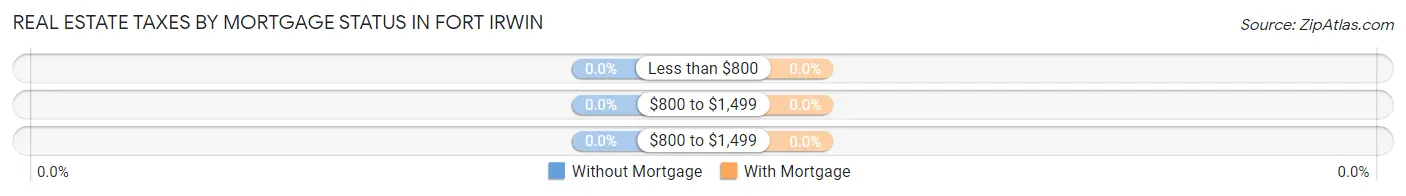
| Property Taxes | Without Mortgage | With Mortgage |
| Less than $800 | 0 (0.0%) | 0 (0.0%) |
| $800 to $1,499 | 0 (0.0%) | 0 (0.0%) |
| $800 to $1,499 | 0 (0.0%) | 0 (0.0%) |
| Total | 18 (100.0%) | 24 (100.0%) |
Health & Disability in Fort Irwin
Health Insurance Coverage by Age in Fort Irwin
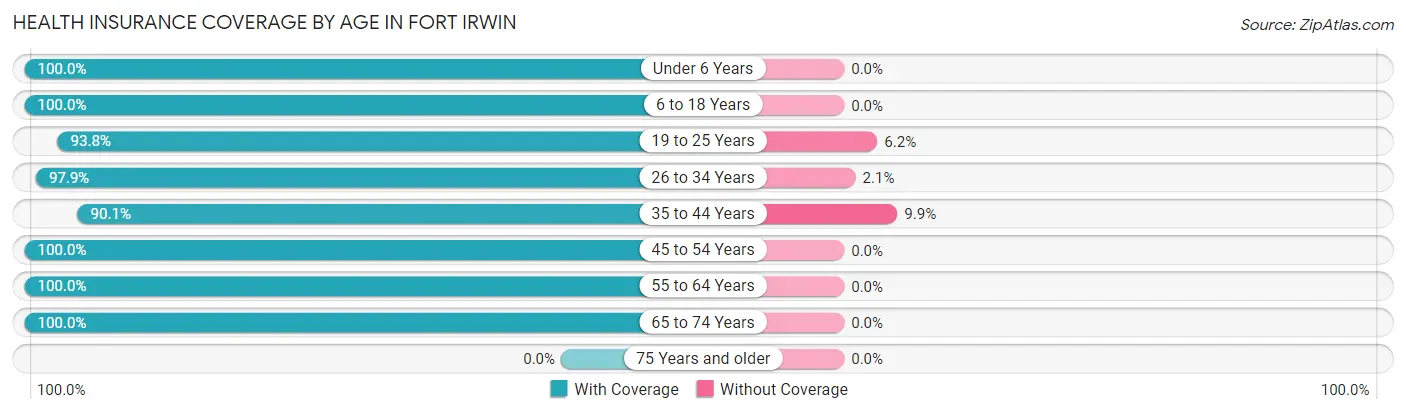
| Age Bracket | With Coverage | Without Coverage |
| Under 6 Years | 1,256 (100.0%) | 0 (0.0%) |
| 6 to 18 Years | 1,429 (100.0%) | 0 (0.0%) |
| 19 to 25 Years | 715 (93.8%) | 47 (6.2%) |
| 26 to 34 Years | 739 (97.9%) | 16 (2.1%) |
| 35 to 44 Years | 455 (90.1%) | 50 (9.9%) |
| 45 to 54 Years | 218 (100.0%) | 0 (0.0%) |
| 55 to 64 Years | 47 (100.0%) | 0 (0.0%) |
| 65 to 74 Years | 6 (100.0%) | 0 (0.0%) |
| 75 Years and older | 0 (0.0%) | 0 (0.0%) |
| Total | 4,865 (97.7%) | 113 (2.3%) |
Health Insurance Coverage by Citizenship Status in Fort Irwin
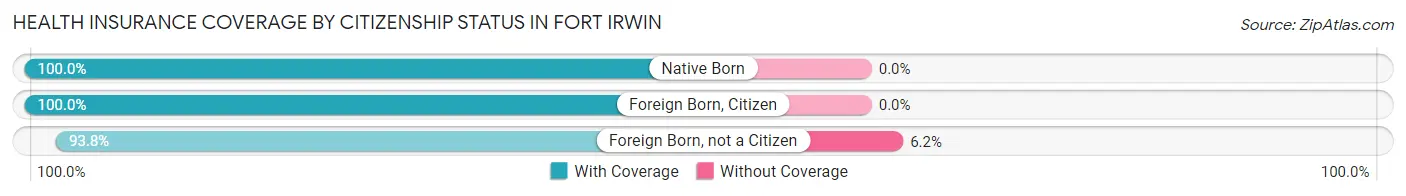
| Citizenship Status | With Coverage | Without Coverage |
| Native Born | 1,256 (100.0%) | 0 (0.0%) |
| Foreign Born, Citizen | 1,429 (100.0%) | 0 (0.0%) |
| Foreign Born, not a Citizen | 715 (93.8%) | 47 (6.2%) |
Health Insurance Coverage by Household Income in Fort Irwin
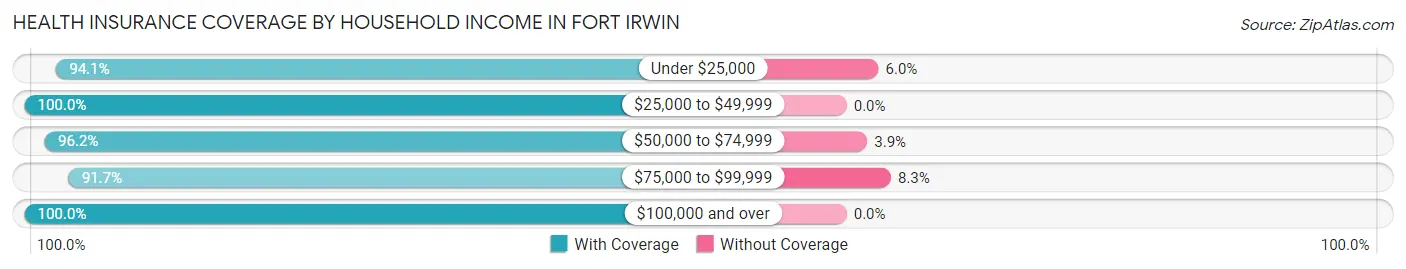
| Household Income | With Coverage | Without Coverage |
| Under $25,000 | 253 (94.1%) | 16 (5.9%) |
| $25,000 to $49,999 | 1,776 (100.0%) | 0 (0.0%) |
| $50,000 to $74,999 | 1,175 (96.2%) | 47 (3.8%) |
| $75,000 to $99,999 | 553 (91.7%) | 50 (8.3%) |
| $100,000 and over | 1,108 (100.0%) | 0 (0.0%) |
Public vs Private Health Insurance Coverage by Age in Fort Irwin
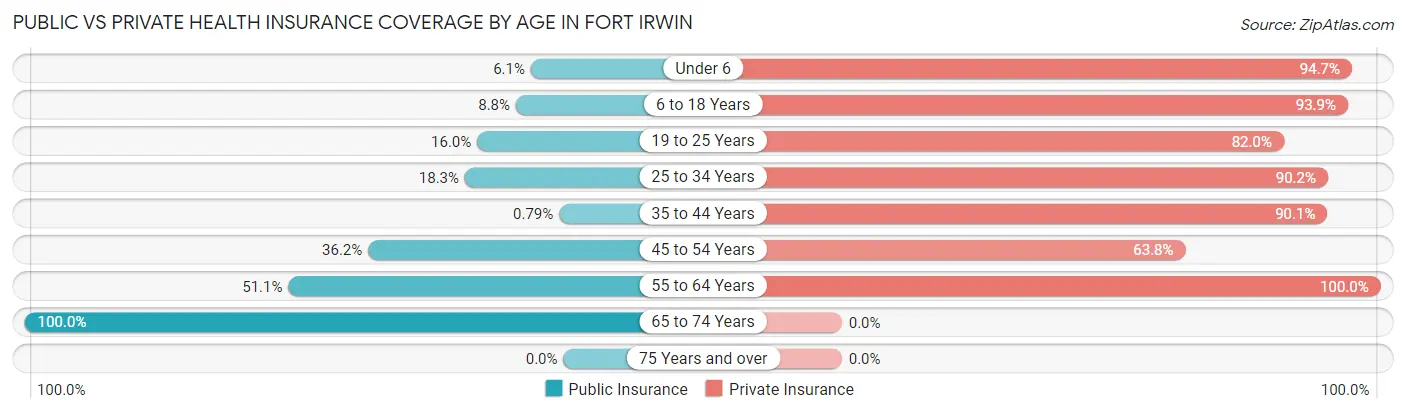
| Age Bracket | Public Insurance | Private Insurance |
| Under 6 | 76 (6.0%) | 1,189 (94.7%) |
| 6 to 18 Years | 126 (8.8%) | 1,342 (93.9%) |
| 19 to 25 Years | 122 (16.0%) | 625 (82.0%) |
| 25 to 34 Years | 138 (18.3%) | 681 (90.2%) |
| 35 to 44 Years | 4 (0.8%) | 455 (90.1%) |
| 45 to 54 Years | 79 (36.2%) | 139 (63.8%) |
| 55 to 64 Years | 24 (51.1%) | 47 (100.0%) |
| 65 to 74 Years | 6 (100.0%) | 0 (0.0%) |
| 75 Years and over | 0 (0.0%) | 0 (0.0%) |
| Total | 575 (11.6%) | 4,478 (90.0%) |
Disability Status by Sex by Age in Fort Irwin
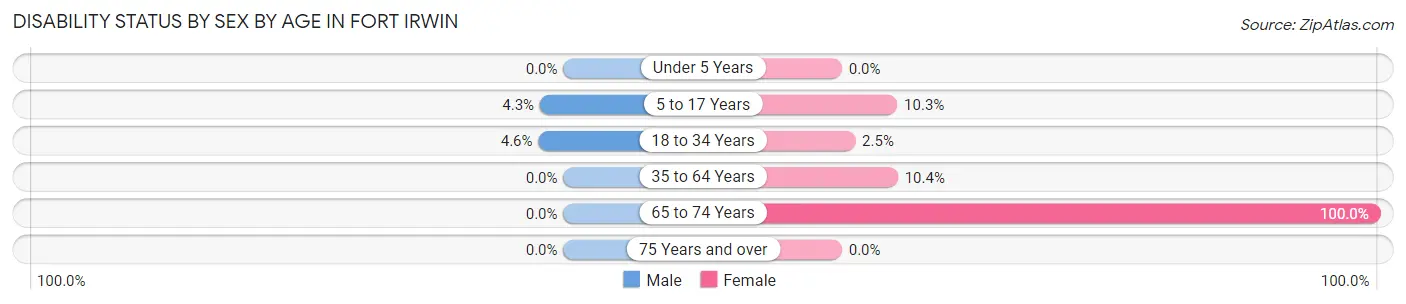
| Age Bracket | Male | Female |
| Under 5 Years | 0 (0.0%) | 0 (0.0%) |
| 5 to 17 Years | 33 (4.3%) | 84 (10.3%) |
| 18 to 34 Years | 13 (4.6%) | 31 (2.5%) |
| 35 to 64 Years | 0 (0.0%) | 55 (10.4%) |
| 65 to 74 Years | 0 (0.0%) | 6 (100.0%) |
| 75 Years and over | 0 (0.0%) | 0 (0.0%) |
Disability Class by Sex by Age in Fort Irwin
Disability Class: Hearing Difficulty
| Age Bracket | Male | Female |
| Under 5 Years | 0 (0.0%) | 0 (0.0%) |
| 5 to 17 Years | 0 (0.0%) | 0 (0.0%) |
| 18 to 34 Years | 0 (0.0%) | 0 (0.0%) |
| 35 to 64 Years | 0 (0.0%) | 0 (0.0%) |
| 65 to 74 Years | 0 (0.0%) | 0 (0.0%) |
| 75 Years and over | 0 (0.0%) | 0 (0.0%) |
Disability Class: Vision Difficulty
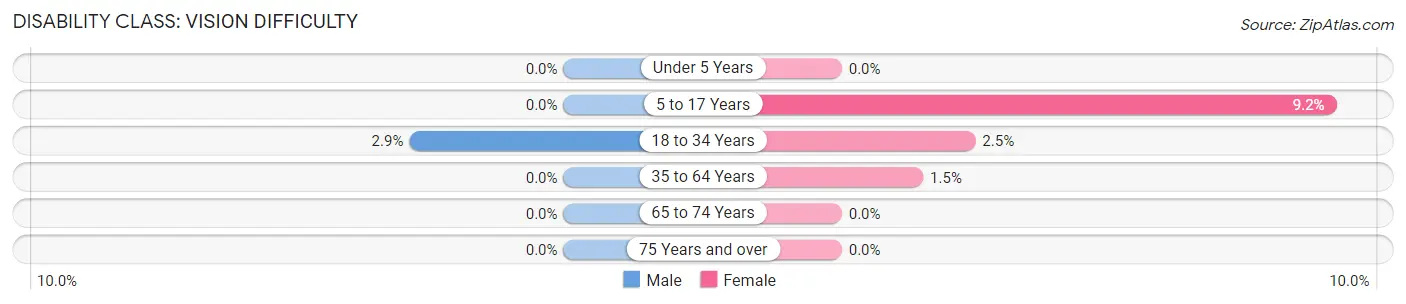
| Age Bracket | Male | Female |
| Under 5 Years | 0 (0.0%) | 0 (0.0%) |
| 5 to 17 Years | 0 (0.0%) | 75 (9.2%) |
| 18 to 34 Years | 8 (2.9%) | 31 (2.5%) |
| 35 to 64 Years | 0 (0.0%) | 8 (1.5%) |
| 65 to 74 Years | 0 (0.0%) | 0 (0.0%) |
| 75 Years and over | 0 (0.0%) | 0 (0.0%) |
Disability Class: Cognitive Difficulty
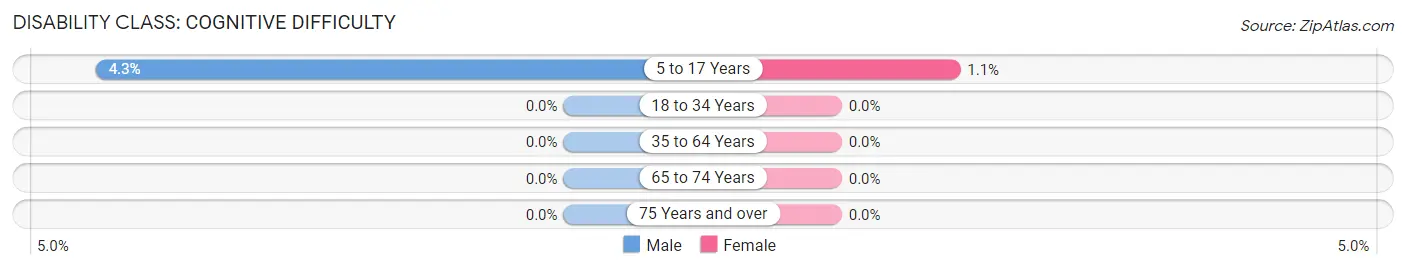
| Age Bracket | Male | Female |
| 5 to 17 Years | 33 (4.3%) | 9 (1.1%) |
| 18 to 34 Years | 0 (0.0%) | 0 (0.0%) |
| 35 to 64 Years | 0 (0.0%) | 0 (0.0%) |
| 65 to 74 Years | 0 (0.0%) | 0 (0.0%) |
| 75 Years and over | 0 (0.0%) | 0 (0.0%) |
Disability Class: Ambulatory Difficulty
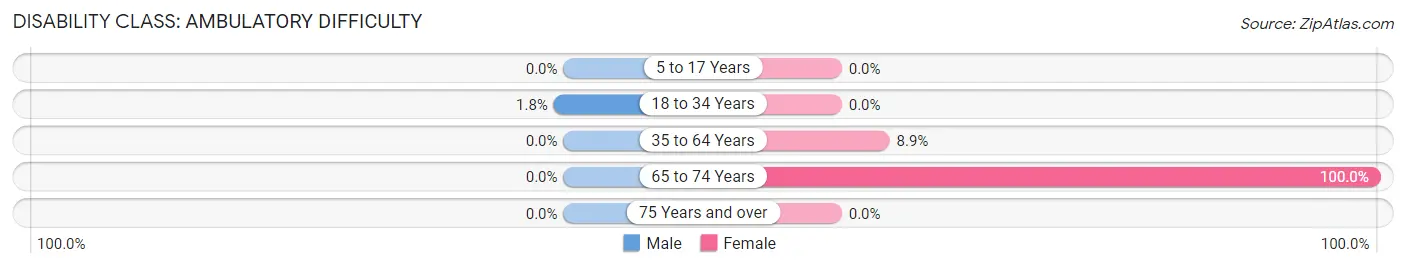
| Age Bracket | Male | Female |
| 5 to 17 Years | 0 (0.0%) | 0 (0.0%) |
| 18 to 34 Years | 5 (1.8%) | 0 (0.0%) |
| 35 to 64 Years | 0 (0.0%) | 47 (8.9%) |
| 65 to 74 Years | 0 (0.0%) | 6 (100.0%) |
| 75 Years and over | 0 (0.0%) | 0 (0.0%) |
Disability Class: Self-Care Difficulty
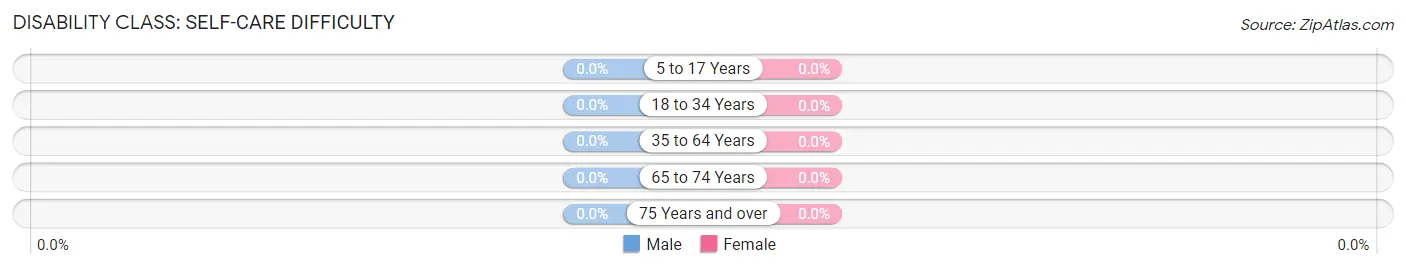
| Age Bracket | Male | Female |
| 5 to 17 Years | 0 (0.0%) | 0 (0.0%) |
| 18 to 34 Years | 0 (0.0%) | 0 (0.0%) |
| 35 to 64 Years | 0 (0.0%) | 0 (0.0%) |
| 65 to 74 Years | 0 (0.0%) | 0 (0.0%) |
| 75 Years and over | 0 (0.0%) | 0 (0.0%) |
Technology Access in Fort Irwin
Computing Device Access in Fort Irwin
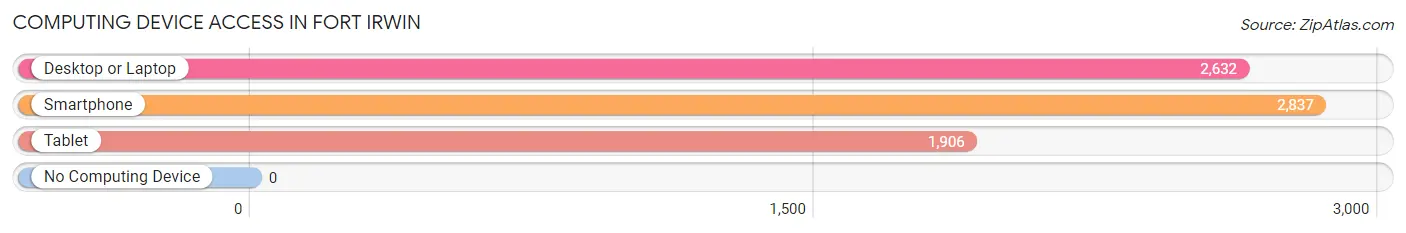
| Device Type | # Households | % Households |
| Desktop or Laptop | 2,632 | 92.2% |
| Smartphone | 2,837 | 99.4% |
| Tablet | 1,906 | 66.8% |
| No Computing Device | 0 | 0.0% |
| Total | 2,853 | 100.0% |
Internet Access in Fort Irwin
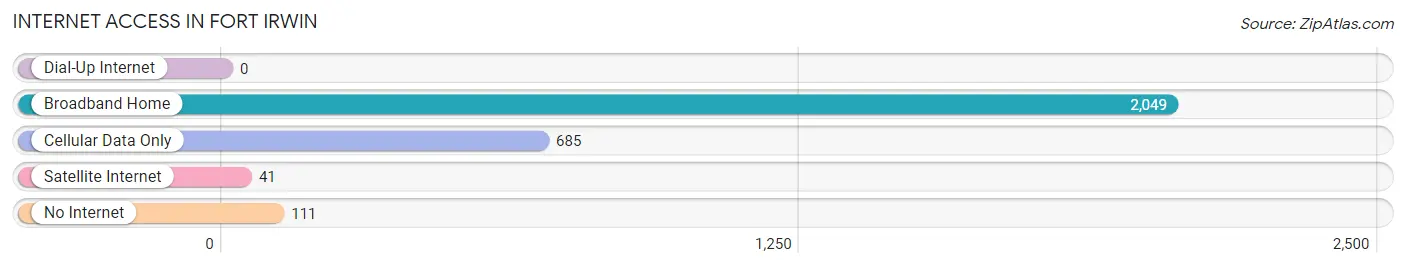
| Internet Type | # Households | % Households |
| Dial-Up Internet | 0 | 0.0% |
| Broadband Home | 2,049 | 71.8% |
| Cellular Data Only | 685 | 24.0% |
| Satellite Internet | 41 | 1.4% |
| No Internet | 111 | 3.9% |
| Total | 2,853 | 100.0% |
Fort Irwin Summary
Fort Irwin is a United States Army base located in the Mojave Desert in San Bernardino County, California. It is the largest military installation in the United States and is home to the National Training Center (NTC). The base is named after Major General George LeRoy Irwin, who commanded the 57th Field Artillery Brigade during World War I.
History
Fort Irwin was established in 1940 as the Mojave Anti-Aircraft Range. It was used as a training ground for anti-aircraft gunners during World War II. In 1951, the base was renamed Fort Irwin and became a permanent Army installation. During the Vietnam War, the base was used as a training ground for the 11th Armored Cavalry Regiment. In the 1980s, the base was used to train the 7th Infantry Division and the 1st Armored Division.
In the 1990s, the base was used to train the 3rd Armored Cavalry Regiment and the 4th Infantry Division. In the 2000s, the base was used to train the 1st Cavalry Division and the 2nd Infantry Division. In 2006, the base was designated as the National Training Center and began to focus on training for counterinsurgency operations.
Geography
Fort Irwin is located in the Mojave Desert in San Bernardino County, California. It is situated between the cities of Barstow and Needles, and is approximately 100 miles northeast of Los Angeles. The base covers an area of approximately 1,000 square miles and is surrounded by the Mojave National Preserve. The base is located at an elevation of 2,000 feet and has a semi-arid climate with hot summers and mild winters.
Economy
Fort Irwin is home to the National Training Center, which is the largest military installation in the United States. The base is also home to the Army's 11th Armored Cavalry Regiment and the 7th Infantry Division. The base has a large number of support facilities, including a hospital, a post exchange, a commissary, a bowling alley, a movie theater, and a golf course.
The base also has a large number of private businesses, including restaurants, hotels, and retail stores. The base is also home to a number of military contractors, including Lockheed Martin, Northrop Grumman, and Raytheon.
Demographics
As of the 2010 census, the population of Fort Irwin was 8,845. The racial makeup of the base was 66.2% White, 19.2% African American, 0.7% Native American, 4.2% Asian, 0.2% Pacific Islander, 5.2% from other races, and 4.3% from two or more races. The base also had a large number of Hispanic or Latino residents, making up 16.3% of the population.
The median household income was $45,845 and the median family income was $50,845. The per capita income was $20,845. The base had a large number of veterans, making up 11.2% of the population. The base also had a large number of active duty military personnel, making up 8.2% of the population.
Common Questions
What is the Total Population of Fort Irwin?
Total Population of Fort Irwin is 8,967.
What is the Total Male Population of Fort Irwin?
Total Male Population of Fort Irwin is 5,538.
What is the Total Female Population of Fort Irwin?
Total Female Population of Fort Irwin is 3,429.
What is the Ratio of Males per 100 Females in Fort Irwin?
There are 161.50 Males per 100 Females in Fort Irwin.
What is the Ratio of Females per 100 Males in Fort Irwin?
There are 61.92 Females per 100 Males in Fort Irwin.
What is the Median Population Age in Fort Irwin?
Median Population Age in Fort Irwin is 23.1 Years.
What is the Average Family Size in Fort Irwin
Average Family Size in Fort Irwin is 3.1 People.
What is the Average Household Size in Fort Irwin
Average Household Size in Fort Irwin is 2.6 People.
What is Per Capita Income in Fort Irwin?
Per Capita income in Fort Irwin is $26,142.
What is the Median Family Income in Fort Irwin?
Median Family Income in Fort Irwin is $63,072.
What is the Median Household income in Fort Irwin?
Median Household Income in Fort Irwin is $63,369.
What is Income or Wage Gap in Fort Irwin?
Income or Wage Gap in Fort Irwin is 33.1%.
Women in Fort Irwin earn 66.9 cents for every dollar earned by a man.
What is Inequality or Gini Index in Fort Irwin?
Inequality or Gini Index in Fort Irwin is 0.29.
How Large is the Labor Force in Fort Irwin?
There are 5,465 People in the Labor Forcein in Fort Irwin.
What is the Percentage of People in the Labor Force in Fort Irwin?
86.8% of People are in the Labor Force in Fort Irwin.
What is the Unemployment Rate in Fort Irwin?
Unemployment Rate in Fort Irwin is 15.4%.