Fetters Hot Springs Agua Caliente, CA
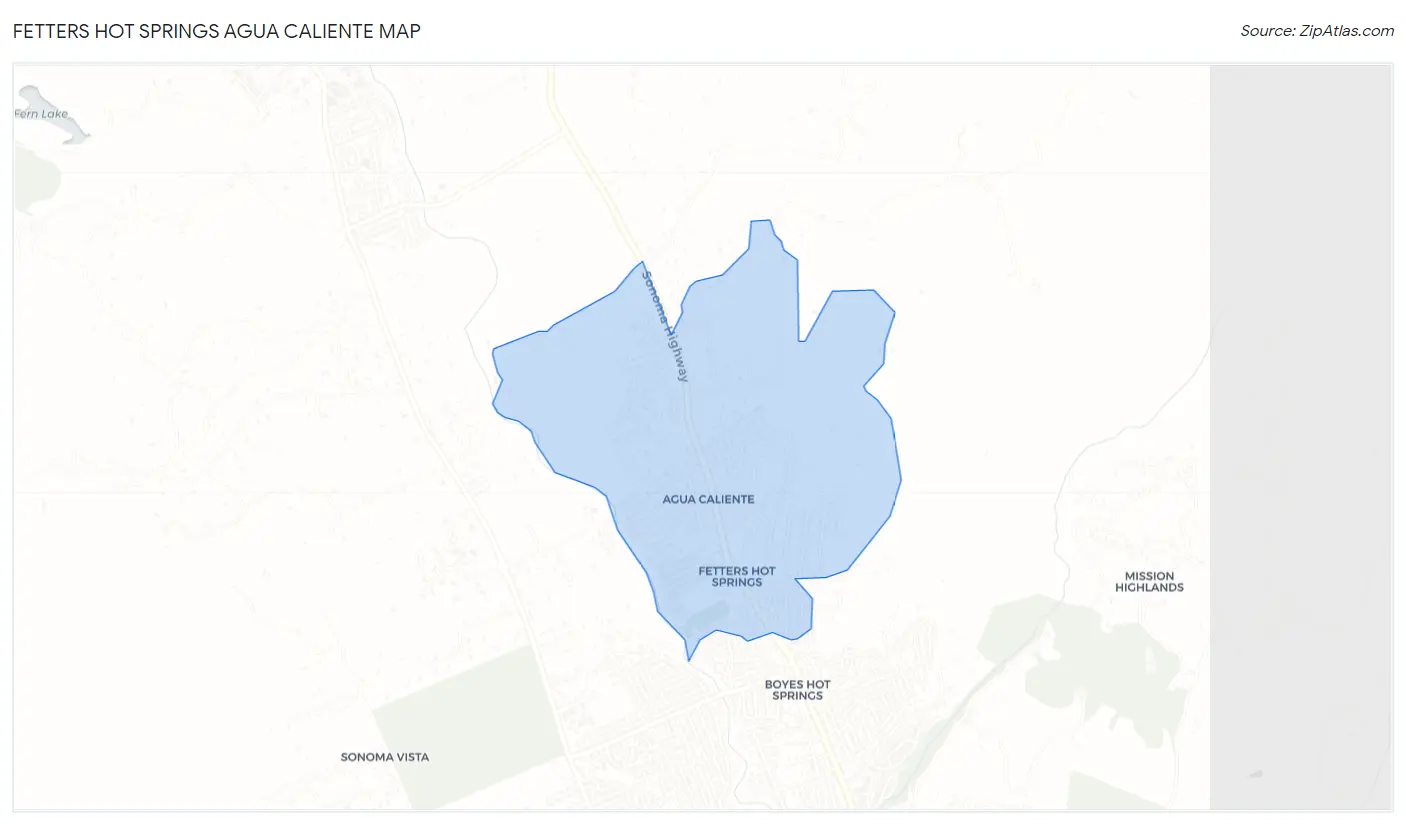
Fetters Hot Springs Agua Caliente Map
Fetters Hot Springs Agua Caliente Overview
4,224
TOTAL POPULATION
2,043
MALE POPULATION
2,181
FEMALE POPULATION
93.67
MALES / 100 FEMALES
106.75
FEMALES / 100 MALES
35.6
MEDIAN AGE
3.7
AVG FAMILY SIZE
3.1
AVG HOUSEHOLD SIZE
$46,044
PER CAPITA INCOME
$103,500
AVG FAMILY INCOME
$110,577
AVG HOUSEHOLD INCOME
32.3%
WAGE / INCOME GAP [ % ]
67.7¢/ $1
WAGE / INCOME GAP [ $ ]
0.43
INEQUALITY / GINI INDEX
2,359
LABOR FORCE [ PEOPLE ]
72.0%
PERCENT IN LABOR FORCE
2.7%
UNEMPLOYMENT RATE
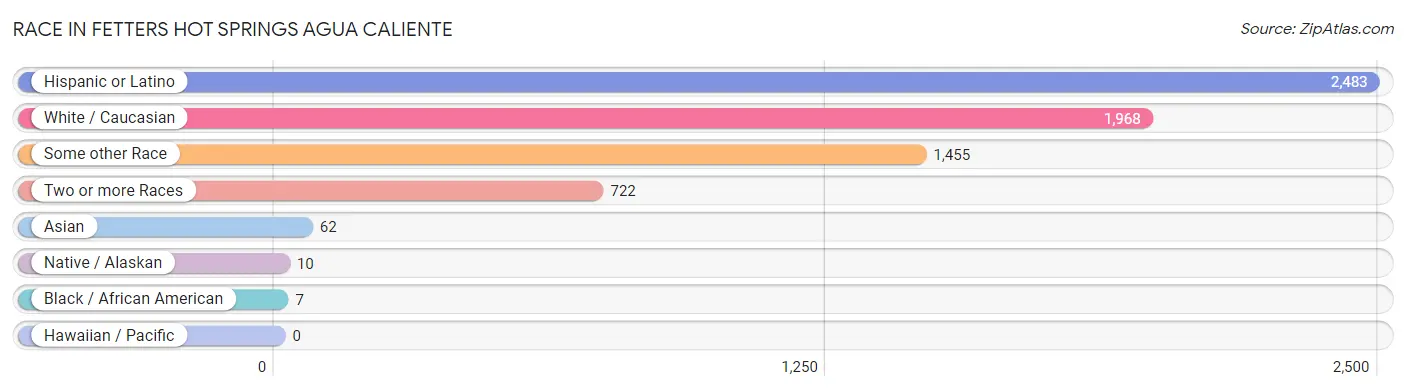
Race in Fetters Hot Springs Agua Caliente
The most populous races in Fetters Hot Springs Agua Caliente are Hispanic or Latino (2,483 | 58.8%), White / Caucasian (1,968 | 46.6%), and Some other Race (1,455 | 34.4%).
| Race | # Population | % Population |
| Asian | 62 | 1.5% |
| Black / African American | 7 | 0.2% |
| Hawaiian / Pacific | 0 | 0.0% |
| Hispanic or Latino | 2,483 | 58.8% |
| Native / Alaskan | 10 | 0.2% |
| White / Caucasian | 1,968 | 46.6% |
| Two or more Races | 722 | 17.1% |
| Some other Race | 1,455 | 34.4% |
| Total | 4,224 | 100.0% |
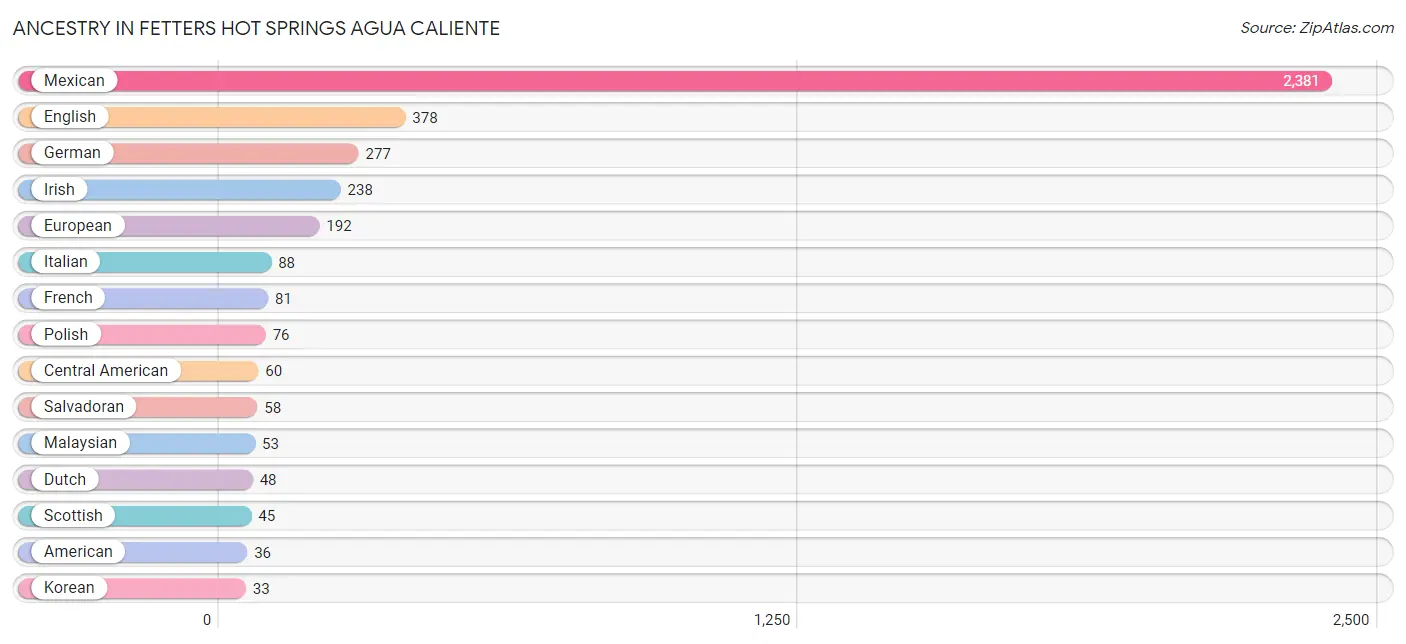
Ancestry in Fetters Hot Springs Agua Caliente
The most populous ancestries reported in Fetters Hot Springs Agua Caliente are Mexican (2,381 | 56.4%), English (378 | 8.9%), German (277 | 6.6%), Irish (238 | 5.6%), and European (192 | 4.5%), together accounting for 82.1% of all Fetters Hot Springs Agua Caliente residents.
| Ancestry | # Population | % Population |
| American | 36 | 0.9% |
| Arab | 19 | 0.4% |
| Belgian | 11 | 0.3% |
| Bhutanese | 32 | 0.8% |
| British | 12 | 0.3% |
| Canadian | 3 | 0.1% |
| Central American | 60 | 1.4% |
| Czech | 5 | 0.1% |
| Danish | 14 | 0.3% |
| Dutch | 48 | 1.1% |
| Eastern European | 25 | 0.6% |
| English | 378 | 8.9% |
| European | 192 | 4.5% |
| Finnish | 21 | 0.5% |
| French | 81 | 1.9% |
| French Canadian | 4 | 0.1% |
| German | 277 | 6.6% |
| Guatemalan | 2 | 0.1% |
| Indian (Asian) | 10 | 0.2% |
| Irish | 238 | 5.6% |
| Israeli | 17 | 0.4% |
| Italian | 88 | 2.1% |
| Korean | 33 | 0.8% |
| Lebanese | 6 | 0.1% |
| Malaysian | 53 | 1.3% |
| Mexican | 2,381 | 56.4% |
| Mexican American Indian | 26 | 0.6% |
| Northern European | 22 | 0.5% |
| Norwegian | 6 | 0.1% |
| Peruvian | 2 | 0.1% |
| Polish | 76 | 1.8% |
| Puerto Rican | 26 | 0.6% |
| Romanian | 6 | 0.1% |
| Russian | 25 | 0.6% |
| Salvadoran | 58 | 1.4% |
| Scandinavian | 10 | 0.2% |
| Scottish | 45 | 1.1% |
| South American | 2 | 0.1% |
| Spaniard | 14 | 0.3% |
| Swedish | 6 | 0.1% |
| Swiss | 13 | 0.3% |
| Syrian | 6 | 0.1% |
| Welsh | 28 | 0.7% | View All 43 Rows |
Immigrants in Fetters Hot Springs Agua Caliente
The most numerous immigrant groups reported in Fetters Hot Springs Agua Caliente came from Latin America (1,332 | 31.5%), Central America (1,330 | 31.5%), Mexico (1,293 | 30.6%), Europe (58 | 1.4%), and Asia (46 | 1.1%), together accounting for 96.1% of all Fetters Hot Springs Agua Caliente residents.

| Immigration Origin | # Population | % Population |
| Asia | 46 | 1.1% |
| Central America | 1,330 | 31.5% |
| China | 10 | 0.2% |
| Eastern Asia | 10 | 0.2% |
| Eastern Europe | 21 | 0.5% |
| El Salvador | 37 | 0.9% |
| Europe | 58 | 1.4% |
| Fiji | 12 | 0.3% |
| France | 22 | 0.5% |
| Germany | 8 | 0.2% |
| Israel | 17 | 0.4% |
| Latin America | 1,332 | 31.5% |
| Mexico | 1,293 | 30.6% |
| Northern Europe | 7 | 0.2% |
| Oceania | 12 | 0.3% |
| Peru | 2 | 0.1% |
| Philippines | 13 | 0.3% |
| Russia | 21 | 0.5% |
| South America | 2 | 0.1% |
| South Eastern Asia | 13 | 0.3% |
| Syria | 6 | 0.1% |
| Western Asia | 23 | 0.5% |
| Western Europe | 30 | 0.7% | View All 23 Rows |
Sex and Age in Fetters Hot Springs Agua Caliente
Sex and Age in Fetters Hot Springs Agua Caliente
The most populous age groups in Fetters Hot Springs Agua Caliente are 50 to 54 Years (243 | 11.9%) for men and 20 to 24 Years (294 | 13.5%) for women.

| Age Bracket | Male | Female |
| Under 5 Years | 221 (10.8%) | 132 (6.0%) |
| 5 to 9 Years | 25 (1.2%) | 157 (7.2%) |
| 10 to 14 Years | 126 (6.2%) | 184 (8.4%) |
| 15 to 19 Years | 74 (3.6%) | 162 (7.4%) |
| 20 to 24 Years | 134 (6.6%) | 294 (13.5%) |
| 25 to 29 Years | 130 (6.4%) | 52 (2.4%) |
| 30 to 34 Years | 186 (9.1%) | 159 (7.3%) |
| 35 to 39 Years | 190 (9.3%) | 103 (4.7%) |
| 40 to 44 Years | 66 (3.2%) | 210 (9.6%) |
| 45 to 49 Years | 121 (5.9%) | 98 (4.5%) |
| 50 to 54 Years | 243 (11.9%) | 165 (7.6%) |
| 55 to 59 Years | 94 (4.6%) | 146 (6.7%) |
| 60 to 64 Years | 168 (8.2%) | 162 (7.4%) |
| 65 to 69 Years | 144 (7.0%) | 55 (2.5%) |
| 70 to 74 Years | 27 (1.3%) | 56 (2.6%) |
| 75 to 79 Years | 60 (2.9%) | 26 (1.2%) |
| 80 to 84 Years | 0 (0.0%) | 4 (0.2%) |
| 85 Years and over | 34 (1.7%) | 16 (0.7%) |
| Total | 2,043 (100.0%) | 2,181 (100.0%) |
Families and Households in Fetters Hot Springs Agua Caliente
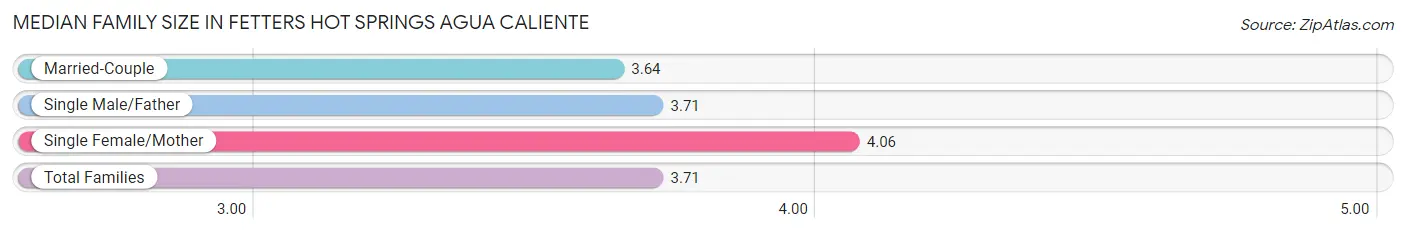
Median Family Size in Fetters Hot Springs Agua Caliente
The median family size in Fetters Hot Springs Agua Caliente is 3.71 persons per family, with single female/mother families (126 | 13.7%) accounting for the largest median family size of 4.06 persons per family. On the other hand, married-couple families (672 | 73.2%) represent the smallest median family size with 3.64 persons per family.
| Family Type | # Families | Family Size |
| Married-Couple | 672 (73.2%) | 3.64 |
| Single Male/Father | 120 (13.1%) | 3.71 |
| Single Female/Mother | 126 (13.7%) | 4.06 |
| Total Families | 918 (100.0%) | 3.71 |
Median Household Size in Fetters Hot Springs Agua Caliente
The median household size in Fetters Hot Springs Agua Caliente is 3.07 persons per household, with single female/mother households (126 | 9.3%) accounting for the largest median household size of 4.96 persons per household. non-family households (434 | 32.1%) represent the smallest median household size with 1.24 persons per household.
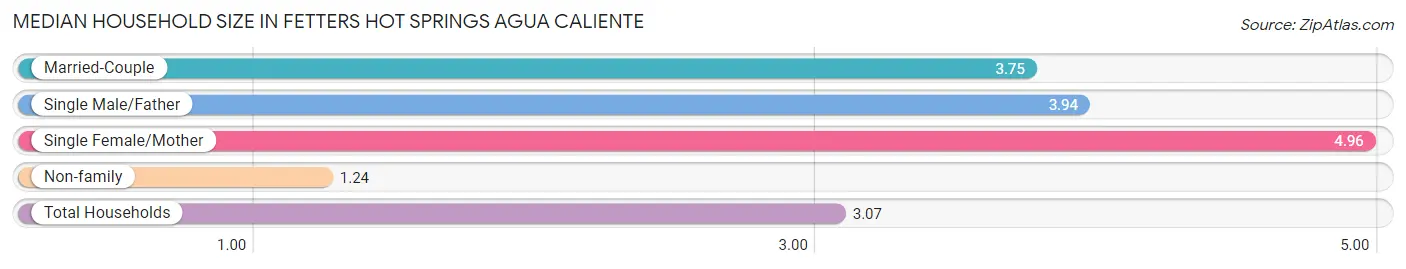
| Household Type | # Households | Household Size |
| Married-Couple | 672 (49.7%) | 3.75 |
| Single Male/Father | 120 (8.9%) | 3.94 |
| Single Female/Mother | 126 (9.3%) | 4.96 |
| Non-family | 434 (32.1%) | 1.24 |
| Total Households | 1,352 (100.0%) | 3.07 |
Household Size by Marriage Status in Fetters Hot Springs Agua Caliente
Out of a total of 1,352 households in Fetters Hot Springs Agua Caliente, 918 (67.9%) are family households, while 434 (32.1%) are nonfamily households. The most numerous type of family households are 2-person households, comprising 294, and the most common type of nonfamily households are 1-person households, comprising 367.

| Household Size | Family Households | Nonfamily Households |
| 1-Person Households | - | 367 (27.1%) |
| 2-Person Households | 294 (21.7%) | 25 (1.8%) |
| 3-Person Households | 102 (7.5%) | 42 (3.1%) |
| 4-Person Households | 233 (17.2%) | 0 (0.0%) |
| 5-Person Households | 179 (13.2%) | 0 (0.0%) |
| 6-Person Households | 34 (2.5%) | 0 (0.0%) |
| 7+ Person Households | 76 (5.6%) | 0 (0.0%) |
| Total | 918 (67.9%) | 434 (32.1%) |
Female Fertility in Fetters Hot Springs Agua Caliente
Fertility by Age in Fetters Hot Springs Agua Caliente
Average fertility rate in Fetters Hot Springs Agua Caliente is 27.0 births per 1,000 women. Women in the age bracket of 20 to 34 years have the highest fertility rate with 38.0 births per 1,000 women. Women in the age bracket of 20 to 34 years acount for 63.3% of all women with births.
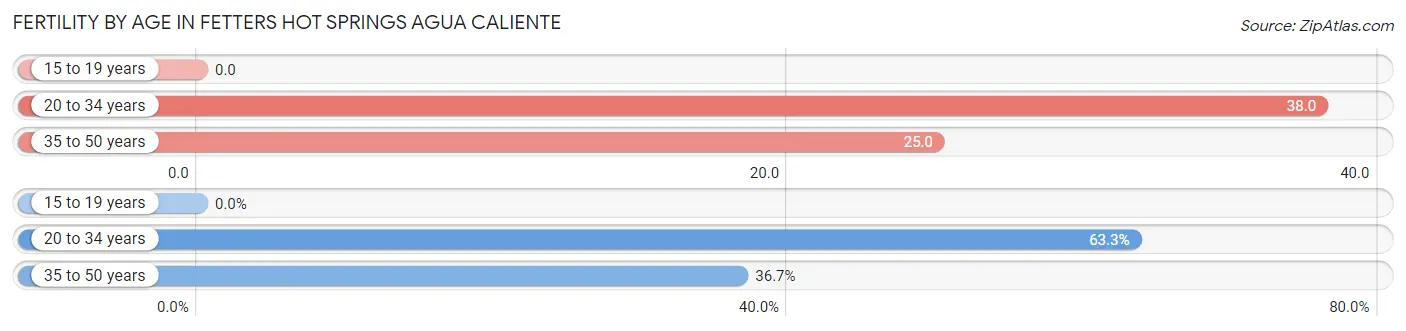
| Age Bracket | Women with Births | Births / 1,000 Women |
| 15 to 19 years | 0 (0.0%) | 0.0 |
| 20 to 34 years | 19 (63.3%) | 38.0 |
| 35 to 50 years | 11 (36.7%) | 25.0 |
| Total | 30 (100.0%) | 27.0 |
Fertility by Age by Marriage Status in Fetters Hot Springs Agua Caliente
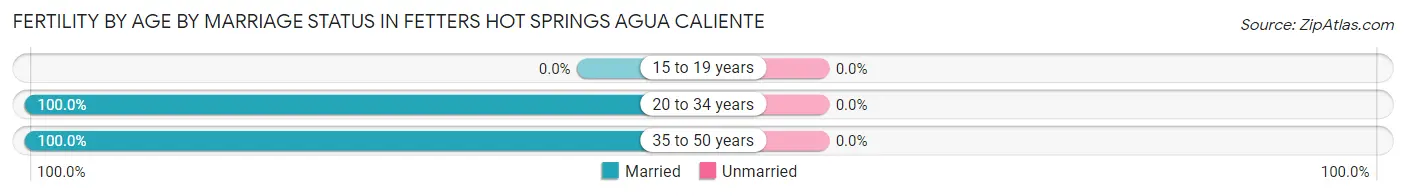
| Age Bracket | Married | Unmarried |
| 15 to 19 years | 0 (0.0%) | 0 (0.0%) |
| 20 to 34 years | 19 (100.0%) | 0 (0.0%) |
| 35 to 50 years | 11 (100.0%) | 0 (0.0%) |
| Total | 30 (100.0%) | 0 (0.0%) |
Fertility by Education in Fetters Hot Springs Agua Caliente
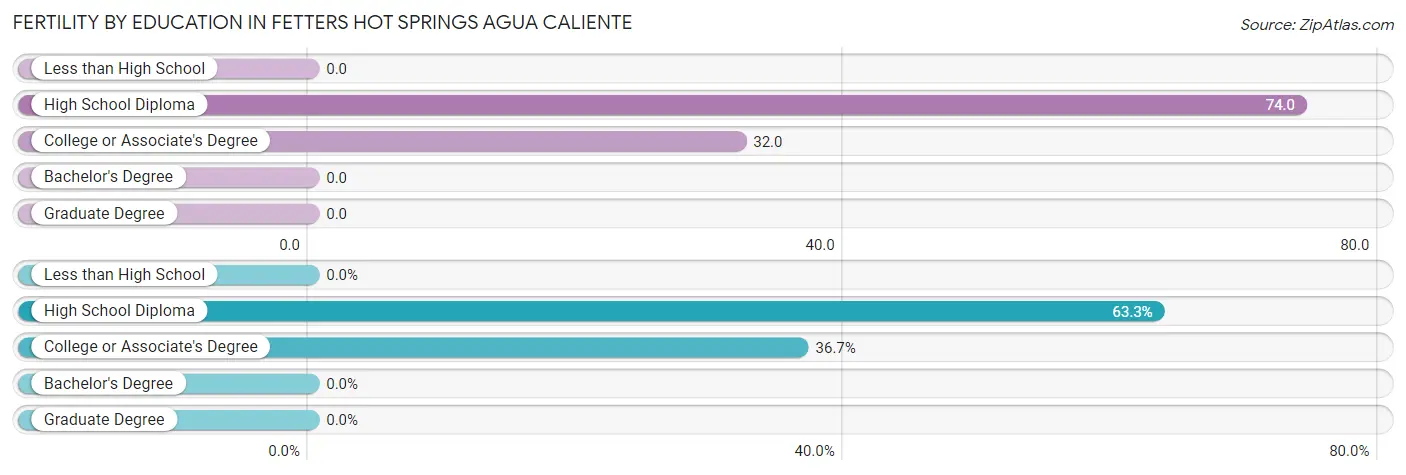
| Educational Attainment | Women with Births | Births / 1,000 Women |
| Less than High School | 0 (0.0%) | 0.0 |
| High School Diploma | 19 (63.3%) | 74.0 |
| College or Associate's Degree | 11 (36.7%) | 32.0 |
| Bachelor's Degree | 0 (0.0%) | 0.0 |
| Graduate Degree | 0 (0.0%) | 0.0 |
| Total | 30 (100.0%) | 27.0 |
Fertility by Education by Marriage Status in Fetters Hot Springs Agua Caliente
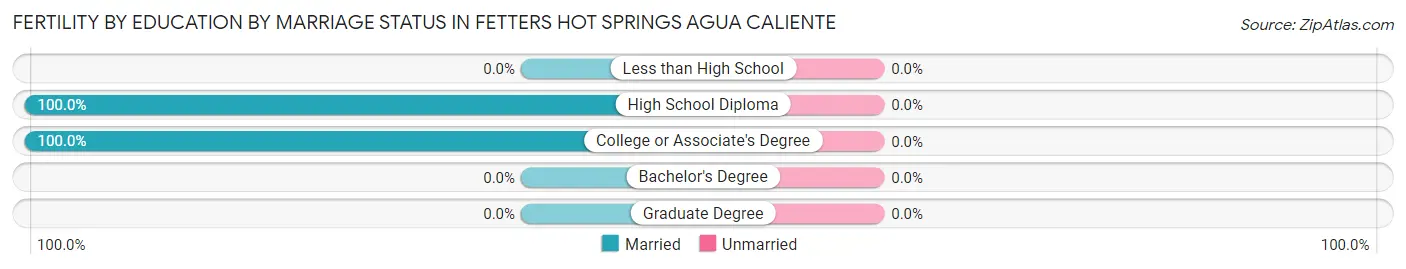
| Educational Attainment | Married | Unmarried |
| Less than High School | 0 (0.0%) | 0 (0.0%) |
| High School Diploma | 19 (100.0%) | 0 (0.0%) |
| College or Associate's Degree | 11 (100.0%) | 0 (0.0%) |
| Bachelor's Degree | 0 (0.0%) | 0 (0.0%) |
| Graduate Degree | 0 (0.0%) | 0 (0.0%) |
| Total | 30 (100.0%) | 0 (0.0%) |
Income in Fetters Hot Springs Agua Caliente
Income Overview in Fetters Hot Springs Agua Caliente
Per Capita Income in Fetters Hot Springs Agua Caliente is $46,044, while median incomes of families and households are $103,500 and $110,577 respectively.
| Characteristic | Number | Measure |
| Per Capita Income | 4,224 | $46,044 |
| Median Family Income | 918 | $103,500 |
| Mean Family Income | 918 | $136,186 |
| Median Household Income | 1,352 | $110,577 |
| Mean Household Income | 1,352 | $144,873 |
| Income Deficit | 918 | $0 |
| Wage / Income Gap (%) | 4,224 | 32.29% |
| Wage / Income Gap ($) | 4,224 | 67.71¢ per $1 |
| Gini / Inequality Index | 4,224 | 0.43 |
Earnings by Sex in Fetters Hot Springs Agua Caliente
Average Earnings in Fetters Hot Springs Agua Caliente are $37,708, $48,646 for men and $32,939 for women, a difference of 32.3%.

| Sex | Number | Average Earnings |
| Male | 1,328 (52.1%) | $48,646 |
| Female | 1,222 (47.9%) | $32,939 |
| Total | 2,550 (100.0%) | $37,708 |
Earnings by Sex by Income Bracket in Fetters Hot Springs Agua Caliente
The most common earnings brackets in Fetters Hot Springs Agua Caliente are $100,000+ for men (193 | 14.5%) and $10,000 to $12,499 for women (215 | 17.6%).
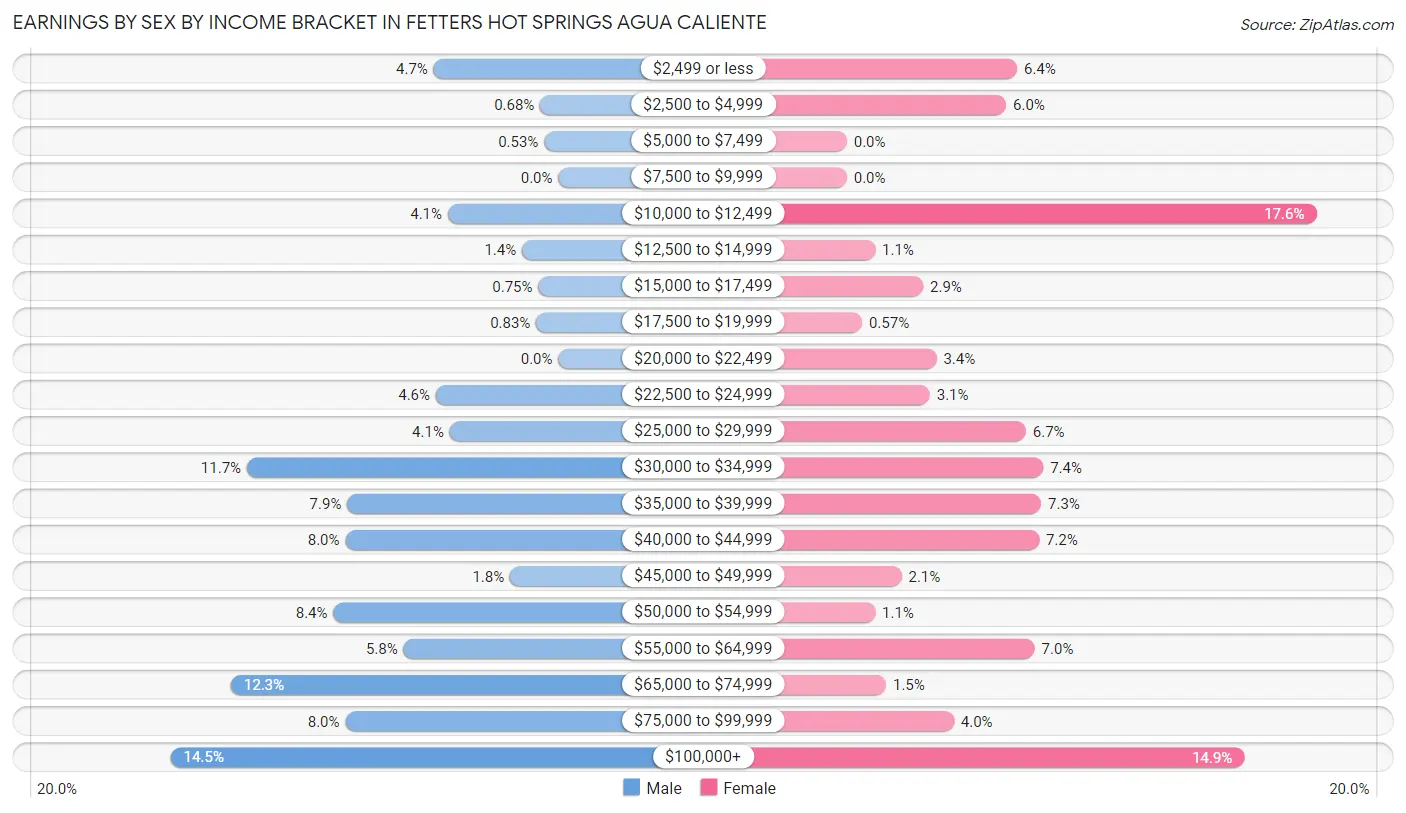
| Income | Male | Female |
| $2,499 or less | 62 (4.7%) | 78 (6.4%) |
| $2,500 to $4,999 | 9 (0.7%) | 73 (6.0%) |
| $5,000 to $7,499 | 7 (0.5%) | 0 (0.0%) |
| $7,500 to $9,999 | 0 (0.0%) | 0 (0.0%) |
| $10,000 to $12,499 | 55 (4.1%) | 215 (17.6%) |
| $12,500 to $14,999 | 18 (1.4%) | 13 (1.1%) |
| $15,000 to $17,499 | 10 (0.7%) | 35 (2.9%) |
| $17,500 to $19,999 | 11 (0.8%) | 7 (0.6%) |
| $20,000 to $22,499 | 0 (0.0%) | 41 (3.4%) |
| $22,500 to $24,999 | 61 (4.6%) | 38 (3.1%) |
| $25,000 to $29,999 | 54 (4.1%) | 82 (6.7%) |
| $30,000 to $34,999 | 155 (11.7%) | 90 (7.4%) |
| $35,000 to $39,999 | 105 (7.9%) | 89 (7.3%) |
| $40,000 to $44,999 | 106 (8.0%) | 88 (7.2%) |
| $45,000 to $49,999 | 24 (1.8%) | 25 (2.1%) |
| $50,000 to $54,999 | 112 (8.4%) | 13 (1.1%) |
| $55,000 to $64,999 | 77 (5.8%) | 86 (7.0%) |
| $65,000 to $74,999 | 163 (12.3%) | 18 (1.5%) |
| $75,000 to $99,999 | 106 (8.0%) | 49 (4.0%) |
| $100,000+ | 193 (14.5%) | 182 (14.9%) |
| Total | 1,328 (100.0%) | 1,222 (100.0%) |
Earnings by Sex by Educational Attainment in Fetters Hot Springs Agua Caliente
Average earnings in Fetters Hot Springs Agua Caliente are $52,112 for men and $40,698 for women, a difference of 21.9%. Men with an educational attainment of graduate degree enjoy the highest average annual earnings of $128,393, while those with high school diploma education earn the least with $41,140. Women with an educational attainment of graduate degree earn the most with the average annual earnings of $95,395, while those with less than high school education have the smallest earnings of $28,686.

| Educational Attainment | Male Income | Female Income |
| Less than High School | $63,000 | $28,686 |
| High School Diploma | $41,140 | $0 |
| College or Associate's Degree | $77,813 | $33,889 |
| Bachelor's Degree | $80,625 | $63,500 |
| Graduate Degree | $128,393 | $95,395 |
| Total | $52,112 | $40,698 |
Family Income in Fetters Hot Springs Agua Caliente
Family Income Brackets in Fetters Hot Springs Agua Caliente
According to the Fetters Hot Springs Agua Caliente family income data, there are 280 families falling into the $100,000 to $149,999 income range, which is the most common income bracket and makes up 30.5% of all families. Conversely, the $15,000 to $24,999 income bracket is the least frequent group with only 9 families (1.0%) belonging to this category.
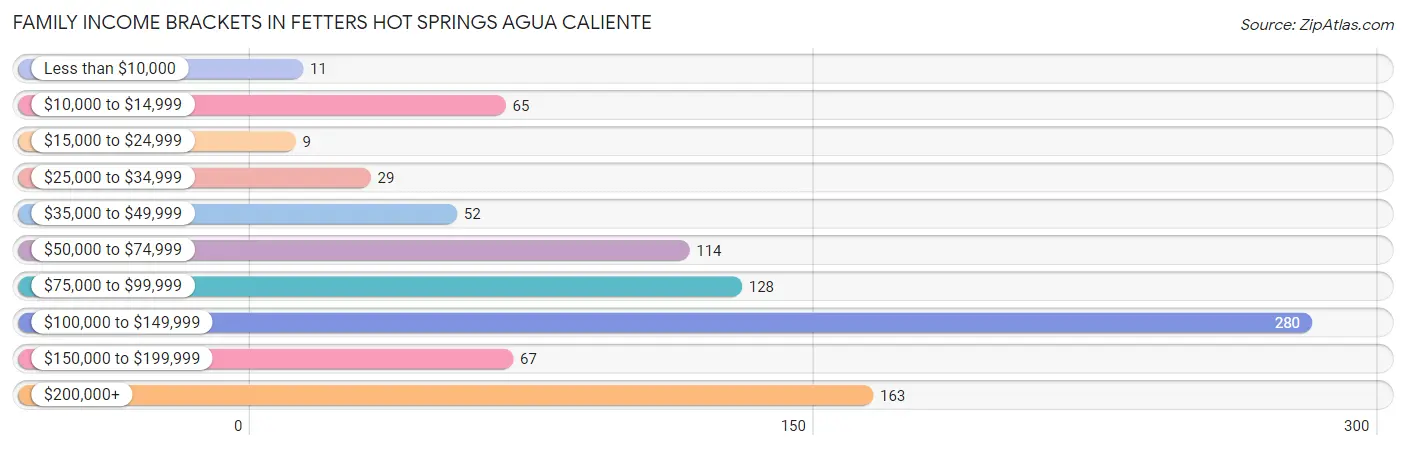
| Income Bracket | # Families | % Families |
| Less than $10,000 | 11 | 1.2% |
| $10,000 to $14,999 | 65 | 7.1% |
| $15,000 to $24,999 | 9 | 1.0% |
| $25,000 to $34,999 | 29 | 3.2% |
| $35,000 to $49,999 | 52 | 5.7% |
| $50,000 to $74,999 | 114 | 12.4% |
| $75,000 to $99,999 | 128 | 13.9% |
| $100,000 to $149,999 | 280 | 30.5% |
| $150,000 to $199,999 | 67 | 7.3% |
| $200,000+ | 163 | 17.8% |
Family Income by Famaliy Size in Fetters Hot Springs Agua Caliente
3-person families (98 | 10.7%) account for the highest median family income in Fetters Hot Springs Agua Caliente with $133,804 per family, while 2-person families (320 | 34.9%) have the highest median income of $63,000 per family member.
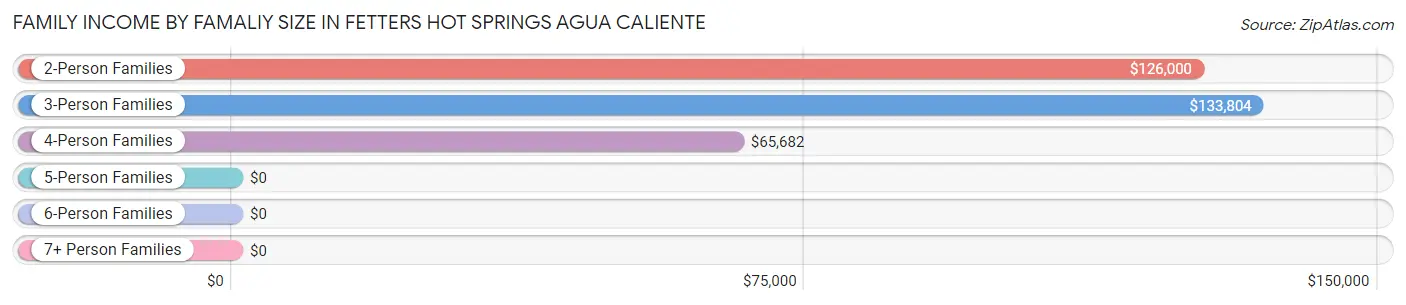
| Income Bracket | # Families | Median Income |
| 2-Person Families | 320 (34.9%) | $126,000 |
| 3-Person Families | 98 (10.7%) | $133,804 |
| 4-Person Families | 310 (33.8%) | $65,682 |
| 5-Person Families | 111 (12.1%) | $0 |
| 6-Person Families | 24 (2.6%) | $0 |
| 7+ Person Families | 55 (6.0%) | $0 |
| Total | 918 (100.0%) | $103,500 |
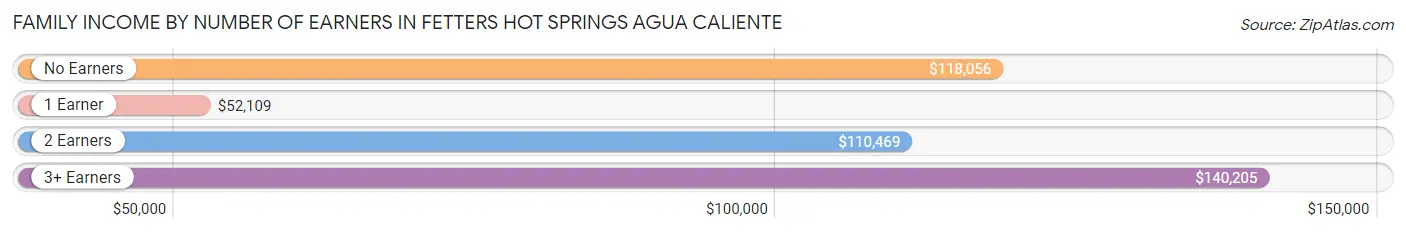
Family Income by Number of Earners in Fetters Hot Springs Agua Caliente
The median family income in Fetters Hot Springs Agua Caliente is $103,500, with families comprising 3+ earners (280) having the highest median family income of $140,205, while families with 1 earner (257) have the lowest median family income of $52,109, accounting for 30.5% and 28.0% of families, respectively.
| Number of Earners | # Families | Median Income |
| No Earners | 58 (6.3%) | $118,056 |
| 1 Earner | 257 (28.0%) | $52,109 |
| 2 Earners | 323 (35.2%) | $110,469 |
| 3+ Earners | 280 (30.5%) | $140,205 |
| Total | 918 (100.0%) | $103,500 |
Household Income in Fetters Hot Springs Agua Caliente
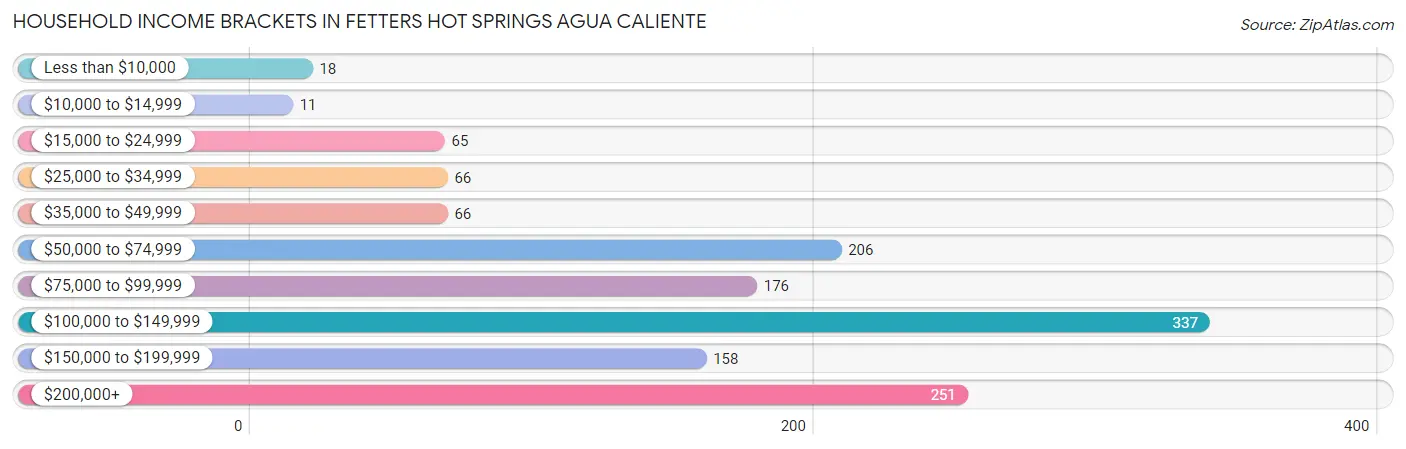
Household Income Brackets in Fetters Hot Springs Agua Caliente
With 337 households falling in the category, the $100,000 to $149,999 income range is the most frequent in Fetters Hot Springs Agua Caliente, accounting for 24.9% of all households. In contrast, only 11 households (0.8%) fall into the $10,000 to $14,999 income bracket, making it the least populous group.
| Income Bracket | # Households | % Households |
| Less than $10,000 | 18 | 1.3% |
| $10,000 to $14,999 | 11 | 0.8% |
| $15,000 to $24,999 | 65 | 4.8% |
| $25,000 to $34,999 | 66 | 4.9% |
| $35,000 to $49,999 | 66 | 4.9% |
| $50,000 to $74,999 | 206 | 15.2% |
| $75,000 to $99,999 | 176 | 13.0% |
| $100,000 to $149,999 | 337 | 24.9% |
| $150,000 to $199,999 | 158 | 11.7% |
| $200,000+ | 251 | 18.6% |
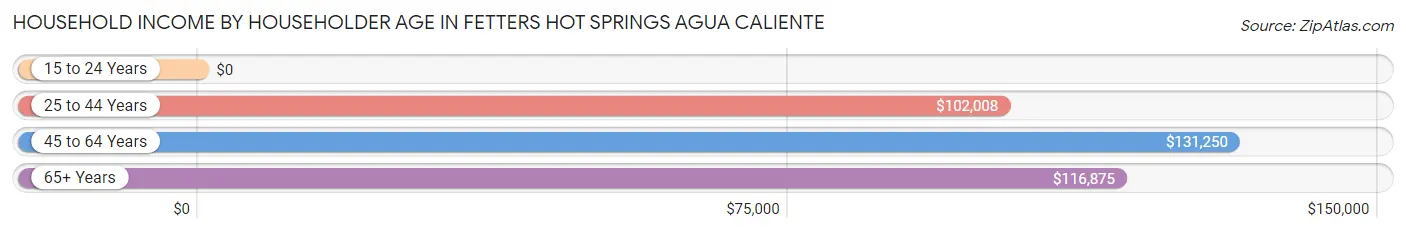
Household Income by Householder Age in Fetters Hot Springs Agua Caliente
The median household income in Fetters Hot Springs Agua Caliente is $110,577, with the highest median household income of $131,250 found in the 45 to 64 years age bracket for the primary householder. A total of 603 households (44.6%) fall into this category. Meanwhile, the 15 to 24 years age bracket for the primary householder has the lowest median household income of $0, with 42 households (3.1%) in this group.
| Income Bracket | # Households | Median Income |
| 15 to 24 Years | 42 (3.1%) | $0 |
| 25 to 44 Years | 428 (31.7%) | $102,008 |
| 45 to 64 Years | 603 (44.6%) | $131,250 |
| 65+ Years | 279 (20.6%) | $116,875 |
| Total | 1,352 (100.0%) | $110,577 |
Poverty in Fetters Hot Springs Agua Caliente
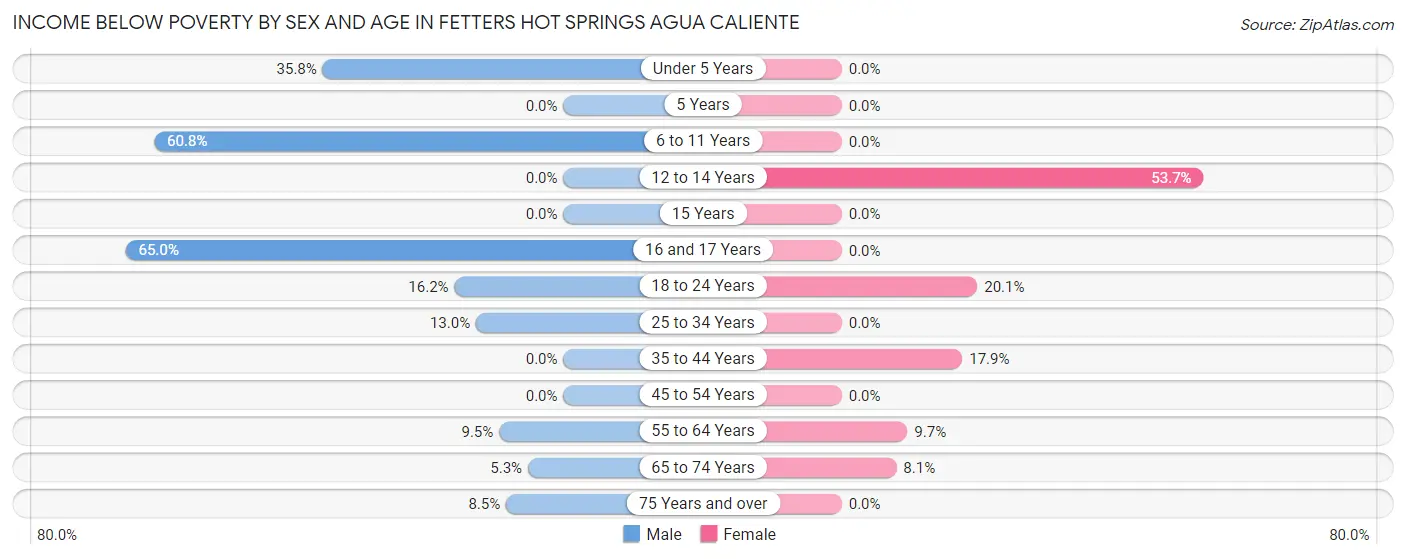
Income Below Poverty by Sex and Age in Fetters Hot Springs Agua Caliente
With 13.0% poverty level for males and 11.2% for females among the residents of Fetters Hot Springs Agua Caliente, 16 and 17 year old males and 12 to 14 year old females are the most vulnerable to poverty, with 13 males (65.0%) and 80 females (53.7%) in their respective age groups living below the poverty level.
| Age Bracket | Male | Female |
| Under 5 Years | 79 (35.7%) | 0 (0.0%) |
| 5 Years | 0 (0.0%) | 0 (0.0%) |
| 6 to 11 Years | 62 (60.8%) | 0 (0.0%) |
| 12 to 14 Years | 0 (0.0%) | 80 (53.7%) |
| 15 Years | 0 (0.0%) | 0 (0.0%) |
| 16 and 17 Years | 13 (65.0%) | 0 (0.0%) |
| 18 to 24 Years | 28 (16.2%) | 69 (20.1%) |
| 25 to 34 Years | 41 (13.0%) | 0 (0.0%) |
| 35 to 44 Years | 0 (0.0%) | 56 (17.9%) |
| 45 to 54 Years | 0 (0.0%) | 0 (0.0%) |
| 55 to 64 Years | 25 (9.5%) | 30 (9.7%) |
| 65 to 74 Years | 9 (5.3%) | 9 (8.1%) |
| 75 Years and over | 8 (8.5%) | 0 (0.0%) |
| Total | 265 (13.0%) | 244 (11.2%) |
Income Above Poverty by Sex and Age in Fetters Hot Springs Agua Caliente
According to the poverty statistics in Fetters Hot Springs Agua Caliente, males aged 5 years and females aged under 5 years are the age groups that are most secure financially, with 100.0% of males and 100.0% of females in these age groups living above the poverty line.
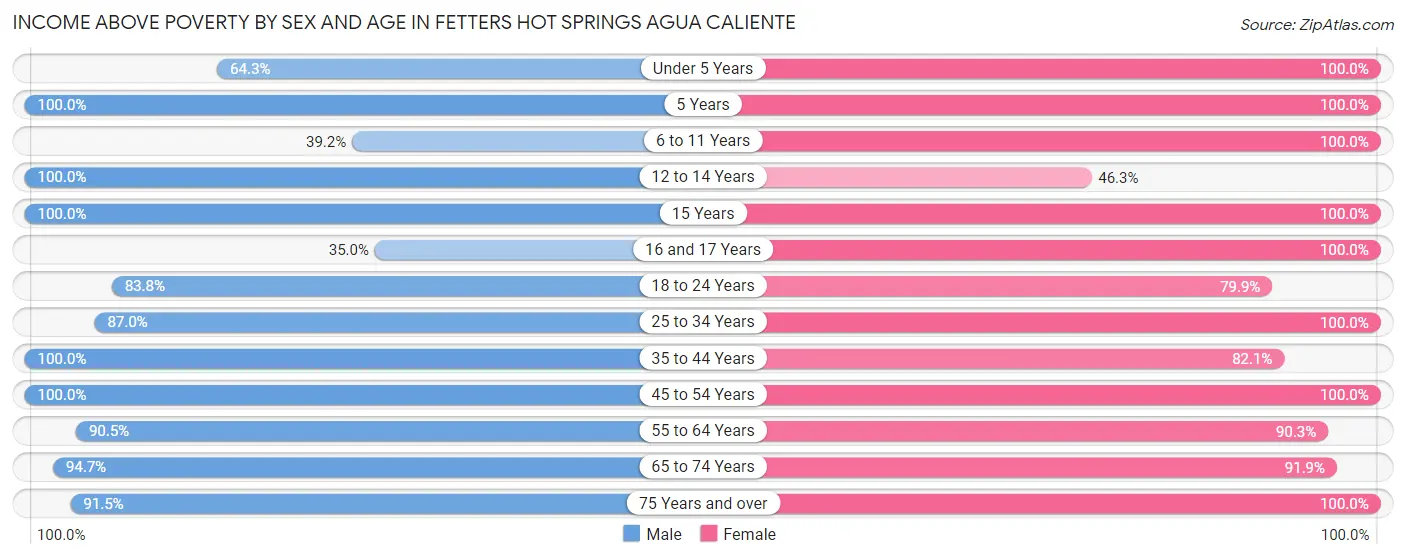
| Age Bracket | Male | Female |
| Under 5 Years | 142 (64.2%) | 132 (100.0%) |
| 5 Years | 9 (100.0%) | 52 (100.0%) |
| 6 to 11 Years | 40 (39.2%) | 140 (100.0%) |
| 12 to 14 Years | 40 (100.0%) | 69 (46.3%) |
| 15 Years | 15 (100.0%) | 88 (100.0%) |
| 16 and 17 Years | 7 (35.0%) | 25 (100.0%) |
| 18 to 24 Years | 145 (83.8%) | 274 (79.9%) |
| 25 to 34 Years | 275 (87.0%) | 211 (100.0%) |
| 35 to 44 Years | 256 (100.0%) | 257 (82.1%) |
| 45 to 54 Years | 364 (100.0%) | 263 (100.0%) |
| 55 to 64 Years | 237 (90.5%) | 278 (90.3%) |
| 65 to 74 Years | 162 (94.7%) | 102 (91.9%) |
| 75 Years and over | 86 (91.5%) | 46 (100.0%) |
| Total | 1,778 (87.0%) | 1,937 (88.8%) |
Income Below Poverty Among Married-Couple Families in Fetters Hot Springs Agua Caliente
The poverty statistics for married-couple families in Fetters Hot Springs Agua Caliente show that 3.3% or 22 of the total 672 families live below the poverty line. Families with no children have the highest poverty rate of 5.3%, comprising of 22 families. On the other hand, families with 1 or 2 children have the lowest poverty rate of 0.0%, which includes 0 families.
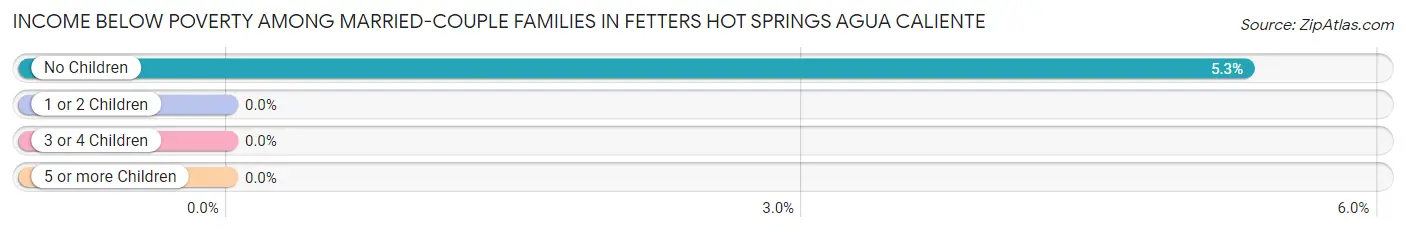
| Children | Above Poverty | Below Poverty |
| No Children | 392 (94.7%) | 22 (5.3%) |
| 1 or 2 Children | 170 (100.0%) | 0 (0.0%) |
| 3 or 4 Children | 88 (100.0%) | 0 (0.0%) |
| 5 or more Children | 0 (0.0%) | 0 (0.0%) |
| Total | 650 (96.7%) | 22 (3.3%) |
Income Below Poverty Among Single-Parent Households in Fetters Hot Springs Agua Caliente
According to the poverty data in Fetters Hot Springs Agua Caliente, 9.2% or 11 single-father households and 44.4% or 56 single-mother households are living below the poverty line. Among single-father households, those with 1 or 2 children have the highest poverty rate, with 11 households (18.6%) experiencing poverty. Likewise, among single-mother households, those with 3 or 4 children have the highest poverty rate, with 56 households (82.4%) falling below the poverty line.
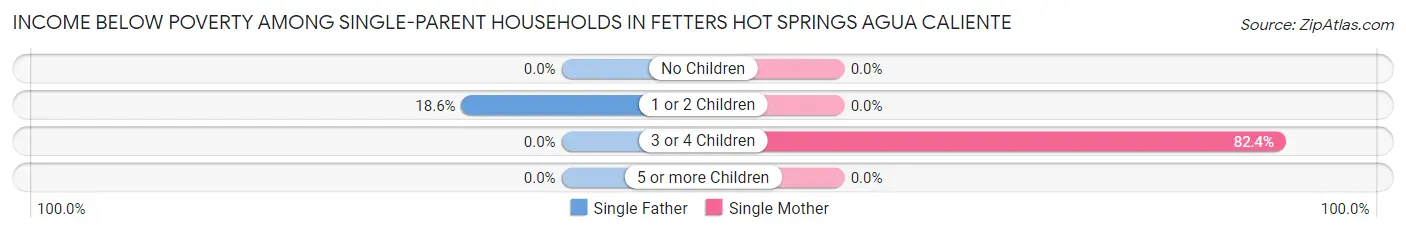
| Children | Single Father | Single Mother |
| No Children | 0 (0.0%) | 0 (0.0%) |
| 1 or 2 Children | 11 (18.6%) | 0 (0.0%) |
| 3 or 4 Children | 0 (0.0%) | 56 (82.4%) |
| 5 or more Children | 0 (0.0%) | 0 (0.0%) |
| Total | 11 (9.2%) | 56 (44.4%) |
Income Below Poverty Among Married-Couple vs Single-Parent Households in Fetters Hot Springs Agua Caliente
The poverty data for Fetters Hot Springs Agua Caliente shows that 22 of the married-couple family households (3.3%) and 67 of the single-parent households (27.2%) are living below the poverty level. Within the married-couple family households, those with no children have the highest poverty rate, with 22 households (5.3%) falling below the poverty line. Among the single-parent households, those with 3 or 4 children have the highest poverty rate, with 56 household (82.4%) living below poverty.
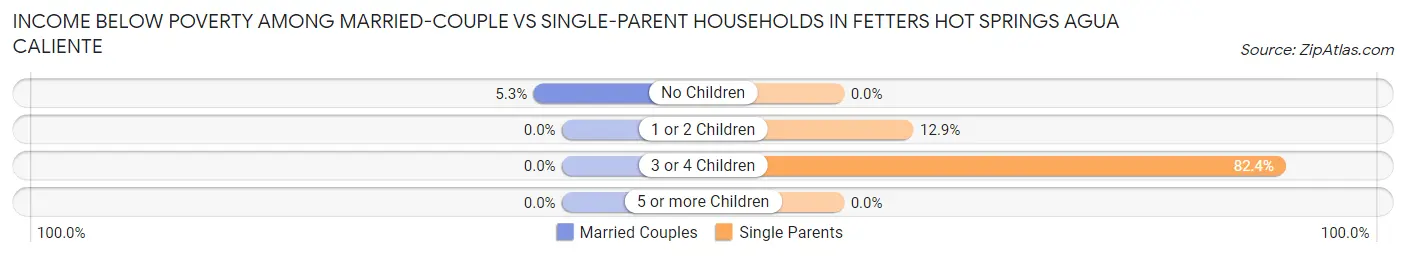
| Children | Married-Couple Families | Single-Parent Households |
| No Children | 22 (5.3%) | 0 (0.0%) |
| 1 or 2 Children | 0 (0.0%) | 11 (12.9%) |
| 3 or 4 Children | 0 (0.0%) | 56 (82.4%) |
| 5 or more Children | 0 (0.0%) | 0 (0.0%) |
| Total | 22 (3.3%) | 67 (27.2%) |
Employment Characteristics in Fetters Hot Springs Agua Caliente
Employment by Class of Employer in Fetters Hot Springs Agua Caliente
Among the 2,251 employed individuals in Fetters Hot Springs Agua Caliente, private company employees (1,492 | 66.3%), self-employed (not incorporated) (348 | 15.5%), and local government employees (180 | 8.0%) make up the most common classes of employment.
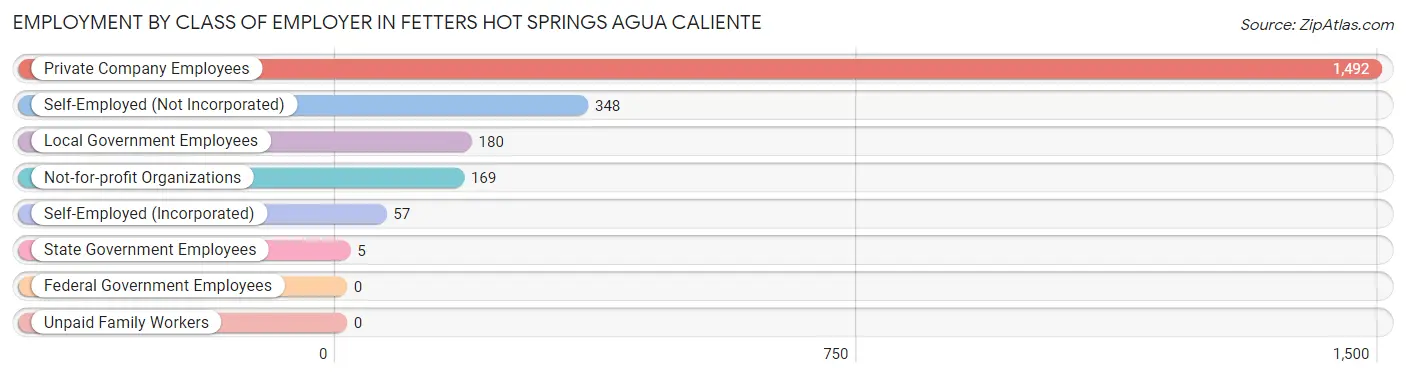
| Employer Class | # Employees | % Employees |
| Private Company Employees | 1,492 | 66.3% |
| Self-Employed (Incorporated) | 57 | 2.5% |
| Self-Employed (Not Incorporated) | 348 | 15.5% |
| Not-for-profit Organizations | 169 | 7.5% |
| Local Government Employees | 180 | 8.0% |
| State Government Employees | 5 | 0.2% |
| Federal Government Employees | 0 | 0.0% |
| Unpaid Family Workers | 0 | 0.0% |
| Total | 2,251 | 100.0% |
Employment Status by Age in Fetters Hot Springs Agua Caliente
According to the labor force statistics for Fetters Hot Springs Agua Caliente, out of the total population over 16 years of age (3,276), 72.0% or 2,359 individuals are in the labor force, with 2.7% or 64 of them unemployed. The age group with the highest labor force participation rate is 30 to 34 years, with 90.7% or 313 individuals in the labor force. Within the labor force, the 55 to 59 years age range has the highest percentage of unemployed individuals, with 14.8% or 29 of them being unemployed.
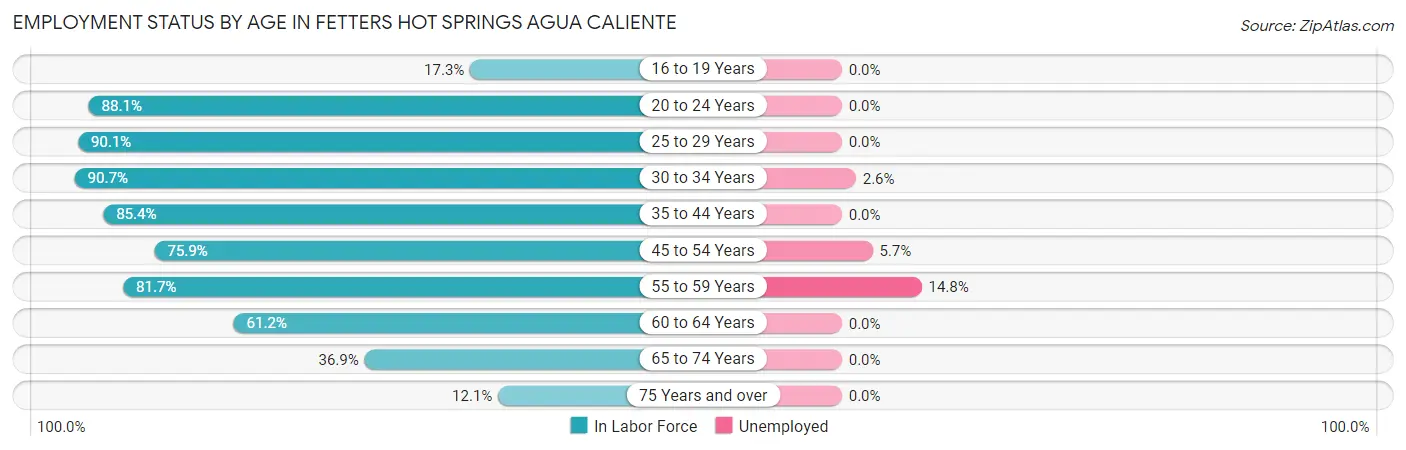
| Age Bracket | In Labor Force | Unemployed |
| 16 to 19 Years | 23 (17.3%) | 0 (0.0%) |
| 20 to 24 Years | 377 (88.1%) | 0 (0.0%) |
| 25 to 29 Years | 164 (90.1%) | 0 (0.0%) |
| 30 to 34 Years | 313 (90.7%) | 8 (2.6%) |
| 35 to 44 Years | 486 (85.4%) | 0 (0.0%) |
| 45 to 54 Years | 476 (75.9%) | 27 (5.7%) |
| 55 to 59 Years | 196 (81.7%) | 29 (14.8%) |
| 60 to 64 Years | 202 (61.2%) | 0 (0.0%) |
| 65 to 74 Years | 104 (36.9%) | 0 (0.0%) |
| 75 Years and over | 17 (12.1%) | 0 (0.0%) |
| Total | 2,359 (72.0%) | 64 (2.7%) |
Employment Status by Educational Attainment in Fetters Hot Springs Agua Caliente
According to labor force statistics for Fetters Hot Springs Agua Caliente, 80.1% of individuals (1,837) out of the total population between 25 and 64 years of age (2,293) are in the labor force, with 3.5% or 64 of them being unemployed. The group with the highest labor force participation rate are those with the educational attainment of college / associate degree, with 87.6% or 345 individuals in the labor force. Within the labor force, individuals with less than high school education have the highest percentage of unemployment, with 9.5% or 29 of them being unemployed.
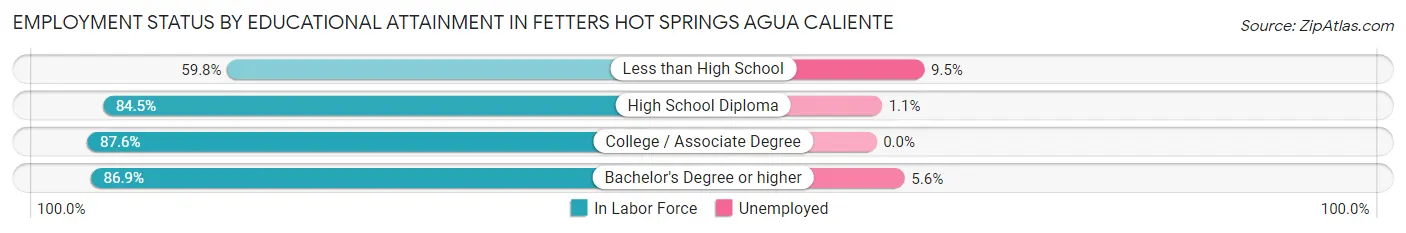
| Educational Attainment | In Labor Force | Unemployed |
| Less than High School | 305 (59.8%) | 48 (9.5%) |
| High School Diploma | 704 (84.5%) | 9 (1.1%) |
| College / Associate Degree | 345 (87.6%) | 0 (0.0%) |
| Bachelor's Degree or higher | 483 (86.9%) | 31 (5.6%) |
| Total | 1,837 (80.1%) | 80 (3.5%) |
Employment Occupations by Sex in Fetters Hot Springs Agua Caliente
Management, Business, Science and Arts Occupations
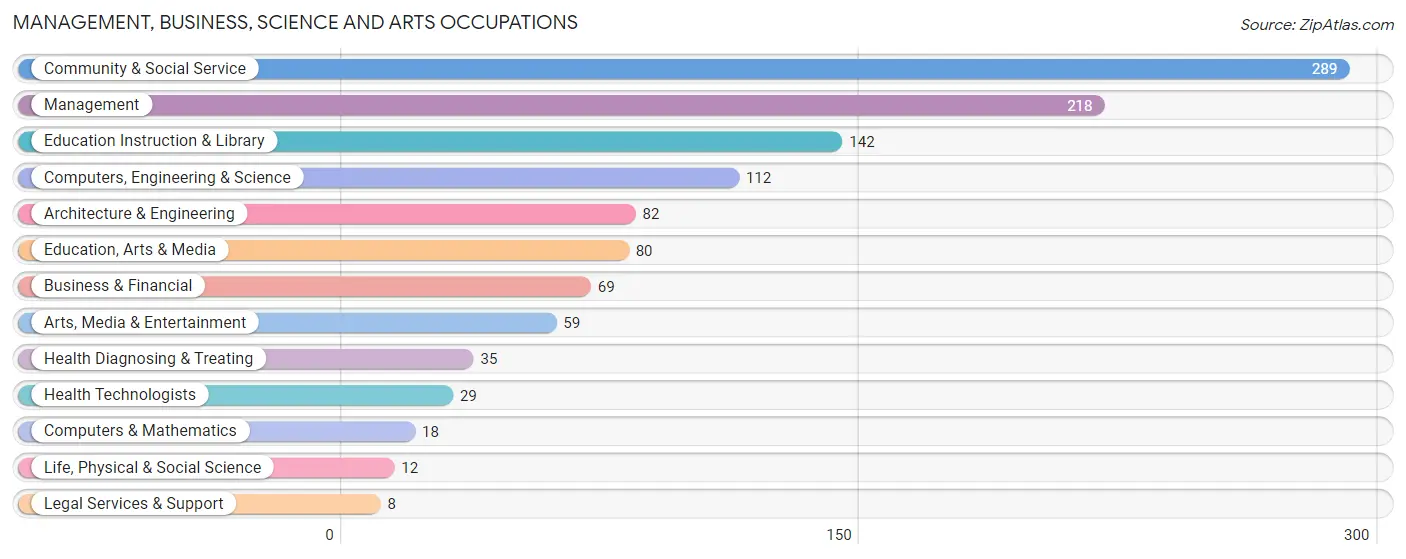
The most common Management, Business, Science and Arts occupations in Fetters Hot Springs Agua Caliente are Community & Social Service (289 | 12.6%), Management (218 | 9.5%), Education Instruction & Library (142 | 6.2%), Computers, Engineering & Science (112 | 4.9%), and Architecture & Engineering (82 | 3.6%).
Management, Business, Science and Arts Occupations by Sex
Within the Management, Business, Science and Arts occupations in Fetters Hot Springs Agua Caliente, the most male-oriented occupations are Computers & Mathematics (100.0%), Management (65.1%), and Business & Financial (42.0%), while the most female-oriented occupations are Life, Physical & Social Science (100.0%), Legal Services & Support (100.0%), and Education, Arts & Media (82.5%).
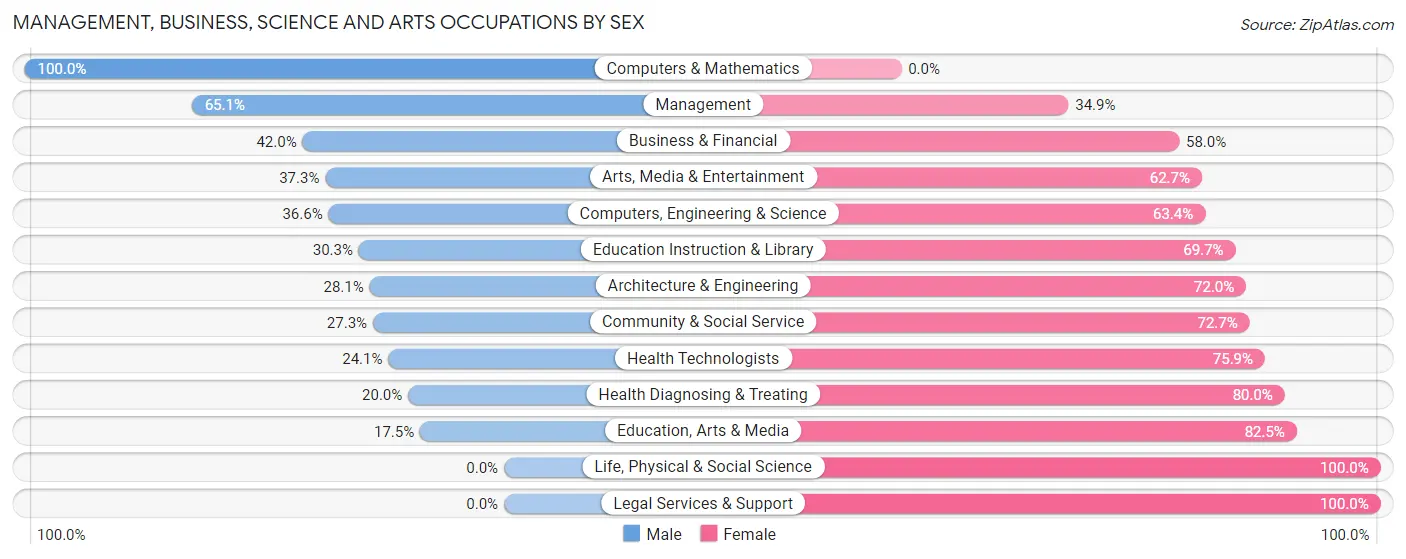
| Occupation | Male | Female |
| Management | 142 (65.1%) | 76 (34.9%) |
| Business & Financial | 29 (42.0%) | 40 (58.0%) |
| Computers, Engineering & Science | 41 (36.6%) | 71 (63.4%) |
| Computers & Mathematics | 18 (100.0%) | 0 (0.0%) |
| Architecture & Engineering | 23 (28.1%) | 59 (72.0%) |
| Life, Physical & Social Science | 0 (0.0%) | 12 (100.0%) |
| Community & Social Service | 79 (27.3%) | 210 (72.7%) |
| Education, Arts & Media | 14 (17.5%) | 66 (82.5%) |
| Legal Services & Support | 0 (0.0%) | 8 (100.0%) |
| Education Instruction & Library | 43 (30.3%) | 99 (69.7%) |
| Arts, Media & Entertainment | 22 (37.3%) | 37 (62.7%) |
| Health Diagnosing & Treating | 7 (20.0%) | 28 (80.0%) |
| Health Technologists | 7 (24.1%) | 22 (75.9%) |
| Total (Category) | 298 (41.2%) | 425 (58.8%) |
| Total (Overall) | 1,258 (54.8%) | 1,036 (45.2%) |
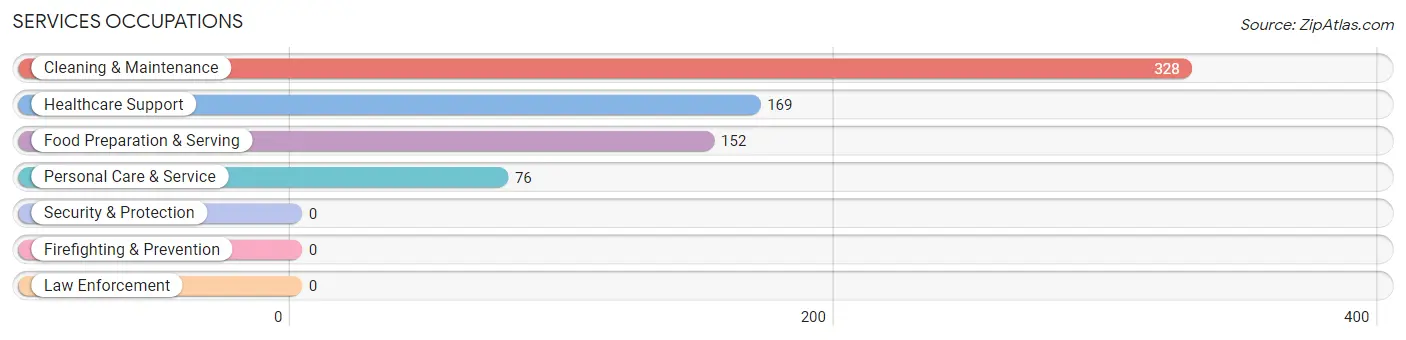
Services Occupations
The most common Services occupations in Fetters Hot Springs Agua Caliente are Cleaning & Maintenance (328 | 14.3%), Healthcare Support (169 | 7.4%), Food Preparation & Serving (152 | 6.6%), and Personal Care & Service (76 | 3.3%).
Services Occupations by Sex
Within the Services occupations in Fetters Hot Springs Agua Caliente, the most male-oriented occupations are Cleaning & Maintenance (64.3%), Healthcare Support (56.2%), and Food Preparation & Serving (39.5%), while the most female-oriented occupations are Personal Care & Service (86.8%), Food Preparation & Serving (60.5%), and Healthcare Support (43.8%).
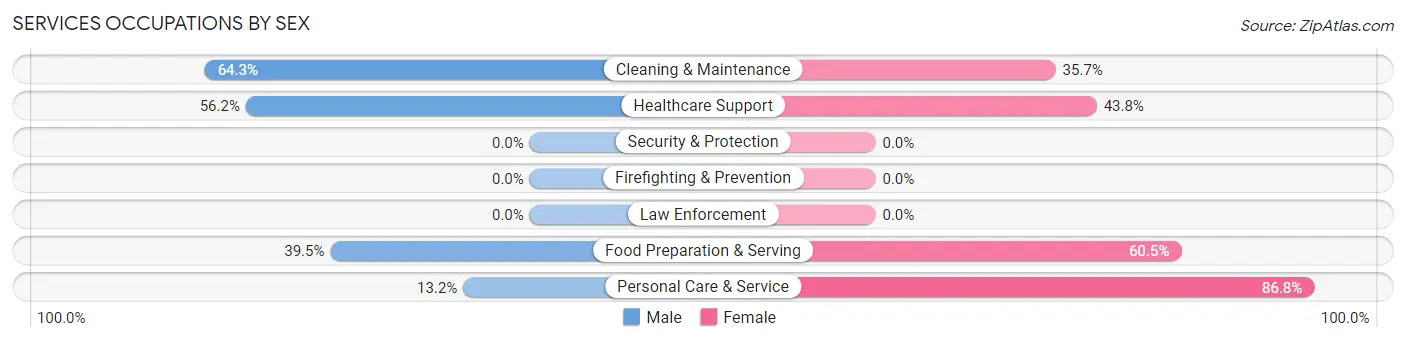
| Occupation | Male | Female |
| Healthcare Support | 95 (56.2%) | 74 (43.8%) |
| Security & Protection | 0 (0.0%) | 0 (0.0%) |
| Firefighting & Prevention | 0 (0.0%) | 0 (0.0%) |
| Law Enforcement | 0 (0.0%) | 0 (0.0%) |
| Food Preparation & Serving | 60 (39.5%) | 92 (60.5%) |
| Cleaning & Maintenance | 211 (64.3%) | 117 (35.7%) |
| Personal Care & Service | 10 (13.2%) | 66 (86.8%) |
| Total (Category) | 376 (51.9%) | 349 (48.1%) |
| Total (Overall) | 1,258 (54.8%) | 1,036 (45.2%) |
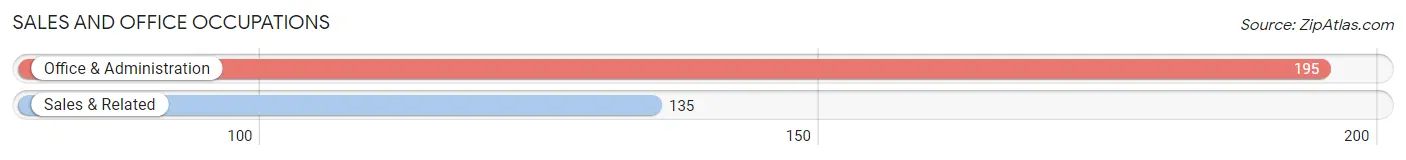
Sales and Office Occupations
The most common Sales and Office occupations in Fetters Hot Springs Agua Caliente are Office & Administration (195 | 8.5%), and Sales & Related (135 | 5.9%).
Sales and Office Occupations by Sex
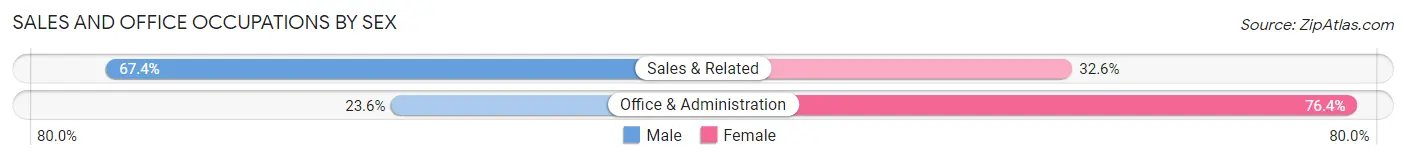
| Occupation | Male | Female |
| Sales & Related | 91 (67.4%) | 44 (32.6%) |
| Office & Administration | 46 (23.6%) | 149 (76.4%) |
| Total (Category) | 137 (41.5%) | 193 (58.5%) |
| Total (Overall) | 1,258 (54.8%) | 1,036 (45.2%) |
Natural Resources, Construction and Maintenance Occupations
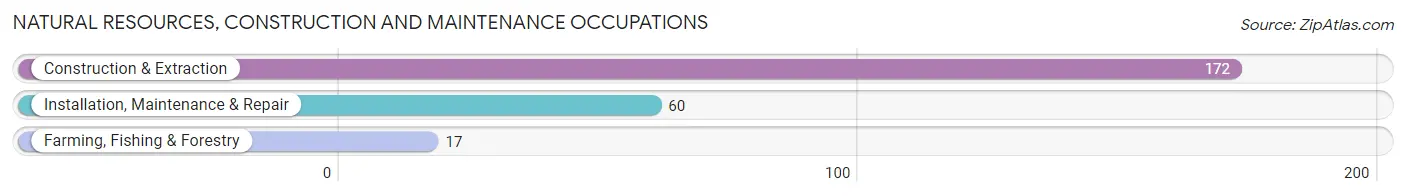
The most common Natural Resources, Construction and Maintenance occupations in Fetters Hot Springs Agua Caliente are Construction & Extraction (172 | 7.5%), Installation, Maintenance & Repair (60 | 2.6%), and Farming, Fishing & Forestry (17 | 0.7%).
Natural Resources, Construction and Maintenance Occupations by Sex
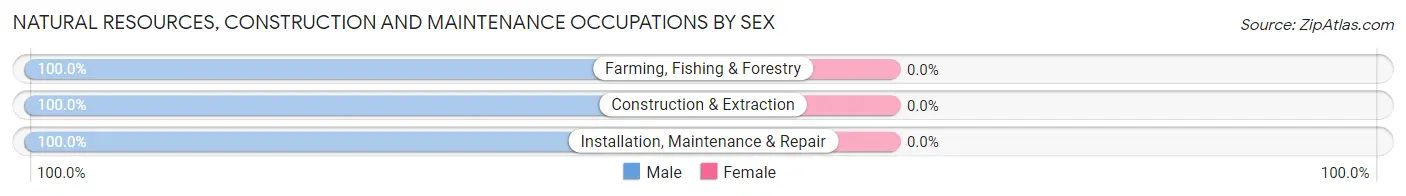
| Occupation | Male | Female |
| Farming, Fishing & Forestry | 17 (100.0%) | 0 (0.0%) |
| Construction & Extraction | 172 (100.0%) | 0 (0.0%) |
| Installation, Maintenance & Repair | 60 (100.0%) | 0 (0.0%) |
| Total (Category) | 249 (100.0%) | 0 (0.0%) |
| Total (Overall) | 1,258 (54.8%) | 1,036 (45.2%) |
Production, Transportation and Moving Occupations
The most common Production, Transportation and Moving occupations in Fetters Hot Springs Agua Caliente are Material Moving (134 | 5.8%), Production (75 | 3.3%), and Transportation (58 | 2.5%).

Production, Transportation and Moving Occupations by Sex

| Occupation | Male | Female |
| Production | 65 (86.7%) | 10 (13.3%) |
| Transportation | 58 (100.0%) | 0 (0.0%) |
| Material Moving | 75 (56.0%) | 59 (44.0%) |
| Total (Category) | 198 (74.2%) | 69 (25.8%) |
| Total (Overall) | 1,258 (54.8%) | 1,036 (45.2%) |
Employment Industries by Sex in Fetters Hot Springs Agua Caliente
Employment Industries in Fetters Hot Springs Agua Caliente
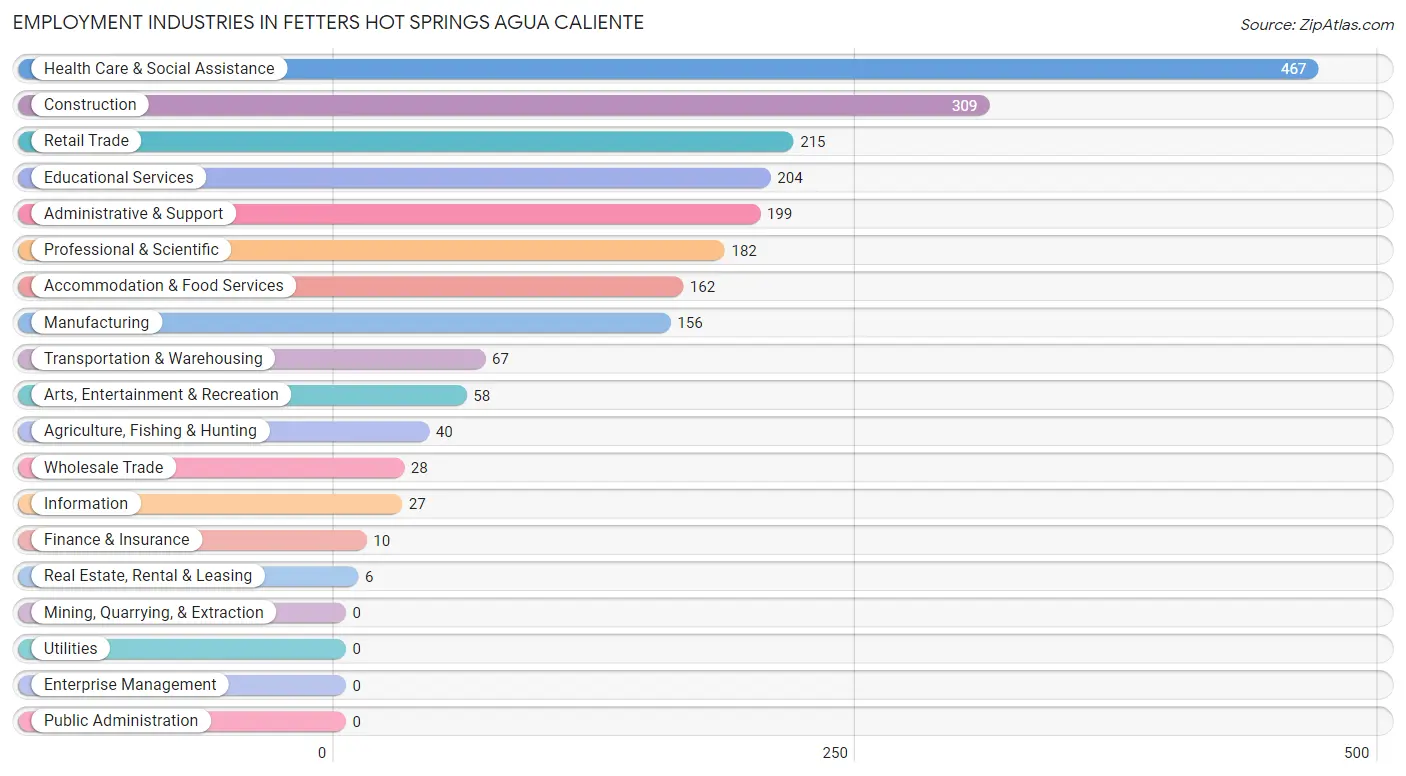
The major employment industries in Fetters Hot Springs Agua Caliente include Health Care & Social Assistance (467 | 20.4%), Construction (309 | 13.5%), Retail Trade (215 | 9.4%), Educational Services (204 | 8.9%), and Administrative & Support (199 | 8.7%).
Employment Industries by Sex in Fetters Hot Springs Agua Caliente
The Fetters Hot Springs Agua Caliente industries that see more men than women are Construction (89.0%), Retail Trade (78.6%), and Manufacturing (71.2%), whereas the industries that tend to have a higher number of women are Wholesale Trade (100.0%), Finance & Insurance (100.0%), and Real Estate, Rental & Leasing (100.0%).
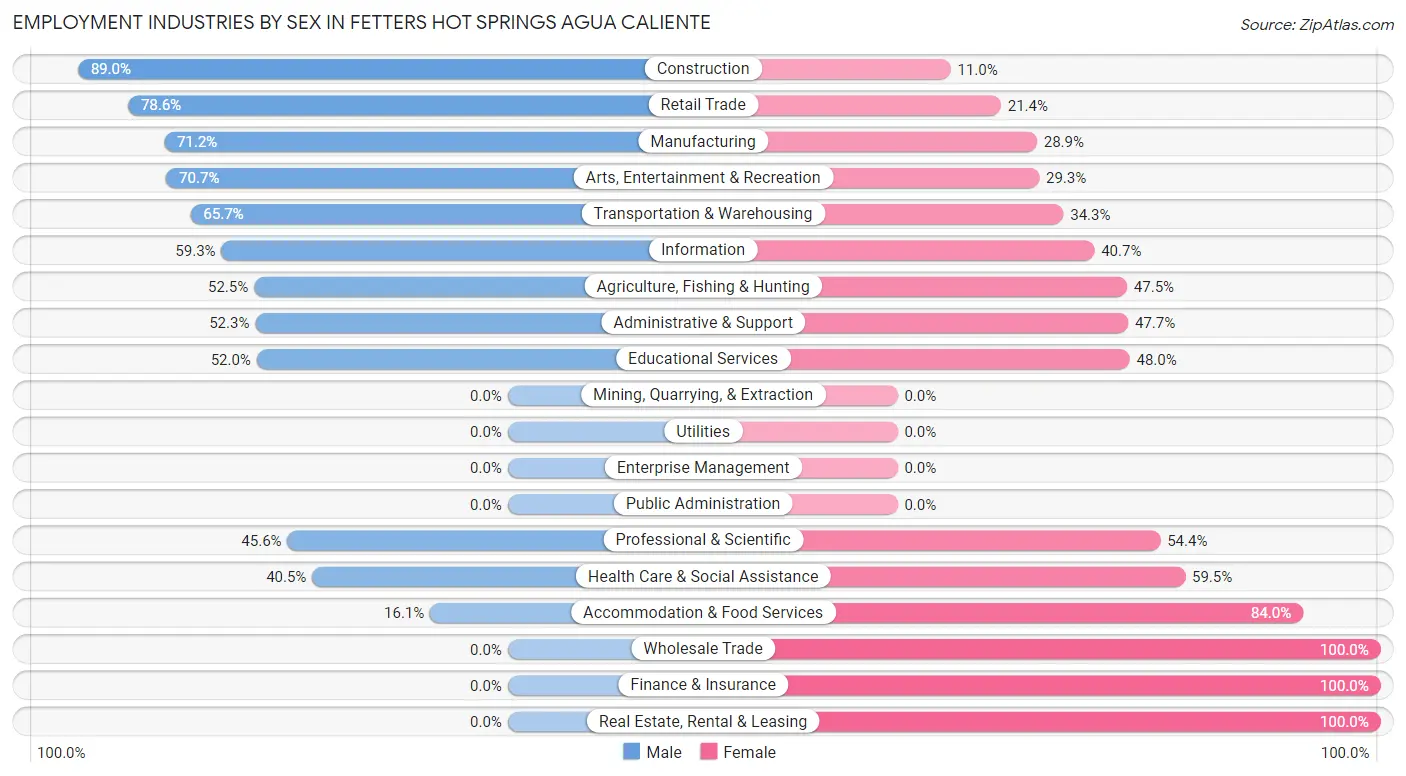
| Industry | Male | Female |
| Agriculture, Fishing & Hunting | 21 (52.5%) | 19 (47.5%) |
| Mining, Quarrying, & Extraction | 0 (0.0%) | 0 (0.0%) |
| Construction | 275 (89.0%) | 34 (11.0%) |
| Manufacturing | 111 (71.2%) | 45 (28.8%) |
| Wholesale Trade | 0 (0.0%) | 28 (100.0%) |
| Retail Trade | 169 (78.6%) | 46 (21.4%) |
| Transportation & Warehousing | 44 (65.7%) | 23 (34.3%) |
| Utilities | 0 (0.0%) | 0 (0.0%) |
| Information | 16 (59.3%) | 11 (40.7%) |
| Finance & Insurance | 0 (0.0%) | 10 (100.0%) |
| Real Estate, Rental & Leasing | 0 (0.0%) | 6 (100.0%) |
| Professional & Scientific | 83 (45.6%) | 99 (54.4%) |
| Enterprise Management | 0 (0.0%) | 0 (0.0%) |
| Administrative & Support | 104 (52.3%) | 95 (47.7%) |
| Educational Services | 106 (52.0%) | 98 (48.0%) |
| Health Care & Social Assistance | 189 (40.5%) | 278 (59.5%) |
| Arts, Entertainment & Recreation | 41 (70.7%) | 17 (29.3%) |
| Accommodation & Food Services | 26 (16.1%) | 136 (84.0%) |
| Public Administration | 0 (0.0%) | 0 (0.0%) |
| Total | 1,258 (54.8%) | 1,036 (45.2%) |
Education in Fetters Hot Springs Agua Caliente
School Enrollment in Fetters Hot Springs Agua Caliente
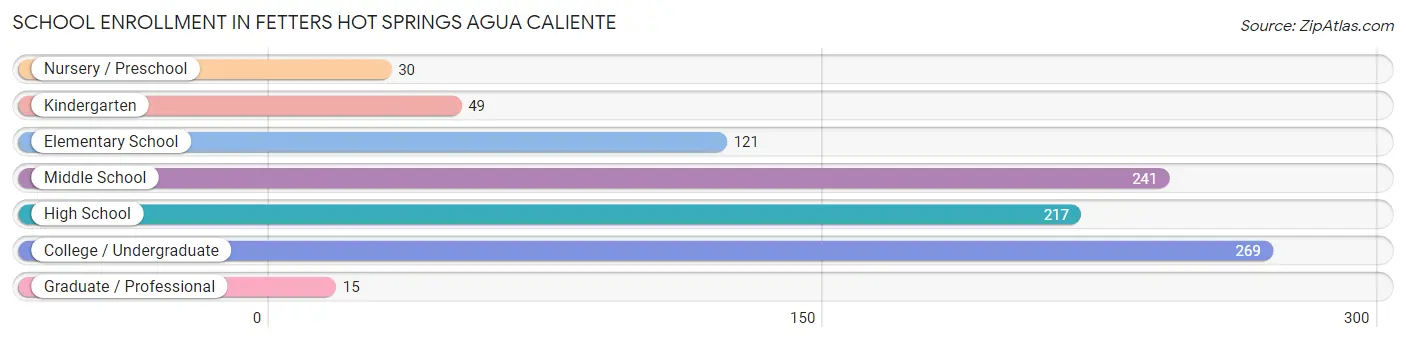
The most common levels of schooling among the 942 students in Fetters Hot Springs Agua Caliente are college / undergraduate (269 | 28.6%), middle school (241 | 25.6%), and high school (217 | 23.0%).
| School Level | # Students | % Students |
| Nursery / Preschool | 30 | 3.2% |
| Kindergarten | 49 | 5.2% |
| Elementary School | 121 | 12.9% |
| Middle School | 241 | 25.6% |
| High School | 217 | 23.0% |
| College / Undergraduate | 269 | 28.6% |
| Graduate / Professional | 15 | 1.6% |
| Total | 942 | 100.0% |
School Enrollment by Age by Funding Source in Fetters Hot Springs Agua Caliente
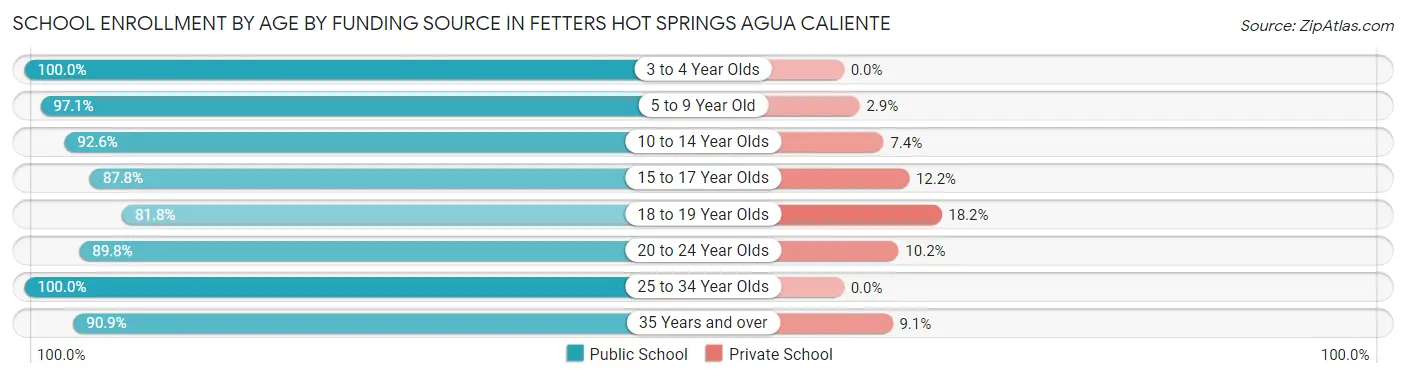
Out of a total of 942 students who are enrolled in schools in Fetters Hot Springs Agua Caliente, 80 (8.5%) attend a private institution, while the remaining 862 (91.5%) are enrolled in public schools. The age group of 18 to 19 year olds has the highest likelihood of being enrolled in private schools, with 16 (18.2% in the age bracket) enrolled. Conversely, the age group of 3 to 4 year olds has the lowest likelihood of being enrolled in a private school, with 30 (100.0% in the age bracket) attending a public institution.
| Age Bracket | Public School | Private School |
| 3 to 4 Year Olds | 30 (100.0%) | 0 (0.0%) |
| 5 to 9 Year Old | 165 (97.1%) | 5 (2.9%) |
| 10 to 14 Year Olds | 287 (92.6%) | 23 (7.4%) |
| 15 to 17 Year Olds | 130 (87.8%) | 18 (12.2%) |
| 18 to 19 Year Olds | 72 (81.8%) | 16 (18.2%) |
| 20 to 24 Year Olds | 141 (89.8%) | 16 (10.2%) |
| 25 to 34 Year Olds | 17 (100.0%) | 0 (0.0%) |
| 35 Years and over | 20 (90.9%) | 2 (9.1%) |
| Total | 862 (91.5%) | 80 (8.5%) |
Educational Attainment by Field of Study in Fetters Hot Springs Agua Caliente
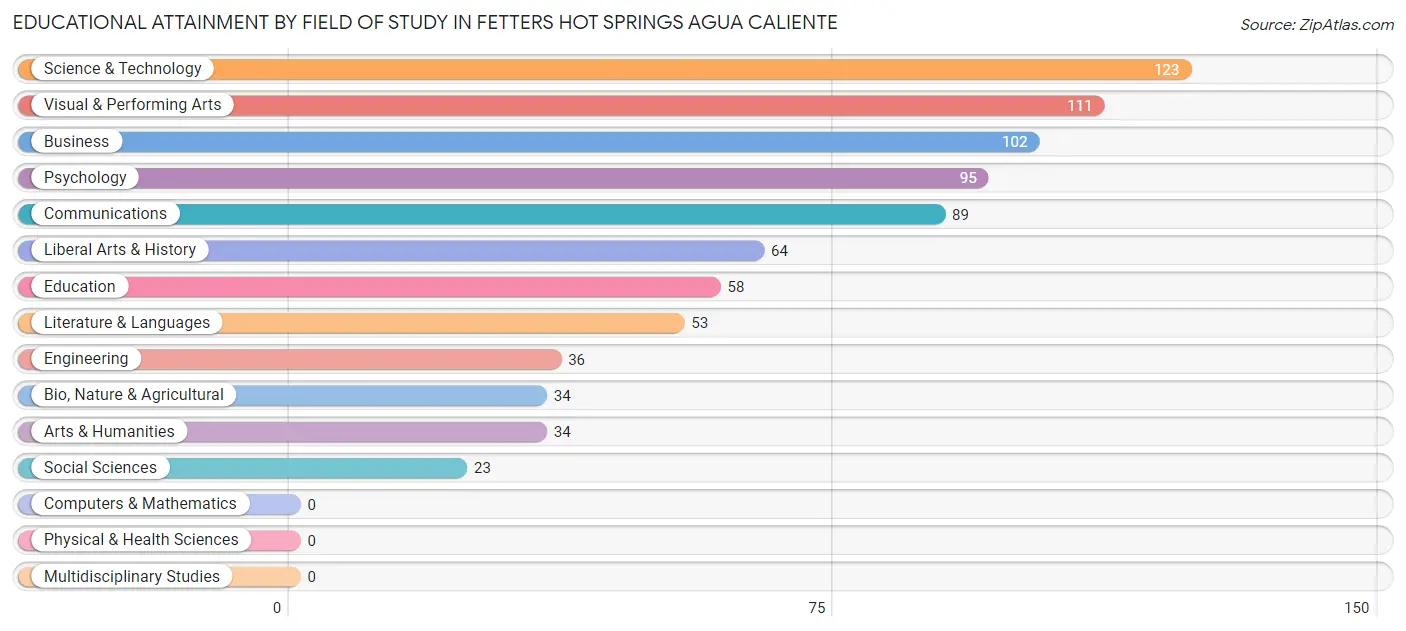
Science & technology (123 | 15.0%), visual & performing arts (111 | 13.5%), business (102 | 12.4%), psychology (95 | 11.6%), and communications (89 | 10.8%) are the most common fields of study among 822 individuals in Fetters Hot Springs Agua Caliente who have obtained a bachelor's degree or higher.
| Field of Study | # Graduates | % Graduates |
| Computers & Mathematics | 0 | 0.0% |
| Bio, Nature & Agricultural | 34 | 4.1% |
| Physical & Health Sciences | 0 | 0.0% |
| Psychology | 95 | 11.6% |
| Social Sciences | 23 | 2.8% |
| Engineering | 36 | 4.4% |
| Multidisciplinary Studies | 0 | 0.0% |
| Science & Technology | 123 | 15.0% |
| Business | 102 | 12.4% |
| Education | 58 | 7.1% |
| Literature & Languages | 53 | 6.5% |
| Liberal Arts & History | 64 | 7.8% |
| Visual & Performing Arts | 111 | 13.5% |
| Communications | 89 | 10.8% |
| Arts & Humanities | 34 | 4.1% |
| Total | 822 | 100.0% |
Transportation & Commute in Fetters Hot Springs Agua Caliente
Vehicle Availability by Sex in Fetters Hot Springs Agua Caliente
The most prevalent vehicle ownership categories in Fetters Hot Springs Agua Caliente are males with 2 vehicles (399, accounting for 32.7%) and females with 2 vehicles (461, making up 39.3%).
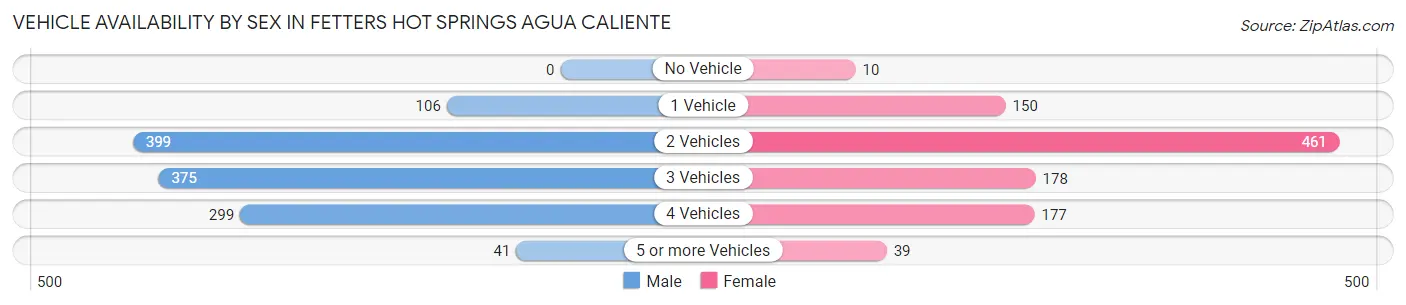
| Vehicles Available | Male | Female |
| No Vehicle | 0 (0.0%) | 10 (1.0%) |
| 1 Vehicle | 106 (8.7%) | 150 (14.8%) |
| 2 Vehicles | 399 (32.7%) | 461 (45.4%) |
| 3 Vehicles | 375 (30.7%) | 178 (17.5%) |
| 4 Vehicles | 299 (24.5%) | 177 (17.4%) |
| 5 or more Vehicles | 41 (3.4%) | 39 (3.8%) |
| Total | 1,220 (100.0%) | 1,015 (100.0%) |
Commute Time in Fetters Hot Springs Agua Caliente
The most frequently occuring commute durations in Fetters Hot Springs Agua Caliente are 15 to 19 minutes (457 commuters, 22.1%), 10 to 14 minutes (444 commuters, 21.4%), and 30 to 34 minutes (254 commuters, 12.2%).
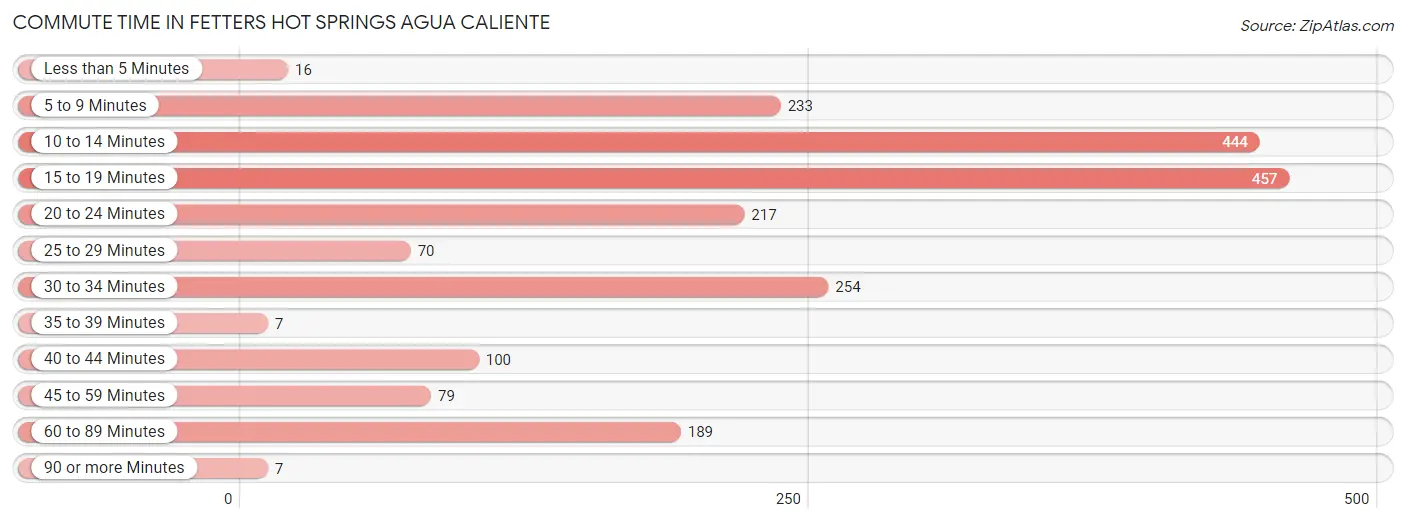
| Commute Time | # Commuters | % Commuters |
| Less than 5 Minutes | 16 | 0.8% |
| 5 to 9 Minutes | 233 | 11.2% |
| 10 to 14 Minutes | 444 | 21.4% |
| 15 to 19 Minutes | 457 | 22.1% |
| 20 to 24 Minutes | 217 | 10.5% |
| 25 to 29 Minutes | 70 | 3.4% |
| 30 to 34 Minutes | 254 | 12.2% |
| 35 to 39 Minutes | 7 | 0.3% |
| 40 to 44 Minutes | 100 | 4.8% |
| 45 to 59 Minutes | 79 | 3.8% |
| 60 to 89 Minutes | 189 | 9.1% |
| 90 or more Minutes | 7 | 0.3% |
Commute Time by Sex in Fetters Hot Springs Agua Caliente
The most common commute times in Fetters Hot Springs Agua Caliente are 10 to 14 minutes (224 commuters, 19.4%) for males and 15 to 19 minutes (260 commuters, 28.3%) for females.
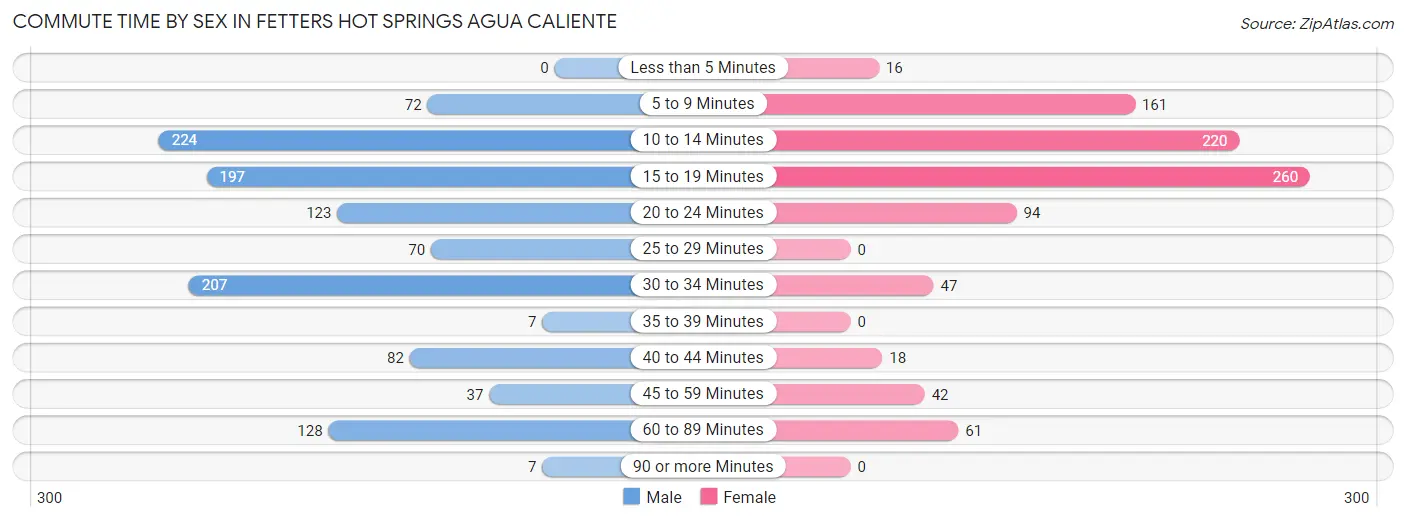
| Commute Time | Male | Female |
| Less than 5 Minutes | 0 (0.0%) | 16 (1.7%) |
| 5 to 9 Minutes | 72 (6.2%) | 161 (17.5%) |
| 10 to 14 Minutes | 224 (19.4%) | 220 (23.9%) |
| 15 to 19 Minutes | 197 (17.1%) | 260 (28.3%) |
| 20 to 24 Minutes | 123 (10.7%) | 94 (10.2%) |
| 25 to 29 Minutes | 70 (6.1%) | 0 (0.0%) |
| 30 to 34 Minutes | 207 (17.9%) | 47 (5.1%) |
| 35 to 39 Minutes | 7 (0.6%) | 0 (0.0%) |
| 40 to 44 Minutes | 82 (7.1%) | 18 (2.0%) |
| 45 to 59 Minutes | 37 (3.2%) | 42 (4.6%) |
| 60 to 89 Minutes | 128 (11.1%) | 61 (6.6%) |
| 90 or more Minutes | 7 (0.6%) | 0 (0.0%) |
Time of Departure to Work by Sex in Fetters Hot Springs Agua Caliente
The most frequent times of departure to work in Fetters Hot Springs Agua Caliente are 6:00 AM to 6:29 AM (179, 15.5%) for males and 6:00 AM to 6:29 AM (174, 18.9%) for females.
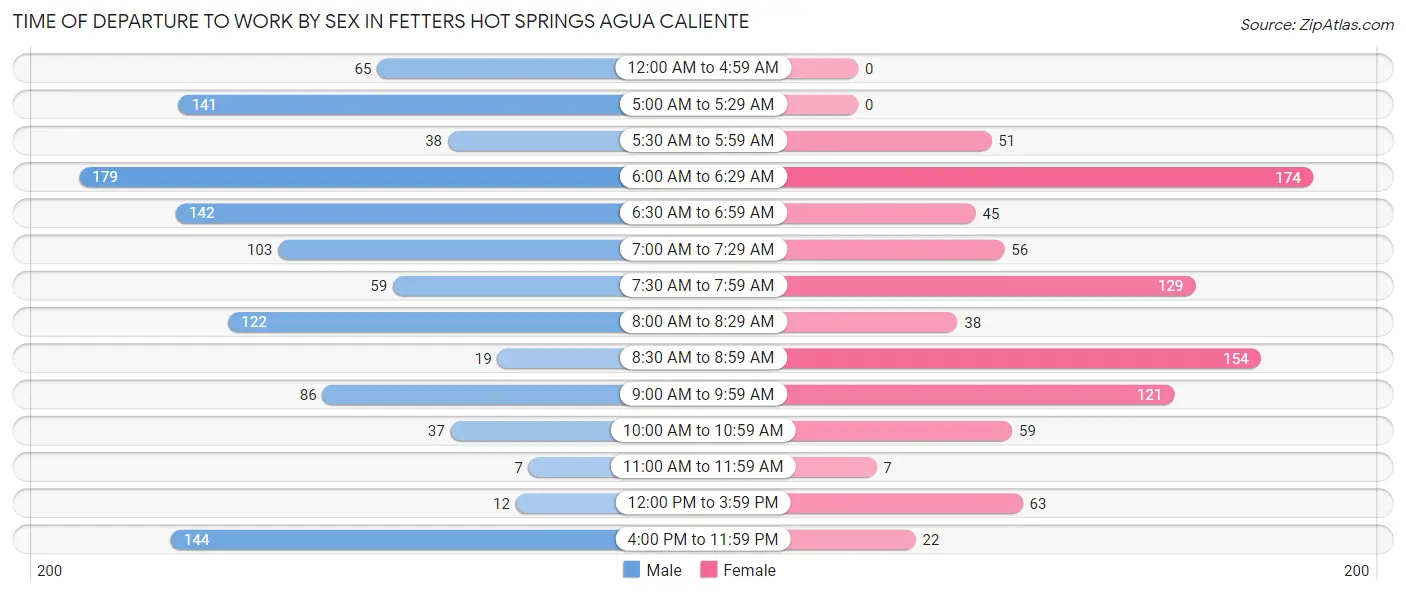
| Time of Departure | Male | Female |
| 12:00 AM to 4:59 AM | 65 (5.6%) | 0 (0.0%) |
| 5:00 AM to 5:29 AM | 141 (12.2%) | 0 (0.0%) |
| 5:30 AM to 5:59 AM | 38 (3.3%) | 51 (5.6%) |
| 6:00 AM to 6:29 AM | 179 (15.5%) | 174 (18.9%) |
| 6:30 AM to 6:59 AM | 142 (12.3%) | 45 (4.9%) |
| 7:00 AM to 7:29 AM | 103 (8.9%) | 56 (6.1%) |
| 7:30 AM to 7:59 AM | 59 (5.1%) | 129 (14.0%) |
| 8:00 AM to 8:29 AM | 122 (10.6%) | 38 (4.1%) |
| 8:30 AM to 8:59 AM | 19 (1.7%) | 154 (16.8%) |
| 9:00 AM to 9:59 AM | 86 (7.4%) | 121 (13.2%) |
| 10:00 AM to 10:59 AM | 37 (3.2%) | 59 (6.4%) |
| 11:00 AM to 11:59 AM | 7 (0.6%) | 7 (0.8%) |
| 12:00 PM to 3:59 PM | 12 (1.0%) | 63 (6.9%) |
| 4:00 PM to 11:59 PM | 144 (12.5%) | 22 (2.4%) |
| Total | 1,154 (100.0%) | 919 (100.0%) |
Housing Occupancy in Fetters Hot Springs Agua Caliente
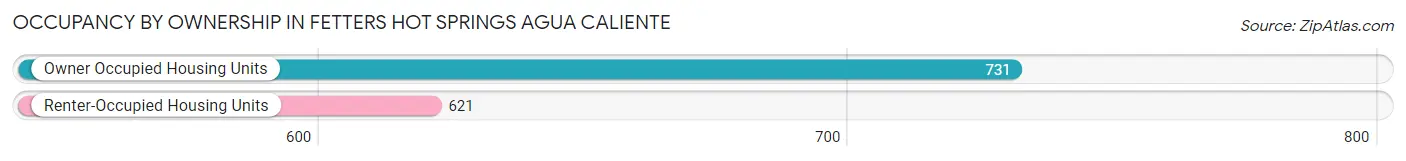
Occupancy by Ownership in Fetters Hot Springs Agua Caliente
Of the total 1,352 dwellings in Fetters Hot Springs Agua Caliente, owner-occupied units account for 731 (54.1%), while renter-occupied units make up 621 (45.9%).
| Occupancy | # Housing Units | % Housing Units |
| Owner Occupied Housing Units | 731 | 54.1% |
| Renter-Occupied Housing Units | 621 | 45.9% |
| Total Occupied Housing Units | 1,352 | 100.0% |
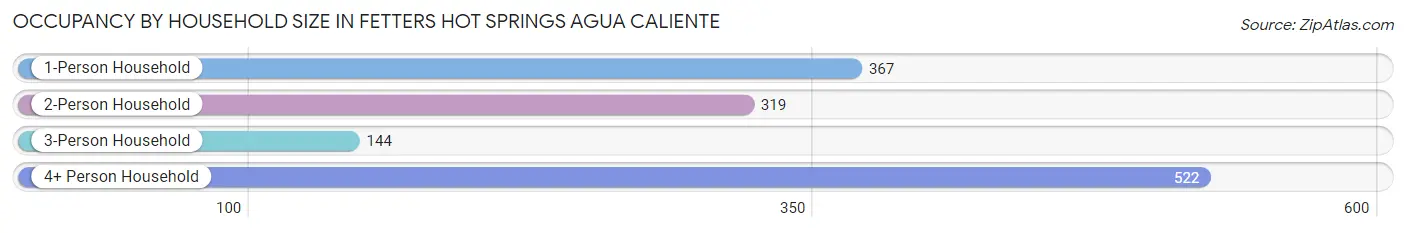
Occupancy by Household Size in Fetters Hot Springs Agua Caliente
| Household Size | # Housing Units | % Housing Units |
| 1-Person Household | 367 | 27.1% |
| 2-Person Household | 319 | 23.6% |
| 3-Person Household | 144 | 10.6% |
| 4+ Person Household | 522 | 38.6% |
| Total Housing Units | 1,352 | 100.0% |
Occupancy by Ownership by Household Size in Fetters Hot Springs Agua Caliente
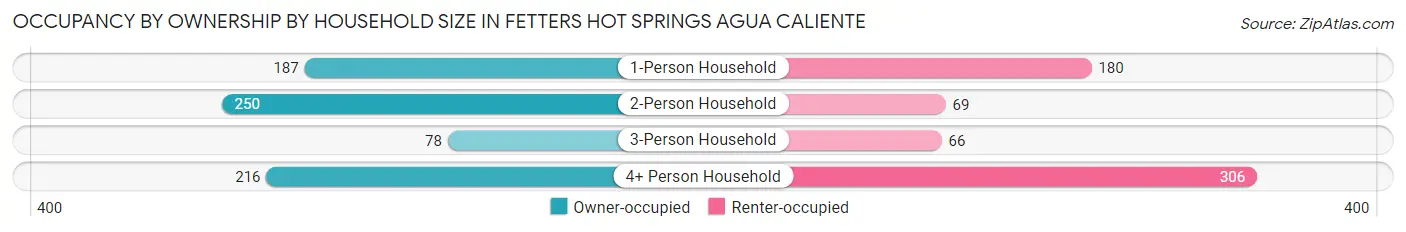
| Household Size | Owner-occupied | Renter-occupied |
| 1-Person Household | 187 (50.9%) | 180 (49.0%) |
| 2-Person Household | 250 (78.4%) | 69 (21.6%) |
| 3-Person Household | 78 (54.2%) | 66 (45.8%) |
| 4+ Person Household | 216 (41.4%) | 306 (58.6%) |
| Total Housing Units | 731 (54.1%) | 621 (45.9%) |
Occupancy by Educational Attainment in Fetters Hot Springs Agua Caliente
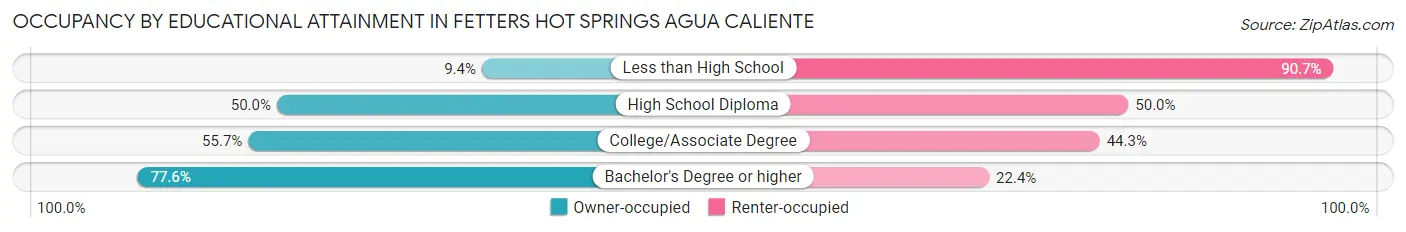
| Household Size | Owner-occupied | Renter-occupied |
| Less than High School | 20 (9.3%) | 194 (90.6%) |
| High School Diploma | 172 (50.0%) | 172 (50.0%) |
| College/Associate Degree | 196 (55.7%) | 156 (44.3%) |
| Bachelor's Degree or higher | 343 (77.6%) | 99 (22.4%) |
Occupancy by Age of Householder in Fetters Hot Springs Agua Caliente
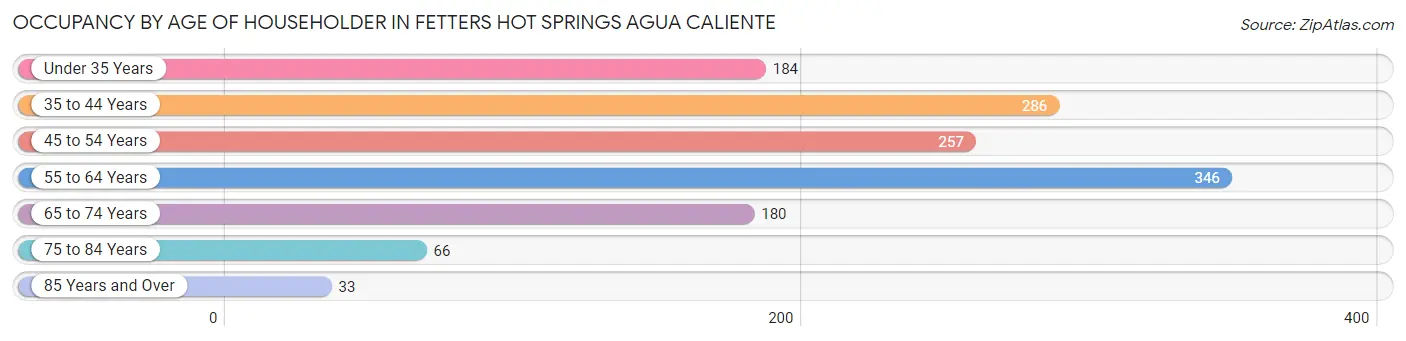
| Age Bracket | # Households | % Households |
| Under 35 Years | 184 | 13.6% |
| 35 to 44 Years | 286 | 21.1% |
| 45 to 54 Years | 257 | 19.0% |
| 55 to 64 Years | 346 | 25.6% |
| 65 to 74 Years | 180 | 13.3% |
| 75 to 84 Years | 66 | 4.9% |
| 85 Years and Over | 33 | 2.4% |
| Total | 1,352 | 100.0% |
Housing Finances in Fetters Hot Springs Agua Caliente
Median Income by Occupancy in Fetters Hot Springs Agua Caliente
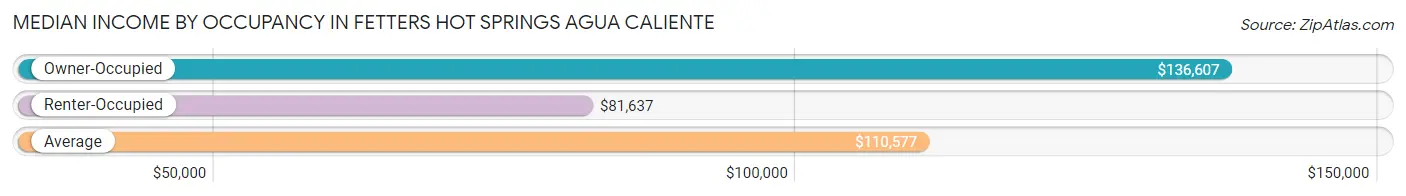
| Occupancy Type | # Households | Median Income |
| Owner-Occupied | 731 (54.1%) | $136,607 |
| Renter-Occupied | 621 (45.9%) | $81,637 |
| Average | 1,352 (100.0%) | $110,577 |
Occupancy by Householder Income Bracket in Fetters Hot Springs Agua Caliente
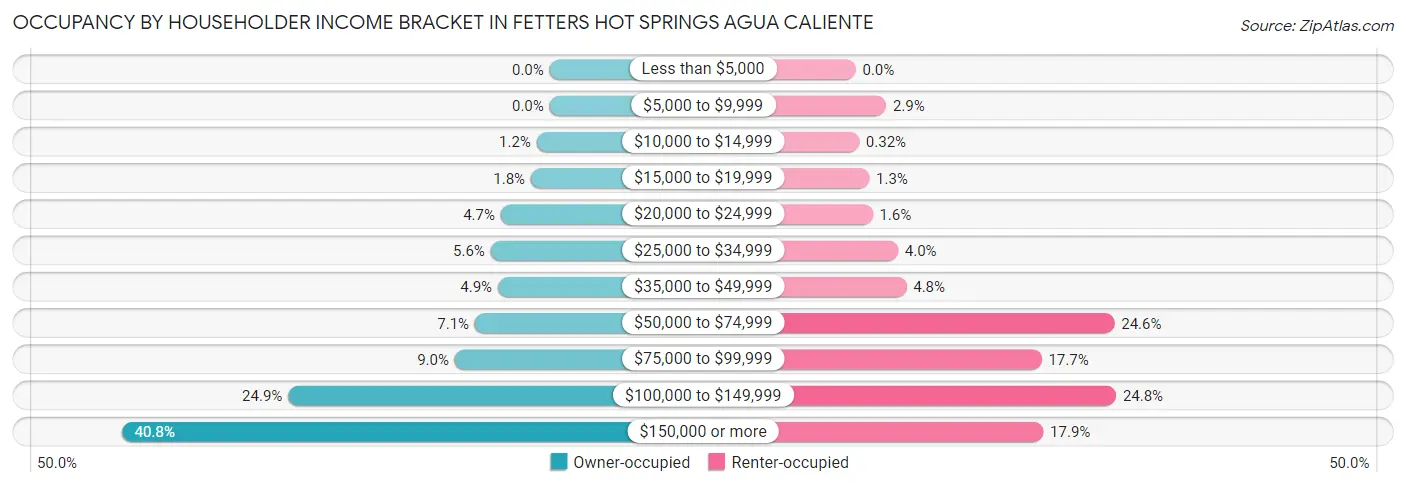
| Income Bracket | Owner-occupied | Renter-occupied |
| Less than $5,000 | 0 (0.0%) | 0 (0.0%) |
| $5,000 to $9,999 | 0 (0.0%) | 18 (2.9%) |
| $10,000 to $14,999 | 9 (1.2%) | 2 (0.3%) |
| $15,000 to $19,999 | 13 (1.8%) | 8 (1.3%) |
| $20,000 to $24,999 | 34 (4.6%) | 10 (1.6%) |
| $25,000 to $34,999 | 41 (5.6%) | 25 (4.0%) |
| $35,000 to $49,999 | 36 (4.9%) | 30 (4.8%) |
| $50,000 to $74,999 | 52 (7.1%) | 153 (24.6%) |
| $75,000 to $99,999 | 66 (9.0%) | 110 (17.7%) |
| $100,000 to $149,999 | 182 (24.9%) | 154 (24.8%) |
| $150,000 or more | 298 (40.8%) | 111 (17.9%) |
| Total | 731 (100.0%) | 621 (100.0%) |
Monthly Housing Cost Tiers in Fetters Hot Springs Agua Caliente
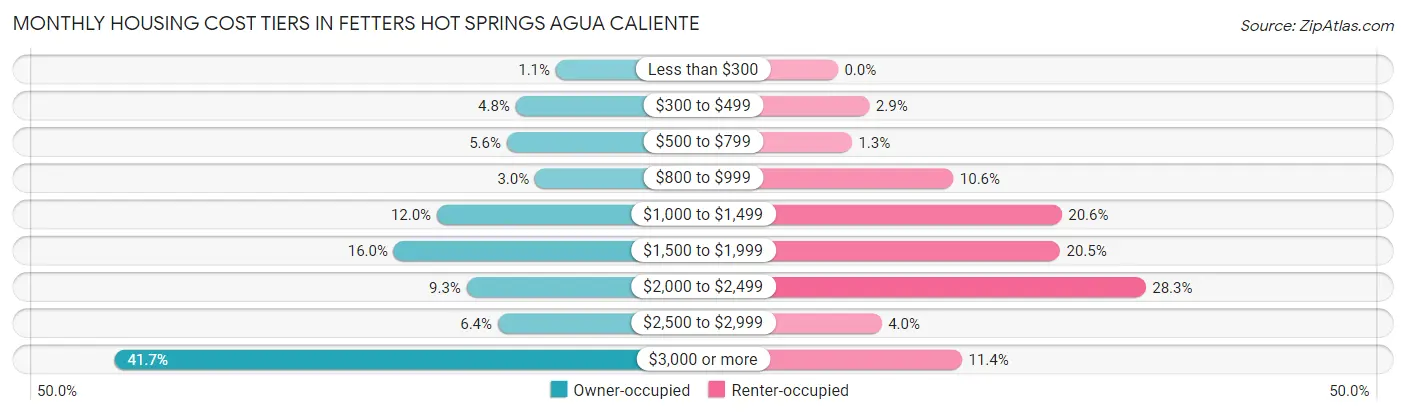
| Monthly Cost | Owner-occupied | Renter-occupied |
| Less than $300 | 8 (1.1%) | 0 (0.0%) |
| $300 to $499 | 35 (4.8%) | 18 (2.9%) |
| $500 to $799 | 41 (5.6%) | 8 (1.3%) |
| $800 to $999 | 22 (3.0%) | 66 (10.6%) |
| $1,000 to $1,499 | 88 (12.0%) | 128 (20.6%) |
| $1,500 to $1,999 | 117 (16.0%) | 127 (20.4%) |
| $2,000 to $2,499 | 68 (9.3%) | 176 (28.3%) |
| $2,500 to $2,999 | 47 (6.4%) | 25 (4.0%) |
| $3,000 or more | 305 (41.7%) | 71 (11.4%) |
| Total | 731 (100.0%) | 621 (100.0%) |
Physical Housing Characteristics in Fetters Hot Springs Agua Caliente
Housing Structures in Fetters Hot Springs Agua Caliente
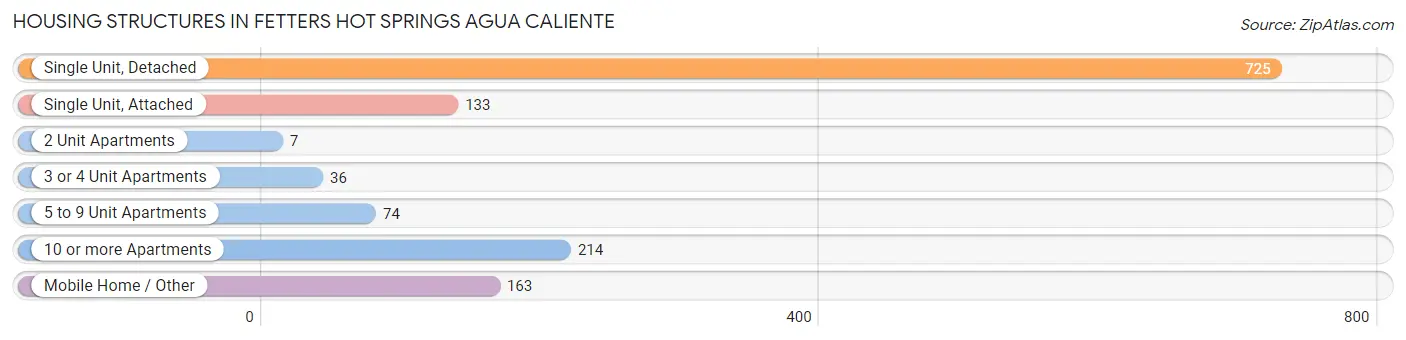
| Structure Type | # Housing Units | % Housing Units |
| Single Unit, Detached | 725 | 53.6% |
| Single Unit, Attached | 133 | 9.8% |
| 2 Unit Apartments | 7 | 0.5% |
| 3 or 4 Unit Apartments | 36 | 2.7% |
| 5 to 9 Unit Apartments | 74 | 5.5% |
| 10 or more Apartments | 214 | 15.8% |
| Mobile Home / Other | 163 | 12.1% |
| Total | 1,352 | 100.0% |
Housing Structures by Occupancy in Fetters Hot Springs Agua Caliente
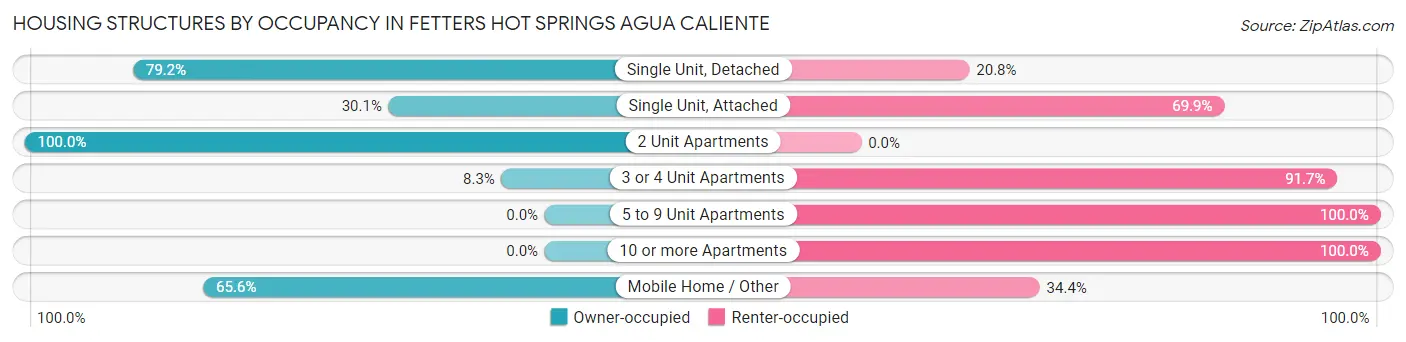
| Structure Type | Owner-occupied | Renter-occupied |
| Single Unit, Detached | 574 (79.2%) | 151 (20.8%) |
| Single Unit, Attached | 40 (30.1%) | 93 (69.9%) |
| 2 Unit Apartments | 7 (100.0%) | 0 (0.0%) |
| 3 or 4 Unit Apartments | 3 (8.3%) | 33 (91.7%) |
| 5 to 9 Unit Apartments | 0 (0.0%) | 74 (100.0%) |
| 10 or more Apartments | 0 (0.0%) | 214 (100.0%) |
| Mobile Home / Other | 107 (65.6%) | 56 (34.4%) |
| Total | 731 (54.1%) | 621 (45.9%) |
Housing Structures by Number of Rooms in Fetters Hot Springs Agua Caliente
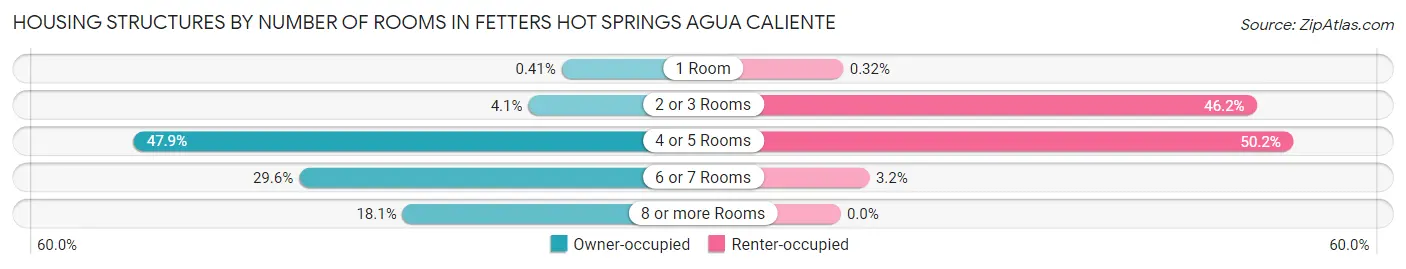
| Number of Rooms | Owner-occupied | Renter-occupied |
| 1 Room | 3 (0.4%) | 2 (0.3%) |
| 2 or 3 Rooms | 30 (4.1%) | 287 (46.2%) |
| 4 or 5 Rooms | 350 (47.9%) | 312 (50.2%) |
| 6 or 7 Rooms | 216 (29.5%) | 20 (3.2%) |
| 8 or more Rooms | 132 (18.1%) | 0 (0.0%) |
| Total | 731 (100.0%) | 621 (100.0%) |
Housing Structure by Heating Type in Fetters Hot Springs Agua Caliente
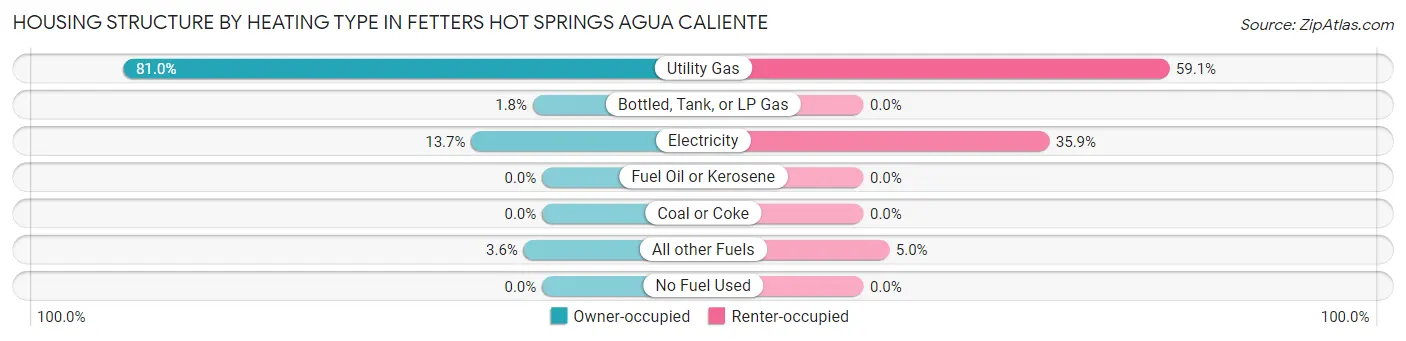
| Heating Type | Owner-occupied | Renter-occupied |
| Utility Gas | 592 (81.0%) | 367 (59.1%) |
| Bottled, Tank, or LP Gas | 13 (1.8%) | 0 (0.0%) |
| Electricity | 100 (13.7%) | 223 (35.9%) |
| Fuel Oil or Kerosene | 0 (0.0%) | 0 (0.0%) |
| Coal or Coke | 0 (0.0%) | 0 (0.0%) |
| All other Fuels | 26 (3.6%) | 31 (5.0%) |
| No Fuel Used | 0 (0.0%) | 0 (0.0%) |
| Total | 731 (100.0%) | 621 (100.0%) |
Household Vehicle Usage in Fetters Hot Springs Agua Caliente
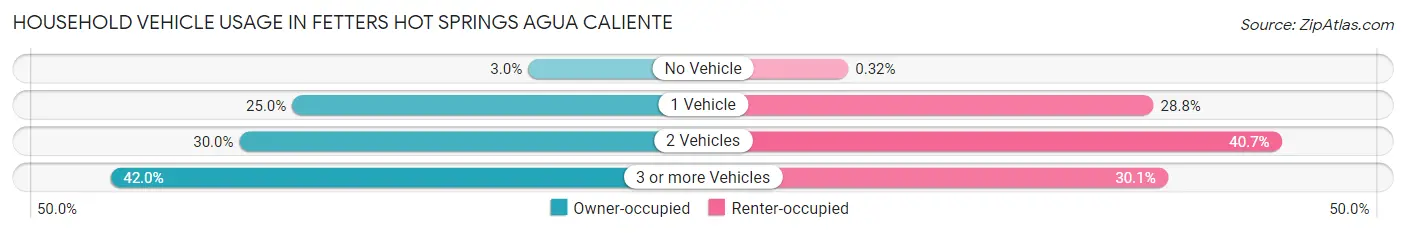
| Vehicles per Household | Owner-occupied | Renter-occupied |
| No Vehicle | 22 (3.0%) | 2 (0.3%) |
| 1 Vehicle | 183 (25.0%) | 179 (28.8%) |
| 2 Vehicles | 219 (30.0%) | 253 (40.7%) |
| 3 or more Vehicles | 307 (42.0%) | 187 (30.1%) |
| Total | 731 (100.0%) | 621 (100.0%) |
Real Estate & Mortgages in Fetters Hot Springs Agua Caliente
Real Estate and Mortgage Overview in Fetters Hot Springs Agua Caliente
| Characteristic | Without Mortgage | With Mortgage |
| Housing Units | 251 | 480 |
| Median Property Value | $547,700 | $808,200 |
| Median Household Income | $86,131 | $262 |
| Monthly Housing Costs | $1,344 | $305 |
| Real Estate Taxes | $3,548 | $0 |
Property Value by Mortgage Status in Fetters Hot Springs Agua Caliente
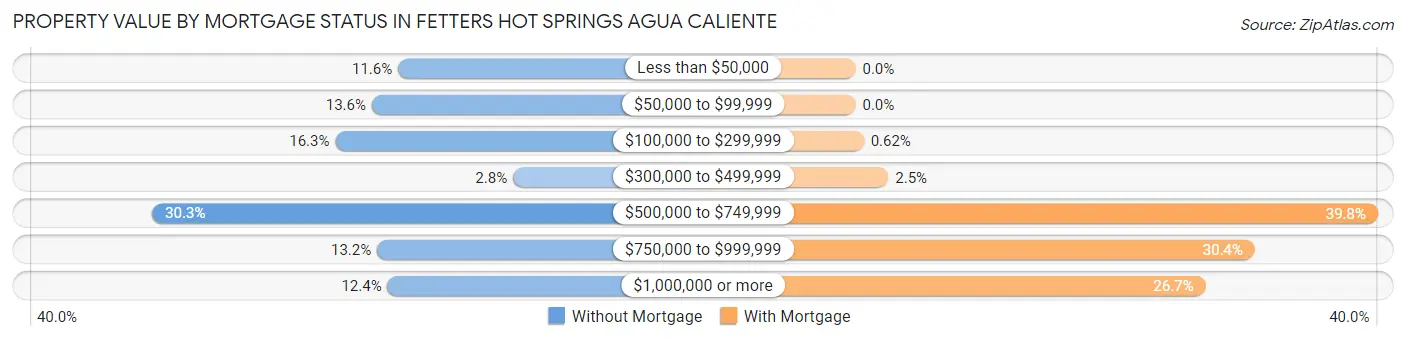
| Property Value | Without Mortgage | With Mortgage |
| Less than $50,000 | 29 (11.6%) | 0 (0.0%) |
| $50,000 to $99,999 | 34 (13.6%) | 0 (0.0%) |
| $100,000 to $299,999 | 41 (16.3%) | 3 (0.6%) |
| $300,000 to $499,999 | 7 (2.8%) | 12 (2.5%) |
| $500,000 to $749,999 | 76 (30.3%) | 191 (39.8%) |
| $750,000 to $999,999 | 33 (13.2%) | 146 (30.4%) |
| $1,000,000 or more | 31 (12.3%) | 128 (26.7%) |
| Total | 251 (100.0%) | 480 (100.0%) |
Household Income by Mortgage Status in Fetters Hot Springs Agua Caliente
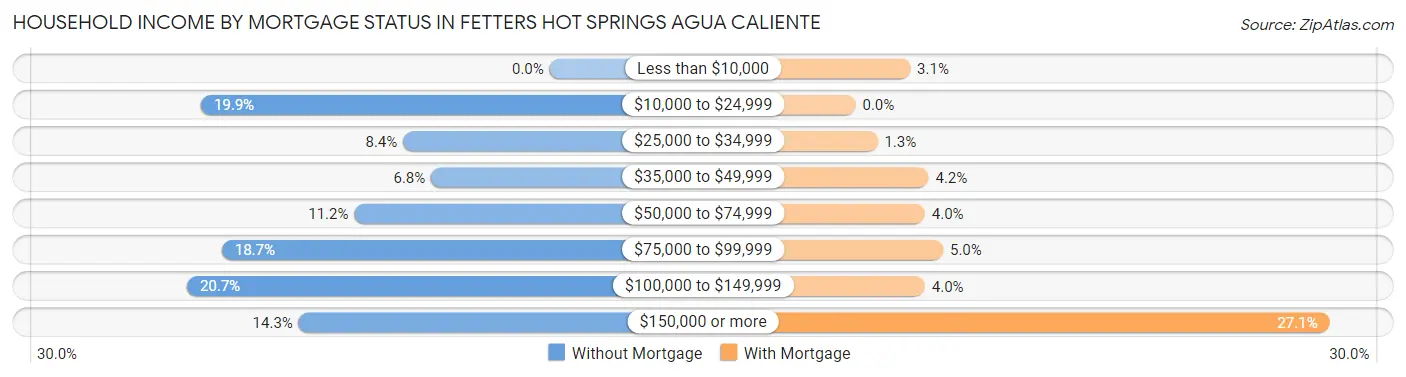
| Household Income | Without Mortgage | With Mortgage |
| Less than $10,000 | 0 (0.0%) | 15 (3.1%) |
| $10,000 to $24,999 | 50 (19.9%) | 0 (0.0%) |
| $25,000 to $34,999 | 21 (8.4%) | 6 (1.3%) |
| $35,000 to $49,999 | 17 (6.8%) | 20 (4.2%) |
| $50,000 to $74,999 | 28 (11.2%) | 19 (4.0%) |
| $75,000 to $99,999 | 47 (18.7%) | 24 (5.0%) |
| $100,000 to $149,999 | 52 (20.7%) | 19 (4.0%) |
| $150,000 or more | 36 (14.3%) | 130 (27.1%) |
| Total | 251 (100.0%) | 480 (100.0%) |
Property Value to Household Income Ratio in Fetters Hot Springs Agua Caliente

| Value-to-Income Ratio | Without Mortgage | With Mortgage |
| Less than 2.0x | 62 (24.7%) | 159,130 (33,152.1%) |
| 2.0x to 2.9x | 8 (3.2%) | 32 (6.7%) |
| 3.0x to 3.9x | 31 (12.3%) | 96 (20.0%) |
| 4.0x or more | 150 (59.8%) | 23 (4.8%) |
| Total | 251 (100.0%) | 480 (100.0%) |
Real Estate Taxes by Mortgage Status in Fetters Hot Springs Agua Caliente

| Property Taxes | Without Mortgage | With Mortgage |
| Less than $800 | 72 (28.7%) | 0 (0.0%) |
| $800 to $1,499 | 0 (0.0%) | 23 (4.8%) |
| $800 to $1,499 | 124 (49.4%) | 7 (1.5%) |
| Total | 251 (100.0%) | 480 (100.0%) |
Health & Disability in Fetters Hot Springs Agua Caliente
Health Insurance Coverage by Age in Fetters Hot Springs Agua Caliente
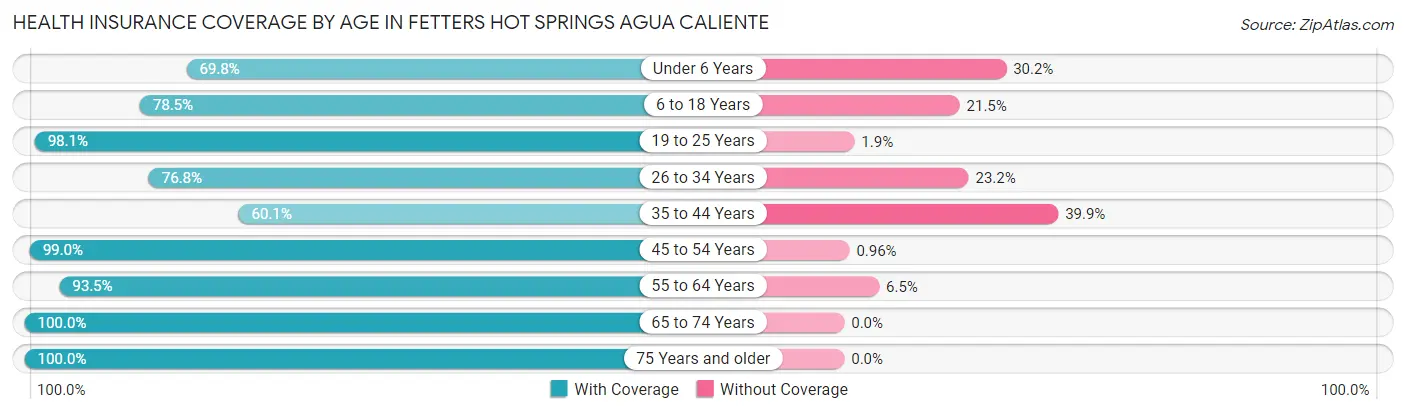
| Age Bracket | With Coverage | Without Coverage |
| Under 6 Years | 289 (69.8%) | 125 (30.2%) |
| 6 to 18 Years | 493 (78.5%) | 135 (21.5%) |
| 19 to 25 Years | 467 (98.1%) | 9 (1.9%) |
| 26 to 34 Years | 398 (76.8%) | 120 (23.2%) |
| 35 to 44 Years | 342 (60.1%) | 227 (39.9%) |
| 45 to 54 Years | 621 (99.0%) | 6 (1.0%) |
| 55 to 64 Years | 533 (93.5%) | 37 (6.5%) |
| 65 to 74 Years | 282 (100.0%) | 0 (0.0%) |
| 75 Years and older | 140 (100.0%) | 0 (0.0%) |
| Total | 3,565 (84.4%) | 659 (15.6%) |
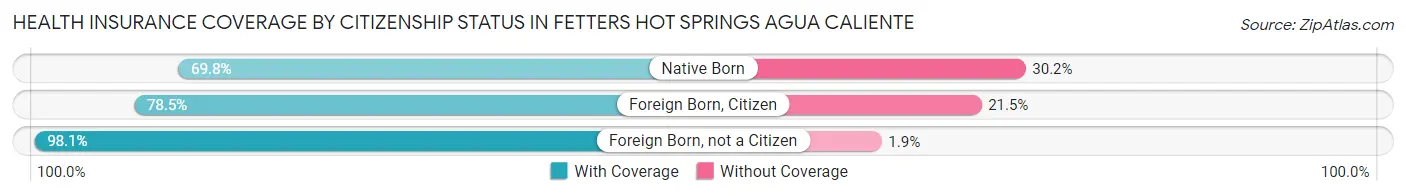
Health Insurance Coverage by Citizenship Status in Fetters Hot Springs Agua Caliente
| Citizenship Status | With Coverage | Without Coverage |
| Native Born | 289 (69.8%) | 125 (30.2%) |
| Foreign Born, Citizen | 493 (78.5%) | 135 (21.5%) |
| Foreign Born, not a Citizen | 467 (98.1%) | 9 (1.9%) |
Health Insurance Coverage by Household Income in Fetters Hot Springs Agua Caliente

| Household Income | With Coverage | Without Coverage |
| Under $25,000 | 103 (92.8%) | 8 (7.2%) |
| $25,000 to $49,999 | 309 (97.2%) | 9 (2.8%) |
| $50,000 to $74,999 | 669 (93.8%) | 44 (6.2%) |
| $75,000 to $99,999 | 589 (95.8%) | 26 (4.2%) |
| $100,000 and over | 1,827 (76.2%) | 572 (23.8%) |
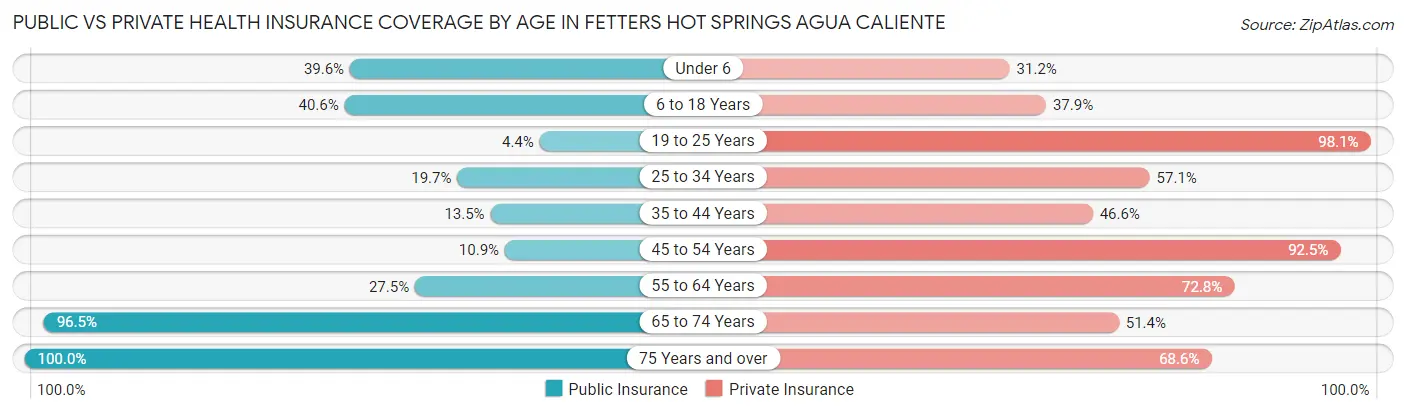
Public vs Private Health Insurance Coverage by Age in Fetters Hot Springs Agua Caliente
| Age Bracket | Public Insurance | Private Insurance |
| Under 6 | 164 (39.6%) | 129 (31.2%) |
| 6 to 18 Years | 255 (40.6%) | 238 (37.9%) |
| 19 to 25 Years | 21 (4.4%) | 467 (98.1%) |
| 25 to 34 Years | 102 (19.7%) | 296 (57.1%) |
| 35 to 44 Years | 77 (13.5%) | 265 (46.6%) |
| 45 to 54 Years | 68 (10.8%) | 580 (92.5%) |
| 55 to 64 Years | 157 (27.5%) | 415 (72.8%) |
| 65 to 74 Years | 272 (96.5%) | 145 (51.4%) |
| 75 Years and over | 140 (100.0%) | 96 (68.6%) |
| Total | 1,256 (29.7%) | 2,631 (62.3%) |
Disability Status by Sex by Age in Fetters Hot Springs Agua Caliente

| Age Bracket | Male | Female |
| Under 5 Years | 0 (0.0%) | 0 (0.0%) |
| 5 to 17 Years | 0 (0.0%) | 33 (7.3%) |
| 18 to 34 Years | 32 (6.5%) | 13 (2.4%) |
| 35 to 64 Years | 36 (4.1%) | 64 (7.2%) |
| 65 to 74 Years | 7 (4.1%) | 12 (10.8%) |
| 75 Years and over | 47 (50.0%) | 22 (47.8%) |
Disability Class by Sex by Age in Fetters Hot Springs Agua Caliente
Disability Class: Hearing Difficulty
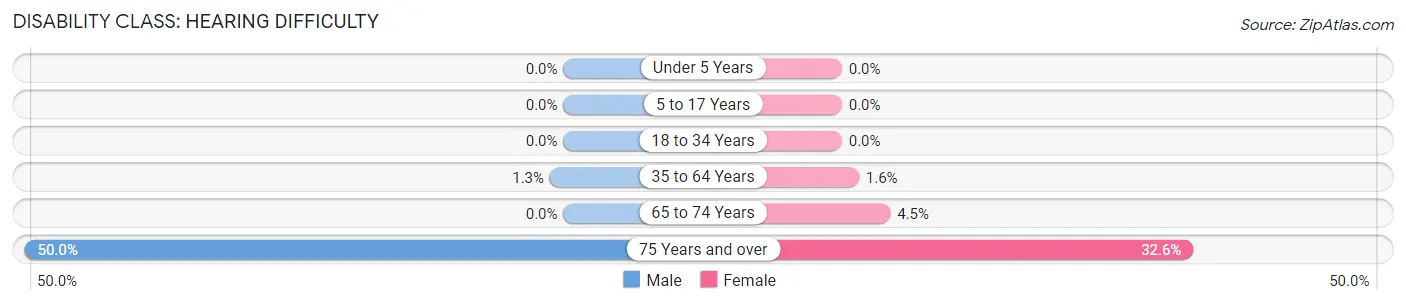
| Age Bracket | Male | Female |
| Under 5 Years | 0 (0.0%) | 0 (0.0%) |
| 5 to 17 Years | 0 (0.0%) | 0 (0.0%) |
| 18 to 34 Years | 0 (0.0%) | 0 (0.0%) |
| 35 to 64 Years | 11 (1.3%) | 14 (1.6%) |
| 65 to 74 Years | 0 (0.0%) | 5 (4.5%) |
| 75 Years and over | 47 (50.0%) | 15 (32.6%) |
Disability Class: Vision Difficulty
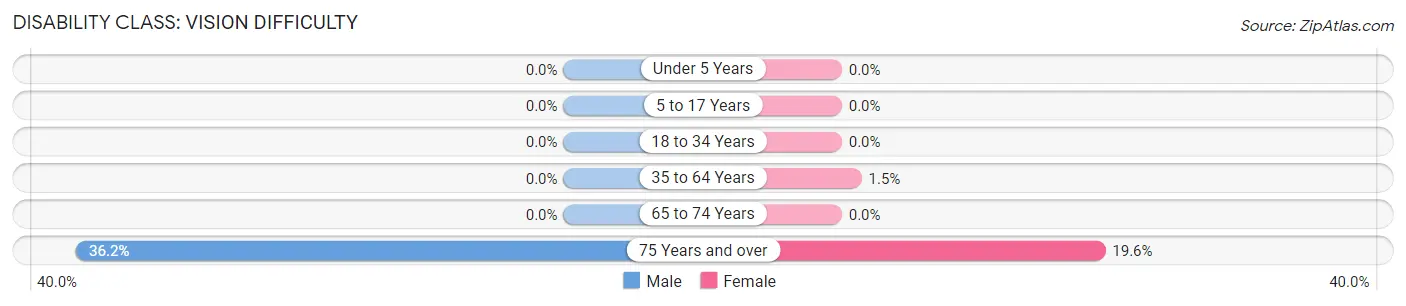
| Age Bracket | Male | Female |
| Under 5 Years | 0 (0.0%) | 0 (0.0%) |
| 5 to 17 Years | 0 (0.0%) | 0 (0.0%) |
| 18 to 34 Years | 0 (0.0%) | 0 (0.0%) |
| 35 to 64 Years | 0 (0.0%) | 13 (1.5%) |
| 65 to 74 Years | 0 (0.0%) | 0 (0.0%) |
| 75 Years and over | 34 (36.2%) | 9 (19.6%) |
Disability Class: Cognitive Difficulty
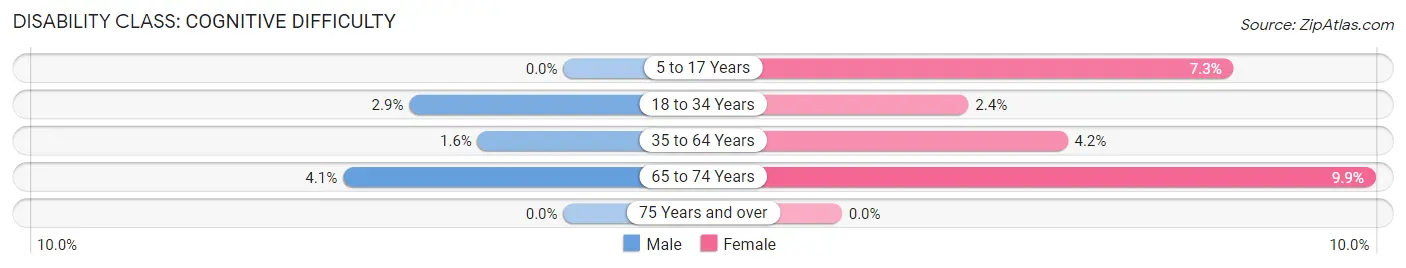
| Age Bracket | Male | Female |
| 5 to 17 Years | 0 (0.0%) | 33 (7.3%) |
| 18 to 34 Years | 14 (2.9%) | 13 (2.4%) |
| 35 to 64 Years | 14 (1.6%) | 37 (4.2%) |
| 65 to 74 Years | 7 (4.1%) | 11 (9.9%) |
| 75 Years and over | 0 (0.0%) | 0 (0.0%) |
Disability Class: Ambulatory Difficulty
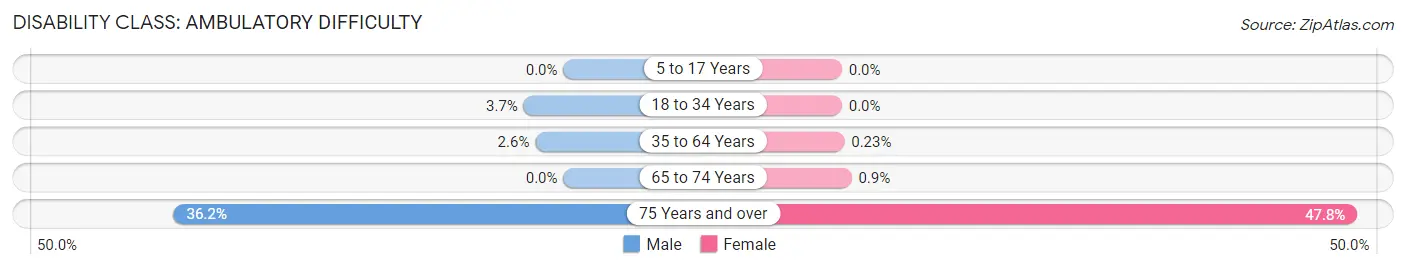
| Age Bracket | Male | Female |
| 5 to 17 Years | 0 (0.0%) | 0 (0.0%) |
| 18 to 34 Years | 18 (3.7%) | 0 (0.0%) |
| 35 to 64 Years | 23 (2.6%) | 2 (0.2%) |
| 65 to 74 Years | 0 (0.0%) | 1 (0.9%) |
| 75 Years and over | 34 (36.2%) | 22 (47.8%) |
Disability Class: Self-Care Difficulty
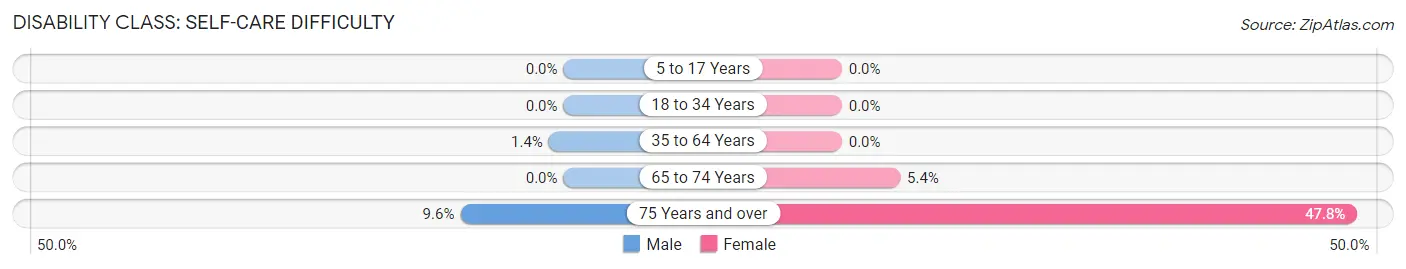
| Age Bracket | Male | Female |
| 5 to 17 Years | 0 (0.0%) | 0 (0.0%) |
| 18 to 34 Years | 0 (0.0%) | 0 (0.0%) |
| 35 to 64 Years | 12 (1.4%) | 0 (0.0%) |
| 65 to 74 Years | 0 (0.0%) | 6 (5.4%) |
| 75 Years and over | 9 (9.6%) | 22 (47.8%) |
Technology Access in Fetters Hot Springs Agua Caliente
Computing Device Access in Fetters Hot Springs Agua Caliente
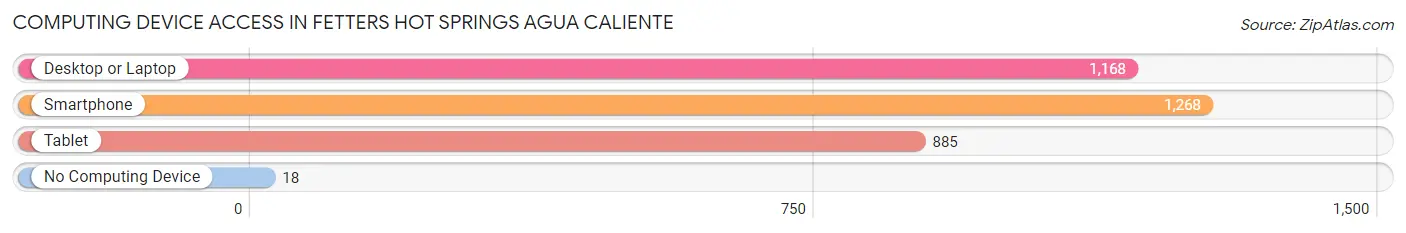
| Device Type | # Households | % Households |
| Desktop or Laptop | 1,168 | 86.4% |
| Smartphone | 1,268 | 93.8% |
| Tablet | 885 | 65.5% |
| No Computing Device | 18 | 1.3% |
| Total | 1,352 | 100.0% |
Internet Access in Fetters Hot Springs Agua Caliente
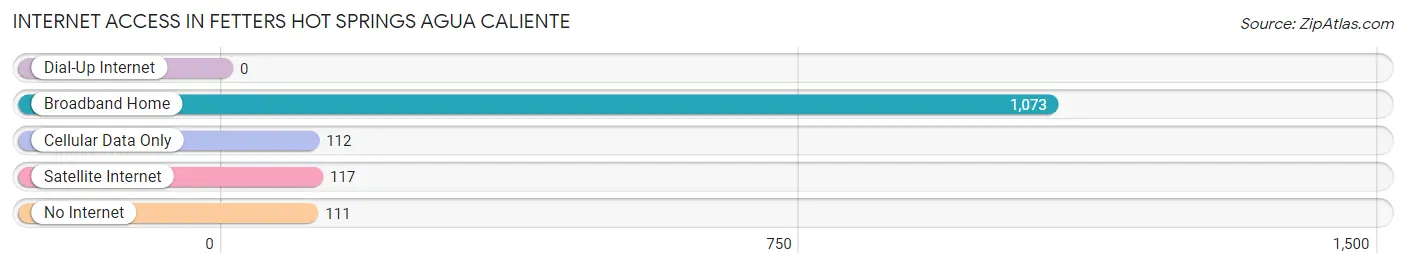
| Internet Type | # Households | % Households |
| Dial-Up Internet | 0 | 0.0% |
| Broadband Home | 1,073 | 79.4% |
| Cellular Data Only | 112 | 8.3% |
| Satellite Internet | 117 | 8.6% |
| No Internet | 111 | 8.2% |
| Total | 1,352 | 100.0% |
Fetters Hot Springs Agua Caliente Summary
Fetters Hot Springs Agua Caliente, CA is a small unincorporated community located in Sonoma County, California. It is situated in the Russian River Valley, approximately 10 miles north of Santa Rosa. The community is named after the hot springs located in the area, which were discovered by the Fetters family in the late 1800s.
History
The Fetters Hot Springs Agua Caliente area has a long and varied history. The area was originally inhabited by the Pomo people, who lived in the area for thousands of years before the arrival of Europeans. The first Europeans to settle in the area were Russian fur traders, who arrived in the early 1800s. The area was then settled by the Fetters family in the late 1800s. The family discovered the hot springs in the area and began to develop the area as a resort. The resort was popular with visitors from San Francisco and other nearby cities.
In the early 1900s, the area was developed further by the Fetters family, who built a hotel, a bathhouse, and other amenities. The area was also used for farming and ranching. In the 1920s, the area was developed further with the construction of a golf course and a swimming pool.
In the 1950s, the area was developed further with the construction of a shopping center and a movie theater. The area was also used for camping and other recreational activities.
Geography
Fetters Hot Springs Agua Caliente is located in the Russian River Valley, approximately 10 miles north of Santa Rosa. The area is characterized by rolling hills and valleys, with the Russian River running through the area. The area is also home to a variety of wildlife, including deer, foxes, and other animals.
The climate in the area is mild, with temperatures ranging from the mid-50s to the mid-70s in the summer months. The area receives an average of 20 inches of rain per year.
Economy
The economy of Fetters Hot Springs Agua Caliente is largely based on tourism. The area is home to a variety of attractions, including the hot springs, the golf course, and the shopping center. The area is also home to a variety of wineries, restaurants, and other businesses.
Demographics
As of the 2010 census, the population of Fetters Hot Springs Agua Caliente was 1,845. The population is largely white (90.2%), with a small percentage of Hispanic or Latino residents (4.2%). The median household income in the area is $63,750, and the median home value is $541,000. The area is largely rural, with a population density of only 8.3 people per square mile.
Common Questions
What is the Total Population of Fetters Hot Springs Agua Caliente?
Total Population of Fetters Hot Springs Agua Caliente is 4,224.
What is the Total Male Population of Fetters Hot Springs Agua Caliente?
Total Male Population of Fetters Hot Springs Agua Caliente is 2,043.
What is the Total Female Population of Fetters Hot Springs Agua Caliente?
Total Female Population of Fetters Hot Springs Agua Caliente is 2,181.
What is the Ratio of Males per 100 Females in Fetters Hot Springs Agua Caliente?
There are 93.67 Males per 100 Females in Fetters Hot Springs Agua Caliente.
What is the Ratio of Females per 100 Males in Fetters Hot Springs Agua Caliente?
There are 106.75 Females per 100 Males in Fetters Hot Springs Agua Caliente.
What is the Median Population Age in Fetters Hot Springs Agua Caliente?
Median Population Age in Fetters Hot Springs Agua Caliente is 35.6 Years.
What is the Average Family Size in Fetters Hot Springs Agua Caliente
Average Family Size in Fetters Hot Springs Agua Caliente is 3.7 People.
What is the Average Household Size in Fetters Hot Springs Agua Caliente
Average Household Size in Fetters Hot Springs Agua Caliente is 3.1 People.
What is Per Capita Income in Fetters Hot Springs Agua Caliente?
Per Capita income in Fetters Hot Springs Agua Caliente is $46,044.
What is the Median Family Income in Fetters Hot Springs Agua Caliente?
Median Family Income in Fetters Hot Springs Agua Caliente is $103,500.
What is the Median Household income in Fetters Hot Springs Agua Caliente?
Median Household Income in Fetters Hot Springs Agua Caliente is $110,577.
What is Income or Wage Gap in Fetters Hot Springs Agua Caliente?
Income or Wage Gap in Fetters Hot Springs Agua Caliente is 32.3%.
Women in Fetters Hot Springs Agua Caliente earn 67.7 cents for every dollar earned by a man.
What is Inequality or Gini Index in Fetters Hot Springs Agua Caliente?
Inequality or Gini Index in Fetters Hot Springs Agua Caliente is 0.43.
How Large is the Labor Force in Fetters Hot Springs Agua Caliente?
There are 2,359 People in the Labor Forcein in Fetters Hot Springs Agua Caliente.
What is the Percentage of People in the Labor Force in Fetters Hot Springs Agua Caliente?
72.0% of People are in the Labor Force in Fetters Hot Springs Agua Caliente.
What is the Unemployment Rate in Fetters Hot Springs Agua Caliente?
Unemployment Rate in Fetters Hot Springs Agua Caliente is 2.7%.