Empire, CA
Empire Map
Empire Overview
3,726
TOTAL POPULATION
1,924
MALE POPULATION
1,802
FEMALE POPULATION
106.77
MALES / 100 FEMALES
93.66
FEMALES / 100 MALES
38.0
MEDIAN AGE
3.3
AVG FAMILY SIZE
3.0
AVG HOUSEHOLD SIZE
$20,527
PER CAPITA INCOME
$48,554
AVG FAMILY INCOME
$45,769
AVG HOUSEHOLD INCOME
28.6%
WAGE / INCOME GAP [ % ]
71.4¢/ $1
WAGE / INCOME GAP [ $ ]
0.45
INEQUALITY / GINI INDEX
1,609
LABOR FORCE [ PEOPLE ]
53.5%
PERCENT IN LABOR FORCE
13.9%
UNEMPLOYMENT RATE
Empire Zip Codes
Empire Area Codes
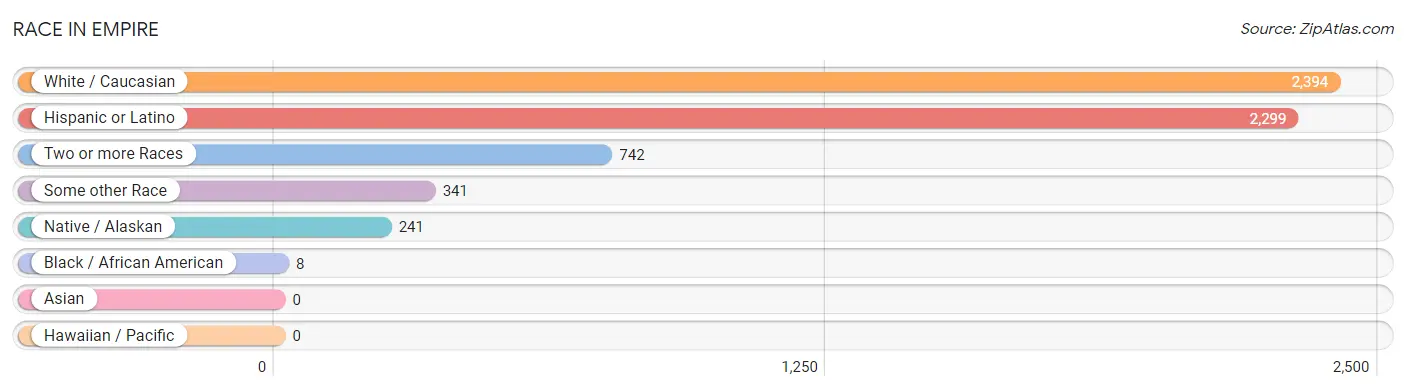
Race in Empire
The most populous races in Empire are White / Caucasian (2,394 | 64.2%), Hispanic or Latino (2,299 | 61.7%), and Two or more Races (742 | 19.9%).
| Race | # Population | % Population |
| Asian | 0 | 0.0% |
| Black / African American | 8 | 0.2% |
| Hawaiian / Pacific | 0 | 0.0% |
| Hispanic or Latino | 2,299 | 61.7% |
| Native / Alaskan | 241 | 6.5% |
| White / Caucasian | 2,394 | 64.2% |
| Two or more Races | 742 | 19.9% |
| Some other Race | 341 | 9.1% |
| Total | 3,726 | 100.0% |
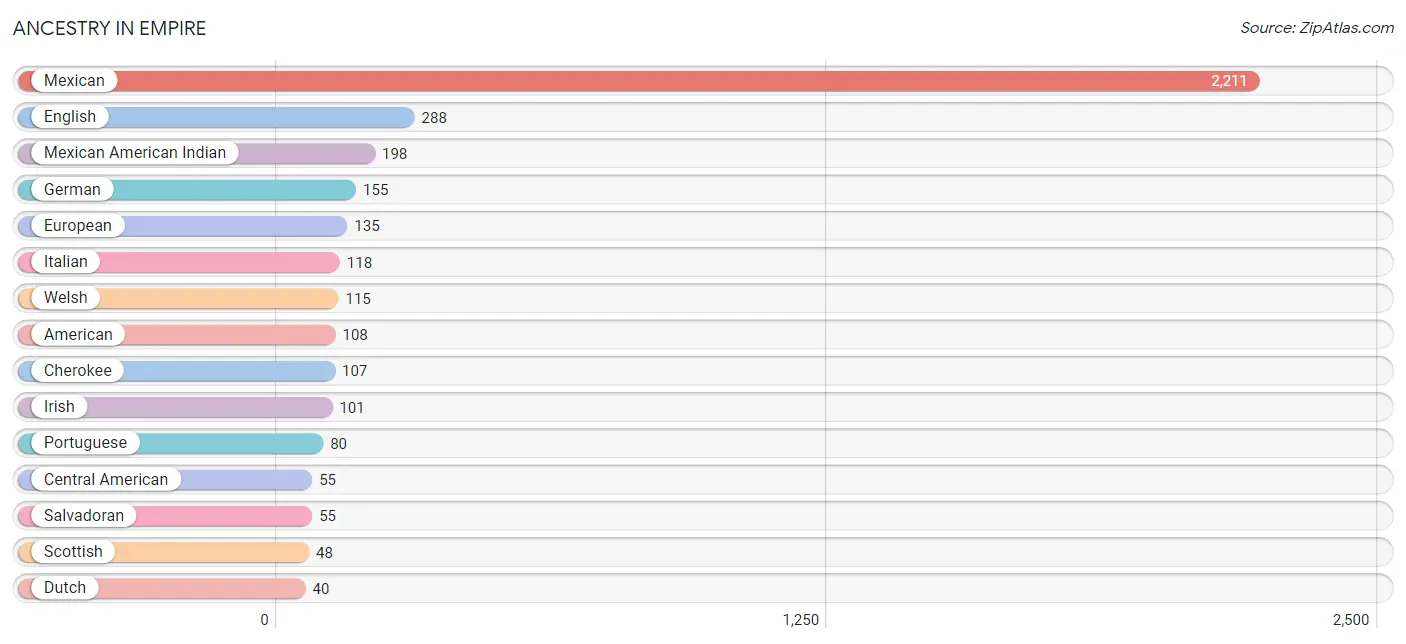
Ancestry in Empire
The most populous ancestries reported in Empire are Mexican (2,211 | 59.3%), English (288 | 7.7%), Mexican American Indian (198 | 5.3%), German (155 | 4.2%), and European (135 | 3.6%), together accounting for 80.2% of all Empire residents.
| Ancestry | # Population | % Population |
| American | 108 | 2.9% |
| British | 15 | 0.4% |
| Central American | 55 | 1.5% |
| Cherokee | 107 | 2.9% |
| Choctaw | 34 | 0.9% |
| Dutch | 40 | 1.1% |
| English | 288 | 7.7% |
| European | 135 | 3.6% |
| French Canadian | 9 | 0.2% |
| German | 155 | 4.2% |
| Irish | 101 | 2.7% |
| Italian | 118 | 3.2% |
| Korean | 26 | 0.7% |
| Mexican | 2,211 | 59.3% |
| Mexican American Indian | 198 | 5.3% |
| Portuguese | 80 | 2.1% |
| Puerto Rican | 29 | 0.8% |
| Salvadoran | 55 | 1.5% |
| Scotch-Irish | 9 | 0.2% |
| Scottish | 48 | 1.3% |
| Welsh | 115 | 3.1% | View All 21 Rows |
Immigrants in Empire
The most numerous immigrant groups reported in Empire came from Central America (714 | 19.2%), Latin America (714 | 19.2%), Mexico (674 | 18.1%), El Salvador (40 | 1.1%), and Europe (37 | 1.0%), together accounting for 58.5% of all Empire residents.

| Immigration Origin | # Population | % Population |
| Australia | 24 | 0.6% |
| Central America | 714 | 19.2% |
| El Salvador | 40 | 1.1% |
| Europe | 37 | 1.0% |
| Latin America | 714 | 19.2% |
| Mexico | 674 | 18.1% |
| Oceania | 24 | 0.6% |
| Portugal | 37 | 1.0% |
| Southern Europe | 37 | 1.0% | View All 9 Rows |
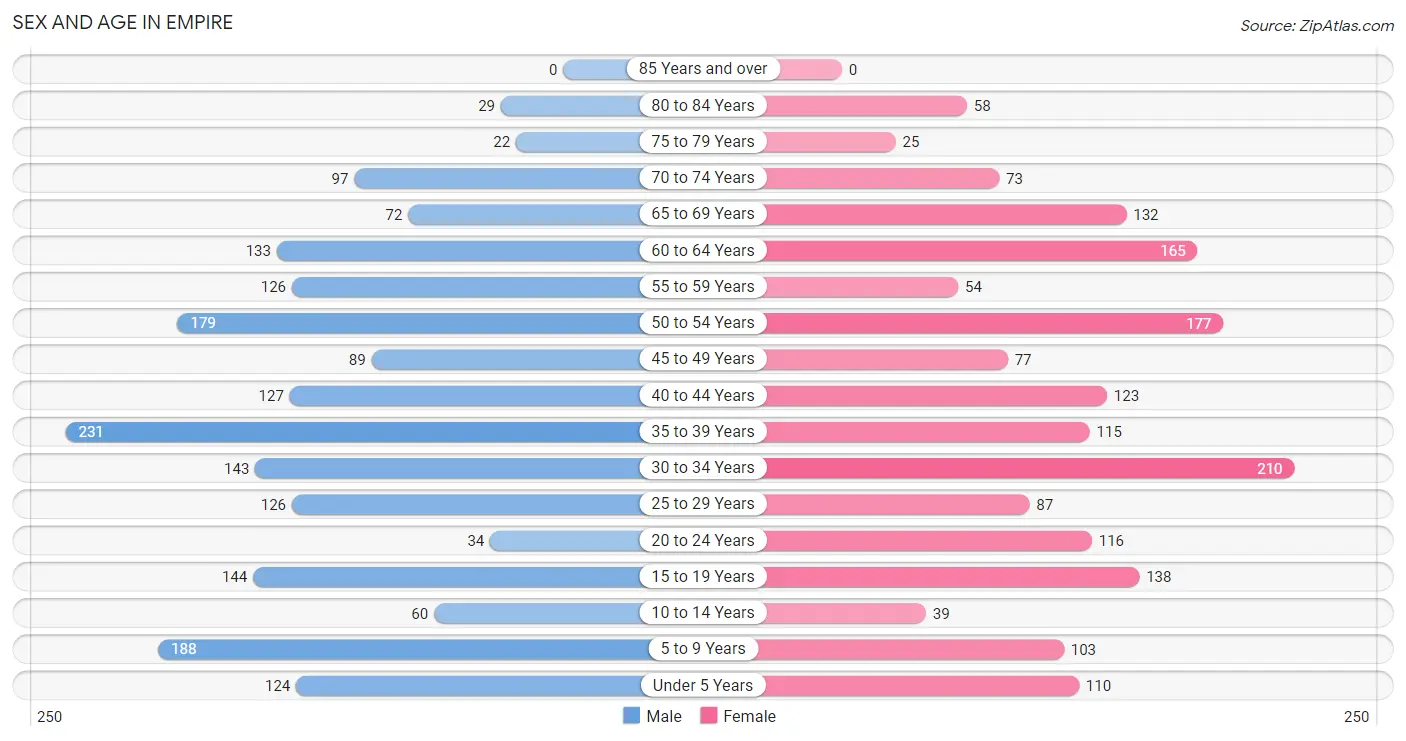
Sex and Age in Empire
Sex and Age in Empire
The most populous age groups in Empire are 35 to 39 Years (231 | 12.0%) for men and 30 to 34 Years (210 | 11.7%) for women.
| Age Bracket | Male | Female |
| Under 5 Years | 124 (6.4%) | 110 (6.1%) |
| 5 to 9 Years | 188 (9.8%) | 103 (5.7%) |
| 10 to 14 Years | 60 (3.1%) | 39 (2.2%) |
| 15 to 19 Years | 144 (7.5%) | 138 (7.7%) |
| 20 to 24 Years | 34 (1.8%) | 116 (6.4%) |
| 25 to 29 Years | 126 (6.6%) | 87 (4.8%) |
| 30 to 34 Years | 143 (7.4%) | 210 (11.7%) |
| 35 to 39 Years | 231 (12.0%) | 115 (6.4%) |
| 40 to 44 Years | 127 (6.6%) | 123 (6.8%) |
| 45 to 49 Years | 89 (4.6%) | 77 (4.3%) |
| 50 to 54 Years | 179 (9.3%) | 177 (9.8%) |
| 55 to 59 Years | 126 (6.6%) | 54 (3.0%) |
| 60 to 64 Years | 133 (6.9%) | 165 (9.2%) |
| 65 to 69 Years | 72 (3.7%) | 132 (7.3%) |
| 70 to 74 Years | 97 (5.0%) | 73 (4.1%) |
| 75 to 79 Years | 22 (1.1%) | 25 (1.4%) |
| 80 to 84 Years | 29 (1.5%) | 58 (3.2%) |
| 85 Years and over | 0 (0.0%) | 0 (0.0%) |
| Total | 1,924 (100.0%) | 1,802 (100.0%) |
Families and Households in Empire
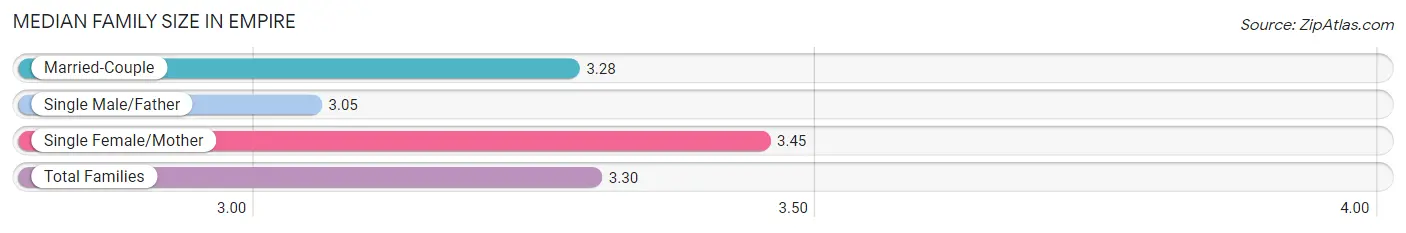
Median Family Size in Empire
The median family size in Empire is 3.30 persons per family, with single female/mother families (271 | 28.6%) accounting for the largest median family size of 3.45 persons per family. On the other hand, single male/father families (106 | 11.2%) represent the smallest median family size with 3.05 persons per family.
| Family Type | # Families | Family Size |
| Married-Couple | 570 (60.2%) | 3.28 |
| Single Male/Father | 106 (11.2%) | 3.05 |
| Single Female/Mother | 271 (28.6%) | 3.45 |
| Total Families | 947 (100.0%) | 3.30 |
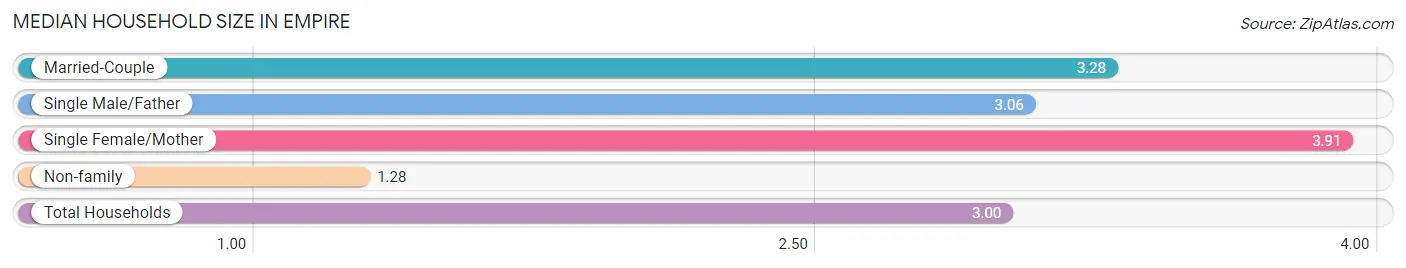
Median Household Size in Empire
The median household size in Empire is 3.00 persons per household, with single female/mother households (271 | 22.9%) accounting for the largest median household size of 3.91 persons per household. non-family households (239 | 20.2%) represent the smallest median household size with 1.28 persons per household.
| Household Type | # Households | Household Size |
| Married-Couple | 570 (48.1%) | 3.28 |
| Single Male/Father | 106 (8.9%) | 3.06 |
| Single Female/Mother | 271 (22.9%) | 3.91 |
| Non-family | 239 (20.2%) | 1.28 |
| Total Households | 1,186 (100.0%) | 3.00 |
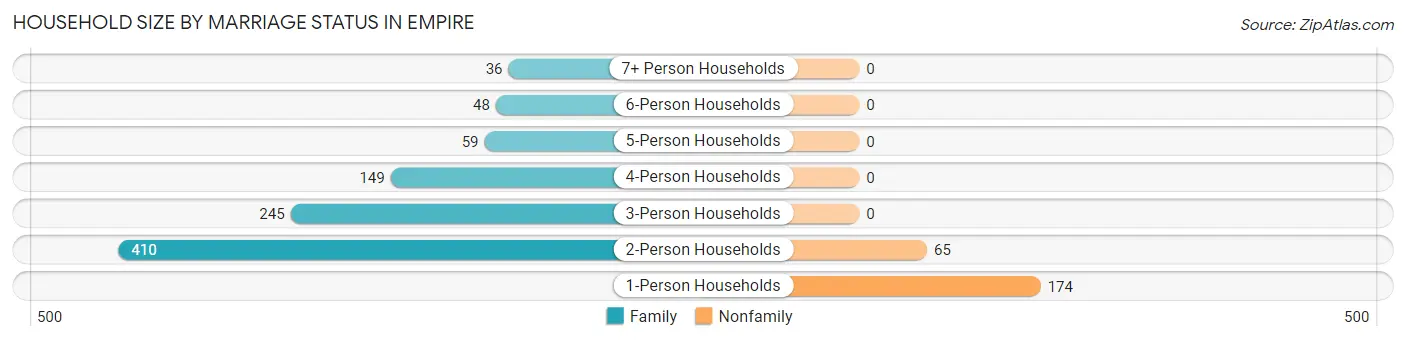
Household Size by Marriage Status in Empire
Out of a total of 1,186 households in Empire, 947 (79.8%) are family households, while 239 (20.2%) are nonfamily households. The most numerous type of family households are 2-person households, comprising 410, and the most common type of nonfamily households are 1-person households, comprising 174.
| Household Size | Family Households | Nonfamily Households |
| 1-Person Households | - | 174 (14.7%) |
| 2-Person Households | 410 (34.6%) | 65 (5.5%) |
| 3-Person Households | 245 (20.7%) | 0 (0.0%) |
| 4-Person Households | 149 (12.6%) | 0 (0.0%) |
| 5-Person Households | 59 (5.0%) | 0 (0.0%) |
| 6-Person Households | 48 (4.1%) | 0 (0.0%) |
| 7+ Person Households | 36 (3.0%) | 0 (0.0%) |
| Total | 947 (79.8%) | 239 (20.2%) |
Female Fertility in Empire
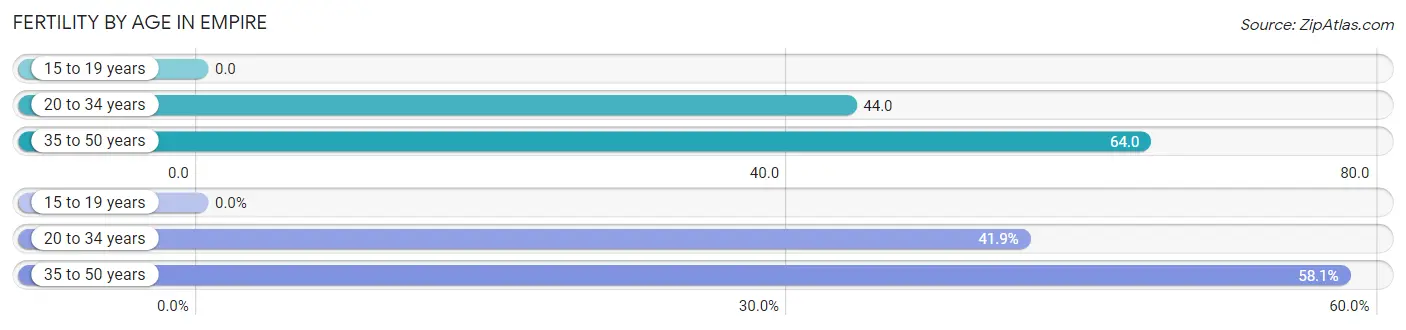
Fertility by Age in Empire
Average fertility rate in Empire is 46.0 births per 1,000 women. Women in the age bracket of 35 to 50 years have the highest fertility rate with 64.0 births per 1,000 women. Women in the age bracket of 35 to 50 years acount for 58.1% of all women with births.
| Age Bracket | Women with Births | Births / 1,000 Women |
| 15 to 19 years | 0 (0.0%) | 0.0 |
| 20 to 34 years | 18 (41.9%) | 44.0 |
| 35 to 50 years | 25 (58.1%) | 64.0 |
| Total | 43 (100.0%) | 46.0 |
Fertility by Age by Marriage Status in Empire
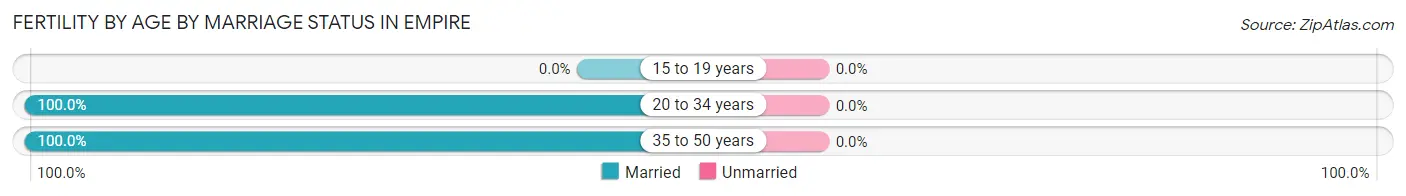
| Age Bracket | Married | Unmarried |
| 15 to 19 years | 0 (0.0%) | 0 (0.0%) |
| 20 to 34 years | 18 (100.0%) | 0 (0.0%) |
| 35 to 50 years | 25 (100.0%) | 0 (0.0%) |
| Total | 43 (100.0%) | 0 (0.0%) |
Fertility by Education in Empire
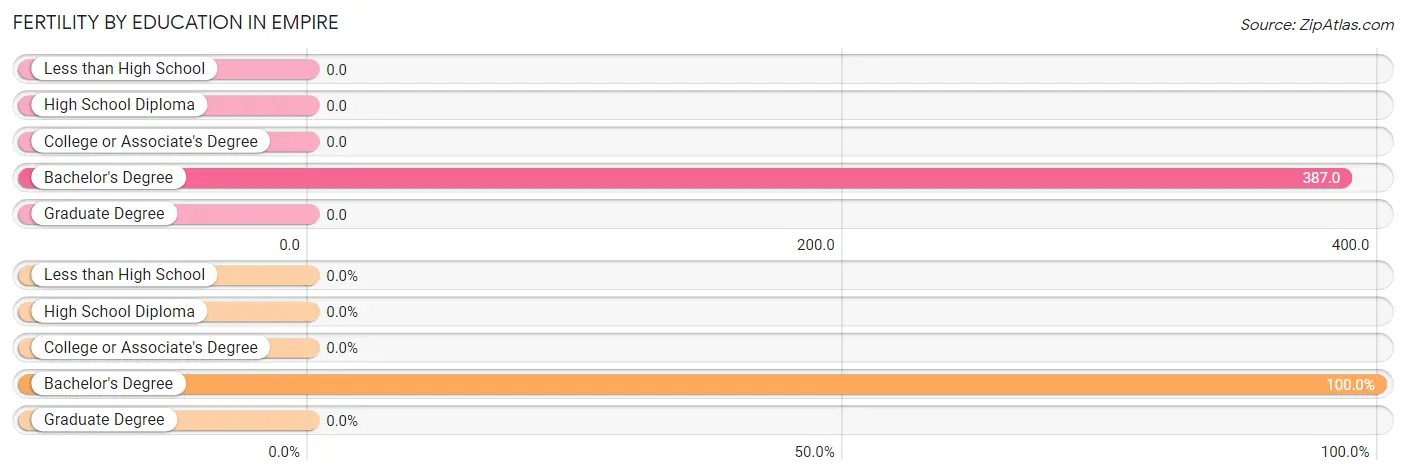
| Educational Attainment | Women with Births | Births / 1,000 Women |
| Less than High School | 0 (0.0%) | 0.0 |
| High School Diploma | 0 (0.0%) | 0.0 |
| College or Associate's Degree | 0 (0.0%) | 0.0 |
| Bachelor's Degree | 43 (100.0%) | 387.0 |
| Graduate Degree | 0 (0.0%) | 0.0 |
| Total | 43 (100.0%) | 46.0 |
Fertility by Education by Marriage Status in Empire
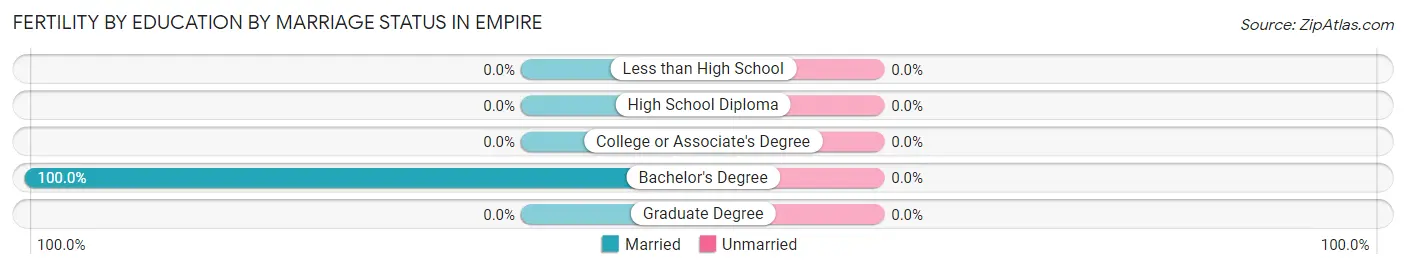
| Educational Attainment | Married | Unmarried |
| Less than High School | 0 (0.0%) | 0 (0.0%) |
| High School Diploma | 0 (0.0%) | 0 (0.0%) |
| College or Associate's Degree | 0 (0.0%) | 0 (0.0%) |
| Bachelor's Degree | 43 (100.0%) | 0 (0.0%) |
| Graduate Degree | 0 (0.0%) | 0 (0.0%) |
| Total | 43 (100.0%) | 0 (0.0%) |
Income in Empire
Income Overview in Empire
Per Capita Income in Empire is $20,527, while median incomes of families and households are $48,554 and $45,769 respectively.
| Characteristic | Number | Measure |
| Per Capita Income | 3,726 | $20,527 |
| Median Family Income | 947 | $48,554 |
| Mean Family Income | 947 | $63,374 |
| Median Household Income | 1,186 | $45,769 |
| Mean Household Income | 1,186 | $59,561 |
| Income Deficit | 947 | $0 |
| Wage / Income Gap (%) | 3,726 | 28.58% |
| Wage / Income Gap ($) | 3,726 | 71.42¢ per $1 |
| Gini / Inequality Index | 3,726 | 0.45 |
Earnings by Sex in Empire
Average Earnings in Empire are $30,556, $35,444 for men and $25,313 for women, a difference of 28.6%.
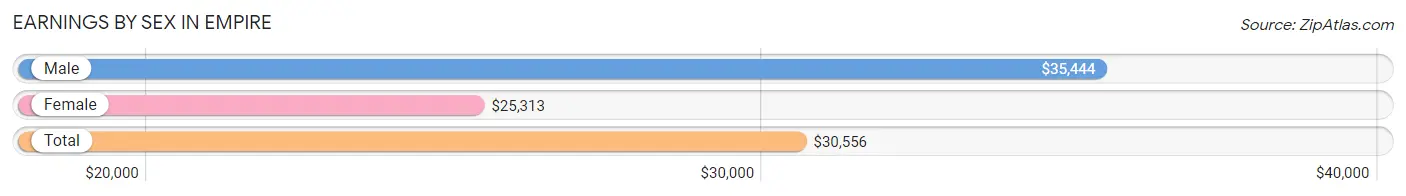
| Sex | Number | Average Earnings |
| Male | 932 (61.3%) | $35,444 |
| Female | 588 (38.7%) | $25,313 |
| Total | 1,520 (100.0%) | $30,556 |
Earnings by Sex by Income Bracket in Empire
The most common earnings brackets in Empire are $100,000+ for men (149 | 16.0%) and $30,000 to $34,999 for women (87 | 14.8%).
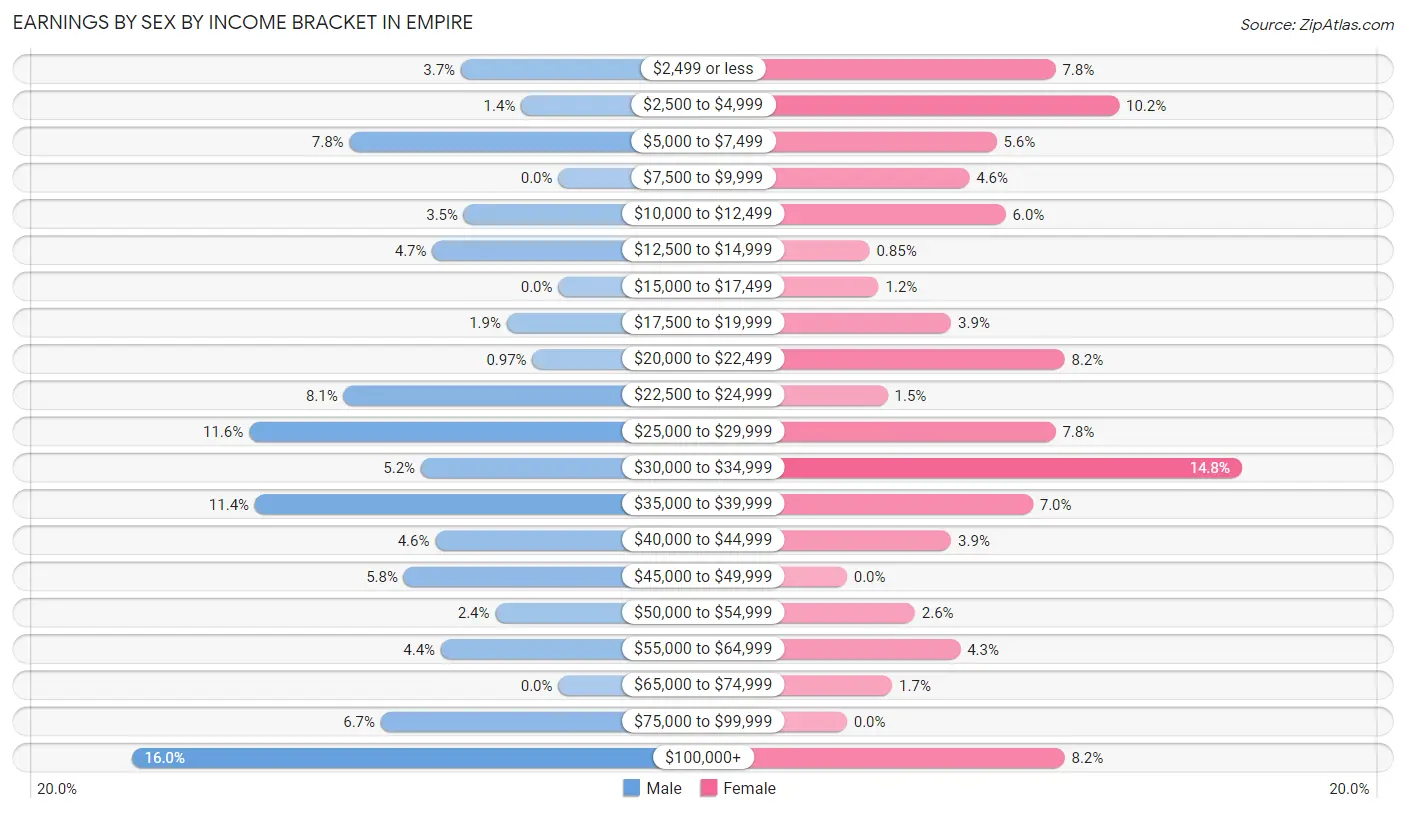
| Income | Male | Female |
| $2,499 or less | 34 (3.6%) | 46 (7.8%) |
| $2,500 to $4,999 | 13 (1.4%) | 60 (10.2%) |
| $5,000 to $7,499 | 73 (7.8%) | 33 (5.6%) |
| $7,500 to $9,999 | 0 (0.0%) | 27 (4.6%) |
| $10,000 to $12,499 | 33 (3.5%) | 35 (5.9%) |
| $12,500 to $14,999 | 44 (4.7%) | 5 (0.9%) |
| $15,000 to $17,499 | 0 (0.0%) | 7 (1.2%) |
| $17,500 to $19,999 | 18 (1.9%) | 23 (3.9%) |
| $20,000 to $22,499 | 9 (1.0%) | 48 (8.2%) |
| $22,500 to $24,999 | 75 (8.1%) | 9 (1.5%) |
| $25,000 to $29,999 | 108 (11.6%) | 46 (7.8%) |
| $30,000 to $34,999 | 48 (5.1%) | 87 (14.8%) |
| $35,000 to $39,999 | 106 (11.4%) | 41 (7.0%) |
| $40,000 to $44,999 | 43 (4.6%) | 23 (3.9%) |
| $45,000 to $49,999 | 54 (5.8%) | 0 (0.0%) |
| $50,000 to $54,999 | 22 (2.4%) | 15 (2.5%) |
| $55,000 to $64,999 | 41 (4.4%) | 25 (4.3%) |
| $65,000 to $74,999 | 0 (0.0%) | 10 (1.7%) |
| $75,000 to $99,999 | 62 (6.7%) | 0 (0.0%) |
| $100,000+ | 149 (16.0%) | 48 (8.2%) |
| Total | 932 (100.0%) | 588 (100.0%) |
Earnings by Sex by Educational Attainment in Empire
Average earnings in Empire are $36,129 for men and $28,586 for women, a difference of 20.9%. Men with an educational attainment of college or associate's degree enjoy the highest average annual earnings of $43,198, while those with high school diploma education earn the least with $32,768. Women with an educational attainment of college or associate's degree earn the most with the average annual earnings of $30,714, while those with high school diploma education have the smallest earnings of $24,722.
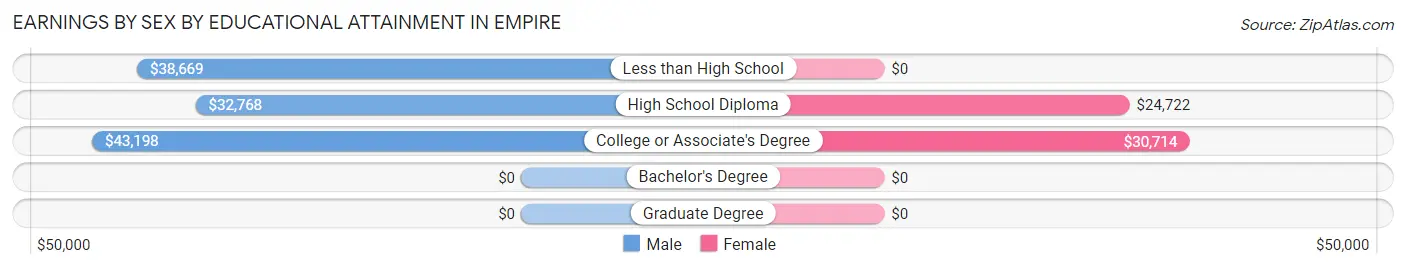
| Educational Attainment | Male Income | Female Income |
| Less than High School | $38,669 | $0 |
| High School Diploma | $32,768 | $24,722 |
| College or Associate's Degree | $43,198 | $30,714 |
| Bachelor's Degree | - | - |
| Graduate Degree | - | - |
| Total | $36,129 | $28,586 |
Family Income in Empire
Family Income Brackets in Empire
According to the Empire family income data, there are 213 families falling into the $100,000 to $149,999 income range, which is the most common income bracket and makes up 22.5% of all families.
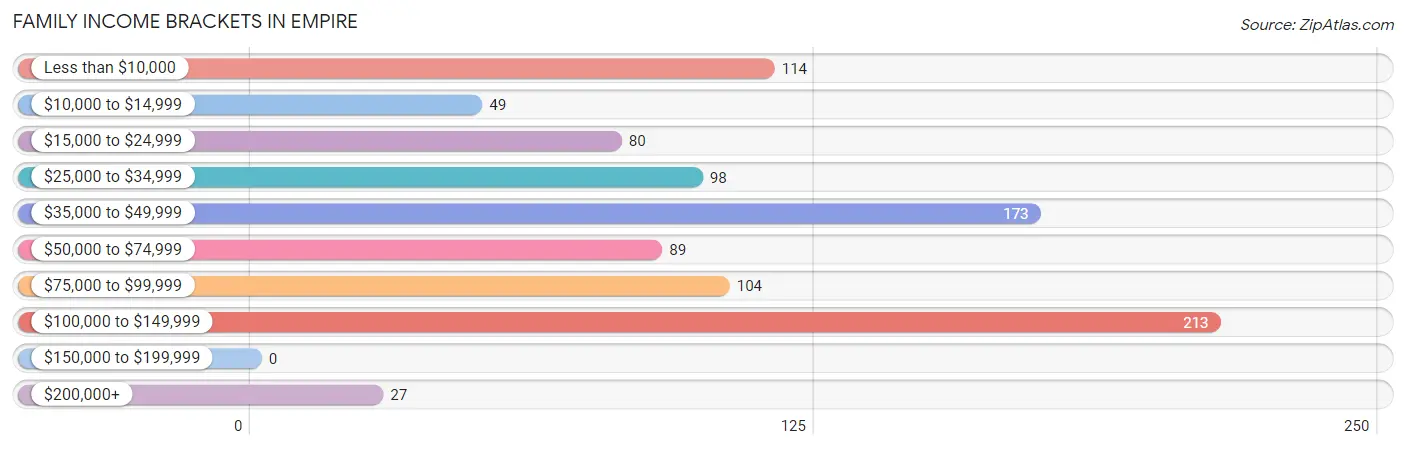
| Income Bracket | # Families | % Families |
| Less than $10,000 | 114 | 12.0% |
| $10,000 to $14,999 | 49 | 5.2% |
| $15,000 to $24,999 | 80 | 8.4% |
| $25,000 to $34,999 | 98 | 10.3% |
| $35,000 to $49,999 | 173 | 18.3% |
| $50,000 to $74,999 | 89 | 9.4% |
| $75,000 to $99,999 | 104 | 11.0% |
| $100,000 to $149,999 | 213 | 22.5% |
| $150,000 to $199,999 | 0 | 0.0% |
| $200,000+ | 27 | 2.9% |
Family Income by Famaliy Size in Empire
4-person families (106 | 11.2%) account for the highest median family income in Empire with $113,000 per family, while 4-person families (106 | 11.2%) have the highest median income of $28,250 per family member.
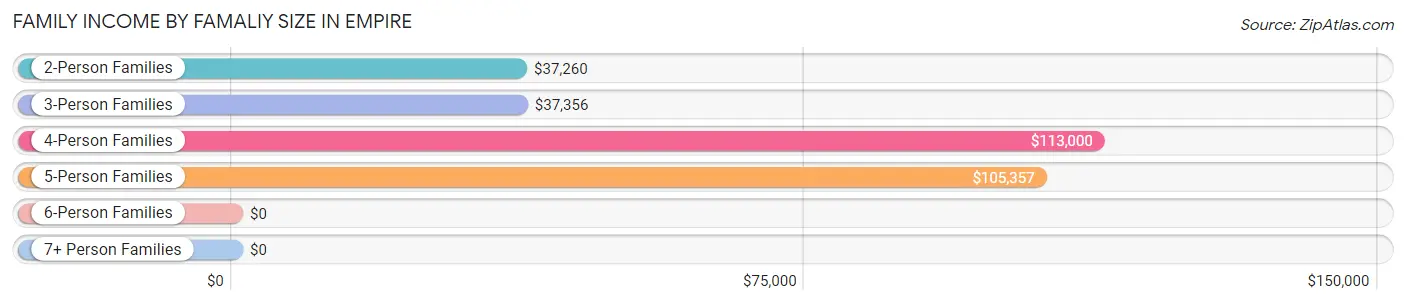
| Income Bracket | # Families | Median Income |
| 2-Person Families | 441 (46.6%) | $37,260 |
| 3-Person Families | 257 (27.1%) | $37,356 |
| 4-Person Families | 106 (11.2%) | $113,000 |
| 5-Person Families | 94 (9.9%) | $105,357 |
| 6-Person Families | 13 (1.4%) | $0 |
| 7+ Person Families | 36 (3.8%) | $0 |
| Total | 947 (100.0%) | $48,554 |
Family Income by Number of Earners in Empire
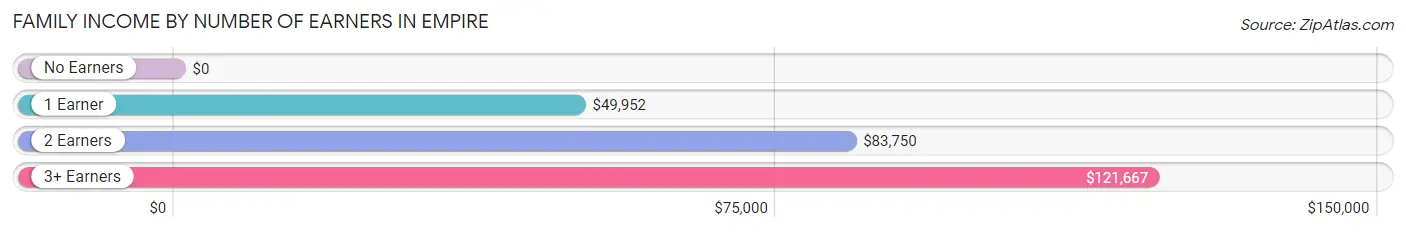
| Number of Earners | # Families | Median Income |
| No Earners | 246 (26.0%) | $0 |
| 1 Earner | 357 (37.7%) | $49,952 |
| 2 Earners | 312 (33.0%) | $83,750 |
| 3+ Earners | 32 (3.4%) | $121,667 |
| Total | 947 (100.0%) | $48,554 |
Household Income in Empire
Household Income Brackets in Empire
With 223 households falling in the category, the $35,000 to $49,999 income range is the most frequent in Empire, accounting for 18.8% of all households.
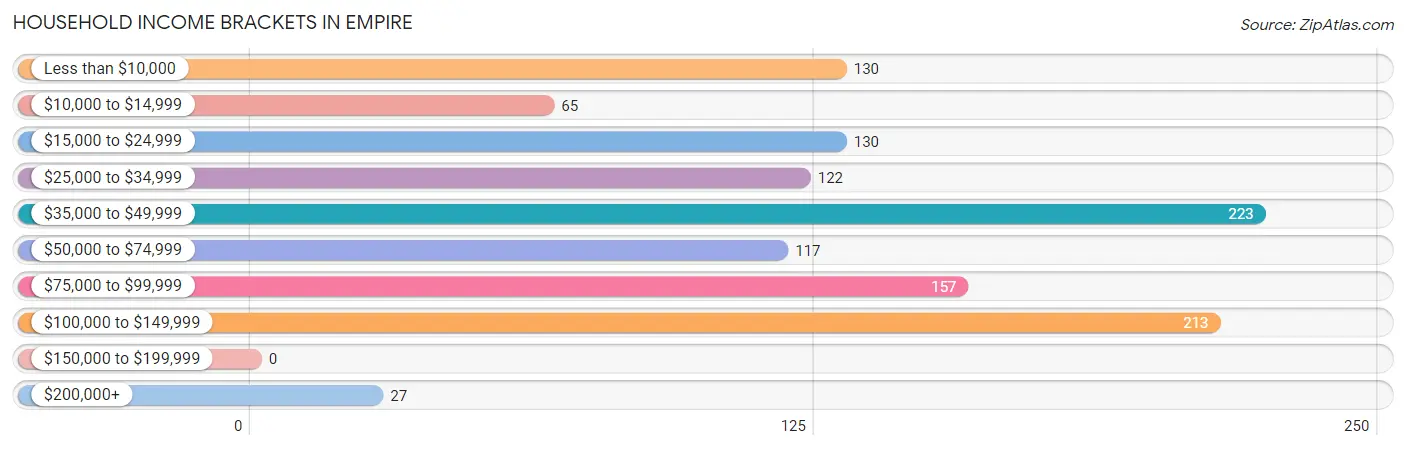
| Income Bracket | # Households | % Households |
| Less than $10,000 | 130 | 11.0% |
| $10,000 to $14,999 | 65 | 5.5% |
| $15,000 to $24,999 | 130 | 11.0% |
| $25,000 to $34,999 | 122 | 10.3% |
| $35,000 to $49,999 | 223 | 18.8% |
| $50,000 to $74,999 | 117 | 9.9% |
| $75,000 to $99,999 | 157 | 13.2% |
| $100,000 to $149,999 | 213 | 18.0% |
| $150,000 to $199,999 | 0 | 0.0% |
| $200,000+ | 27 | 2.3% |
Household Income by Householder Age in Empire
The median household income in Empire is $45,769, with the highest median household income of $70,761 found in the 25 to 44 years age bracket for the primary householder. A total of 444 households (37.4%) fall into this category.
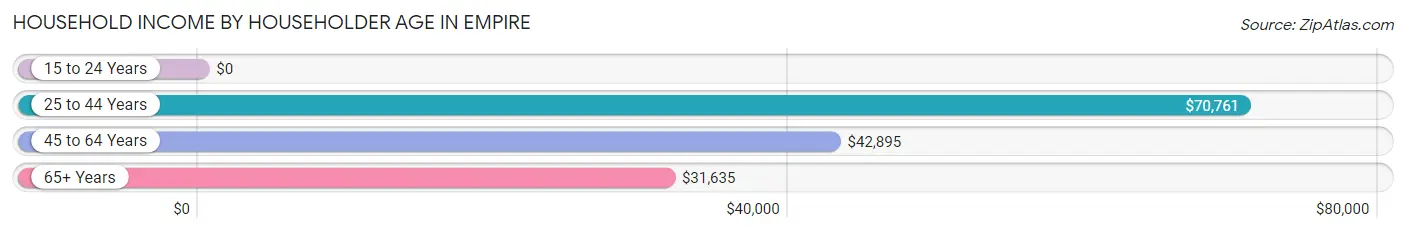
| Income Bracket | # Households | Median Income |
| 15 to 24 Years | 0 (0.0%) | $0 |
| 25 to 44 Years | 444 (37.4%) | $70,761 |
| 45 to 64 Years | 424 (35.7%) | $42,895 |
| 65+ Years | 318 (26.8%) | $31,635 |
| Total | 1,186 (100.0%) | $45,769 |
Poverty in Empire
Income Below Poverty by Sex and Age in Empire
With 25.0% poverty level for males and 29.6% for females among the residents of Empire, 5 year old males and 65 to 74 year old females are the most vulnerable to poverty, with 32 males (100.0%) and 109 females (53.2%) in their respective age groups living below the poverty level.
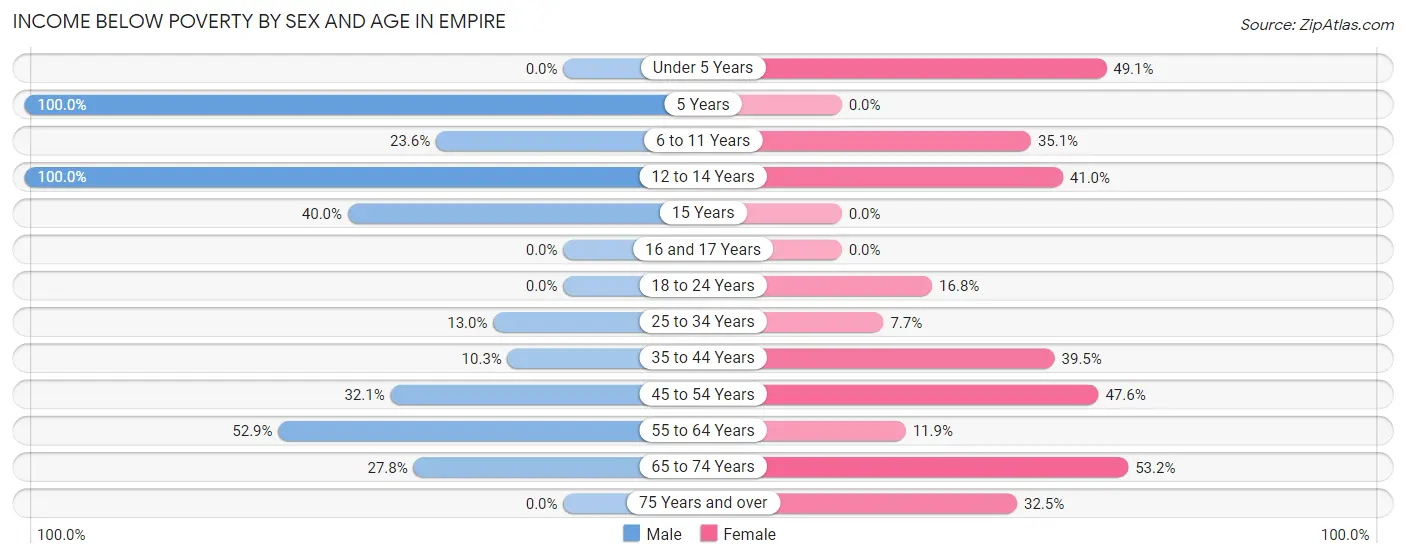
| Age Bracket | Male | Female |
| Under 5 Years | 0 (0.0%) | 54 (49.1%) |
| 5 Years | 32 (100.0%) | 0 (0.0%) |
| 6 to 11 Years | 43 (23.6%) | 33 (35.1%) |
| 12 to 14 Years | 34 (100.0%) | 16 (41.0%) |
| 15 Years | 30 (40.0%) | 0 (0.0%) |
| 16 and 17 Years | 0 (0.0%) | 0 (0.0%) |
| 18 to 24 Years | 0 (0.0%) | 28 (16.8%) |
| 25 to 34 Years | 35 (13.0%) | 23 (7.7%) |
| 35 to 44 Years | 37 (10.3%) | 94 (39.5%) |
| 45 to 54 Years | 86 (32.1%) | 121 (47.6%) |
| 55 to 64 Years | 137 (52.9%) | 26 (11.9%) |
| 65 to 74 Years | 47 (27.8%) | 109 (53.2%) |
| 75 Years and over | 0 (0.0%) | 27 (32.5%) |
| Total | 481 (25.0%) | 531 (29.6%) |
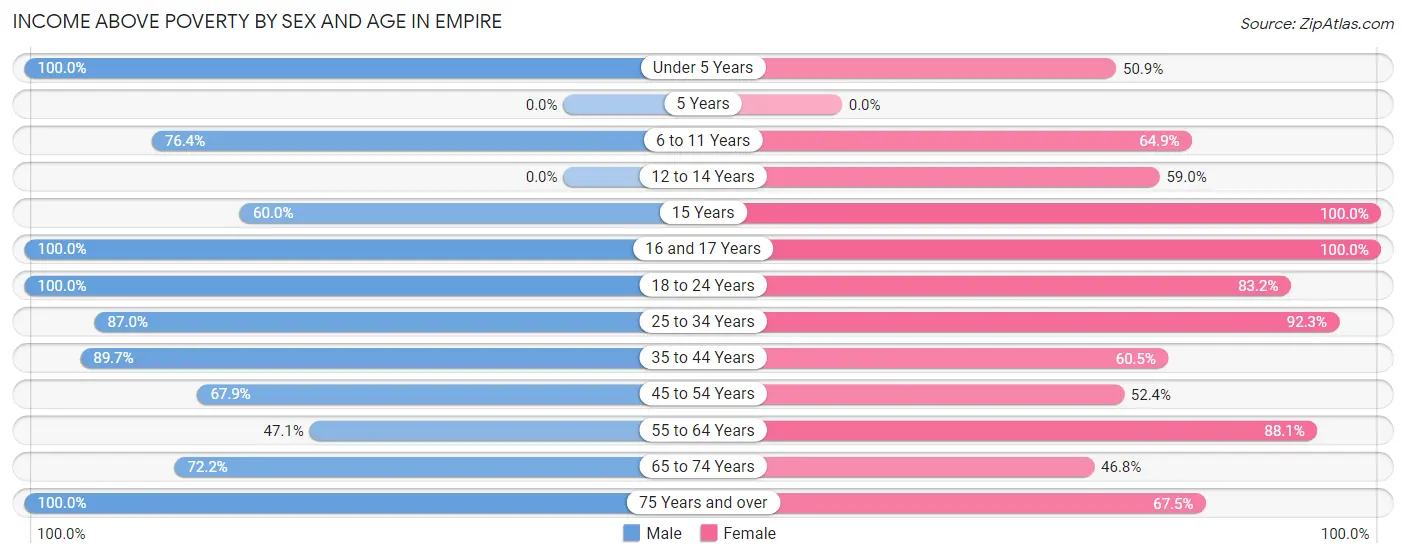
Income Above Poverty by Sex and Age in Empire
According to the poverty statistics in Empire, males aged under 5 years and females aged 15 years are the age groups that are most secure financially, with 100.0% of males and 100.0% of females in these age groups living above the poverty line.
| Age Bracket | Male | Female |
| Under 5 Years | 124 (100.0%) | 56 (50.9%) |
| 5 Years | 0 (0.0%) | 0 (0.0%) |
| 6 to 11 Years | 139 (76.4%) | 61 (64.9%) |
| 12 to 14 Years | 0 (0.0%) | 23 (59.0%) |
| 15 Years | 45 (60.0%) | 20 (100.0%) |
| 16 and 17 Years | 45 (100.0%) | 67 (100.0%) |
| 18 to 24 Years | 58 (100.0%) | 139 (83.2%) |
| 25 to 34 Years | 234 (87.0%) | 274 (92.3%) |
| 35 to 44 Years | 321 (89.7%) | 144 (60.5%) |
| 45 to 54 Years | 182 (67.9%) | 133 (52.4%) |
| 55 to 64 Years | 122 (47.1%) | 193 (88.1%) |
| 65 to 74 Years | 122 (72.2%) | 96 (46.8%) |
| 75 Years and over | 51 (100.0%) | 56 (67.5%) |
| Total | 1,443 (75.0%) | 1,262 (70.4%) |
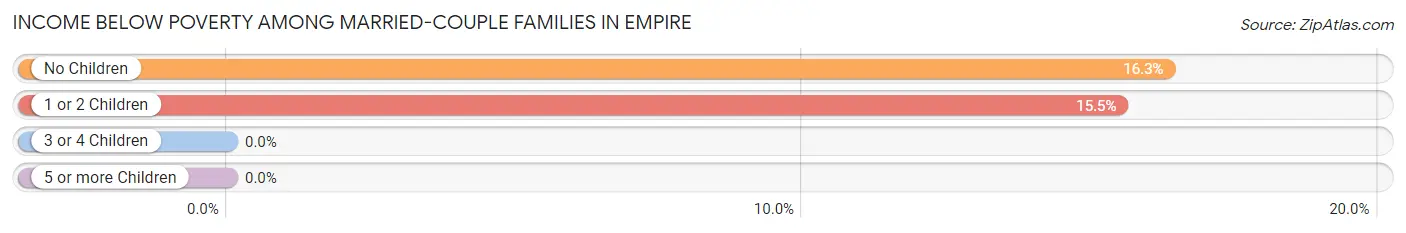
Income Below Poverty Among Married-Couple Families in Empire
The poverty statistics for married-couple families in Empire show that 14.4% or 82 of the total 570 families live below the poverty line. Families with no children have the highest poverty rate of 16.3%, comprising of 62 families. On the other hand, families with 3 or 4 children have the lowest poverty rate of 0.0%, which includes 0 families.
| Children | Above Poverty | Below Poverty |
| No Children | 318 (83.7%) | 62 (16.3%) |
| 1 or 2 Children | 109 (84.5%) | 20 (15.5%) |
| 3 or 4 Children | 49 (100.0%) | 0 (0.0%) |
| 5 or more Children | 12 (100.0%) | 0 (0.0%) |
| Total | 488 (85.6%) | 82 (14.4%) |
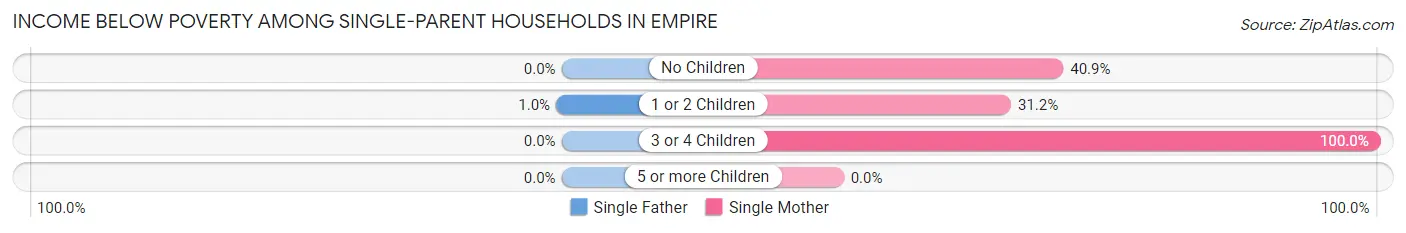
Income Below Poverty Among Single-Parent Households in Empire
According to the poverty data in Empire, 0.9% or 1 single-father households and 46.9% or 127 single-mother households are living below the poverty line. Among single-father households, those with 1 or 2 children have the highest poverty rate, with 1 households (1.0%) experiencing poverty. Likewise, among single-mother households, those with 3 or 4 children have the highest poverty rate, with 40 households (100.0%) falling below the poverty line.
| Children | Single Father | Single Mother |
| No Children | 0 (0.0%) | 63 (40.9%) |
| 1 or 2 Children | 1 (1.0%) | 24 (31.2%) |
| 3 or 4 Children | 0 (0.0%) | 40 (100.0%) |
| 5 or more Children | 0 (0.0%) | 0 (0.0%) |
| Total | 1 (0.9%) | 127 (46.9%) |
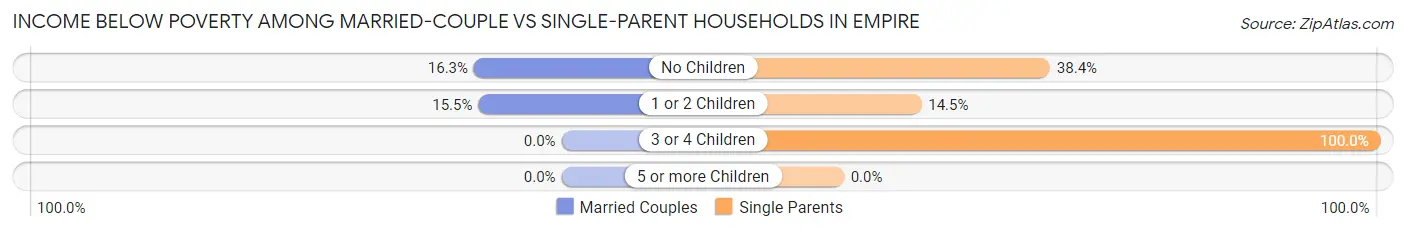
Income Below Poverty Among Married-Couple vs Single-Parent Households in Empire
The poverty data for Empire shows that 82 of the married-couple family households (14.4%) and 128 of the single-parent households (34.0%) are living below the poverty level. Within the married-couple family households, those with no children have the highest poverty rate, with 62 households (16.3%) falling below the poverty line. Among the single-parent households, those with 3 or 4 children have the highest poverty rate, with 40 household (100.0%) living below poverty.
| Children | Married-Couple Families | Single-Parent Households |
| No Children | 62 (16.3%) | 63 (38.4%) |
| 1 or 2 Children | 20 (15.5%) | 25 (14.4%) |
| 3 or 4 Children | 0 (0.0%) | 40 (100.0%) |
| 5 or more Children | 0 (0.0%) | 0 (0.0%) |
| Total | 82 (14.4%) | 128 (34.0%) |
Employment Characteristics in Empire
Employment by Class of Employer in Empire
Among the 1,311 employed individuals in Empire, private company employees (1,021 | 77.9%), local government employees (106 | 8.1%), and self-employed (not incorporated) (78 | 5.9%) make up the most common classes of employment.
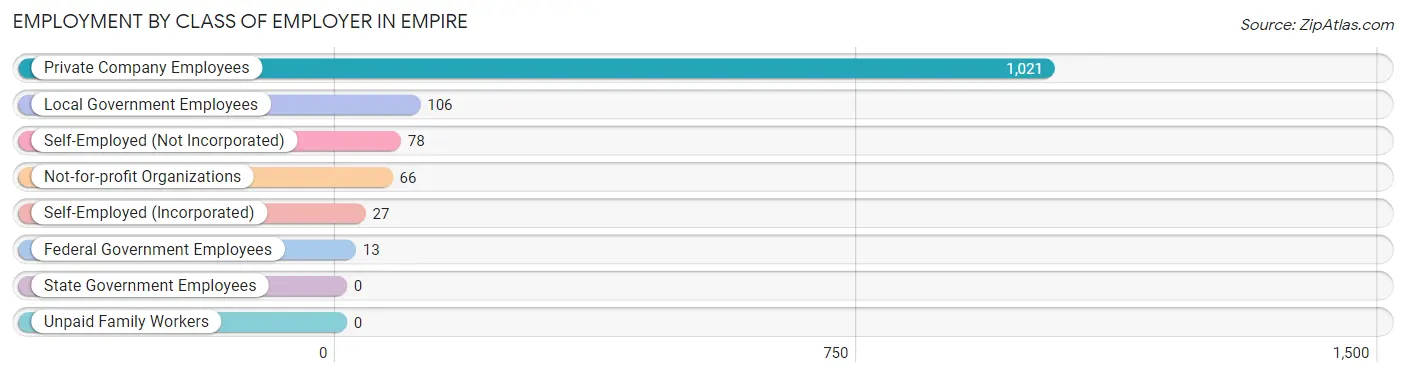
| Employer Class | # Employees | % Employees |
| Private Company Employees | 1,021 | 77.9% |
| Self-Employed (Incorporated) | 27 | 2.1% |
| Self-Employed (Not Incorporated) | 78 | 5.9% |
| Not-for-profit Organizations | 66 | 5.0% |
| Local Government Employees | 106 | 8.1% |
| State Government Employees | 0 | 0.0% |
| Federal Government Employees | 13 | 1.0% |
| Unpaid Family Workers | 0 | 0.0% |
| Total | 1,311 | 100.0% |
Employment Status by Age in Empire
According to the labor force statistics for Empire, out of the total population over 16 years of age (3,007), 53.5% or 1,609 individuals are in the labor force, with 13.9% or 224 of them unemployed. The age group with the highest labor force participation rate is 25 to 29 years, with 99.5% or 212 individuals in the labor force. Within the labor force, the 20 to 24 years age range has the highest percentage of unemployed individuals, with 65.7% or 65 of them being unemployed.
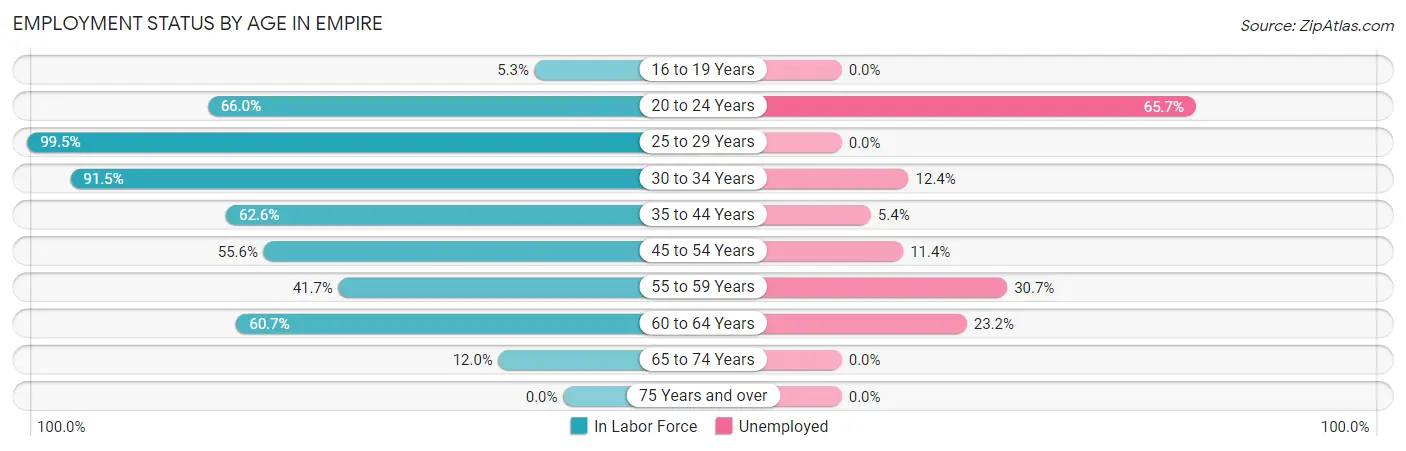
| Age Bracket | In Labor Force | Unemployed |
| 16 to 19 Years | 10 (5.3%) | 0 (0.0%) |
| 20 to 24 Years | 99 (66.0%) | 65 (65.7%) |
| 25 to 29 Years | 212 (99.5%) | 0 (0.0%) |
| 30 to 34 Years | 323 (91.5%) | 40 (12.4%) |
| 35 to 44 Years | 373 (62.6%) | 20 (5.4%) |
| 45 to 54 Years | 290 (55.6%) | 33 (11.4%) |
| 55 to 59 Years | 75 (41.7%) | 23 (30.7%) |
| 60 to 64 Years | 181 (60.7%) | 42 (23.2%) |
| 65 to 74 Years | 45 (12.0%) | 0 (0.0%) |
| 75 Years and over | 0 (0.0%) | 0 (0.0%) |
| Total | 1,609 (53.5%) | 224 (13.9%) |
Employment Status by Educational Attainment in Empire
According to labor force statistics for Empire, 67.3% of individuals (1,455) out of the total population between 25 and 64 years of age (2,162) are in the labor force, with 10.9% or 159 of them being unemployed. The group with the highest labor force participation rate are those with the educational attainment of high school diploma, with 72.9% or 709 individuals in the labor force. Within the labor force, individuals with high school diploma education have the highest percentage of unemployment, with 17.6% or 125 of them being unemployed.
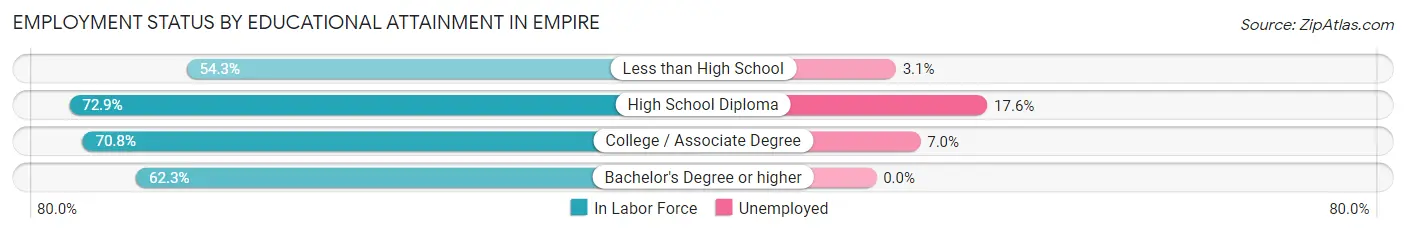
| Educational Attainment | In Labor Force | Unemployed |
| Less than High School | 260 (54.3%) | 15 (3.1%) |
| High School Diploma | 709 (72.9%) | 171 (17.6%) |
| College / Associate Degree | 356 (70.8%) | 35 (7.0%) |
| Bachelor's Degree or higher | 129 (62.3%) | 0 (0.0%) |
| Total | 1,455 (67.3%) | 236 (10.9%) |
Employment Occupations by Sex in Empire
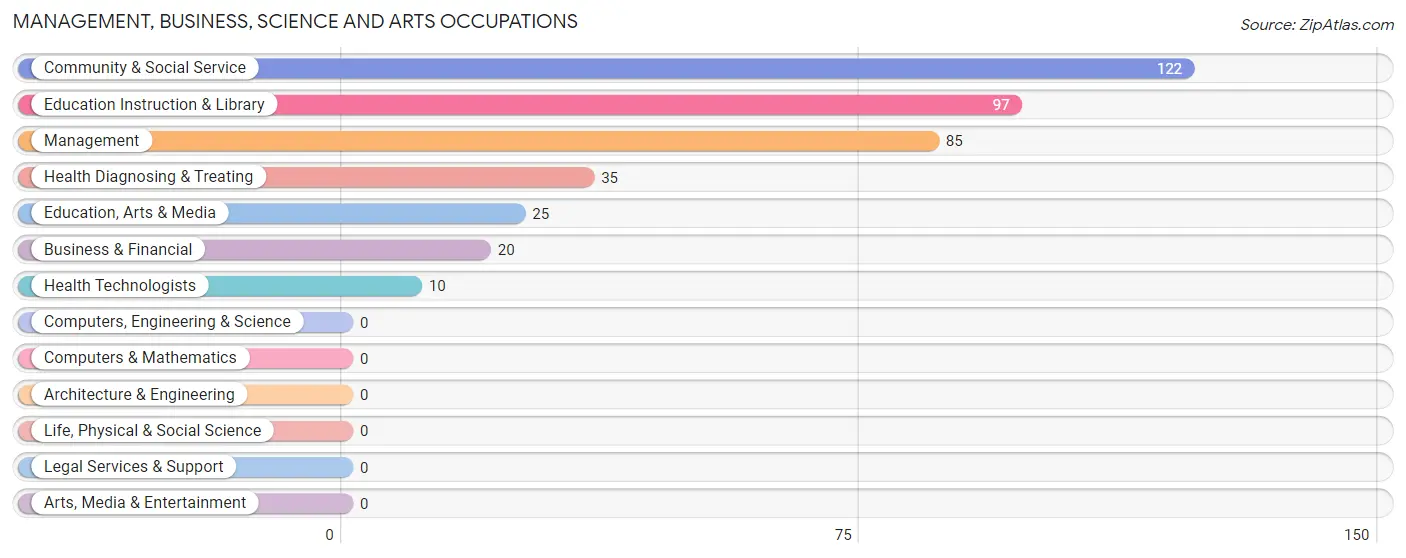
Management, Business, Science and Arts Occupations
The most common Management, Business, Science and Arts occupations in Empire are Community & Social Service (122 | 8.8%), Education Instruction & Library (97 | 7.0%), Management (85 | 6.1%), Health Diagnosing & Treating (35 | 2.5%), and Education, Arts & Media (25 | 1.8%).
Management, Business, Science and Arts Occupations by Sex
Within the Management, Business, Science and Arts occupations in Empire, the most male-oriented occupations are Education, Arts & Media (68.0%), Management (50.6%), and Community & Social Service (13.9%), while the most female-oriented occupations are Business & Financial (100.0%), Education Instruction & Library (100.0%), and Health Diagnosing & Treating (100.0%).
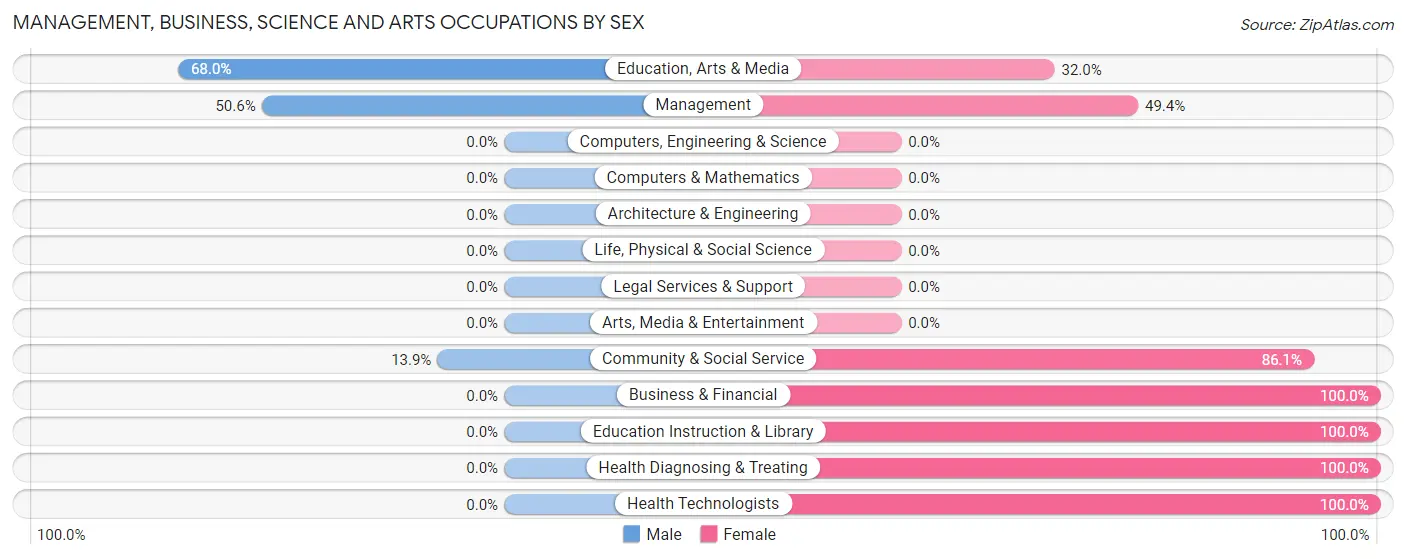
| Occupation | Male | Female |
| Management | 43 (50.6%) | 42 (49.4%) |
| Business & Financial | 0 (0.0%) | 20 (100.0%) |
| Computers, Engineering & Science | 0 (0.0%) | 0 (0.0%) |
| Computers & Mathematics | 0 (0.0%) | 0 (0.0%) |
| Architecture & Engineering | 0 (0.0%) | 0 (0.0%) |
| Life, Physical & Social Science | 0 (0.0%) | 0 (0.0%) |
| Community & Social Service | 17 (13.9%) | 105 (86.1%) |
| Education, Arts & Media | 17 (68.0%) | 8 (32.0%) |
| Legal Services & Support | 0 (0.0%) | 0 (0.0%) |
| Education Instruction & Library | 0 (0.0%) | 97 (100.0%) |
| Arts, Media & Entertainment | 0 (0.0%) | 0 (0.0%) |
| Health Diagnosing & Treating | 0 (0.0%) | 35 (100.0%) |
| Health Technologists | 0 (0.0%) | 10 (100.0%) |
| Total (Category) | 60 (22.9%) | 202 (77.1%) |
| Total (Overall) | 855 (61.7%) | 530 (38.3%) |
Services Occupations
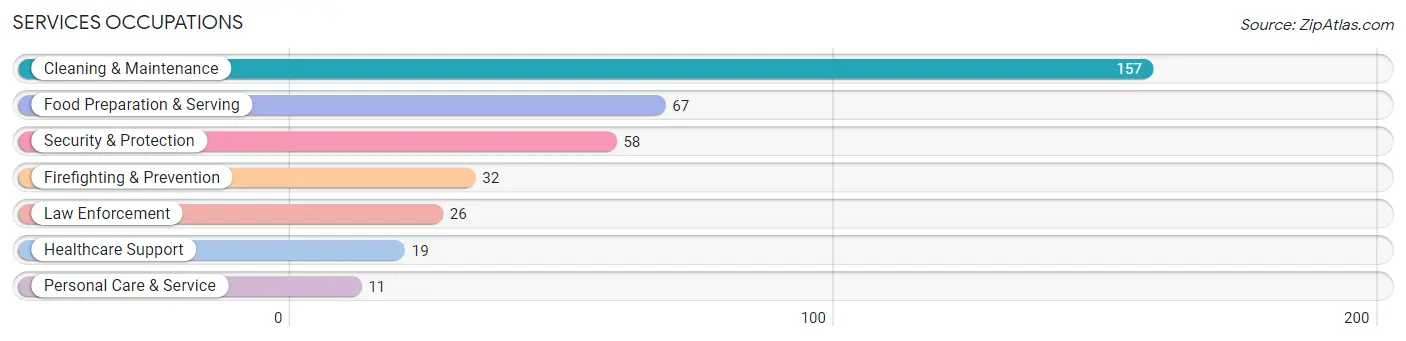
The most common Services occupations in Empire are Cleaning & Maintenance (157 | 11.3%), Food Preparation & Serving (67 | 4.8%), Security & Protection (58 | 4.2%), Firefighting & Prevention (32 | 2.3%), and Law Enforcement (26 | 1.9%).
Services Occupations by Sex
Within the Services occupations in Empire, the most male-oriented occupations are Security & Protection (100.0%), Firefighting & Prevention (100.0%), and Law Enforcement (100.0%), while the most female-oriented occupations are Food Preparation & Serving (100.0%), Personal Care & Service (100.0%), and Healthcare Support (47.4%).
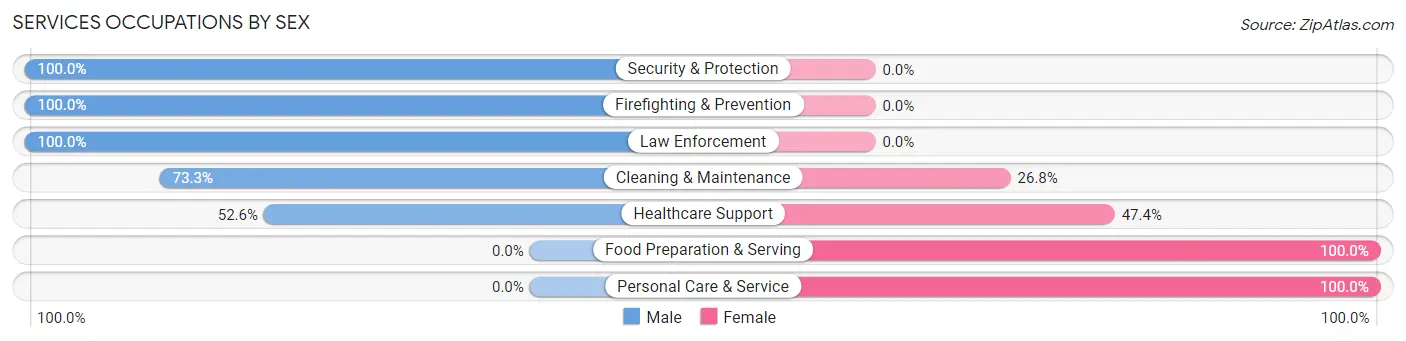
| Occupation | Male | Female |
| Healthcare Support | 10 (52.6%) | 9 (47.4%) |
| Security & Protection | 58 (100.0%) | 0 (0.0%) |
| Firefighting & Prevention | 32 (100.0%) | 0 (0.0%) |
| Law Enforcement | 26 (100.0%) | 0 (0.0%) |
| Food Preparation & Serving | 0 (0.0%) | 67 (100.0%) |
| Cleaning & Maintenance | 115 (73.3%) | 42 (26.8%) |
| Personal Care & Service | 0 (0.0%) | 11 (100.0%) |
| Total (Category) | 183 (58.7%) | 129 (41.3%) |
| Total (Overall) | 855 (61.7%) | 530 (38.3%) |
Sales and Office Occupations
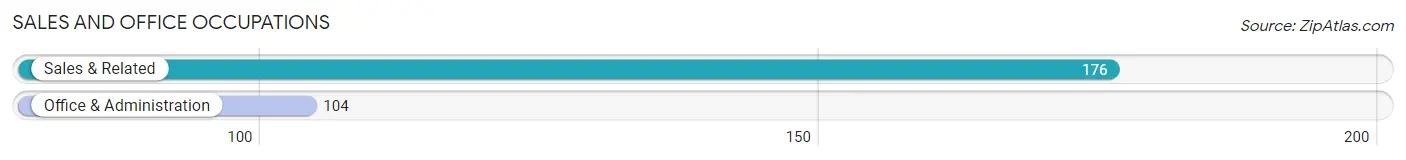
The most common Sales and Office occupations in Empire are Sales & Related (176 | 12.7%), and Office & Administration (104 | 7.5%).
Sales and Office Occupations by Sex
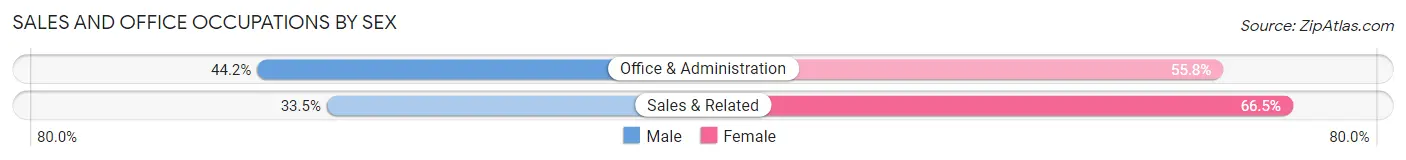
| Occupation | Male | Female |
| Sales & Related | 59 (33.5%) | 117 (66.5%) |
| Office & Administration | 46 (44.2%) | 58 (55.8%) |
| Total (Category) | 105 (37.5%) | 175 (62.5%) |
| Total (Overall) | 855 (61.7%) | 530 (38.3%) |
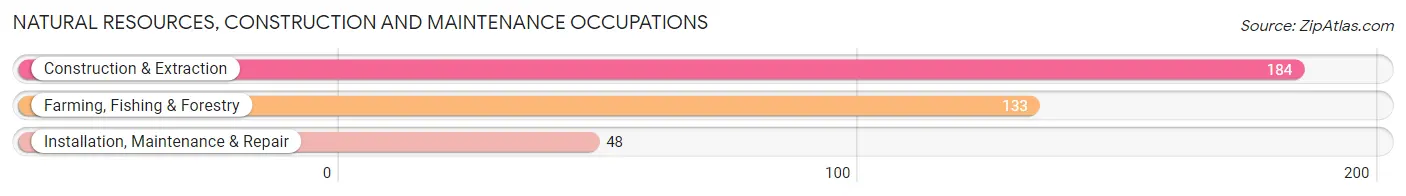
Natural Resources, Construction and Maintenance Occupations
The most common Natural Resources, Construction and Maintenance occupations in Empire are Construction & Extraction (184 | 13.3%), Farming, Fishing & Forestry (133 | 9.6%), and Installation, Maintenance & Repair (48 | 3.5%).
Natural Resources, Construction and Maintenance Occupations by Sex
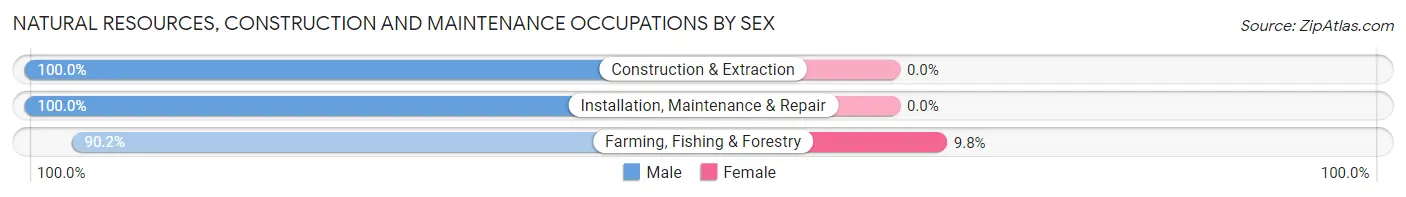
| Occupation | Male | Female |
| Farming, Fishing & Forestry | 120 (90.2%) | 13 (9.8%) |
| Construction & Extraction | 184 (100.0%) | 0 (0.0%) |
| Installation, Maintenance & Repair | 48 (100.0%) | 0 (0.0%) |
| Total (Category) | 352 (96.4%) | 13 (3.6%) |
| Total (Overall) | 855 (61.7%) | 530 (38.3%) |
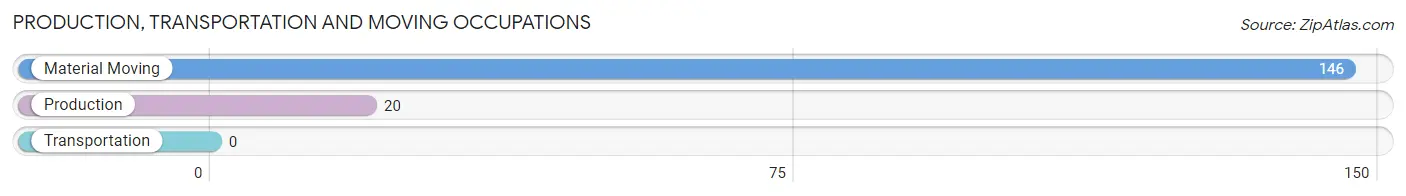
Production, Transportation and Moving Occupations
The most common Production, Transportation and Moving occupations in Empire are Material Moving (146 | 10.5%), and Production (20 | 1.4%).
Production, Transportation and Moving Occupations by Sex
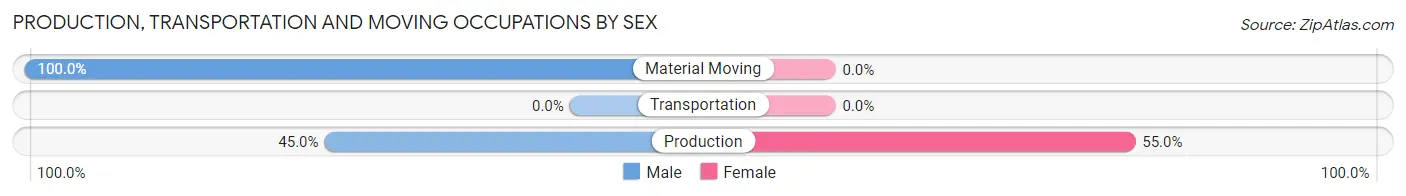
| Occupation | Male | Female |
| Production | 9 (45.0%) | 11 (55.0%) |
| Transportation | 0 (0.0%) | 0 (0.0%) |
| Material Moving | 146 (100.0%) | 0 (0.0%) |
| Total (Category) | 155 (93.4%) | 11 (6.6%) |
| Total (Overall) | 855 (61.7%) | 530 (38.3%) |
Employment Industries by Sex in Empire
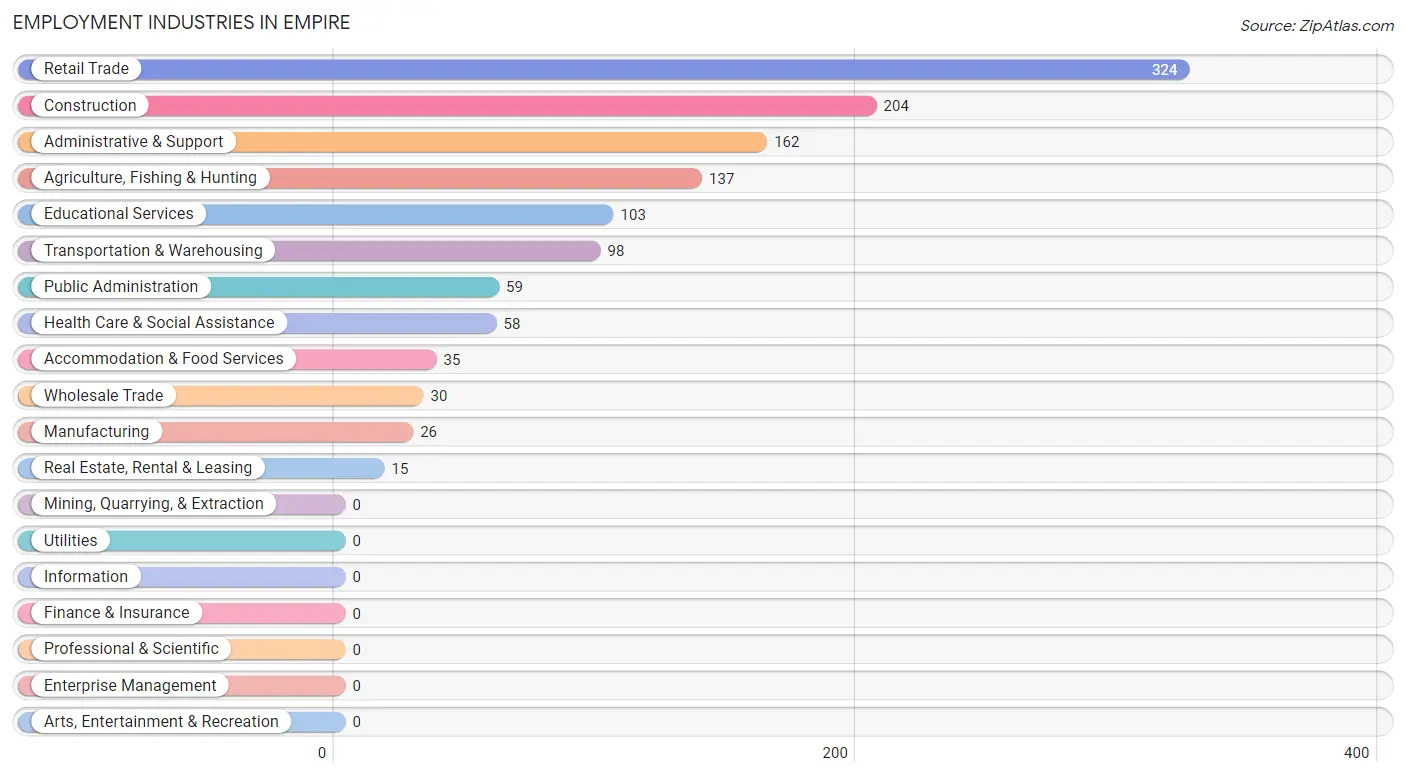
Employment Industries in Empire
The major employment industries in Empire include Retail Trade (324 | 23.4%), Construction (204 | 14.7%), Administrative & Support (162 | 11.7%), Agriculture, Fishing & Hunting (137 | 9.9%), and Educational Services (103 | 7.4%).
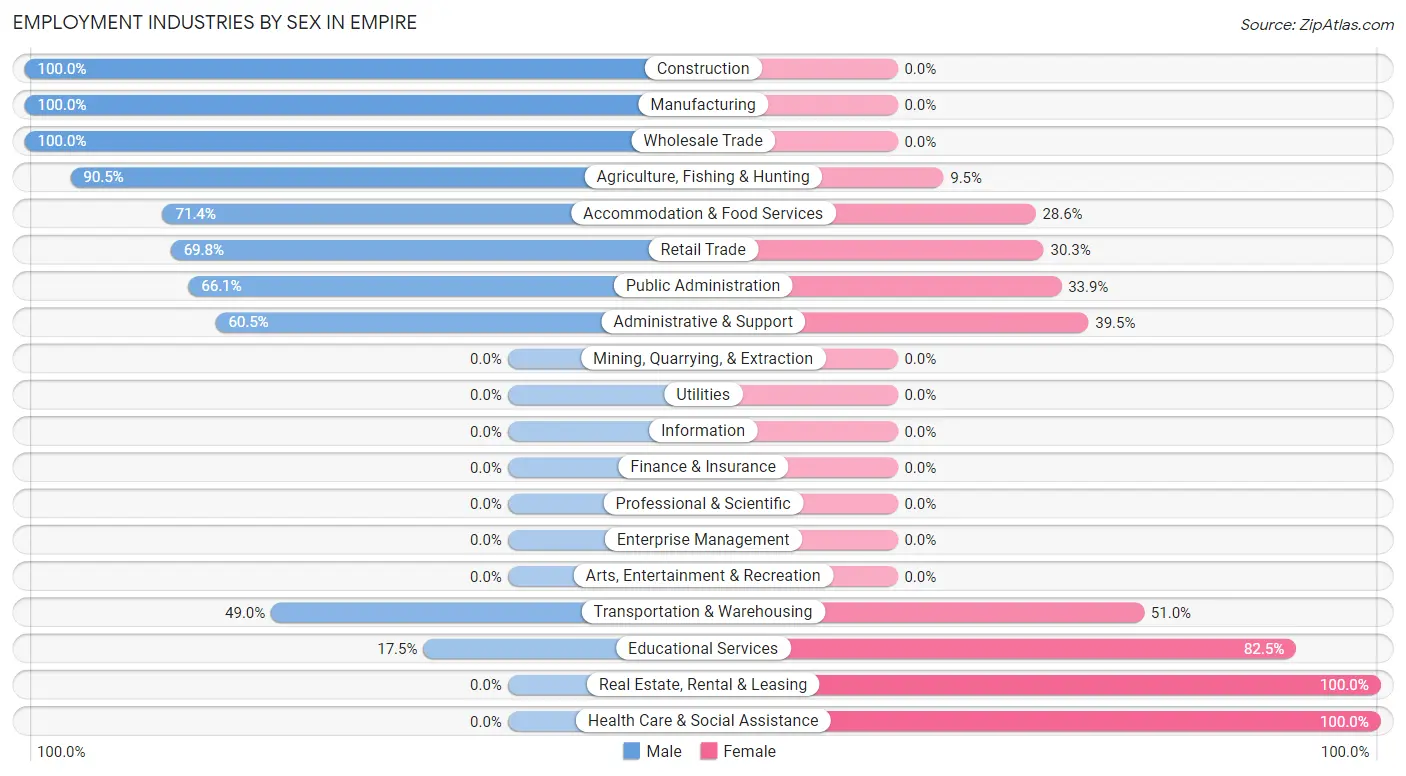
Employment Industries by Sex in Empire
The Empire industries that see more men than women are Construction (100.0%), Manufacturing (100.0%), and Wholesale Trade (100.0%), whereas the industries that tend to have a higher number of women are Real Estate, Rental & Leasing (100.0%), Health Care & Social Assistance (100.0%), and Educational Services (82.5%).
| Industry | Male | Female |
| Agriculture, Fishing & Hunting | 124 (90.5%) | 13 (9.5%) |
| Mining, Quarrying, & Extraction | 0 (0.0%) | 0 (0.0%) |
| Construction | 204 (100.0%) | 0 (0.0%) |
| Manufacturing | 26 (100.0%) | 0 (0.0%) |
| Wholesale Trade | 30 (100.0%) | 0 (0.0%) |
| Retail Trade | 226 (69.8%) | 98 (30.2%) |
| Transportation & Warehousing | 48 (49.0%) | 50 (51.0%) |
| Utilities | 0 (0.0%) | 0 (0.0%) |
| Information | 0 (0.0%) | 0 (0.0%) |
| Finance & Insurance | 0 (0.0%) | 0 (0.0%) |
| Real Estate, Rental & Leasing | 0 (0.0%) | 15 (100.0%) |
| Professional & Scientific | 0 (0.0%) | 0 (0.0%) |
| Enterprise Management | 0 (0.0%) | 0 (0.0%) |
| Administrative & Support | 98 (60.5%) | 64 (39.5%) |
| Educational Services | 18 (17.5%) | 85 (82.5%) |
| Health Care & Social Assistance | 0 (0.0%) | 58 (100.0%) |
| Arts, Entertainment & Recreation | 0 (0.0%) | 0 (0.0%) |
| Accommodation & Food Services | 25 (71.4%) | 10 (28.6%) |
| Public Administration | 39 (66.1%) | 20 (33.9%) |
| Total | 855 (61.7%) | 530 (38.3%) |
Education in Empire
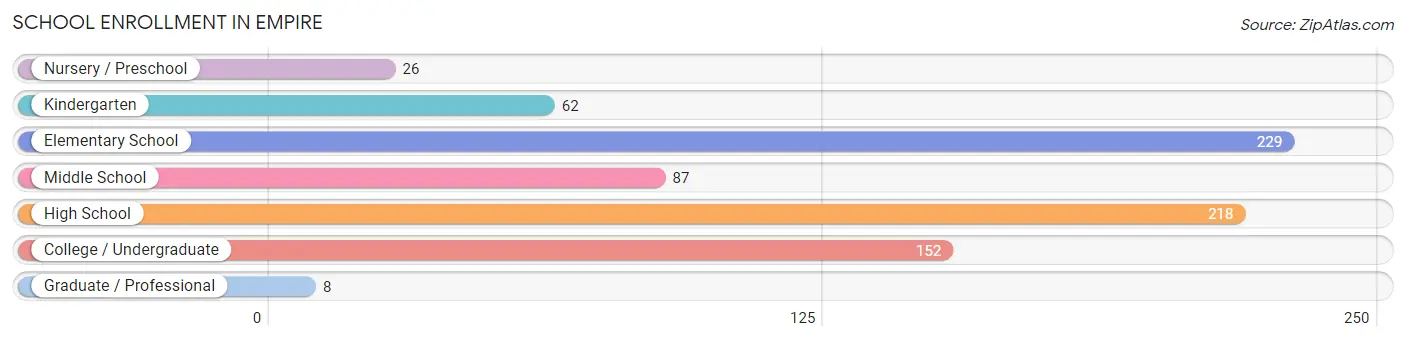
School Enrollment in Empire
The most common levels of schooling among the 782 students in Empire are elementary school (229 | 29.3%), high school (218 | 27.9%), and college / undergraduate (152 | 19.4%).
| School Level | # Students | % Students |
| Nursery / Preschool | 26 | 3.3% |
| Kindergarten | 62 | 7.9% |
| Elementary School | 229 | 29.3% |
| Middle School | 87 | 11.1% |
| High School | 218 | 27.9% |
| College / Undergraduate | 152 | 19.4% |
| Graduate / Professional | 8 | 1.0% |
| Total | 782 | 100.0% |
School Enrollment by Age by Funding Source in Empire
Out of a total of 782 students who are enrolled in schools in Empire, 73 (9.3%) attend a private institution, while the remaining 709 (90.7%) are enrolled in public schools. The age group of 15 to 17 year olds has the highest likelihood of being enrolled in private schools, with 73 (37.4% in the age bracket) enrolled. Conversely, the age group of 3 to 4 year olds has the lowest likelihood of being enrolled in a private school, with 26 (100.0% in the age bracket) attending a public institution.
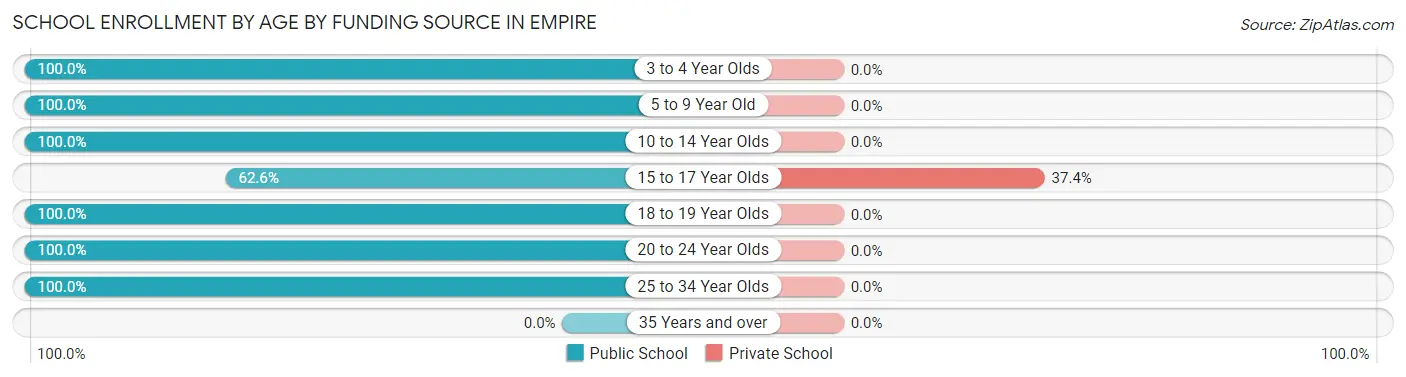
| Age Bracket | Public School | Private School |
| 3 to 4 Year Olds | 26 (100.0%) | 0 (0.0%) |
| 5 to 9 Year Old | 291 (100.0%) | 0 (0.0%) |
| 10 to 14 Year Olds | 99 (100.0%) | 0 (0.0%) |
| 15 to 17 Year Olds | 122 (62.6%) | 73 (37.4%) |
| 18 to 19 Year Olds | 31 (100.0%) | 0 (0.0%) |
| 20 to 24 Year Olds | 88 (100.0%) | 0 (0.0%) |
| 25 to 34 Year Olds | 52 (100.0%) | 0 (0.0%) |
| 35 Years and over | 0 (0.0%) | 0 (0.0%) |
| Total | 709 (90.7%) | 73 (9.3%) |
Educational Attainment by Field of Study in Empire
Liberal arts & history (57 | 27.5%), communications (42 | 20.3%), business (29 | 14.0%), physical & health sciences (27 | 13.0%), and visual & performing arts (25 | 12.1%) are the most common fields of study among 207 individuals in Empire who have obtained a bachelor's degree or higher.
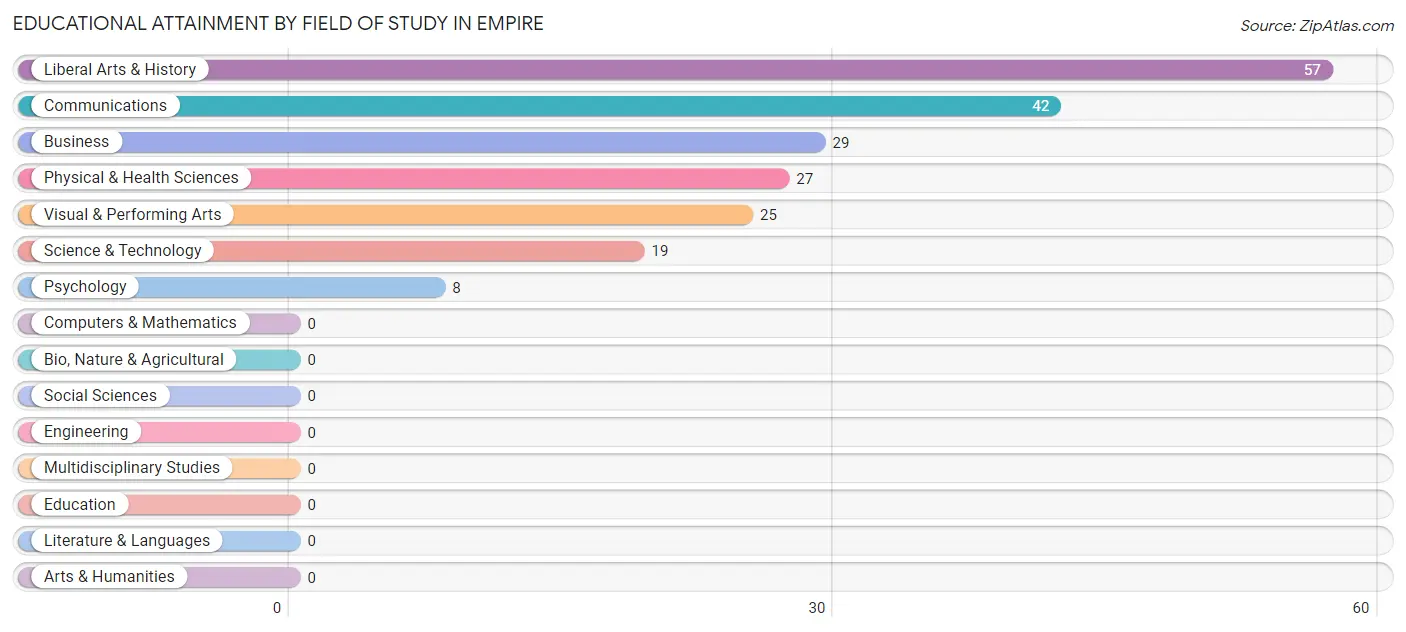
| Field of Study | # Graduates | % Graduates |
| Computers & Mathematics | 0 | 0.0% |
| Bio, Nature & Agricultural | 0 | 0.0% |
| Physical & Health Sciences | 27 | 13.0% |
| Psychology | 8 | 3.9% |
| Social Sciences | 0 | 0.0% |
| Engineering | 0 | 0.0% |
| Multidisciplinary Studies | 0 | 0.0% |
| Science & Technology | 19 | 9.2% |
| Business | 29 | 14.0% |
| Education | 0 | 0.0% |
| Literature & Languages | 0 | 0.0% |
| Liberal Arts & History | 57 | 27.5% |
| Visual & Performing Arts | 25 | 12.1% |
| Communications | 42 | 20.3% |
| Arts & Humanities | 0 | 0.0% |
| Total | 207 | 100.0% |
Transportation & Commute in Empire
Vehicle Availability by Sex in Empire
The most prevalent vehicle ownership categories in Empire are males with 1 vehicle (325, accounting for 38.4%) and females with 1 vehicle (153, making up 69.9%).
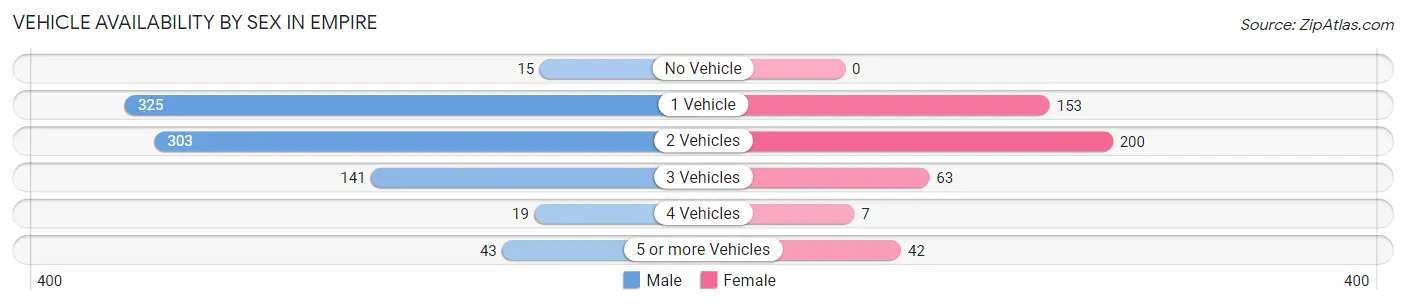
| Vehicles Available | Male | Female |
| No Vehicle | 15 (1.8%) | 0 (0.0%) |
| 1 Vehicle | 325 (38.4%) | 153 (32.9%) |
| 2 Vehicles | 303 (35.8%) | 200 (43.0%) |
| 3 Vehicles | 141 (16.7%) | 63 (13.6%) |
| 4 Vehicles | 19 (2.2%) | 7 (1.5%) |
| 5 or more Vehicles | 43 (5.1%) | 42 (9.0%) |
| Total | 846 (100.0%) | 465 (100.0%) |
Commute Time in Empire
The most frequently occuring commute durations in Empire are 30 to 34 minutes (319 commuters, 24.8%), 20 to 24 minutes (299 commuters, 23.3%), and 15 to 19 minutes (192 commuters, 14.9%).
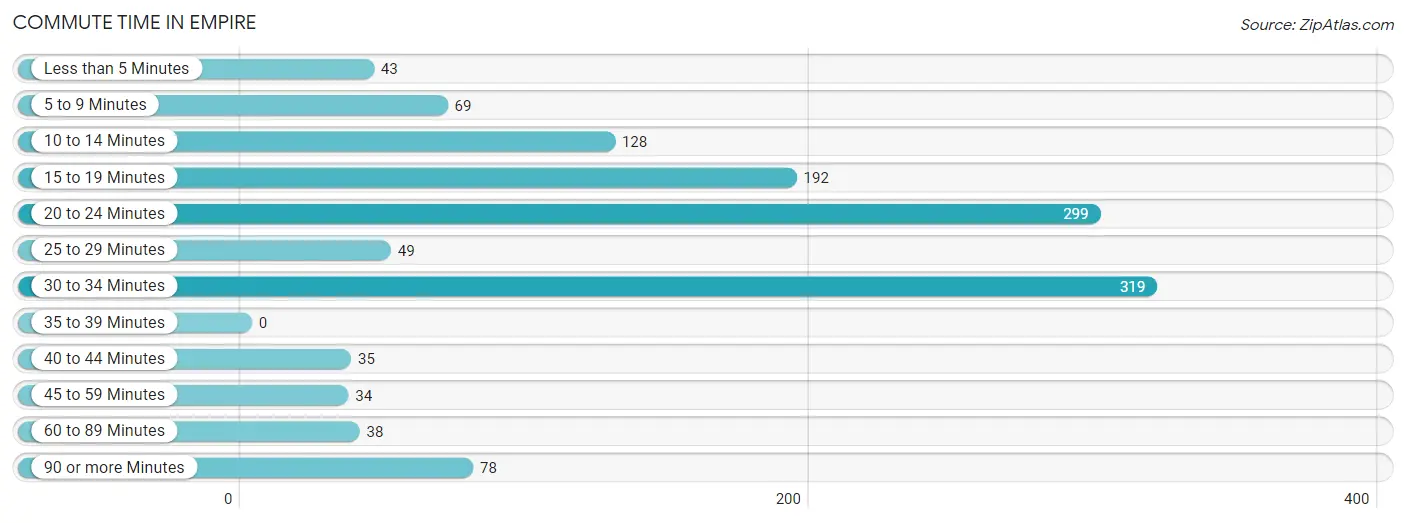
| Commute Time | # Commuters | % Commuters |
| Less than 5 Minutes | 43 | 3.4% |
| 5 to 9 Minutes | 69 | 5.4% |
| 10 to 14 Minutes | 128 | 10.0% |
| 15 to 19 Minutes | 192 | 14.9% |
| 20 to 24 Minutes | 299 | 23.3% |
| 25 to 29 Minutes | 49 | 3.8% |
| 30 to 34 Minutes | 319 | 24.8% |
| 35 to 39 Minutes | 0 | 0.0% |
| 40 to 44 Minutes | 35 | 2.7% |
| 45 to 59 Minutes | 34 | 2.6% |
| 60 to 89 Minutes | 38 | 3.0% |
| 90 or more Minutes | 78 | 6.1% |
Commute Time by Sex in Empire
The most common commute times in Empire are 20 to 24 minutes (182 commuters, 21.5%) for males and 30 to 34 minutes (142 commuters, 32.4%) for females.

| Commute Time | Male | Female |
| Less than 5 Minutes | 43 (5.1%) | 0 (0.0%) |
| 5 to 9 Minutes | 56 (6.6%) | 13 (3.0%) |
| 10 to 14 Minutes | 128 (15.1%) | 0 (0.0%) |
| 15 to 19 Minutes | 76 (9.0%) | 116 (26.5%) |
| 20 to 24 Minutes | 182 (21.5%) | 117 (26.7%) |
| 25 to 29 Minutes | 34 (4.0%) | 15 (3.4%) |
| 30 to 34 Minutes | 177 (20.9%) | 142 (32.4%) |
| 35 to 39 Minutes | 0 (0.0%) | 0 (0.0%) |
| 40 to 44 Minutes | 0 (0.0%) | 35 (8.0%) |
| 45 to 59 Minutes | 34 (4.0%) | 0 (0.0%) |
| 60 to 89 Minutes | 38 (4.5%) | 0 (0.0%) |
| 90 or more Minutes | 78 (9.2%) | 0 (0.0%) |
Time of Departure to Work by Sex in Empire
The most frequent times of departure to work in Empire are 7:00 AM to 7:29 AM (213, 25.2%) for males and 8:00 AM to 8:29 AM (91, 20.8%) for females.
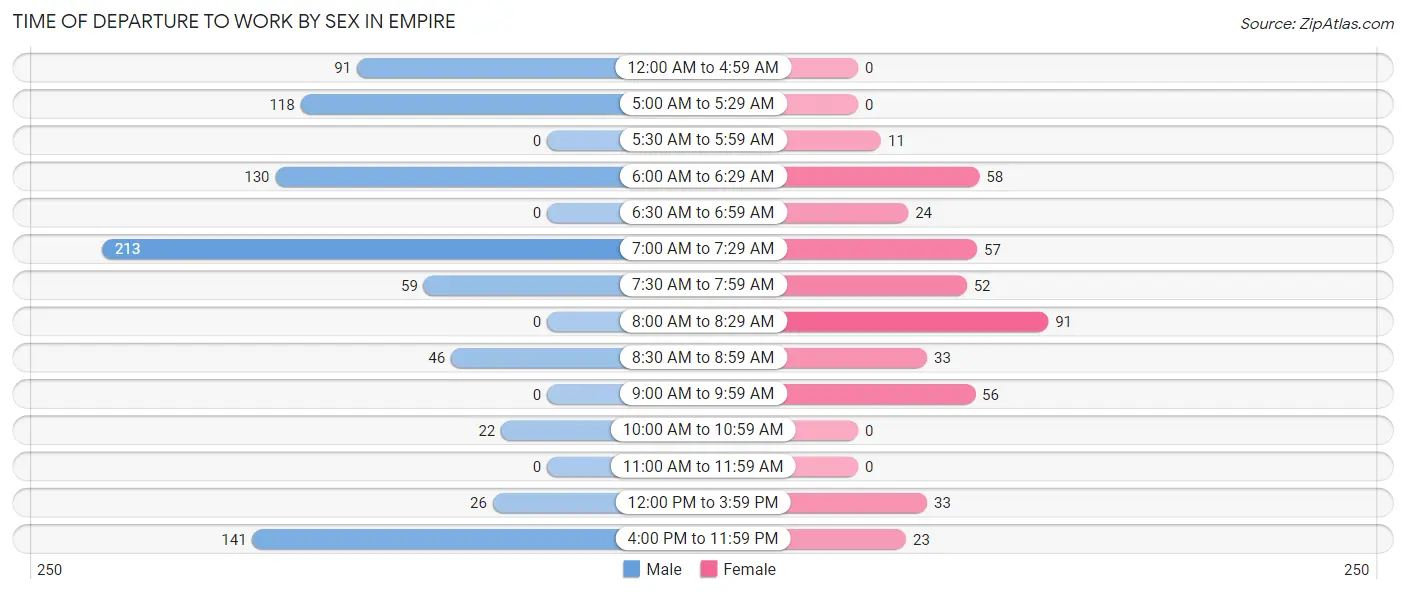
| Time of Departure | Male | Female |
| 12:00 AM to 4:59 AM | 91 (10.8%) | 0 (0.0%) |
| 5:00 AM to 5:29 AM | 118 (14.0%) | 0 (0.0%) |
| 5:30 AM to 5:59 AM | 0 (0.0%) | 11 (2.5%) |
| 6:00 AM to 6:29 AM | 130 (15.4%) | 58 (13.2%) |
| 6:30 AM to 6:59 AM | 0 (0.0%) | 24 (5.5%) |
| 7:00 AM to 7:29 AM | 213 (25.2%) | 57 (13.0%) |
| 7:30 AM to 7:59 AM | 59 (7.0%) | 52 (11.9%) |
| 8:00 AM to 8:29 AM | 0 (0.0%) | 91 (20.8%) |
| 8:30 AM to 8:59 AM | 46 (5.4%) | 33 (7.5%) |
| 9:00 AM to 9:59 AM | 0 (0.0%) | 56 (12.8%) |
| 10:00 AM to 10:59 AM | 22 (2.6%) | 0 (0.0%) |
| 11:00 AM to 11:59 AM | 0 (0.0%) | 0 (0.0%) |
| 12:00 PM to 3:59 PM | 26 (3.1%) | 33 (7.5%) |
| 4:00 PM to 11:59 PM | 141 (16.7%) | 23 (5.2%) |
| Total | 846 (100.0%) | 438 (100.0%) |
Housing Occupancy in Empire
Occupancy by Ownership in Empire
Of the total 1,186 dwellings in Empire, owner-occupied units account for 705 (59.4%), while renter-occupied units make up 481 (40.6%).
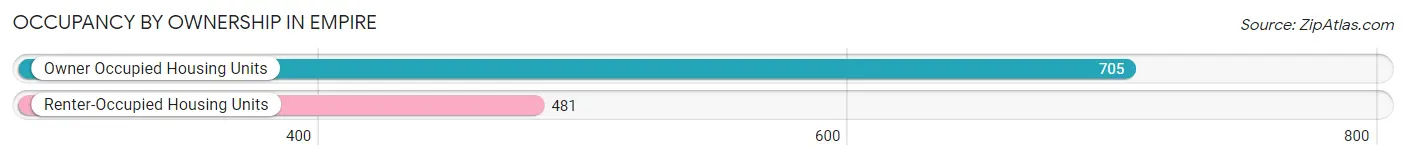
| Occupancy | # Housing Units | % Housing Units |
| Owner Occupied Housing Units | 705 | 59.4% |
| Renter-Occupied Housing Units | 481 | 40.6% |
| Total Occupied Housing Units | 1,186 | 100.0% |
Occupancy by Household Size in Empire
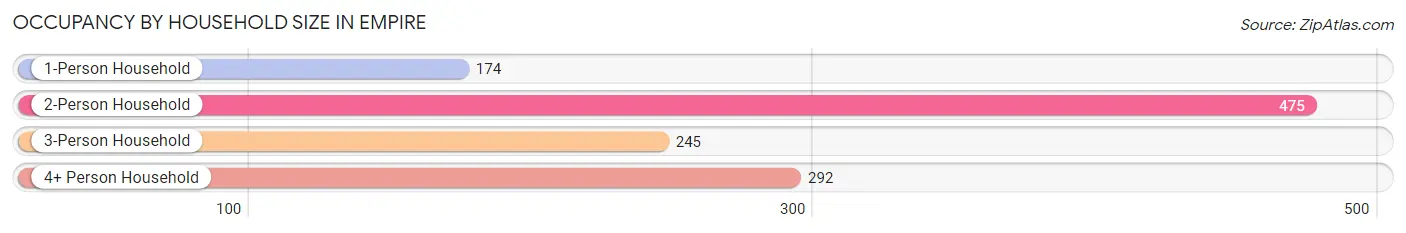
| Household Size | # Housing Units | % Housing Units |
| 1-Person Household | 174 | 14.7% |
| 2-Person Household | 475 | 40.1% |
| 3-Person Household | 245 | 20.7% |
| 4+ Person Household | 292 | 24.6% |
| Total Housing Units | 1,186 | 100.0% |
Occupancy by Ownership by Household Size in Empire
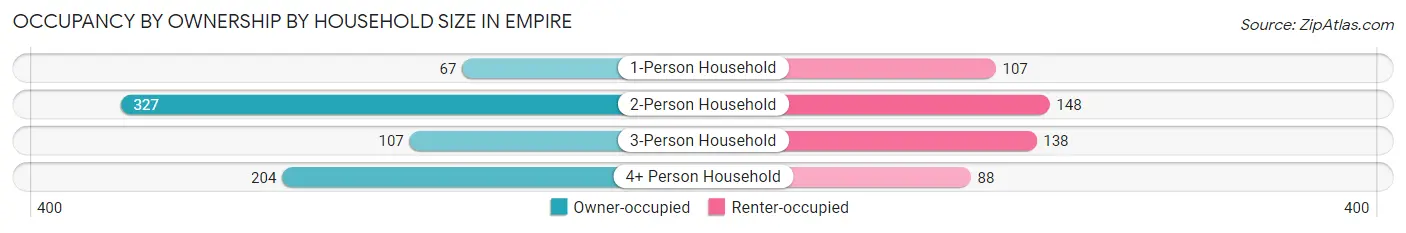
| Household Size | Owner-occupied | Renter-occupied |
| 1-Person Household | 67 (38.5%) | 107 (61.5%) |
| 2-Person Household | 327 (68.8%) | 148 (31.2%) |
| 3-Person Household | 107 (43.7%) | 138 (56.3%) |
| 4+ Person Household | 204 (69.9%) | 88 (30.1%) |
| Total Housing Units | 705 (59.4%) | 481 (40.6%) |
Occupancy by Educational Attainment in Empire
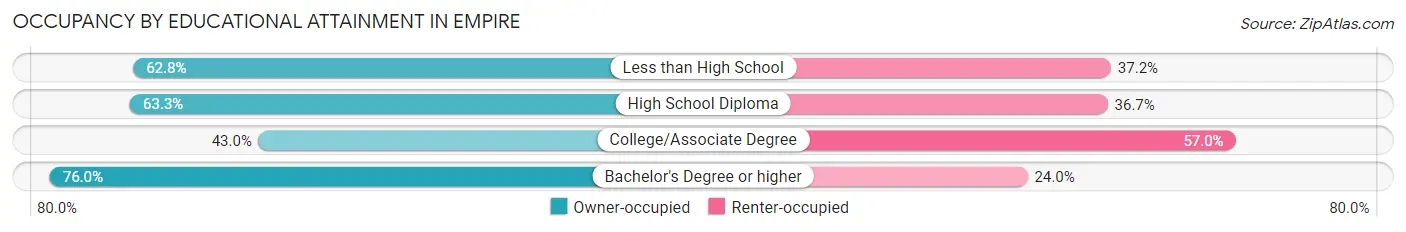
| Household Size | Owner-occupied | Renter-occupied |
| Less than High School | 172 (62.8%) | 102 (37.2%) |
| High School Diploma | 362 (63.3%) | 210 (36.7%) |
| College/Associate Degree | 114 (43.0%) | 151 (57.0%) |
| Bachelor's Degree or higher | 57 (76.0%) | 18 (24.0%) |
Occupancy by Age of Householder in Empire

| Age Bracket | # Households | % Households |
| Under 35 Years | 253 | 21.3% |
| 35 to 44 Years | 191 | 16.1% |
| 45 to 54 Years | 263 | 22.2% |
| 55 to 64 Years | 161 | 13.6% |
| 65 to 74 Years | 233 | 19.7% |
| 75 to 84 Years | 85 | 7.2% |
| 85 Years and Over | 0 | 0.0% |
| Total | 1,186 | 100.0% |
Housing Finances in Empire
Median Income by Occupancy in Empire
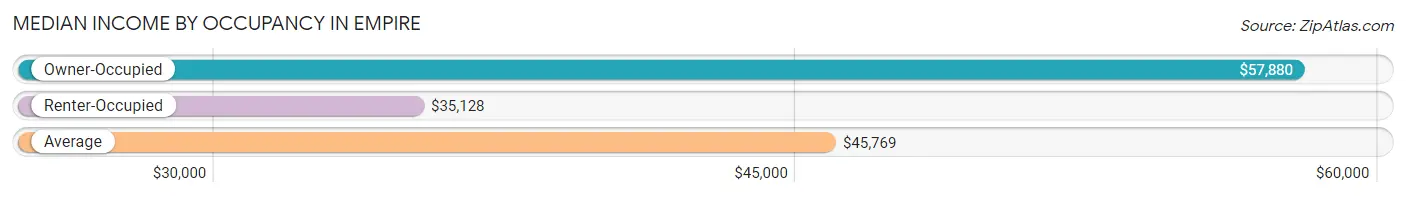
| Occupancy Type | # Households | Median Income |
| Owner-Occupied | 705 (59.4%) | $57,880 |
| Renter-Occupied | 481 (40.6%) | $35,128 |
| Average | 1,186 (100.0%) | $45,769 |
Occupancy by Householder Income Bracket in Empire
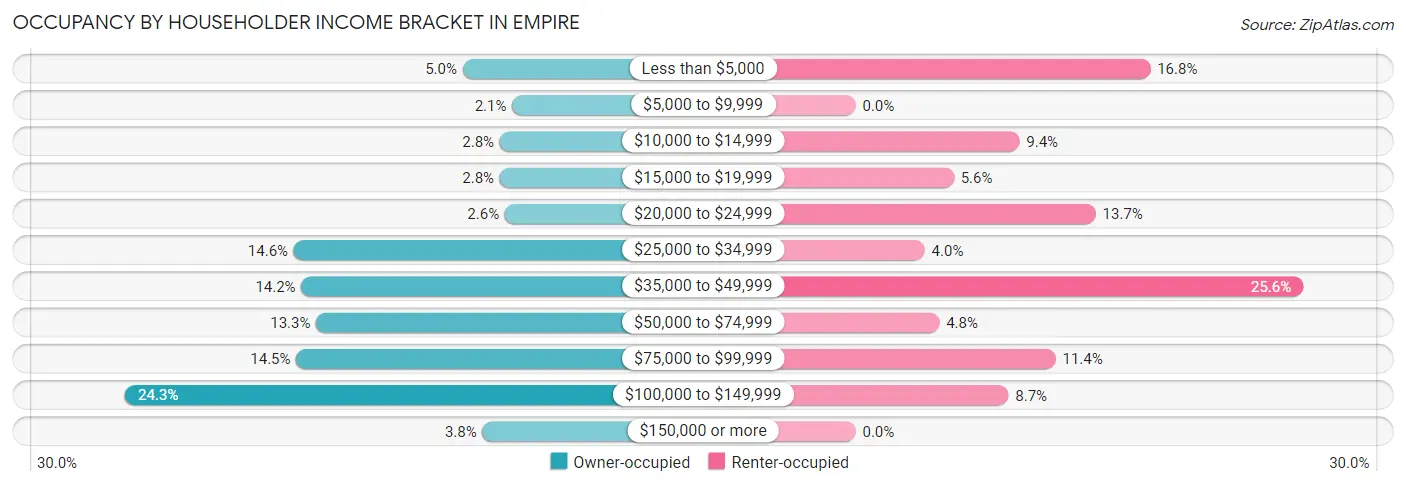
| Income Bracket | Owner-occupied | Renter-occupied |
| Less than $5,000 | 35 (5.0%) | 81 (16.8%) |
| $5,000 to $9,999 | 15 (2.1%) | 0 (0.0%) |
| $10,000 to $14,999 | 20 (2.8%) | 45 (9.4%) |
| $15,000 to $19,999 | 20 (2.8%) | 27 (5.6%) |
| $20,000 to $24,999 | 18 (2.5%) | 66 (13.7%) |
| $25,000 to $34,999 | 103 (14.6%) | 19 (4.0%) |
| $35,000 to $49,999 | 100 (14.2%) | 123 (25.6%) |
| $50,000 to $74,999 | 94 (13.3%) | 23 (4.8%) |
| $75,000 to $99,999 | 102 (14.5%) | 55 (11.4%) |
| $100,000 to $149,999 | 171 (24.3%) | 42 (8.7%) |
| $150,000 or more | 27 (3.8%) | 0 (0.0%) |
| Total | 705 (100.0%) | 481 (100.0%) |
Monthly Housing Cost Tiers in Empire
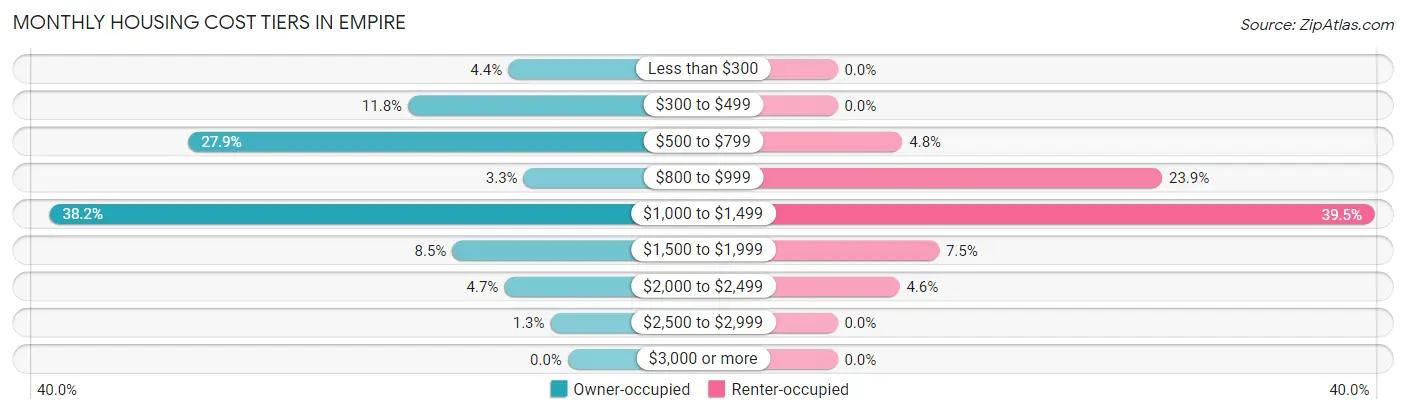
| Monthly Cost | Owner-occupied | Renter-occupied |
| Less than $300 | 31 (4.4%) | 0 (0.0%) |
| $300 to $499 | 83 (11.8%) | 0 (0.0%) |
| $500 to $799 | 197 (27.9%) | 23 (4.8%) |
| $800 to $999 | 23 (3.3%) | 115 (23.9%) |
| $1,000 to $1,499 | 269 (38.2%) | 190 (39.5%) |
| $1,500 to $1,999 | 60 (8.5%) | 36 (7.5%) |
| $2,000 to $2,499 | 33 (4.7%) | 22 (4.6%) |
| $2,500 to $2,999 | 9 (1.3%) | 0 (0.0%) |
| $3,000 or more | 0 (0.0%) | 0 (0.0%) |
| Total | 705 (100.0%) | 481 (100.0%) |
Physical Housing Characteristics in Empire
Housing Structures in Empire
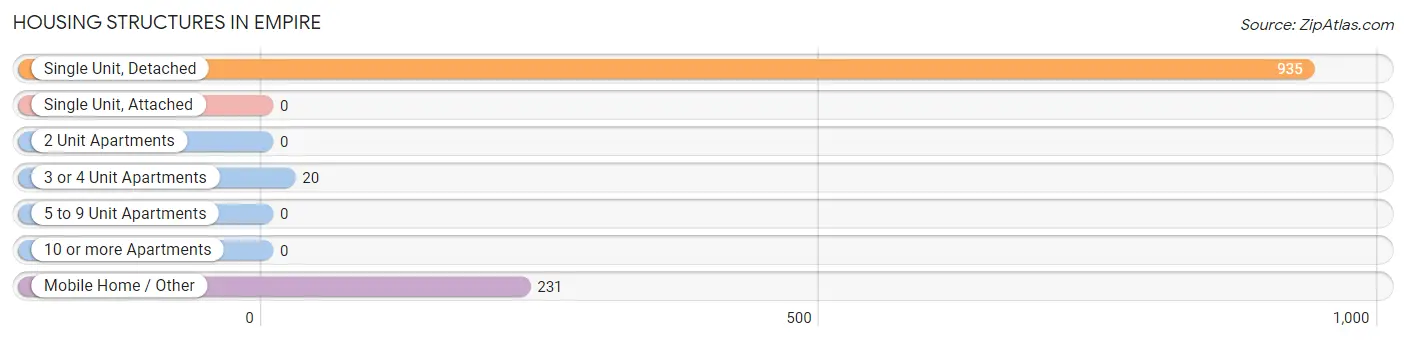
| Structure Type | # Housing Units | % Housing Units |
| Single Unit, Detached | 935 | 78.8% |
| Single Unit, Attached | 0 | 0.0% |
| 2 Unit Apartments | 0 | 0.0% |
| 3 or 4 Unit Apartments | 20 | 1.7% |
| 5 to 9 Unit Apartments | 0 | 0.0% |
| 10 or more Apartments | 0 | 0.0% |
| Mobile Home / Other | 231 | 19.5% |
| Total | 1,186 | 100.0% |
Housing Structures by Occupancy in Empire
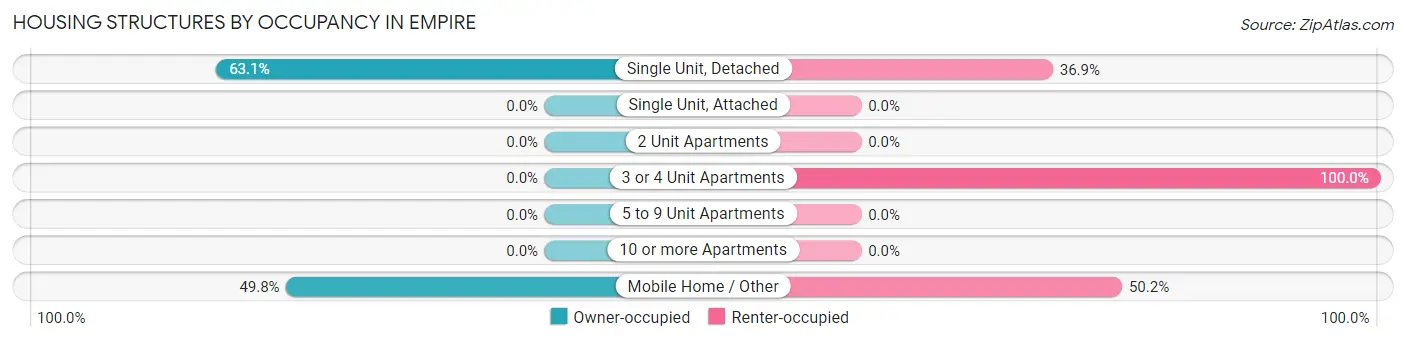
| Structure Type | Owner-occupied | Renter-occupied |
| Single Unit, Detached | 590 (63.1%) | 345 (36.9%) |
| Single Unit, Attached | 0 (0.0%) | 0 (0.0%) |
| 2 Unit Apartments | 0 (0.0%) | 0 (0.0%) |
| 3 or 4 Unit Apartments | 0 (0.0%) | 20 (100.0%) |
| 5 to 9 Unit Apartments | 0 (0.0%) | 0 (0.0%) |
| 10 or more Apartments | 0 (0.0%) | 0 (0.0%) |
| Mobile Home / Other | 115 (49.8%) | 116 (50.2%) |
| Total | 705 (59.4%) | 481 (40.6%) |
Housing Structures by Number of Rooms in Empire
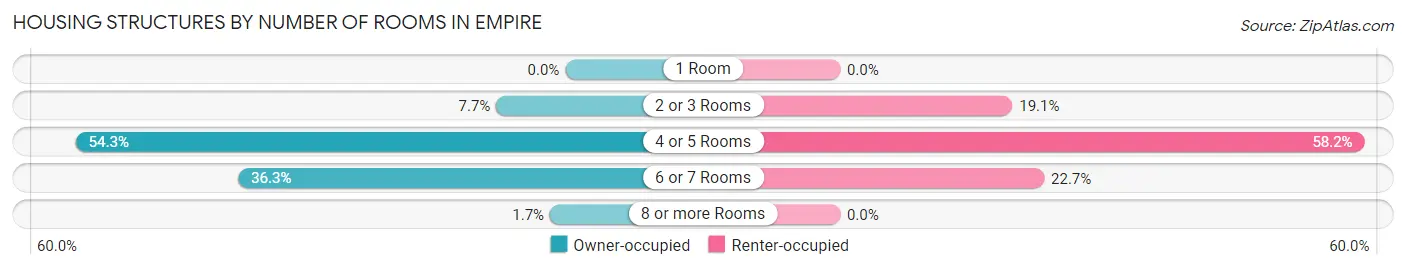
| Number of Rooms | Owner-occupied | Renter-occupied |
| 1 Room | 0 (0.0%) | 0 (0.0%) |
| 2 or 3 Rooms | 54 (7.7%) | 92 (19.1%) |
| 4 or 5 Rooms | 383 (54.3%) | 280 (58.2%) |
| 6 or 7 Rooms | 256 (36.3%) | 109 (22.7%) |
| 8 or more Rooms | 12 (1.7%) | 0 (0.0%) |
| Total | 705 (100.0%) | 481 (100.0%) |
Housing Structure by Heating Type in Empire
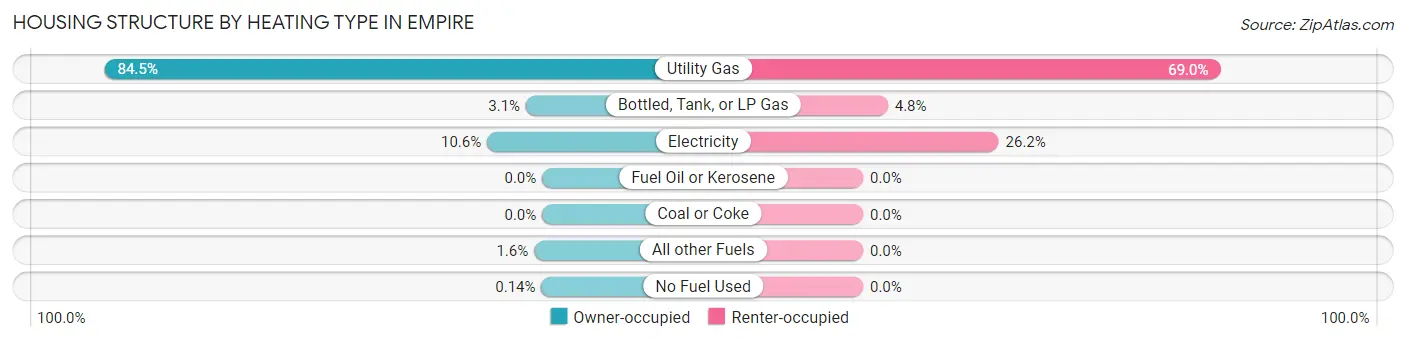
| Heating Type | Owner-occupied | Renter-occupied |
| Utility Gas | 596 (84.5%) | 332 (69.0%) |
| Bottled, Tank, or LP Gas | 22 (3.1%) | 23 (4.8%) |
| Electricity | 75 (10.6%) | 126 (26.2%) |
| Fuel Oil or Kerosene | 0 (0.0%) | 0 (0.0%) |
| Coal or Coke | 0 (0.0%) | 0 (0.0%) |
| All other Fuels | 11 (1.6%) | 0 (0.0%) |
| No Fuel Used | 1 (0.1%) | 0 (0.0%) |
| Total | 705 (100.0%) | 481 (100.0%) |
Household Vehicle Usage in Empire
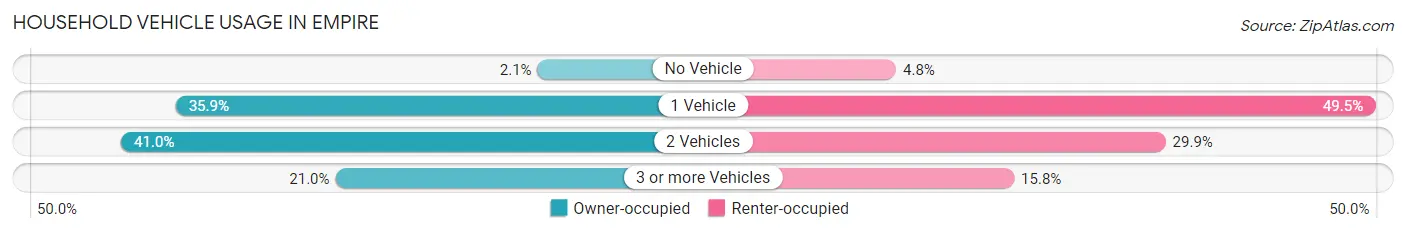
| Vehicles per Household | Owner-occupied | Renter-occupied |
| No Vehicle | 15 (2.1%) | 23 (4.8%) |
| 1 Vehicle | 253 (35.9%) | 238 (49.5%) |
| 2 Vehicles | 289 (41.0%) | 144 (29.9%) |
| 3 or more Vehicles | 148 (21.0%) | 76 (15.8%) |
| Total | 705 (100.0%) | 481 (100.0%) |
Real Estate & Mortgages in Empire
Real Estate and Mortgage Overview in Empire
| Characteristic | Without Mortgage | With Mortgage |
| Housing Units | 355 | 350 |
| Median Property Value | $279,400 | $240,000 |
| Median Household Income | $47,633 | $27 |
| Monthly Housing Costs | $553 | $0 |
| Real Estate Taxes | $1,655 | $0 |
Property Value by Mortgage Status in Empire
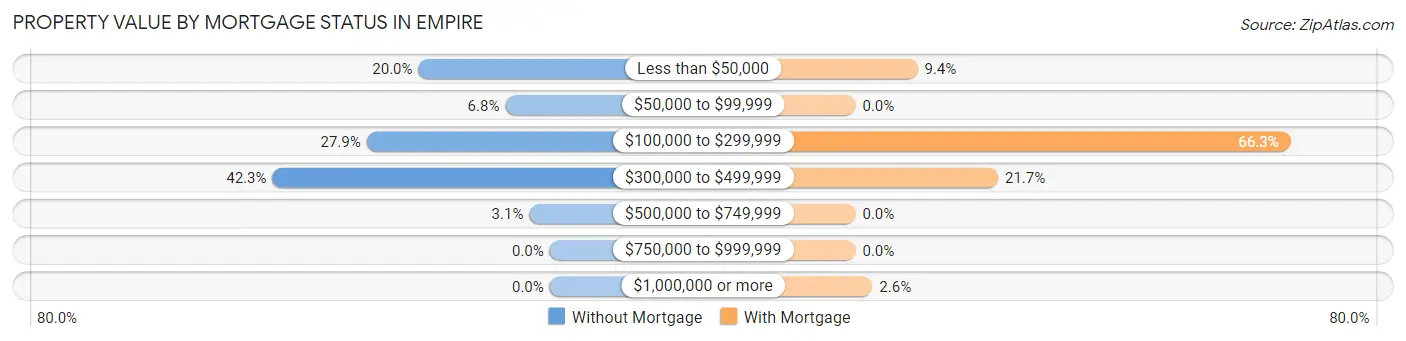
| Property Value | Without Mortgage | With Mortgage |
| Less than $50,000 | 71 (20.0%) | 33 (9.4%) |
| $50,000 to $99,999 | 24 (6.8%) | 0 (0.0%) |
| $100,000 to $299,999 | 99 (27.9%) | 232 (66.3%) |
| $300,000 to $499,999 | 150 (42.2%) | 76 (21.7%) |
| $500,000 to $749,999 | 11 (3.1%) | 0 (0.0%) |
| $750,000 to $999,999 | 0 (0.0%) | 0 (0.0%) |
| $1,000,000 or more | 0 (0.0%) | 9 (2.6%) |
| Total | 355 (100.0%) | 350 (100.0%) |
Household Income by Mortgage Status in Empire
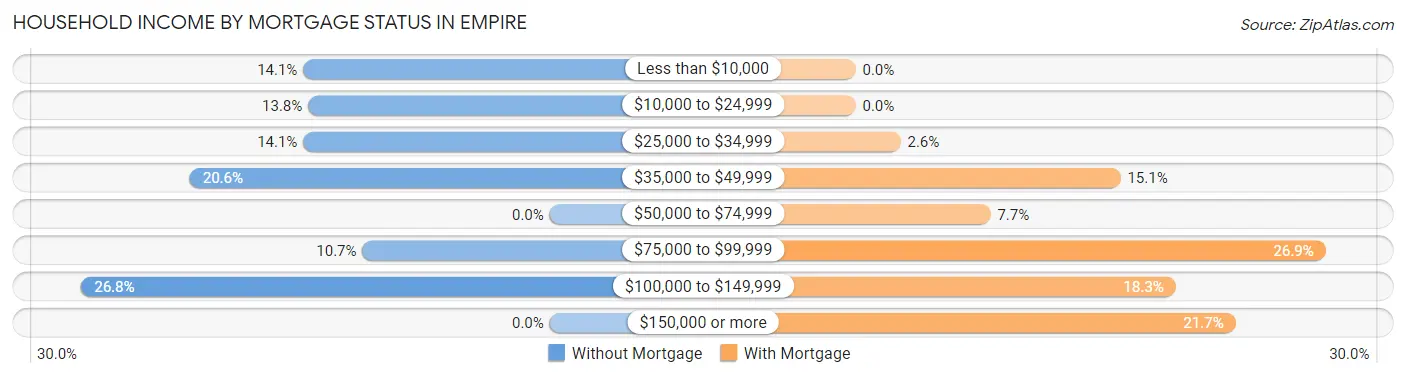
| Household Income | Without Mortgage | With Mortgage |
| Less than $10,000 | 50 (14.1%) | 0 (0.0%) |
| $10,000 to $24,999 | 49 (13.8%) | 0 (0.0%) |
| $25,000 to $34,999 | 50 (14.1%) | 9 (2.6%) |
| $35,000 to $49,999 | 73 (20.6%) | 53 (15.1%) |
| $50,000 to $74,999 | 0 (0.0%) | 27 (7.7%) |
| $75,000 to $99,999 | 38 (10.7%) | 94 (26.9%) |
| $100,000 to $149,999 | 95 (26.8%) | 64 (18.3%) |
| $150,000 or more | 0 (0.0%) | 76 (21.7%) |
| Total | 355 (100.0%) | 350 (100.0%) |
Property Value to Household Income Ratio in Empire
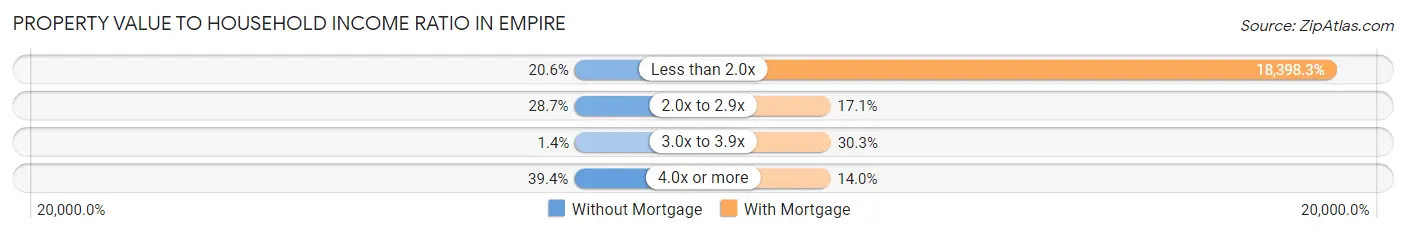
| Value-to-Income Ratio | Without Mortgage | With Mortgage |
| Less than 2.0x | 73 (20.6%) | 64,394 (18,398.3%) |
| 2.0x to 2.9x | 102 (28.7%) | 60 (17.1%) |
| 3.0x to 3.9x | 5 (1.4%) | 106 (30.3%) |
| 4.0x or more | 140 (39.4%) | 49 (14.0%) |
| Total | 355 (100.0%) | 350 (100.0%) |
Real Estate Taxes by Mortgage Status in Empire
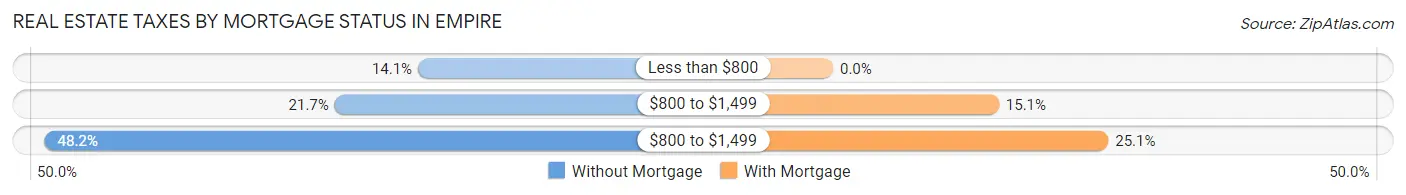
| Property Taxes | Without Mortgage | With Mortgage |
| Less than $800 | 50 (14.1%) | 0 (0.0%) |
| $800 to $1,499 | 77 (21.7%) | 53 (15.1%) |
| $800 to $1,499 | 171 (48.2%) | 88 (25.1%) |
| Total | 355 (100.0%) | 350 (100.0%) |
Health & Disability in Empire
Health Insurance Coverage by Age in Empire
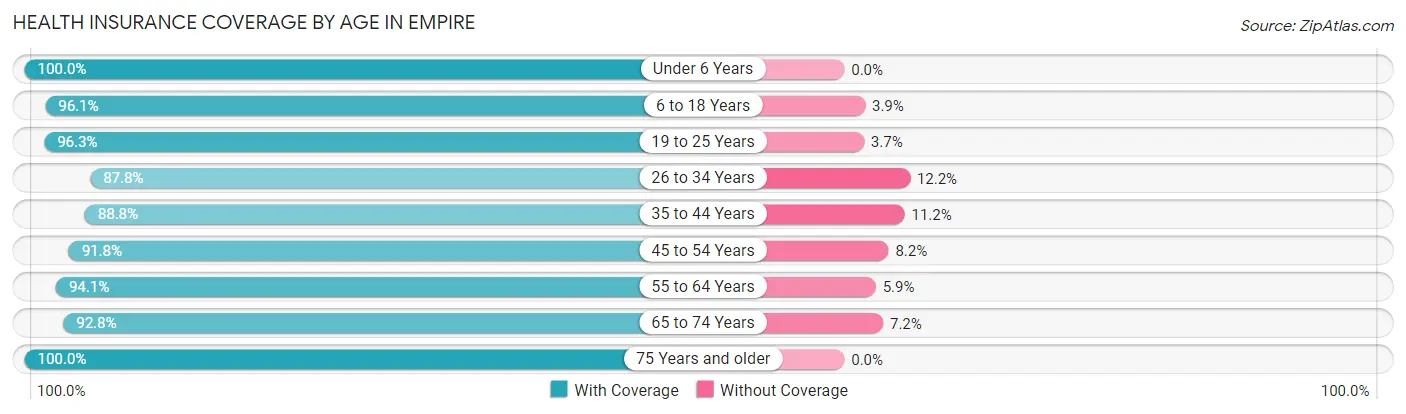
| Age Bracket | With Coverage | Without Coverage |
| Under 6 Years | 266 (100.0%) | 0 (0.0%) |
| 6 to 18 Years | 596 (96.1%) | 24 (3.9%) |
| 19 to 25 Years | 237 (96.3%) | 9 (3.7%) |
| 26 to 34 Years | 430 (87.8%) | 60 (12.2%) |
| 35 to 44 Years | 529 (88.8%) | 67 (11.2%) |
| 45 to 54 Years | 479 (91.8%) | 43 (8.2%) |
| 55 to 64 Years | 450 (94.1%) | 28 (5.9%) |
| 65 to 74 Years | 347 (92.8%) | 27 (7.2%) |
| 75 Years and older | 134 (100.0%) | 0 (0.0%) |
| Total | 3,468 (93.1%) | 258 (6.9%) |
Health Insurance Coverage by Citizenship Status in Empire
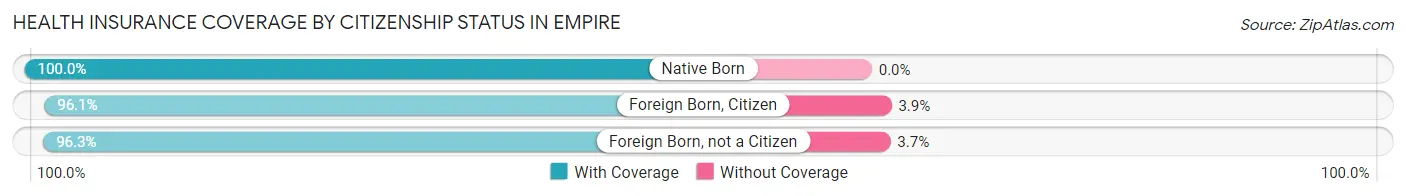
| Citizenship Status | With Coverage | Without Coverage |
| Native Born | 266 (100.0%) | 0 (0.0%) |
| Foreign Born, Citizen | 596 (96.1%) | 24 (3.9%) |
| Foreign Born, not a Citizen | 237 (96.3%) | 9 (3.7%) |
Health Insurance Coverage by Household Income in Empire
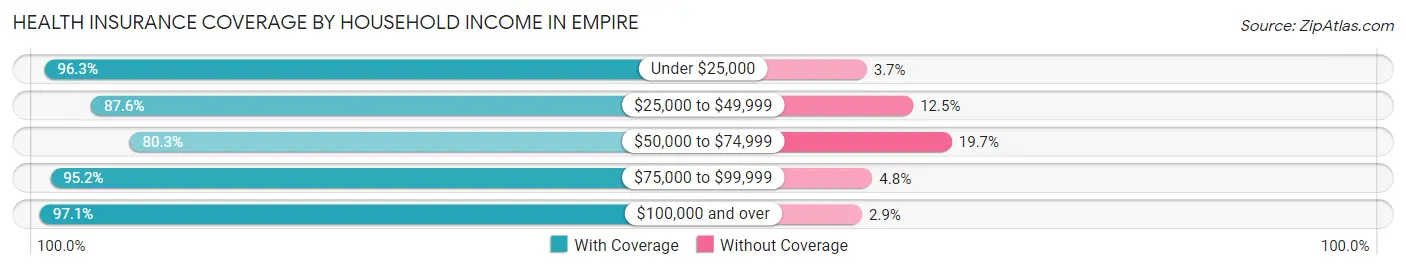
| Household Income | With Coverage | Without Coverage |
| Under $25,000 | 694 (96.3%) | 27 (3.7%) |
| $25,000 to $49,999 | 802 (87.5%) | 114 (12.4%) |
| $50,000 to $74,999 | 208 (80.3%) | 51 (19.7%) |
| $75,000 to $99,999 | 655 (95.2%) | 33 (4.8%) |
| $100,000 and over | 948 (97.1%) | 28 (2.9%) |
Public vs Private Health Insurance Coverage by Age in Empire
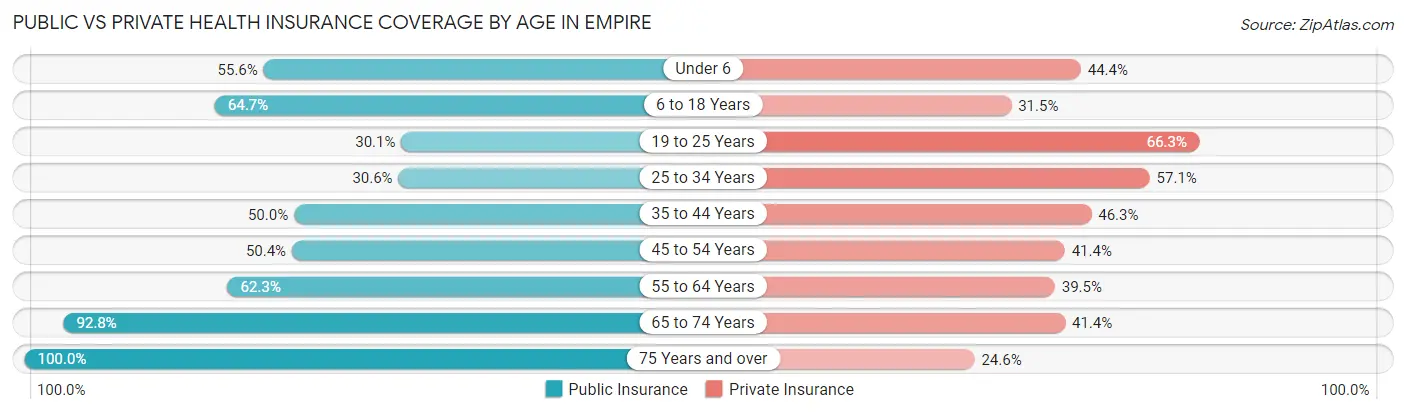
| Age Bracket | Public Insurance | Private Insurance |
| Under 6 | 148 (55.6%) | 118 (44.4%) |
| 6 to 18 Years | 401 (64.7%) | 195 (31.5%) |
| 19 to 25 Years | 74 (30.1%) | 163 (66.3%) |
| 25 to 34 Years | 150 (30.6%) | 280 (57.1%) |
| 35 to 44 Years | 298 (50.0%) | 276 (46.3%) |
| 45 to 54 Years | 263 (50.4%) | 216 (41.4%) |
| 55 to 64 Years | 298 (62.3%) | 189 (39.5%) |
| 65 to 74 Years | 347 (92.8%) | 155 (41.4%) |
| 75 Years and over | 134 (100.0%) | 33 (24.6%) |
| Total | 2,113 (56.7%) | 1,625 (43.6%) |
Disability Status by Sex by Age in Empire
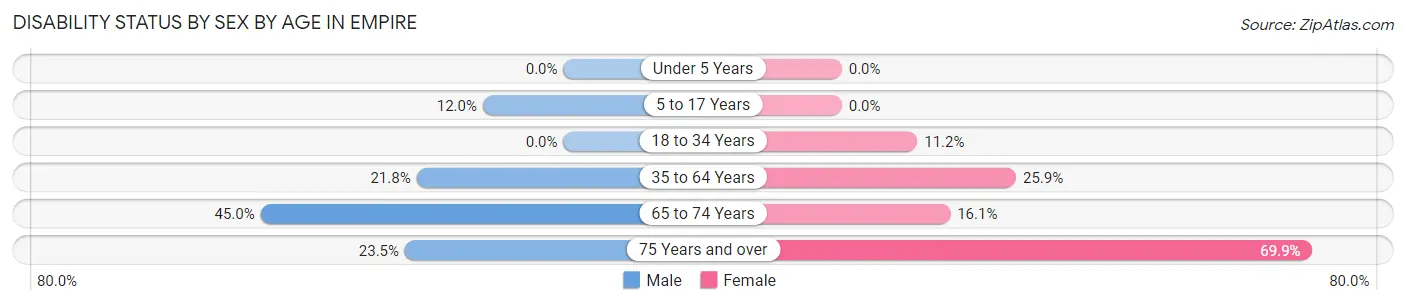
| Age Bracket | Male | Female |
| Under 5 Years | 0 (0.0%) | 0 (0.0%) |
| 5 to 17 Years | 44 (12.0%) | 0 (0.0%) |
| 18 to 34 Years | 0 (0.0%) | 52 (11.2%) |
| 35 to 64 Years | 193 (21.8%) | 184 (25.9%) |
| 65 to 74 Years | 76 (45.0%) | 33 (16.1%) |
| 75 Years and over | 12 (23.5%) | 58 (69.9%) |
Disability Class by Sex by Age in Empire
Disability Class: Hearing Difficulty
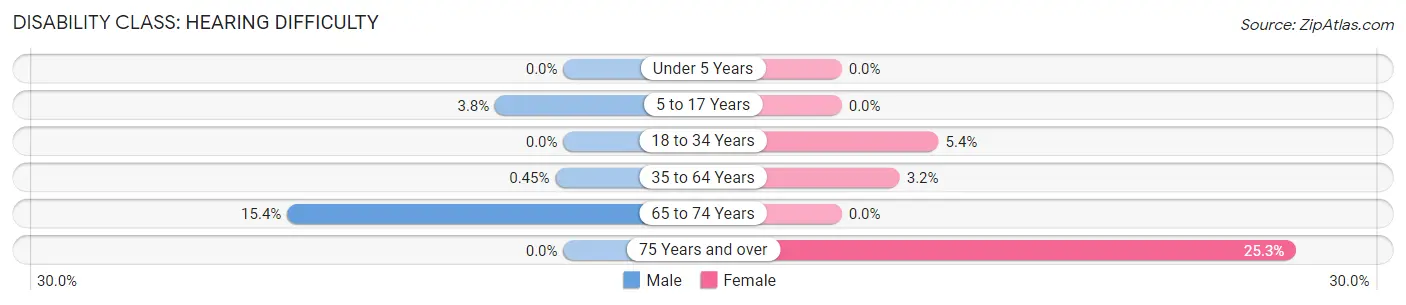
| Age Bracket | Male | Female |
| Under 5 Years | 0 (0.0%) | 0 (0.0%) |
| 5 to 17 Years | 14 (3.8%) | 0 (0.0%) |
| 18 to 34 Years | 0 (0.0%) | 25 (5.4%) |
| 35 to 64 Years | 4 (0.4%) | 23 (3.2%) |
| 65 to 74 Years | 26 (15.4%) | 0 (0.0%) |
| 75 Years and over | 0 (0.0%) | 21 (25.3%) |
Disability Class: Vision Difficulty
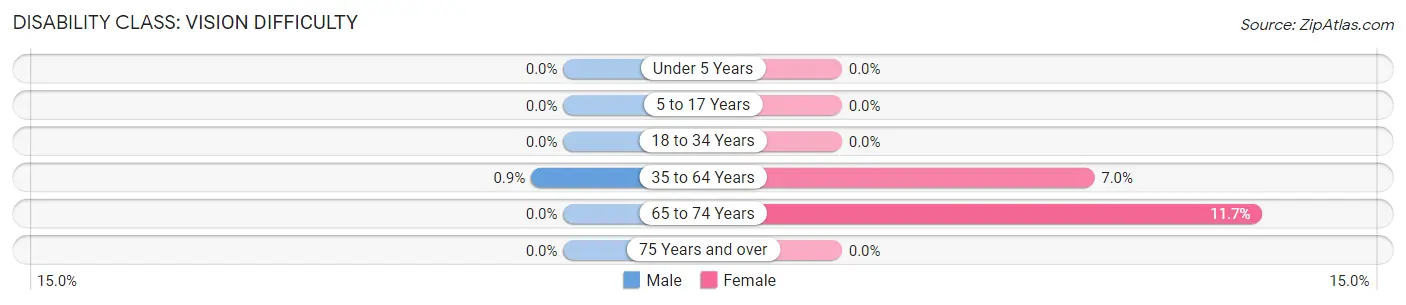
| Age Bracket | Male | Female |
| Under 5 Years | 0 (0.0%) | 0 (0.0%) |
| 5 to 17 Years | 0 (0.0%) | 0 (0.0%) |
| 18 to 34 Years | 0 (0.0%) | 0 (0.0%) |
| 35 to 64 Years | 8 (0.9%) | 50 (7.0%) |
| 65 to 74 Years | 0 (0.0%) | 24 (11.7%) |
| 75 Years and over | 0 (0.0%) | 0 (0.0%) |
Disability Class: Cognitive Difficulty
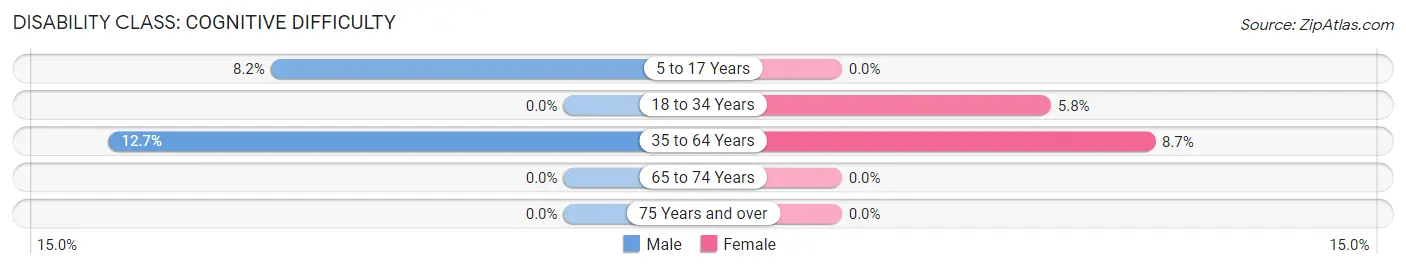
| Age Bracket | Male | Female |
| 5 to 17 Years | 30 (8.2%) | 0 (0.0%) |
| 18 to 34 Years | 0 (0.0%) | 27 (5.8%) |
| 35 to 64 Years | 112 (12.7%) | 62 (8.7%) |
| 65 to 74 Years | 0 (0.0%) | 0 (0.0%) |
| 75 Years and over | 0 (0.0%) | 0 (0.0%) |
Disability Class: Ambulatory Difficulty
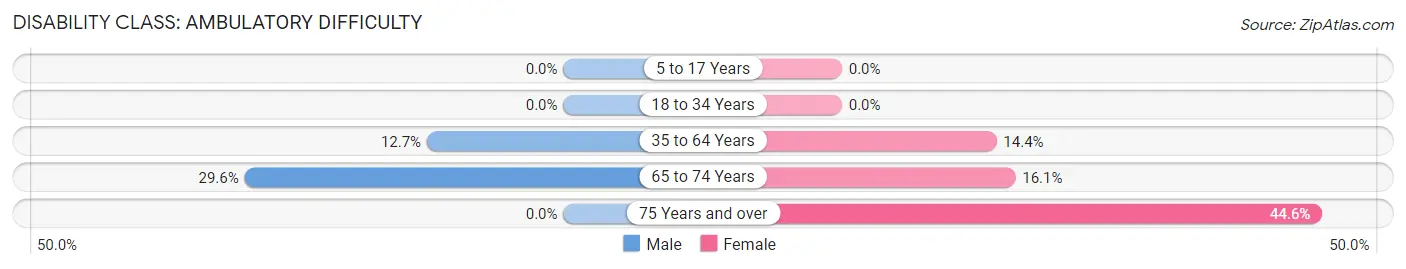
| Age Bracket | Male | Female |
| 5 to 17 Years | 0 (0.0%) | 0 (0.0%) |
| 18 to 34 Years | 0 (0.0%) | 0 (0.0%) |
| 35 to 64 Years | 112 (12.7%) | 102 (14.3%) |
| 65 to 74 Years | 50 (29.6%) | 33 (16.1%) |
| 75 Years and over | 0 (0.0%) | 37 (44.6%) |
Disability Class: Self-Care Difficulty
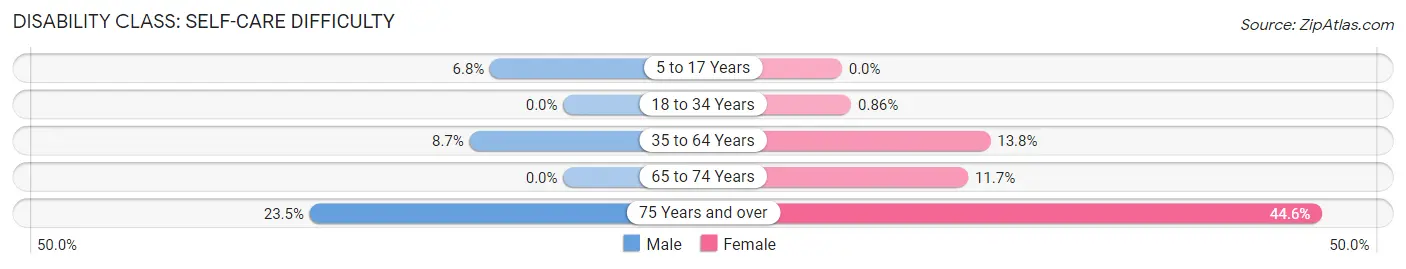
| Age Bracket | Male | Female |
| 5 to 17 Years | 25 (6.8%) | 0 (0.0%) |
| 18 to 34 Years | 0 (0.0%) | 4 (0.9%) |
| 35 to 64 Years | 77 (8.7%) | 98 (13.8%) |
| 65 to 74 Years | 0 (0.0%) | 24 (11.7%) |
| 75 Years and over | 12 (23.5%) | 37 (44.6%) |
Technology Access in Empire
Computing Device Access in Empire
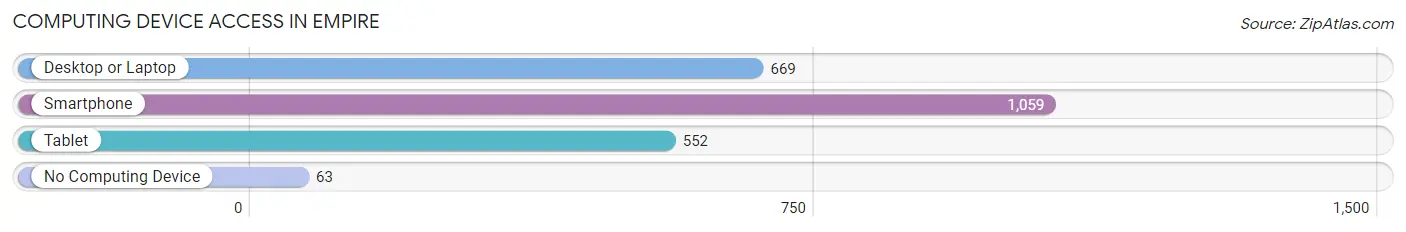
| Device Type | # Households | % Households |
| Desktop or Laptop | 669 | 56.4% |
| Smartphone | 1,059 | 89.3% |
| Tablet | 552 | 46.5% |
| No Computing Device | 63 | 5.3% |
| Total | 1,186 | 100.0% |
Internet Access in Empire
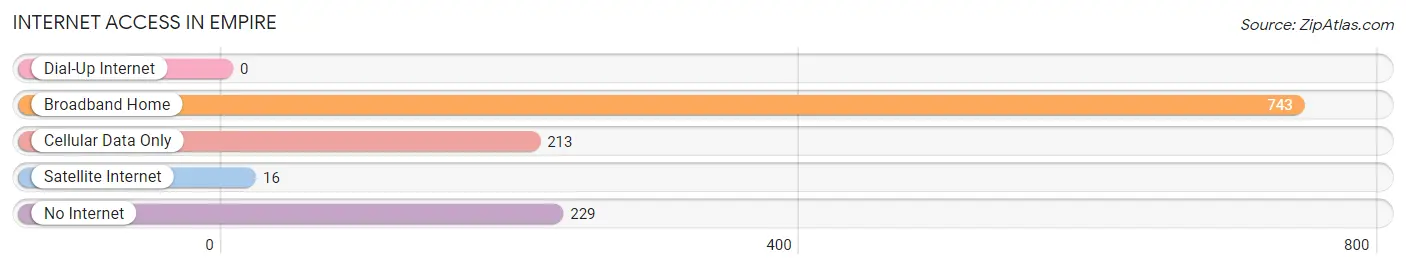
| Internet Type | # Households | % Households |
| Dial-Up Internet | 0 | 0.0% |
| Broadband Home | 743 | 62.6% |
| Cellular Data Only | 213 | 18.0% |
| Satellite Internet | 16 | 1.3% |
| No Internet | 229 | 19.3% |
| Total | 1,186 | 100.0% |
Empire Summary
Empire is a census-designated place located in San Bernardino County, California. It is situated in the western part of the Mojave Desert, approximately 10 miles east of the city of Barstow. The population of Empire was 1,945 at the 2010 census.
Geography
Empire is located at 34°51'25"N 116°45'45"W (34.856944, -116.762500). According to the United States Census Bureau, the CDP has a total area of 4.2 square miles (10.8 km2), all of it land.
The terrain of Empire is mostly flat, with some rolling hills. The area is part of the Mojave Desert, and is characterized by sparse vegetation and dry, sandy soil. The climate is hot and dry, with temperatures ranging from the mid-90s in the summer to the mid-50s in the winter.
History
The area that is now Empire was first settled in the late 19th century by miners and ranchers. The town was officially founded in 1906, and was named after the Empire Mine, which was located nearby. The mine was a major producer of gold and silver, and was in operation until the early 1940s.
In the 1950s, the town began to experience a population boom as people moved to the area to take advantage of the booming mining industry. The population peaked in the 1960s, but began to decline in the 1970s as the mining industry declined.
Economy
The economy of Empire is largely based on mining and tourism. The town is home to several mining companies, including the Empire Mine, which is still in operation. The mine produces gold, silver, and other minerals.
The town is also a popular tourist destination, as it is located near several attractions, including the Mojave National Preserve and the Calico Ghost Town. The town is also home to several restaurants, shops, and other businesses.
Demographics
As of the 2010 census, there were 1,945 people, 690 households, and 517 families residing in Empire. The population density was 462.2 people per square mile (178.7/km2). There were 790 housing units at an average density of 188.7 per square mile (72.8/km2). The racial makeup of Empire was 75.2% White, 1.2% African American, 1.2% Native American, 0.6% Asian, 0.1% Pacific Islander, 17.7% from other races, and 4.0% from two or more races. Hispanic or Latino of any race were 33.2% of the population.
There were 690 households, out of which 33.3% had children under the age of 18 living with them, 54.3% were married couples living together, 11.3% had a female householder with no husband present, and 28.3% were non-families. 22.2% of all households were made up of individuals, and 8.3% had someone living alone who was 65 years of age or older. The average household size was 2.81 and the average family size was 3.30.
In Empire, the population was spread out, with 28.2% under the age of 18, 8.2% from 18 to 24, 25.2% from 25 to 44, 25.2% from 45 to 64, and 13.2% who were 65 years of age or older. The median age was 36 years. For every 100 females, there were 103.2 males. For every 100 females age 18 and over, there were 101.2 males.
The median income for a household in Empire was $37,917, and the median income for a family was $41,250. Males had a median income of $35,000 versus $25,000 for females. The per capita income for the CDP was $15,945. About 11.2% of families and 14.2% of the population were below the poverty line, including 19.2% of those under age 18 and 8.3% of those age 65 or over.
Common Questions
What is the Total Population of Empire?
Total Population of Empire is 3,726.
What is the Total Male Population of Empire?
Total Male Population of Empire is 1,924.
What is the Total Female Population of Empire?
Total Female Population of Empire is 1,802.
What is the Ratio of Males per 100 Females in Empire?
There are 106.77 Males per 100 Females in Empire.
What is the Ratio of Females per 100 Males in Empire?
There are 93.66 Females per 100 Males in Empire.
What is the Median Population Age in Empire?
Median Population Age in Empire is 38.0 Years.
What is the Average Family Size in Empire
Average Family Size in Empire is 3.3 People.
What is the Average Household Size in Empire
Average Household Size in Empire is 3.0 People.
What is Per Capita Income in Empire?
Per Capita income in Empire is $20,527.
What is the Median Family Income in Empire?
Median Family Income in Empire is $48,554.
What is the Median Household income in Empire?
Median Household Income in Empire is $45,769.
What is Income or Wage Gap in Empire?
Income or Wage Gap in Empire is 28.6%.
Women in Empire earn 71.4 cents for every dollar earned by a man.
What is Inequality or Gini Index in Empire?
Inequality or Gini Index in Empire is 0.45.
How Large is the Labor Force in Empire?
There are 1,609 People in the Labor Forcein in Empire.
What is the Percentage of People in the Labor Force in Empire?
53.5% of People are in the Labor Force in Empire.
What is the Unemployment Rate in Empire?
Unemployment Rate in Empire is 13.9%.