Eldridge, CA
Eldridge Map
Eldridge Overview
730
TOTAL POPULATION
351
MALE POPULATION
379
FEMALE POPULATION
92.61
MALES / 100 FEMALES
107.98
FEMALES / 100 MALES
54.5
MEDIAN AGE
2.6
AVG FAMILY SIZE
2.2
AVG HOUSEHOLD SIZE
$122,854
PER CAPITA INCOME
$137,109
AVG HOUSEHOLD INCOME
60.8%
WAGE / INCOME GAP [ % ]
39.2¢/ $1
WAGE / INCOME GAP [ $ ]
0.56
INEQUALITY / GINI INDEX
476
LABOR FORCE [ PEOPLE ]
71.3%
PERCENT IN LABOR FORCE
13.0%
UNEMPLOYMENT RATE
Eldridge Zip Codes
Eldridge Area Codes
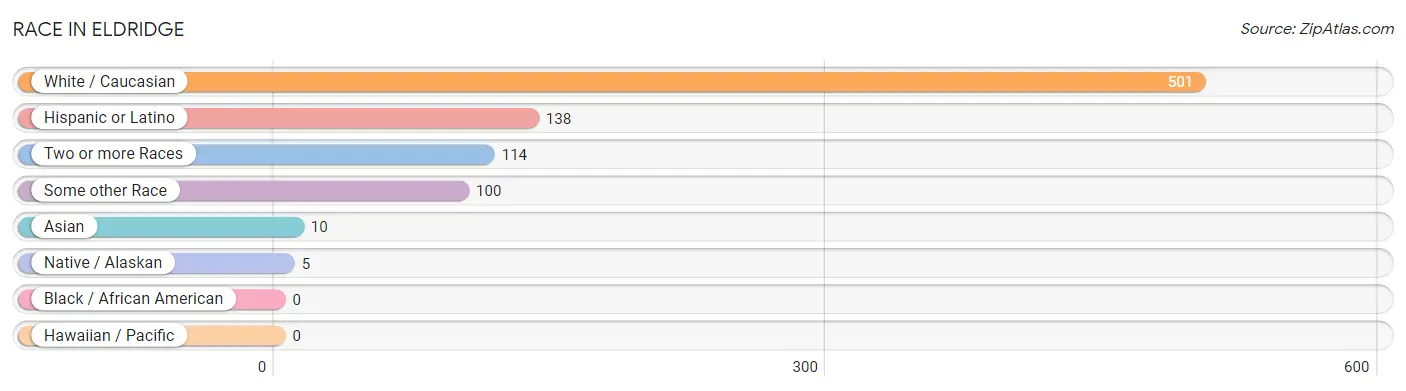
Race in Eldridge
The most populous races in Eldridge are White / Caucasian (501 | 68.6%), Hispanic or Latino (138 | 18.9%), and Two or more Races (114 | 15.6%).
| Race | # Population | % Population |
| Asian | 10 | 1.4% |
| Black / African American | 0 | 0.0% |
| Hawaiian / Pacific | 0 | 0.0% |
| Hispanic or Latino | 138 | 18.9% |
| Native / Alaskan | 5 | 0.7% |
| White / Caucasian | 501 | 68.6% |
| Two or more Races | 114 | 15.6% |
| Some other Race | 100 | 13.7% |
| Total | 730 | 100.0% |
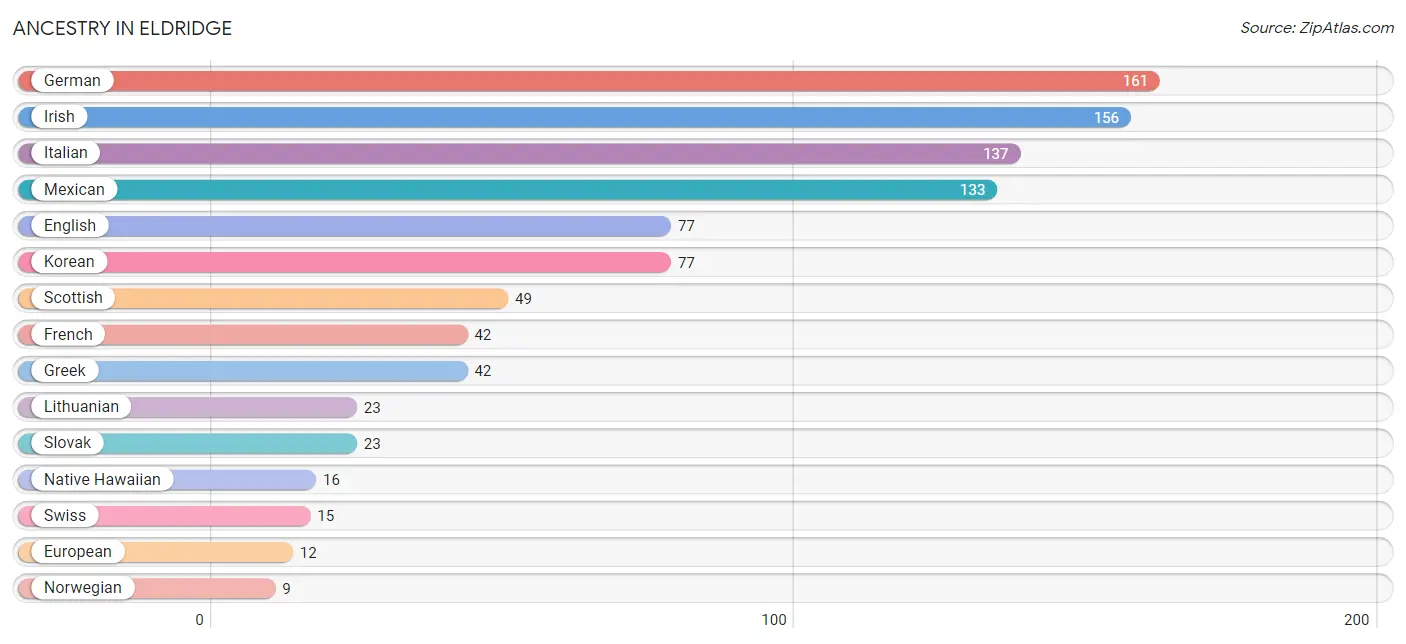
Ancestry in Eldridge
The most populous ancestries reported in Eldridge are German (161 | 22.1%), Irish (156 | 21.4%), Italian (137 | 18.8%), Mexican (133 | 18.2%), and English (77 | 10.5%), together accounting for 91.0% of all Eldridge residents.
| Ancestry | # Population | % Population |
| Central American | 5 | 0.7% |
| English | 77 | 10.5% |
| European | 12 | 1.6% |
| French | 42 | 5.8% |
| German | 161 | 22.1% |
| Greek | 42 | 5.8% |
| Irish | 156 | 21.4% |
| Italian | 137 | 18.8% |
| Korean | 77 | 10.5% |
| Lithuanian | 23 | 3.2% |
| Mexican | 133 | 18.2% |
| Native Hawaiian | 16 | 2.2% |
| Norwegian | 9 | 1.2% |
| Salvadoran | 5 | 0.7% |
| Scottish | 49 | 6.7% |
| Slovak | 23 | 3.2% |
| Swiss | 15 | 2.1% | View All 17 Rows |
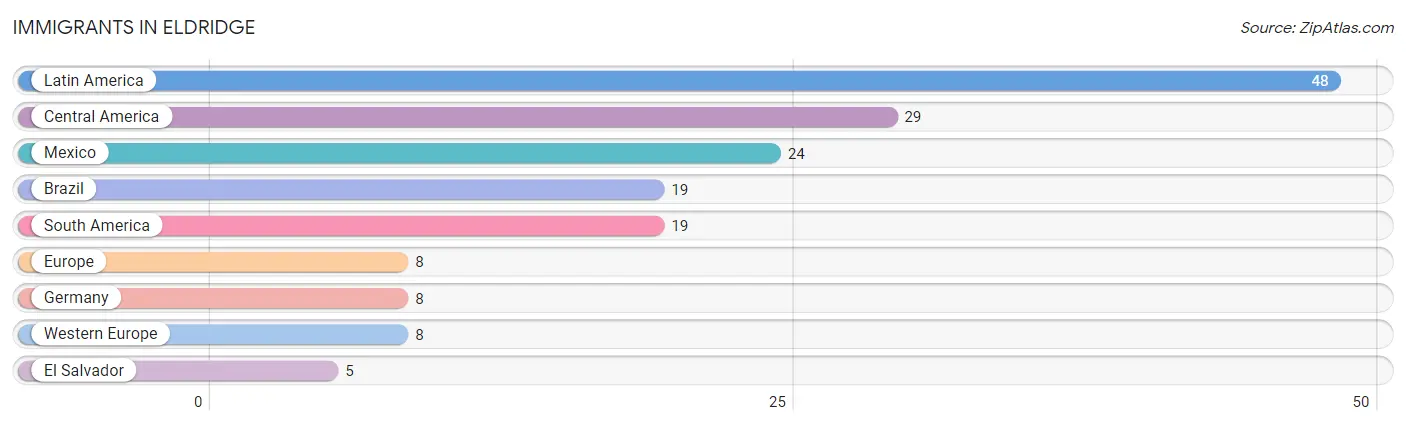
Immigrants in Eldridge
The most numerous immigrant groups reported in Eldridge came from Latin America (48 | 6.6%), Central America (29 | 4.0%), Mexico (24 | 3.3%), Brazil (19 | 2.6%), and South America (19 | 2.6%), together accounting for 19.0% of all Eldridge residents.
| Immigration Origin | # Population | % Population |
| Brazil | 19 | 2.6% |
| Central America | 29 | 4.0% |
| El Salvador | 5 | 0.7% |
| Europe | 8 | 1.1% |
| Germany | 8 | 1.1% |
| Latin America | 48 | 6.6% |
| Mexico | 24 | 3.3% |
| South America | 19 | 2.6% |
| Western Europe | 8 | 1.1% | View All 9 Rows |
Sex and Age in Eldridge
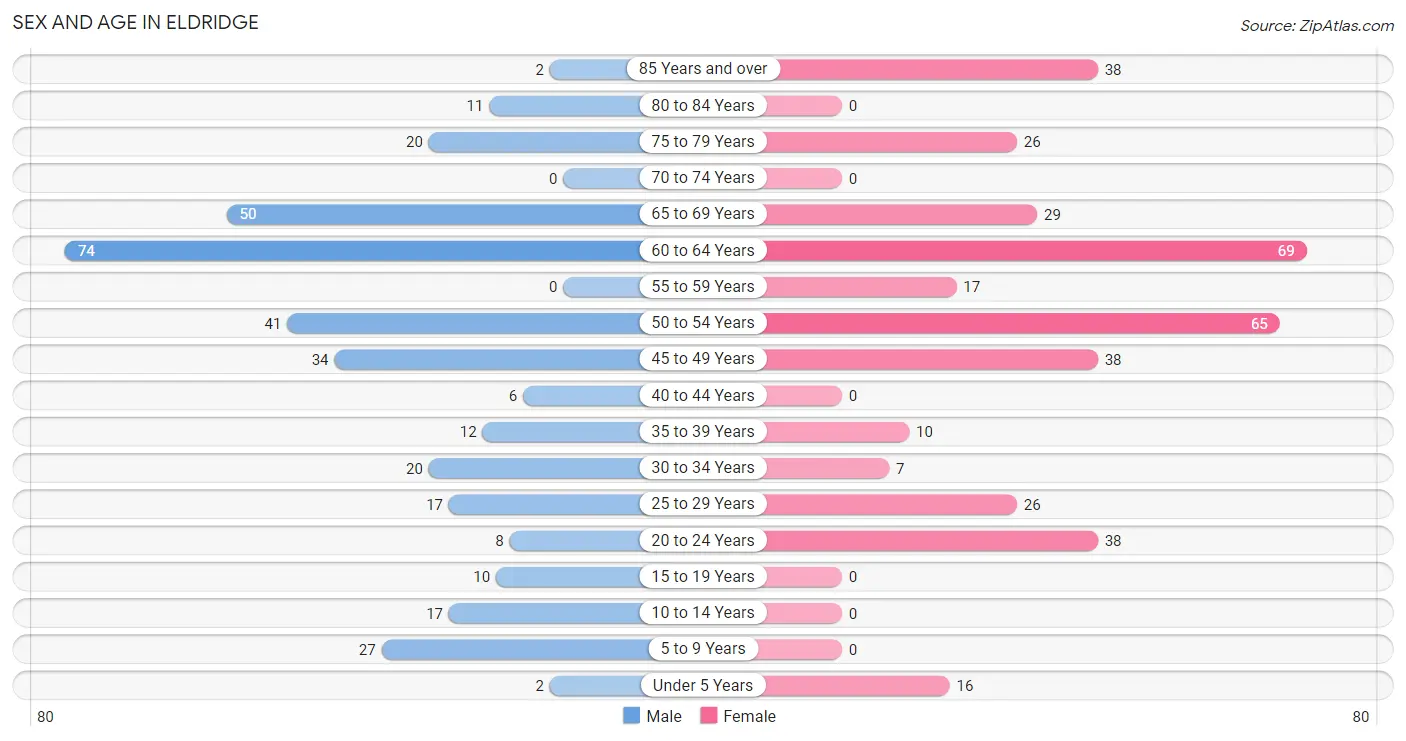
Sex and Age in Eldridge
The most populous age groups in Eldridge are 60 to 64 Years (74 | 21.1%) for men and 60 to 64 Years (69 | 18.2%) for women.
| Age Bracket | Male | Female |
| Under 5 Years | 2 (0.6%) | 16 (4.2%) |
| 5 to 9 Years | 27 (7.7%) | 0 (0.0%) |
| 10 to 14 Years | 17 (4.8%) | 0 (0.0%) |
| 15 to 19 Years | 10 (2.9%) | 0 (0.0%) |
| 20 to 24 Years | 8 (2.3%) | 38 (10.0%) |
| 25 to 29 Years | 17 (4.8%) | 26 (6.9%) |
| 30 to 34 Years | 20 (5.7%) | 7 (1.8%) |
| 35 to 39 Years | 12 (3.4%) | 10 (2.6%) |
| 40 to 44 Years | 6 (1.7%) | 0 (0.0%) |
| 45 to 49 Years | 34 (9.7%) | 38 (10.0%) |
| 50 to 54 Years | 41 (11.7%) | 65 (17.2%) |
| 55 to 59 Years | 0 (0.0%) | 17 (4.5%) |
| 60 to 64 Years | 74 (21.1%) | 69 (18.2%) |
| 65 to 69 Years | 50 (14.2%) | 29 (7.6%) |
| 70 to 74 Years | 0 (0.0%) | 0 (0.0%) |
| 75 to 79 Years | 20 (5.7%) | 26 (6.9%) |
| 80 to 84 Years | 11 (3.1%) | 0 (0.0%) |
| 85 Years and over | 2 (0.6%) | 38 (10.0%) |
| Total | 351 (100.0%) | 379 (100.0%) |
Families and Households in Eldridge
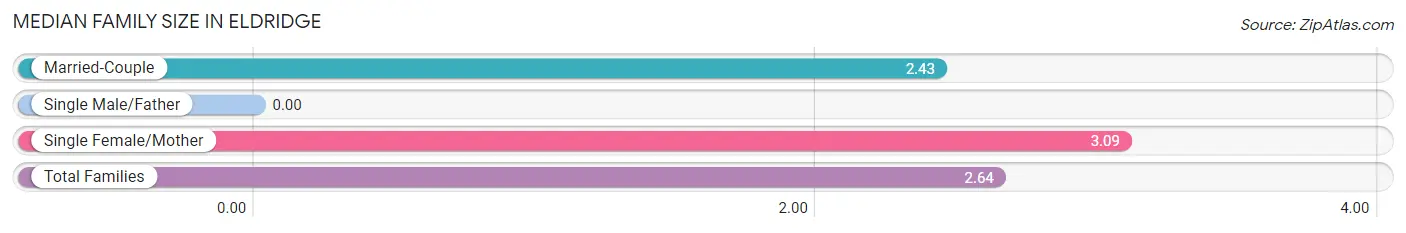
Median Family Size in Eldridge
| Family Type | # Families | Family Size |
| Married-Couple | 115 (67.6%) | 2.43 |
| Single Male/Father | 0 (0.0%) | - |
| Single Female/Mother | 55 (32.4%) | 3.09 |
| Total Families | 170 (100.0%) | 2.64 |
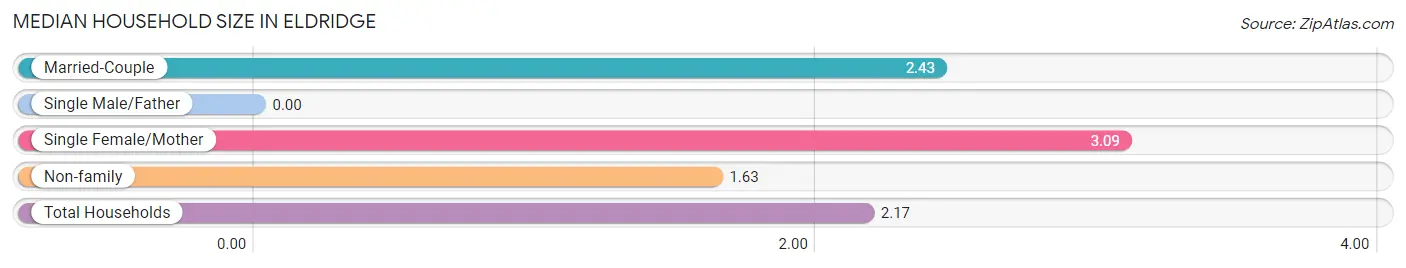
Median Household Size in Eldridge
| Household Type | # Households | Household Size |
| Married-Couple | 115 (35.8%) | 2.43 |
| Single Male/Father | 0 (0.0%) | - |
| Single Female/Mother | 55 (17.1%) | 3.09 |
| Non-family | 151 (47.0%) | 1.63 |
| Total Households | 321 (100.0%) | 2.17 |
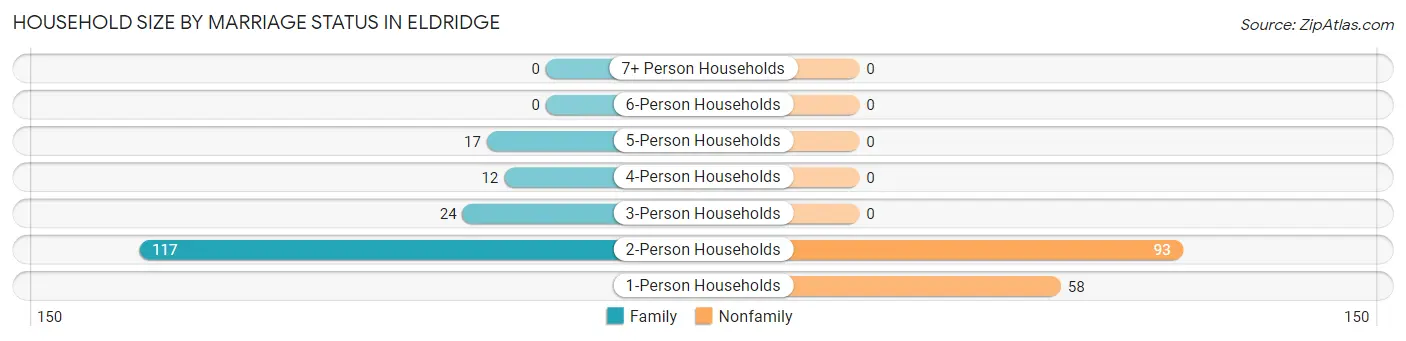
Household Size by Marriage Status in Eldridge
Out of a total of 321 households in Eldridge, 170 (53.0%) are family households, while 151 (47.0%) are nonfamily households. The most numerous type of family households are 2-person households, comprising 117, and the most common type of nonfamily households are 2-person households, comprising 93.
| Household Size | Family Households | Nonfamily Households |
| 1-Person Households | - | 58 (18.1%) |
| 2-Person Households | 117 (36.4%) | 93 (29.0%) |
| 3-Person Households | 24 (7.5%) | 0 (0.0%) |
| 4-Person Households | 12 (3.7%) | 0 (0.0%) |
| 5-Person Households | 17 (5.3%) | 0 (0.0%) |
| 6-Person Households | 0 (0.0%) | 0 (0.0%) |
| 7+ Person Households | 0 (0.0%) | 0 (0.0%) |
| Total | 170 (53.0%) | 151 (47.0%) |
Female Fertility in Eldridge
Fertility by Age in Eldridge
| Age Bracket | Women with Births | Births / 1,000 Women |
| 15 to 19 years | 0 (0.0%) | 0.0 |
| 20 to 34 years | 0 (0.0%) | 0.0 |
| 35 to 50 years | 0 (0.0%) | 0.0 |
| Total | 0 (0.0%) | 0.0 |
Fertility by Age by Marriage Status in Eldridge
| Age Bracket | Married | Unmarried |
| 15 to 19 years | 0 (0.0%) | 0 (0.0%) |
| 20 to 34 years | 0 (0.0%) | 0 (0.0%) |
| 35 to 50 years | 0 (0.0%) | 0 (0.0%) |
| Total | 0 (0.0%) | 0 (0.0%) |
Fertility by Education in Eldridge
| Educational Attainment | Women with Births | Births / 1,000 Women |
| Less than High School | 0 (0.0%) | 0.0 |
| High School Diploma | 0 (0.0%) | 0.0 |
| College or Associate's Degree | 0 (0.0%) | 0.0 |
| Bachelor's Degree | 0 (0.0%) | 0.0 |
| Graduate Degree | 0 (0.0%) | 0.0 |
| Total | 0 (0.0%) | 0.0 |
Fertility by Education by Marriage Status in Eldridge
| Educational Attainment | Married | Unmarried |
| Less than High School | 0 (0.0%) | 0 (0.0%) |
| High School Diploma | 0 (0.0%) | 0 (0.0%) |
| College or Associate's Degree | 0 (0.0%) | 0 (0.0%) |
| Bachelor's Degree | 0 (0.0%) | 0 (0.0%) |
| Graduate Degree | 0 (0.0%) | 0 (0.0%) |
| Total | 0 (0.0%) | 0 (0.0%) |
Income in Eldridge
Income Overview in Eldridge
| Characteristic | Number | Measure |
| Per Capita Income | 730 | $122,854 |
| Median Family Income | 170 | $0 |
| Mean Family Income | 170 | $411,294 |
| Median Household Income | 321 | $137,109 |
| Mean Household Income | 321 | $277,522 |
| Income Deficit | 170 | $0 |
| Wage / Income Gap (%) | 730 | 60.80% |
| Wage / Income Gap ($) | 730 | 39.20¢ per $1 |
| Gini / Inequality Index | 730 | 0.56 |
Earnings by Sex in Eldridge
Average Earnings in Eldridge are $51,339, $62,000 for men and $24,303 for women, a difference of 60.8%.
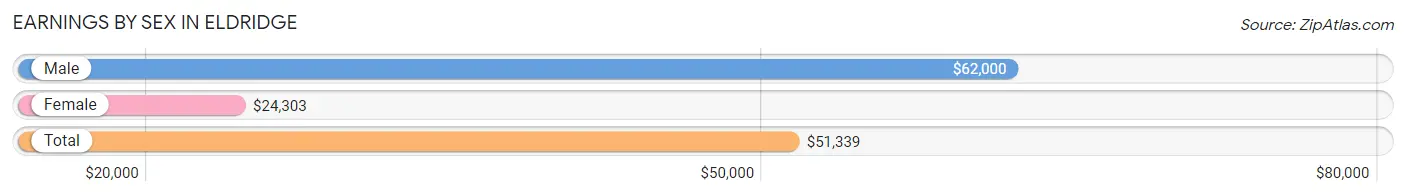
| Sex | Number | Average Earnings |
| Male | 260 (55.4%) | $62,000 |
| Female | 209 (44.6%) | $24,303 |
| Total | 469 (100.0%) | $51,339 |
Earnings by Sex by Income Bracket in Eldridge
The most common earnings brackets in Eldridge are $100,000+ for men (86 | 33.1%) and $22,500 to $24,999 for women (52 | 24.9%).
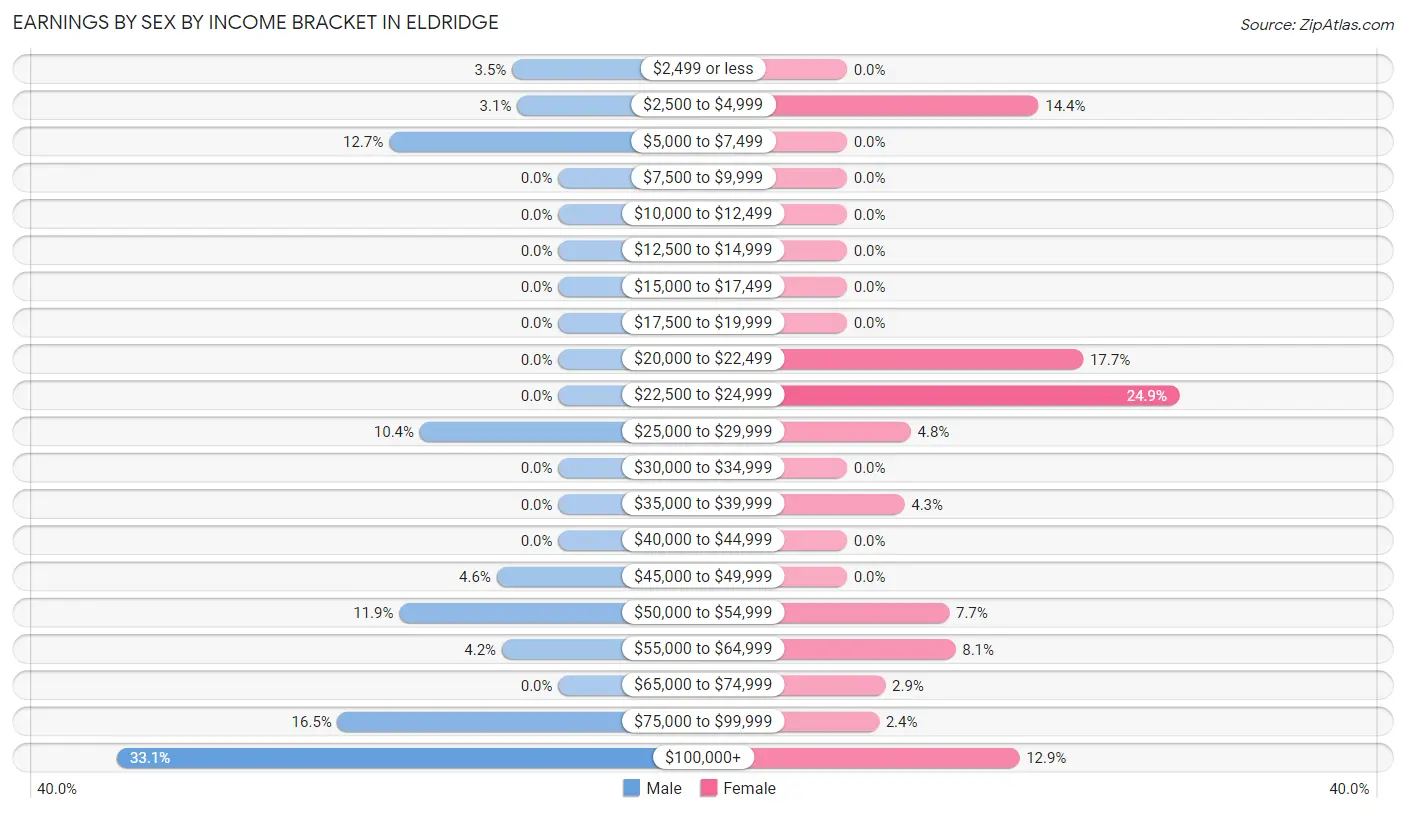
| Income | Male | Female |
| $2,499 or less | 9 (3.5%) | 0 (0.0%) |
| $2,500 to $4,999 | 8 (3.1%) | 30 (14.3%) |
| $5,000 to $7,499 | 33 (12.7%) | 0 (0.0%) |
| $7,500 to $9,999 | 0 (0.0%) | 0 (0.0%) |
| $10,000 to $12,499 | 0 (0.0%) | 0 (0.0%) |
| $12,500 to $14,999 | 0 (0.0%) | 0 (0.0%) |
| $15,000 to $17,499 | 0 (0.0%) | 0 (0.0%) |
| $17,500 to $19,999 | 0 (0.0%) | 0 (0.0%) |
| $20,000 to $22,499 | 0 (0.0%) | 37 (17.7%) |
| $22,500 to $24,999 | 0 (0.0%) | 52 (24.9%) |
| $25,000 to $29,999 | 27 (10.4%) | 10 (4.8%) |
| $30,000 to $34,999 | 0 (0.0%) | 0 (0.0%) |
| $35,000 to $39,999 | 0 (0.0%) | 9 (4.3%) |
| $40,000 to $44,999 | 0 (0.0%) | 0 (0.0%) |
| $45,000 to $49,999 | 12 (4.6%) | 0 (0.0%) |
| $50,000 to $54,999 | 31 (11.9%) | 16 (7.7%) |
| $55,000 to $64,999 | 11 (4.2%) | 17 (8.1%) |
| $65,000 to $74,999 | 0 (0.0%) | 6 (2.9%) |
| $75,000 to $99,999 | 43 (16.5%) | 5 (2.4%) |
| $100,000+ | 86 (33.1%) | 27 (12.9%) |
| Total | 260 (100.0%) | 209 (100.0%) |
Earnings by Sex by Educational Attainment in Eldridge
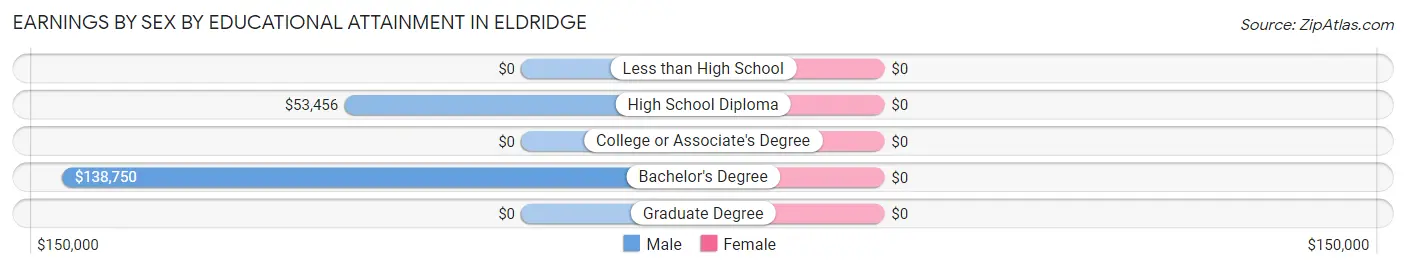
| Educational Attainment | Male Income | Female Income |
| Less than High School | - | - |
| High School Diploma | $53,456 | $0 |
| College or Associate's Degree | - | - |
| Bachelor's Degree | $138,750 | $0 |
| Graduate Degree | - | - |
| Total | $81,339 | $24,495 |
Family Income in Eldridge
Family Income Brackets in Eldridge
According to the Eldridge family income data, there are 76 families falling into the $200,000+ income range, which is the most common income bracket and makes up 44.7% of all families.
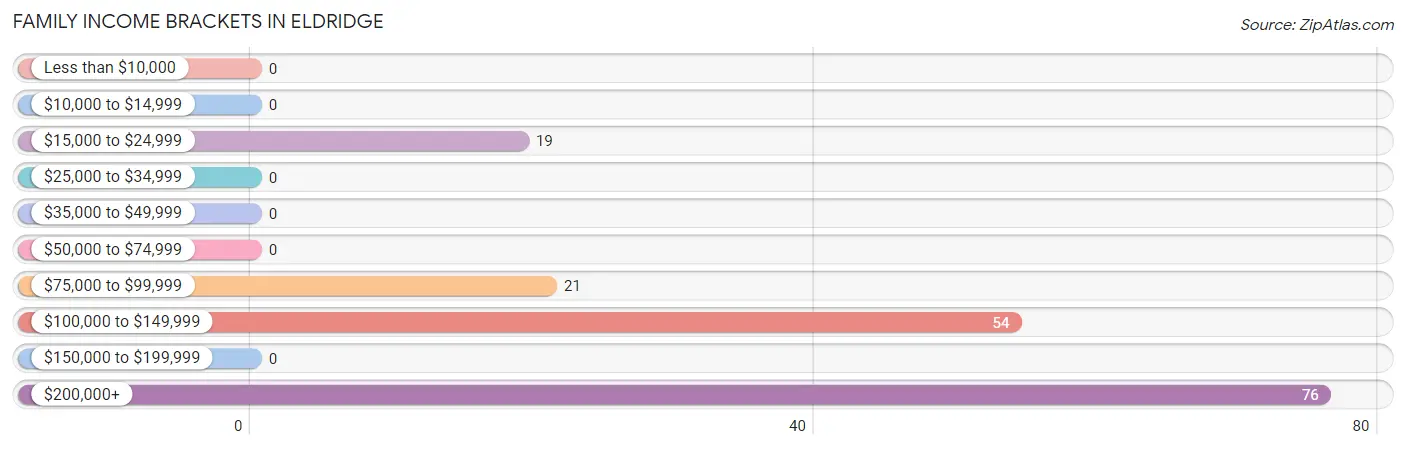
| Income Bracket | # Families | % Families |
| Less than $10,000 | 0 | 0.0% |
| $10,000 to $14,999 | 0 | 0.0% |
| $15,000 to $24,999 | 19 | 11.2% |
| $25,000 to $34,999 | 0 | 0.0% |
| $35,000 to $49,999 | 0 | 0.0% |
| $50,000 to $74,999 | 0 | 0.0% |
| $75,000 to $99,999 | 21 | 12.4% |
| $100,000 to $149,999 | 54 | 31.8% |
| $150,000 to $199,999 | 0 | 0.0% |
| $200,000+ | 76 | 44.7% |
Family Income by Famaliy Size in Eldridge
2-person families (117 | 68.8%) account for the highest median family income in Eldridge with $250,001 per family, while 2-person families (117 | 68.8%) have the highest median income of $125,000 per family member.
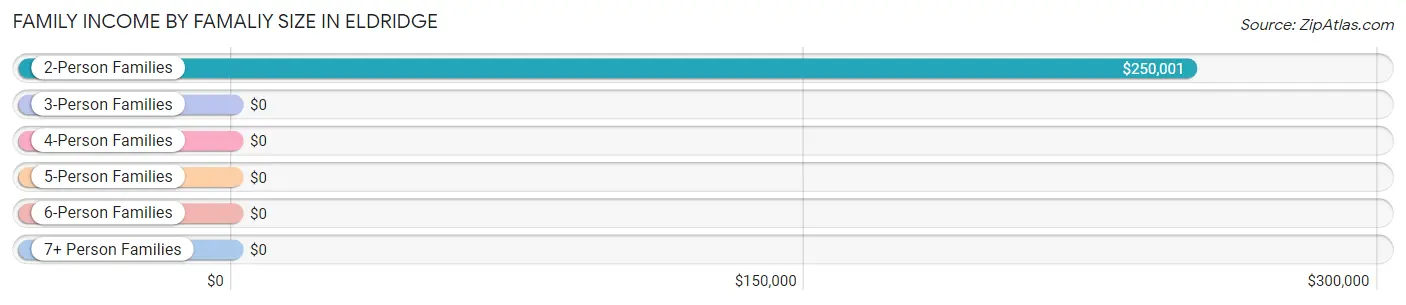
| Income Bracket | # Families | Median Income |
| 2-Person Families | 117 (68.8%) | $250,001 |
| 3-Person Families | 24 (14.1%) | $0 |
| 4-Person Families | 12 (7.1%) | $0 |
| 5-Person Families | 17 (10.0%) | $0 |
| 6-Person Families | 0 (0.0%) | $0 |
| 7+ Person Families | 0 (0.0%) | $0 |
| Total | 170 (100.0%) | $0 |
Family Income by Number of Earners in Eldridge
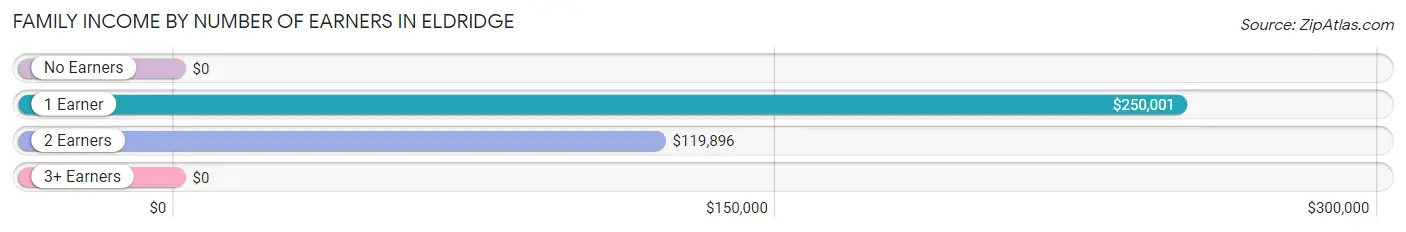
| Number of Earners | # Families | Median Income |
| No Earners | 0 (0.0%) | $0 |
| 1 Earner | 75 (44.1%) | $250,001 |
| 2 Earners | 69 (40.6%) | $119,896 |
| 3+ Earners | 26 (15.3%) | $0 |
| Total | 170 (100.0%) | $0 |
Household Income in Eldridge
Household Income Brackets in Eldridge
With 95 households falling in the category, the $200,000+ income range is the most frequent in Eldridge, accounting for 29.6% of all households.
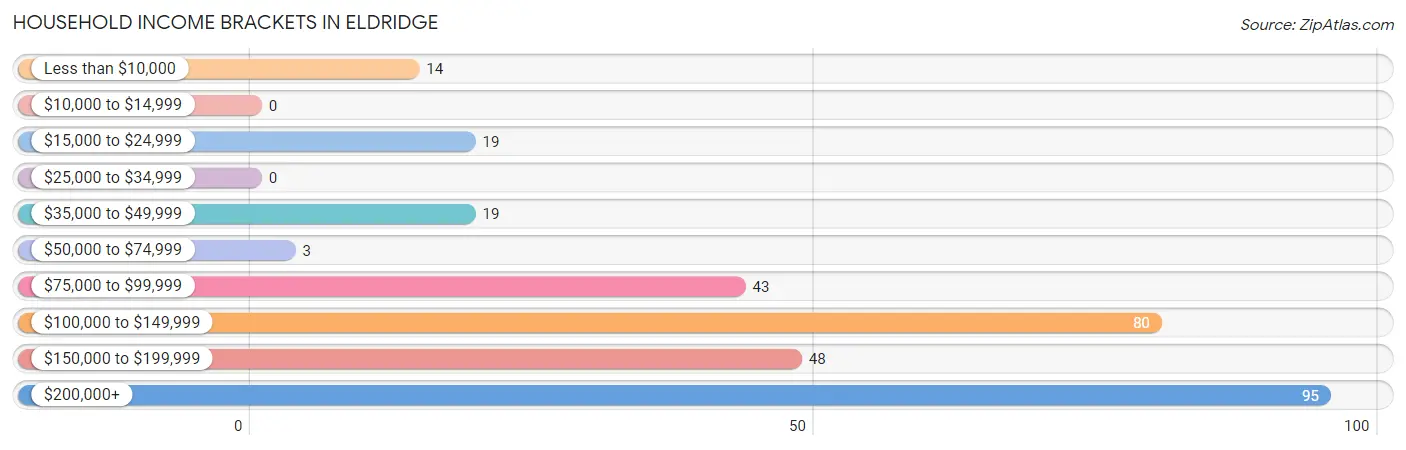
| Income Bracket | # Households | % Households |
| Less than $10,000 | 14 | 4.4% |
| $10,000 to $14,999 | 0 | 0.0% |
| $15,000 to $24,999 | 19 | 5.9% |
| $25,000 to $34,999 | 0 | 0.0% |
| $35,000 to $49,999 | 19 | 5.9% |
| $50,000 to $74,999 | 3 | 0.9% |
| $75,000 to $99,999 | 43 | 13.4% |
| $100,000 to $149,999 | 80 | 24.9% |
| $150,000 to $199,999 | 48 | 15.0% |
| $200,000+ | 95 | 29.6% |
Household Income by Householder Age in Eldridge
The median household income in Eldridge is $137,109, with the highest median household income of $165,357 found in the 45 to 64 years age bracket for the primary householder. A total of 164 households (51.1%) fall into this category. Meanwhile, the 15 to 24 years age bracket for the primary householder has the lowest median household income of $0, with 8 households (2.5%) in this group.
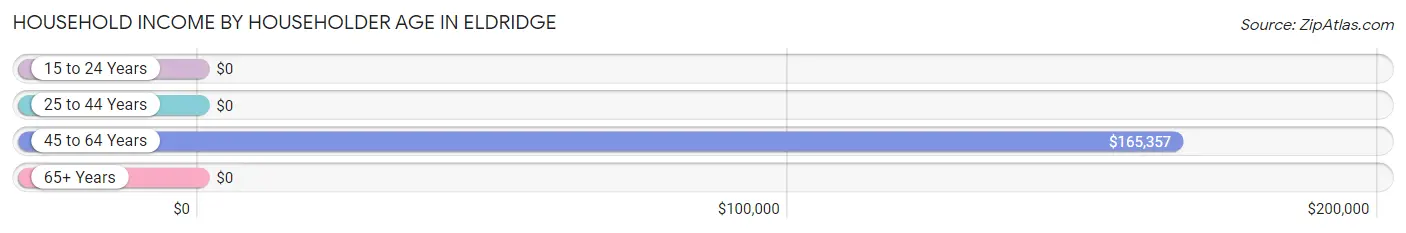
| Income Bracket | # Households | Median Income |
| 15 to 24 Years | 8 (2.5%) | $0 |
| 25 to 44 Years | 31 (9.7%) | $0 |
| 45 to 64 Years | 164 (51.1%) | $165,357 |
| 65+ Years | 118 (36.8%) | $0 |
| Total | 321 (100.0%) | $137,109 |
Poverty in Eldridge
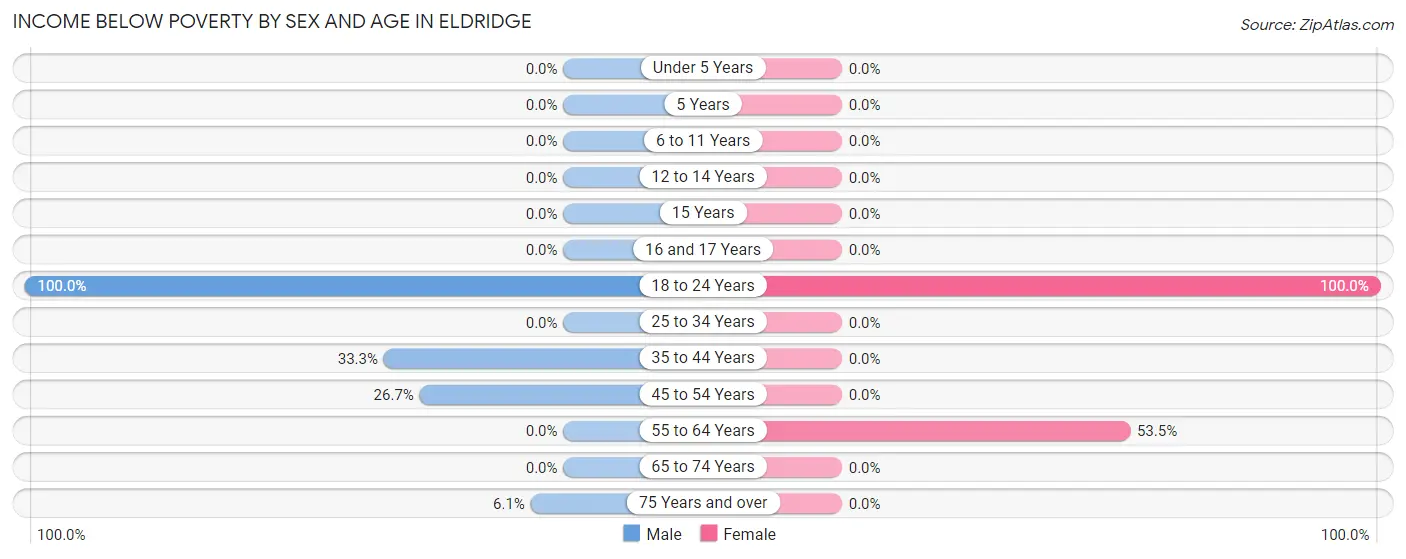
Income Below Poverty by Sex and Age in Eldridge
With 10.3% poverty level for males and 22.2% for females among the residents of Eldridge, 18 to 24 year old males and 18 to 24 year old females are the most vulnerable to poverty, with 8 males (100.0%) and 38 females (100.0%) in their respective age groups living below the poverty level.
| Age Bracket | Male | Female |
| Under 5 Years | 0 (0.0%) | 0 (0.0%) |
| 5 Years | 0 (0.0%) | 0 (0.0%) |
| 6 to 11 Years | 0 (0.0%) | 0 (0.0%) |
| 12 to 14 Years | 0 (0.0%) | 0 (0.0%) |
| 15 Years | 0 (0.0%) | 0 (0.0%) |
| 16 and 17 Years | 0 (0.0%) | 0 (0.0%) |
| 18 to 24 Years | 8 (100.0%) | 38 (100.0%) |
| 25 to 34 Years | 0 (0.0%) | 0 (0.0%) |
| 35 to 44 Years | 6 (33.3%) | 0 (0.0%) |
| 45 to 54 Years | 20 (26.7%) | 0 (0.0%) |
| 55 to 64 Years | 0 (0.0%) | 46 (53.5%) |
| 65 to 74 Years | 0 (0.0%) | 0 (0.0%) |
| 75 Years and over | 2 (6.1%) | 0 (0.0%) |
| Total | 36 (10.3%) | 84 (22.2%) |
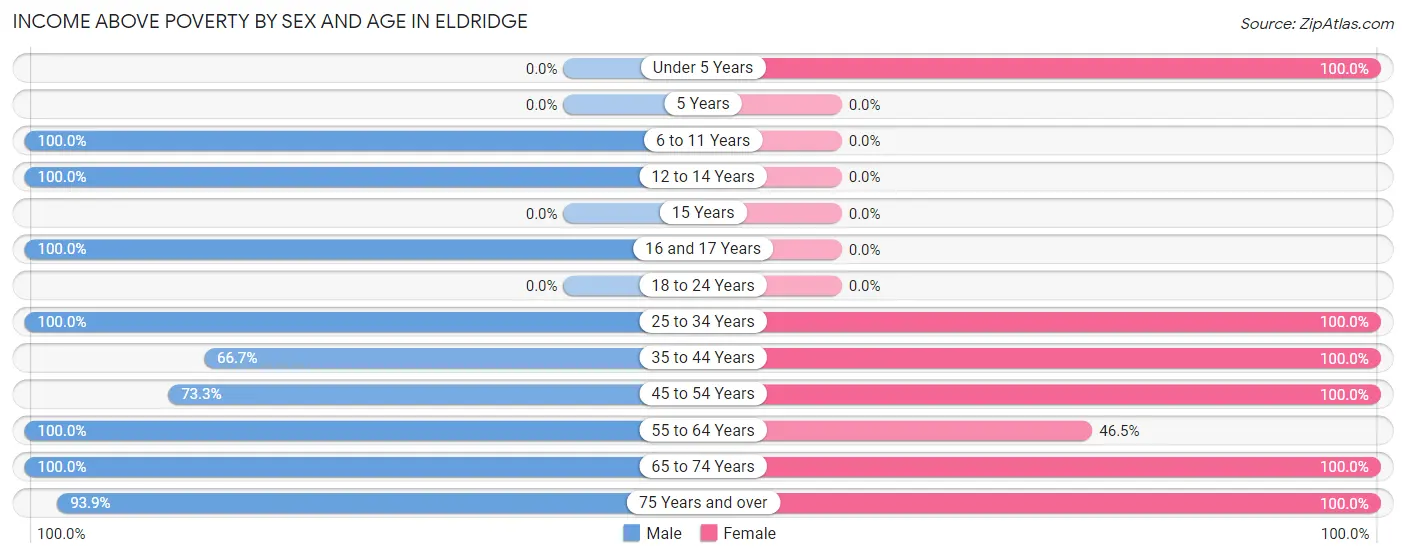
Income Above Poverty by Sex and Age in Eldridge
According to the poverty statistics in Eldridge, males aged 6 to 11 years and females aged under 5 years are the age groups that are most secure financially, with 100.0% of males and 100.0% of females in these age groups living above the poverty line.
| Age Bracket | Male | Female |
| Under 5 Years | 0 (0.0%) | 16 (100.0%) |
| 5 Years | 0 (0.0%) | 0 (0.0%) |
| 6 to 11 Years | 27 (100.0%) | 0 (0.0%) |
| 12 to 14 Years | 17 (100.0%) | 0 (0.0%) |
| 15 Years | 0 (0.0%) | 0 (0.0%) |
| 16 and 17 Years | 9 (100.0%) | 0 (0.0%) |
| 18 to 24 Years | 0 (0.0%) | 0 (0.0%) |
| 25 to 34 Years | 37 (100.0%) | 33 (100.0%) |
| 35 to 44 Years | 12 (66.7%) | 10 (100.0%) |
| 45 to 54 Years | 55 (73.3%) | 103 (100.0%) |
| 55 to 64 Years | 74 (100.0%) | 40 (46.5%) |
| 65 to 74 Years | 50 (100.0%) | 29 (100.0%) |
| 75 Years and over | 31 (93.9%) | 64 (100.0%) |
| Total | 312 (89.7%) | 295 (77.8%) |
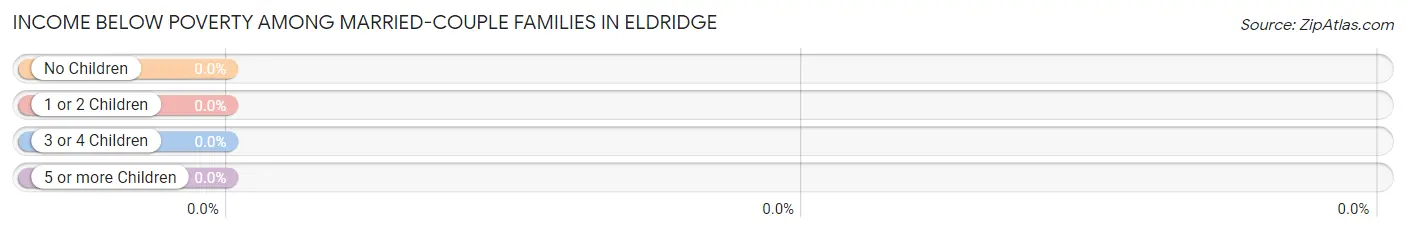
Income Below Poverty Among Married-Couple Families in Eldridge
| Children | Above Poverty | Below Poverty |
| No Children | 94 (100.0%) | 0 (0.0%) |
| 1 or 2 Children | 21 (100.0%) | 0 (0.0%) |
| 3 or 4 Children | 0 (0.0%) | 0 (0.0%) |
| 5 or more Children | 0 (0.0%) | 0 (0.0%) |
| Total | 115 (100.0%) | 0 (0.0%) |
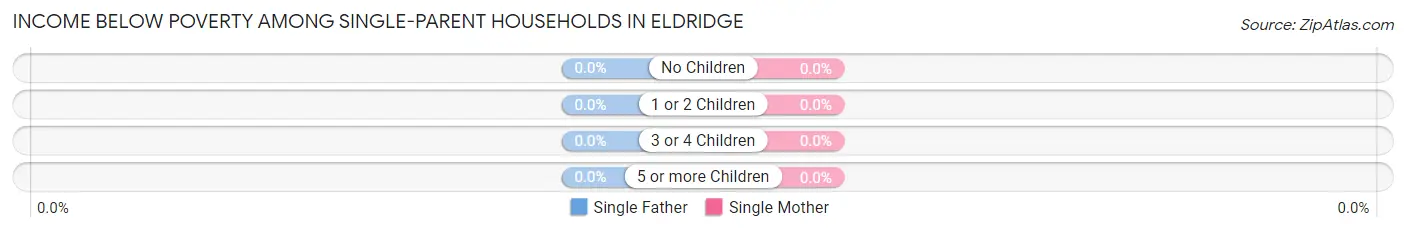
Income Below Poverty Among Single-Parent Households in Eldridge
| Children | Single Father | Single Mother |
| No Children | 0 (0.0%) | 0 (0.0%) |
| 1 or 2 Children | 0 (0.0%) | 0 (0.0%) |
| 3 or 4 Children | 0 (0.0%) | 0 (0.0%) |
| 5 or more Children | 0 (0.0%) | 0 (0.0%) |
| Total | 0 (0.0%) | 0 (0.0%) |
Income Below Poverty Among Married-Couple vs Single-Parent Households in Eldridge
| Children | Married-Couple Families | Single-Parent Households |
| No Children | 0 (0.0%) | 0 (0.0%) |
| 1 or 2 Children | 0 (0.0%) | 0 (0.0%) |
| 3 or 4 Children | 0 (0.0%) | 0 (0.0%) |
| 5 or more Children | 0 (0.0%) | 0 (0.0%) |
| Total | 0 (0.0%) | 0 (0.0%) |
Employment Characteristics in Eldridge
Employment by Class of Employer in Eldridge
Among the 397 employed individuals in Eldridge, private company employees (243 | 61.2%), self-employed (not incorporated) (97 | 24.4%), and local government employees (46 | 11.6%) make up the most common classes of employment.
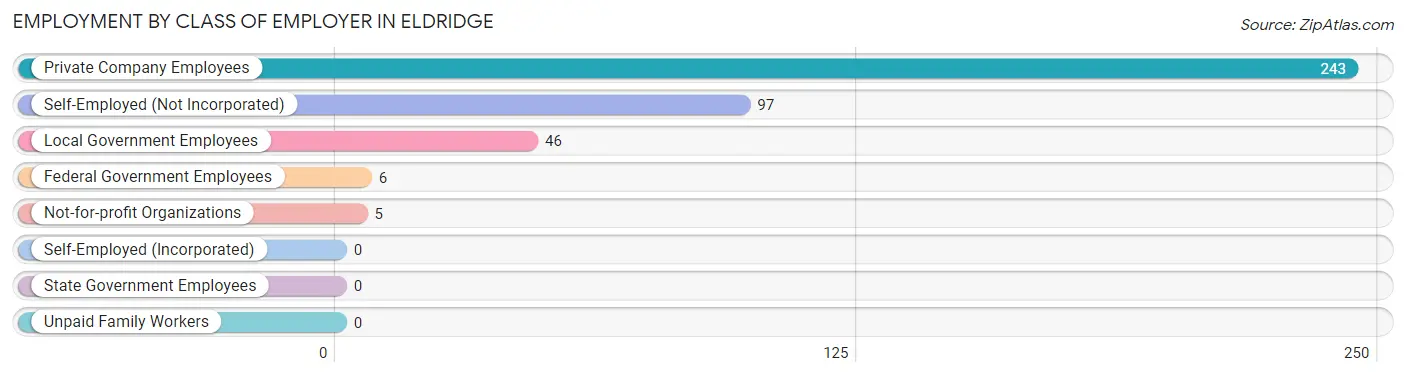
| Employer Class | # Employees | % Employees |
| Private Company Employees | 243 | 61.2% |
| Self-Employed (Incorporated) | 0 | 0.0% |
| Self-Employed (Not Incorporated) | 97 | 24.4% |
| Not-for-profit Organizations | 5 | 1.3% |
| Local Government Employees | 46 | 11.6% |
| State Government Employees | 0 | 0.0% |
| Federal Government Employees | 6 | 1.5% |
| Unpaid Family Workers | 0 | 0.0% |
| Total | 397 | 100.0% |
Employment Status by Age in Eldridge
According to the labor force statistics for Eldridge, out of the total population over 16 years of age (668), 71.3% or 476 individuals are in the labor force, with 13.0% or 62 of them unemployed. The age group with the highest labor force participation rate is 25 to 29 years, with 100.0% or 43 individuals in the labor force. Within the labor force, the 65 to 74 years age range has the highest percentage of unemployed individuals, with 38.0% or 19 of them being unemployed.
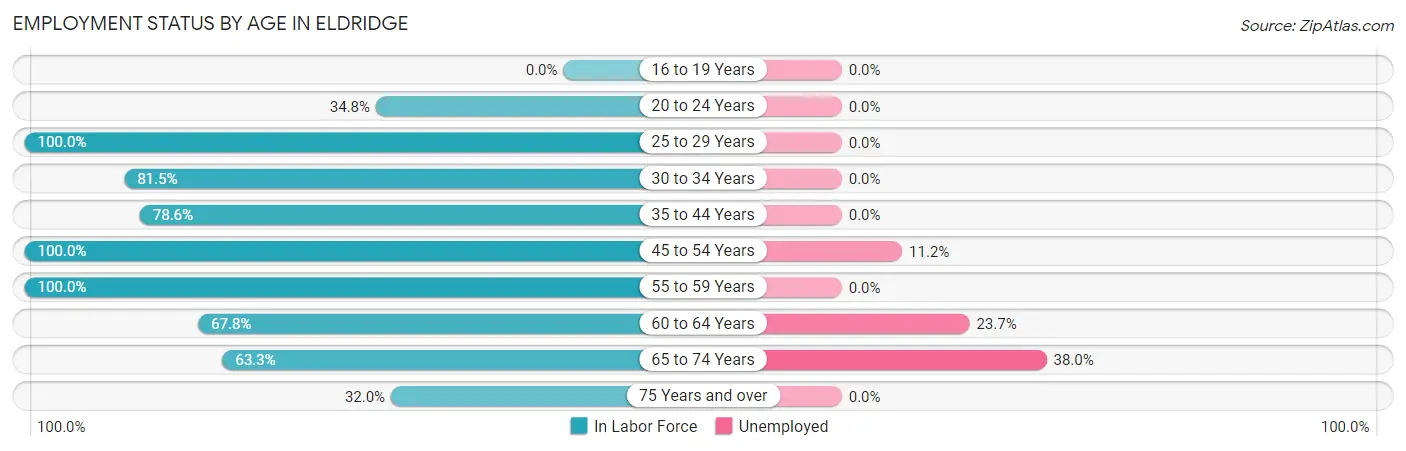
| Age Bracket | In Labor Force | Unemployed |
| 16 to 19 Years | 0 (0.0%) | 0 (0.0%) |
| 20 to 24 Years | 16 (34.8%) | 0 (0.0%) |
| 25 to 29 Years | 43 (100.0%) | 0 (0.0%) |
| 30 to 34 Years | 22 (81.5%) | 0 (0.0%) |
| 35 to 44 Years | 22 (78.6%) | 0 (0.0%) |
| 45 to 54 Years | 178 (100.0%) | 20 (11.2%) |
| 55 to 59 Years | 17 (100.0%) | 0 (0.0%) |
| 60 to 64 Years | 97 (67.8%) | 23 (23.7%) |
| 65 to 74 Years | 50 (63.3%) | 19 (38.0%) |
| 75 Years and over | 31 (32.0%) | 0 (0.0%) |
| Total | 476 (71.3%) | 62 (13.0%) |
Employment Status by Educational Attainment in Eldridge
According to labor force statistics for Eldridge, 86.9% of individuals (379) out of the total population between 25 and 64 years of age (436) are in the labor force, with 11.3% or 43 of them being unemployed. The group with the highest labor force participation rate are those with the educational attainment of high school diploma, with 100.0% or 55 individuals in the labor force. Within the labor force, individuals with bachelor's degree or higher education have the highest percentage of unemployment, with 15.1% or 24 of them being unemployed.
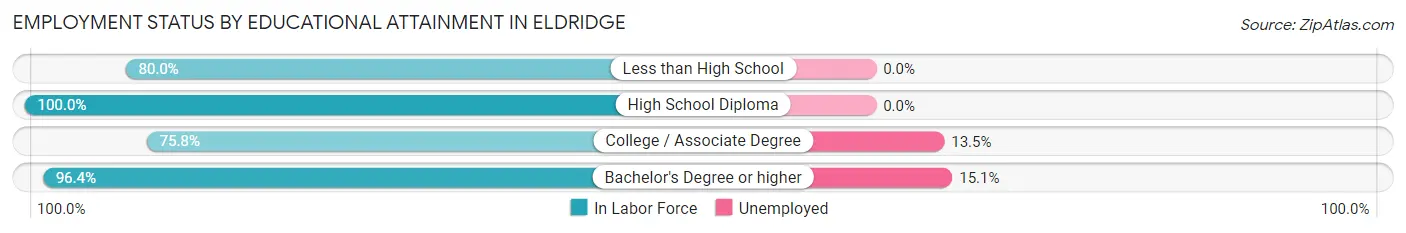
| Educational Attainment | In Labor Force | Unemployed |
| Less than High School | 24 (80.0%) | 0 (0.0%) |
| High School Diploma | 55 (100.0%) | 0 (0.0%) |
| College / Associate Degree | 141 (75.8%) | 25 (13.5%) |
| Bachelor's Degree or higher | 159 (96.4%) | 25 (15.1%) |
| Total | 379 (86.9%) | 49 (11.3%) |
Employment Occupations by Sex in Eldridge
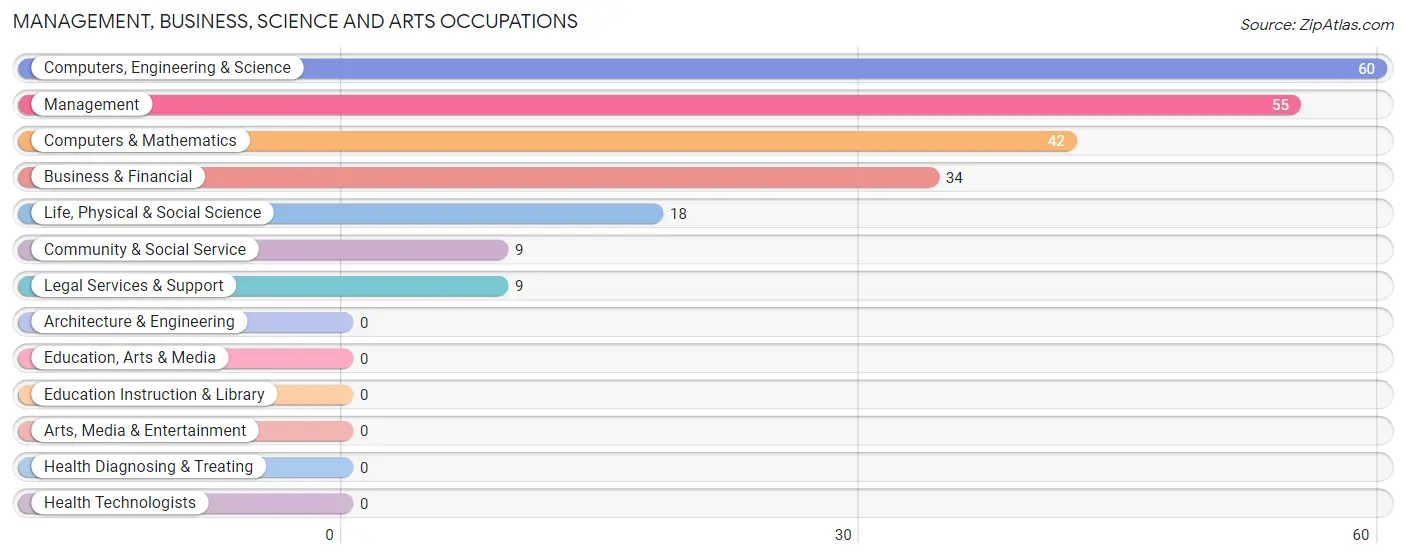
Management, Business, Science and Arts Occupations
The most common Management, Business, Science and Arts occupations in Eldridge are Computers, Engineering & Science (60 | 14.5%), Management (55 | 13.3%), Computers & Mathematics (42 | 10.1%), Business & Financial (34 | 8.2%), and Life, Physical & Social Science (18 | 4.3%).
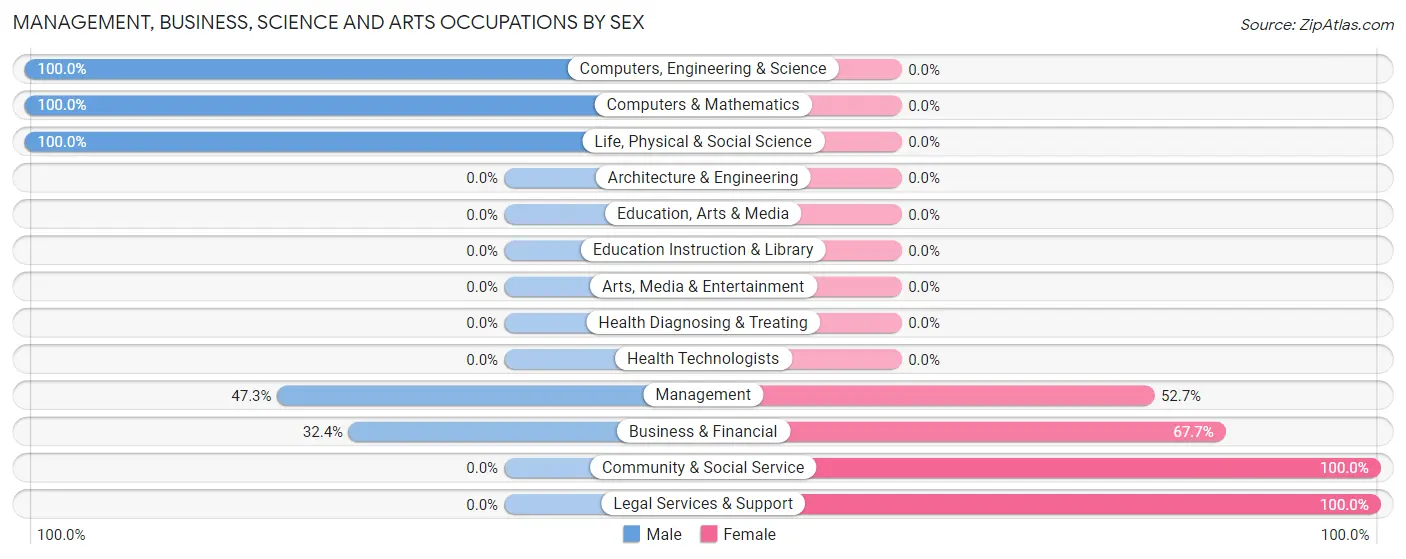
Management, Business, Science and Arts Occupations by Sex
Within the Management, Business, Science and Arts occupations in Eldridge, the most male-oriented occupations are Computers, Engineering & Science (100.0%), Computers & Mathematics (100.0%), and Life, Physical & Social Science (100.0%), while the most female-oriented occupations are Community & Social Service (100.0%), Legal Services & Support (100.0%), and Business & Financial (67.6%).
| Occupation | Male | Female |
| Management | 26 (47.3%) | 29 (52.7%) |
| Business & Financial | 11 (32.4%) | 23 (67.6%) |
| Computers, Engineering & Science | 60 (100.0%) | 0 (0.0%) |
| Computers & Mathematics | 42 (100.0%) | 0 (0.0%) |
| Architecture & Engineering | 0 (0.0%) | 0 (0.0%) |
| Life, Physical & Social Science | 18 (100.0%) | 0 (0.0%) |
| Community & Social Service | 0 (0.0%) | 9 (100.0%) |
| Education, Arts & Media | 0 (0.0%) | 0 (0.0%) |
| Legal Services & Support | 0 (0.0%) | 9 (100.0%) |
| Education Instruction & Library | 0 (0.0%) | 0 (0.0%) |
| Arts, Media & Entertainment | 0 (0.0%) | 0 (0.0%) |
| Health Diagnosing & Treating | 0 (0.0%) | 0 (0.0%) |
| Health Technologists | 0 (0.0%) | 0 (0.0%) |
| Total (Category) | 97 (61.4%) | 61 (38.6%) |
| Total (Overall) | 227 (54.8%) | 187 (45.2%) |
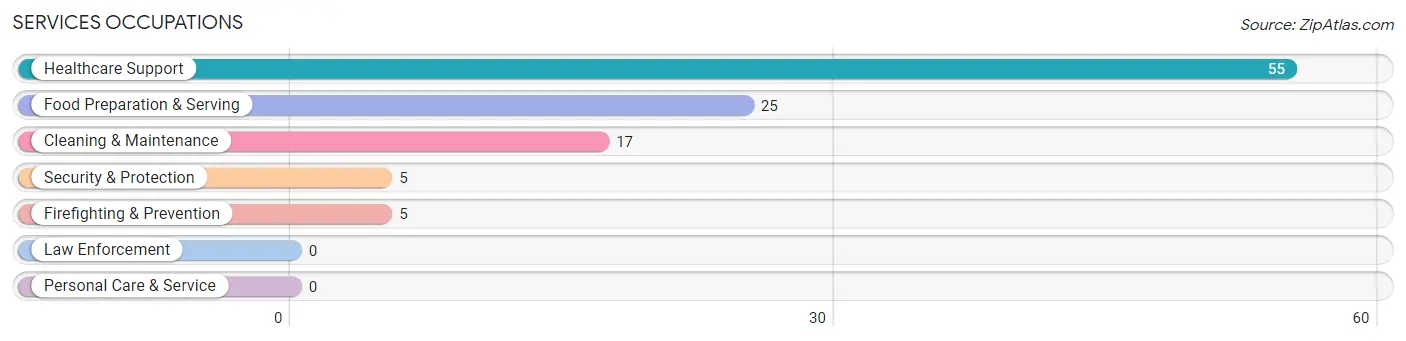
Services Occupations
The most common Services occupations in Eldridge are Healthcare Support (55 | 13.3%), Food Preparation & Serving (25 | 6.0%), Cleaning & Maintenance (17 | 4.1%), Security & Protection (5 | 1.2%), and Firefighting & Prevention (5 | 1.2%).
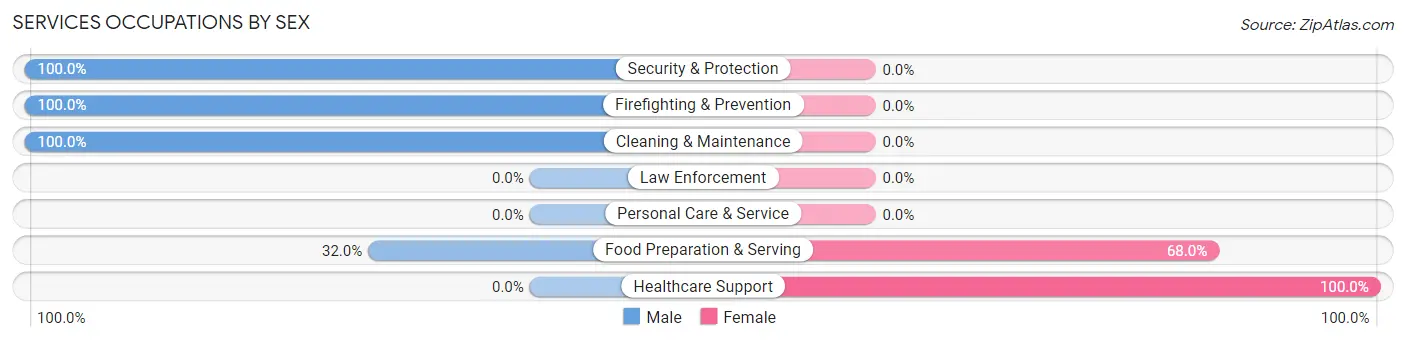
Services Occupations by Sex
Within the Services occupations in Eldridge, the most male-oriented occupations are Security & Protection (100.0%), Firefighting & Prevention (100.0%), and Cleaning & Maintenance (100.0%), while the most female-oriented occupations are Healthcare Support (100.0%), and Food Preparation & Serving (68.0%).
| Occupation | Male | Female |
| Healthcare Support | 0 (0.0%) | 55 (100.0%) |
| Security & Protection | 5 (100.0%) | 0 (0.0%) |
| Firefighting & Prevention | 5 (100.0%) | 0 (0.0%) |
| Law Enforcement | 0 (0.0%) | 0 (0.0%) |
| Food Preparation & Serving | 8 (32.0%) | 17 (68.0%) |
| Cleaning & Maintenance | 17 (100.0%) | 0 (0.0%) |
| Personal Care & Service | 0 (0.0%) | 0 (0.0%) |
| Total (Category) | 30 (29.4%) | 72 (70.6%) |
| Total (Overall) | 227 (54.8%) | 187 (45.2%) |
Sales and Office Occupations
The most common Sales and Office occupations in Eldridge are Sales & Related (65 | 15.7%), and Office & Administration (35 | 8.5%).
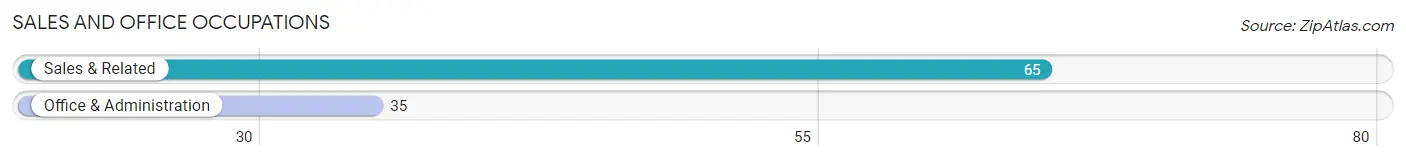
Sales and Office Occupations by Sex
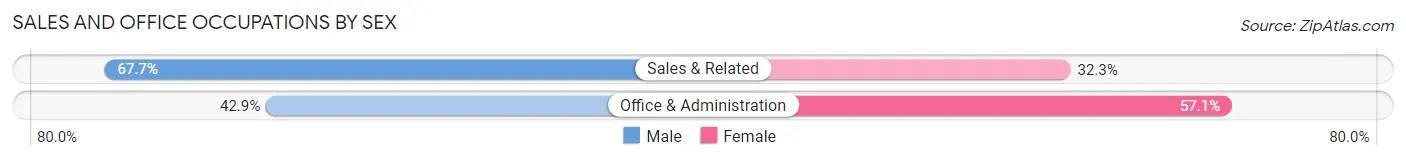
| Occupation | Male | Female |
| Sales & Related | 44 (67.7%) | 21 (32.3%) |
| Office & Administration | 15 (42.9%) | 20 (57.1%) |
| Total (Category) | 59 (59.0%) | 41 (41.0%) |
| Total (Overall) | 227 (54.8%) | 187 (45.2%) |
Natural Resources, Construction and Maintenance Occupations
The most common Natural Resources, Construction and Maintenance occupations in Eldridge are Construction & Extraction (17 | 4.1%), and Farming, Fishing & Forestry (6 | 1.5%).
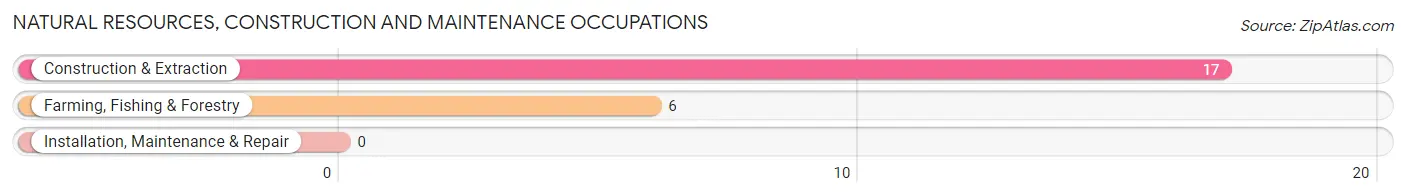
Natural Resources, Construction and Maintenance Occupations by Sex

| Occupation | Male | Female |
| Farming, Fishing & Forestry | 0 (0.0%) | 6 (100.0%) |
| Construction & Extraction | 17 (100.0%) | 0 (0.0%) |
| Installation, Maintenance & Repair | 0 (0.0%) | 0 (0.0%) |
| Total (Category) | 17 (73.9%) | 6 (26.1%) |
| Total (Overall) | 227 (54.8%) | 187 (45.2%) |
Production, Transportation and Moving Occupations
The most common Production, Transportation and Moving occupations in Eldridge are Production (19 | 4.6%), and Transportation (12 | 2.9%).
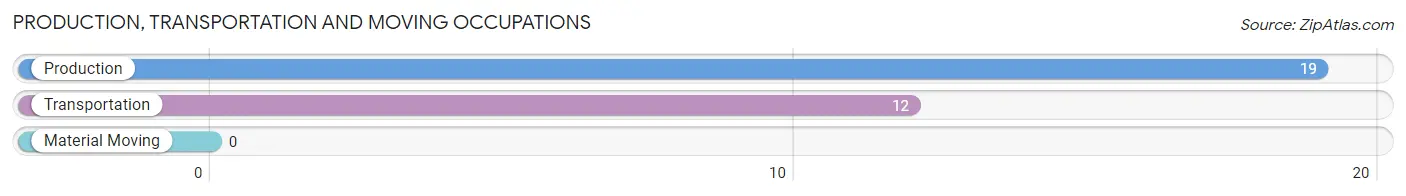
Production, Transportation and Moving Occupations by Sex
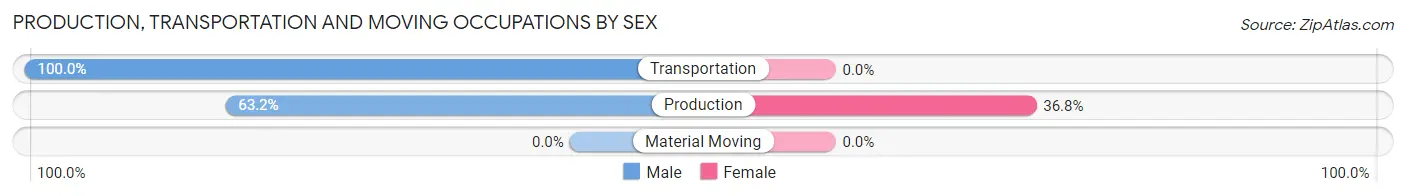
| Occupation | Male | Female |
| Production | 12 (63.2%) | 7 (36.8%) |
| Transportation | 12 (100.0%) | 0 (0.0%) |
| Material Moving | 0 (0.0%) | 0 (0.0%) |
| Total (Category) | 24 (77.4%) | 7 (22.6%) |
| Total (Overall) | 227 (54.8%) | 187 (45.2%) |
Employment Industries by Sex in Eldridge
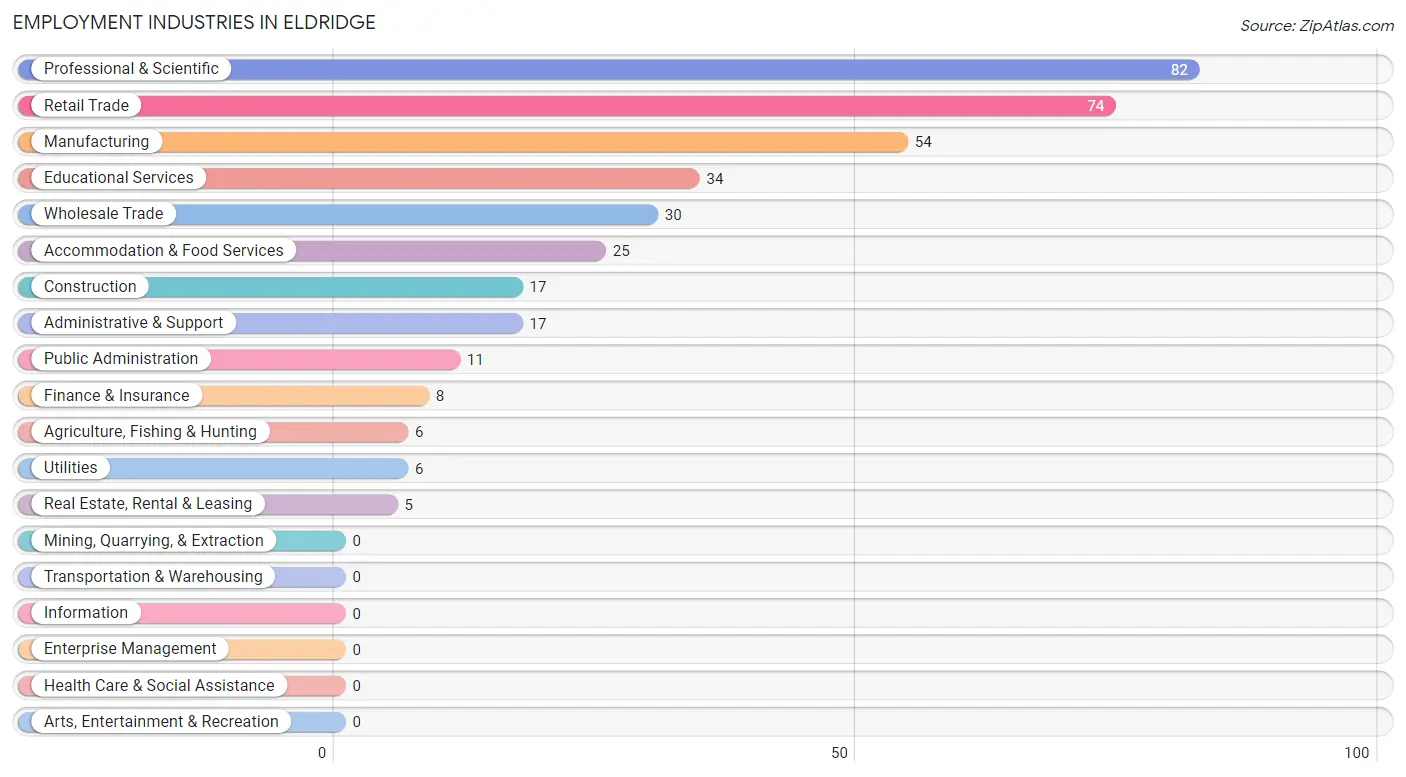
Employment Industries in Eldridge
The major employment industries in Eldridge include Professional & Scientific (82 | 19.8%), Retail Trade (74 | 17.9%), Manufacturing (54 | 13.0%), Educational Services (34 | 8.2%), and Wholesale Trade (30 | 7.2%).
Employment Industries by Sex in Eldridge
The Eldridge industries that see more men than women are Construction (100.0%), Wholesale Trade (100.0%), and Real Estate, Rental & Leasing (100.0%), whereas the industries that tend to have a higher number of women are Agriculture, Fishing & Hunting (100.0%), Utilities (100.0%), and Finance & Insurance (100.0%).
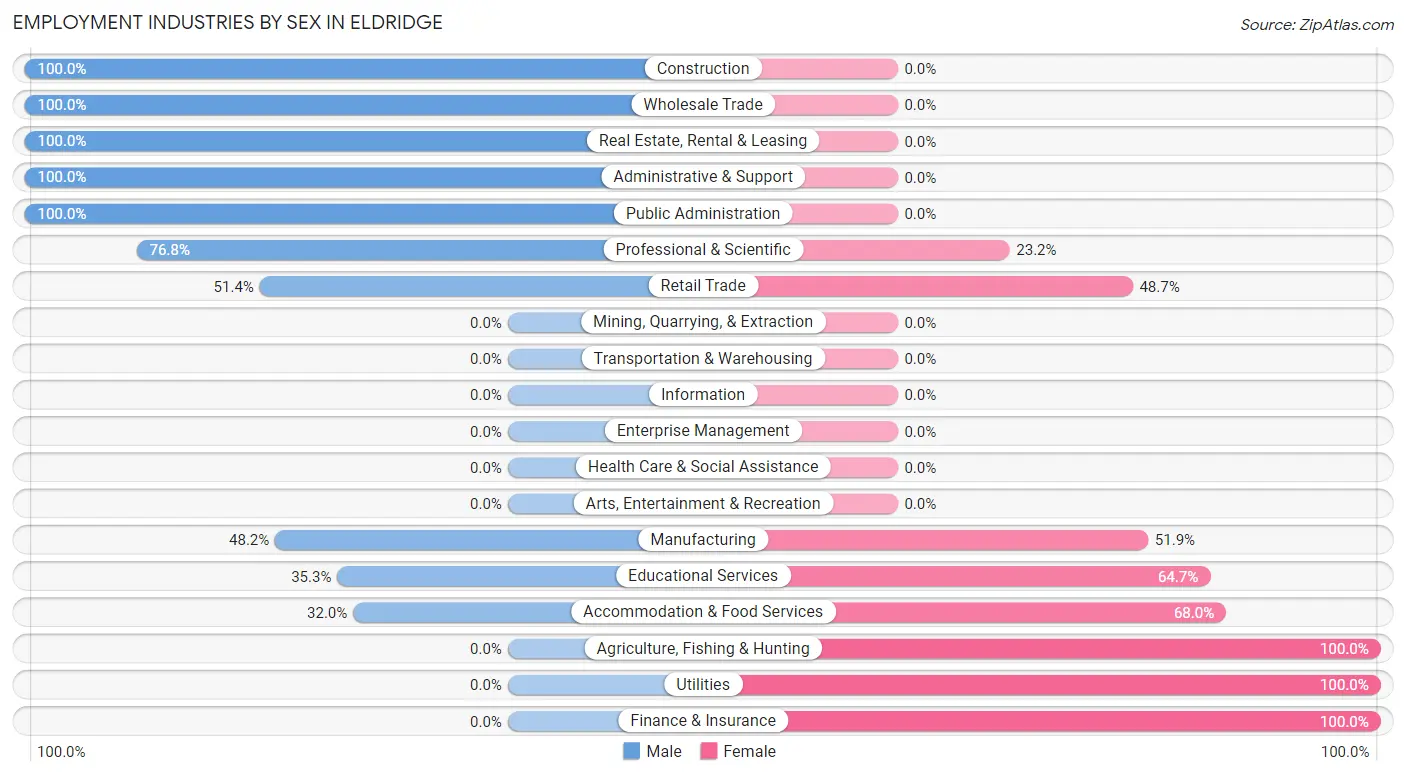
| Industry | Male | Female |
| Agriculture, Fishing & Hunting | 0 (0.0%) | 6 (100.0%) |
| Mining, Quarrying, & Extraction | 0 (0.0%) | 0 (0.0%) |
| Construction | 17 (100.0%) | 0 (0.0%) |
| Manufacturing | 26 (48.1%) | 28 (51.8%) |
| Wholesale Trade | 30 (100.0%) | 0 (0.0%) |
| Retail Trade | 38 (51.3%) | 36 (48.6%) |
| Transportation & Warehousing | 0 (0.0%) | 0 (0.0%) |
| Utilities | 0 (0.0%) | 6 (100.0%) |
| Information | 0 (0.0%) | 0 (0.0%) |
| Finance & Insurance | 0 (0.0%) | 8 (100.0%) |
| Real Estate, Rental & Leasing | 5 (100.0%) | 0 (0.0%) |
| Professional & Scientific | 63 (76.8%) | 19 (23.2%) |
| Enterprise Management | 0 (0.0%) | 0 (0.0%) |
| Administrative & Support | 17 (100.0%) | 0 (0.0%) |
| Educational Services | 12 (35.3%) | 22 (64.7%) |
| Health Care & Social Assistance | 0 (0.0%) | 0 (0.0%) |
| Arts, Entertainment & Recreation | 0 (0.0%) | 0 (0.0%) |
| Accommodation & Food Services | 8 (32.0%) | 17 (68.0%) |
| Public Administration | 11 (100.0%) | 0 (0.0%) |
| Total | 227 (54.8%) | 187 (45.2%) |
Education in Eldridge
School Enrollment in Eldridge
The most common levels of schooling among the 116 students in Eldridge are college / undergraduate (46 | 39.7%), elementary school (27 | 23.3%), and middle school (17 | 14.7%).
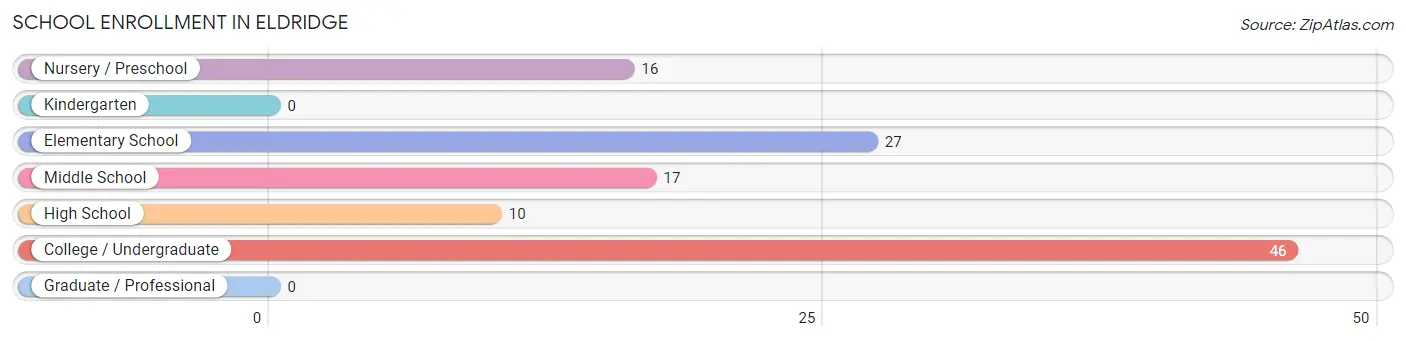
| School Level | # Students | % Students |
| Nursery / Preschool | 16 | 13.8% |
| Kindergarten | 0 | 0.0% |
| Elementary School | 27 | 23.3% |
| Middle School | 17 | 14.7% |
| High School | 10 | 8.6% |
| College / Undergraduate | 46 | 39.7% |
| Graduate / Professional | 0 | 0.0% |
| Total | 116 | 100.0% |
School Enrollment by Age by Funding Source in Eldridge
Out of a total of 116 students who are enrolled in schools in Eldridge, 1 (0.9%) attend a private institution, while the remaining 115 (99.1%) are enrolled in public schools. The age group of 15 to 17 year olds has the highest likelihood of being enrolled in private schools, with 1 (10.0% in the age bracket) enrolled. Conversely, the age group of 3 to 4 year olds has the lowest likelihood of being enrolled in a private school, with 16 (100.0% in the age bracket) attending a public institution.
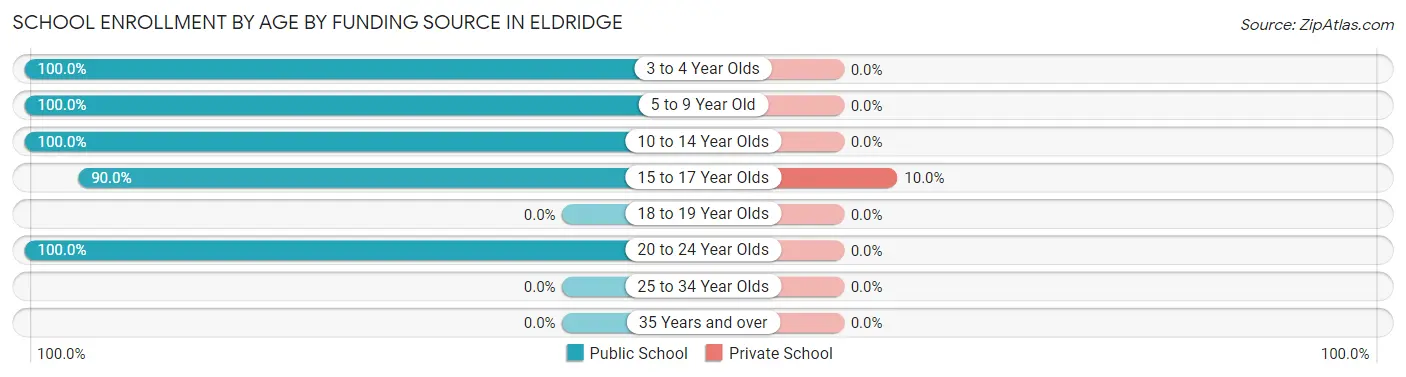
| Age Bracket | Public School | Private School |
| 3 to 4 Year Olds | 16 (100.0%) | 0 (0.0%) |
| 5 to 9 Year Old | 27 (100.0%) | 0 (0.0%) |
| 10 to 14 Year Olds | 17 (100.0%) | 0 (0.0%) |
| 15 to 17 Year Olds | 9 (90.0%) | 1 (10.0%) |
| 18 to 19 Year Olds | 0 (0.0%) | 0 (0.0%) |
| 20 to 24 Year Olds | 46 (100.0%) | 0 (0.0%) |
| 25 to 34 Year Olds | 0 (0.0%) | 0 (0.0%) |
| 35 Years and over | 0 (0.0%) | 0 (0.0%) |
| Total | 115 (99.1%) | 1 (0.9%) |
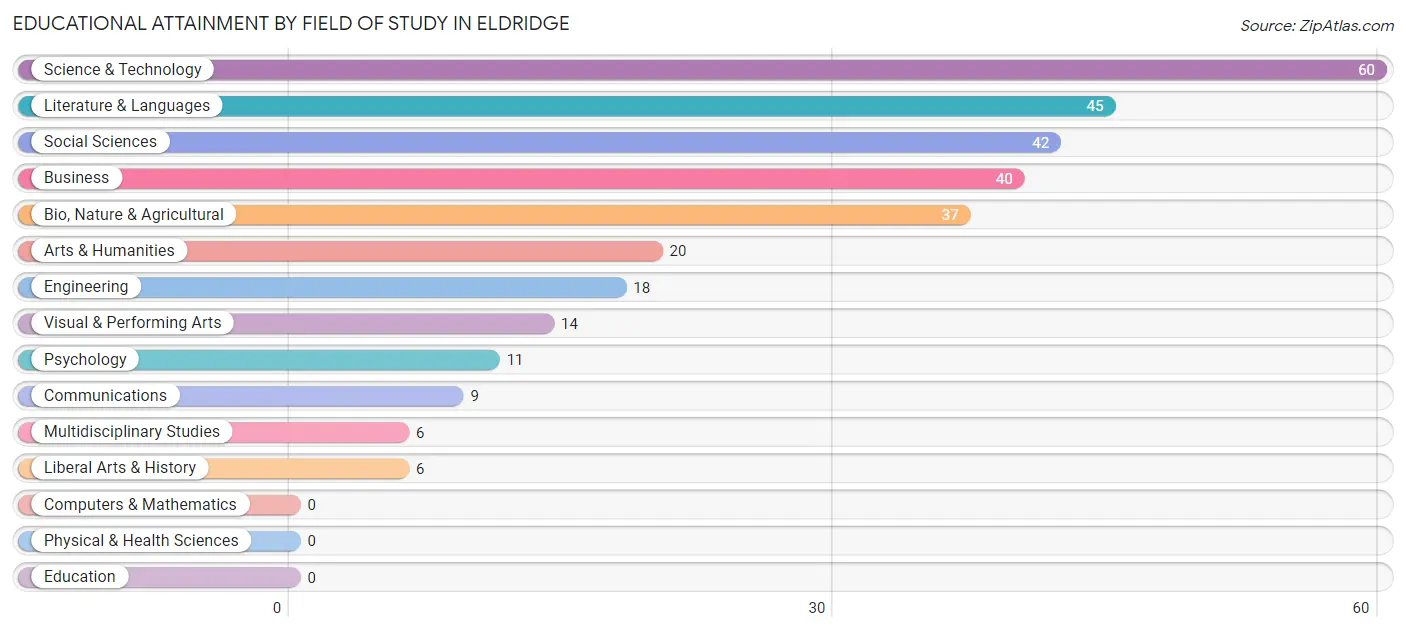
Educational Attainment by Field of Study in Eldridge
Science & technology (60 | 19.5%), literature & languages (45 | 14.6%), social sciences (42 | 13.6%), business (40 | 13.0%), and bio, nature & agricultural (37 | 12.0%) are the most common fields of study among 308 individuals in Eldridge who have obtained a bachelor's degree or higher.
| Field of Study | # Graduates | % Graduates |
| Computers & Mathematics | 0 | 0.0% |
| Bio, Nature & Agricultural | 37 | 12.0% |
| Physical & Health Sciences | 0 | 0.0% |
| Psychology | 11 | 3.6% |
| Social Sciences | 42 | 13.6% |
| Engineering | 18 | 5.8% |
| Multidisciplinary Studies | 6 | 1.9% |
| Science & Technology | 60 | 19.5% |
| Business | 40 | 13.0% |
| Education | 0 | 0.0% |
| Literature & Languages | 45 | 14.6% |
| Liberal Arts & History | 6 | 1.9% |
| Visual & Performing Arts | 14 | 4.5% |
| Communications | 9 | 2.9% |
| Arts & Humanities | 20 | 6.5% |
| Total | 308 | 100.0% |
Transportation & Commute in Eldridge
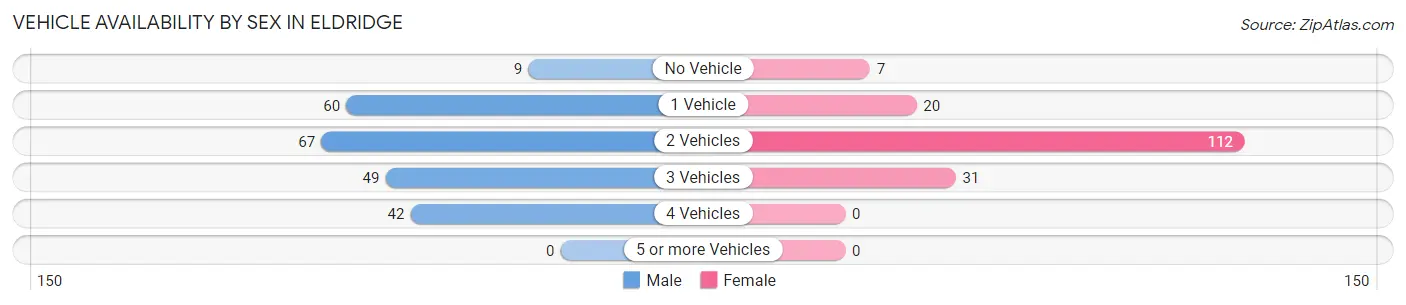
Vehicle Availability by Sex in Eldridge
The most prevalent vehicle ownership categories in Eldridge are males with 2 vehicles (67, accounting for 29.5%) and females with 2 vehicles (112, making up 39.4%).
| Vehicles Available | Male | Female |
| No Vehicle | 9 (4.0%) | 7 (4.1%) |
| 1 Vehicle | 60 (26.4%) | 20 (11.8%) |
| 2 Vehicles | 67 (29.5%) | 112 (65.9%) |
| 3 Vehicles | 49 (21.6%) | 31 (18.2%) |
| 4 Vehicles | 42 (18.5%) | 0 (0.0%) |
| 5 or more Vehicles | 0 (0.0%) | 0 (0.0%) |
| Total | 227 (100.0%) | 170 (100.0%) |
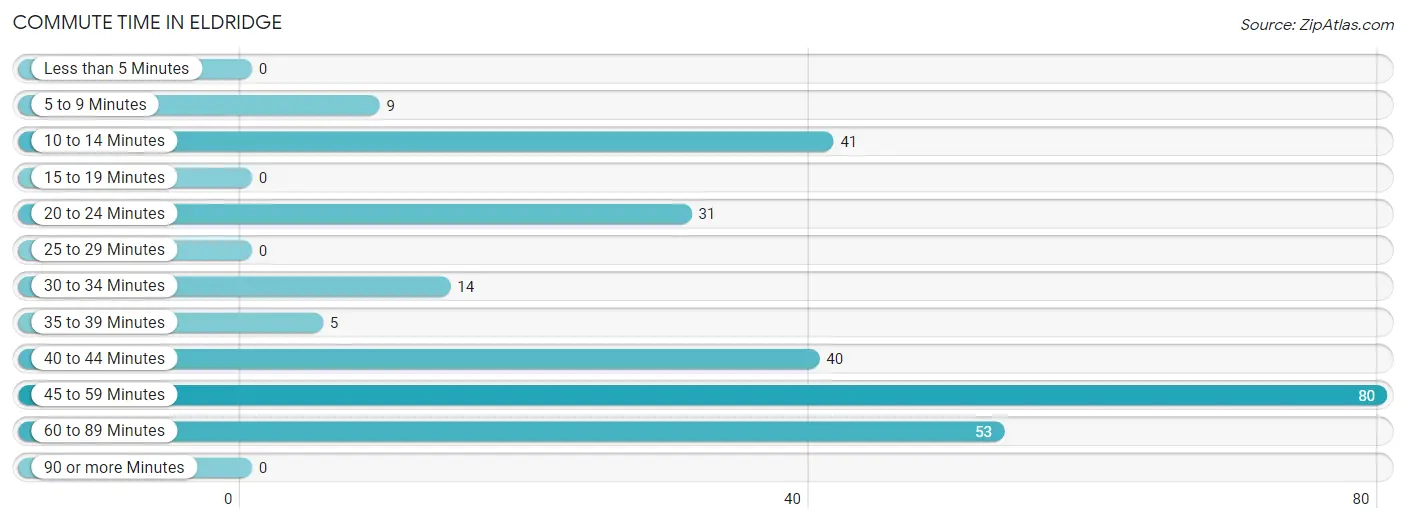
Commute Time in Eldridge
The most frequently occuring commute durations in Eldridge are 45 to 59 minutes (80 commuters, 29.3%), 60 to 89 minutes (53 commuters, 19.4%), and 10 to 14 minutes (41 commuters, 15.0%).
| Commute Time | # Commuters | % Commuters |
| Less than 5 Minutes | 0 | 0.0% |
| 5 to 9 Minutes | 9 | 3.3% |
| 10 to 14 Minutes | 41 | 15.0% |
| 15 to 19 Minutes | 0 | 0.0% |
| 20 to 24 Minutes | 31 | 11.4% |
| 25 to 29 Minutes | 0 | 0.0% |
| 30 to 34 Minutes | 14 | 5.1% |
| 35 to 39 Minutes | 5 | 1.8% |
| 40 to 44 Minutes | 40 | 14.6% |
| 45 to 59 Minutes | 80 | 29.3% |
| 60 to 89 Minutes | 53 | 19.4% |
| 90 or more Minutes | 0 | 0.0% |
Commute Time by Sex in Eldridge
The most common commute times in Eldridge are 60 to 89 minutes (53 commuters, 32.7%) for males and 45 to 59 minutes (74 commuters, 66.7%) for females.
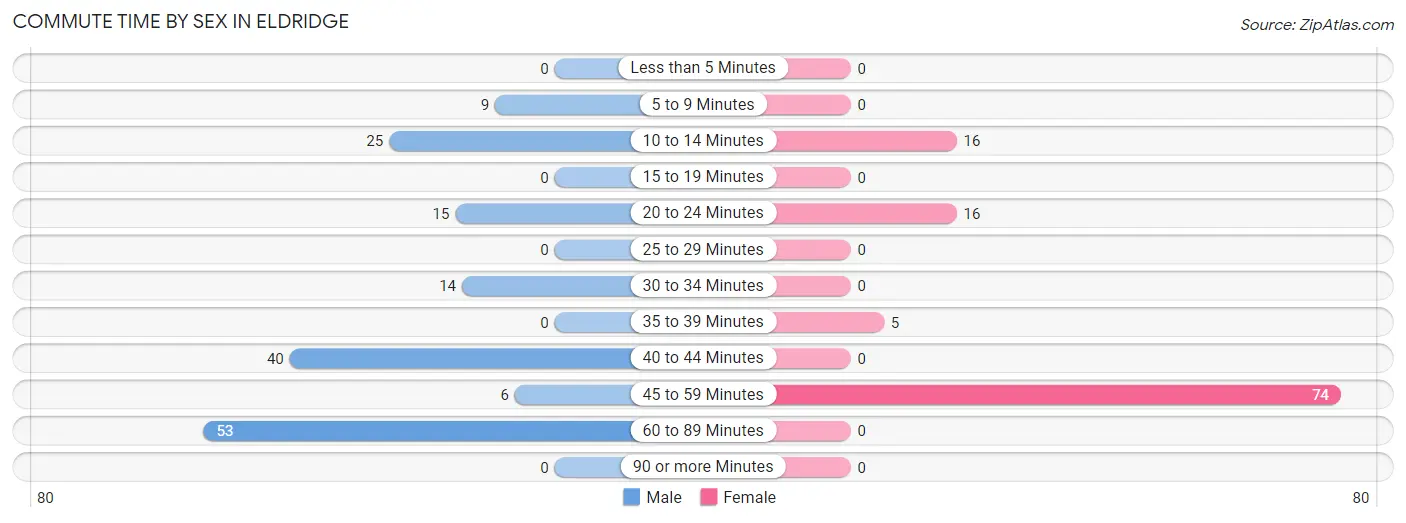
| Commute Time | Male | Female |
| Less than 5 Minutes | 0 (0.0%) | 0 (0.0%) |
| 5 to 9 Minutes | 9 (5.6%) | 0 (0.0%) |
| 10 to 14 Minutes | 25 (15.4%) | 16 (14.4%) |
| 15 to 19 Minutes | 0 (0.0%) | 0 (0.0%) |
| 20 to 24 Minutes | 15 (9.3%) | 16 (14.4%) |
| 25 to 29 Minutes | 0 (0.0%) | 0 (0.0%) |
| 30 to 34 Minutes | 14 (8.6%) | 0 (0.0%) |
| 35 to 39 Minutes | 0 (0.0%) | 5 (4.5%) |
| 40 to 44 Minutes | 40 (24.7%) | 0 (0.0%) |
| 45 to 59 Minutes | 6 (3.7%) | 74 (66.7%) |
| 60 to 89 Minutes | 53 (32.7%) | 0 (0.0%) |
| 90 or more Minutes | 0 (0.0%) | 0 (0.0%) |
Time of Departure to Work by Sex in Eldridge
The most frequent times of departure to work in Eldridge are 7:30 AM to 7:59 AM (45, 27.8%) for males and 9:00 AM to 9:59 AM (42, 37.8%) for females.
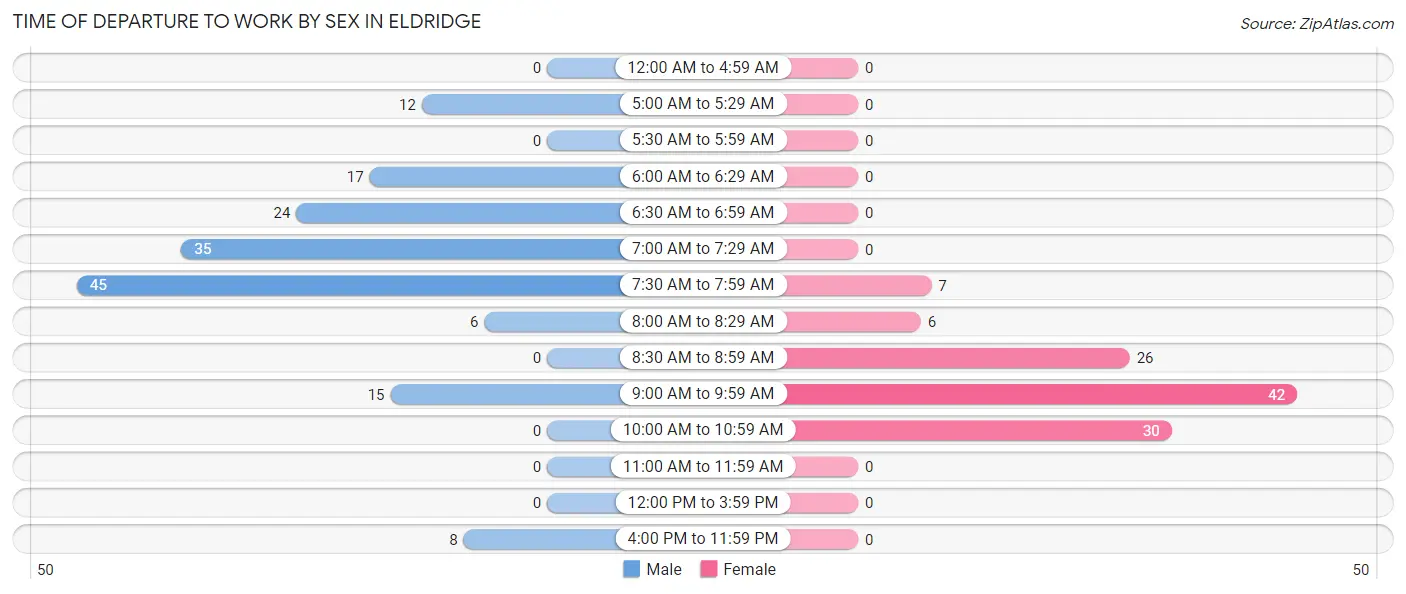
| Time of Departure | Male | Female |
| 12:00 AM to 4:59 AM | 0 (0.0%) | 0 (0.0%) |
| 5:00 AM to 5:29 AM | 12 (7.4%) | 0 (0.0%) |
| 5:30 AM to 5:59 AM | 0 (0.0%) | 0 (0.0%) |
| 6:00 AM to 6:29 AM | 17 (10.5%) | 0 (0.0%) |
| 6:30 AM to 6:59 AM | 24 (14.8%) | 0 (0.0%) |
| 7:00 AM to 7:29 AM | 35 (21.6%) | 0 (0.0%) |
| 7:30 AM to 7:59 AM | 45 (27.8%) | 7 (6.3%) |
| 8:00 AM to 8:29 AM | 6 (3.7%) | 6 (5.4%) |
| 8:30 AM to 8:59 AM | 0 (0.0%) | 26 (23.4%) |
| 9:00 AM to 9:59 AM | 15 (9.3%) | 42 (37.8%) |
| 10:00 AM to 10:59 AM | 0 (0.0%) | 30 (27.0%) |
| 11:00 AM to 11:59 AM | 0 (0.0%) | 0 (0.0%) |
| 12:00 PM to 3:59 PM | 0 (0.0%) | 0 (0.0%) |
| 4:00 PM to 11:59 PM | 8 (4.9%) | 0 (0.0%) |
| Total | 162 (100.0%) | 111 (100.0%) |
Housing Occupancy in Eldridge
Occupancy by Ownership in Eldridge
Of the total 321 dwellings in Eldridge, owner-occupied units account for 225 (70.1%), while renter-occupied units make up 96 (29.9%).
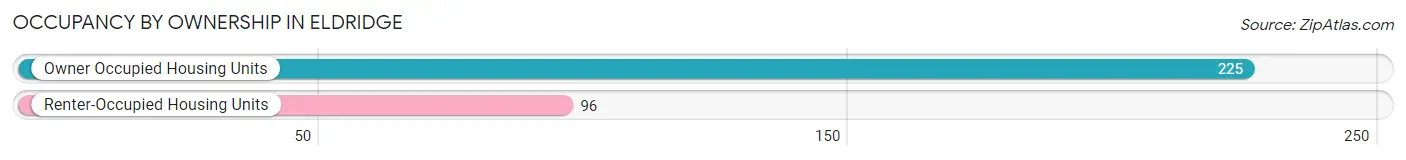
| Occupancy | # Housing Units | % Housing Units |
| Owner Occupied Housing Units | 225 | 70.1% |
| Renter-Occupied Housing Units | 96 | 29.9% |
| Total Occupied Housing Units | 321 | 100.0% |
Occupancy by Household Size in Eldridge
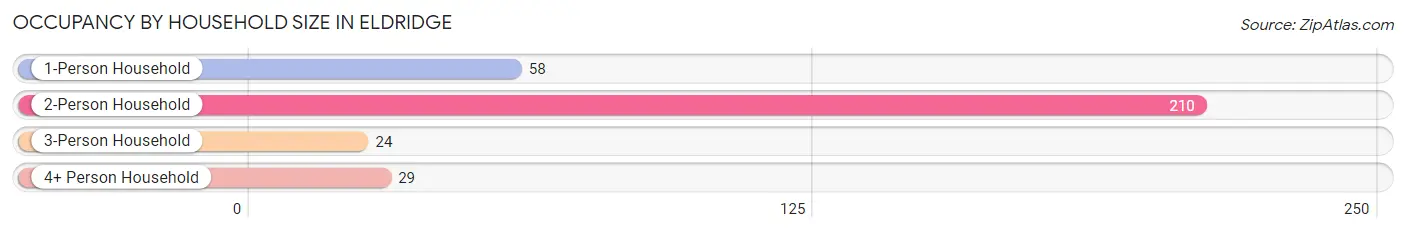
| Household Size | # Housing Units | % Housing Units |
| 1-Person Household | 58 | 18.1% |
| 2-Person Household | 210 | 65.4% |
| 3-Person Household | 24 | 7.5% |
| 4+ Person Household | 29 | 9.0% |
| Total Housing Units | 321 | 100.0% |
Occupancy by Ownership by Household Size in Eldridge
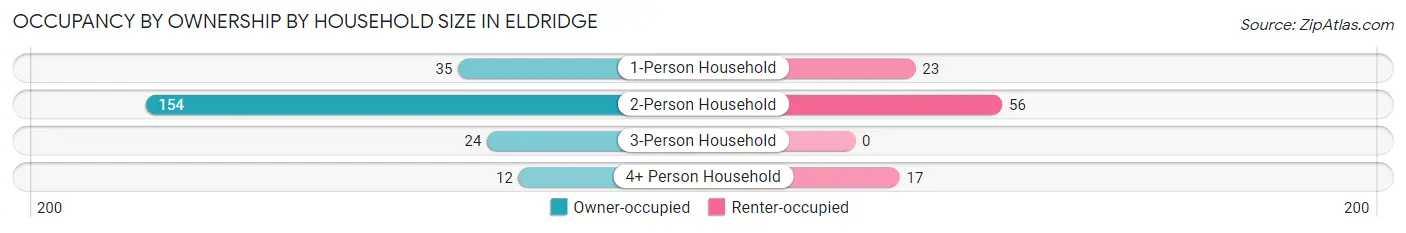
| Household Size | Owner-occupied | Renter-occupied |
| 1-Person Household | 35 (60.3%) | 23 (39.7%) |
| 2-Person Household | 154 (73.3%) | 56 (26.7%) |
| 3-Person Household | 24 (100.0%) | 0 (0.0%) |
| 4+ Person Household | 12 (41.4%) | 17 (58.6%) |
| Total Housing Units | 225 (70.1%) | 96 (29.9%) |
Occupancy by Educational Attainment in Eldridge
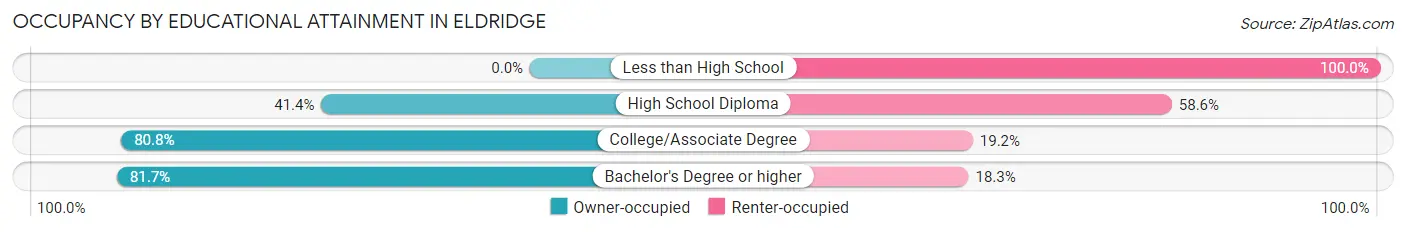
| Household Size | Owner-occupied | Renter-occupied |
| Less than High School | 0 (0.0%) | 30 (100.0%) |
| High School Diploma | 12 (41.4%) | 17 (58.6%) |
| College/Associate Degree | 97 (80.8%) | 23 (19.2%) |
| Bachelor's Degree or higher | 116 (81.7%) | 26 (18.3%) |
Occupancy by Age of Householder in Eldridge
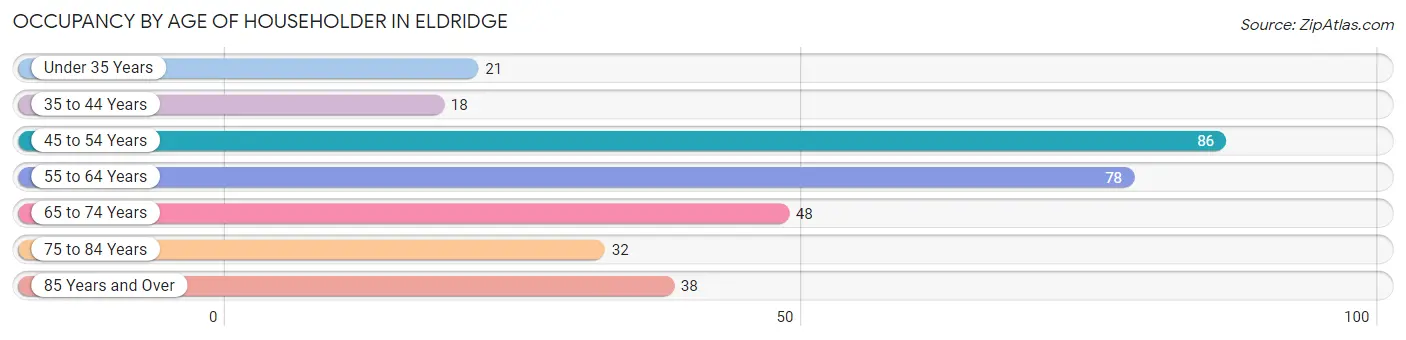
| Age Bracket | # Households | % Households |
| Under 35 Years | 21 | 6.5% |
| 35 to 44 Years | 18 | 5.6% |
| 45 to 54 Years | 86 | 26.8% |
| 55 to 64 Years | 78 | 24.3% |
| 65 to 74 Years | 48 | 14.9% |
| 75 to 84 Years | 32 | 10.0% |
| 85 Years and Over | 38 | 11.8% |
| Total | 321 | 100.0% |
Housing Finances in Eldridge
Median Income by Occupancy in Eldridge
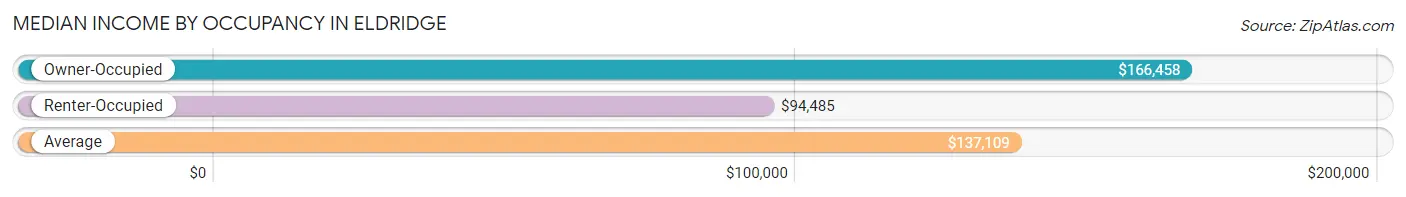
| Occupancy Type | # Households | Median Income |
| Owner-Occupied | 225 (70.1%) | $166,458 |
| Renter-Occupied | 96 (29.9%) | $94,485 |
| Average | 321 (100.0%) | $137,109 |
Occupancy by Householder Income Bracket in Eldridge
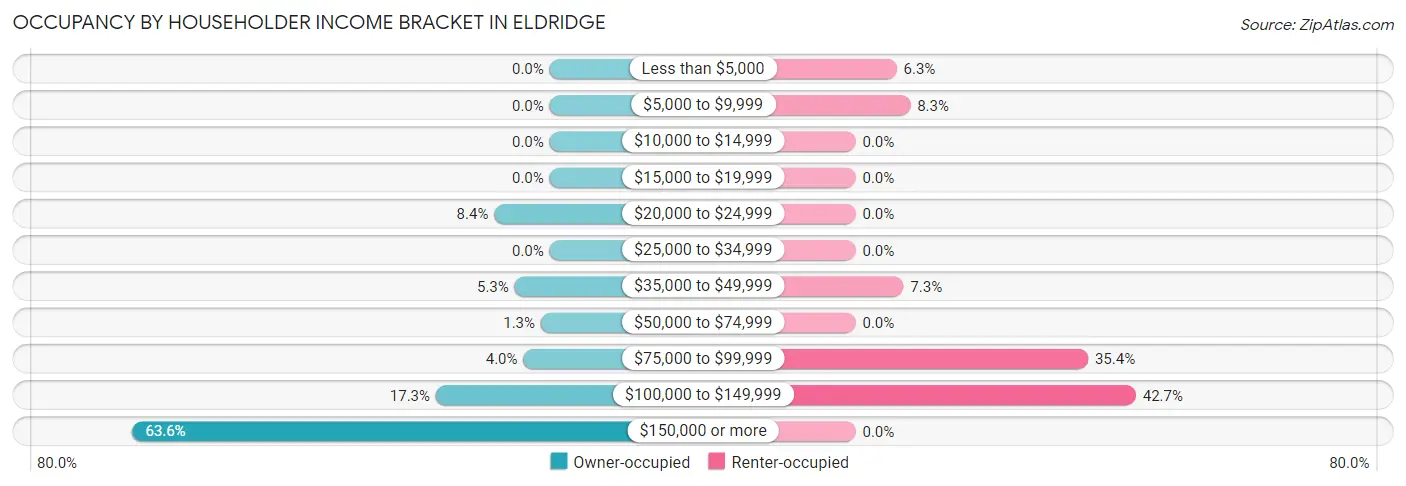
| Income Bracket | Owner-occupied | Renter-occupied |
| Less than $5,000 | 0 (0.0%) | 6 (6.2%) |
| $5,000 to $9,999 | 0 (0.0%) | 8 (8.3%) |
| $10,000 to $14,999 | 0 (0.0%) | 0 (0.0%) |
| $15,000 to $19,999 | 0 (0.0%) | 0 (0.0%) |
| $20,000 to $24,999 | 19 (8.4%) | 0 (0.0%) |
| $25,000 to $34,999 | 0 (0.0%) | 0 (0.0%) |
| $35,000 to $49,999 | 12 (5.3%) | 7 (7.3%) |
| $50,000 to $74,999 | 3 (1.3%) | 0 (0.0%) |
| $75,000 to $99,999 | 9 (4.0%) | 34 (35.4%) |
| $100,000 to $149,999 | 39 (17.3%) | 41 (42.7%) |
| $150,000 or more | 143 (63.6%) | 0 (0.0%) |
| Total | 225 (100.0%) | 96 (100.0%) |
Monthly Housing Cost Tiers in Eldridge
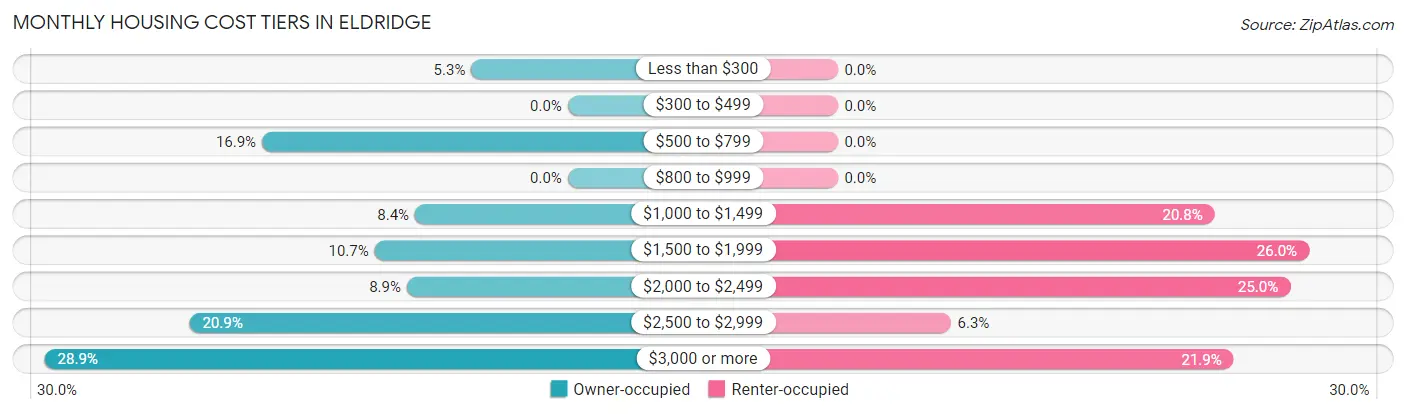
| Monthly Cost | Owner-occupied | Renter-occupied |
| Less than $300 | 12 (5.3%) | 0 (0.0%) |
| $300 to $499 | 0 (0.0%) | 0 (0.0%) |
| $500 to $799 | 38 (16.9%) | 0 (0.0%) |
| $800 to $999 | 0 (0.0%) | 0 (0.0%) |
| $1,000 to $1,499 | 19 (8.4%) | 20 (20.8%) |
| $1,500 to $1,999 | 24 (10.7%) | 25 (26.0%) |
| $2,000 to $2,499 | 20 (8.9%) | 24 (25.0%) |
| $2,500 to $2,999 | 47 (20.9%) | 6 (6.2%) |
| $3,000 or more | 65 (28.9%) | 21 (21.9%) |
| Total | 225 (100.0%) | 96 (100.0%) |
Physical Housing Characteristics in Eldridge
Housing Structures in Eldridge
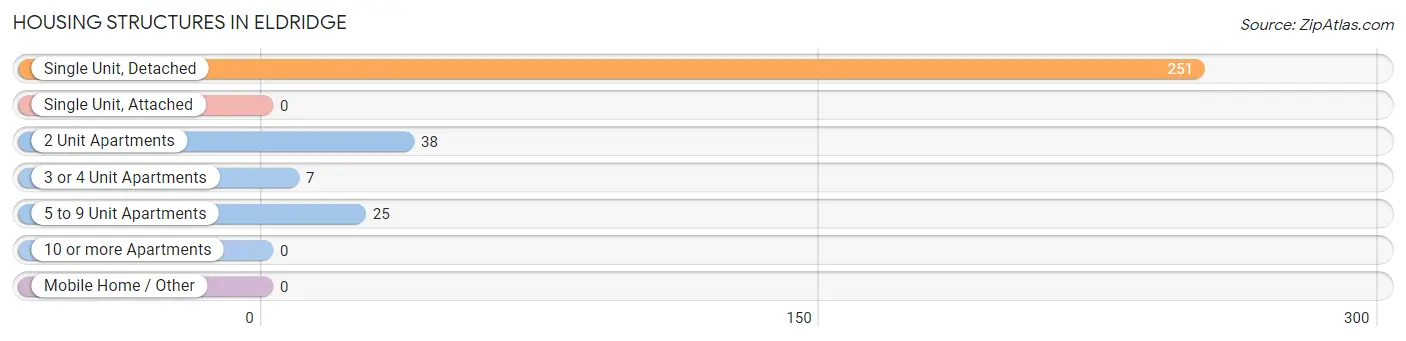
| Structure Type | # Housing Units | % Housing Units |
| Single Unit, Detached | 251 | 78.2% |
| Single Unit, Attached | 0 | 0.0% |
| 2 Unit Apartments | 38 | 11.8% |
| 3 or 4 Unit Apartments | 7 | 2.2% |
| 5 to 9 Unit Apartments | 25 | 7.8% |
| 10 or more Apartments | 0 | 0.0% |
| Mobile Home / Other | 0 | 0.0% |
| Total | 321 | 100.0% |
Housing Structures by Occupancy in Eldridge
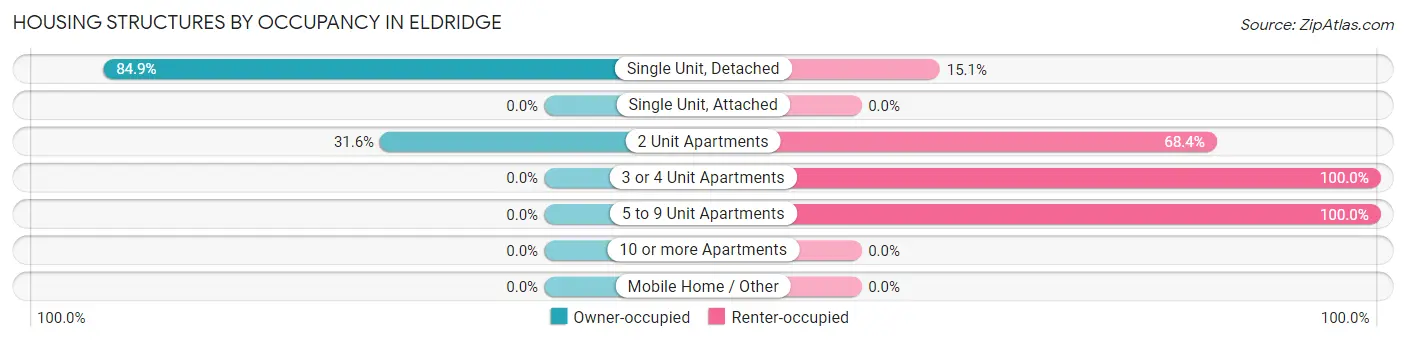
| Structure Type | Owner-occupied | Renter-occupied |
| Single Unit, Detached | 213 (84.9%) | 38 (15.1%) |
| Single Unit, Attached | 0 (0.0%) | 0 (0.0%) |
| 2 Unit Apartments | 12 (31.6%) | 26 (68.4%) |
| 3 or 4 Unit Apartments | 0 (0.0%) | 7 (100.0%) |
| 5 to 9 Unit Apartments | 0 (0.0%) | 25 (100.0%) |
| 10 or more Apartments | 0 (0.0%) | 0 (0.0%) |
| Mobile Home / Other | 0 (0.0%) | 0 (0.0%) |
| Total | 225 (70.1%) | 96 (29.9%) |
Housing Structures by Number of Rooms in Eldridge
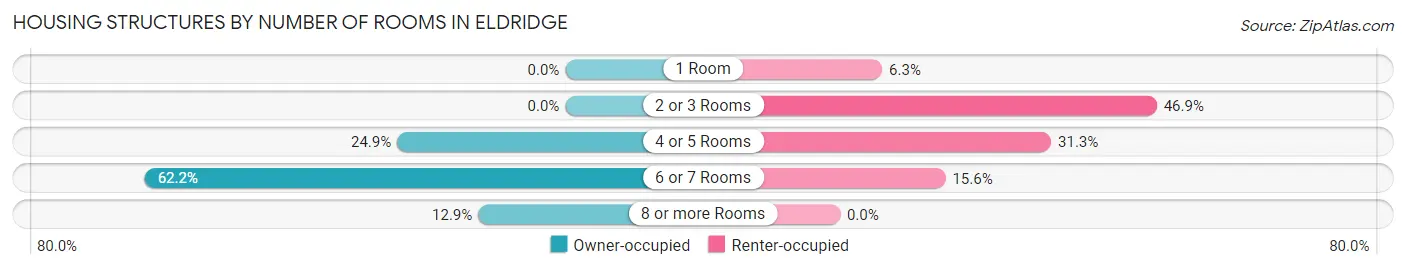
| Number of Rooms | Owner-occupied | Renter-occupied |
| 1 Room | 0 (0.0%) | 6 (6.2%) |
| 2 or 3 Rooms | 0 (0.0%) | 45 (46.9%) |
| 4 or 5 Rooms | 56 (24.9%) | 30 (31.2%) |
| 6 or 7 Rooms | 140 (62.2%) | 15 (15.6%) |
| 8 or more Rooms | 29 (12.9%) | 0 (0.0%) |
| Total | 225 (100.0%) | 96 (100.0%) |
Housing Structure by Heating Type in Eldridge
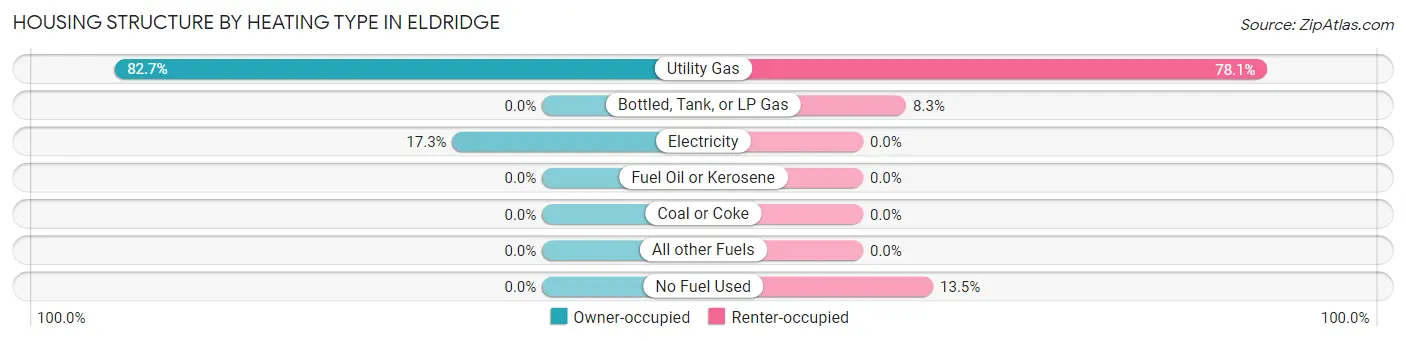
| Heating Type | Owner-occupied | Renter-occupied |
| Utility Gas | 186 (82.7%) | 75 (78.1%) |
| Bottled, Tank, or LP Gas | 0 (0.0%) | 8 (8.3%) |
| Electricity | 39 (17.3%) | 0 (0.0%) |
| Fuel Oil or Kerosene | 0 (0.0%) | 0 (0.0%) |
| Coal or Coke | 0 (0.0%) | 0 (0.0%) |
| All other Fuels | 0 (0.0%) | 0 (0.0%) |
| No Fuel Used | 0 (0.0%) | 13 (13.5%) |
| Total | 225 (100.0%) | 96 (100.0%) |
Household Vehicle Usage in Eldridge
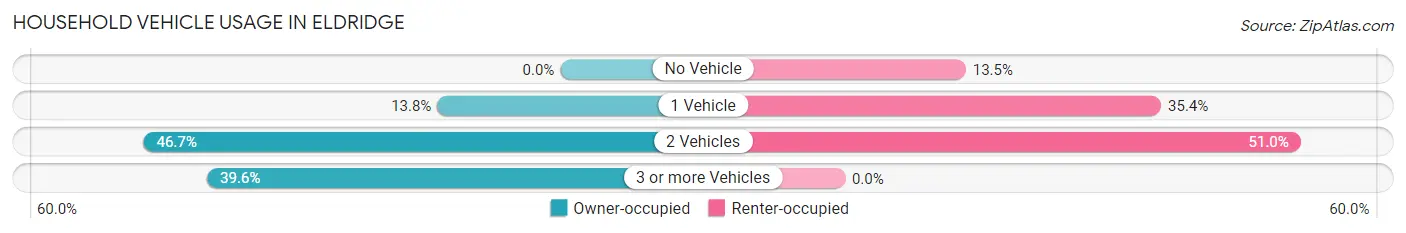
| Vehicles per Household | Owner-occupied | Renter-occupied |
| No Vehicle | 0 (0.0%) | 13 (13.5%) |
| 1 Vehicle | 31 (13.8%) | 34 (35.4%) |
| 2 Vehicles | 105 (46.7%) | 49 (51.0%) |
| 3 or more Vehicles | 89 (39.6%) | 0 (0.0%) |
| Total | 225 (100.0%) | 96 (100.0%) |
Real Estate & Mortgages in Eldridge
Real Estate and Mortgage Overview in Eldridge
| Characteristic | Without Mortgage | With Mortgage |
| Housing Units | 50 | 175 |
| Median Property Value | - | - |
| Median Household Income | - | - |
| Monthly Housing Costs | - | - |
| Real Estate Taxes | - | - |
Property Value by Mortgage Status in Eldridge
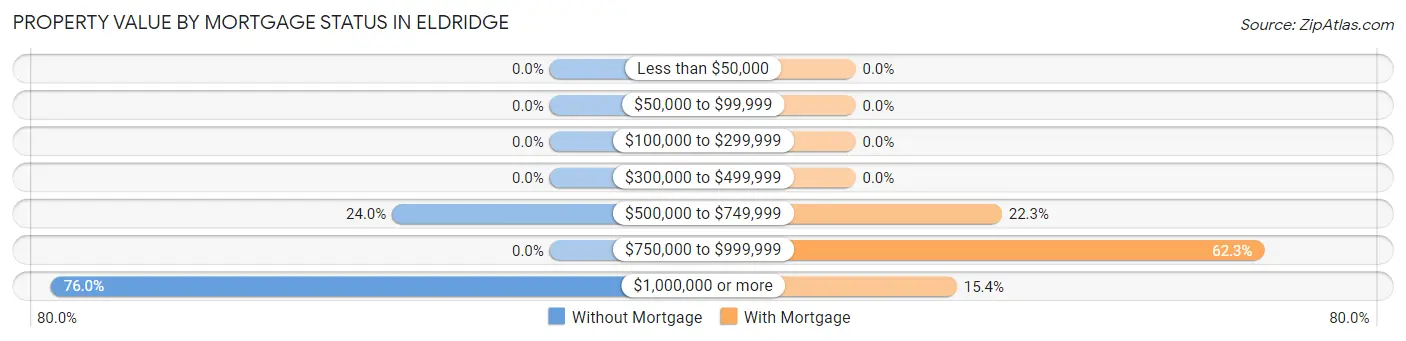
| Property Value | Without Mortgage | With Mortgage |
| Less than $50,000 | 0 (0.0%) | 0 (0.0%) |
| $50,000 to $99,999 | 0 (0.0%) | 0 (0.0%) |
| $100,000 to $299,999 | 0 (0.0%) | 0 (0.0%) |
| $300,000 to $499,999 | 0 (0.0%) | 0 (0.0%) |
| $500,000 to $749,999 | 12 (24.0%) | 39 (22.3%) |
| $750,000 to $999,999 | 0 (0.0%) | 109 (62.3%) |
| $1,000,000 or more | 38 (76.0%) | 27 (15.4%) |
| Total | 50 (100.0%) | 175 (100.0%) |
Household Income by Mortgage Status in Eldridge
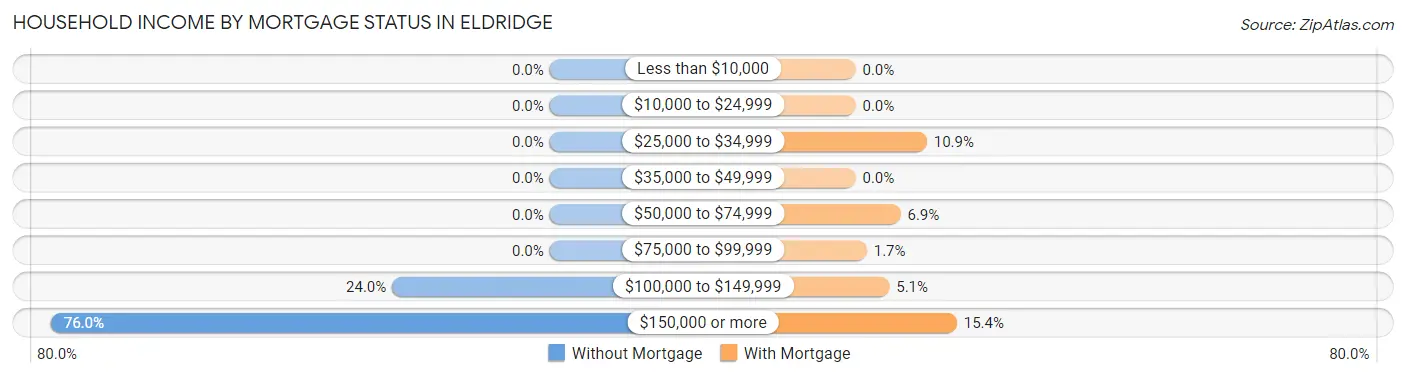
| Household Income | Without Mortgage | With Mortgage |
| Less than $10,000 | 0 (0.0%) | 0 (0.0%) |
| $10,000 to $24,999 | 0 (0.0%) | 0 (0.0%) |
| $25,000 to $34,999 | 0 (0.0%) | 19 (10.9%) |
| $35,000 to $49,999 | 0 (0.0%) | 0 (0.0%) |
| $50,000 to $74,999 | 0 (0.0%) | 12 (6.9%) |
| $75,000 to $99,999 | 0 (0.0%) | 3 (1.7%) |
| $100,000 to $149,999 | 12 (24.0%) | 9 (5.1%) |
| $150,000 or more | 38 (76.0%) | 27 (15.4%) |
| Total | 50 (100.0%) | 175 (100.0%) |
Property Value to Household Income Ratio in Eldridge
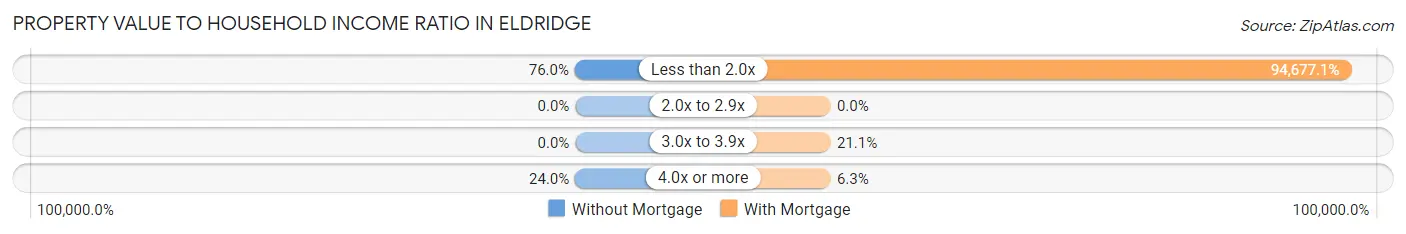
| Value-to-Income Ratio | Without Mortgage | With Mortgage |
| Less than 2.0x | 38 (76.0%) | 165,685 (94,677.1%) |
| 2.0x to 2.9x | 0 (0.0%) | 0 (0.0%) |
| 3.0x to 3.9x | 0 (0.0%) | 37 (21.1%) |
| 4.0x or more | 12 (24.0%) | 11 (6.3%) |
| Total | 50 (100.0%) | 175 (100.0%) |
Real Estate Taxes by Mortgage Status in Eldridge
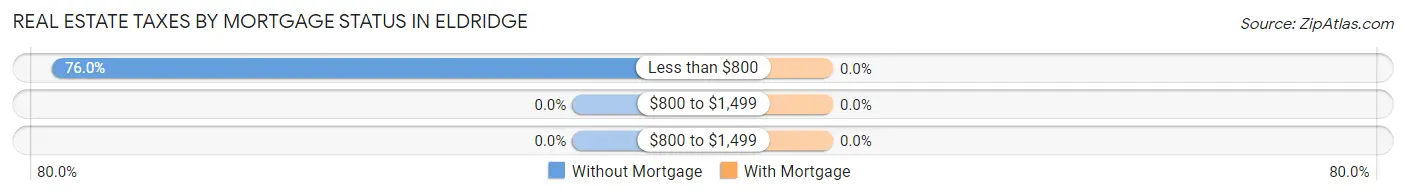
| Property Taxes | Without Mortgage | With Mortgage |
| Less than $800 | 38 (76.0%) | 0 (0.0%) |
| $800 to $1,499 | 0 (0.0%) | 0 (0.0%) |
| $800 to $1,499 | 0 (0.0%) | 0 (0.0%) |
| Total | 50 (100.0%) | 175 (100.0%) |
Health & Disability in Eldridge
Health Insurance Coverage by Age in Eldridge
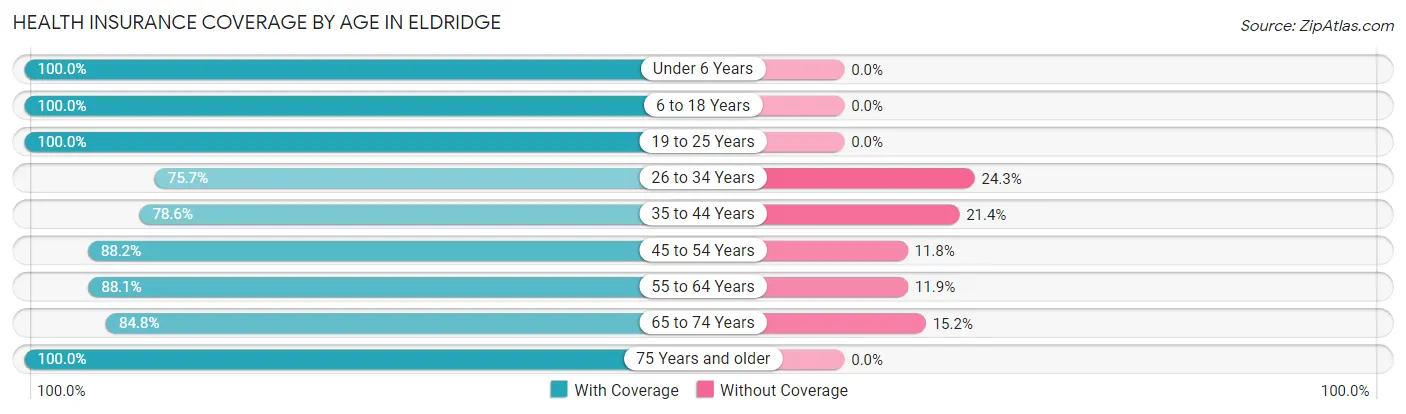
| Age Bracket | With Coverage | Without Coverage |
| Under 6 Years | 18 (100.0%) | 0 (0.0%) |
| 6 to 18 Years | 53 (100.0%) | 0 (0.0%) |
| 19 to 25 Years | 46 (100.0%) | 0 (0.0%) |
| 26 to 34 Years | 53 (75.7%) | 17 (24.3%) |
| 35 to 44 Years | 22 (78.6%) | 6 (21.4%) |
| 45 to 54 Years | 157 (88.2%) | 21 (11.8%) |
| 55 to 64 Years | 141 (88.1%) | 19 (11.9%) |
| 65 to 74 Years | 67 (84.8%) | 12 (15.2%) |
| 75 Years and older | 97 (100.0%) | 0 (0.0%) |
| Total | 654 (89.7%) | 75 (10.3%) |
Health Insurance Coverage by Citizenship Status in Eldridge
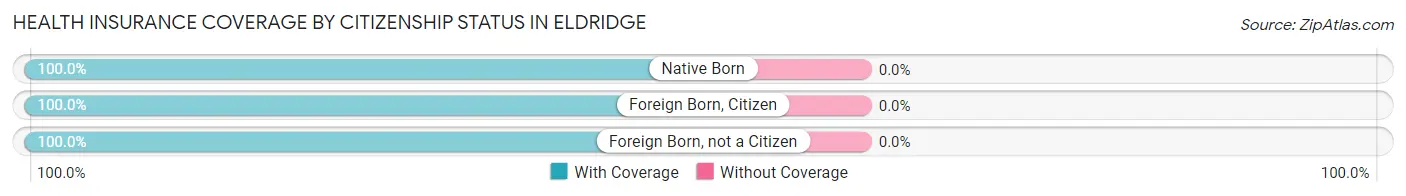
| Citizenship Status | With Coverage | Without Coverage |
| Native Born | 18 (100.0%) | 0 (0.0%) |
| Foreign Born, Citizen | 53 (100.0%) | 0 (0.0%) |
| Foreign Born, not a Citizen | 46 (100.0%) | 0 (0.0%) |
Health Insurance Coverage by Household Income in Eldridge
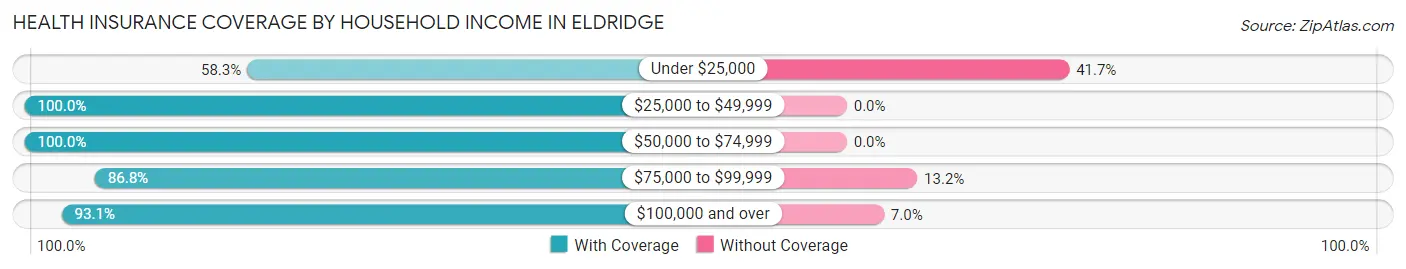
| Household Income | With Coverage | Without Coverage |
| Under $25,000 | 35 (58.3%) | 25 (41.7%) |
| $25,000 to $49,999 | 28 (100.0%) | 0 (0.0%) |
| $50,000 to $74,999 | 3 (100.0%) | 0 (0.0%) |
| $75,000 to $99,999 | 112 (86.8%) | 17 (13.2%) |
| $100,000 and over | 442 (93.0%) | 33 (7.0%) |
Public vs Private Health Insurance Coverage by Age in Eldridge
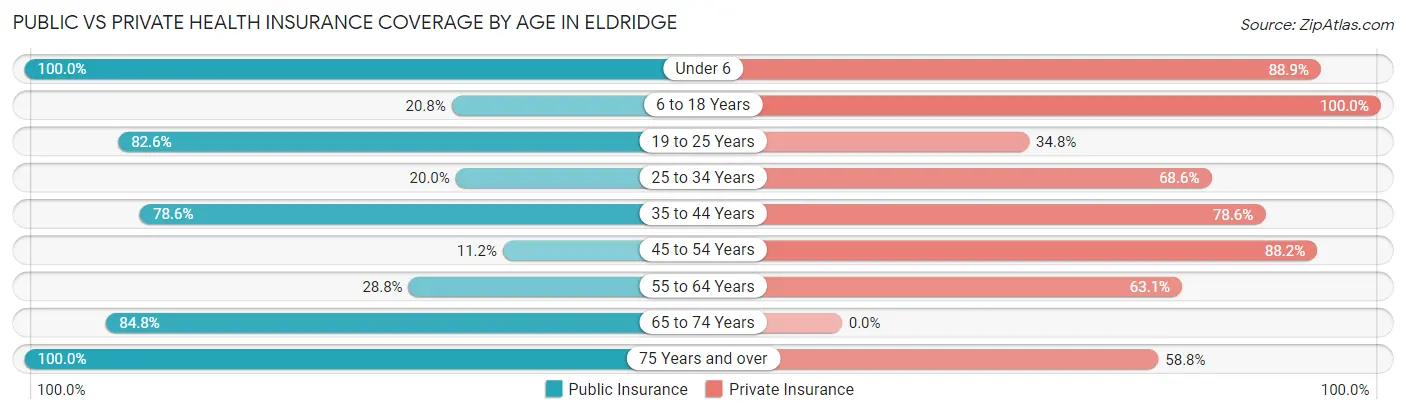
| Age Bracket | Public Insurance | Private Insurance |
| Under 6 | 18 (100.0%) | 16 (88.9%) |
| 6 to 18 Years | 11 (20.7%) | 53 (100.0%) |
| 19 to 25 Years | 38 (82.6%) | 16 (34.8%) |
| 25 to 34 Years | 14 (20.0%) | 48 (68.6%) |
| 35 to 44 Years | 22 (78.6%) | 22 (78.6%) |
| 45 to 54 Years | 20 (11.2%) | 157 (88.2%) |
| 55 to 64 Years | 46 (28.7%) | 101 (63.1%) |
| 65 to 74 Years | 67 (84.8%) | 0 (0.0%) |
| 75 Years and over | 97 (100.0%) | 57 (58.8%) |
| Total | 333 (45.7%) | 470 (64.5%) |
Disability Status by Sex by Age in Eldridge
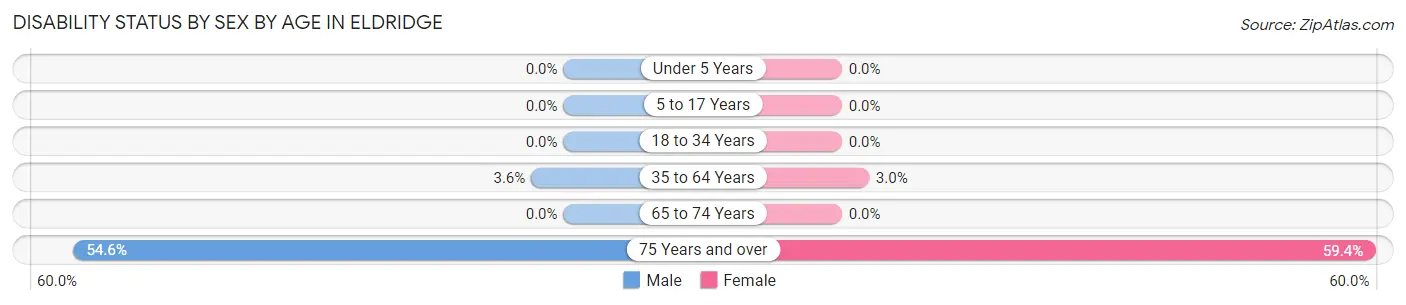
| Age Bracket | Male | Female |
| Under 5 Years | 0 (0.0%) | 0 (0.0%) |
| 5 to 17 Years | 0 (0.0%) | 0 (0.0%) |
| 18 to 34 Years | 0 (0.0%) | 0 (0.0%) |
| 35 to 64 Years | 6 (3.6%) | 6 (3.0%) |
| 65 to 74 Years | 0 (0.0%) | 0 (0.0%) |
| 75 Years and over | 18 (54.5%) | 38 (59.4%) |
Disability Class by Sex by Age in Eldridge
Disability Class: Hearing Difficulty
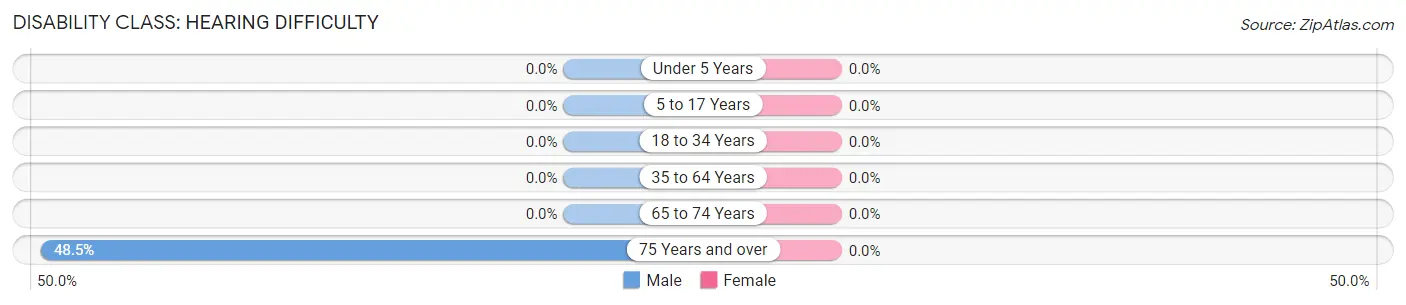
| Age Bracket | Male | Female |
| Under 5 Years | 0 (0.0%) | 0 (0.0%) |
| 5 to 17 Years | 0 (0.0%) | 0 (0.0%) |
| 18 to 34 Years | 0 (0.0%) | 0 (0.0%) |
| 35 to 64 Years | 0 (0.0%) | 0 (0.0%) |
| 65 to 74 Years | 0 (0.0%) | 0 (0.0%) |
| 75 Years and over | 16 (48.5%) | 0 (0.0%) |
Disability Class: Vision Difficulty
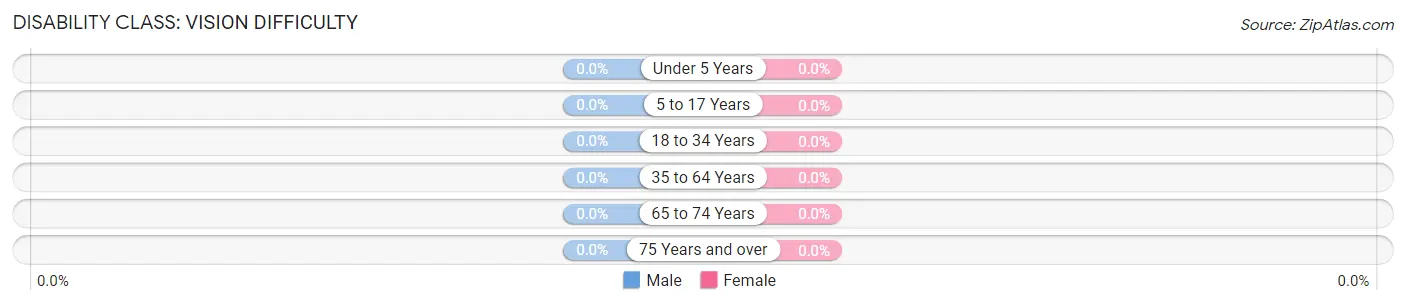
| Age Bracket | Male | Female |
| Under 5 Years | 0 (0.0%) | 0 (0.0%) |
| 5 to 17 Years | 0 (0.0%) | 0 (0.0%) |
| 18 to 34 Years | 0 (0.0%) | 0 (0.0%) |
| 35 to 64 Years | 0 (0.0%) | 0 (0.0%) |
| 65 to 74 Years | 0 (0.0%) | 0 (0.0%) |
| 75 Years and over | 0 (0.0%) | 0 (0.0%) |
Disability Class: Cognitive Difficulty
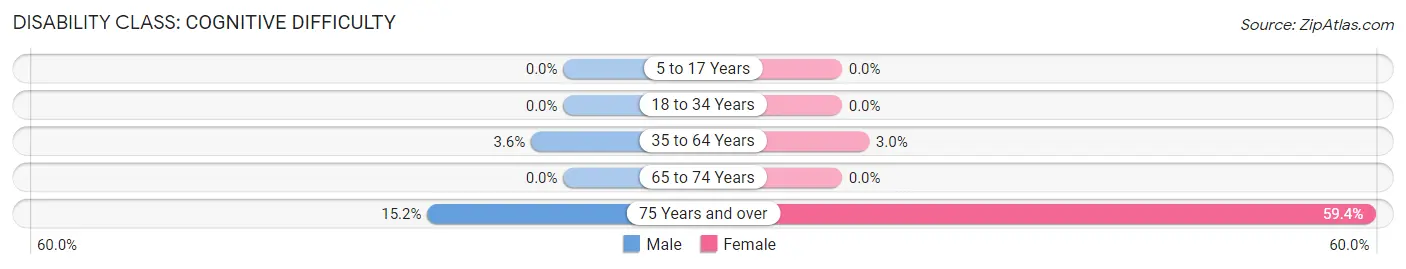
| Age Bracket | Male | Female |
| 5 to 17 Years | 0 (0.0%) | 0 (0.0%) |
| 18 to 34 Years | 0 (0.0%) | 0 (0.0%) |
| 35 to 64 Years | 6 (3.6%) | 6 (3.0%) |
| 65 to 74 Years | 0 (0.0%) | 0 (0.0%) |
| 75 Years and over | 5 (15.1%) | 38 (59.4%) |
Disability Class: Ambulatory Difficulty
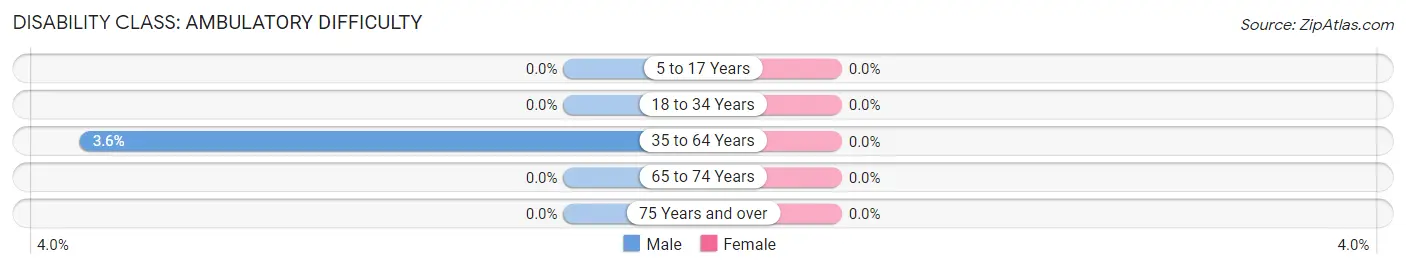
| Age Bracket | Male | Female |
| 5 to 17 Years | 0 (0.0%) | 0 (0.0%) |
| 18 to 34 Years | 0 (0.0%) | 0 (0.0%) |
| 35 to 64 Years | 6 (3.6%) | 0 (0.0%) |
| 65 to 74 Years | 0 (0.0%) | 0 (0.0%) |
| 75 Years and over | 0 (0.0%) | 0 (0.0%) |
Disability Class: Self-Care Difficulty
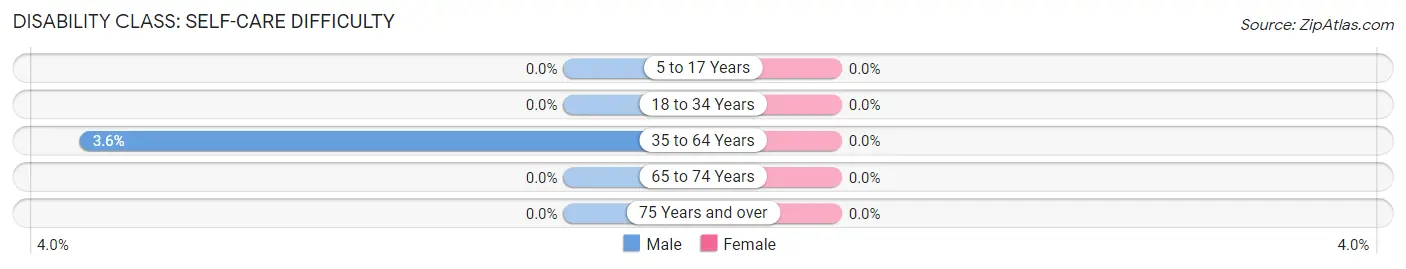
| Age Bracket | Male | Female |
| 5 to 17 Years | 0 (0.0%) | 0 (0.0%) |
| 18 to 34 Years | 0 (0.0%) | 0 (0.0%) |
| 35 to 64 Years | 6 (3.6%) | 0 (0.0%) |
| 65 to 74 Years | 0 (0.0%) | 0 (0.0%) |
| 75 Years and over | 0 (0.0%) | 0 (0.0%) |
Technology Access in Eldridge
Computing Device Access in Eldridge
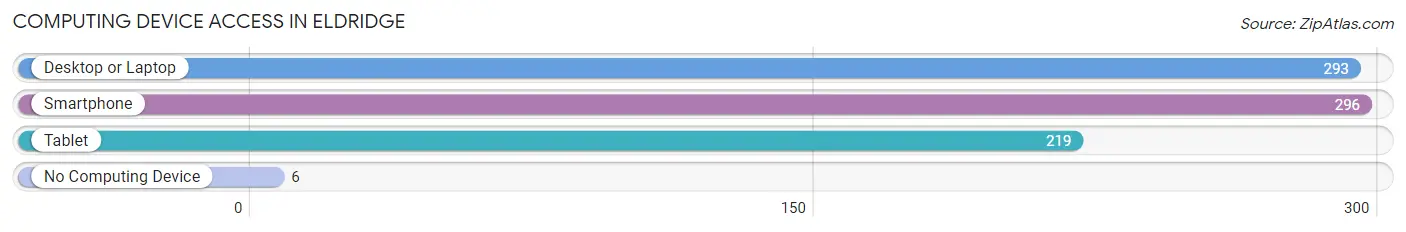
| Device Type | # Households | % Households |
| Desktop or Laptop | 293 | 91.3% |
| Smartphone | 296 | 92.2% |
| Tablet | 219 | 68.2% |
| No Computing Device | 6 | 1.9% |
| Total | 321 | 100.0% |
Internet Access in Eldridge
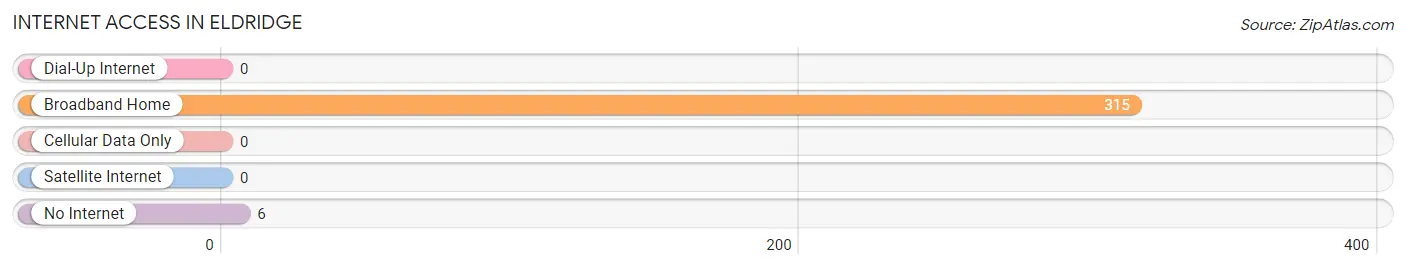
| Internet Type | # Households | % Households |
| Dial-Up Internet | 0 | 0.0% |
| Broadband Home | 315 | 98.1% |
| Cellular Data Only | 0 | 0.0% |
| Satellite Internet | 0 | 0.0% |
| No Internet | 6 | 1.9% |
| Total | 321 | 100.0% |
Eldridge Summary
Eldridge is a small unincorporated community located in Sonoma County, California. It is situated in the northern part of the county, about 10 miles north of Santa Rosa and about 5 miles east of the Pacific Ocean. The population of Eldridge was estimated to be around 1,000 in 2000.
History
The area that is now Eldridge was originally inhabited by the Coast Miwok Native Americans. The first European settlers arrived in the area in the mid-1800s, and the town was officially founded in 1876. The town was named after William Eldridge, who was one of the first settlers in the area.
In the early 1900s, the town was a popular destination for tourists, who came to enjoy the mild climate and the scenic views of the nearby Pacific Ocean. The town also had a thriving agricultural industry, with many farms and ranches in the area.
Geography
Eldridge is located in the northern part of Sonoma County, about 10 miles north of Santa Rosa and about 5 miles east of the Pacific Ocean. The town is situated in a valley surrounded by rolling hills and is bordered by the Russian River to the east. The climate in Eldridge is mild and temperate, with warm summers and cool winters.
Economy
The economy of Eldridge is largely based on agriculture and tourism. The town is home to several wineries and vineyards, as well as a number of farms and ranches. Tourism is also an important part of the local economy, with many visitors coming to the area to enjoy the scenic views and mild climate.
Demographics
As of the 2000 census, the population of Eldridge was estimated to be around 1,000. The racial makeup of the town was 94.3% White, 0.7% African American, 0.7% Native American, 0.7% Asian, 0.3% Pacific Islander, and 2.7% from other races. The median household income in Eldridge was $50,000, and the median age was 40.
Conclusion
Eldridge is a small unincorporated community located in Sonoma County, California. It is situated in the northern part of the county, about 10 miles north of Santa Rosa and about 5 miles east of the Pacific Ocean. The population of Eldridge was estimated to be around 1,000 in 2000. The economy of Eldridge is largely based on agriculture and tourism, and the town is home to several wineries and vineyards, as well as a number of farms and ranches. The racial makeup of the town was 94.3% White, 0.7% African American, 0.7% Native American, 0.7% Asian, 0.3% Pacific Islander, and 2.7% from other races. The median household income in Eldridge was $50,000, and the median age was 40.
Common Questions
What is the Total Population of Eldridge?
Total Population of Eldridge is 730.
What is the Total Male Population of Eldridge?
Total Male Population of Eldridge is 351.
What is the Total Female Population of Eldridge?
Total Female Population of Eldridge is 379.
What is the Ratio of Males per 100 Females in Eldridge?
There are 92.61 Males per 100 Females in Eldridge.
What is the Ratio of Females per 100 Males in Eldridge?
There are 107.98 Females per 100 Males in Eldridge.
What is the Median Population Age in Eldridge?
Median Population Age in Eldridge is 54.5 Years.
What is the Average Family Size in Eldridge
Average Family Size in Eldridge is 2.6 People.
What is the Average Household Size in Eldridge
Average Household Size in Eldridge is 2.2 People.
What is Per Capita Income in Eldridge?
Per Capita income in Eldridge is $122,854.
What is the Median Household income in Eldridge?
Median Household Income in Eldridge is $137,109.
What is Income or Wage Gap in Eldridge?
Income or Wage Gap in Eldridge is 60.8%.
Women in Eldridge earn 39.2 cents for every dollar earned by a man.
What is Inequality or Gini Index in Eldridge?
Inequality or Gini Index in Eldridge is 0.56.
How Large is the Labor Force in Eldridge?
There are 476 People in the Labor Forcein in Eldridge.
What is the Percentage of People in the Labor Force in Eldridge?
71.3% of People are in the Labor Force in Eldridge.
What is the Unemployment Rate in Eldridge?
Unemployment Rate in Eldridge is 13.0%.