El Segundo, CA
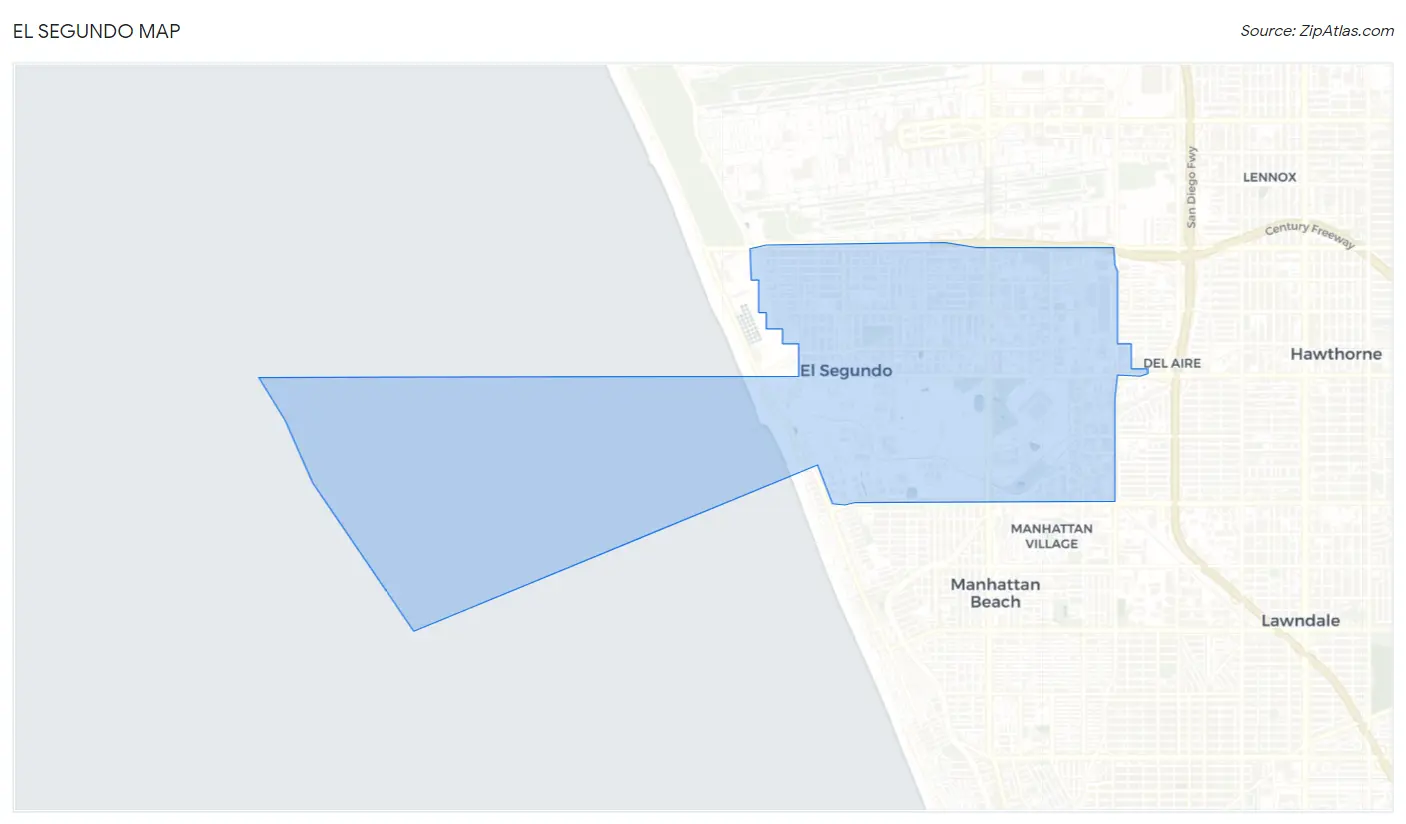
El Segundo Map
El Segundo Overview
17,081
TOTAL POPULATION
8,662
MALE POPULATION
8,419
FEMALE POPULATION
102.89
MALES / 100 FEMALES
97.19
FEMALES / 100 MALES
36.4
MEDIAN AGE
3.0
AVG FAMILY SIZE
2.4
AVG HOUSEHOLD SIZE
$74,872
PER CAPITA INCOME
$173,714
AVG FAMILY INCOME
$142,596
AVG HOUSEHOLD INCOME
24.2%
WAGE / INCOME GAP [ % ]
75.8¢/ $1
WAGE / INCOME GAP [ $ ]
0.43
INEQUALITY / GINI INDEX
10,538
LABOR FORCE [ PEOPLE ]
76.2%
PERCENT IN LABOR FORCE
5.4%
UNEMPLOYMENT RATE
El Segundo Zip Codes
Race in El Segundo
The most populous races in El Segundo are White / Caucasian (11,259 | 65.9%), Hispanic or Latino (3,207 | 18.8%), and Two or more Races (2,877 | 16.8%).
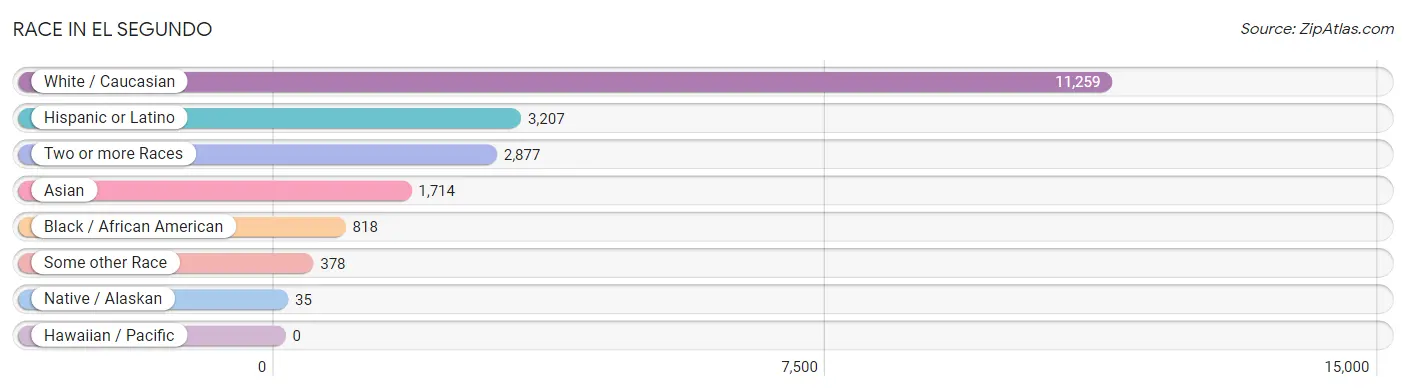
| Race | # Population | % Population |
| Asian | 1,714 | 10.0% |
| Black / African American | 818 | 4.8% |
| Hawaiian / Pacific | 0 | 0.0% |
| Hispanic or Latino | 3,207 | 18.8% |
| Native / Alaskan | 35 | 0.2% |
| White / Caucasian | 11,259 | 65.9% |
| Two or more Races | 2,877 | 16.8% |
| Some other Race | 378 | 2.2% |
| Total | 17,081 | 100.0% |
Ancestry in El Segundo
The most populous ancestries reported in El Segundo are German (2,492 | 14.6%), Mexican (2,090 | 12.2%), Irish (2,010 | 11.8%), English (1,833 | 10.7%), and Italian (1,579 | 9.2%), together accounting for 58.6% of all El Segundo residents.
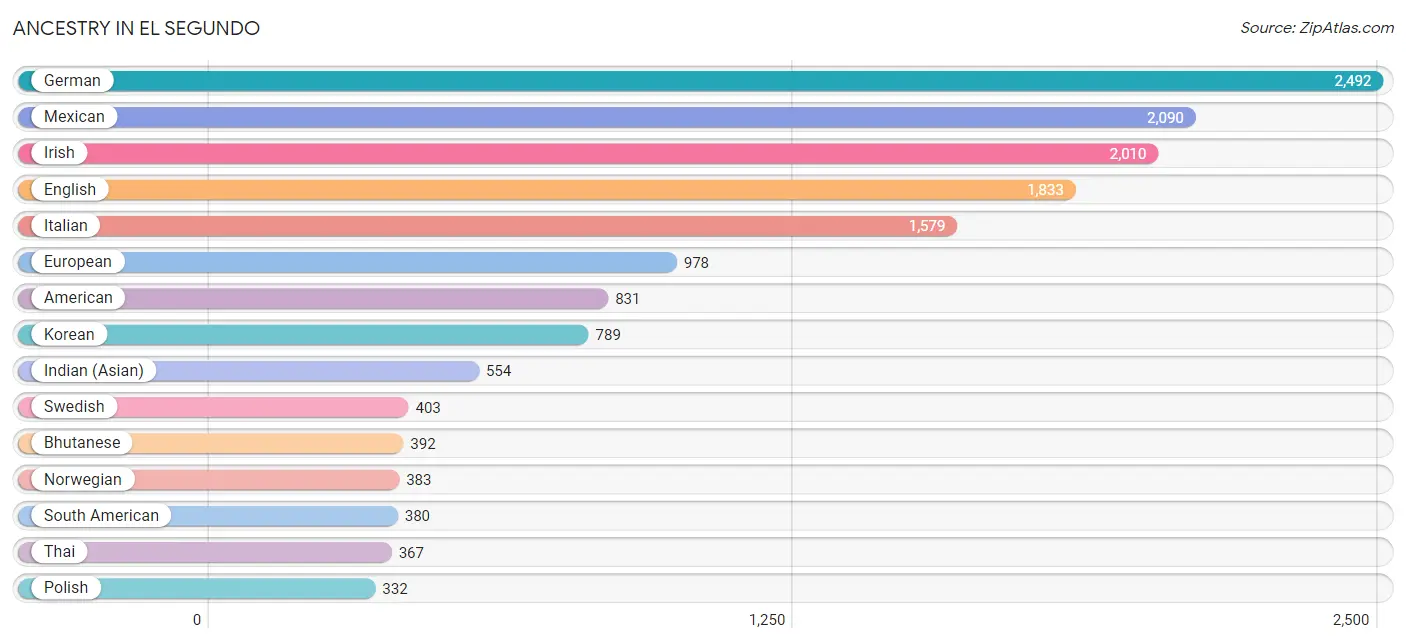
| Ancestry | # Population | % Population |
| African | 78 | 0.5% |
| American | 831 | 4.9% |
| Arab | 214 | 1.3% |
| Argentinean | 86 | 0.5% |
| Australian | 29 | 0.2% |
| Austrian | 65 | 0.4% |
| Basque | 15 | 0.1% |
| Belgian | 15 | 0.1% |
| Belizean | 14 | 0.1% |
| Bhutanese | 392 | 2.3% |
| Brazilian | 61 | 0.4% |
| British | 219 | 1.3% |
| Burmese | 271 | 1.6% |
| Canadian | 122 | 0.7% |
| Central American | 212 | 1.2% |
| Central American Indian | 82 | 0.5% |
| Cherokee | 81 | 0.5% |
| Chickasaw | 13 | 0.1% |
| Chilean | 9 | 0.1% |
| Colombian | 41 | 0.2% |
| Colville | 24 | 0.1% |
| Costa Rican | 34 | 0.2% |
| Croatian | 19 | 0.1% |
| Cuban | 56 | 0.3% |
| Czech | 36 | 0.2% |
| Danish | 149 | 0.9% |
| Dutch | 111 | 0.6% |
| Eastern European | 57 | 0.3% |
| Ecuadorian | 110 | 0.6% |
| English | 1,833 | 10.7% |
| European | 978 | 5.7% |
| Filipino | 37 | 0.2% |
| Finnish | 45 | 0.3% |
| French | 319 | 1.9% |
| French Canadian | 27 | 0.2% |
| German | 2,492 | 14.6% |
| Greek | 259 | 1.5% |
| Guatemalan | 83 | 0.5% |
| Hungarian | 40 | 0.2% |
| Indian (Asian) | 554 | 3.2% |
| Indonesian | 17 | 0.1% |
| Iranian | 132 | 0.8% |
| Irish | 2,010 | 11.8% |
| Israeli | 63 | 0.4% |
| Italian | 1,579 | 9.2% |
| Jamaican | 39 | 0.2% |
| Jordanian | 39 | 0.2% |
| Kenyan | 26 | 0.2% |
| Korean | 789 | 4.6% |
| Laotian | 9 | 0.1% |
| Latvian | 52 | 0.3% |
| Lebanese | 94 | 0.5% |
| Lithuanian | 131 | 0.8% |
| Mexican | 2,090 | 12.2% |
| Mexican American Indian | 5 | 0.0% |
| Native Hawaiian | 23 | 0.1% |
| Navajo | 8 | 0.1% |
| New Zealander | 21 | 0.1% |
| Nicaraguan | 6 | 0.0% |
| Northern European | 309 | 1.8% |
| Norwegian | 383 | 2.2% |
| Paiute | 30 | 0.2% |
| Pakistani | 226 | 1.3% |
| Peruvian | 117 | 0.7% |
| Polish | 332 | 1.9% |
| Portuguese | 122 | 0.7% |
| Puerto Rican | 147 | 0.9% |
| Romanian | 36 | 0.2% |
| Russian | 328 | 1.9% |
| Salvadoran | 89 | 0.5% |
| Scandinavian | 58 | 0.3% |
| Scotch-Irish | 183 | 1.1% |
| Scottish | 310 | 1.8% |
| Serbian | 13 | 0.1% |
| Slovak | 62 | 0.4% |
| Slovene | 12 | 0.1% |
| South American | 380 | 2.2% |
| South American Indian | 14 | 0.1% |
| Spaniard | 188 | 1.1% |
| Spanish | 53 | 0.3% |
| Sri Lankan | 39 | 0.2% |
| Subsaharan African | 104 | 0.6% |
| Swedish | 403 | 2.4% |
| Swiss | 20 | 0.1% |
| Syrian | 32 | 0.2% |
| Thai | 367 | 2.1% |
| Turkish | 47 | 0.3% |
| Ukrainian | 16 | 0.1% |
| Venezuelan | 17 | 0.1% |
| Welsh | 113 | 0.7% |
| Yakama | 3 | 0.0% | View All 91 Rows |
Immigrants in El Segundo
The most numerous immigrant groups reported in El Segundo came from Asia (1,001 | 5.9%), Latin America (498 | 2.9%), Europe (408 | 2.4%), South Eastern Asia (345 | 2.0%), and South Central Asia (324 | 1.9%), together accounting for 15.1% of all El Segundo residents.
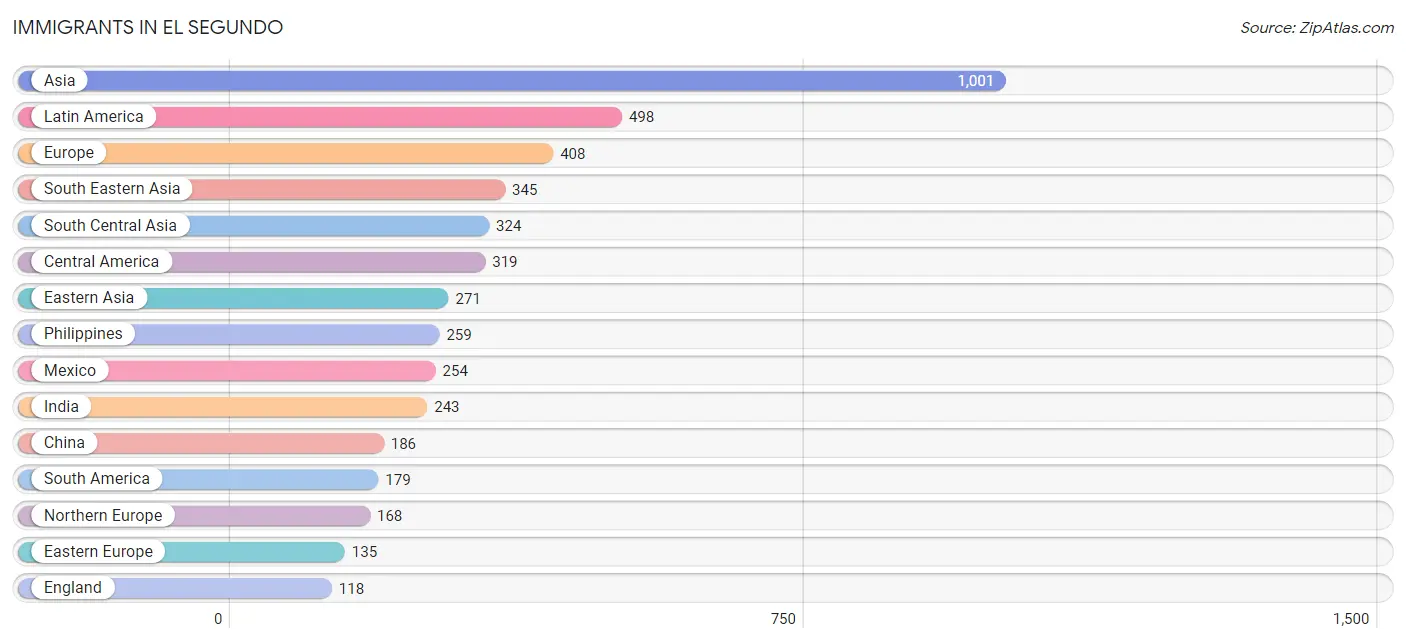
| Immigration Origin | # Population | % Population |
| Africa | 24 | 0.1% |
| Asia | 1,001 | 5.9% |
| Australia | 8 | 0.1% |
| Belize | 27 | 0.2% |
| Brazil | 57 | 0.3% |
| Canada | 93 | 0.5% |
| Central America | 319 | 1.9% |
| China | 186 | 1.1% |
| Colombia | 31 | 0.2% |
| Czechoslovakia | 3 | 0.0% |
| Eastern Africa | 24 | 0.1% |
| Eastern Asia | 271 | 1.6% |
| Eastern Europe | 135 | 0.8% |
| Ecuador | 60 | 0.4% |
| El Salvador | 38 | 0.2% |
| England | 118 | 0.7% |
| Europe | 408 | 2.4% |
| France | 13 | 0.1% |
| Germany | 47 | 0.3% |
| Hong Kong | 39 | 0.2% |
| India | 243 | 1.4% |
| Iran | 60 | 0.4% |
| Iraq | 10 | 0.1% |
| Italy | 37 | 0.2% |
| Japan | 67 | 0.4% |
| Kenya | 17 | 0.1% |
| Korea | 18 | 0.1% |
| Latin America | 498 | 2.9% |
| Lebanon | 25 | 0.2% |
| Mexico | 254 | 1.5% |
| Netherlands | 8 | 0.1% |
| Northern Europe | 168 | 1.0% |
| Oceania | 29 | 0.2% |
| Peru | 14 | 0.1% |
| Philippines | 259 | 1.5% |
| Russia | 85 | 0.5% |
| Scotland | 3 | 0.0% |
| Serbia | 35 | 0.2% |
| Singapore | 36 | 0.2% |
| South America | 179 | 1.1% |
| South Central Asia | 324 | 1.9% |
| South Eastern Asia | 345 | 2.0% |
| Southern Europe | 37 | 0.2% |
| Sri Lanka | 21 | 0.1% |
| Taiwan | 81 | 0.5% |
| Thailand | 33 | 0.2% |
| Turkey | 26 | 0.2% |
| Uganda | 7 | 0.0% |
| Venezuela | 17 | 0.1% |
| Western Asia | 61 | 0.4% |
| Western Europe | 68 | 0.4% | View All 51 Rows |
Sex and Age in El Segundo
Sex and Age in El Segundo
The most populous age groups in El Segundo are 30 to 34 Years (1,070 | 12.3%) for men and 25 to 29 Years (974 | 11.6%) for women.
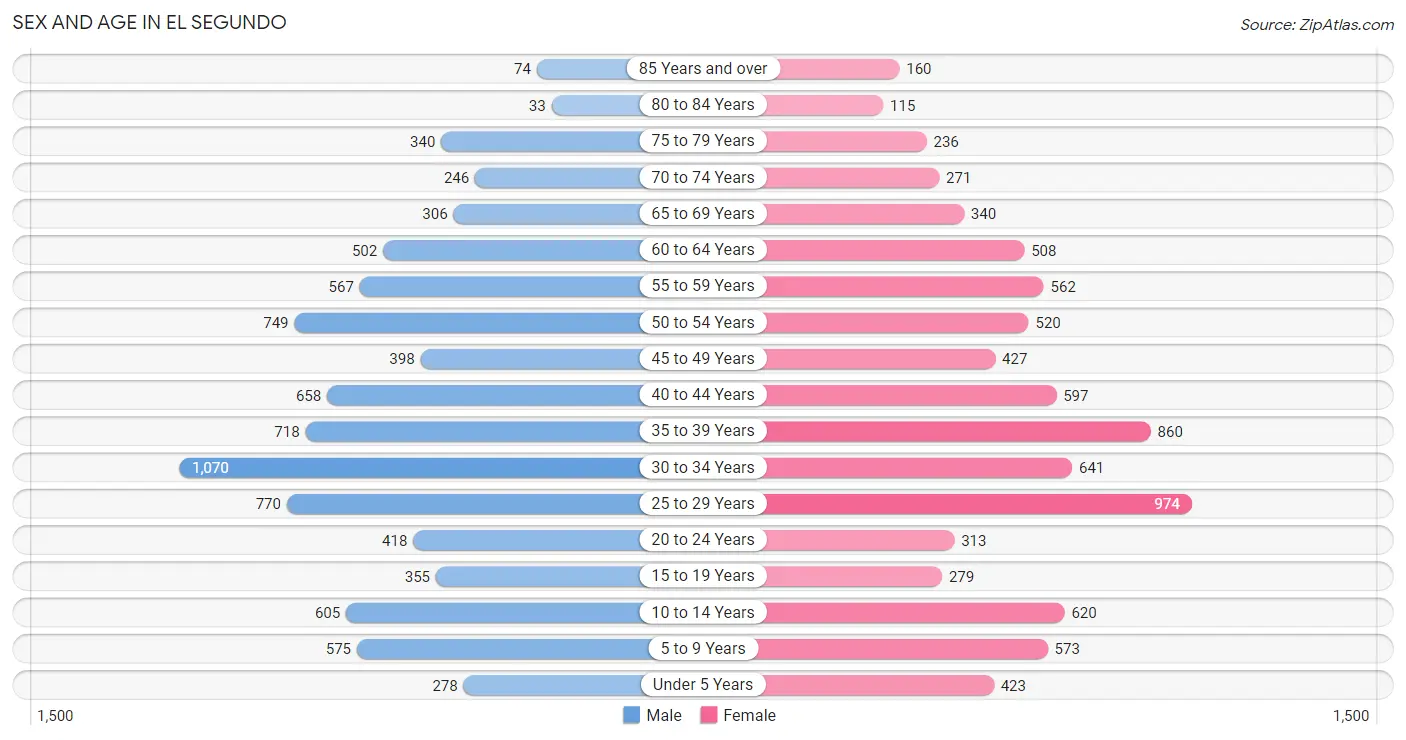
| Age Bracket | Male | Female |
| Under 5 Years | 278 (3.2%) | 423 (5.0%) |
| 5 to 9 Years | 575 (6.6%) | 573 (6.8%) |
| 10 to 14 Years | 605 (7.0%) | 620 (7.4%) |
| 15 to 19 Years | 355 (4.1%) | 279 (3.3%) |
| 20 to 24 Years | 418 (4.8%) | 313 (3.7%) |
| 25 to 29 Years | 770 (8.9%) | 974 (11.6%) |
| 30 to 34 Years | 1,070 (12.3%) | 641 (7.6%) |
| 35 to 39 Years | 718 (8.3%) | 860 (10.2%) |
| 40 to 44 Years | 658 (7.6%) | 597 (7.1%) |
| 45 to 49 Years | 398 (4.6%) | 427 (5.1%) |
| 50 to 54 Years | 749 (8.6%) | 520 (6.2%) |
| 55 to 59 Years | 567 (6.6%) | 562 (6.7%) |
| 60 to 64 Years | 502 (5.8%) | 508 (6.0%) |
| 65 to 69 Years | 306 (3.5%) | 340 (4.0%) |
| 70 to 74 Years | 246 (2.8%) | 271 (3.2%) |
| 75 to 79 Years | 340 (3.9%) | 236 (2.8%) |
| 80 to 84 Years | 33 (0.4%) | 115 (1.4%) |
| 85 Years and over | 74 (0.9%) | 160 (1.9%) |
| Total | 8,662 (100.0%) | 8,419 (100.0%) |
Families and Households in El Segundo
Median Family Size in El Segundo
The median family size in El Segundo is 3.01 persons per family, with married-couple families (3,359 | 80.3%) accounting for the largest median family size of 3.16 persons per family. On the other hand, single female/mother families (535 | 12.8%) represent the smallest median family size with 2.33 persons per family.
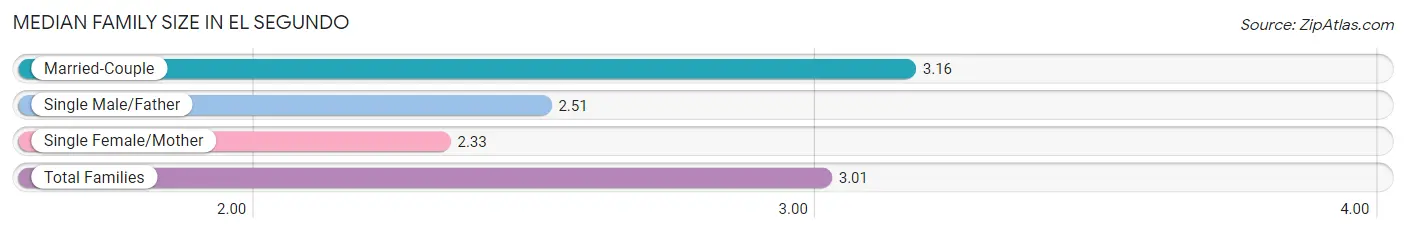
| Family Type | # Families | Family Size |
| Married-Couple | 3,359 (80.3%) | 3.16 |
| Single Male/Father | 291 (7.0%) | 2.51 |
| Single Female/Mother | 535 (12.8%) | 2.33 |
| Total Families | 4,185 (100.0%) | 3.01 |
Median Household Size in El Segundo
The median household size in El Segundo is 2.41 persons per household, with married-couple households (3,359 | 47.5%) accounting for the largest median household size of 3.17 persons per household. non-family households (2,890 | 40.8%) represent the smallest median household size with 1.48 persons per household.
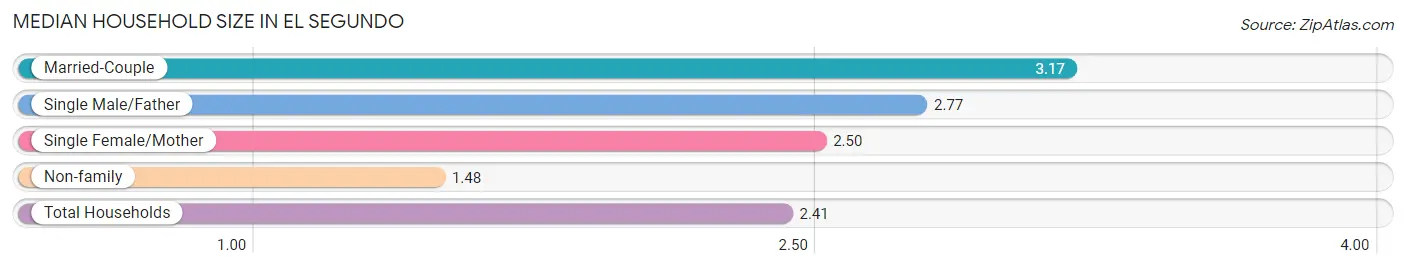
| Household Type | # Households | Household Size |
| Married-Couple | 3,359 (47.5%) | 3.17 |
| Single Male/Father | 291 (4.1%) | 2.77 |
| Single Female/Mother | 535 (7.6%) | 2.50 |
| Non-family | 2,890 (40.8%) | 1.48 |
| Total Households | 7,075 (100.0%) | 2.41 |
Household Size by Marriage Status in El Segundo
Out of a total of 7,075 households in El Segundo, 4,185 (59.2%) are family households, while 2,890 (40.8%) are nonfamily households. The most numerous type of family households are 2-person households, comprising 1,942, and the most common type of nonfamily households are 1-person households, comprising 1,936.
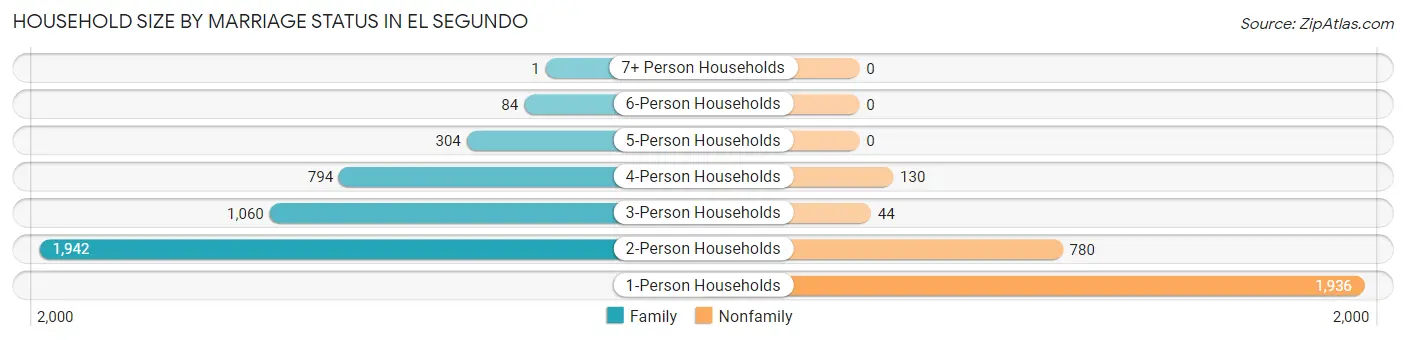
| Household Size | Family Households | Nonfamily Households |
| 1-Person Households | - | 1,936 (27.4%) |
| 2-Person Households | 1,942 (27.5%) | 780 (11.0%) |
| 3-Person Households | 1,060 (15.0%) | 44 (0.6%) |
| 4-Person Households | 794 (11.2%) | 130 (1.8%) |
| 5-Person Households | 304 (4.3%) | 0 (0.0%) |
| 6-Person Households | 84 (1.2%) | 0 (0.0%) |
| 7+ Person Households | 1 (0.0%) | 0 (0.0%) |
| Total | 4,185 (59.2%) | 2,890 (40.8%) |
Female Fertility in El Segundo
Fertility by Age in El Segundo
Average fertility rate in El Segundo is 53.0 births per 1,000 women. Women in the age bracket of 35 to 50 years have the highest fertility rate with 75.0 births per 1,000 women. Women in the age bracket of 35 to 50 years acount for 66.5% of all women with births.
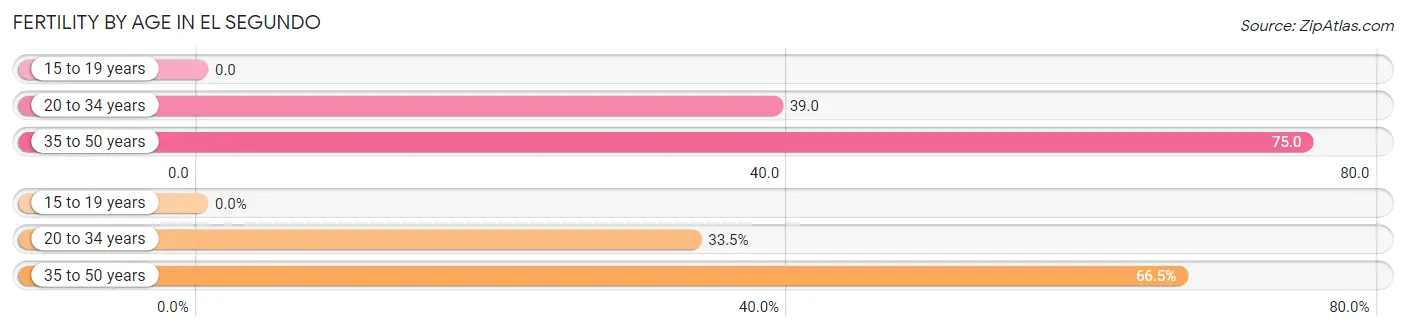
| Age Bracket | Women with Births | Births / 1,000 Women |
| 15 to 19 years | 0 (0.0%) | 0.0 |
| 20 to 34 years | 75 (33.5%) | 39.0 |
| 35 to 50 years | 149 (66.5%) | 75.0 |
| Total | 224 (100.0%) | 53.0 |
Fertility by Age by Marriage Status in El Segundo
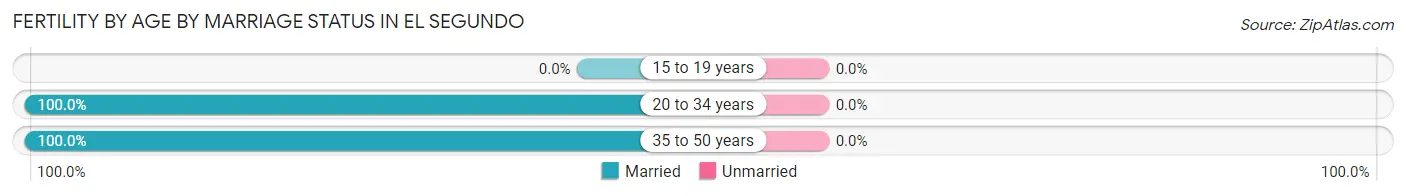
| Age Bracket | Married | Unmarried |
| 15 to 19 years | 0 (0.0%) | 0 (0.0%) |
| 20 to 34 years | 75 (100.0%) | 0 (0.0%) |
| 35 to 50 years | 149 (100.0%) | 0 (0.0%) |
| Total | 224 (100.0%) | 0 (0.0%) |
Fertility by Education in El Segundo
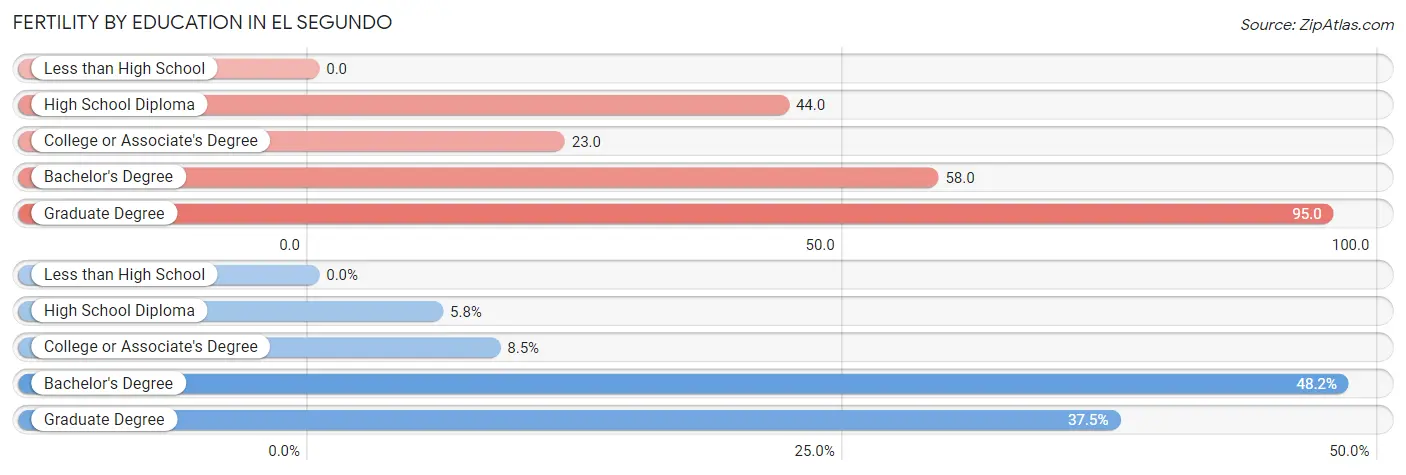
| Educational Attainment | Women with Births | Births / 1,000 Women |
| Less than High School | 0 (0.0%) | 0.0 |
| High School Diploma | 13 (5.8%) | 44.0 |
| College or Associate's Degree | 19 (8.5%) | 23.0 |
| Bachelor's Degree | 108 (48.2%) | 58.0 |
| Graduate Degree | 84 (37.5%) | 95.0 |
| Total | 224 (100.0%) | 53.0 |
Fertility by Education by Marriage Status in El Segundo
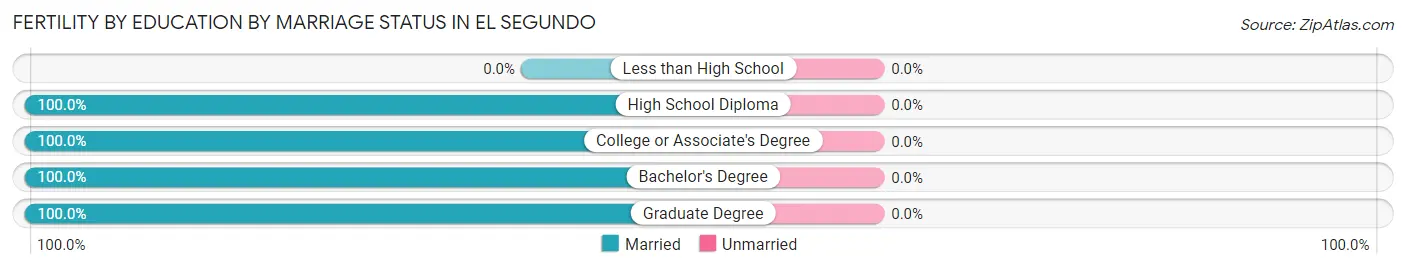
| Educational Attainment | Married | Unmarried |
| Less than High School | 0 (0.0%) | 0 (0.0%) |
| High School Diploma | 13 (100.0%) | 0 (0.0%) |
| College or Associate's Degree | 19 (100.0%) | 0 (0.0%) |
| Bachelor's Degree | 108 (100.0%) | 0 (0.0%) |
| Graduate Degree | 84 (100.0%) | 0 (0.0%) |
| Total | 224 (100.0%) | 0 (0.0%) |
Income in El Segundo
Income Overview in El Segundo
Per Capita Income in El Segundo is $74,872, while median incomes of families and households are $173,714 and $142,596 respectively.
| Characteristic | Number | Measure |
| Per Capita Income | 17,081 | $74,872 |
| Median Family Income | 4,185 | $173,714 |
| Mean Family Income | 4,185 | $206,176 |
| Median Household Income | 7,075 | $142,596 |
| Mean Household Income | 7,075 | $177,618 |
| Income Deficit | 4,185 | $0 |
| Wage / Income Gap (%) | 17,081 | 24.24% |
| Wage / Income Gap ($) | 17,081 | 75.76¢ per $1 |
| Gini / Inequality Index | 17,081 | 0.43 |
Earnings by Sex in El Segundo
Average Earnings in El Segundo are $81,243, $91,962 for men and $69,669 for women, a difference of 24.2%.
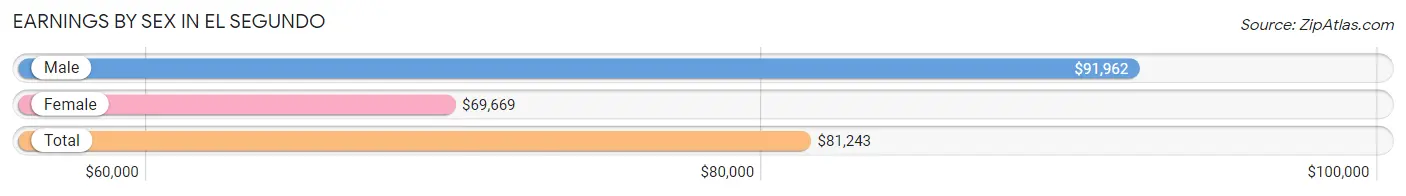
| Sex | Number | Average Earnings |
| Male | 5,706 (53.7%) | $91,962 |
| Female | 4,916 (46.3%) | $69,669 |
| Total | 10,622 (100.0%) | $81,243 |
Earnings by Sex by Income Bracket in El Segundo
The most common earnings brackets in El Segundo are $100,000+ for men (2,741 | 48.0%) and $100,000+ for women (1,350 | 27.5%).
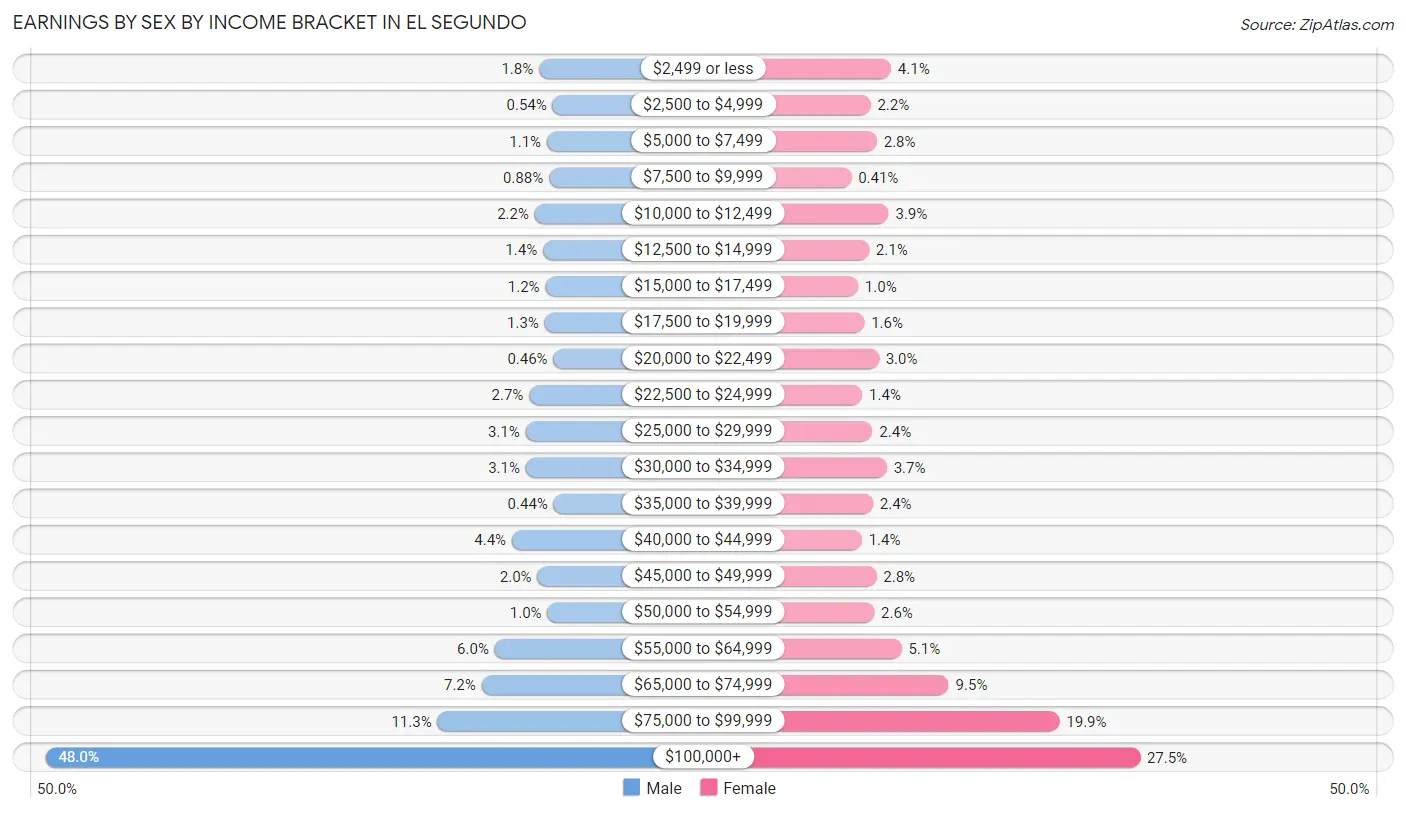
| Income | Male | Female |
| $2,499 or less | 103 (1.8%) | 203 (4.1%) |
| $2,500 to $4,999 | 31 (0.5%) | 109 (2.2%) |
| $5,000 to $7,499 | 61 (1.1%) | 138 (2.8%) |
| $7,500 to $9,999 | 50 (0.9%) | 20 (0.4%) |
| $10,000 to $12,499 | 126 (2.2%) | 192 (3.9%) |
| $12,500 to $14,999 | 82 (1.4%) | 102 (2.1%) |
| $15,000 to $17,499 | 69 (1.2%) | 51 (1.0%) |
| $17,500 to $19,999 | 73 (1.3%) | 80 (1.6%) |
| $20,000 to $22,499 | 26 (0.5%) | 147 (3.0%) |
| $22,500 to $24,999 | 156 (2.7%) | 71 (1.4%) |
| $25,000 to $29,999 | 175 (3.1%) | 118 (2.4%) |
| $30,000 to $34,999 | 174 (3.0%) | 184 (3.7%) |
| $35,000 to $39,999 | 25 (0.4%) | 120 (2.4%) |
| $40,000 to $44,999 | 248 (4.3%) | 69 (1.4%) |
| $45,000 to $49,999 | 112 (2.0%) | 136 (2.8%) |
| $50,000 to $54,999 | 58 (1.0%) | 126 (2.6%) |
| $55,000 to $64,999 | 340 (6.0%) | 252 (5.1%) |
| $65,000 to $74,999 | 410 (7.2%) | 469 (9.5%) |
| $75,000 to $99,999 | 646 (11.3%) | 979 (19.9%) |
| $100,000+ | 2,741 (48.0%) | 1,350 (27.5%) |
| Total | 5,706 (100.0%) | 4,916 (100.0%) |
Earnings by Sex by Educational Attainment in El Segundo
Average earnings in El Segundo are $104,048 for men and $75,697 for women, a difference of 27.3%. Men with an educational attainment of graduate degree enjoy the highest average annual earnings of $143,179, while those with college or associate's degree education earn the least with $82,500. Women with an educational attainment of graduate degree earn the most with the average annual earnings of $85,972, while those with less than high school education have the smallest earnings of $18,229.
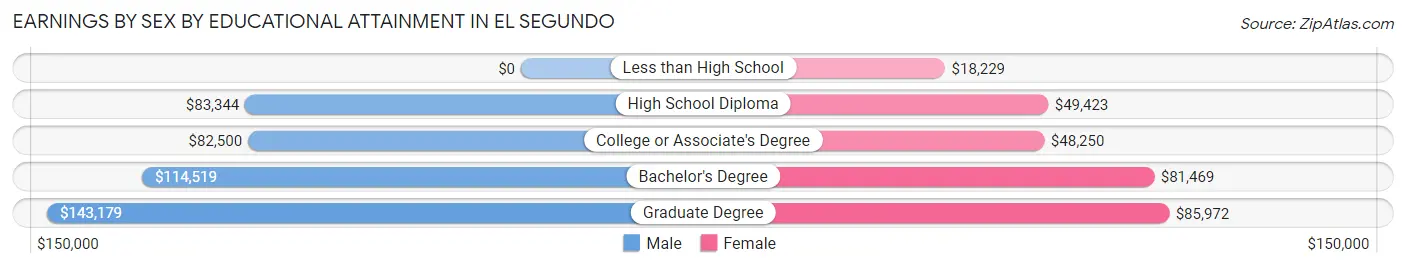
| Educational Attainment | Male Income | Female Income |
| Less than High School | - | - |
| High School Diploma | $83,344 | $49,423 |
| College or Associate's Degree | $82,500 | $48,250 |
| Bachelor's Degree | $114,519 | $81,469 |
| Graduate Degree | $143,179 | $85,972 |
| Total | $104,048 | $75,697 |
Family Income in El Segundo
Family Income Brackets in El Segundo
According to the El Segundo family income data, there are 1,548 families falling into the $200,000+ income range, which is the most common income bracket and makes up 37.0% of all families. Conversely, the $10,000 to $14,999 income bracket is the least frequent group with only 8 families (0.2%) belonging to this category.
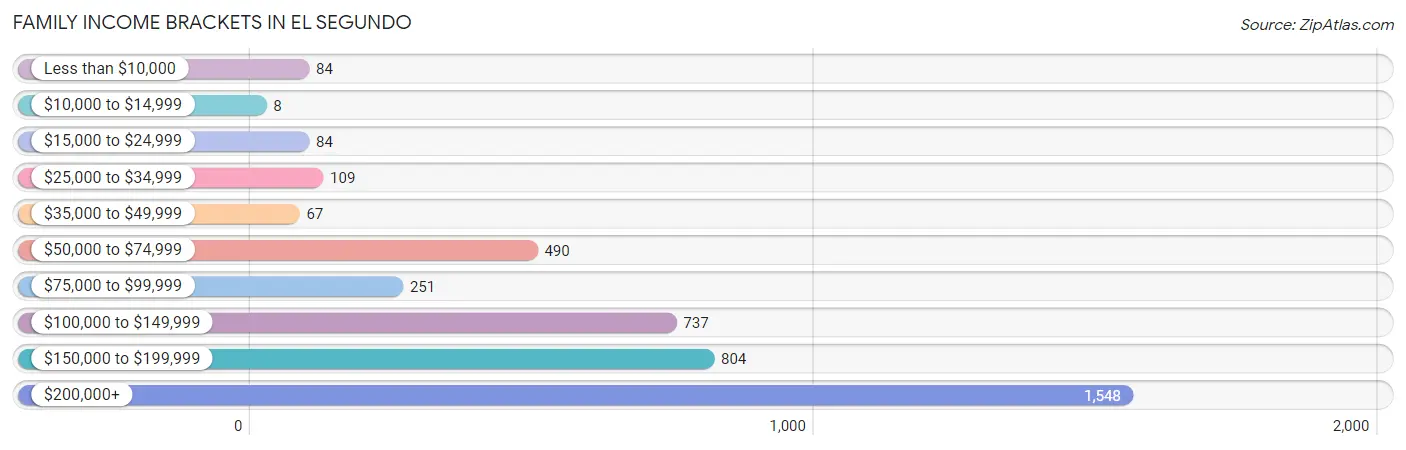
| Income Bracket | # Families | % Families |
| Less than $10,000 | 84 | 2.0% |
| $10,000 to $14,999 | 8 | 0.2% |
| $15,000 to $24,999 | 84 | 2.0% |
| $25,000 to $34,999 | 109 | 2.6% |
| $35,000 to $49,999 | 67 | 1.6% |
| $50,000 to $74,999 | 490 | 11.7% |
| $75,000 to $99,999 | 251 | 6.0% |
| $100,000 to $149,999 | 737 | 17.6% |
| $150,000 to $199,999 | 804 | 19.2% |
| $200,000+ | 1,548 | 37.0% |
Family Income by Famaliy Size in El Segundo
5-person families (304 | 7.3%) account for the highest median family income in El Segundo with $236,118 per family, while 2-person families (2,080 | 49.7%) have the highest median income of $59,822 per family member.
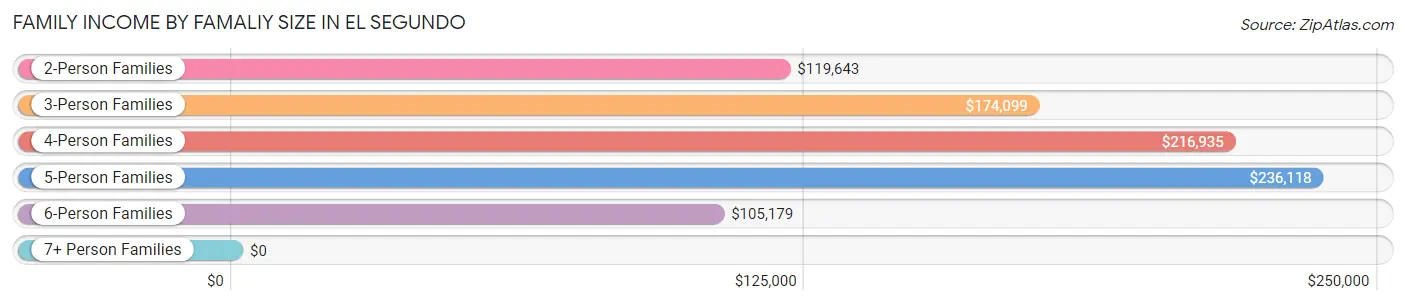
| Income Bracket | # Families | Median Income |
| 2-Person Families | 2,080 (49.7%) | $119,643 |
| 3-Person Families | 945 (22.6%) | $174,099 |
| 4-Person Families | 771 (18.4%) | $216,935 |
| 5-Person Families | 304 (7.3%) | $236,118 |
| 6-Person Families | 84 (2.0%) | $105,179 |
| 7+ Person Families | 1 (0.0%) | $0 |
| Total | 4,185 (100.0%) | $173,714 |
Family Income by Number of Earners in El Segundo
The median family income in El Segundo is $173,714, with families comprising 2 earners (2,214) having the highest median family income of $200,521, while families with no earners (552) have the lowest median family income of $54,073, accounting for 52.9% and 13.2% of families, respectively.
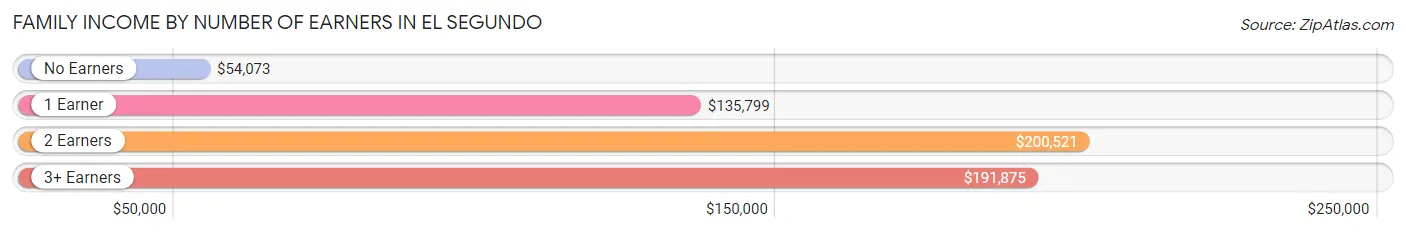
| Number of Earners | # Families | Median Income |
| No Earners | 552 (13.2%) | $54,073 |
| 1 Earner | 1,043 (24.9%) | $135,799 |
| 2 Earners | 2,214 (52.9%) | $200,521 |
| 3+ Earners | 376 (9.0%) | $191,875 |
| Total | 4,185 (100.0%) | $173,714 |
Household Income in El Segundo
Household Income Brackets in El Segundo
With 2,108 households falling in the category, the $200,000+ income range is the most frequent in El Segundo, accounting for 29.8% of all households. In contrast, only 71 households (1.0%) fall into the $10,000 to $14,999 income bracket, making it the least populous group.
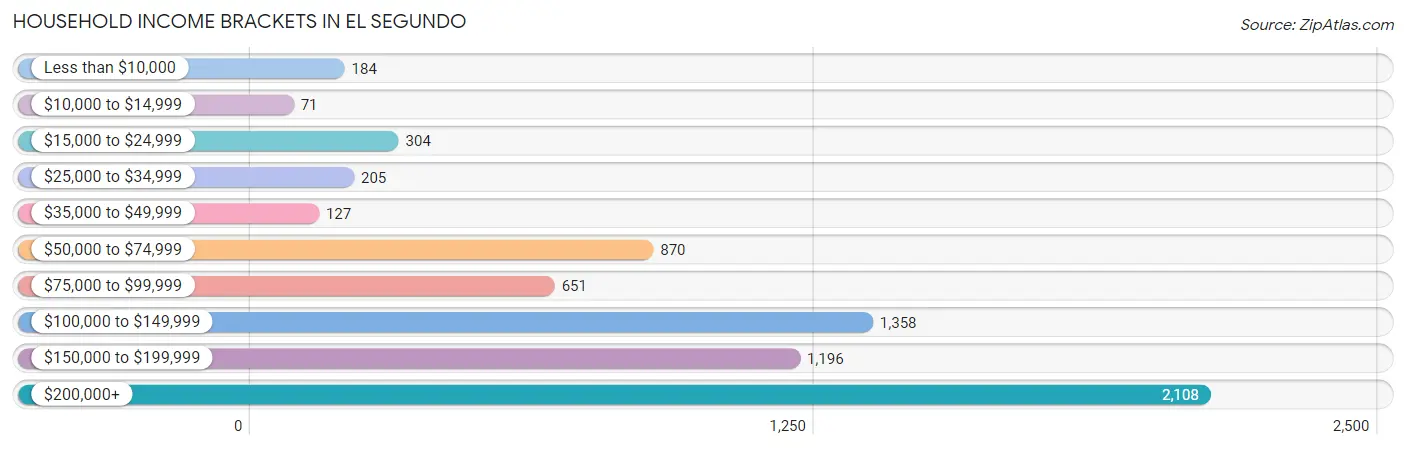
| Income Bracket | # Households | % Households |
| Less than $10,000 | 184 | 2.6% |
| $10,000 to $14,999 | 71 | 1.0% |
| $15,000 to $24,999 | 304 | 4.3% |
| $25,000 to $34,999 | 205 | 2.9% |
| $35,000 to $49,999 | 127 | 1.8% |
| $50,000 to $74,999 | 870 | 12.3% |
| $75,000 to $99,999 | 651 | 9.2% |
| $100,000 to $149,999 | 1,358 | 19.2% |
| $150,000 to $199,999 | 1,196 | 16.9% |
| $200,000+ | 2,108 | 29.8% |
Household Income by Householder Age in El Segundo
The median household income in El Segundo is $142,596, with the highest median household income of $161,818 found in the 25 to 44 years age bracket for the primary householder. A total of 3,252 households (46.0%) fall into this category. Meanwhile, the 15 to 24 years age bracket for the primary householder has the lowest median household income of $0, with 36 households (0.5%) in this group.
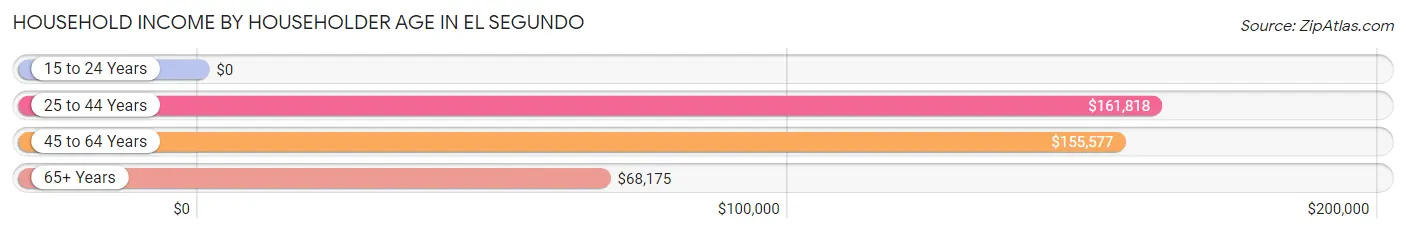
| Income Bracket | # Households | Median Income |
| 15 to 24 Years | 36 (0.5%) | $0 |
| 25 to 44 Years | 3,252 (46.0%) | $161,818 |
| 45 to 64 Years | 2,478 (35.0%) | $155,577 |
| 65+ Years | 1,309 (18.5%) | $68,175 |
| Total | 7,075 (100.0%) | $142,596 |
Poverty in El Segundo
Income Below Poverty by Sex and Age in El Segundo
With 4.4% poverty level for males and 4.9% for females among the residents of El Segundo, 15 year old males and 16 and 17 year old females are the most vulnerable to poverty, with 17 males (36.2%) and 29 females (25.4%) in their respective age groups living below the poverty level.
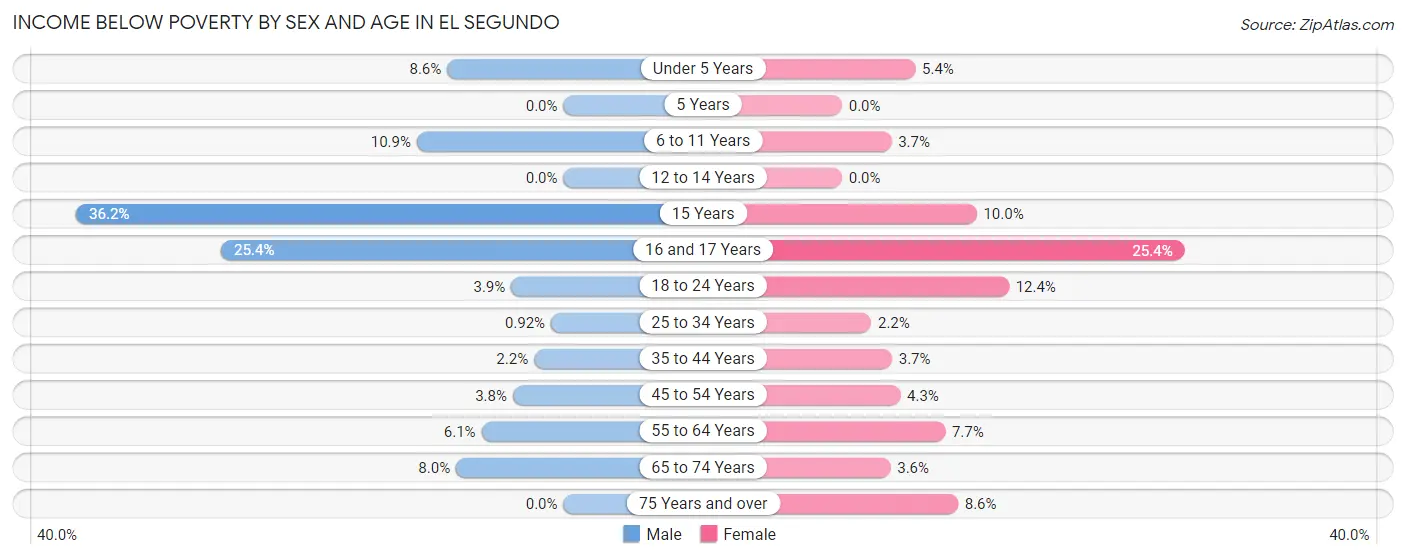
| Age Bracket | Male | Female |
| Under 5 Years | 24 (8.6%) | 23 (5.4%) |
| 5 Years | 0 (0.0%) | 0 (0.0%) |
| 6 to 11 Years | 74 (10.9%) | 26 (3.7%) |
| 12 to 14 Years | 0 (0.0%) | 0 (0.0%) |
| 15 Years | 17 (36.2%) | 13 (10.0%) |
| 16 and 17 Years | 47 (25.4%) | 29 (25.4%) |
| 18 to 24 Years | 21 (3.9%) | 42 (12.4%) |
| 25 to 34 Years | 17 (0.9%) | 35 (2.2%) |
| 35 to 44 Years | 30 (2.2%) | 54 (3.7%) |
| 45 to 54 Years | 43 (3.7%) | 41 (4.3%) |
| 55 to 64 Years | 65 (6.1%) | 82 (7.7%) |
| 65 to 74 Years | 44 (8.0%) | 22 (3.6%) |
| 75 Years and over | 0 (0.0%) | 44 (8.6%) |
| Total | 382 (4.4%) | 411 (4.9%) |
Income Above Poverty by Sex and Age in El Segundo
According to the poverty statistics in El Segundo, males aged 5 years and females aged 5 years are the age groups that are most secure financially, with 100.0% of males and 100.0% of females in these age groups living above the poverty line.
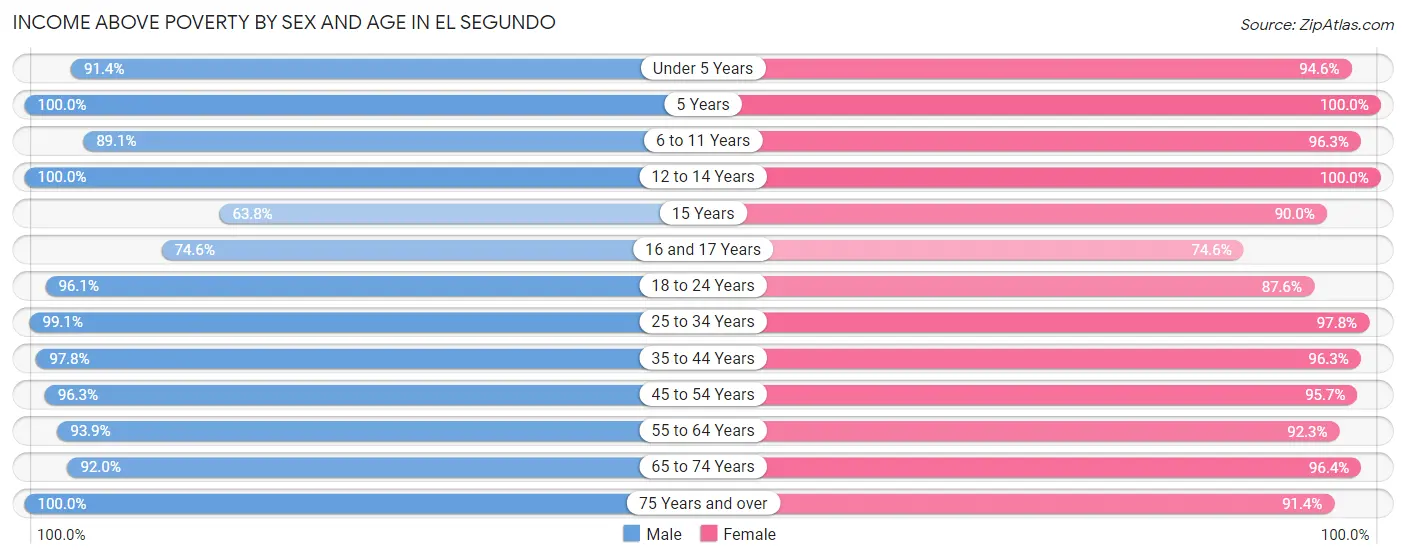
| Age Bracket | Male | Female |
| Under 5 Years | 254 (91.4%) | 400 (94.6%) |
| 5 Years | 68 (100.0%) | 138 (100.0%) |
| 6 to 11 Years | 606 (89.1%) | 682 (96.3%) |
| 12 to 14 Years | 391 (100.0%) | 347 (100.0%) |
| 15 Years | 30 (63.8%) | 117 (90.0%) |
| 16 and 17 Years | 138 (74.6%) | 85 (74.6%) |
| 18 to 24 Years | 520 (96.1%) | 297 (87.6%) |
| 25 to 34 Years | 1,823 (99.1%) | 1,580 (97.8%) |
| 35 to 44 Years | 1,346 (97.8%) | 1,403 (96.3%) |
| 45 to 54 Years | 1,104 (96.3%) | 906 (95.7%) |
| 55 to 64 Years | 1,004 (93.9%) | 988 (92.3%) |
| 65 to 74 Years | 508 (92.0%) | 589 (96.4%) |
| 75 Years and over | 447 (100.0%) | 467 (91.4%) |
| Total | 8,239 (95.6%) | 7,999 (95.1%) |
Income Below Poverty Among Married-Couple Families in El Segundo
The poverty statistics for married-couple families in El Segundo show that 2.5% or 84 of the total 3,359 families live below the poverty line. Families with 3 or 4 children have the highest poverty rate of 11.1%, comprising of 22 families. On the other hand, families with no children have the lowest poverty rate of 1.4%, which includes 25 families.
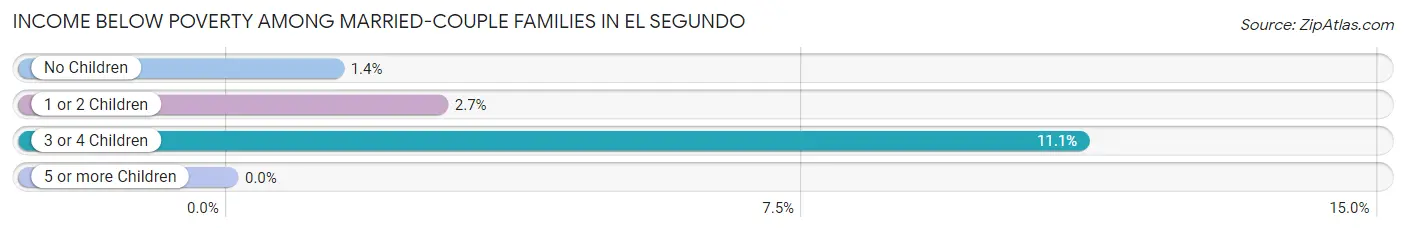
| Children | Above Poverty | Below Poverty |
| No Children | 1,786 (98.6%) | 25 (1.4%) |
| 1 or 2 Children | 1,313 (97.3%) | 37 (2.7%) |
| 3 or 4 Children | 176 (88.9%) | 22 (11.1%) |
| 5 or more Children | 0 (0.0%) | 0 (0.0%) |
| Total | 3,275 (97.5%) | 84 (2.5%) |
Income Below Poverty Among Single-Parent Households in El Segundo
According to the poverty data in El Segundo, 10.0% or 29 single-father households and 5.1% or 27 single-mother households are living below the poverty line. Among single-father households, those with 1 or 2 children have the highest poverty rate, with 29 households (15.7%) experiencing poverty. Likewise, among single-mother households, those with 1 or 2 children have the highest poverty rate, with 27 households (10.9%) falling below the poverty line.
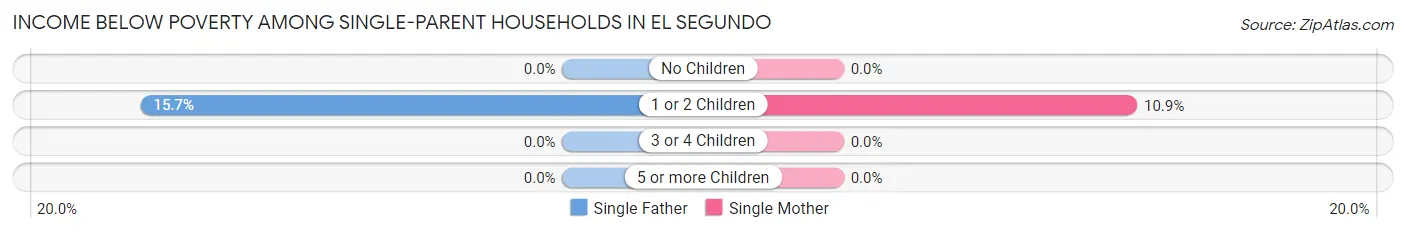
| Children | Single Father | Single Mother |
| No Children | 0 (0.0%) | 0 (0.0%) |
| 1 or 2 Children | 29 (15.7%) | 27 (10.9%) |
| 3 or 4 Children | 0 (0.0%) | 0 (0.0%) |
| 5 or more Children | 0 (0.0%) | 0 (0.0%) |
| Total | 29 (10.0%) | 27 (5.1%) |
Income Below Poverty Among Married-Couple vs Single-Parent Households in El Segundo
The poverty data for El Segundo shows that 84 of the married-couple family households (2.5%) and 56 of the single-parent households (6.8%) are living below the poverty level. Within the married-couple family households, those with 3 or 4 children have the highest poverty rate, with 22 households (11.1%) falling below the poverty line. Among the single-parent households, those with 1 or 2 children have the highest poverty rate, with 56 household (13.0%) living below poverty.
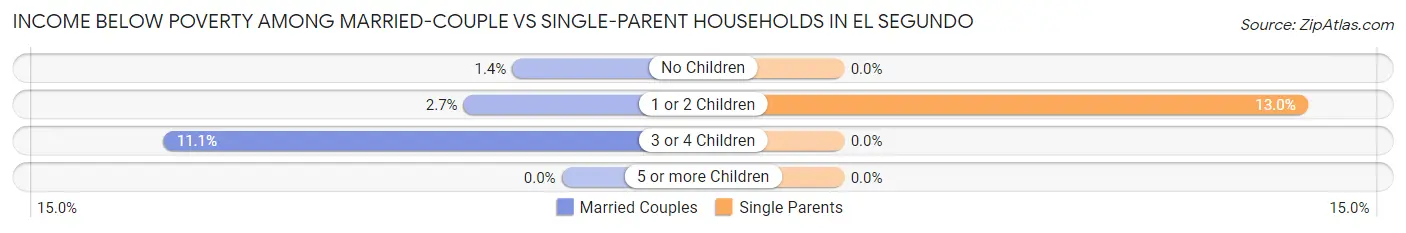
| Children | Married-Couple Families | Single-Parent Households |
| No Children | 25 (1.4%) | 0 (0.0%) |
| 1 or 2 Children | 37 (2.7%) | 56 (13.0%) |
| 3 or 4 Children | 22 (11.1%) | 0 (0.0%) |
| 5 or more Children | 0 (0.0%) | 0 (0.0%) |
| Total | 84 (2.5%) | 56 (6.8%) |
Employment Characteristics in El Segundo
Employment by Class of Employer in El Segundo
Among the 9,810 employed individuals in El Segundo, private company employees (6,779 | 69.1%), not-for-profit organizations (784 | 8.0%), and self-employed (not incorporated) (751 | 7.7%) make up the most common classes of employment.
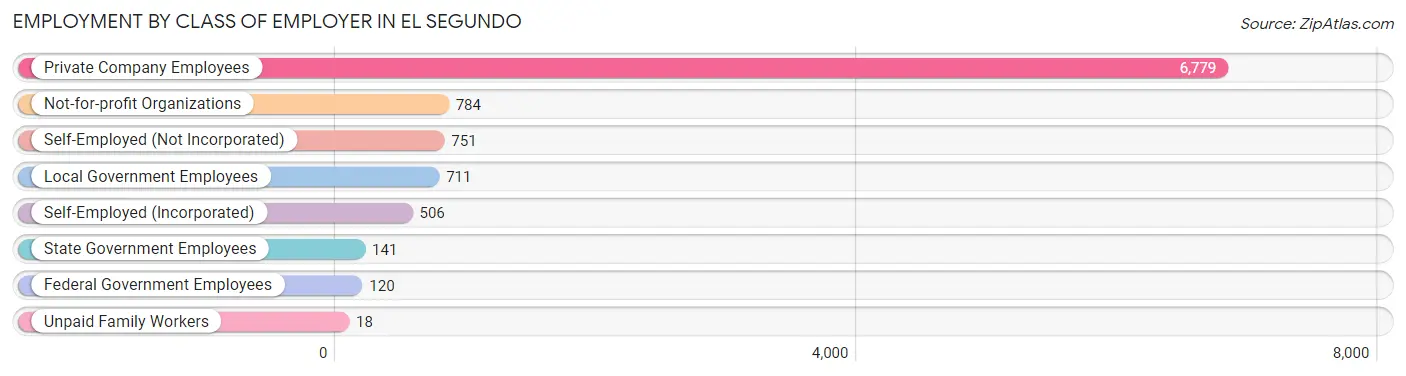
| Employer Class | # Employees | % Employees |
| Private Company Employees | 6,779 | 69.1% |
| Self-Employed (Incorporated) | 506 | 5.2% |
| Self-Employed (Not Incorporated) | 751 | 7.7% |
| Not-for-profit Organizations | 784 | 8.0% |
| Local Government Employees | 711 | 7.2% |
| State Government Employees | 141 | 1.4% |
| Federal Government Employees | 120 | 1.2% |
| Unpaid Family Workers | 18 | 0.2% |
| Total | 9,810 | 100.0% |
Employment Status by Age in El Segundo
According to the labor force statistics for El Segundo, out of the total population over 16 years of age (13,830), 76.2% or 10,538 individuals are in the labor force, with 5.4% or 569 of them unemployed. The age group with the highest labor force participation rate is 30 to 34 years, with 97.7% or 1,672 individuals in the labor force. Within the labor force, the 16 to 19 years age range has the highest percentage of unemployed individuals, with 32.0% or 55 of them being unemployed.
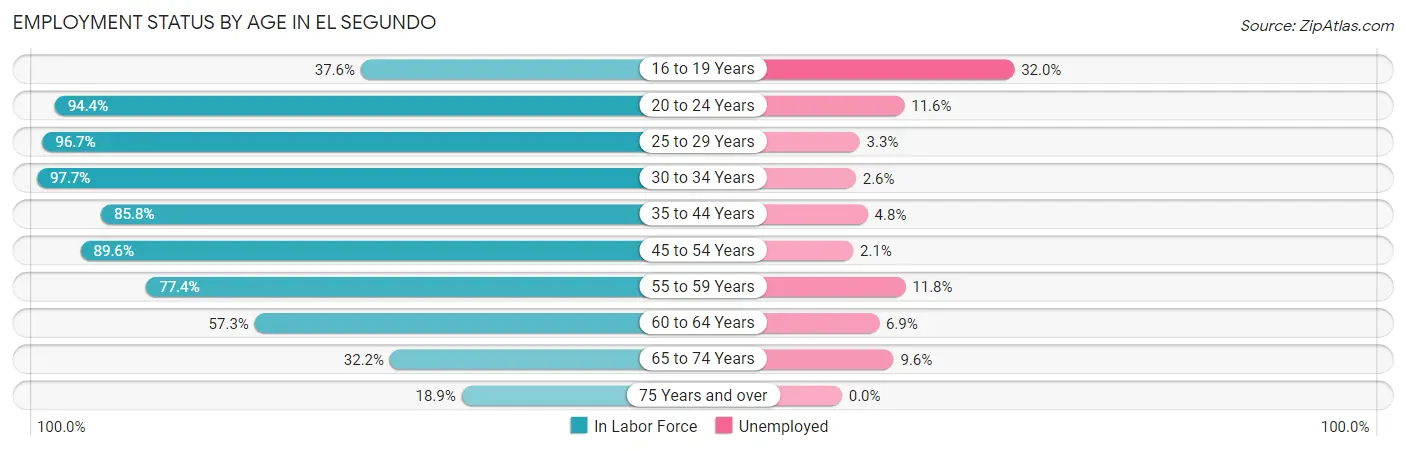
| Age Bracket | In Labor Force | Unemployed |
| 16 to 19 Years | 172 (37.6%) | 55 (32.0%) |
| 20 to 24 Years | 690 (94.4%) | 80 (11.6%) |
| 25 to 29 Years | 1,686 (96.7%) | 56 (3.3%) |
| 30 to 34 Years | 1,672 (97.7%) | 43 (2.6%) |
| 35 to 44 Years | 2,431 (85.8%) | 117 (4.8%) |
| 45 to 54 Years | 1,876 (89.6%) | 39 (2.1%) |
| 55 to 59 Years | 874 (77.4%) | 103 (11.8%) |
| 60 to 64 Years | 579 (57.3%) | 40 (6.9%) |
| 65 to 74 Years | 374 (32.2%) | 36 (9.6%) |
| 75 Years and over | 181 (18.9%) | 0 (0.0%) |
| Total | 10,538 (76.2%) | 569 (5.4%) |
Employment Status by Educational Attainment in El Segundo
According to labor force statistics for El Segundo, 86.7% of individuals (9,122) out of the total population between 25 and 64 years of age (10,521) are in the labor force, with 4.4% or 401 of them being unemployed. The group with the highest labor force participation rate are those with the educational attainment of bachelor's degree or higher, with 89.1% or 5,957 individuals in the labor force. Within the labor force, individuals with less than high school education have the highest percentage of unemployment, with 27.3% or 12 of them being unemployed.
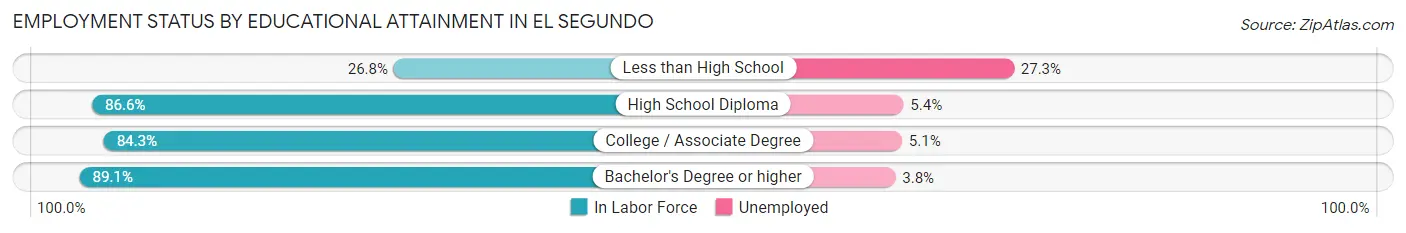
| Educational Attainment | In Labor Force | Unemployed |
| Less than High School | 44 (26.8%) | 45 (27.3%) |
| High School Diploma | 856 (86.6%) | 53 (5.4%) |
| College / Associate Degree | 2,262 (84.3%) | 137 (5.1%) |
| Bachelor's Degree or higher | 5,957 (89.1%) | 254 (3.8%) |
| Total | 9,122 (86.7%) | 463 (4.4%) |
Employment Occupations by Sex in El Segundo
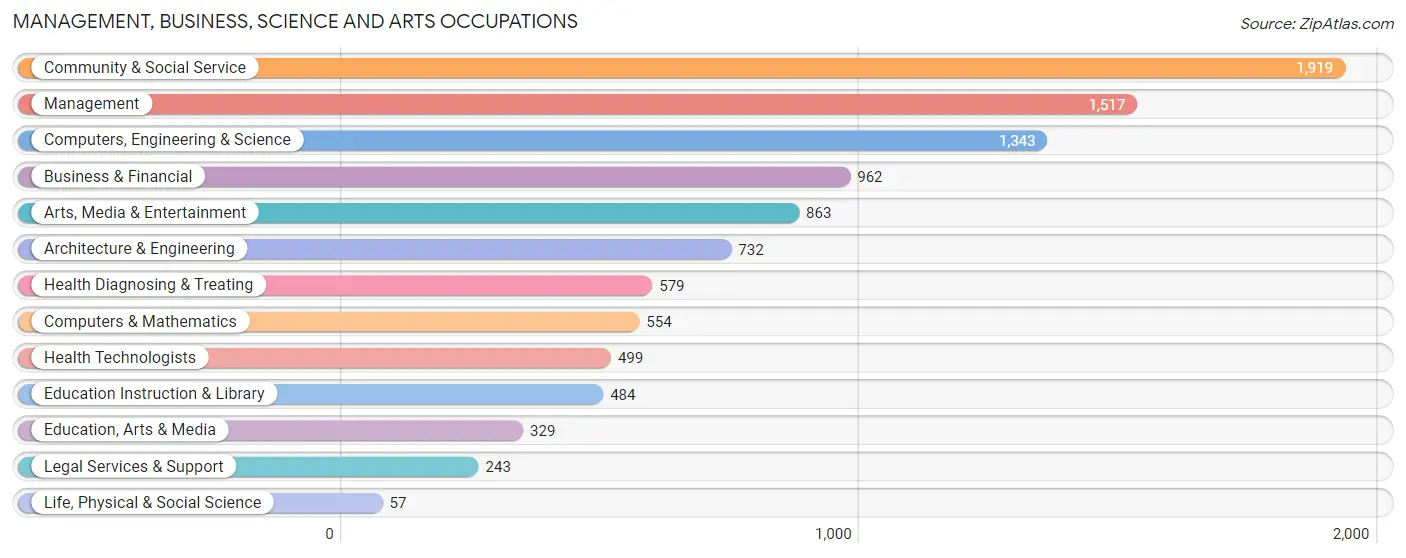
Management, Business, Science and Arts Occupations
The most common Management, Business, Science and Arts occupations in El Segundo are Community & Social Service (1,919 | 19.3%), Management (1,517 | 15.2%), Computers, Engineering & Science (1,343 | 13.5%), Business & Financial (962 | 9.7%), and Arts, Media & Entertainment (863 | 8.7%).
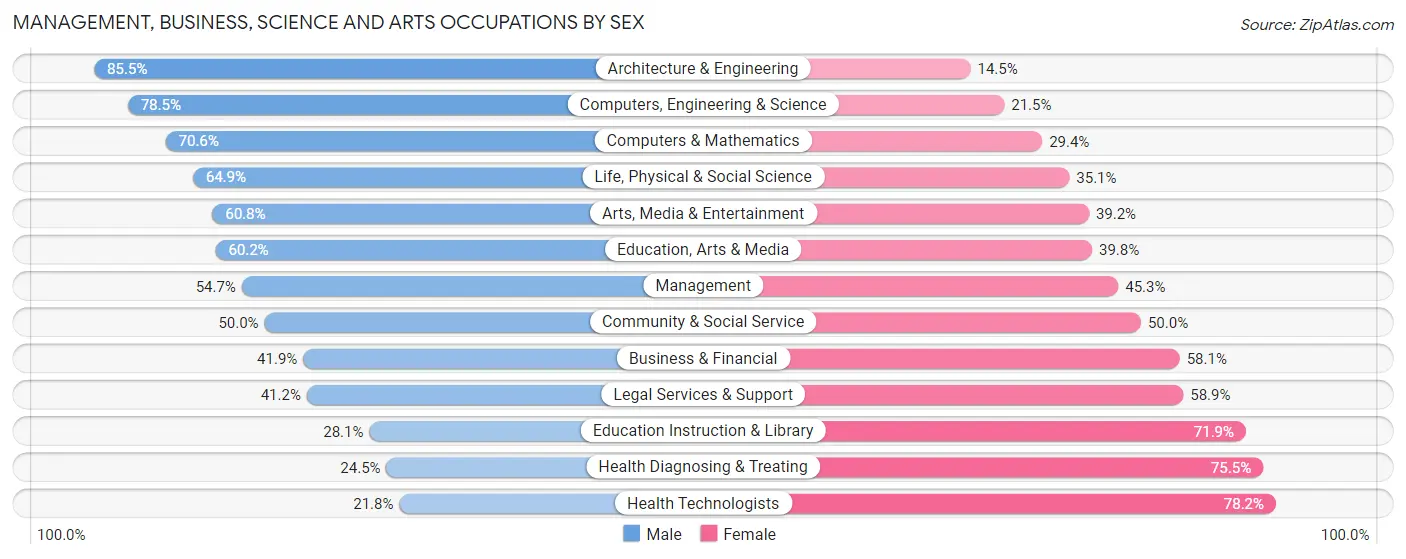
Management, Business, Science and Arts Occupations by Sex
Within the Management, Business, Science and Arts occupations in El Segundo, the most male-oriented occupations are Architecture & Engineering (85.5%), Computers, Engineering & Science (78.5%), and Computers & Mathematics (70.6%), while the most female-oriented occupations are Health Technologists (78.2%), Health Diagnosing & Treating (75.5%), and Education Instruction & Library (71.9%).
| Occupation | Male | Female |
| Management | 830 (54.7%) | 687 (45.3%) |
| Business & Financial | 403 (41.9%) | 559 (58.1%) |
| Computers, Engineering & Science | 1,054 (78.5%) | 289 (21.5%) |
| Computers & Mathematics | 391 (70.6%) | 163 (29.4%) |
| Architecture & Engineering | 626 (85.5%) | 106 (14.5%) |
| Life, Physical & Social Science | 37 (64.9%) | 20 (35.1%) |
| Community & Social Service | 959 (50.0%) | 960 (50.0%) |
| Education, Arts & Media | 198 (60.2%) | 131 (39.8%) |
| Legal Services & Support | 100 (41.1%) | 143 (58.9%) |
| Education Instruction & Library | 136 (28.1%) | 348 (71.9%) |
| Arts, Media & Entertainment | 525 (60.8%) | 338 (39.2%) |
| Health Diagnosing & Treating | 142 (24.5%) | 437 (75.5%) |
| Health Technologists | 109 (21.8%) | 390 (78.2%) |
| Total (Category) | 3,388 (53.6%) | 2,932 (46.4%) |
| Total (Overall) | 5,426 (54.5%) | 4,529 (45.5%) |
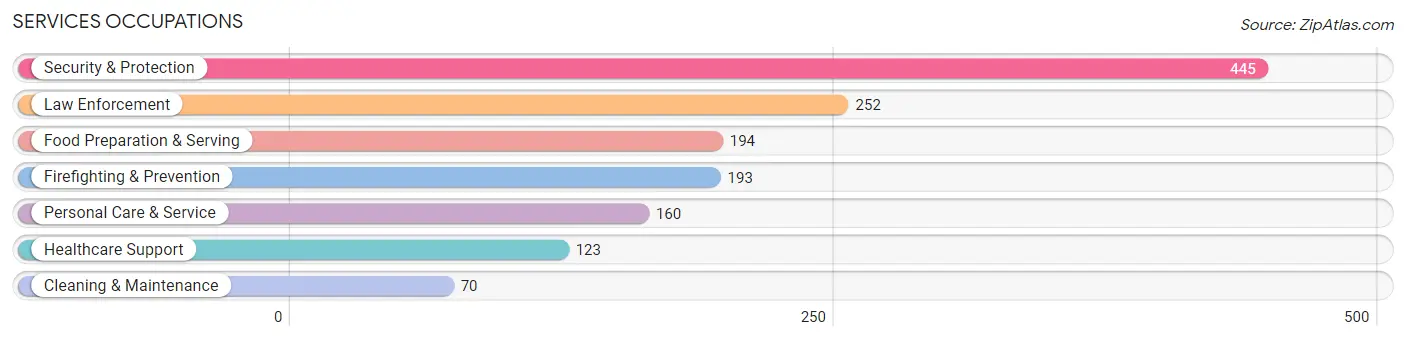
Services Occupations
The most common Services occupations in El Segundo are Security & Protection (445 | 4.5%), Law Enforcement (252 | 2.5%), Food Preparation & Serving (194 | 1.9%), Firefighting & Prevention (193 | 1.9%), and Personal Care & Service (160 | 1.6%).
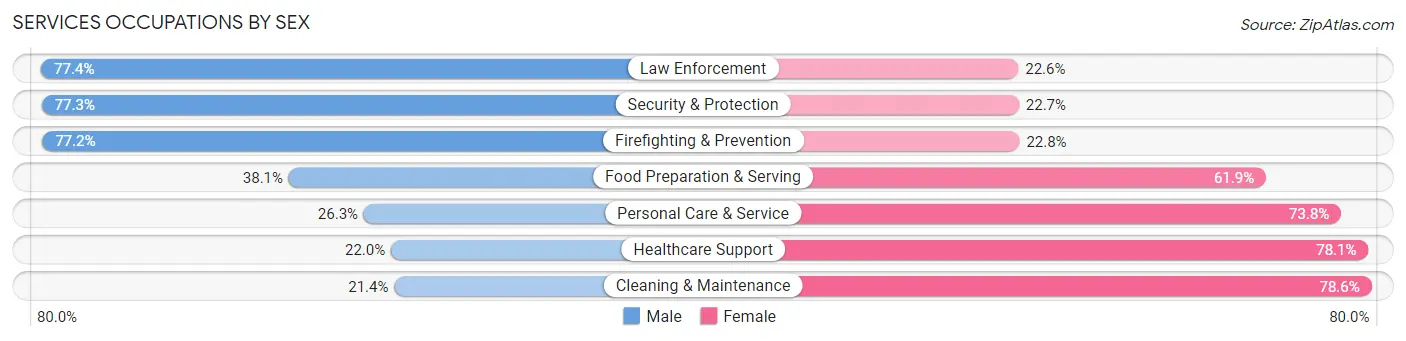
Services Occupations by Sex
Within the Services occupations in El Segundo, the most male-oriented occupations are Law Enforcement (77.4%), Security & Protection (77.3%), and Firefighting & Prevention (77.2%), while the most female-oriented occupations are Cleaning & Maintenance (78.6%), Healthcare Support (78.0%), and Personal Care & Service (73.8%).
| Occupation | Male | Female |
| Healthcare Support | 27 (22.0%) | 96 (78.0%) |
| Security & Protection | 344 (77.3%) | 101 (22.7%) |
| Firefighting & Prevention | 149 (77.2%) | 44 (22.8%) |
| Law Enforcement | 195 (77.4%) | 57 (22.6%) |
| Food Preparation & Serving | 74 (38.1%) | 120 (61.9%) |
| Cleaning & Maintenance | 15 (21.4%) | 55 (78.6%) |
| Personal Care & Service | 42 (26.3%) | 118 (73.8%) |
| Total (Category) | 502 (50.6%) | 490 (49.4%) |
| Total (Overall) | 5,426 (54.5%) | 4,529 (45.5%) |
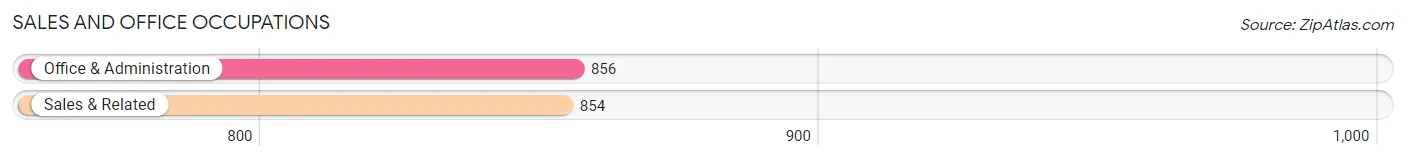
Sales and Office Occupations
The most common Sales and Office occupations in El Segundo are Office & Administration (856 | 8.6%), and Sales & Related (854 | 8.6%).
Sales and Office Occupations by Sex
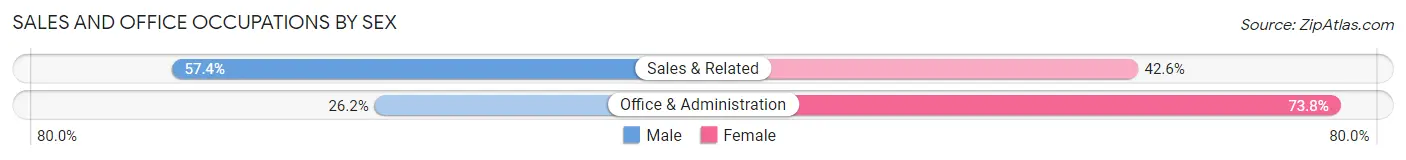
| Occupation | Male | Female |
| Sales & Related | 490 (57.4%) | 364 (42.6%) |
| Office & Administration | 224 (26.2%) | 632 (73.8%) |
| Total (Category) | 714 (41.7%) | 996 (58.3%) |
| Total (Overall) | 5,426 (54.5%) | 4,529 (45.5%) |
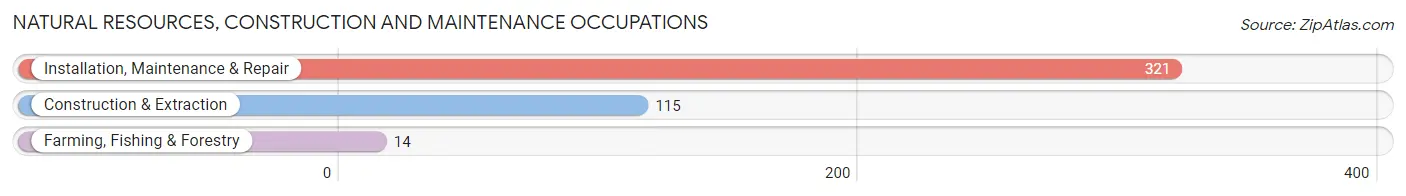
Natural Resources, Construction and Maintenance Occupations
The most common Natural Resources, Construction and Maintenance occupations in El Segundo are Installation, Maintenance & Repair (321 | 3.2%), Construction & Extraction (115 | 1.2%), and Farming, Fishing & Forestry (14 | 0.1%).
Natural Resources, Construction and Maintenance Occupations by Sex
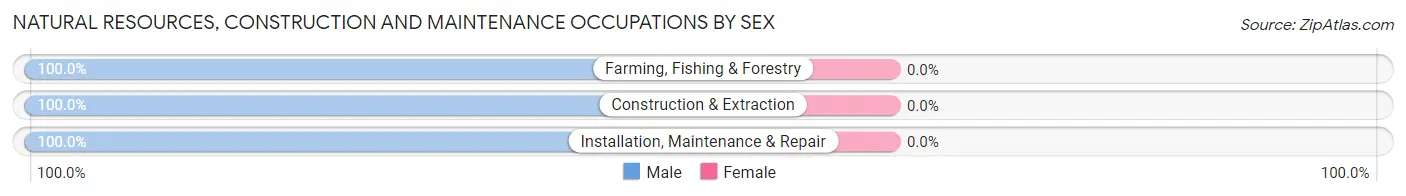
| Occupation | Male | Female |
| Farming, Fishing & Forestry | 14 (100.0%) | 0 (0.0%) |
| Construction & Extraction | 115 (100.0%) | 0 (0.0%) |
| Installation, Maintenance & Repair | 321 (100.0%) | 0 (0.0%) |
| Total (Category) | 450 (100.0%) | 0 (0.0%) |
| Total (Overall) | 5,426 (54.5%) | 4,529 (45.5%) |
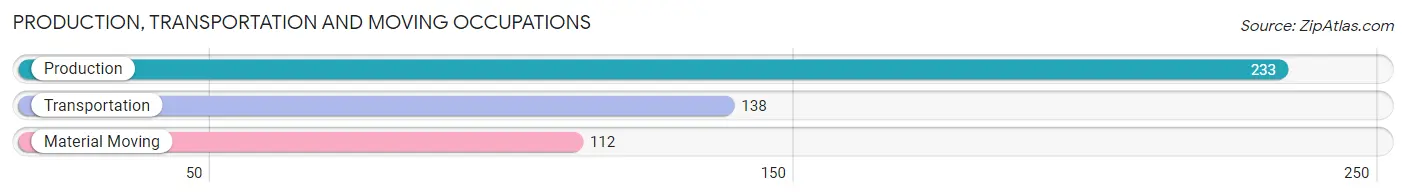
Production, Transportation and Moving Occupations
The most common Production, Transportation and Moving occupations in El Segundo are Production (233 | 2.3%), Transportation (138 | 1.4%), and Material Moving (112 | 1.1%).
Production, Transportation and Moving Occupations by Sex
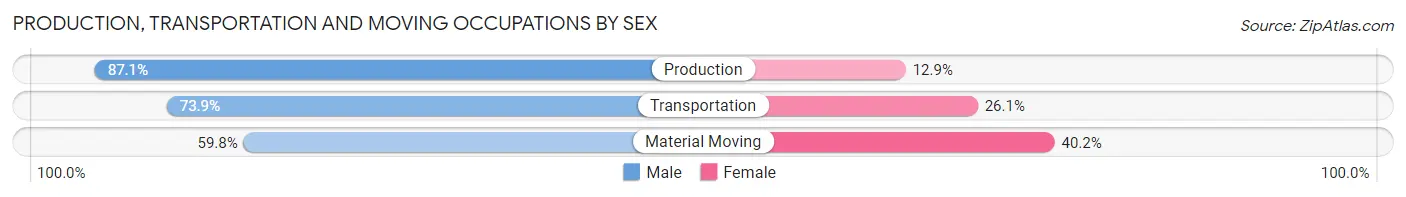
| Occupation | Male | Female |
| Production | 203 (87.1%) | 30 (12.9%) |
| Transportation | 102 (73.9%) | 36 (26.1%) |
| Material Moving | 67 (59.8%) | 45 (40.2%) |
| Total (Category) | 372 (77.0%) | 111 (23.0%) |
| Total (Overall) | 5,426 (54.5%) | 4,529 (45.5%) |
Employment Industries by Sex in El Segundo
Employment Industries in El Segundo
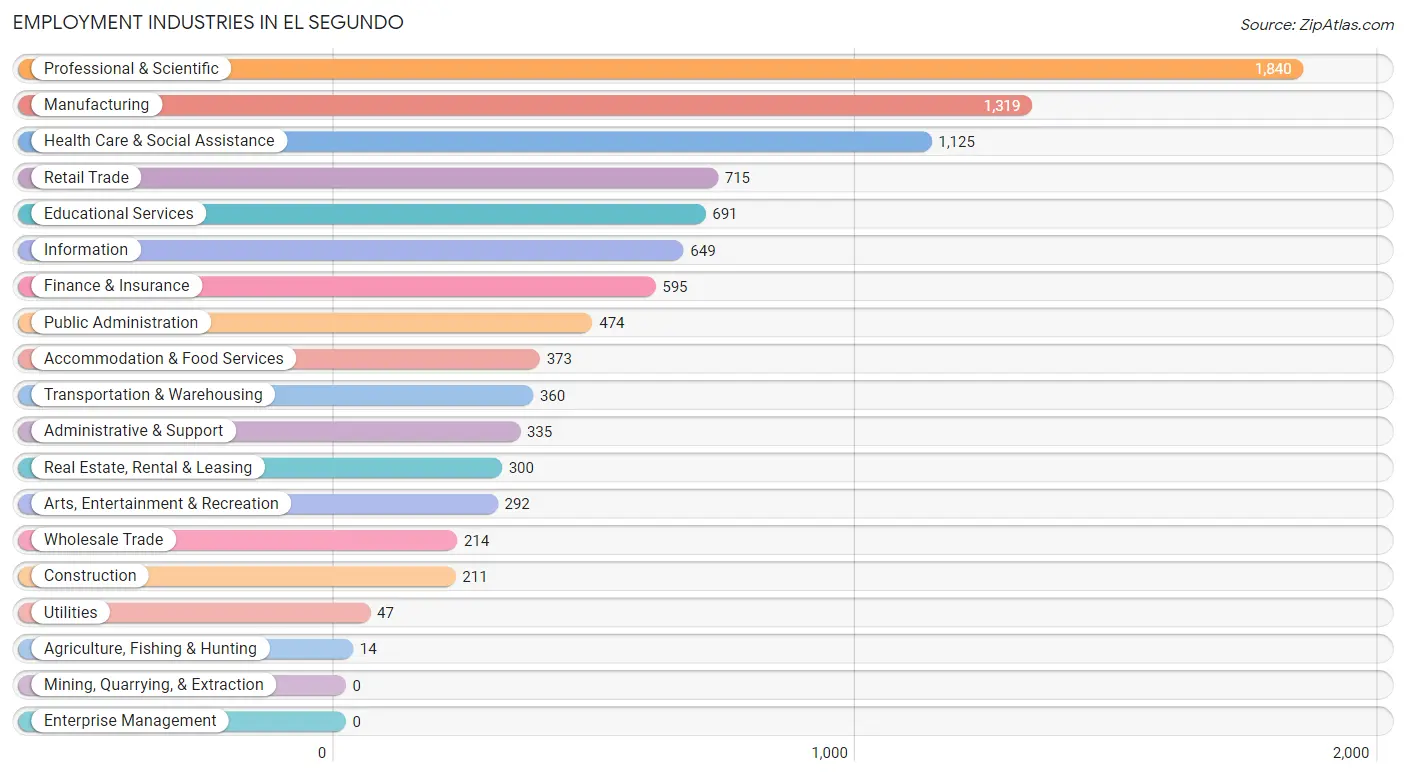
The major employment industries in El Segundo include Professional & Scientific (1,840 | 18.5%), Manufacturing (1,319 | 13.3%), Health Care & Social Assistance (1,125 | 11.3%), Retail Trade (715 | 7.2%), and Educational Services (691 | 6.9%).
Employment Industries by Sex in El Segundo
The El Segundo industries that see more men than women are Agriculture, Fishing & Hunting (100.0%), Construction (95.7%), and Real Estate, Rental & Leasing (85.7%), whereas the industries that tend to have a higher number of women are Utilities (74.5%), Educational Services (71.9%), and Health Care & Social Assistance (69.5%).
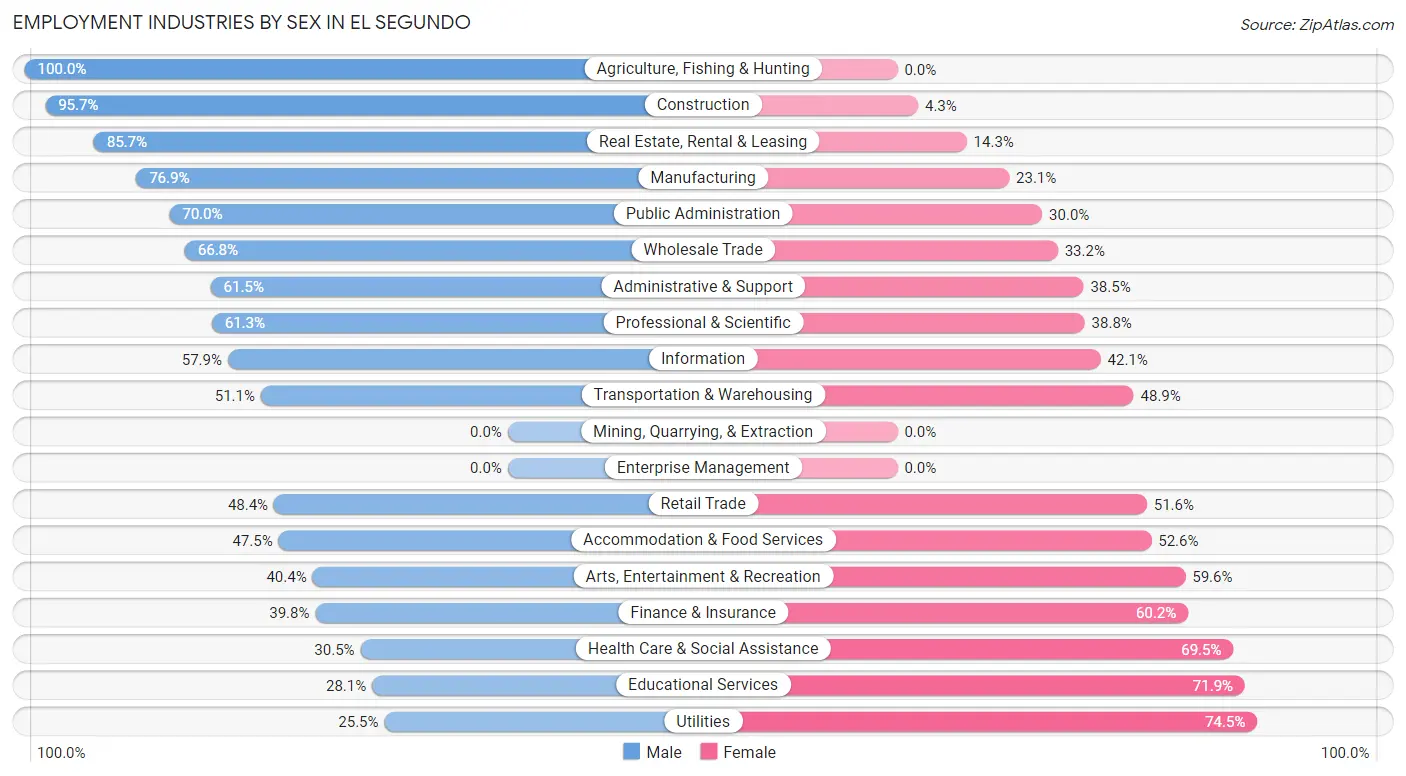
| Industry | Male | Female |
| Agriculture, Fishing & Hunting | 14 (100.0%) | 0 (0.0%) |
| Mining, Quarrying, & Extraction | 0 (0.0%) | 0 (0.0%) |
| Construction | 202 (95.7%) | 9 (4.3%) |
| Manufacturing | 1,014 (76.9%) | 305 (23.1%) |
| Wholesale Trade | 143 (66.8%) | 71 (33.2%) |
| Retail Trade | 346 (48.4%) | 369 (51.6%) |
| Transportation & Warehousing | 184 (51.1%) | 176 (48.9%) |
| Utilities | 12 (25.5%) | 35 (74.5%) |
| Information | 376 (57.9%) | 273 (42.1%) |
| Finance & Insurance | 237 (39.8%) | 358 (60.2%) |
| Real Estate, Rental & Leasing | 257 (85.7%) | 43 (14.3%) |
| Professional & Scientific | 1,127 (61.3%) | 713 (38.8%) |
| Enterprise Management | 0 (0.0%) | 0 (0.0%) |
| Administrative & Support | 206 (61.5%) | 129 (38.5%) |
| Educational Services | 194 (28.1%) | 497 (71.9%) |
| Health Care & Social Assistance | 343 (30.5%) | 782 (69.5%) |
| Arts, Entertainment & Recreation | 118 (40.4%) | 174 (59.6%) |
| Accommodation & Food Services | 177 (47.4%) | 196 (52.5%) |
| Public Administration | 332 (70.0%) | 142 (30.0%) |
| Total | 5,426 (54.5%) | 4,529 (45.5%) |
Education in El Segundo
School Enrollment in El Segundo
The most common levels of schooling among the 4,235 students in El Segundo are middle school (1,036 | 24.5%), elementary school (958 | 22.6%), and college / undergraduate (720 | 17.0%).
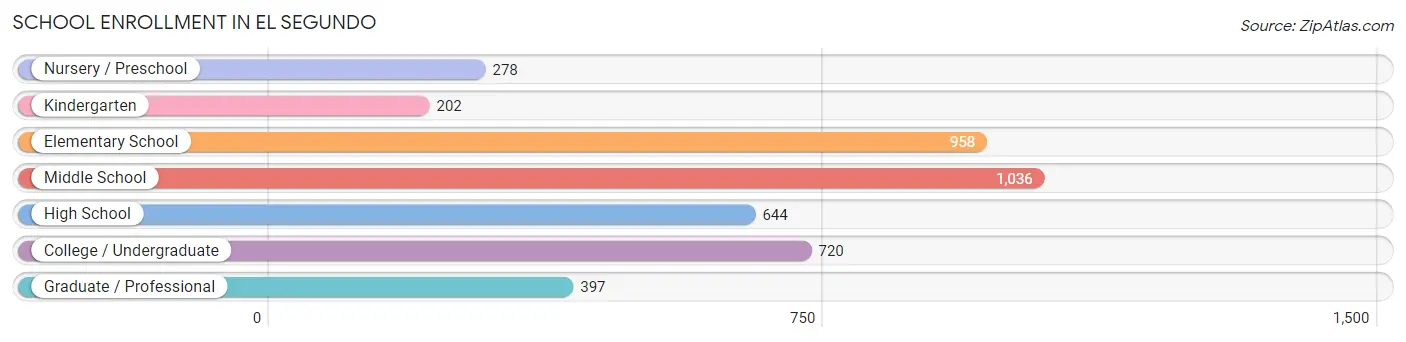
| School Level | # Students | % Students |
| Nursery / Preschool | 278 | 6.6% |
| Kindergarten | 202 | 4.8% |
| Elementary School | 958 | 22.6% |
| Middle School | 1,036 | 24.5% |
| High School | 644 | 15.2% |
| College / Undergraduate | 720 | 17.0% |
| Graduate / Professional | 397 | 9.4% |
| Total | 4,235 | 100.0% |
School Enrollment by Age by Funding Source in El Segundo
Out of a total of 4,235 students who are enrolled in schools in El Segundo, 631 (14.9%) attend a private institution, while the remaining 3,604 (85.1%) are enrolled in public schools. The age group of 25 to 34 year olds has the highest likelihood of being enrolled in private schools, with 219 (41.0% in the age bracket) enrolled. Conversely, the age group of 10 to 14 year olds has the lowest likelihood of being enrolled in a private school, with 1,194 (97.5% in the age bracket) attending a public institution.
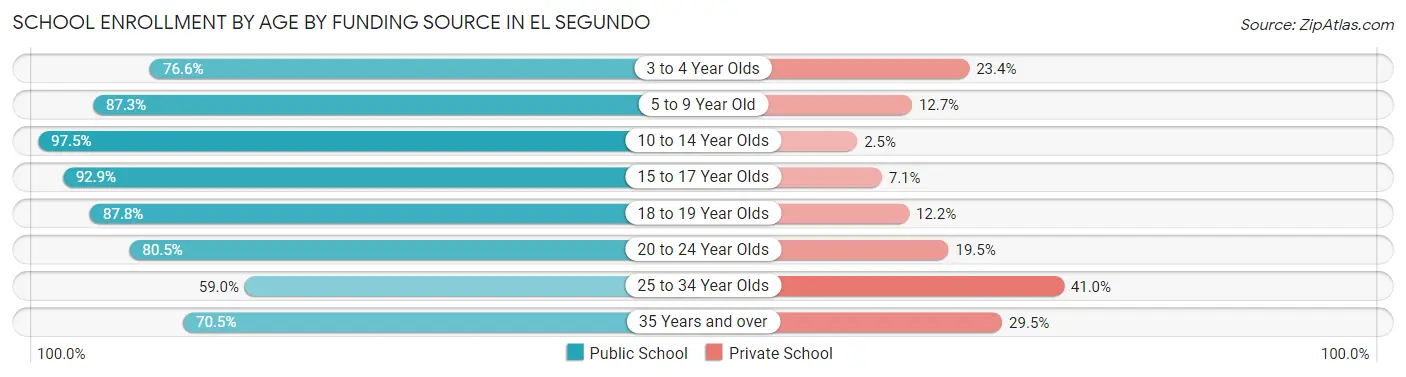
| Age Bracket | Public School | Private School |
| 3 to 4 Year Olds | 167 (76.6%) | 51 (23.4%) |
| 5 to 9 Year Old | 1,002 (87.3%) | 146 (12.7%) |
| 10 to 14 Year Olds | 1,194 (97.5%) | 31 (2.5%) |
| 15 to 17 Year Olds | 432 (92.9%) | 33 (7.1%) |
| 18 to 19 Year Olds | 101 (87.8%) | 14 (12.2%) |
| 20 to 24 Year Olds | 173 (80.5%) | 42 (19.5%) |
| 25 to 34 Year Olds | 315 (59.0%) | 219 (41.0%) |
| 35 Years and over | 222 (70.5%) | 93 (29.5%) |
| Total | 3,604 (85.1%) | 631 (14.9%) |
Educational Attainment by Field of Study in El Segundo
Business (1,505 | 17.6%), social sciences (1,238 | 14.5%), engineering (1,099 | 12.9%), visual & performing arts (769 | 9.0%), and communications (656 | 7.7%) are the most common fields of study among 8,532 individuals in El Segundo who have obtained a bachelor's degree or higher.
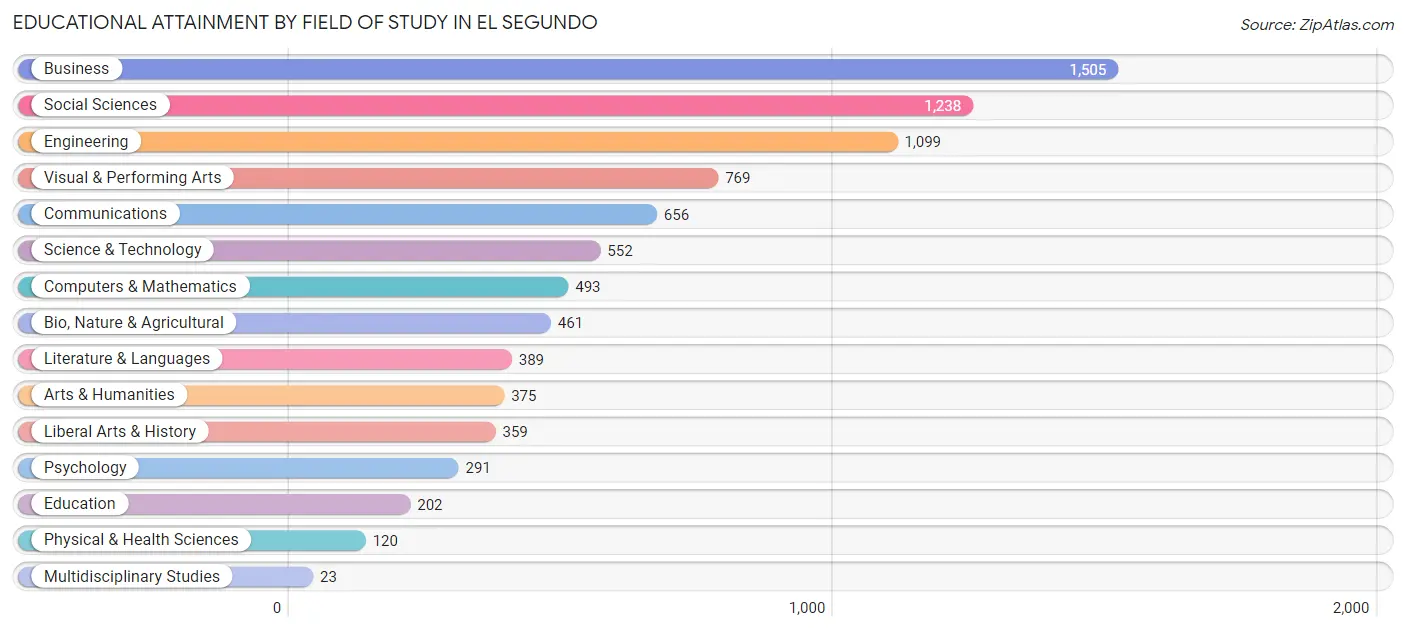
| Field of Study | # Graduates | % Graduates |
| Computers & Mathematics | 493 | 5.8% |
| Bio, Nature & Agricultural | 461 | 5.4% |
| Physical & Health Sciences | 120 | 1.4% |
| Psychology | 291 | 3.4% |
| Social Sciences | 1,238 | 14.5% |
| Engineering | 1,099 | 12.9% |
| Multidisciplinary Studies | 23 | 0.3% |
| Science & Technology | 552 | 6.5% |
| Business | 1,505 | 17.6% |
| Education | 202 | 2.4% |
| Literature & Languages | 389 | 4.6% |
| Liberal Arts & History | 359 | 4.2% |
| Visual & Performing Arts | 769 | 9.0% |
| Communications | 656 | 7.7% |
| Arts & Humanities | 375 | 4.4% |
| Total | 8,532 | 100.0% |
Transportation & Commute in El Segundo
Vehicle Availability by Sex in El Segundo
The most prevalent vehicle ownership categories in El Segundo are males with 2 vehicles (2,610, accounting for 48.6%) and females with 2 vehicles (2,215, making up 58.8%).
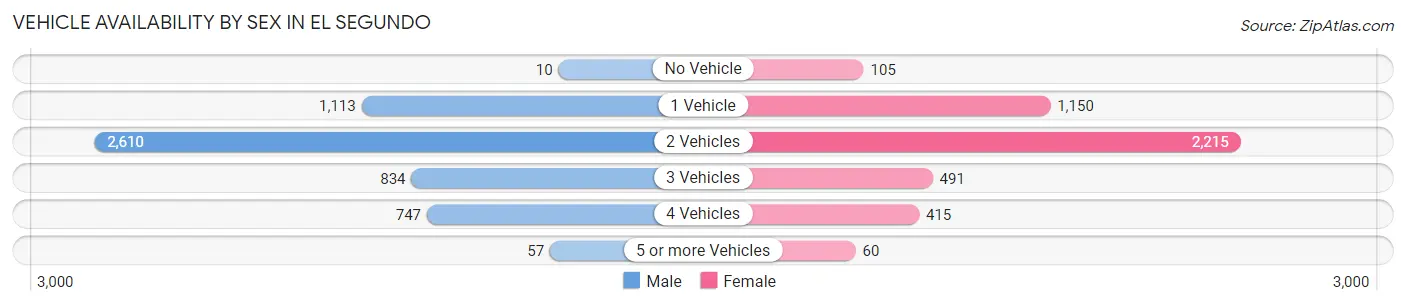
| Vehicles Available | Male | Female |
| No Vehicle | 10 (0.2%) | 105 (2.4%) |
| 1 Vehicle | 1,113 (20.7%) | 1,150 (25.9%) |
| 2 Vehicles | 2,610 (48.6%) | 2,215 (49.9%) |
| 3 Vehicles | 834 (15.5%) | 491 (11.1%) |
| 4 Vehicles | 747 (13.9%) | 415 (9.4%) |
| 5 or more Vehicles | 57 (1.1%) | 60 (1.3%) |
| Total | 5,371 (100.0%) | 4,436 (100.0%) |
Commute Time in El Segundo
The most frequently occuring commute durations in El Segundo are 10 to 14 minutes (1,549 commuters, 20.2%), 15 to 19 minutes (1,108 commuters, 14.5%), and 5 to 9 minutes (1,060 commuters, 13.8%).
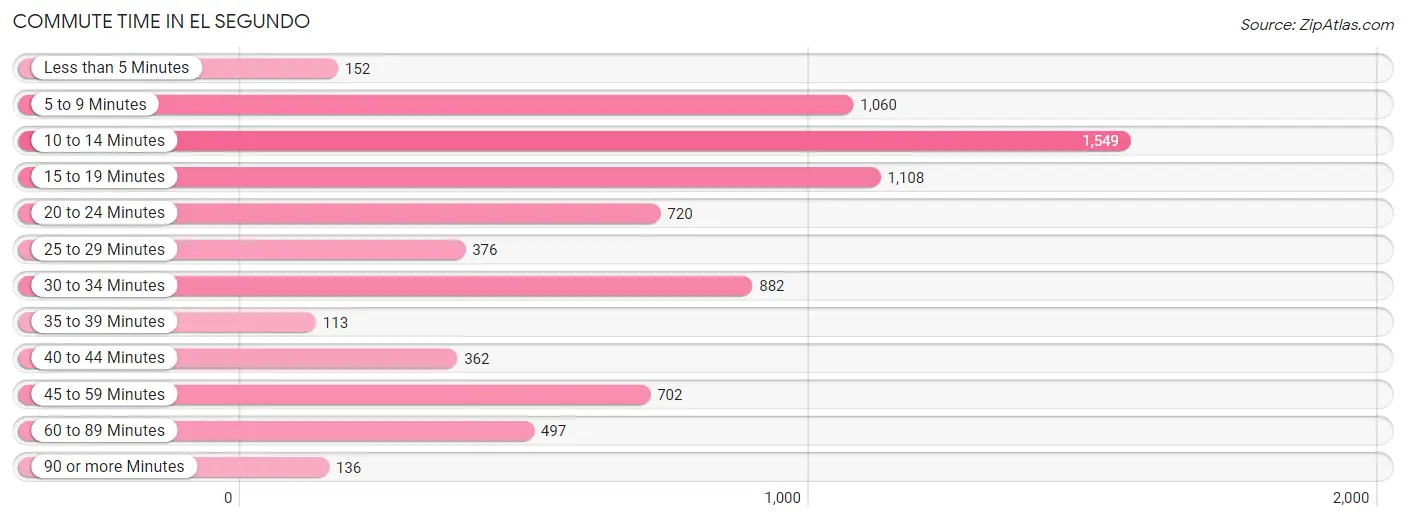
| Commute Time | # Commuters | % Commuters |
| Less than 5 Minutes | 152 | 2.0% |
| 5 to 9 Minutes | 1,060 | 13.8% |
| 10 to 14 Minutes | 1,549 | 20.2% |
| 15 to 19 Minutes | 1,108 | 14.5% |
| 20 to 24 Minutes | 720 | 9.4% |
| 25 to 29 Minutes | 376 | 4.9% |
| 30 to 34 Minutes | 882 | 11.5% |
| 35 to 39 Minutes | 113 | 1.5% |
| 40 to 44 Minutes | 362 | 4.7% |
| 45 to 59 Minutes | 702 | 9.2% |
| 60 to 89 Minutes | 497 | 6.5% |
| 90 or more Minutes | 136 | 1.8% |
Commute Time by Sex in El Segundo
The most common commute times in El Segundo are 10 to 14 minutes (1,037 commuters, 24.0%) for males and 15 to 19 minutes (628 commuters, 18.8%) for females.
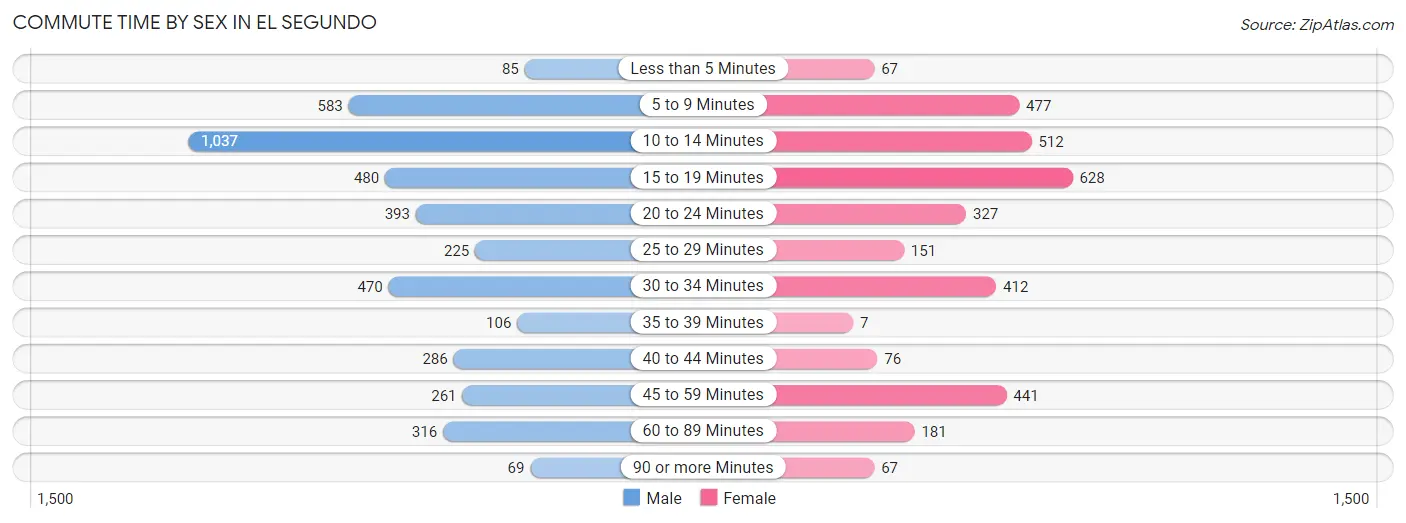
| Commute Time | Male | Female |
| Less than 5 Minutes | 85 (2.0%) | 67 (2.0%) |
| 5 to 9 Minutes | 583 (13.5%) | 477 (14.3%) |
| 10 to 14 Minutes | 1,037 (24.0%) | 512 (15.3%) |
| 15 to 19 Minutes | 480 (11.1%) | 628 (18.8%) |
| 20 to 24 Minutes | 393 (9.1%) | 327 (9.8%) |
| 25 to 29 Minutes | 225 (5.2%) | 151 (4.5%) |
| 30 to 34 Minutes | 470 (10.9%) | 412 (12.3%) |
| 35 to 39 Minutes | 106 (2.5%) | 7 (0.2%) |
| 40 to 44 Minutes | 286 (6.6%) | 76 (2.3%) |
| 45 to 59 Minutes | 261 (6.0%) | 441 (13.2%) |
| 60 to 89 Minutes | 316 (7.3%) | 181 (5.4%) |
| 90 or more Minutes | 69 (1.6%) | 67 (2.0%) |
Time of Departure to Work by Sex in El Segundo
The most frequent times of departure to work in El Segundo are 8:00 AM to 8:29 AM (804, 18.6%) for males and 9:00 AM to 9:59 AM (548, 16.4%) for females.
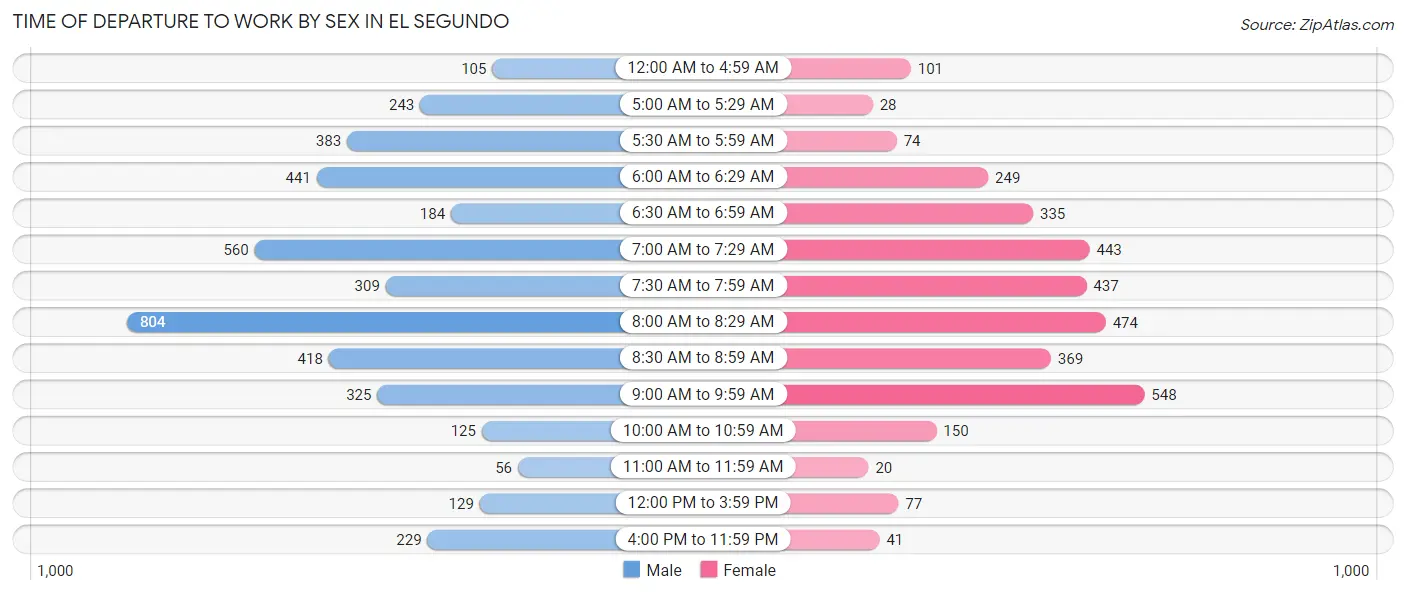
| Time of Departure | Male | Female |
| 12:00 AM to 4:59 AM | 105 (2.4%) | 101 (3.0%) |
| 5:00 AM to 5:29 AM | 243 (5.6%) | 28 (0.8%) |
| 5:30 AM to 5:59 AM | 383 (8.9%) | 74 (2.2%) |
| 6:00 AM to 6:29 AM | 441 (10.2%) | 249 (7.4%) |
| 6:30 AM to 6:59 AM | 184 (4.3%) | 335 (10.0%) |
| 7:00 AM to 7:29 AM | 560 (13.0%) | 443 (13.2%) |
| 7:30 AM to 7:59 AM | 309 (7.2%) | 437 (13.1%) |
| 8:00 AM to 8:29 AM | 804 (18.6%) | 474 (14.2%) |
| 8:30 AM to 8:59 AM | 418 (9.7%) | 369 (11.0%) |
| 9:00 AM to 9:59 AM | 325 (7.5%) | 548 (16.4%) |
| 10:00 AM to 10:59 AM | 125 (2.9%) | 150 (4.5%) |
| 11:00 AM to 11:59 AM | 56 (1.3%) | 20 (0.6%) |
| 12:00 PM to 3:59 PM | 129 (3.0%) | 77 (2.3%) |
| 4:00 PM to 11:59 PM | 229 (5.3%) | 41 (1.2%) |
| Total | 4,311 (100.0%) | 3,346 (100.0%) |
Housing Occupancy in El Segundo
Occupancy by Ownership in El Segundo
Of the total 7,075 dwellings in El Segundo, owner-occupied units account for 2,985 (42.2%), while renter-occupied units make up 4,090 (57.8%).
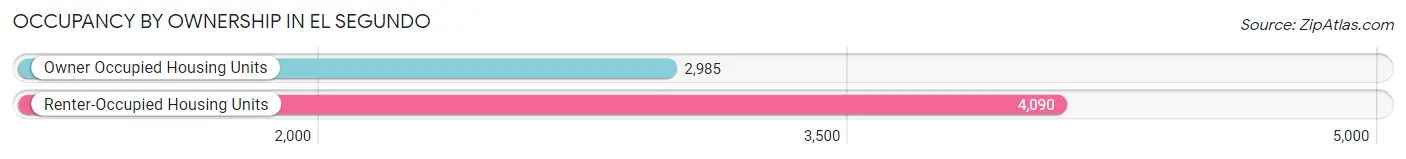
| Occupancy | # Housing Units | % Housing Units |
| Owner Occupied Housing Units | 2,985 | 42.2% |
| Renter-Occupied Housing Units | 4,090 | 57.8% |
| Total Occupied Housing Units | 7,075 | 100.0% |
Occupancy by Household Size in El Segundo
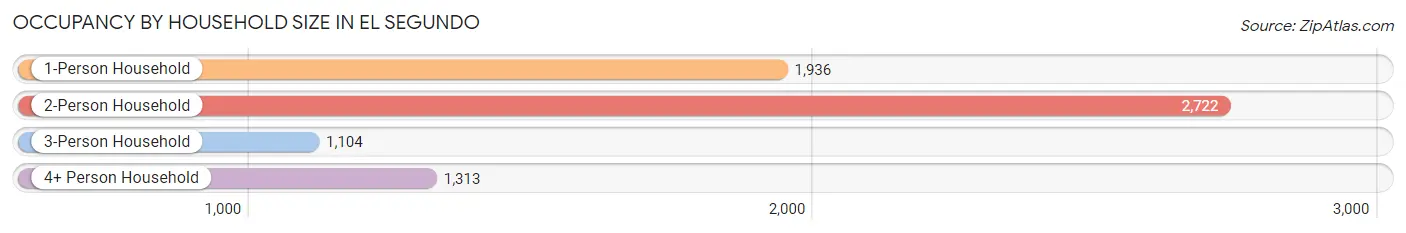
| Household Size | # Housing Units | % Housing Units |
| 1-Person Household | 1,936 | 27.4% |
| 2-Person Household | 2,722 | 38.5% |
| 3-Person Household | 1,104 | 15.6% |
| 4+ Person Household | 1,313 | 18.6% |
| Total Housing Units | 7,075 | 100.0% |
Occupancy by Ownership by Household Size in El Segundo
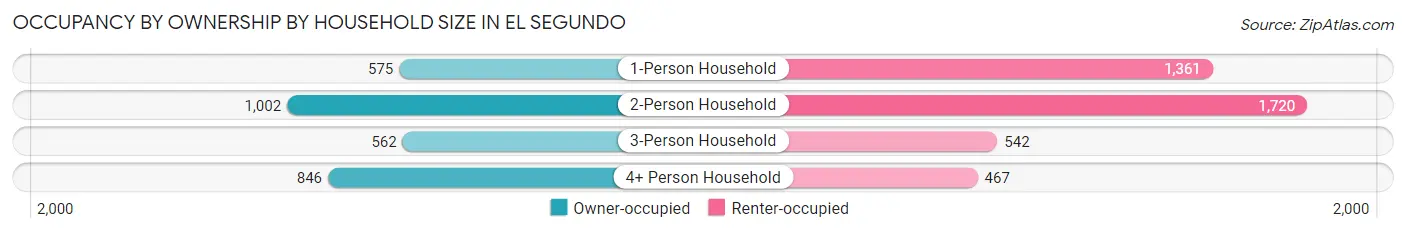
| Household Size | Owner-occupied | Renter-occupied |
| 1-Person Household | 575 (29.7%) | 1,361 (70.3%) |
| 2-Person Household | 1,002 (36.8%) | 1,720 (63.2%) |
| 3-Person Household | 562 (50.9%) | 542 (49.1%) |
| 4+ Person Household | 846 (64.4%) | 467 (35.6%) |
| Total Housing Units | 2,985 (42.2%) | 4,090 (57.8%) |
Occupancy by Educational Attainment in El Segundo
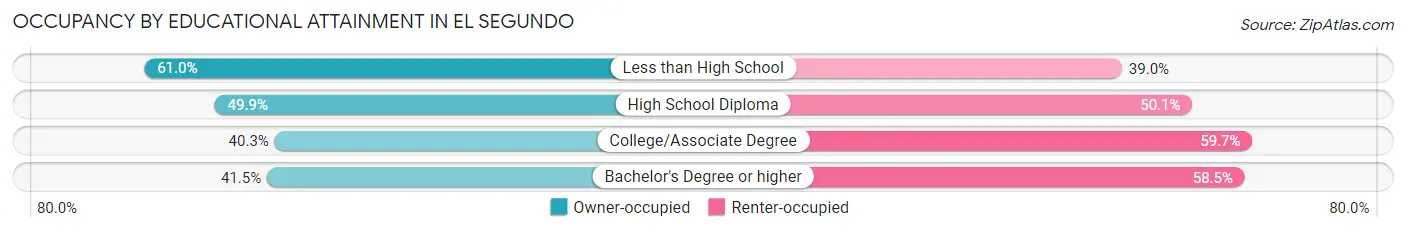
| Household Size | Owner-occupied | Renter-occupied |
| Less than High School | 36 (61.0%) | 23 (39.0%) |
| High School Diploma | 355 (49.9%) | 357 (50.1%) |
| College/Associate Degree | 829 (40.3%) | 1,226 (59.7%) |
| Bachelor's Degree or higher | 1,765 (41.5%) | 2,484 (58.5%) |
Occupancy by Age of Householder in El Segundo
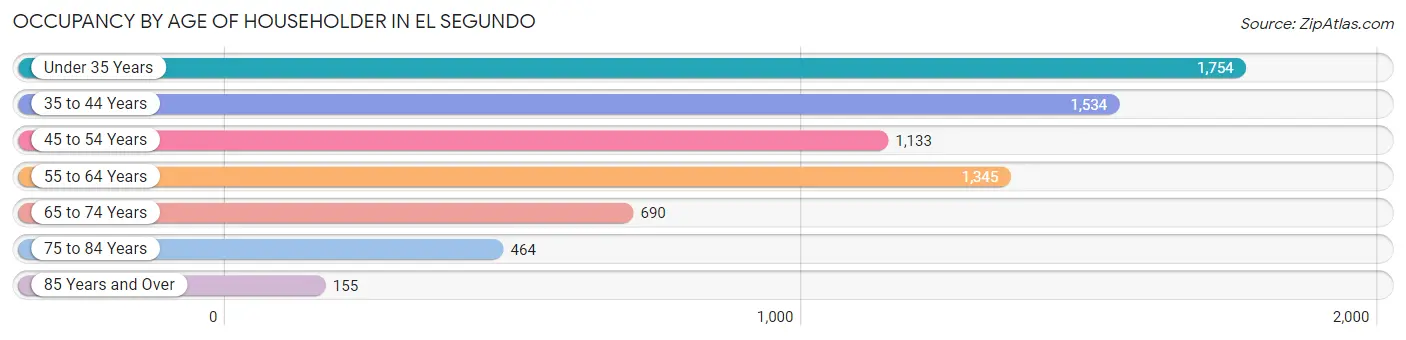
| Age Bracket | # Households | % Households |
| Under 35 Years | 1,754 | 24.8% |
| 35 to 44 Years | 1,534 | 21.7% |
| 45 to 54 Years | 1,133 | 16.0% |
| 55 to 64 Years | 1,345 | 19.0% |
| 65 to 74 Years | 690 | 9.8% |
| 75 to 84 Years | 464 | 6.6% |
| 85 Years and Over | 155 | 2.2% |
| Total | 7,075 | 100.0% |
Housing Finances in El Segundo
Median Income by Occupancy in El Segundo
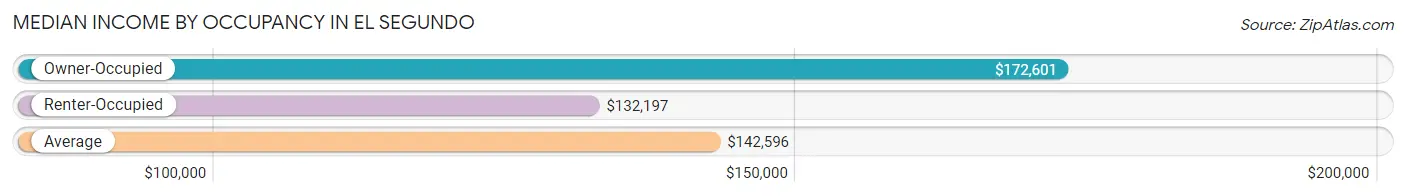
| Occupancy Type | # Households | Median Income |
| Owner-Occupied | 2,985 (42.2%) | $172,601 |
| Renter-Occupied | 4,090 (57.8%) | $132,197 |
| Average | 7,075 (100.0%) | $142,596 |
Occupancy by Householder Income Bracket in El Segundo
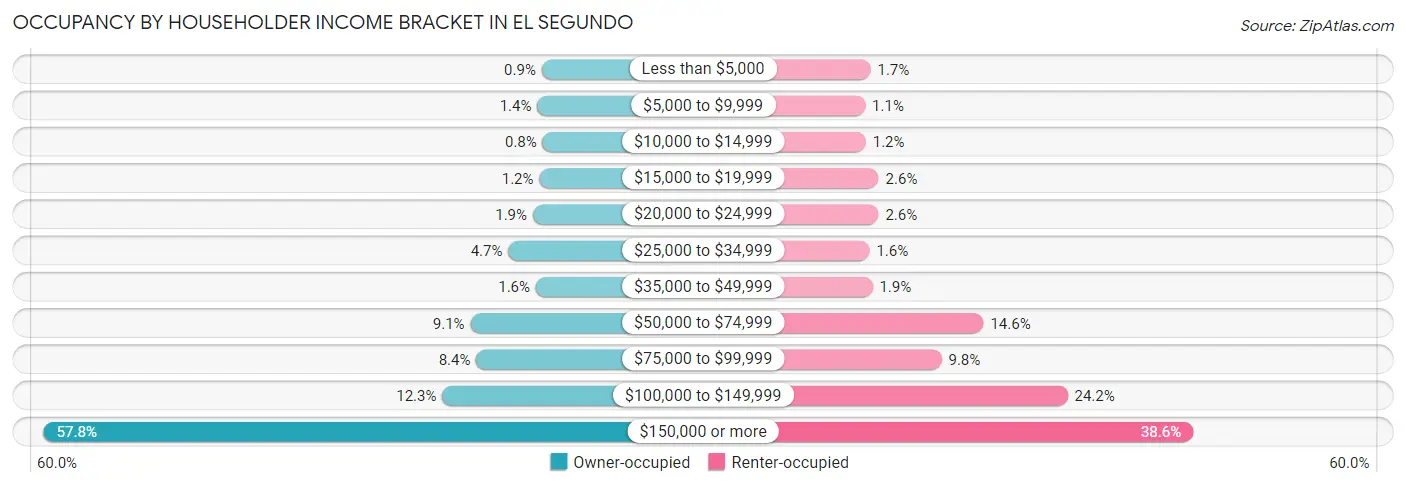
| Income Bracket | Owner-occupied | Renter-occupied |
| Less than $5,000 | 27 (0.9%) | 70 (1.7%) |
| $5,000 to $9,999 | 42 (1.4%) | 45 (1.1%) |
| $10,000 to $14,999 | 24 (0.8%) | 48 (1.2%) |
| $15,000 to $19,999 | 35 (1.2%) | 108 (2.6%) |
| $20,000 to $24,999 | 57 (1.9%) | 107 (2.6%) |
| $25,000 to $34,999 | 141 (4.7%) | 65 (1.6%) |
| $35,000 to $49,999 | 47 (1.6%) | 79 (1.9%) |
| $50,000 to $74,999 | 270 (9.0%) | 598 (14.6%) |
| $75,000 to $99,999 | 250 (8.4%) | 402 (9.8%) |
| $100,000 to $149,999 | 366 (12.3%) | 991 (24.2%) |
| $150,000 or more | 1,726 (57.8%) | 1,577 (38.6%) |
| Total | 2,985 (100.0%) | 4,090 (100.0%) |
Monthly Housing Cost Tiers in El Segundo
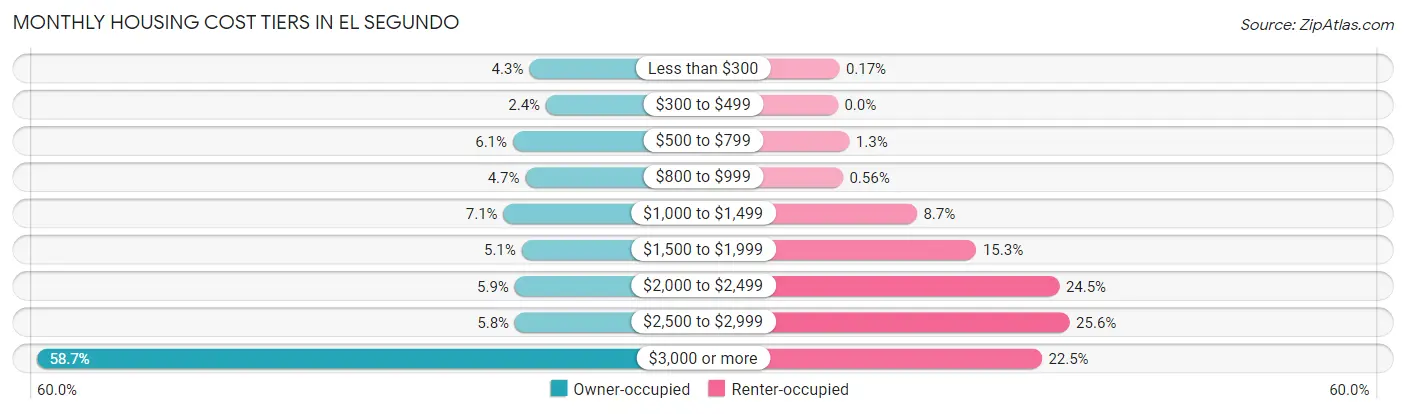
| Monthly Cost | Owner-occupied | Renter-occupied |
| Less than $300 | 127 (4.3%) | 7 (0.2%) |
| $300 to $499 | 72 (2.4%) | 0 (0.0%) |
| $500 to $799 | 181 (6.1%) | 52 (1.3%) |
| $800 to $999 | 140 (4.7%) | 23 (0.6%) |
| $1,000 to $1,499 | 212 (7.1%) | 357 (8.7%) |
| $1,500 to $1,999 | 152 (5.1%) | 626 (15.3%) |
| $2,000 to $2,499 | 175 (5.9%) | 1,001 (24.5%) |
| $2,500 to $2,999 | 174 (5.8%) | 1,047 (25.6%) |
| $3,000 or more | 1,752 (58.7%) | 922 (22.5%) |
| Total | 2,985 (100.0%) | 4,090 (100.0%) |
Physical Housing Characteristics in El Segundo
Housing Structures in El Segundo
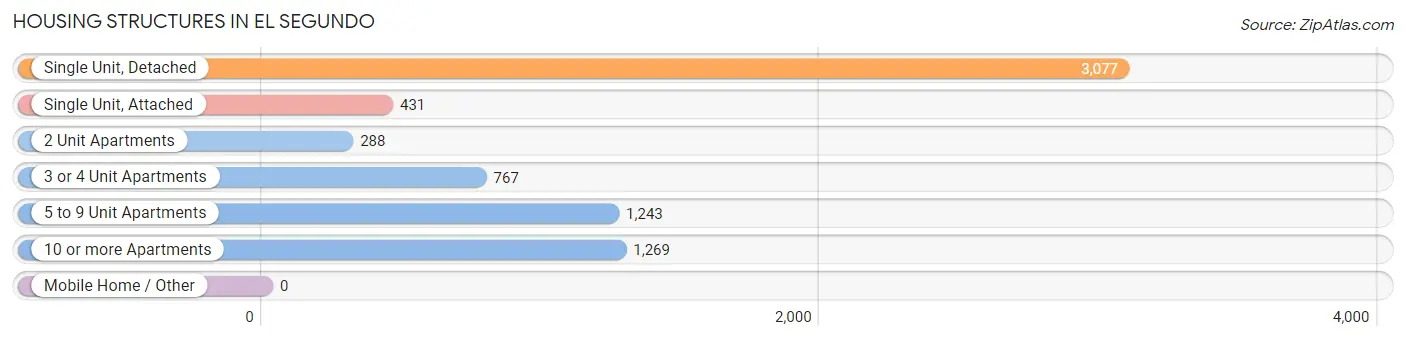
| Structure Type | # Housing Units | % Housing Units |
| Single Unit, Detached | 3,077 | 43.5% |
| Single Unit, Attached | 431 | 6.1% |
| 2 Unit Apartments | 288 | 4.1% |
| 3 or 4 Unit Apartments | 767 | 10.8% |
| 5 to 9 Unit Apartments | 1,243 | 17.6% |
| 10 or more Apartments | 1,269 | 17.9% |
| Mobile Home / Other | 0 | 0.0% |
| Total | 7,075 | 100.0% |
Housing Structures by Occupancy in El Segundo
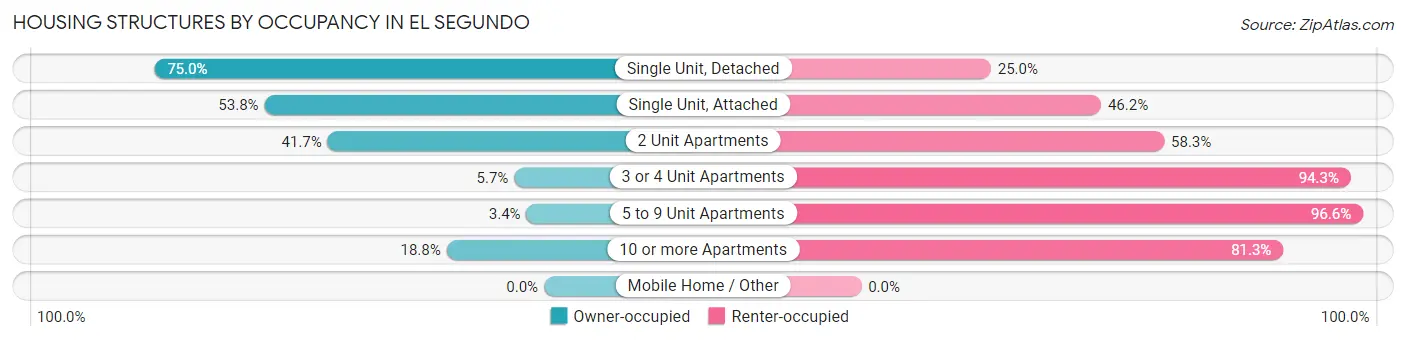
| Structure Type | Owner-occupied | Renter-occupied |
| Single Unit, Detached | 2,309 (75.0%) | 768 (25.0%) |
| Single Unit, Attached | 232 (53.8%) | 199 (46.2%) |
| 2 Unit Apartments | 120 (41.7%) | 168 (58.3%) |
| 3 or 4 Unit Apartments | 44 (5.7%) | 723 (94.3%) |
| 5 to 9 Unit Apartments | 42 (3.4%) | 1,201 (96.6%) |
| 10 or more Apartments | 238 (18.8%) | 1,031 (81.2%) |
| Mobile Home / Other | 0 (0.0%) | 0 (0.0%) |
| Total | 2,985 (42.2%) | 4,090 (57.8%) |
Housing Structures by Number of Rooms in El Segundo
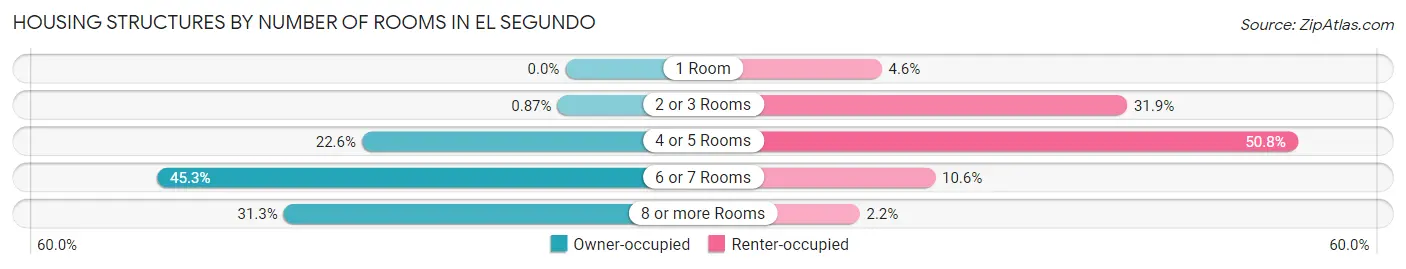
| Number of Rooms | Owner-occupied | Renter-occupied |
| 1 Room | 0 (0.0%) | 189 (4.6%) |
| 2 or 3 Rooms | 26 (0.9%) | 1,303 (31.9%) |
| 4 or 5 Rooms | 674 (22.6%) | 2,077 (50.8%) |
| 6 or 7 Rooms | 1,352 (45.3%) | 432 (10.6%) |
| 8 or more Rooms | 933 (31.3%) | 89 (2.2%) |
| Total | 2,985 (100.0%) | 4,090 (100.0%) |
Housing Structure by Heating Type in El Segundo
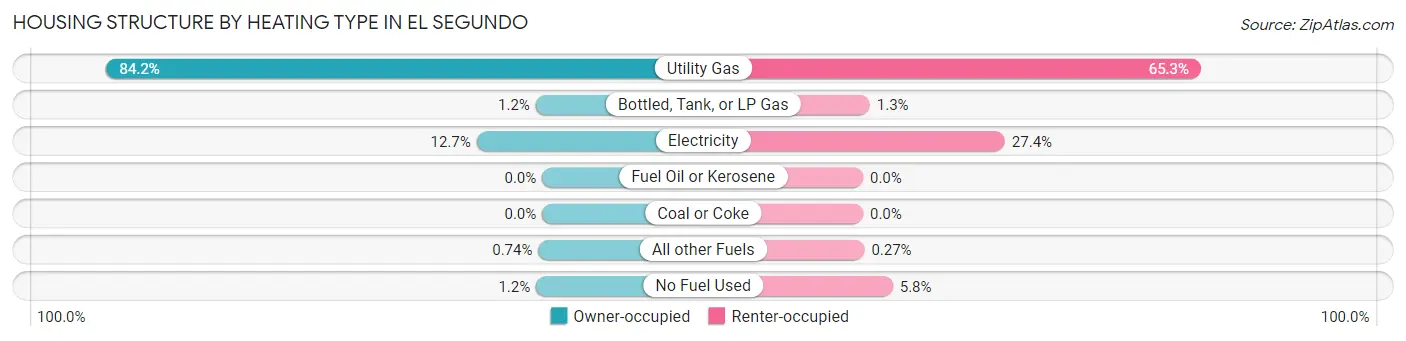
| Heating Type | Owner-occupied | Renter-occupied |
| Utility Gas | 2,513 (84.2%) | 2,669 (65.3%) |
| Bottled, Tank, or LP Gas | 37 (1.2%) | 54 (1.3%) |
| Electricity | 378 (12.7%) | 1,121 (27.4%) |
| Fuel Oil or Kerosene | 0 (0.0%) | 0 (0.0%) |
| Coal or Coke | 0 (0.0%) | 0 (0.0%) |
| All other Fuels | 22 (0.7%) | 11 (0.3%) |
| No Fuel Used | 35 (1.2%) | 235 (5.8%) |
| Total | 2,985 (100.0%) | 4,090 (100.0%) |
Household Vehicle Usage in El Segundo
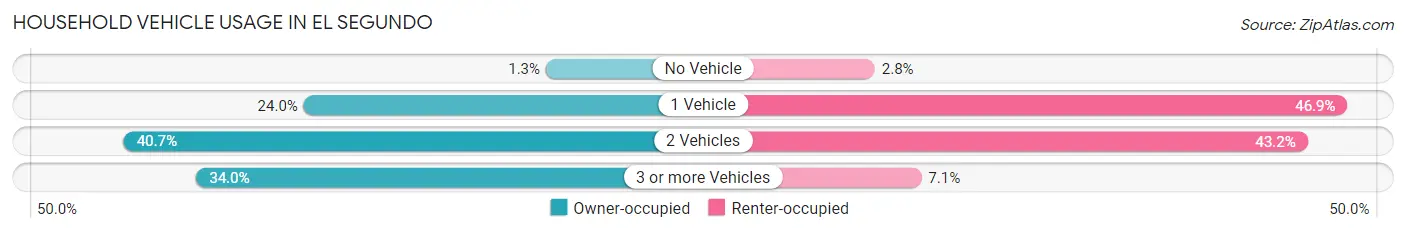
| Vehicles per Household | Owner-occupied | Renter-occupied |
| No Vehicle | 40 (1.3%) | 114 (2.8%) |
| 1 Vehicle | 715 (23.9%) | 1,918 (46.9%) |
| 2 Vehicles | 1,216 (40.7%) | 1,766 (43.2%) |
| 3 or more Vehicles | 1,014 (34.0%) | 292 (7.1%) |
| Total | 2,985 (100.0%) | 4,090 (100.0%) |
Real Estate & Mortgages in El Segundo
Real Estate and Mortgage Overview in El Segundo
| Characteristic | Without Mortgage | With Mortgage |
| Housing Units | 696 | 2,289 |
| Median Property Value | $1,300,000 | $1,531,000 |
| Median Household Income | $80,377 | $1,550 |
| Monthly Housing Costs | $774 | $1,737 |
| Real Estate Taxes | $4,133 | $0 |
Property Value by Mortgage Status in El Segundo
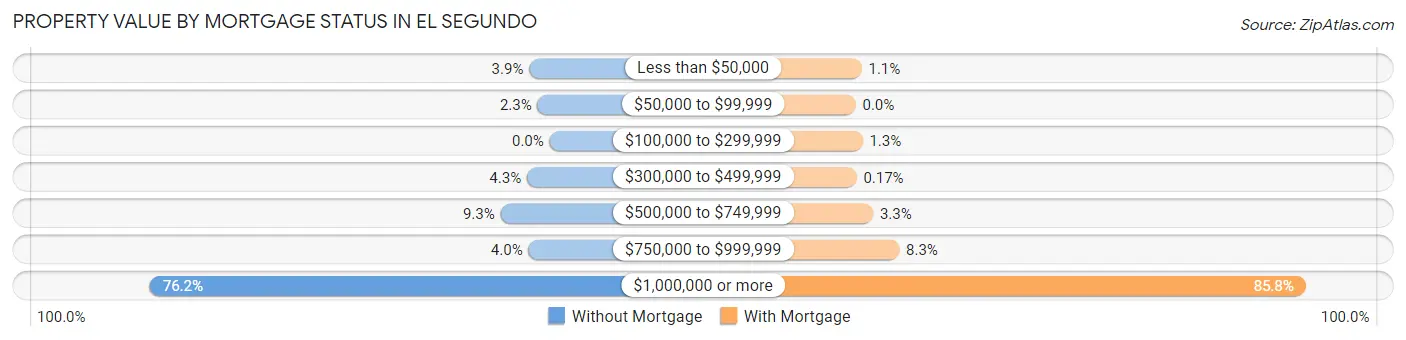
| Property Value | Without Mortgage | With Mortgage |
| Less than $50,000 | 27 (3.9%) | 26 (1.1%) |
| $50,000 to $99,999 | 16 (2.3%) | 0 (0.0%) |
| $100,000 to $299,999 | 0 (0.0%) | 30 (1.3%) |
| $300,000 to $499,999 | 30 (4.3%) | 4 (0.2%) |
| $500,000 to $749,999 | 65 (9.3%) | 76 (3.3%) |
| $750,000 to $999,999 | 28 (4.0%) | 190 (8.3%) |
| $1,000,000 or more | 530 (76.1%) | 1,963 (85.8%) |
| Total | 696 (100.0%) | 2,289 (100.0%) |
Household Income by Mortgage Status in El Segundo
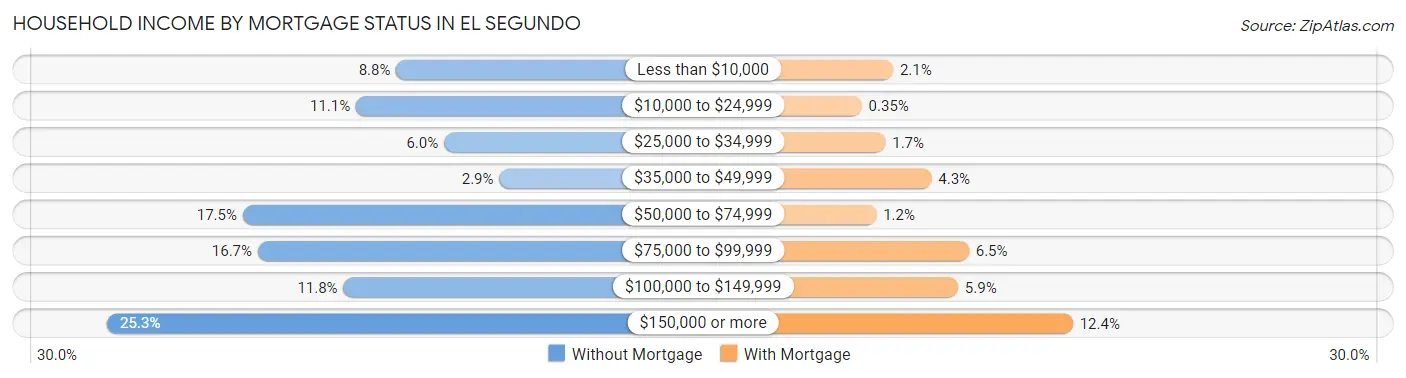
| Household Income | Without Mortgage | With Mortgage |
| Less than $10,000 | 61 (8.8%) | 49 (2.1%) |
| $10,000 to $24,999 | 77 (11.1%) | 8 (0.4%) |
| $25,000 to $34,999 | 42 (6.0%) | 39 (1.7%) |
| $35,000 to $49,999 | 20 (2.9%) | 99 (4.3%) |
| $50,000 to $74,999 | 122 (17.5%) | 27 (1.2%) |
| $75,000 to $99,999 | 116 (16.7%) | 148 (6.5%) |
| $100,000 to $149,999 | 82 (11.8%) | 134 (5.9%) |
| $150,000 or more | 176 (25.3%) | 284 (12.4%) |
| Total | 696 (100.0%) | 2,289 (100.0%) |
Property Value to Household Income Ratio in El Segundo
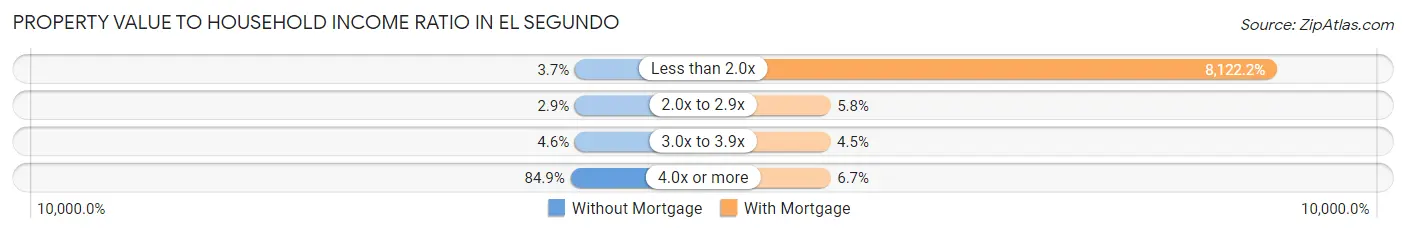
| Value-to-Income Ratio | Without Mortgage | With Mortgage |
| Less than 2.0x | 26 (3.7%) | 185,917 (8,122.2%) |
| 2.0x to 2.9x | 20 (2.9%) | 133 (5.8%) |
| 3.0x to 3.9x | 32 (4.6%) | 102 (4.5%) |
| 4.0x or more | 591 (84.9%) | 154 (6.7%) |
| Total | 696 (100.0%) | 2,289 (100.0%) |
Real Estate Taxes by Mortgage Status in El Segundo
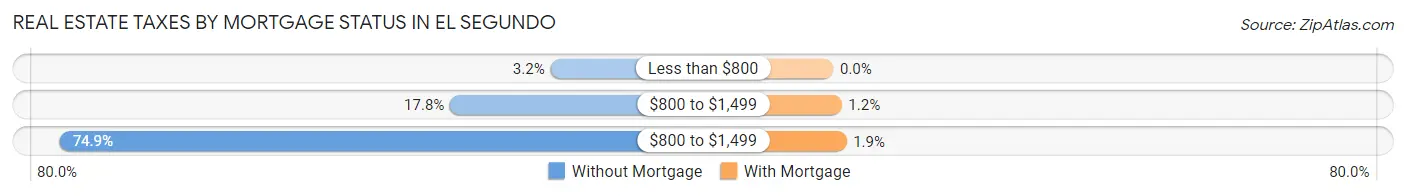
| Property Taxes | Without Mortgage | With Mortgage |
| Less than $800 | 22 (3.2%) | 0 (0.0%) |
| $800 to $1,499 | 124 (17.8%) | 28 (1.2%) |
| $800 to $1,499 | 521 (74.9%) | 44 (1.9%) |
| Total | 696 (100.0%) | 2,289 (100.0%) |
Health & Disability in El Segundo
Health Insurance Coverage by Age in El Segundo
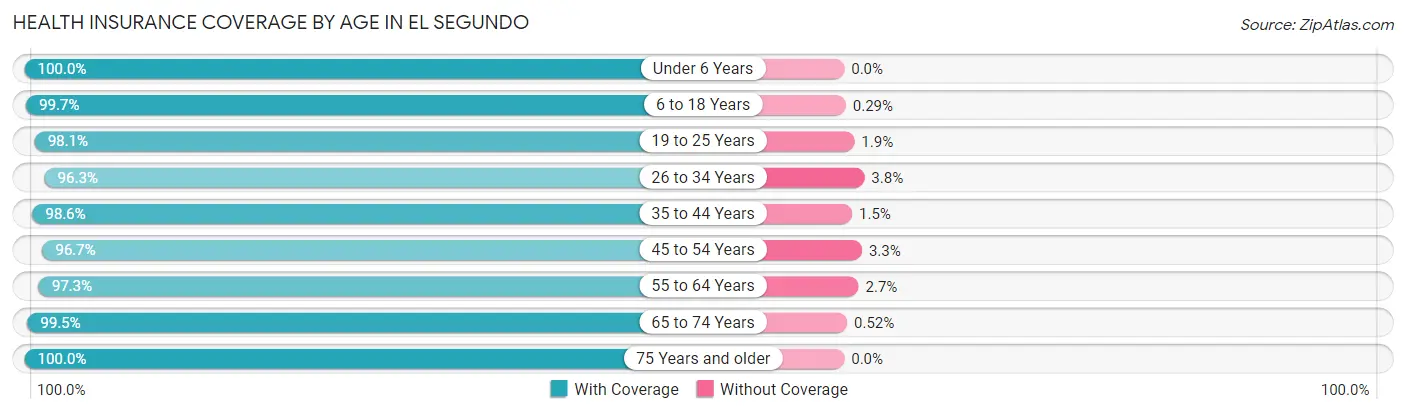
| Age Bracket | With Coverage | Without Coverage |
| Under 6 Years | 907 (100.0%) | 0 (0.0%) |
| 6 to 18 Years | 2,734 (99.7%) | 8 (0.3%) |
| 19 to 25 Years | 1,141 (98.1%) | 22 (1.9%) |
| 26 to 34 Years | 2,955 (96.3%) | 115 (3.7%) |
| 35 to 44 Years | 2,792 (98.6%) | 41 (1.5%) |
| 45 to 54 Years | 2,025 (96.7%) | 69 (3.3%) |
| 55 to 64 Years | 2,082 (97.3%) | 57 (2.7%) |
| 65 to 74 Years | 1,157 (99.5%) | 6 (0.5%) |
| 75 Years and older | 958 (100.0%) | 0 (0.0%) |
| Total | 16,751 (98.1%) | 318 (1.9%) |
Health Insurance Coverage by Citizenship Status in El Segundo
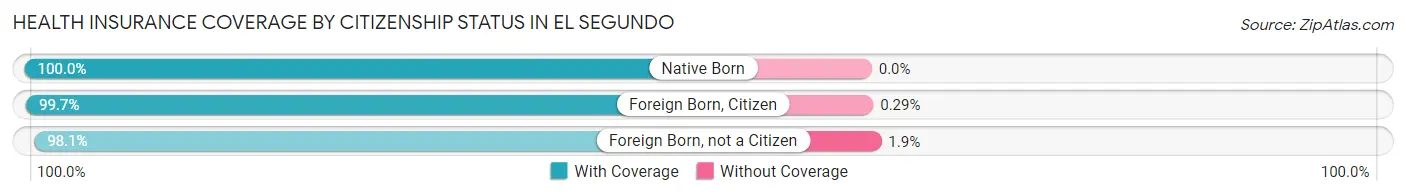
| Citizenship Status | With Coverage | Without Coverage |
| Native Born | 907 (100.0%) | 0 (0.0%) |
| Foreign Born, Citizen | 2,734 (99.7%) | 8 (0.3%) |
| Foreign Born, not a Citizen | 1,141 (98.1%) | 22 (1.9%) |
Health Insurance Coverage by Household Income in El Segundo
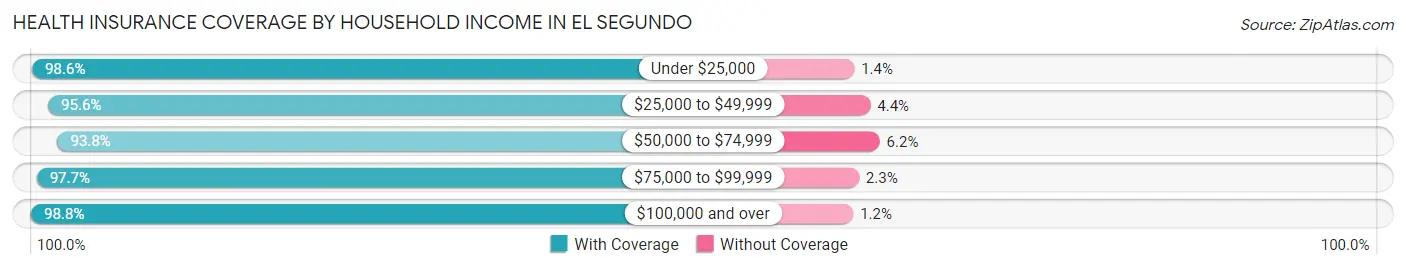
| Household Income | With Coverage | Without Coverage |
| Under $25,000 | 925 (98.6%) | 13 (1.4%) |
| $25,000 to $49,999 | 541 (95.6%) | 25 (4.4%) |
| $50,000 to $74,999 | 1,477 (93.8%) | 97 (6.2%) |
| $75,000 to $99,999 | 1,164 (97.7%) | 27 (2.3%) |
| $100,000 and over | 12,612 (98.8%) | 155 (1.2%) |
Public vs Private Health Insurance Coverage by Age in El Segundo
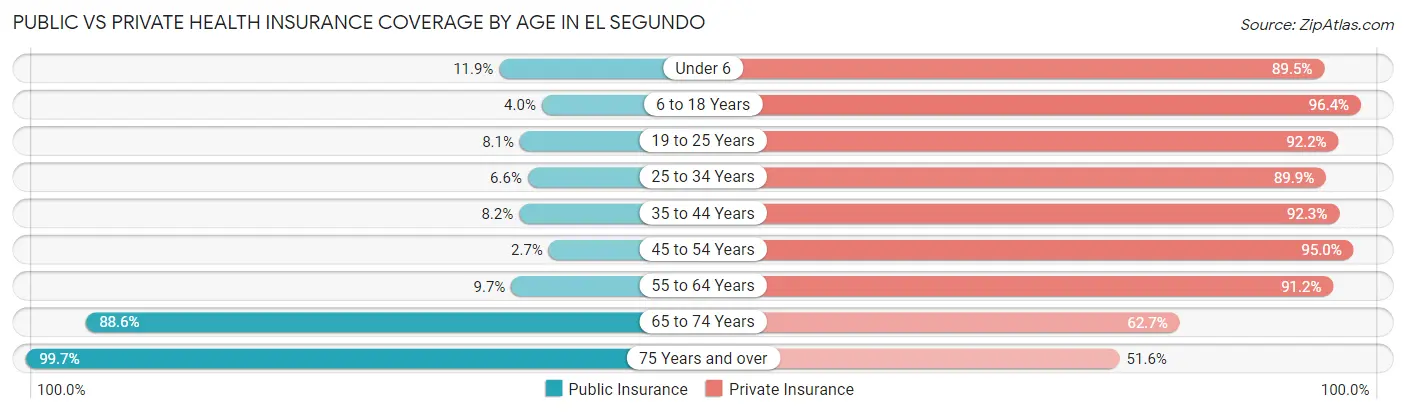
| Age Bracket | Public Insurance | Private Insurance |
| Under 6 | 108 (11.9%) | 812 (89.5%) |
| 6 to 18 Years | 110 (4.0%) | 2,642 (96.4%) |
| 19 to 25 Years | 94 (8.1%) | 1,072 (92.2%) |
| 25 to 34 Years | 203 (6.6%) | 2,759 (89.9%) |
| 35 to 44 Years | 233 (8.2%) | 2,615 (92.3%) |
| 45 to 54 Years | 57 (2.7%) | 1,989 (95.0%) |
| 55 to 64 Years | 207 (9.7%) | 1,951 (91.2%) |
| 65 to 74 Years | 1,030 (88.6%) | 729 (62.7%) |
| 75 Years and over | 955 (99.7%) | 494 (51.6%) |
| Total | 2,997 (17.6%) | 15,063 (88.2%) |
Disability Status by Sex by Age in El Segundo
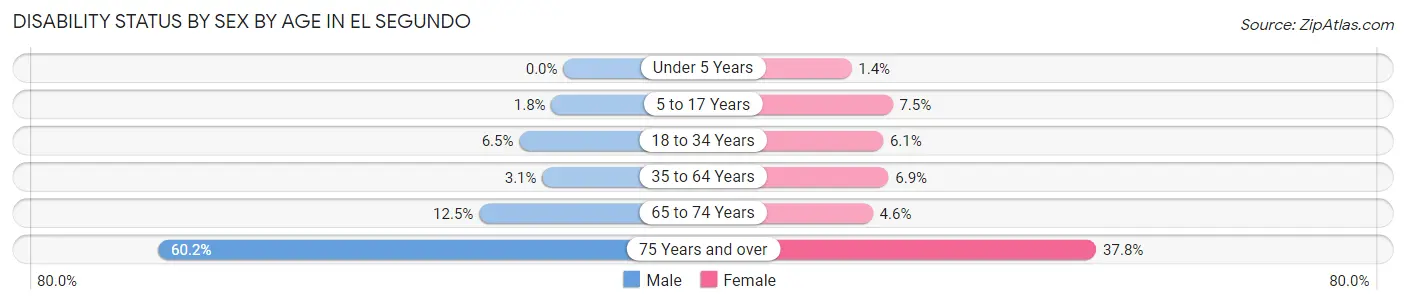
| Age Bracket | Male | Female |
| Under 5 Years | 0 (0.0%) | 6 (1.4%) |
| 5 to 17 Years | 25 (1.8%) | 108 (7.5%) |
| 18 to 34 Years | 155 (6.5%) | 120 (6.1%) |
| 35 to 64 Years | 112 (3.1%) | 240 (6.9%) |
| 65 to 74 Years | 69 (12.5%) | 28 (4.6%) |
| 75 Years and over | 269 (60.2%) | 193 (37.8%) |
Disability Class by Sex by Age in El Segundo
Disability Class: Hearing Difficulty
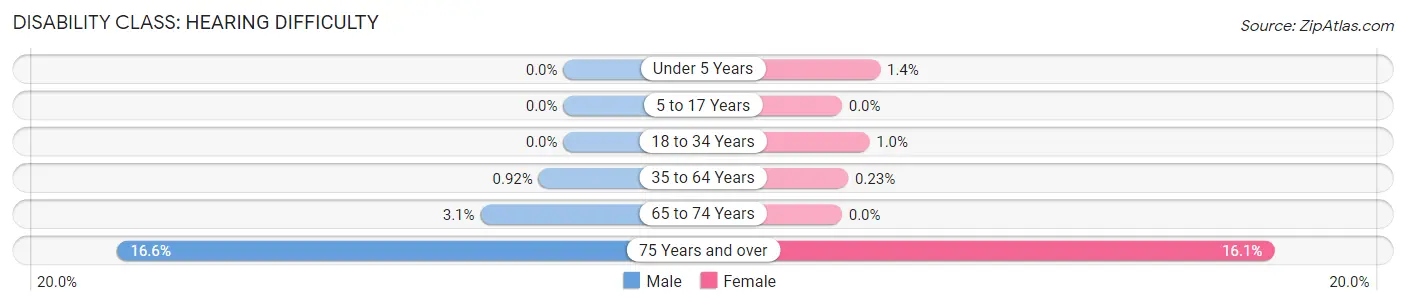
| Age Bracket | Male | Female |
| Under 5 Years | 0 (0.0%) | 6 (1.4%) |
| 5 to 17 Years | 0 (0.0%) | 0 (0.0%) |
| 18 to 34 Years | 0 (0.0%) | 20 (1.0%) |
| 35 to 64 Years | 33 (0.9%) | 8 (0.2%) |
| 65 to 74 Years | 17 (3.1%) | 0 (0.0%) |
| 75 Years and over | 74 (16.6%) | 82 (16.1%) |
Disability Class: Vision Difficulty
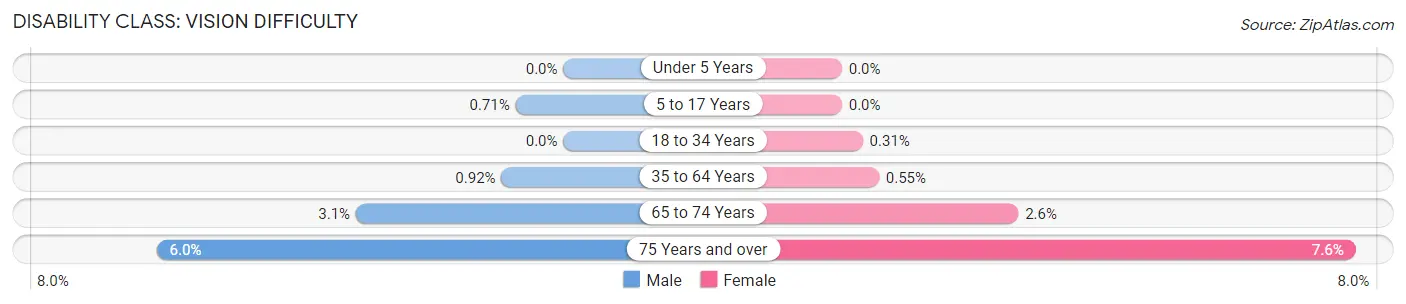
| Age Bracket | Male | Female |
| Under 5 Years | 0 (0.0%) | 0 (0.0%) |
| 5 to 17 Years | 10 (0.7%) | 0 (0.0%) |
| 18 to 34 Years | 0 (0.0%) | 6 (0.3%) |
| 35 to 64 Years | 33 (0.9%) | 19 (0.5%) |
| 65 to 74 Years | 17 (3.1%) | 16 (2.6%) |
| 75 Years and over | 27 (6.0%) | 39 (7.6%) |
Disability Class: Cognitive Difficulty
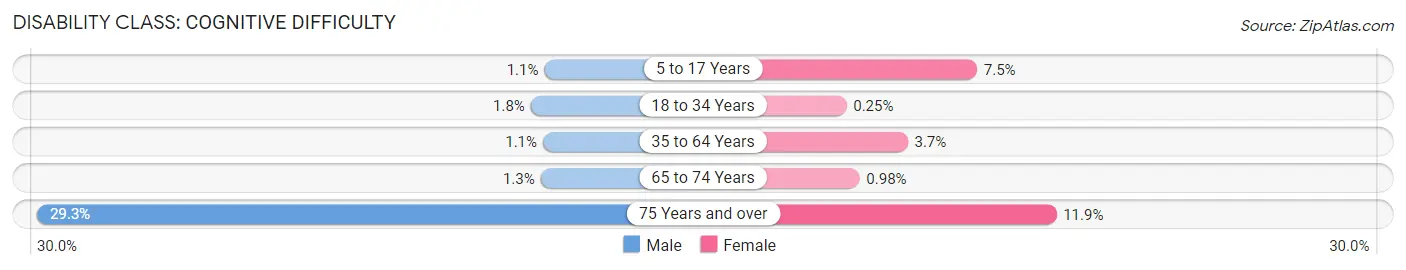
| Age Bracket | Male | Female |
| 5 to 17 Years | 15 (1.1%) | 108 (7.5%) |
| 18 to 34 Years | 43 (1.8%) | 5 (0.3%) |
| 35 to 64 Years | 41 (1.1%) | 127 (3.7%) |
| 65 to 74 Years | 7 (1.3%) | 6 (1.0%) |
| 75 Years and over | 131 (29.3%) | 61 (11.9%) |
Disability Class: Ambulatory Difficulty
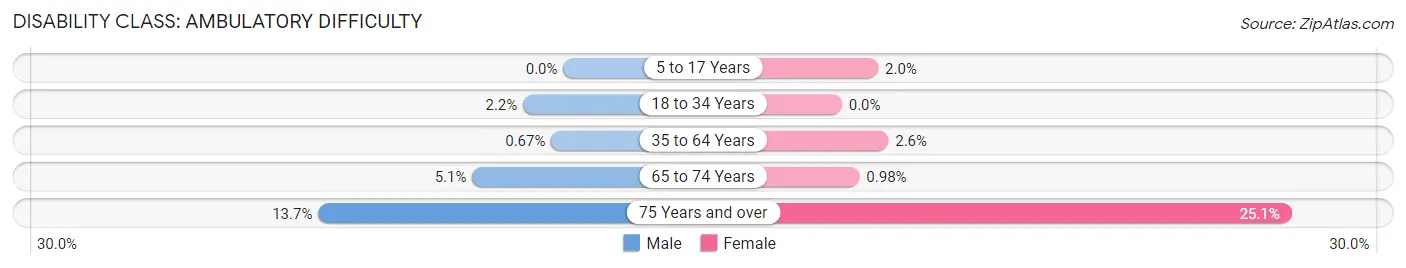
| Age Bracket | Male | Female |
| 5 to 17 Years | 0 (0.0%) | 29 (2.0%) |
| 18 to 34 Years | 53 (2.2%) | 0 (0.0%) |
| 35 to 64 Years | 24 (0.7%) | 90 (2.6%) |
| 65 to 74 Years | 28 (5.1%) | 6 (1.0%) |
| 75 Years and over | 61 (13.7%) | 128 (25.1%) |
Disability Class: Self-Care Difficulty
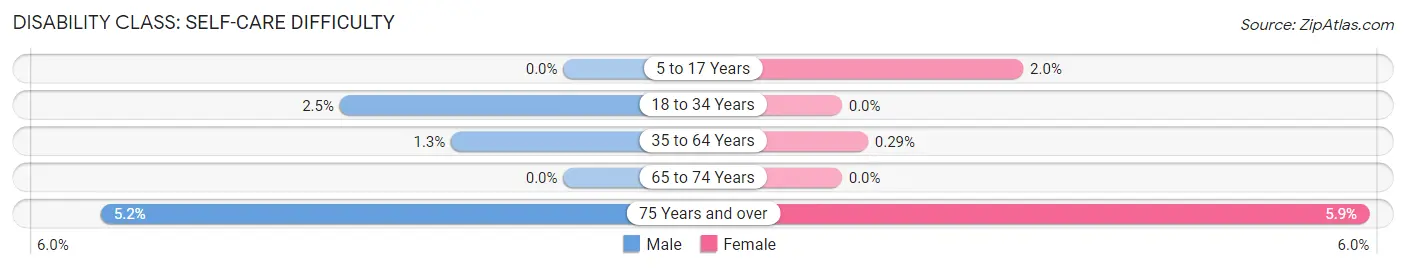
| Age Bracket | Male | Female |
| 5 to 17 Years | 0 (0.0%) | 29 (2.0%) |
| 18 to 34 Years | 59 (2.5%) | 0 (0.0%) |
| 35 to 64 Years | 45 (1.3%) | 10 (0.3%) |
| 65 to 74 Years | 0 (0.0%) | 0 (0.0%) |
| 75 Years and over | 23 (5.1%) | 30 (5.9%) |
Technology Access in El Segundo
Computing Device Access in El Segundo
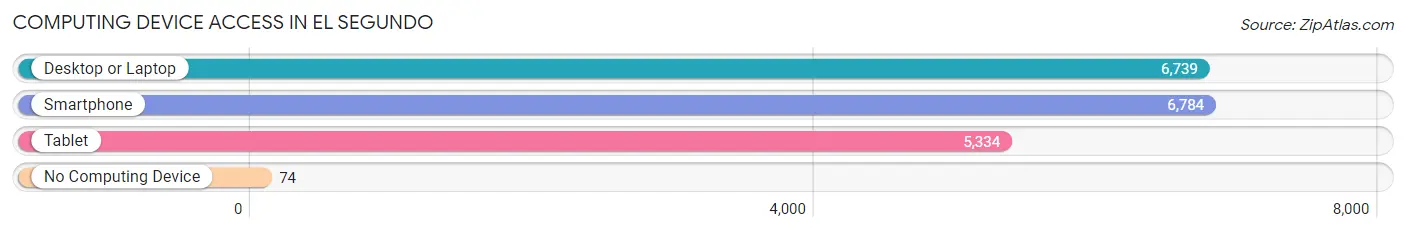
| Device Type | # Households | % Households |
| Desktop or Laptop | 6,739 | 95.3% |
| Smartphone | 6,784 | 95.9% |
| Tablet | 5,334 | 75.4% |
| No Computing Device | 74 | 1.1% |
| Total | 7,075 | 100.0% |
Internet Access in El Segundo
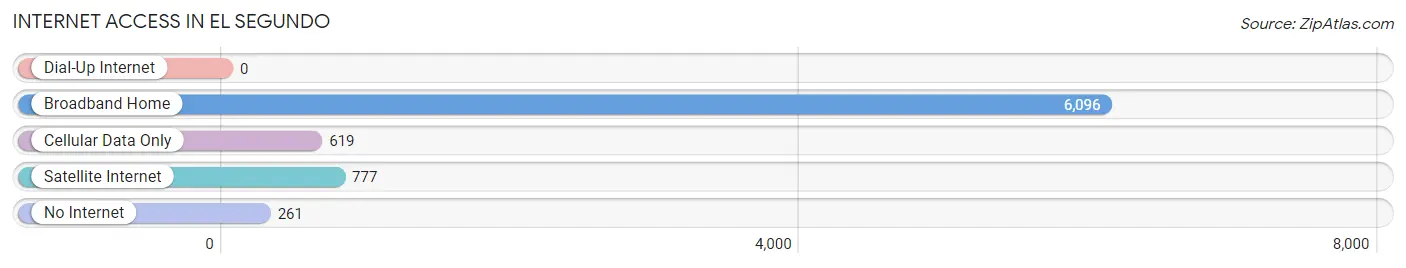
| Internet Type | # Households | % Households |
| Dial-Up Internet | 0 | 0.0% |
| Broadband Home | 6,096 | 86.2% |
| Cellular Data Only | 619 | 8.7% |
| Satellite Internet | 777 | 11.0% |
| No Internet | 261 | 3.7% |
| Total | 7,075 | 100.0% |
El Segundo Summary
History
The city of El Segundo, California is located in the southwestern corner of Los Angeles County, just south of the Los Angeles International Airport. The city was founded in 1912 by a group of investors led by Standard Oil executive Harry Culver. The city was named after the Spanish phrase “el segundo” which means “the second” in English. The name was chosen to reflect the fact that the city was the second oil refinery in the area.
The city of El Segundo was incorporated in 1917 and quickly became a popular destination for vacationers and business travelers. The city was home to a number of popular attractions, including the El Segundo Beach Hotel, the El Segundo Country Club, and the El Segundo Golf Course. The city also had a thriving business district, which included a number of banks, department stores, and other businesses.
In the 1950s, El Segundo began to experience a period of rapid growth. The city was home to a number of aerospace companies, including North American Aviation, which later became Rockwell International. The city also became home to a number of oil refineries, including the El Segundo Refinery, which is still in operation today.
In the 1970s, El Segundo began to experience a period of decline. The city’s population decreased as businesses moved away and the aerospace industry began to decline. However, the city has since experienced a resurgence in recent years, thanks to the growth of the technology industry in the area.
Geography
El Segundo is located in the southwestern corner of Los Angeles County, just south of the Los Angeles International Airport. The city is bordered by the cities of Manhattan Beach to the north, Hawthorne to the east, and Redondo Beach to the south. The city covers an area of 5.2 square miles and has a population of 16,654 as of the 2010 census.
The city is located on the Pacific Coast and is home to a number of beaches, including El Segundo Beach, Dockweiler Beach, and Manhattan Beach. The city is also home to a number of parks, including El Segundo Park, El Segundo Recreation Park, and El Segundo Nature Center.
Economy
El Segundo is home to a number of major employers, including Northrop Grumman, Raytheon, Boeing, and Mattel. The city is also home to a number of technology companies, including SpaceX, which is headquartered in the city.
The city’s economy is also supported by a number of small businesses, including restaurants, retail stores, and other services. The city is also home to a number of hotels, including the El Segundo Beach Hotel and the El Segundo Country Club.
Demographics
As of the 2010 census, El Segundo had a population of 16,654. The racial makeup of the city was 73.3% White, 8.2% African American, 0.5% Native American, 8.2% Asian, 0.2% Pacific Islander, and 8.6% from other races. Hispanic or Latino of any race were 22.3% of the population.
The median household income in El Segundo was $76,845 in 2017. The median home value was $817,400 in 2017. The median age of the city’s population was 37.7 years.
Conclusion
El Segundo is a city located in the southwestern corner of Los Angeles County, just south of the Los Angeles International Airport. The city was founded in 1912 and has since become a popular destination for vacationers and business travelers. The city is home to a number of major employers, including Northrop Grumman, Raytheon, Boeing, and Mattel. The city’s economy is also supported by a number of small businesses, including restaurants, retail stores, and other services. The city has a population of 16,654 as of the 2010 census and a median household income of $76,845 in 2017.
Common Questions
What is the Total Population of El Segundo?
Total Population of El Segundo is 17,081.
What is the Total Male Population of El Segundo?
Total Male Population of El Segundo is 8,662.
What is the Total Female Population of El Segundo?
Total Female Population of El Segundo is 8,419.
What is the Ratio of Males per 100 Females in El Segundo?
There are 102.89 Males per 100 Females in El Segundo.
What is the Ratio of Females per 100 Males in El Segundo?
There are 97.19 Females per 100 Males in El Segundo.
What is the Median Population Age in El Segundo?
Median Population Age in El Segundo is 36.4 Years.
What is the Average Family Size in El Segundo
Average Family Size in El Segundo is 3.0 People.
What is the Average Household Size in El Segundo
Average Household Size in El Segundo is 2.4 People.
What is Per Capita Income in El Segundo?
Per Capita income in El Segundo is $74,872.
What is the Median Family Income in El Segundo?
Median Family Income in El Segundo is $173,714.
What is the Median Household income in El Segundo?
Median Household Income in El Segundo is $142,596.
What is Income or Wage Gap in El Segundo?
Income or Wage Gap in El Segundo is 24.2%.
Women in El Segundo earn 75.8 cents for every dollar earned by a man.
What is Inequality or Gini Index in El Segundo?
Inequality or Gini Index in El Segundo is 0.43.
How Large is the Labor Force in El Segundo?
There are 10,538 People in the Labor Forcein in El Segundo.
What is the Percentage of People in the Labor Force in El Segundo?
76.2% of People are in the Labor Force in El Segundo.
What is the Unemployment Rate in El Segundo?
Unemployment Rate in El Segundo is 5.4%.