East Porterville, CA
East Porterville Map
East Porterville Overview
5,424
TOTAL POPULATION
2,840
MALE POPULATION
2,584
FEMALE POPULATION
109.91
MALES / 100 FEMALES
90.99
FEMALES / 100 MALES
28.3
MEDIAN AGE
4.9
AVG FAMILY SIZE
4.3
AVG HOUSEHOLD SIZE
$12,588
PER CAPITA INCOME
$35,606
AVG FAMILY INCOME
$31,816
AVG HOUSEHOLD INCOME
6.2%
WAGE / INCOME GAP [ % ]
93.8¢/ $1
WAGE / INCOME GAP [ $ ]
$9,225
FAMILY INCOME DEFICIT
0.48
INEQUALITY / GINI INDEX
2,127
LABOR FORCE [ PEOPLE ]
55.0%
PERCENT IN LABOR FORCE
25.4%
UNEMPLOYMENT RATE
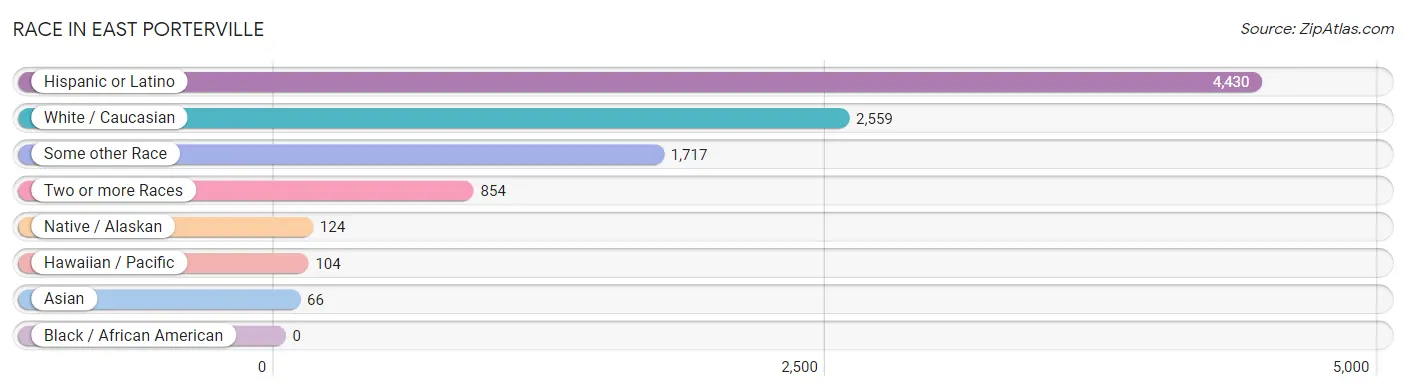
Race in East Porterville
The most populous races in East Porterville are Hispanic or Latino (4,430 | 81.7%), White / Caucasian (2,559 | 47.2%), and Some other Race (1,717 | 31.7%).
| Race | # Population | % Population |
| Asian | 66 | 1.2% |
| Black / African American | 0 | 0.0% |
| Hawaiian / Pacific | 104 | 1.9% |
| Hispanic or Latino | 4,430 | 81.7% |
| Native / Alaskan | 124 | 2.3% |
| White / Caucasian | 2,559 | 47.2% |
| Two or more Races | 854 | 15.7% |
| Some other Race | 1,717 | 31.7% |
| Total | 5,424 | 100.0% |
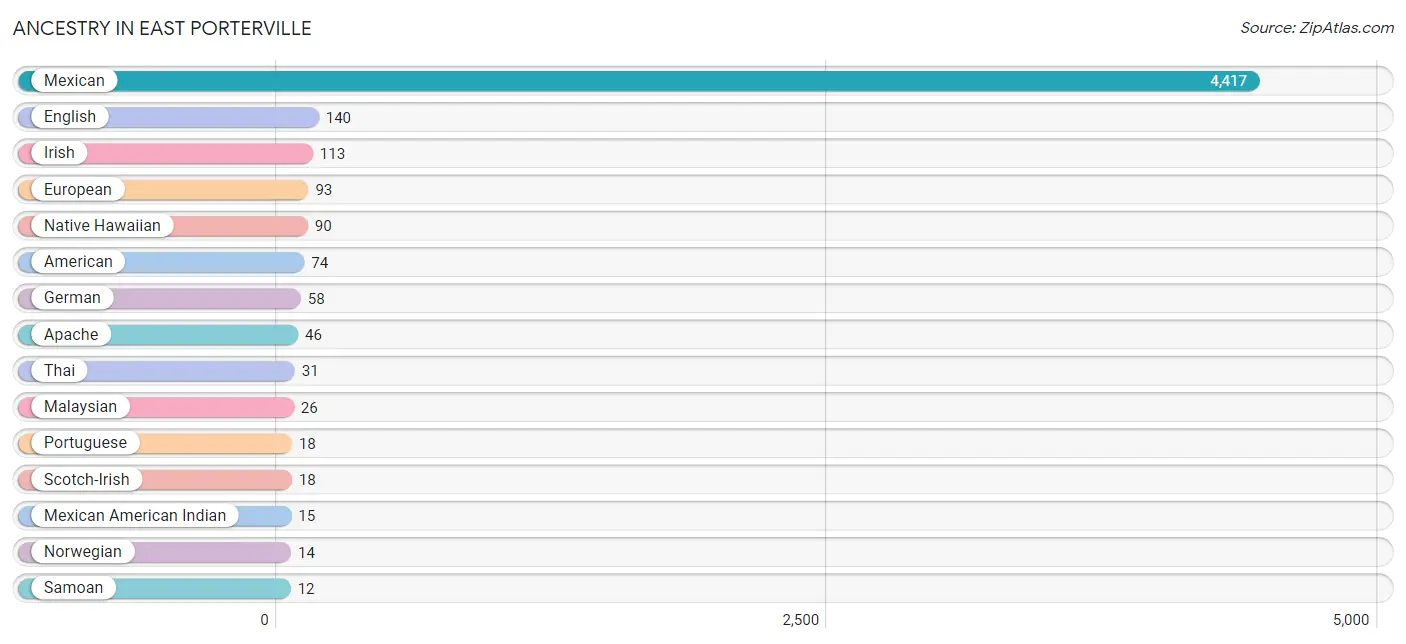
Ancestry in East Porterville
The most populous ancestries reported in East Porterville are Mexican (4,417 | 81.4%), English (140 | 2.6%), Irish (113 | 2.1%), European (93 | 1.7%), and Native Hawaiian (90 | 1.7%), together accounting for 89.5% of all East Porterville residents.
| Ancestry | # Population | % Population |
| American | 74 | 1.4% |
| Apache | 46 | 0.9% |
| Bangladeshi | 5 | 0.1% |
| Blackfeet | 11 | 0.2% |
| Burmese | 4 | 0.1% |
| Central American | 9 | 0.2% |
| Croatian | 3 | 0.1% |
| Dutch | 8 | 0.2% |
| English | 140 | 2.6% |
| European | 93 | 1.7% |
| French American Indian | 8 | 0.2% |
| German | 58 | 1.1% |
| Irish | 113 | 2.1% |
| Italian | 2 | 0.0% |
| Malaysian | 26 | 0.5% |
| Mexican | 4,417 | 81.4% |
| Mexican American Indian | 15 | 0.3% |
| Native Hawaiian | 90 | 1.7% |
| Norwegian | 14 | 0.3% |
| Polish | 3 | 0.1% |
| Portuguese | 18 | 0.3% |
| Salvadoran | 9 | 0.2% |
| Samoan | 12 | 0.2% |
| Scandinavian | 3 | 0.1% |
| Scotch-Irish | 18 | 0.3% |
| Scottish | 10 | 0.2% |
| Thai | 31 | 0.6% |
| Welsh | 7 | 0.1% | View All 28 Rows |
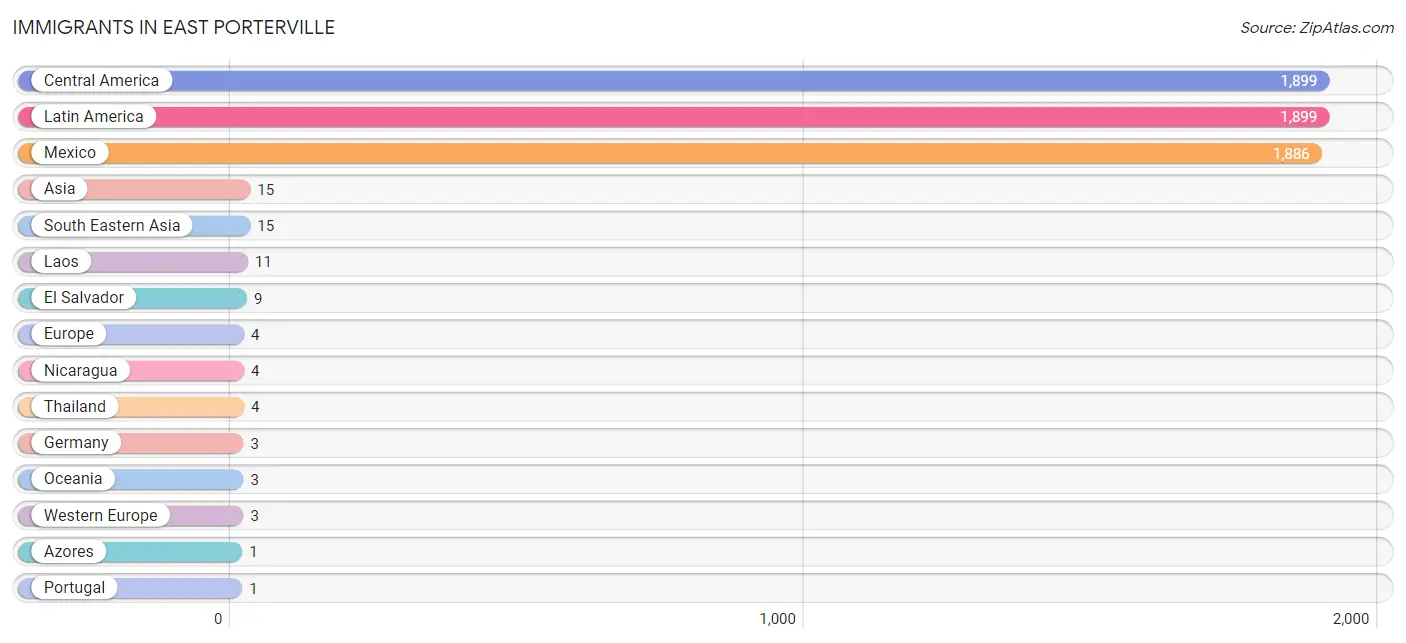
Immigrants in East Porterville
The most numerous immigrant groups reported in East Porterville came from Central America (1,899 | 35.0%), Latin America (1,899 | 35.0%), Mexico (1,886 | 34.8%), Asia (15 | 0.3%), and South Eastern Asia (15 | 0.3%), together accounting for 105.3% of all East Porterville residents.
| Immigration Origin | # Population | % Population |
| Asia | 15 | 0.3% |
| Azores | 1 | 0.0% |
| Central America | 1,899 | 35.0% |
| El Salvador | 9 | 0.2% |
| Europe | 4 | 0.1% |
| Germany | 3 | 0.1% |
| Laos | 11 | 0.2% |
| Latin America | 1,899 | 35.0% |
| Mexico | 1,886 | 34.8% |
| Nicaragua | 4 | 0.1% |
| Oceania | 3 | 0.1% |
| Portugal | 1 | 0.0% |
| South Eastern Asia | 15 | 0.3% |
| Southern Europe | 1 | 0.0% |
| Thailand | 4 | 0.1% |
| Western Europe | 3 | 0.1% | View All 16 Rows |
Sex and Age in East Porterville
Sex and Age in East Porterville
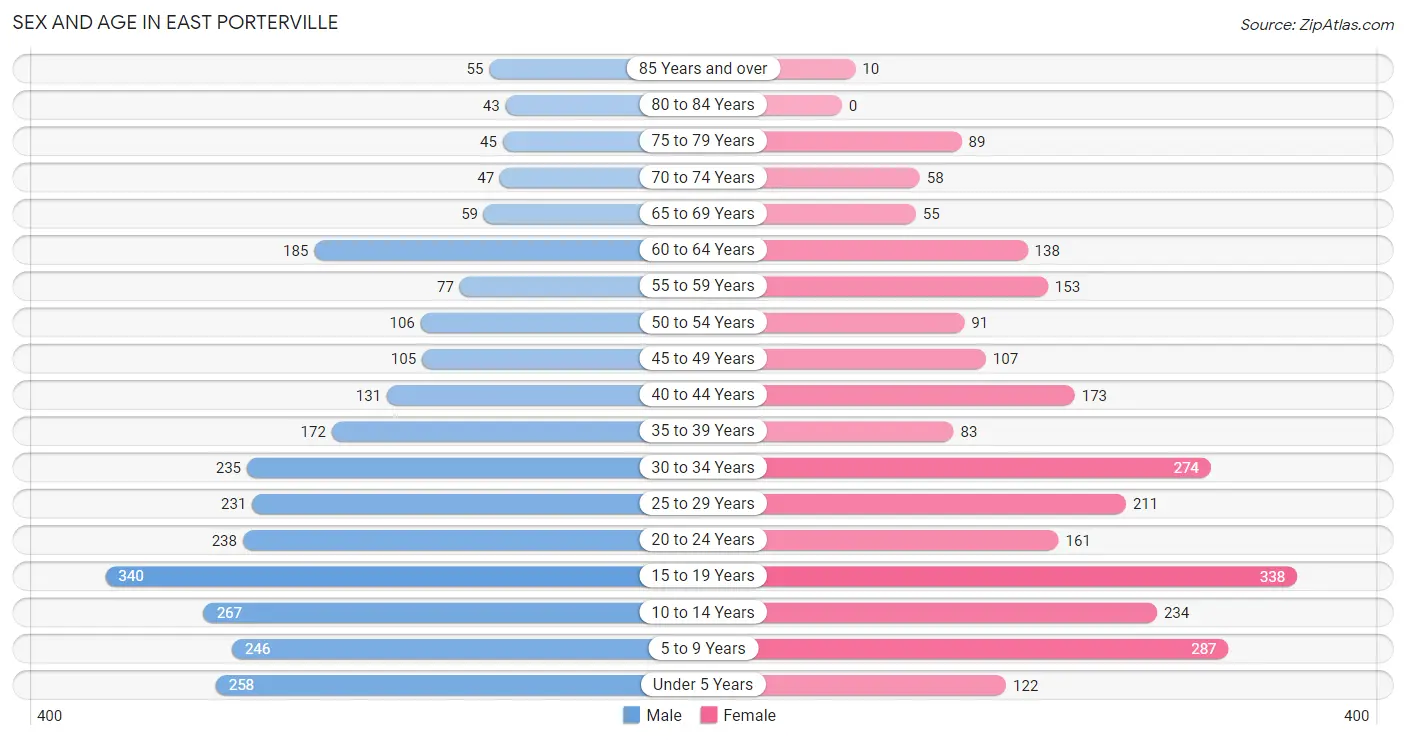
The most populous age groups in East Porterville are 15 to 19 Years (340 | 12.0%) for men and 15 to 19 Years (338 | 13.1%) for women.
| Age Bracket | Male | Female |
| Under 5 Years | 258 (9.1%) | 122 (4.7%) |
| 5 to 9 Years | 246 (8.7%) | 287 (11.1%) |
| 10 to 14 Years | 267 (9.4%) | 234 (9.1%) |
| 15 to 19 Years | 340 (12.0%) | 338 (13.1%) |
| 20 to 24 Years | 238 (8.4%) | 161 (6.2%) |
| 25 to 29 Years | 231 (8.1%) | 211 (8.2%) |
| 30 to 34 Years | 235 (8.3%) | 274 (10.6%) |
| 35 to 39 Years | 172 (6.1%) | 83 (3.2%) |
| 40 to 44 Years | 131 (4.6%) | 173 (6.7%) |
| 45 to 49 Years | 105 (3.7%) | 107 (4.1%) |
| 50 to 54 Years | 106 (3.7%) | 91 (3.5%) |
| 55 to 59 Years | 77 (2.7%) | 153 (5.9%) |
| 60 to 64 Years | 185 (6.5%) | 138 (5.3%) |
| 65 to 69 Years | 59 (2.1%) | 55 (2.1%) |
| 70 to 74 Years | 47 (1.7%) | 58 (2.2%) |
| 75 to 79 Years | 45 (1.6%) | 89 (3.4%) |
| 80 to 84 Years | 43 (1.5%) | 0 (0.0%) |
| 85 Years and over | 55 (1.9%) | 10 (0.4%) |
| Total | 2,840 (100.0%) | 2,584 (100.0%) |
Families and Households in East Porterville
Median Family Size in East Porterville
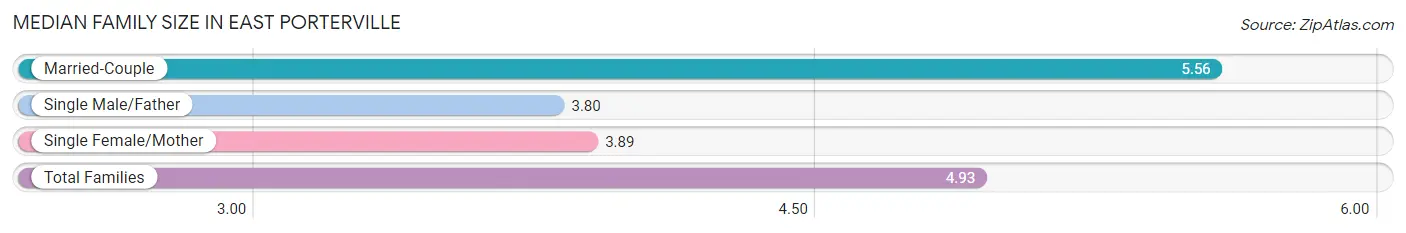
The median family size in East Porterville is 4.93 persons per family, with married-couple families (619 | 63.0%) accounting for the largest median family size of 5.56 persons per family. On the other hand, single male/father families (122 | 12.4%) represent the smallest median family size with 3.80 persons per family.
| Family Type | # Families | Family Size |
| Married-Couple | 619 (63.0%) | 5.56 |
| Single Male/Father | 122 (12.4%) | 3.80 |
| Single Female/Mother | 241 (24.5%) | 3.89 |
| Total Families | 982 (100.0%) | 4.93 |
Median Household Size in East Porterville
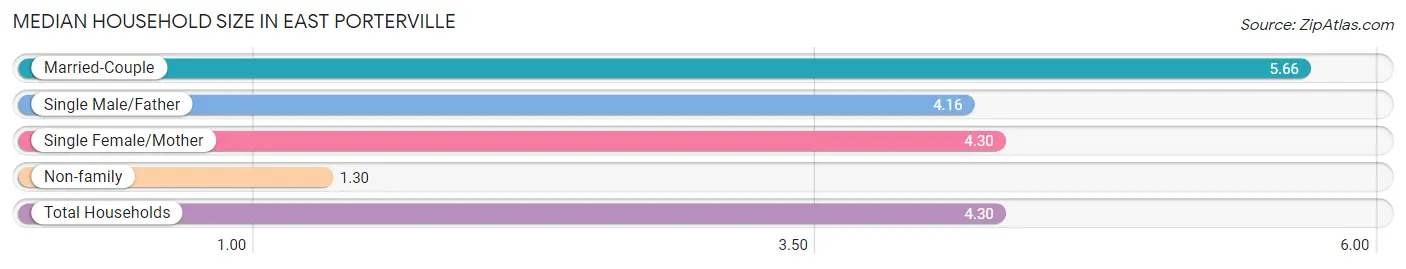
The median household size in East Porterville is 4.30 persons per household, with married-couple households (619 | 49.2%) accounting for the largest median household size of 5.66 persons per household. non-family households (276 | 21.9%) represent the smallest median household size with 1.30 persons per household.
| Household Type | # Households | Household Size |
| Married-Couple | 619 (49.2%) | 5.66 |
| Single Male/Father | 122 (9.7%) | 4.16 |
| Single Female/Mother | 241 (19.2%) | 4.30 |
| Non-family | 276 (21.9%) | 1.30 |
| Total Households | 1,258 (100.0%) | 4.30 |
Household Size by Marriage Status in East Porterville
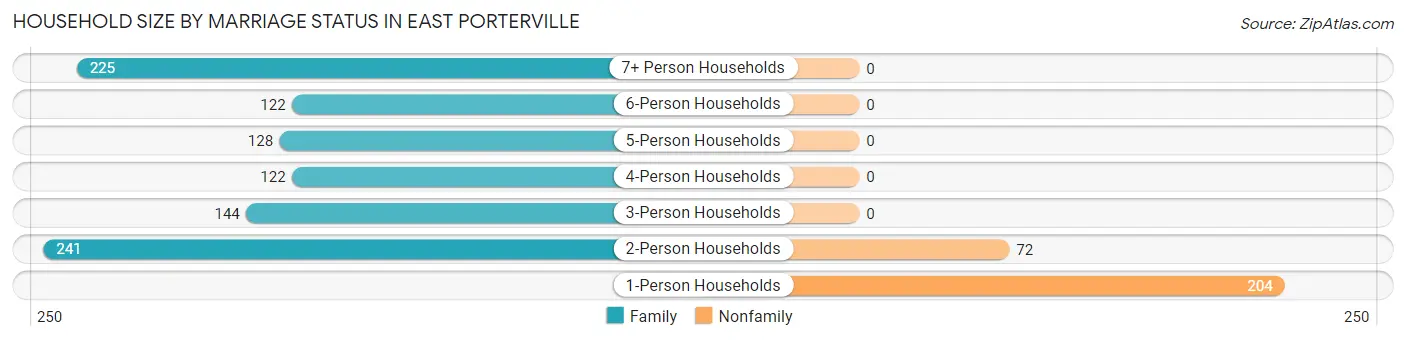
Out of a total of 1,258 households in East Porterville, 982 (78.1%) are family households, while 276 (21.9%) are nonfamily households. The most numerous type of family households are 2-person households, comprising 241, and the most common type of nonfamily households are 1-person households, comprising 204.
| Household Size | Family Households | Nonfamily Households |
| 1-Person Households | - | 204 (16.2%) |
| 2-Person Households | 241 (19.2%) | 72 (5.7%) |
| 3-Person Households | 144 (11.5%) | 0 (0.0%) |
| 4-Person Households | 122 (9.7%) | 0 (0.0%) |
| 5-Person Households | 128 (10.2%) | 0 (0.0%) |
| 6-Person Households | 122 (9.7%) | 0 (0.0%) |
| 7+ Person Households | 225 (17.9%) | 0 (0.0%) |
| Total | 982 (78.1%) | 276 (21.9%) |
Female Fertility in East Porterville
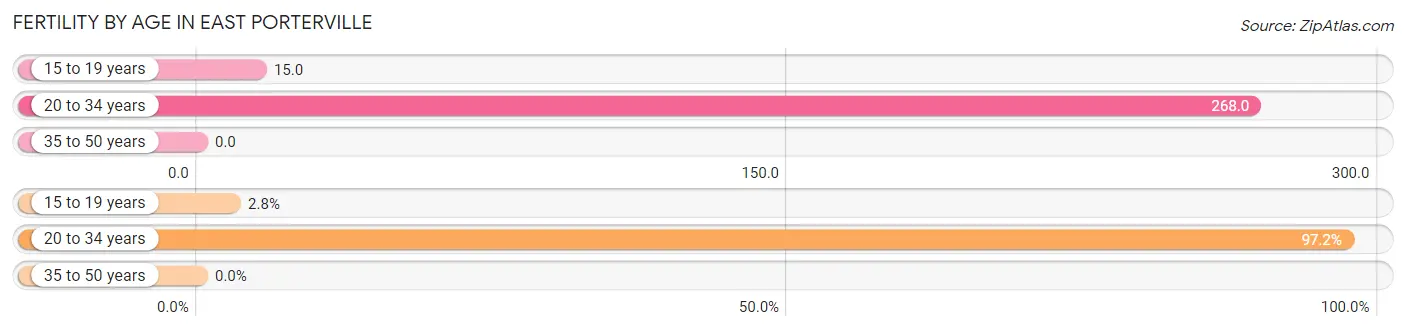
Fertility by Age in East Porterville
Average fertility rate in East Porterville is 131.0 births per 1,000 women. Women in the age bracket of 20 to 34 years have the highest fertility rate with 268.0 births per 1,000 women. Women in the age bracket of 20 to 34 years acount for 97.2% of all women with births.
| Age Bracket | Women with Births | Births / 1,000 Women |
| 15 to 19 years | 5 (2.8%) | 15.0 |
| 20 to 34 years | 173 (97.2%) | 268.0 |
| 35 to 50 years | 0 (0.0%) | 0.0 |
| Total | 178 (100.0%) | 131.0 |
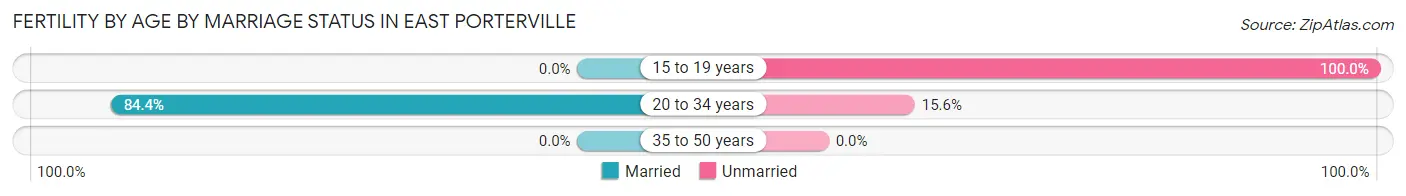
Fertility by Age by Marriage Status in East Porterville
82.0% of women with births (178) in East Porterville are married. The highest percentage of unmarried women with births falls into 15 to 19 years age bracket with 100.0% of them unmarried at the time of birth, while the lowest percentage of unmarried women with births belong to 20 to 34 years age bracket with 15.6% of them unmarried.
| Age Bracket | Married | Unmarried |
| 15 to 19 years | 0 (0.0%) | 5 (100.0%) |
| 20 to 34 years | 146 (84.4%) | 27 (15.6%) |
| 35 to 50 years | 0 (0.0%) | 0 (0.0%) |
| Total | 146 (82.0%) | 32 (18.0%) |
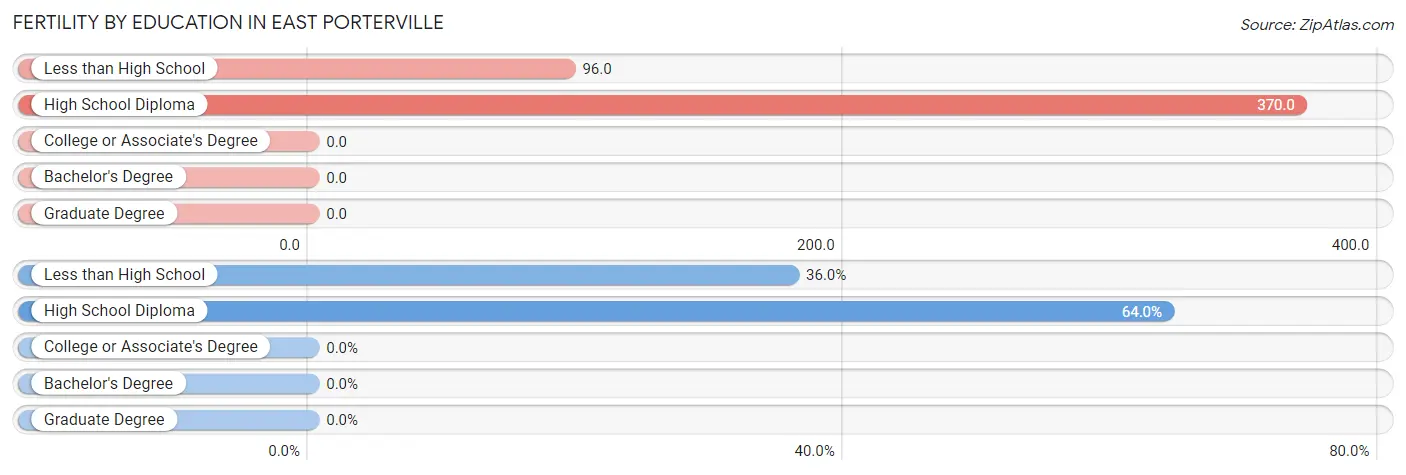
Fertility by Education in East Porterville
| Educational Attainment | Women with Births | Births / 1,000 Women |
| Less than High School | 64 (36.0%) | 96.0 |
| High School Diploma | 114 (64.0%) | 370.0 |
| College or Associate's Degree | 0 (0.0%) | 0.0 |
| Bachelor's Degree | 0 (0.0%) | 0.0 |
| Graduate Degree | 0 (0.0%) | 0.0 |
| Total | 178 (100.0%) | 131.0 |
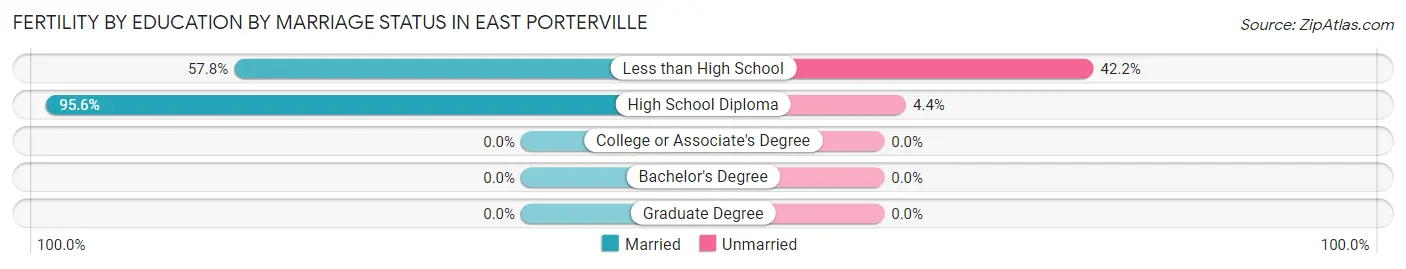
Fertility by Education by Marriage Status in East Porterville
18.0% of women with births in East Porterville are unmarried. Women with the educational attainment of high school diploma are most likely to be married with 95.6% of them married at childbirth, while women with the educational attainment of less than high school are least likely to be married with 42.2% of them unmarried at childbirth.
| Educational Attainment | Married | Unmarried |
| Less than High School | 37 (57.8%) | 27 (42.2%) |
| High School Diploma | 109 (95.6%) | 5 (4.4%) |
| College or Associate's Degree | 0 (0.0%) | 0 (0.0%) |
| Bachelor's Degree | 0 (0.0%) | 0 (0.0%) |
| Graduate Degree | 0 (0.0%) | 0 (0.0%) |
| Total | 146 (82.0%) | 32 (18.0%) |
Income in East Porterville
Income Overview in East Porterville
Per Capita Income in East Porterville is $12,588, while median incomes of families and households are $35,606 and $31,816 respectively.
| Characteristic | Number | Measure |
| Per Capita Income | 5,424 | $12,588 |
| Median Family Income | 982 | $35,606 |
| Mean Family Income | 982 | $57,945 |
| Median Household Income | 1,258 | $31,816 |
| Mean Household Income | 1,258 | $51,579 |
| Income Deficit | 982 | $9,225 |
| Wage / Income Gap (%) | 5,424 | 6.22% |
| Wage / Income Gap ($) | 5,424 | 93.78¢ per $1 |
| Gini / Inequality Index | 5,424 | 0.48 |
Earnings by Sex in East Porterville
Average Earnings in East Porterville are $16,951, $16,617 for men and $17,720 for women, a difference of 6.2%.
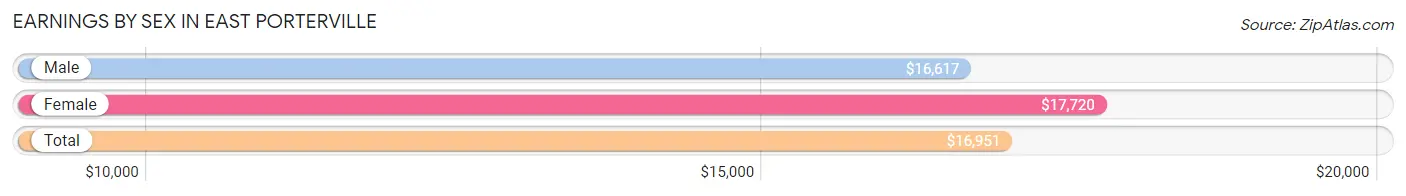
| Sex | Number | Average Earnings |
| Male | 1,354 (61.0%) | $16,617 |
| Female | 865 (39.0%) | $17,720 |
| Total | 2,219 (100.0%) | $16,951 |
Earnings by Sex by Income Bracket in East Porterville
The most common earnings brackets in East Porterville are $15,000 to $17,499 for men (150 | 11.1%) and $17,500 to $19,999 for women (108 | 12.5%).
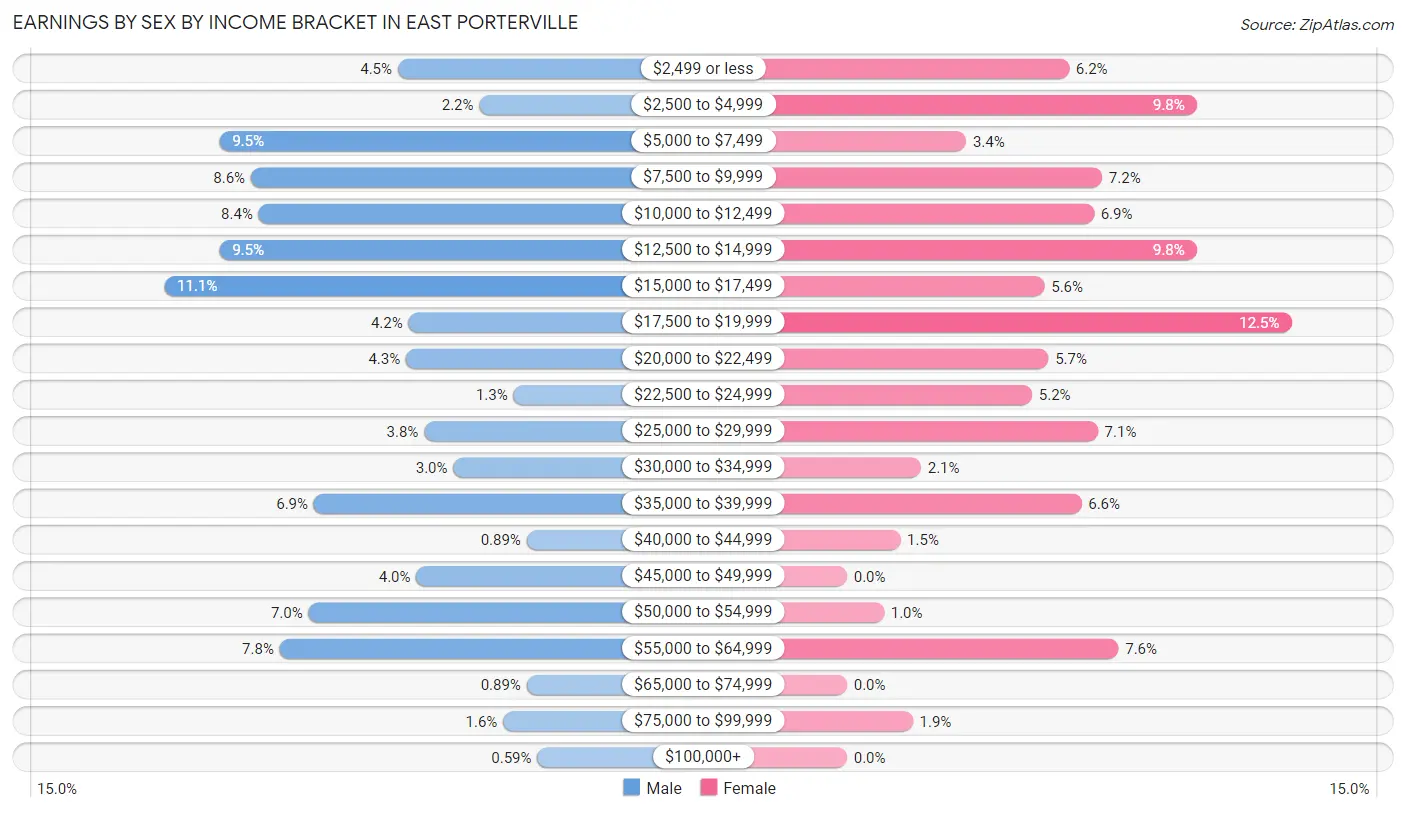
| Income | Male | Female |
| $2,499 or less | 61 (4.5%) | 54 (6.2%) |
| $2,500 to $4,999 | 30 (2.2%) | 85 (9.8%) |
| $5,000 to $7,499 | 129 (9.5%) | 29 (3.4%) |
| $7,500 to $9,999 | 117 (8.6%) | 62 (7.2%) |
| $10,000 to $12,499 | 114 (8.4%) | 60 (6.9%) |
| $12,500 to $14,999 | 129 (9.5%) | 85 (9.8%) |
| $15,000 to $17,499 | 150 (11.1%) | 48 (5.6%) |
| $17,500 to $19,999 | 57 (4.2%) | 108 (12.5%) |
| $20,000 to $22,499 | 58 (4.3%) | 49 (5.7%) |
| $22,500 to $24,999 | 17 (1.3%) | 45 (5.2%) |
| $25,000 to $29,999 | 51 (3.8%) | 61 (7.0%) |
| $30,000 to $34,999 | 40 (2.9%) | 18 (2.1%) |
| $35,000 to $39,999 | 93 (6.9%) | 57 (6.6%) |
| $40,000 to $44,999 | 12 (0.9%) | 13 (1.5%) |
| $45,000 to $49,999 | 54 (4.0%) | 0 (0.0%) |
| $50,000 to $54,999 | 95 (7.0%) | 9 (1.0%) |
| $55,000 to $64,999 | 106 (7.8%) | 66 (7.6%) |
| $65,000 to $74,999 | 12 (0.9%) | 0 (0.0%) |
| $75,000 to $99,999 | 21 (1.5%) | 16 (1.8%) |
| $100,000+ | 8 (0.6%) | 0 (0.0%) |
| Total | 1,354 (100.0%) | 865 (100.0%) |
Earnings by Sex by Educational Attainment in East Porterville
Average earnings in East Porterville are $18,966 for men and $18,461 for women, a difference of 2.7%. Men with an educational attainment of college or associate's degree enjoy the highest average annual earnings of $32,083, while those with high school diploma education earn the least with $13,491. Women with an educational attainment of bachelor's degree earn the most with the average annual earnings of $23,929, while those with less than high school education have the smallest earnings of $15,658.
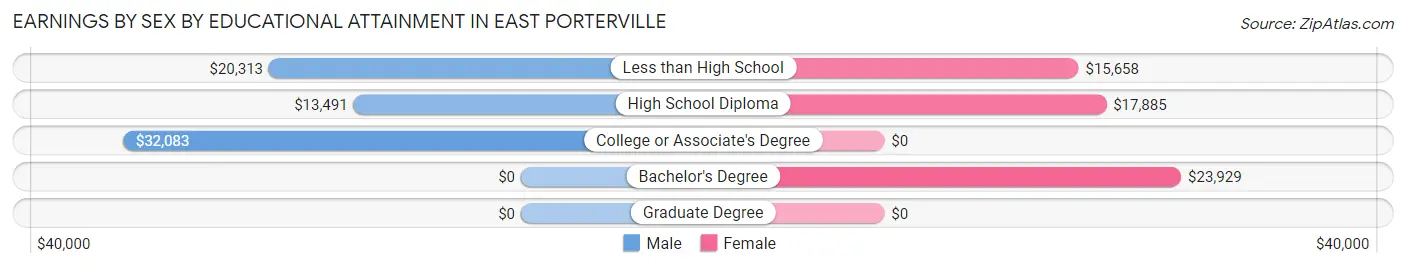
| Educational Attainment | Male Income | Female Income |
| Less than High School | $20,313 | $15,658 |
| High School Diploma | $13,491 | $17,885 |
| College or Associate's Degree | $32,083 | $0 |
| Bachelor's Degree | - | - |
| Graduate Degree | - | - |
| Total | $18,966 | $18,461 |
Family Income in East Porterville
Family Income Brackets in East Porterville
According to the East Porterville family income data, there are 215 families falling into the $25,000 to $34,999 income range, which is the most common income bracket and makes up 21.9% of all families. Conversely, the $200,000+ income bracket is the least frequent group with only 12 families (1.2%) belonging to this category.
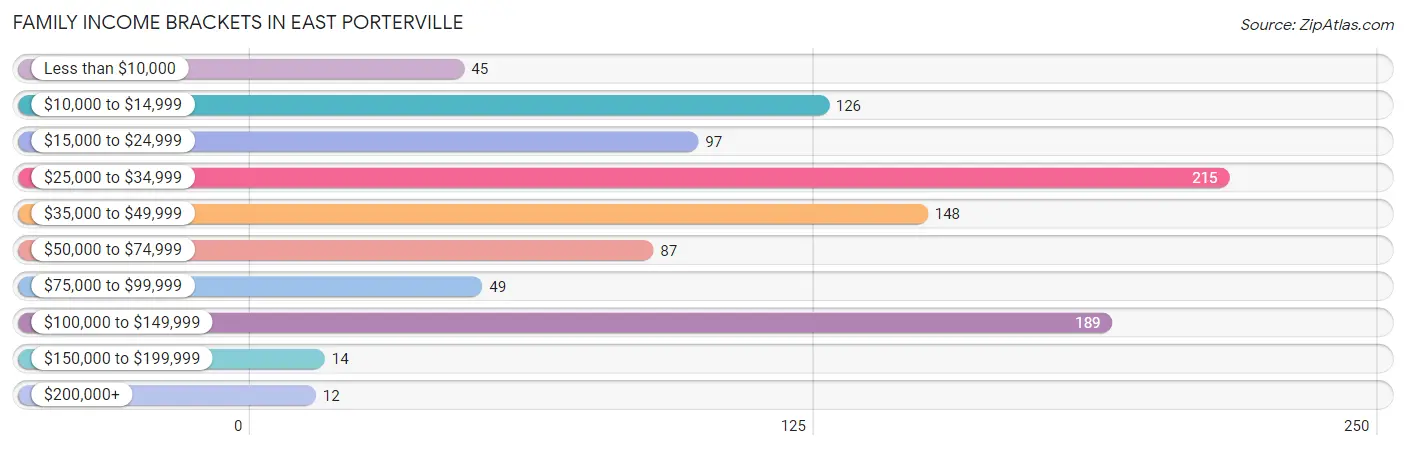
| Income Bracket | # Families | % Families |
| Less than $10,000 | 45 | 4.6% |
| $10,000 to $14,999 | 126 | 12.8% |
| $15,000 to $24,999 | 97 | 9.9% |
| $25,000 to $34,999 | 215 | 21.9% |
| $35,000 to $49,999 | 148 | 15.1% |
| $50,000 to $74,999 | 87 | 8.9% |
| $75,000 to $99,999 | 49 | 5.0% |
| $100,000 to $149,999 | 189 | 19.2% |
| $150,000 to $199,999 | 14 | 1.4% |
| $200,000+ | 12 | 1.2% |
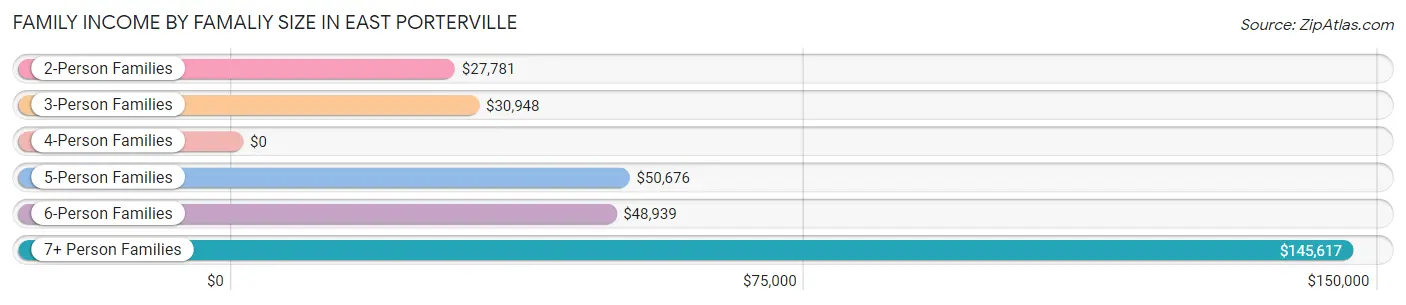
Family Income by Famaliy Size in East Porterville
7+ person families (205 | 20.9%) account for the highest median family income in East Porterville with $145,617 per family, while 7+ person families (205 | 20.9%) have the highest median income of $20,802 per family member.
| Income Bracket | # Families | Median Income |
| 2-Person Families | 277 (28.2%) | $27,781 |
| 3-Person Families | 108 (11.0%) | $30,948 |
| 4-Person Families | 188 (19.1%) | $0 |
| 5-Person Families | 92 (9.4%) | $50,676 |
| 6-Person Families | 112 (11.4%) | $48,939 |
| 7+ Person Families | 205 (20.9%) | $145,617 |
| Total | 982 (100.0%) | $35,606 |
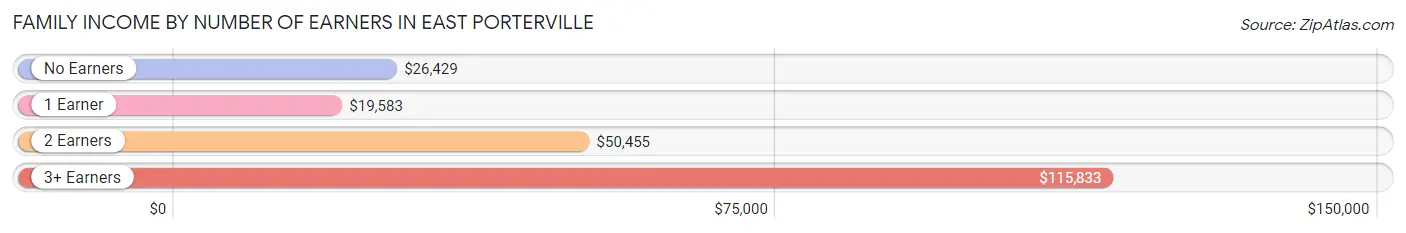
Family Income by Number of Earners in East Porterville
The median family income in East Porterville is $35,606, with families comprising 3+ earners (290) having the highest median family income of $115,833, while families with 1 earner (258) have the lowest median family income of $19,583, accounting for 29.5% and 26.3% of families, respectively.
| Number of Earners | # Families | Median Income |
| No Earners | 158 (16.1%) | $26,429 |
| 1 Earner | 258 (26.3%) | $19,583 |
| 2 Earners | 276 (28.1%) | $50,455 |
| 3+ Earners | 290 (29.5%) | $115,833 |
| Total | 982 (100.0%) | $35,606 |
Household Income in East Porterville
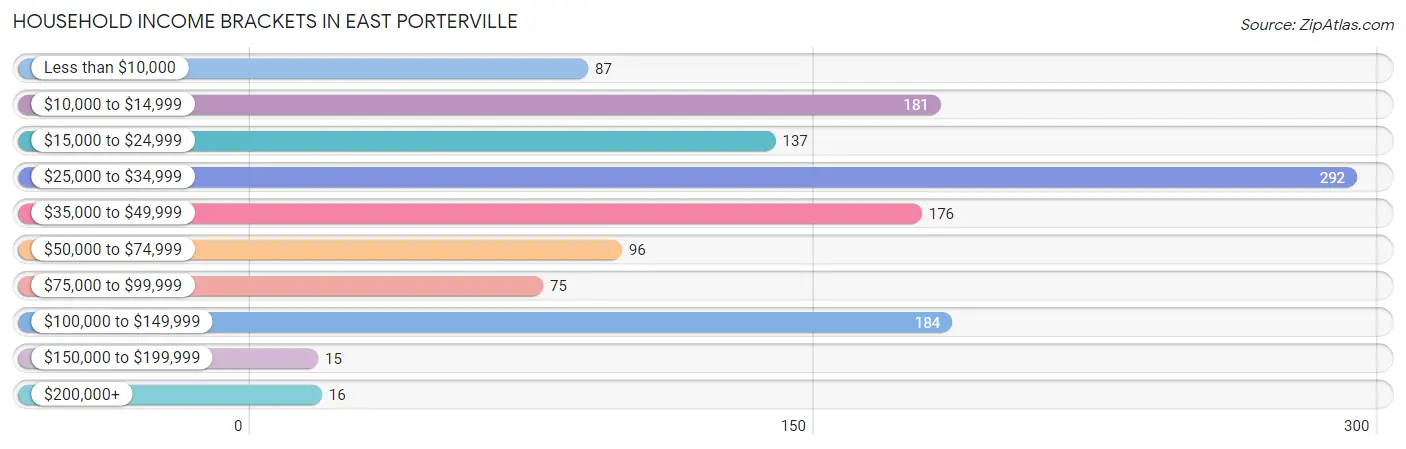
Household Income Brackets in East Porterville
With 292 households falling in the category, the $25,000 to $34,999 income range is the most frequent in East Porterville, accounting for 23.2% of all households. In contrast, only 15 households (1.2%) fall into the $150,000 to $199,999 income bracket, making it the least populous group.
| Income Bracket | # Households | % Households |
| Less than $10,000 | 87 | 6.9% |
| $10,000 to $14,999 | 181 | 14.4% |
| $15,000 to $24,999 | 137 | 10.9% |
| $25,000 to $34,999 | 292 | 23.2% |
| $35,000 to $49,999 | 176 | 14.0% |
| $50,000 to $74,999 | 96 | 7.6% |
| $75,000 to $99,999 | 75 | 6.0% |
| $100,000 to $149,999 | 184 | 14.6% |
| $150,000 to $199,999 | 15 | 1.2% |
| $200,000+ | 16 | 1.3% |
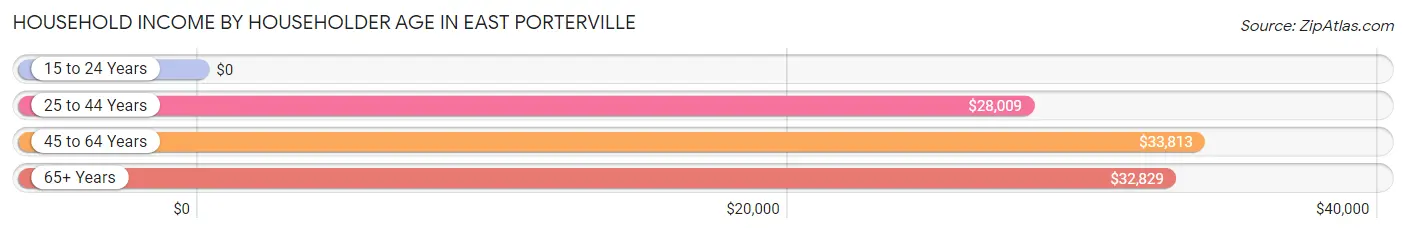
Household Income by Householder Age in East Porterville
The median household income in East Porterville is $31,816, with the highest median household income of $33,813 found in the 45 to 64 years age bracket for the primary householder. A total of 491 households (39.0%) fall into this category. Meanwhile, the 15 to 24 years age bracket for the primary householder has the lowest median household income of $0, with 17 households (1.3%) in this group.
| Income Bracket | # Households | Median Income |
| 15 to 24 Years | 17 (1.3%) | $0 |
| 25 to 44 Years | 533 (42.4%) | $28,009 |
| 45 to 64 Years | 491 (39.0%) | $33,813 |
| 65+ Years | 217 (17.2%) | $32,829 |
| Total | 1,258 (100.0%) | $31,816 |
Poverty in East Porterville
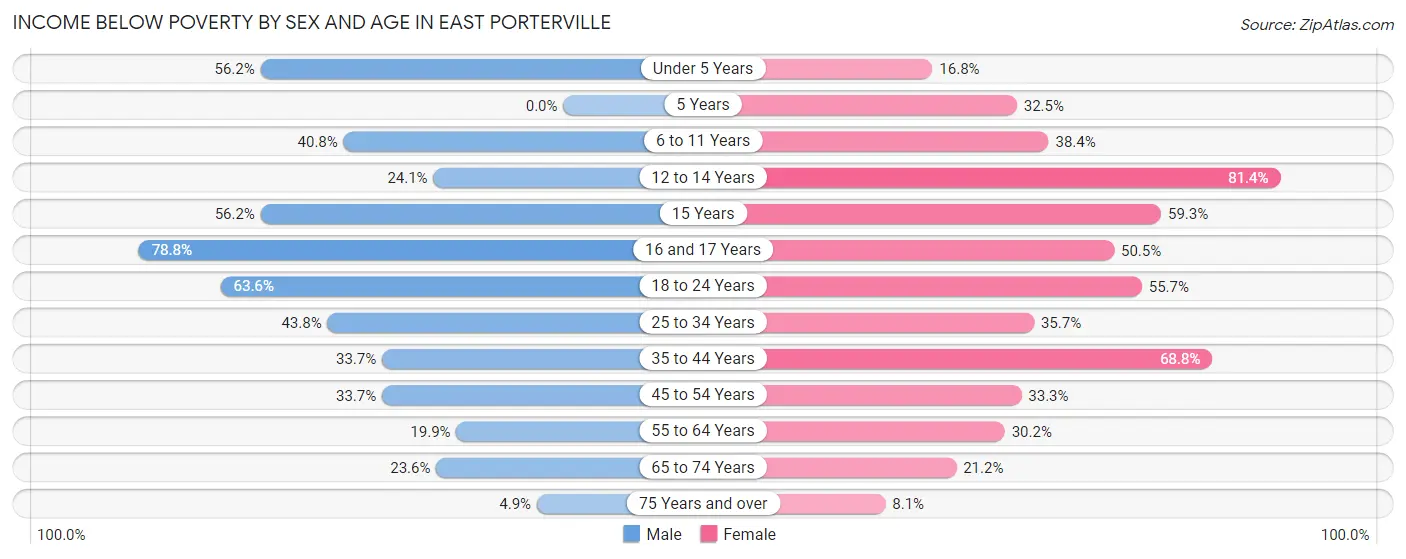
Income Below Poverty by Sex and Age in East Porterville
With 40.7% poverty level for males and 42.9% for females among the residents of East Porterville, 16 and 17 year old males and 12 to 14 year old females are the most vulnerable to poverty, with 119 males (78.8%) and 153 females (81.4%) in their respective age groups living below the poverty level.
| Age Bracket | Male | Female |
| Under 5 Years | 145 (56.2%) | 18 (16.8%) |
| 5 Years | 0 (0.0%) | 38 (32.5%) |
| 6 to 11 Years | 135 (40.8%) | 71 (38.4%) |
| 12 to 14 Years | 27 (24.1%) | 153 (81.4%) |
| 15 Years | 50 (56.2%) | 32 (59.3%) |
| 16 and 17 Years | 119 (78.8%) | 47 (50.5%) |
| 18 to 24 Years | 215 (63.6%) | 196 (55.7%) |
| 25 to 34 Years | 204 (43.8%) | 173 (35.7%) |
| 35 to 44 Years | 102 (33.7%) | 176 (68.8%) |
| 45 to 54 Years | 71 (33.7%) | 66 (33.3%) |
| 55 to 64 Years | 52 (19.9%) | 88 (30.2%) |
| 65 to 74 Years | 25 (23.6%) | 24 (21.2%) |
| 75 Years and over | 7 (4.9%) | 8 (8.1%) |
| Total | 1,152 (40.7%) | 1,090 (42.9%) |
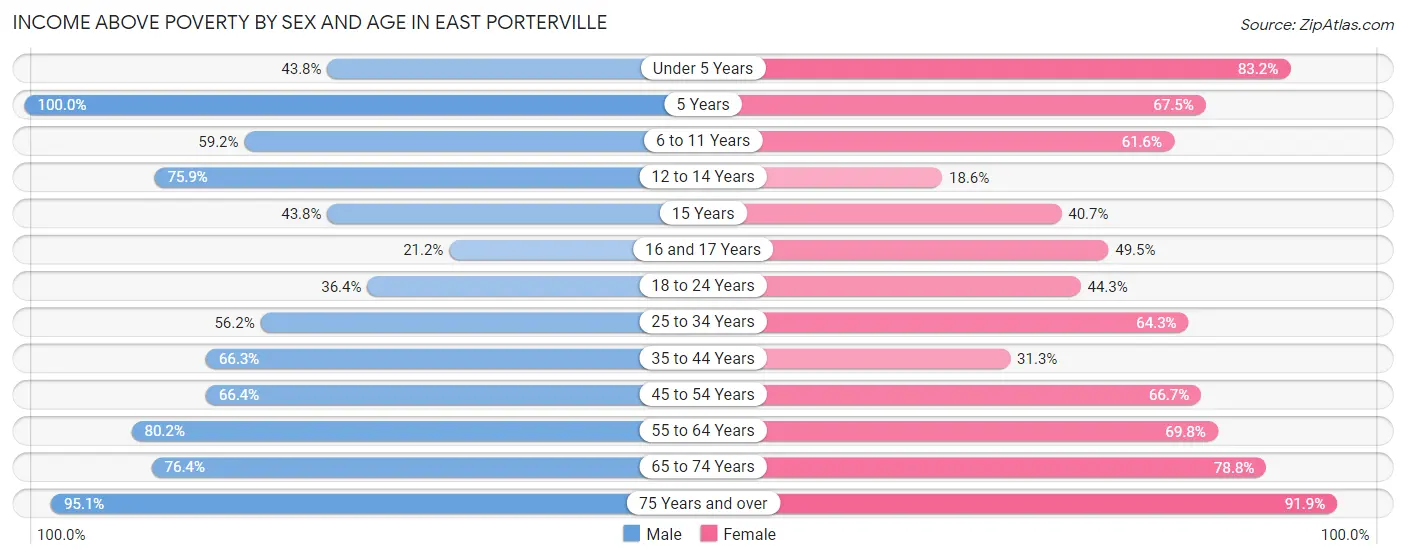
Income Above Poverty by Sex and Age in East Porterville
According to the poverty statistics in East Porterville, males aged 5 years and females aged 75 years and over are the age groups that are most secure financially, with 100.0% of males and 91.9% of females in these age groups living above the poverty line.
| Age Bracket | Male | Female |
| Under 5 Years | 113 (43.8%) | 89 (83.2%) |
| 5 Years | 62 (100.0%) | 79 (67.5%) |
| 6 to 11 Years | 196 (59.2%) | 114 (61.6%) |
| 12 to 14 Years | 85 (75.9%) | 35 (18.6%) |
| 15 Years | 39 (43.8%) | 22 (40.7%) |
| 16 and 17 Years | 32 (21.2%) | 46 (49.5%) |
| 18 to 24 Years | 123 (36.4%) | 156 (44.3%) |
| 25 to 34 Years | 262 (56.2%) | 312 (64.3%) |
| 35 to 44 Years | 201 (66.3%) | 80 (31.2%) |
| 45 to 54 Years | 140 (66.3%) | 132 (66.7%) |
| 55 to 64 Years | 210 (80.1%) | 203 (69.8%) |
| 65 to 74 Years | 81 (76.4%) | 89 (78.8%) |
| 75 Years and over | 136 (95.1%) | 91 (91.9%) |
| Total | 1,680 (59.3%) | 1,448 (57.1%) |
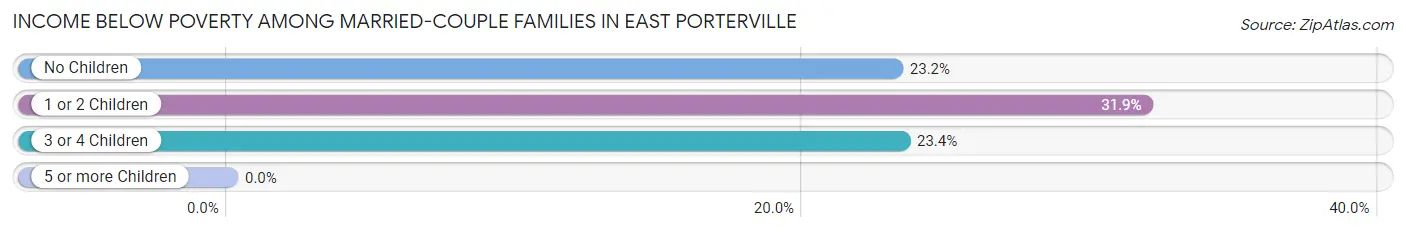
Income Below Poverty Among Married-Couple Families in East Porterville
The poverty statistics for married-couple families in East Porterville show that 24.6% or 152 of the total 619 families live below the poverty line. Families with 1 or 2 children have the highest poverty rate of 31.9%, comprising of 58 families. On the other hand, families with 5 or more children have the lowest poverty rate of 0.0%, which includes 0 families.
| Children | Above Poverty | Below Poverty |
| No Children | 166 (76.8%) | 50 (23.2%) |
| 1 or 2 Children | 124 (68.1%) | 58 (31.9%) |
| 3 or 4 Children | 144 (76.6%) | 44 (23.4%) |
| 5 or more Children | 33 (100.0%) | 0 (0.0%) |
| Total | 467 (75.4%) | 152 (24.6%) |
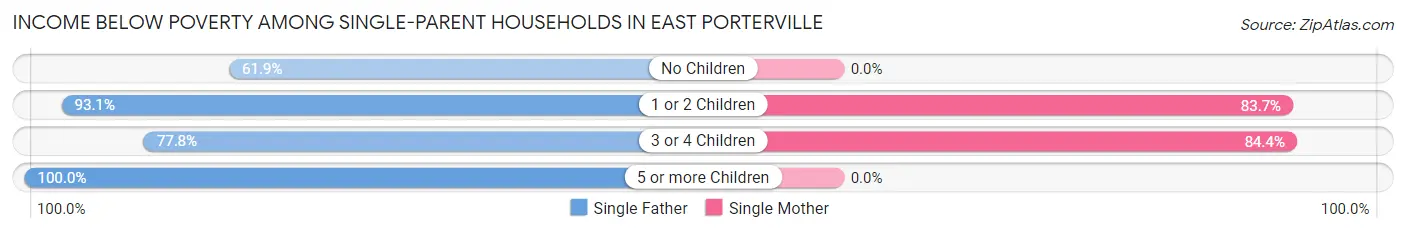
Income Below Poverty Among Single-Parent Households in East Porterville
According to the poverty data in East Porterville, 75.4% or 92 single-father households and 67.6% or 163 single-mother households are living below the poverty line. Among single-father households, those with 5 or more children have the highest poverty rate, with 12 households (100.0%) experiencing poverty. Likewise, among single-mother households, those with 3 or 4 children have the highest poverty rate, with 81 households (84.4%) falling below the poverty line.
| Children | Single Father | Single Mother |
| No Children | 39 (61.9%) | 0 (0.0%) |
| 1 or 2 Children | 27 (93.1%) | 82 (83.7%) |
| 3 or 4 Children | 14 (77.8%) | 81 (84.4%) |
| 5 or more Children | 12 (100.0%) | 0 (0.0%) |
| Total | 92 (75.4%) | 163 (67.6%) |
Income Below Poverty Among Married-Couple vs Single-Parent Households in East Porterville
The poverty data for East Porterville shows that 152 of the married-couple family households (24.6%) and 255 of the single-parent households (70.3%) are living below the poverty level. Within the married-couple family households, those with 1 or 2 children have the highest poverty rate, with 58 households (31.9%) falling below the poverty line. Among the single-parent households, those with 5 or more children have the highest poverty rate, with 12 household (100.0%) living below poverty.
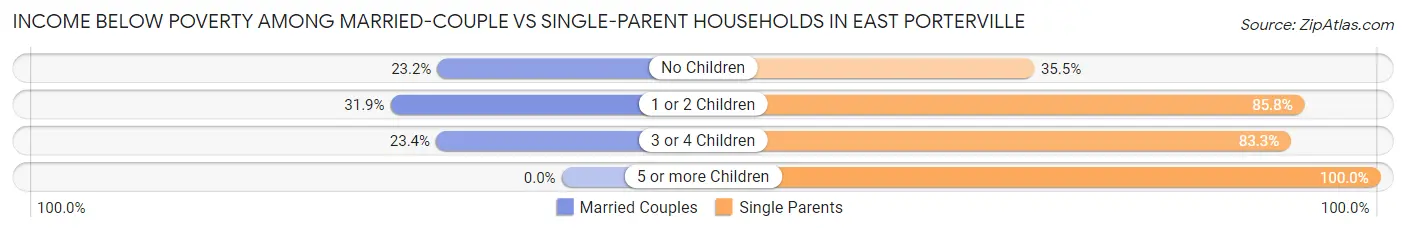
| Children | Married-Couple Families | Single-Parent Households |
| No Children | 50 (23.2%) | 39 (35.4%) |
| 1 or 2 Children | 58 (31.9%) | 109 (85.8%) |
| 3 or 4 Children | 44 (23.4%) | 95 (83.3%) |
| 5 or more Children | 0 (0.0%) | 12 (100.0%) |
| Total | 152 (24.6%) | 255 (70.3%) |
Employment Characteristics in East Porterville
Employment by Class of Employer in East Porterville
Among the 1,540 employed individuals in East Porterville, private company employees (1,076 | 69.9%), not-for-profit organizations (158 | 10.3%), and self-employed (not incorporated) (155 | 10.1%) make up the most common classes of employment.
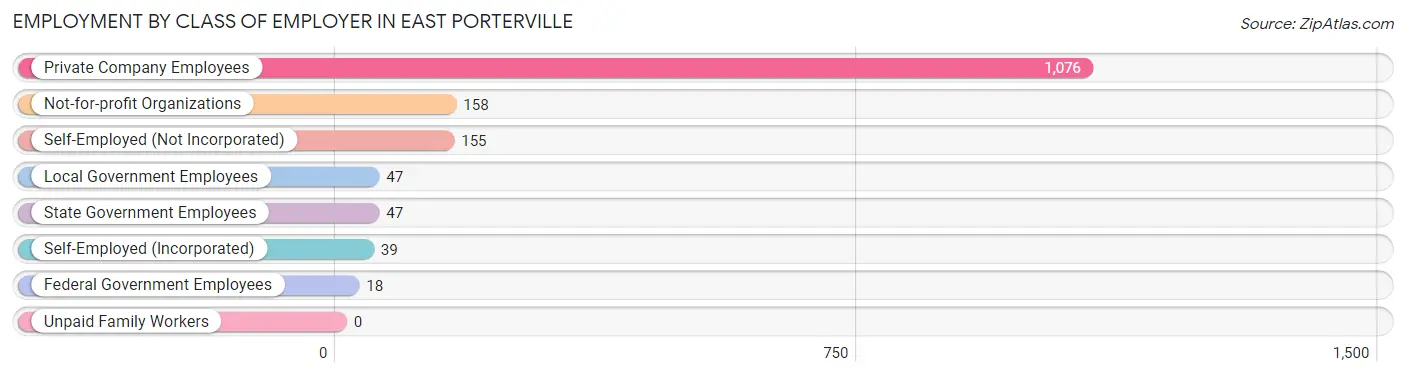
| Employer Class | # Employees | % Employees |
| Private Company Employees | 1,076 | 69.9% |
| Self-Employed (Incorporated) | 39 | 2.5% |
| Self-Employed (Not Incorporated) | 155 | 10.1% |
| Not-for-profit Organizations | 158 | 10.3% |
| Local Government Employees | 47 | 3.0% |
| State Government Employees | 47 | 3.0% |
| Federal Government Employees | 18 | 1.2% |
| Unpaid Family Workers | 0 | 0.0% |
| Total | 1,540 | 100.0% |
Employment Status by Age in East Porterville
According to the labor force statistics for East Porterville, out of the total population over 16 years of age (3,867), 55.0% or 2,127 individuals are in the labor force, with 25.4% or 540 of them unemployed. The age group with the highest labor force participation rate is 30 to 34 years, with 88.2% or 449 individuals in the labor force. Within the labor force, the 60 to 64 years age range has the highest percentage of unemployed individuals, with 65.1% or 99 of them being unemployed.
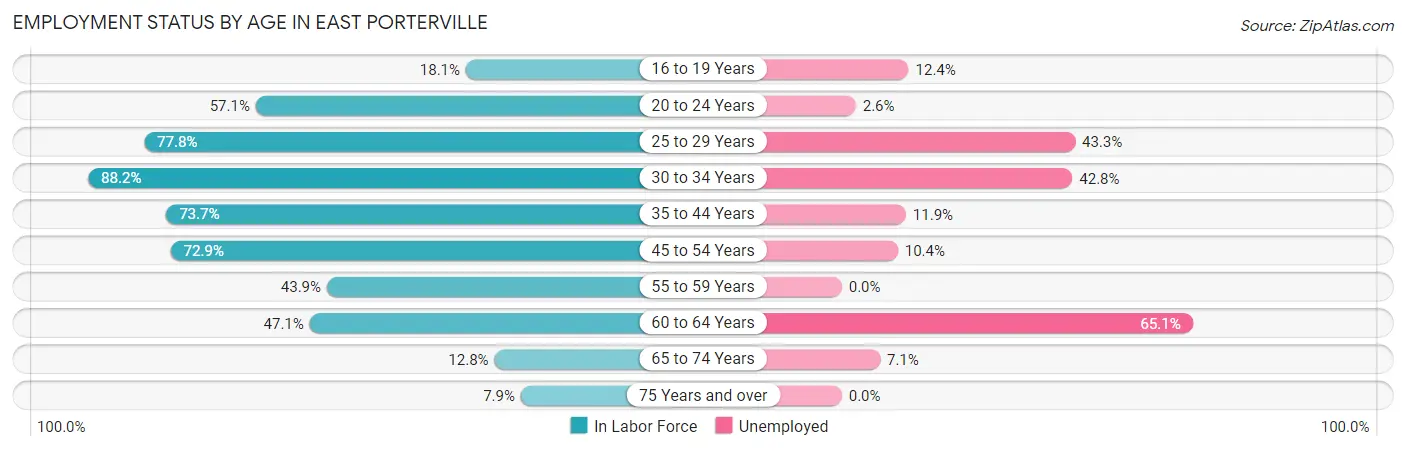
| Age Bracket | In Labor Force | Unemployed |
| 16 to 19 Years | 97 (18.1%) | 12 (12.4%) |
| 20 to 24 Years | 228 (57.1%) | 6 (2.6%) |
| 25 to 29 Years | 344 (77.8%) | 149 (43.3%) |
| 30 to 34 Years | 449 (88.2%) | 192 (42.8%) |
| 35 to 44 Years | 412 (73.7%) | 49 (11.9%) |
| 45 to 54 Years | 298 (72.9%) | 31 (10.4%) |
| 55 to 59 Years | 101 (43.9%) | 0 (0.0%) |
| 60 to 64 Years | 152 (47.1%) | 99 (65.1%) |
| 65 to 74 Years | 28 (12.8%) | 2 (7.1%) |
| 75 Years and over | 19 (7.9%) | 0 (0.0%) |
| Total | 2,127 (55.0%) | 540 (25.4%) |
Employment Status by Educational Attainment in East Porterville
According to labor force statistics for East Porterville, 71.0% of individuals (1,755) out of the total population between 25 and 64 years of age (2,472) are in the labor force, with 29.6% or 519 of them being unemployed. The group with the highest labor force participation rate are those with the educational attainment of high school diploma, with 84.6% or 631 individuals in the labor force. Within the labor force, individuals with high school diploma education have the highest percentage of unemployment, with 44.7% or 282 of them being unemployed.
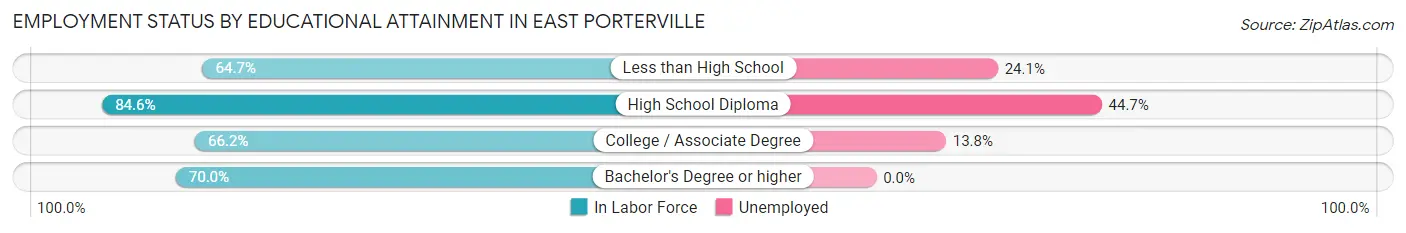
| Educational Attainment | In Labor Force | Unemployed |
| Less than High School | 851 (64.7%) | 317 (24.1%) |
| High School Diploma | 631 (84.6%) | 333 (44.7%) |
| College / Associate Degree | 239 (66.2%) | 50 (13.8%) |
| Bachelor's Degree or higher | 35 (70.0%) | 0 (0.0%) |
| Total | 1,755 (71.0%) | 732 (29.6%) |
Employment Occupations by Sex in East Porterville
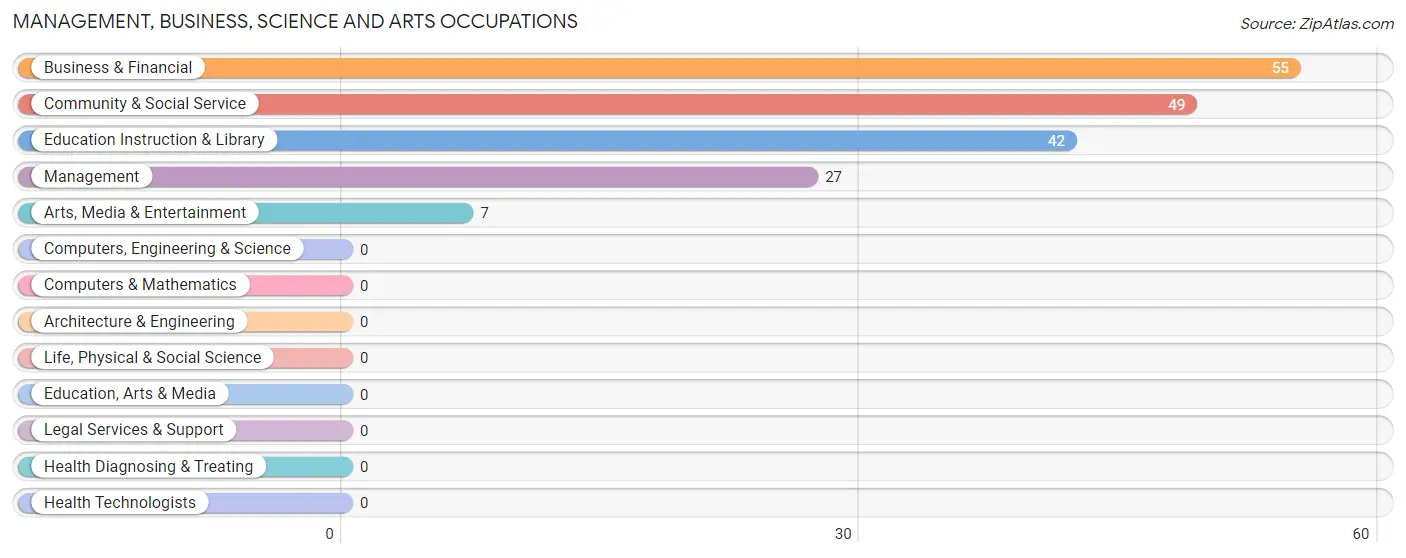
Management, Business, Science and Arts Occupations
The most common Management, Business, Science and Arts occupations in East Porterville are Business & Financial (55 | 3.5%), Community & Social Service (49 | 3.1%), Education Instruction & Library (42 | 2.6%), Management (27 | 1.7%), and Arts, Media & Entertainment (7 | 0.4%).
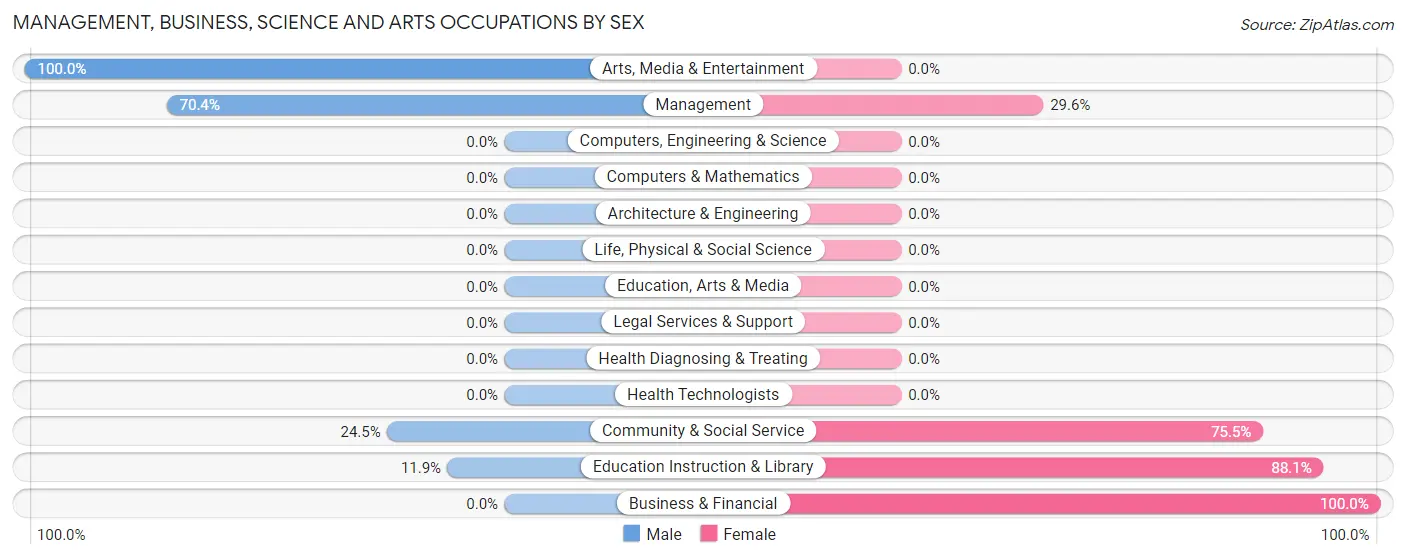
Management, Business, Science and Arts Occupations by Sex
Within the Management, Business, Science and Arts occupations in East Porterville, the most male-oriented occupations are Arts, Media & Entertainment (100.0%), Management (70.4%), and Community & Social Service (24.5%), while the most female-oriented occupations are Business & Financial (100.0%), Education Instruction & Library (88.1%), and Community & Social Service (75.5%).
| Occupation | Male | Female |
| Management | 19 (70.4%) | 8 (29.6%) |
| Business & Financial | 0 (0.0%) | 55 (100.0%) |
| Computers, Engineering & Science | 0 (0.0%) | 0 (0.0%) |
| Computers & Mathematics | 0 (0.0%) | 0 (0.0%) |
| Architecture & Engineering | 0 (0.0%) | 0 (0.0%) |
| Life, Physical & Social Science | 0 (0.0%) | 0 (0.0%) |
| Community & Social Service | 12 (24.5%) | 37 (75.5%) |
| Education, Arts & Media | 0 (0.0%) | 0 (0.0%) |
| Legal Services & Support | 0 (0.0%) | 0 (0.0%) |
| Education Instruction & Library | 5 (11.9%) | 37 (88.1%) |
| Arts, Media & Entertainment | 7 (100.0%) | 0 (0.0%) |
| Health Diagnosing & Treating | 0 (0.0%) | 0 (0.0%) |
| Health Technologists | 0 (0.0%) | 0 (0.0%) |
| Total (Category) | 31 (23.7%) | 100 (76.3%) |
| Total (Overall) | 1,008 (63.5%) | 580 (36.5%) |
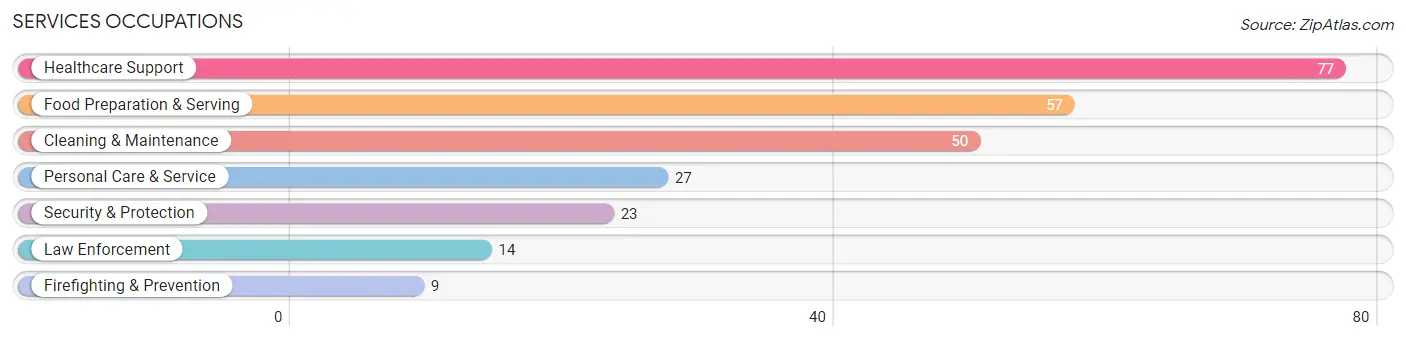
Services Occupations
The most common Services occupations in East Porterville are Healthcare Support (77 | 4.9%), Food Preparation & Serving (57 | 3.6%), Cleaning & Maintenance (50 | 3.2%), Personal Care & Service (27 | 1.7%), and Security & Protection (23 | 1.5%).
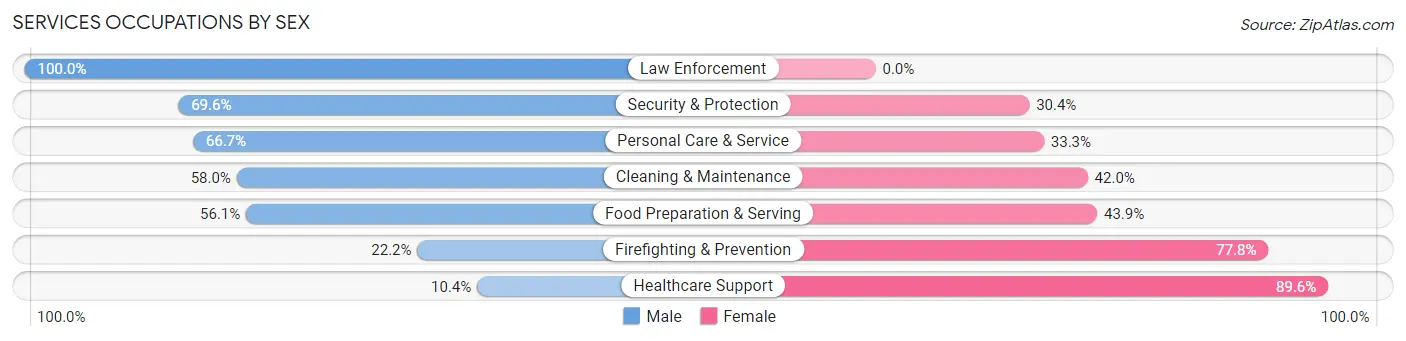
Services Occupations by Sex
Within the Services occupations in East Porterville, the most male-oriented occupations are Law Enforcement (100.0%), Security & Protection (69.6%), and Personal Care & Service (66.7%), while the most female-oriented occupations are Healthcare Support (89.6%), Firefighting & Prevention (77.8%), and Food Preparation & Serving (43.9%).
| Occupation | Male | Female |
| Healthcare Support | 8 (10.4%) | 69 (89.6%) |
| Security & Protection | 16 (69.6%) | 7 (30.4%) |
| Firefighting & Prevention | 2 (22.2%) | 7 (77.8%) |
| Law Enforcement | 14 (100.0%) | 0 (0.0%) |
| Food Preparation & Serving | 32 (56.1%) | 25 (43.9%) |
| Cleaning & Maintenance | 29 (58.0%) | 21 (42.0%) |
| Personal Care & Service | 18 (66.7%) | 9 (33.3%) |
| Total (Category) | 103 (44.0%) | 131 (56.0%) |
| Total (Overall) | 1,008 (63.5%) | 580 (36.5%) |
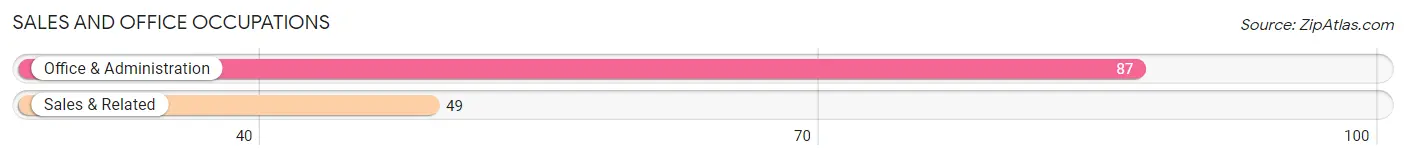
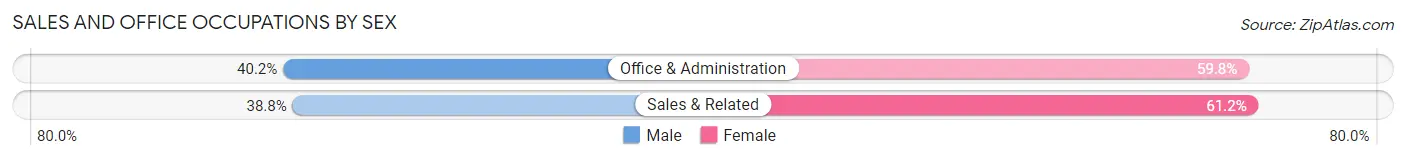
Sales and Office Occupations
The most common Sales and Office occupations in East Porterville are Office & Administration (87 | 5.5%), and Sales & Related (49 | 3.1%).
Sales and Office Occupations by Sex
| Occupation | Male | Female |
| Sales & Related | 19 (38.8%) | 30 (61.2%) |
| Office & Administration | 35 (40.2%) | 52 (59.8%) |
| Total (Category) | 54 (39.7%) | 82 (60.3%) |
| Total (Overall) | 1,008 (63.5%) | 580 (36.5%) |
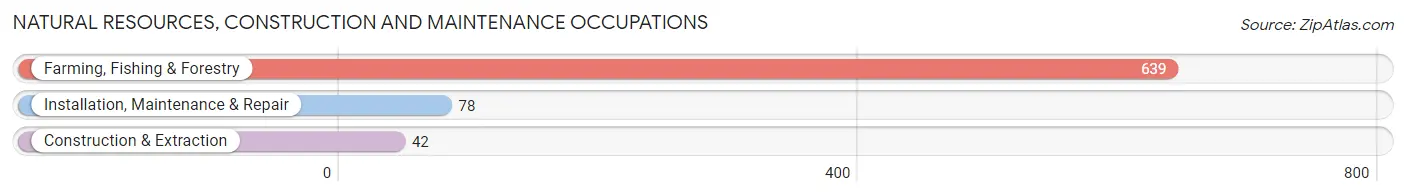
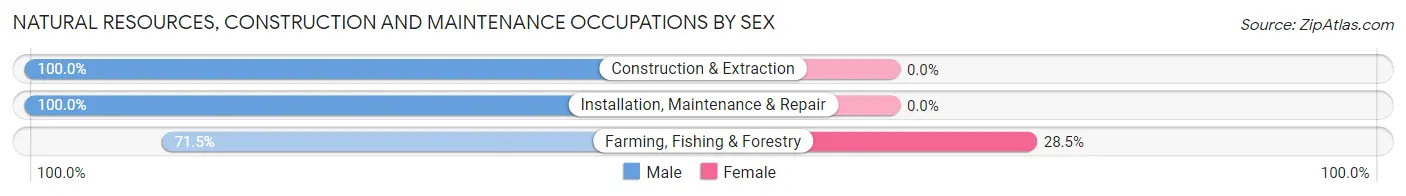
Natural Resources, Construction and Maintenance Occupations
The most common Natural Resources, Construction and Maintenance occupations in East Porterville are Farming, Fishing & Forestry (639 | 40.2%), Installation, Maintenance & Repair (78 | 4.9%), and Construction & Extraction (42 | 2.6%).
Natural Resources, Construction and Maintenance Occupations by Sex
| Occupation | Male | Female |
| Farming, Fishing & Forestry | 457 (71.5%) | 182 (28.5%) |
| Construction & Extraction | 42 (100.0%) | 0 (0.0%) |
| Installation, Maintenance & Repair | 78 (100.0%) | 0 (0.0%) |
| Total (Category) | 577 (76.0%) | 182 (24.0%) |
| Total (Overall) | 1,008 (63.5%) | 580 (36.5%) |
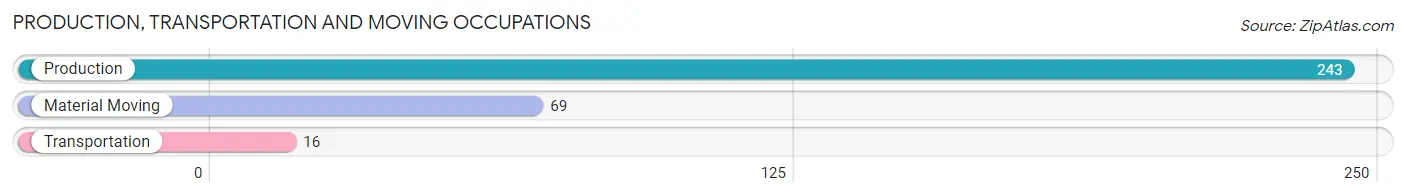
Production, Transportation and Moving Occupations
The most common Production, Transportation and Moving occupations in East Porterville are Production (243 | 15.3%), Material Moving (69 | 4.3%), and Transportation (16 | 1.0%).
Production, Transportation and Moving Occupations by Sex
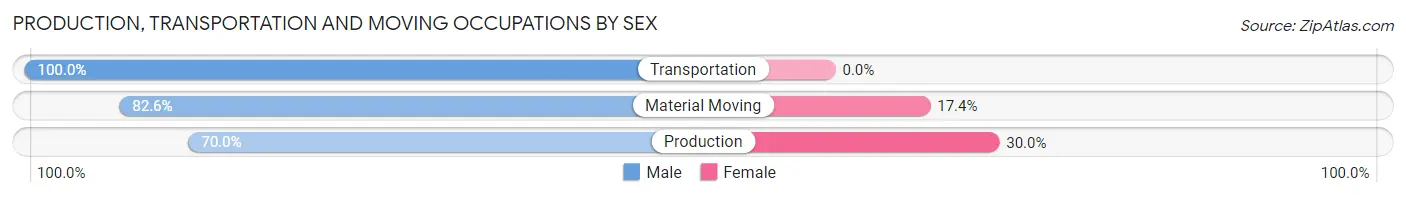
| Occupation | Male | Female |
| Production | 170 (70.0%) | 73 (30.0%) |
| Transportation | 16 (100.0%) | 0 (0.0%) |
| Material Moving | 57 (82.6%) | 12 (17.4%) |
| Total (Category) | 243 (74.1%) | 85 (25.9%) |
| Total (Overall) | 1,008 (63.5%) | 580 (36.5%) |
Employment Industries by Sex in East Porterville
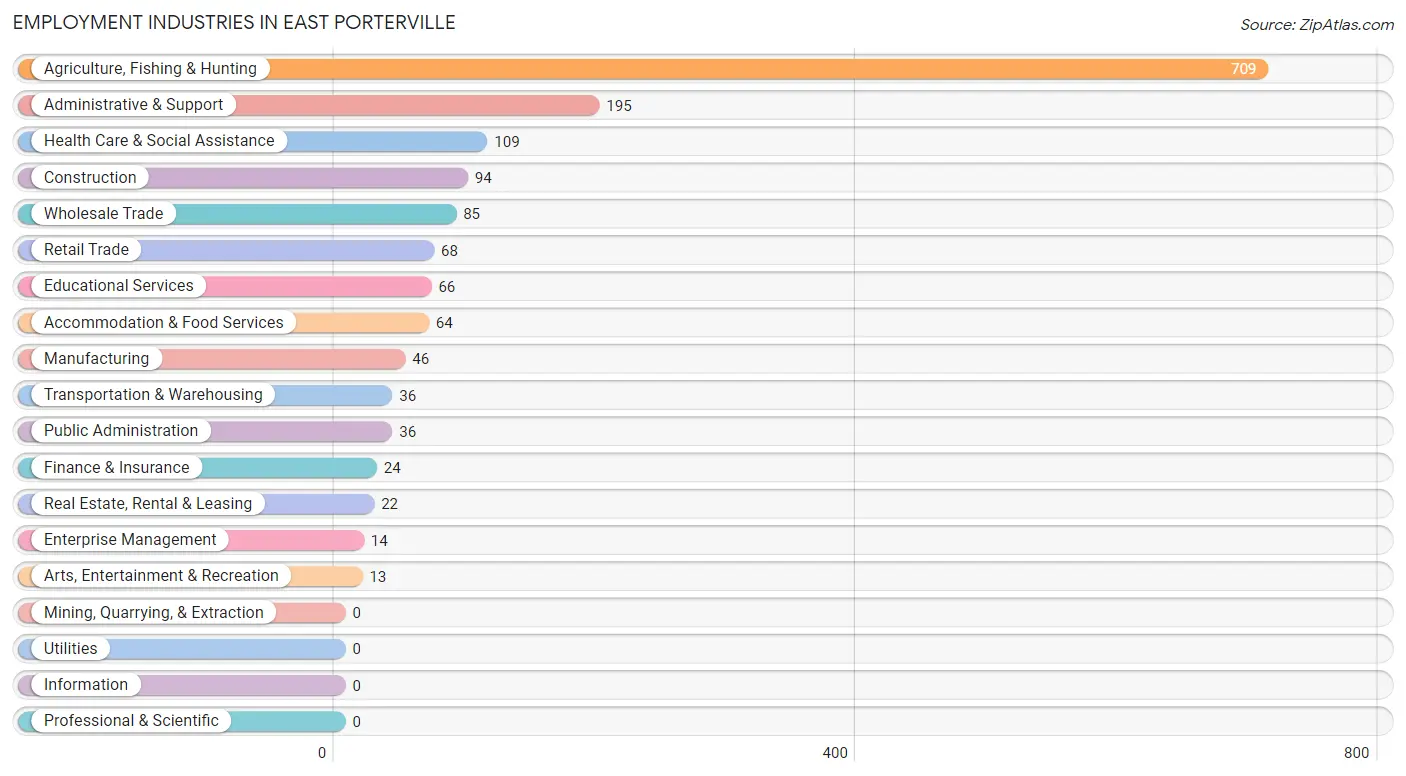
Employment Industries in East Porterville
The major employment industries in East Porterville include Agriculture, Fishing & Hunting (709 | 44.7%), Administrative & Support (195 | 12.3%), Health Care & Social Assistance (109 | 6.9%), Construction (94 | 5.9%), and Wholesale Trade (85 | 5.3%).
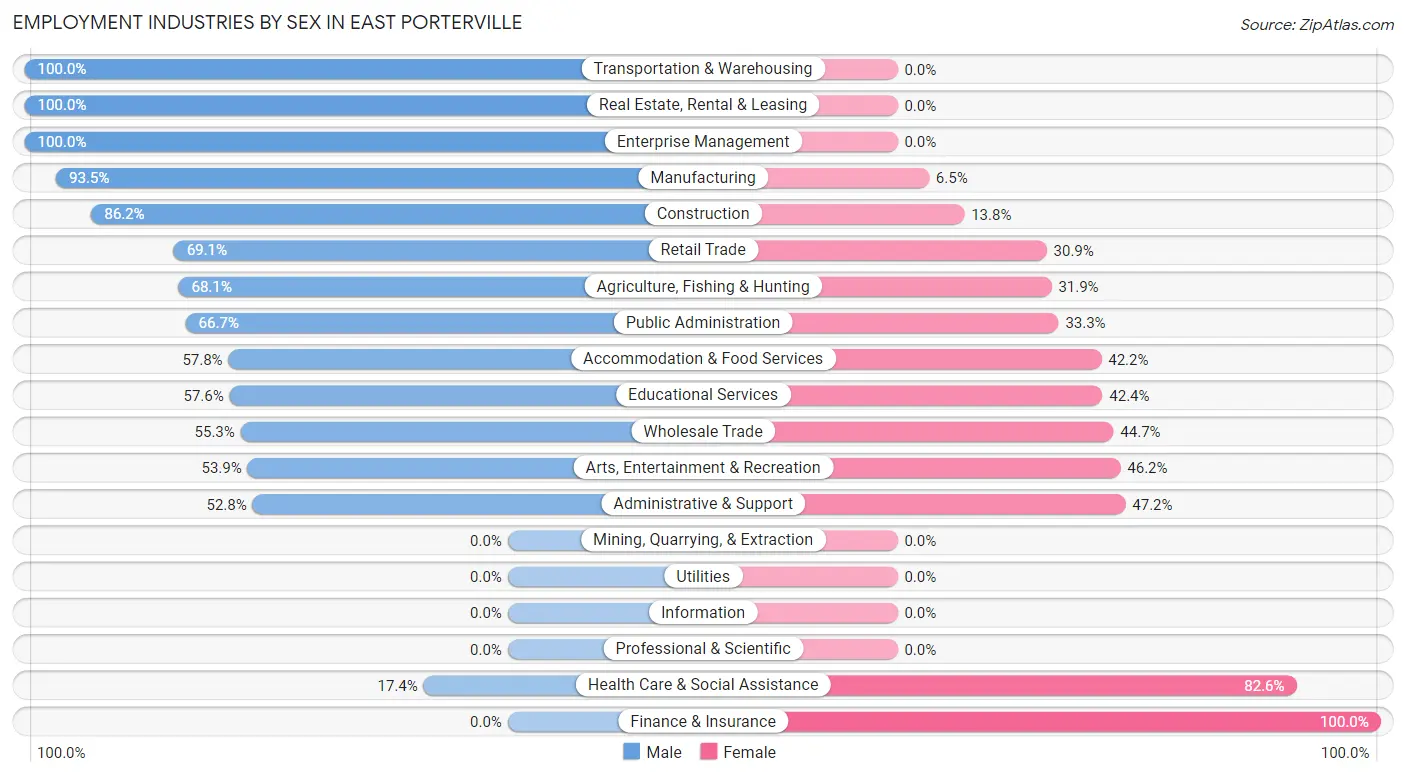
Employment Industries by Sex in East Porterville
The East Porterville industries that see more men than women are Transportation & Warehousing (100.0%), Real Estate, Rental & Leasing (100.0%), and Enterprise Management (100.0%), whereas the industries that tend to have a higher number of women are Finance & Insurance (100.0%), Health Care & Social Assistance (82.6%), and Administrative & Support (47.2%).
| Industry | Male | Female |
| Agriculture, Fishing & Hunting | 483 (68.1%) | 226 (31.9%) |
| Mining, Quarrying, & Extraction | 0 (0.0%) | 0 (0.0%) |
| Construction | 81 (86.2%) | 13 (13.8%) |
| Manufacturing | 43 (93.5%) | 3 (6.5%) |
| Wholesale Trade | 47 (55.3%) | 38 (44.7%) |
| Retail Trade | 47 (69.1%) | 21 (30.9%) |
| Transportation & Warehousing | 36 (100.0%) | 0 (0.0%) |
| Utilities | 0 (0.0%) | 0 (0.0%) |
| Information | 0 (0.0%) | 0 (0.0%) |
| Finance & Insurance | 0 (0.0%) | 24 (100.0%) |
| Real Estate, Rental & Leasing | 22 (100.0%) | 0 (0.0%) |
| Professional & Scientific | 0 (0.0%) | 0 (0.0%) |
| Enterprise Management | 14 (100.0%) | 0 (0.0%) |
| Administrative & Support | 103 (52.8%) | 92 (47.2%) |
| Educational Services | 38 (57.6%) | 28 (42.4%) |
| Health Care & Social Assistance | 19 (17.4%) | 90 (82.6%) |
| Arts, Entertainment & Recreation | 7 (53.8%) | 6 (46.2%) |
| Accommodation & Food Services | 37 (57.8%) | 27 (42.2%) |
| Public Administration | 24 (66.7%) | 12 (33.3%) |
| Total | 1,008 (63.5%) | 580 (36.5%) |
Education in East Porterville
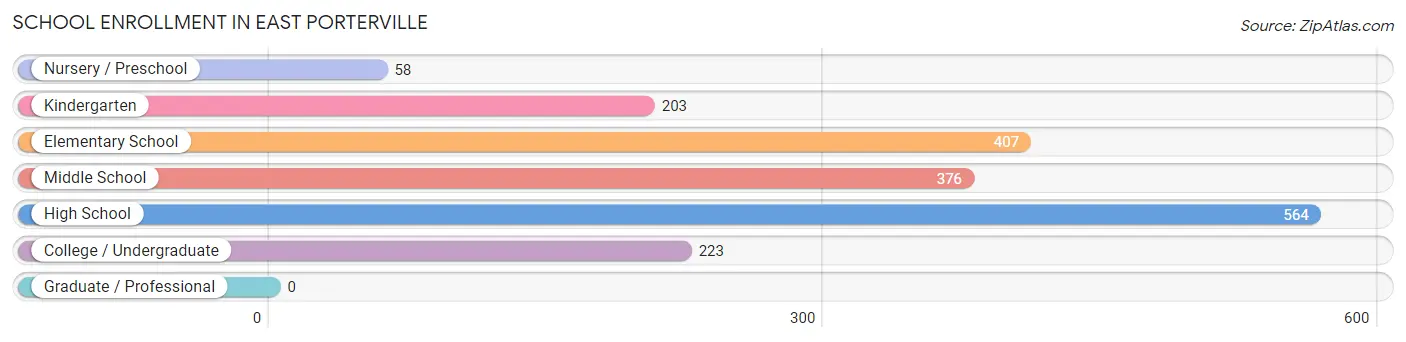
School Enrollment in East Porterville
The most common levels of schooling among the 1,831 students in East Porterville are high school (564 | 30.8%), elementary school (407 | 22.2%), and middle school (376 | 20.5%).
| School Level | # Students | % Students |
| Nursery / Preschool | 58 | 3.2% |
| Kindergarten | 203 | 11.1% |
| Elementary School | 407 | 22.2% |
| Middle School | 376 | 20.5% |
| High School | 564 | 30.8% |
| College / Undergraduate | 223 | 12.2% |
| Graduate / Professional | 0 | 0.0% |
| Total | 1,831 | 100.0% |
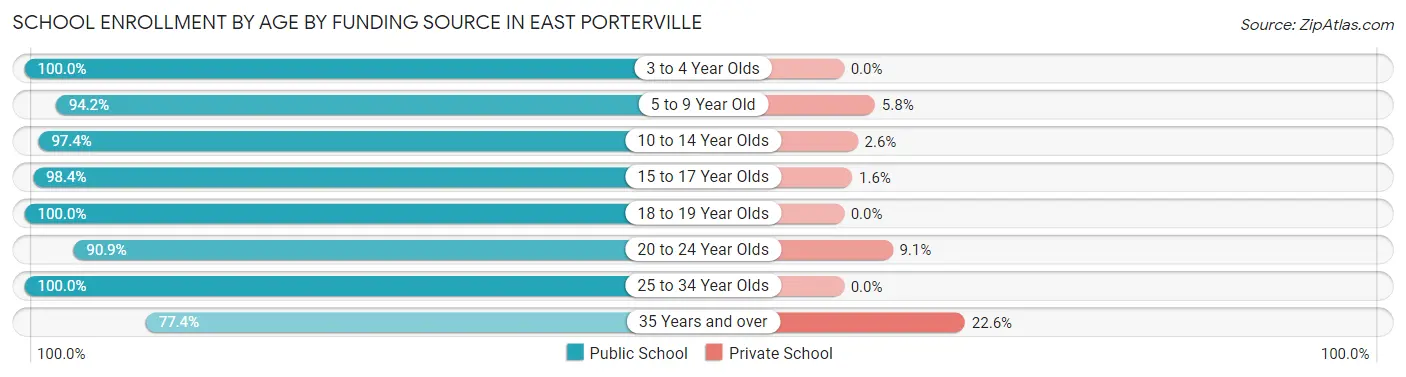
School Enrollment by Age by Funding Source in East Porterville
Out of a total of 1,831 students who are enrolled in schools in East Porterville, 64 (3.5%) attend a private institution, while the remaining 1,767 (96.5%) are enrolled in public schools. The age group of 35 years and over has the highest likelihood of being enrolled in private schools, with 7 (22.6% in the age bracket) enrolled. Conversely, the age group of 3 to 4 year olds has the lowest likelihood of being enrolled in a private school, with 58 (100.0% in the age bracket) attending a public institution.
| Age Bracket | Public School | Private School |
| 3 to 4 Year Olds | 58 (100.0%) | 0 (0.0%) |
| 5 to 9 Year Old | 502 (94.2%) | 31 (5.8%) |
| 10 to 14 Year Olds | 488 (97.4%) | 13 (2.6%) |
| 15 to 17 Year Olds | 375 (98.4%) | 6 (1.6%) |
| 18 to 19 Year Olds | 206 (100.0%) | 0 (0.0%) |
| 20 to 24 Year Olds | 70 (90.9%) | 7 (9.1%) |
| 25 to 34 Year Olds | 44 (100.0%) | 0 (0.0%) |
| 35 Years and over | 24 (77.4%) | 7 (22.6%) |
| Total | 1,767 (96.5%) | 64 (3.5%) |
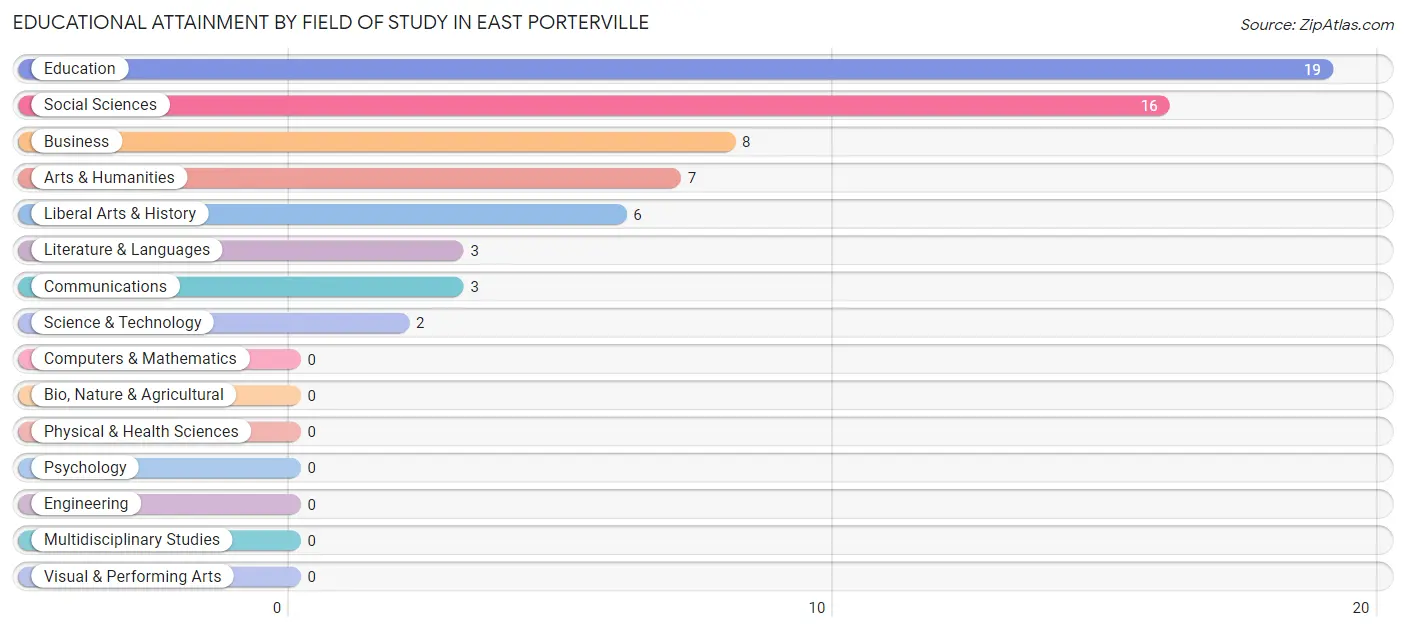
Educational Attainment by Field of Study in East Porterville
Education (19 | 29.7%), social sciences (16 | 25.0%), business (8 | 12.5%), arts & humanities (7 | 10.9%), and liberal arts & history (6 | 9.4%) are the most common fields of study among 64 individuals in East Porterville who have obtained a bachelor's degree or higher.
| Field of Study | # Graduates | % Graduates |
| Computers & Mathematics | 0 | 0.0% |
| Bio, Nature & Agricultural | 0 | 0.0% |
| Physical & Health Sciences | 0 | 0.0% |
| Psychology | 0 | 0.0% |
| Social Sciences | 16 | 25.0% |
| Engineering | 0 | 0.0% |
| Multidisciplinary Studies | 0 | 0.0% |
| Science & Technology | 2 | 3.1% |
| Business | 8 | 12.5% |
| Education | 19 | 29.7% |
| Literature & Languages | 3 | 4.7% |
| Liberal Arts & History | 6 | 9.4% |
| Visual & Performing Arts | 0 | 0.0% |
| Communications | 3 | 4.7% |
| Arts & Humanities | 7 | 10.9% |
| Total | 64 | 100.0% |
Transportation & Commute in East Porterville
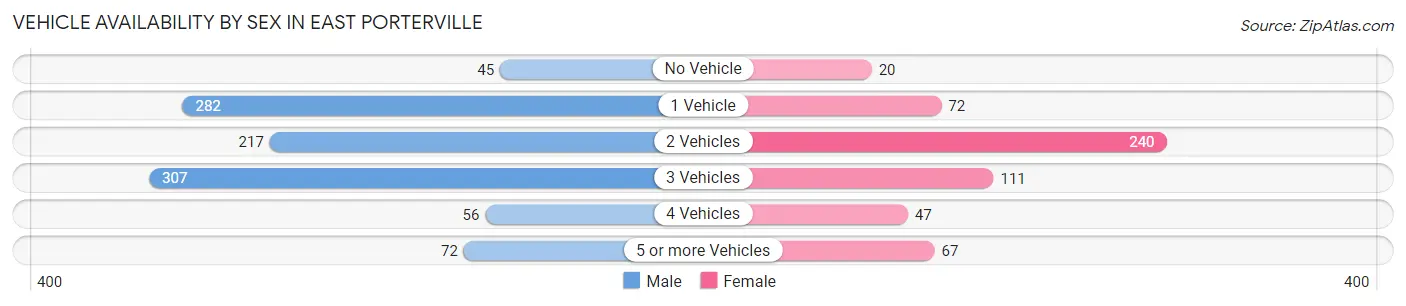
Vehicle Availability by Sex in East Porterville
The most prevalent vehicle ownership categories in East Porterville are males with 3 vehicles (307, accounting for 31.4%) and females with 3 vehicles (111, making up 55.1%).
| Vehicles Available | Male | Female |
| No Vehicle | 45 (4.6%) | 20 (3.6%) |
| 1 Vehicle | 282 (28.8%) | 72 (12.9%) |
| 2 Vehicles | 217 (22.2%) | 240 (43.1%) |
| 3 Vehicles | 307 (31.4%) | 111 (19.9%) |
| 4 Vehicles | 56 (5.7%) | 47 (8.4%) |
| 5 or more Vehicles | 72 (7.3%) | 67 (12.0%) |
| Total | 979 (100.0%) | 557 (100.0%) |
Commute Time in East Porterville
The most frequently occuring commute durations in East Porterville are 45 to 59 minutes (357 commuters, 23.8%), 15 to 19 minutes (279 commuters, 18.6%), and 10 to 14 minutes (161 commuters, 10.7%).
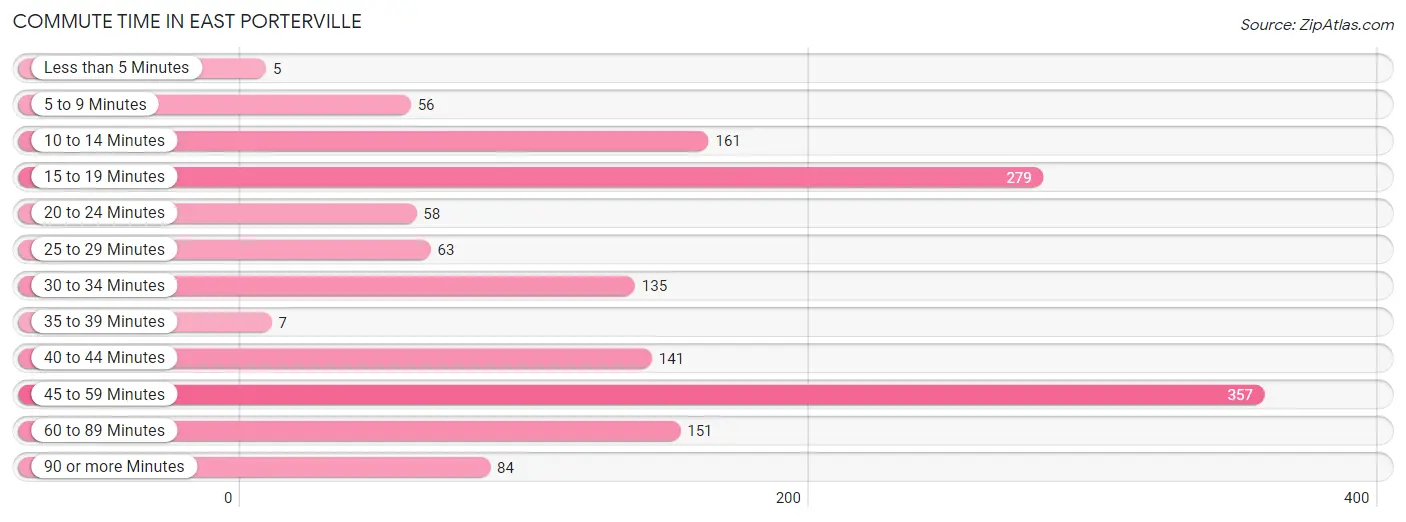
| Commute Time | # Commuters | % Commuters |
| Less than 5 Minutes | 5 | 0.3% |
| 5 to 9 Minutes | 56 | 3.7% |
| 10 to 14 Minutes | 161 | 10.7% |
| 15 to 19 Minutes | 279 | 18.6% |
| 20 to 24 Minutes | 58 | 3.9% |
| 25 to 29 Minutes | 63 | 4.2% |
| 30 to 34 Minutes | 135 | 9.0% |
| 35 to 39 Minutes | 7 | 0.5% |
| 40 to 44 Minutes | 141 | 9.4% |
| 45 to 59 Minutes | 357 | 23.8% |
| 60 to 89 Minutes | 151 | 10.1% |
| 90 or more Minutes | 84 | 5.6% |
Commute Time by Sex in East Porterville
The most common commute times in East Porterville are 45 to 59 minutes (243 commuters, 25.6%) for males and 15 to 19 minutes (131 commuters, 24.0%) for females.
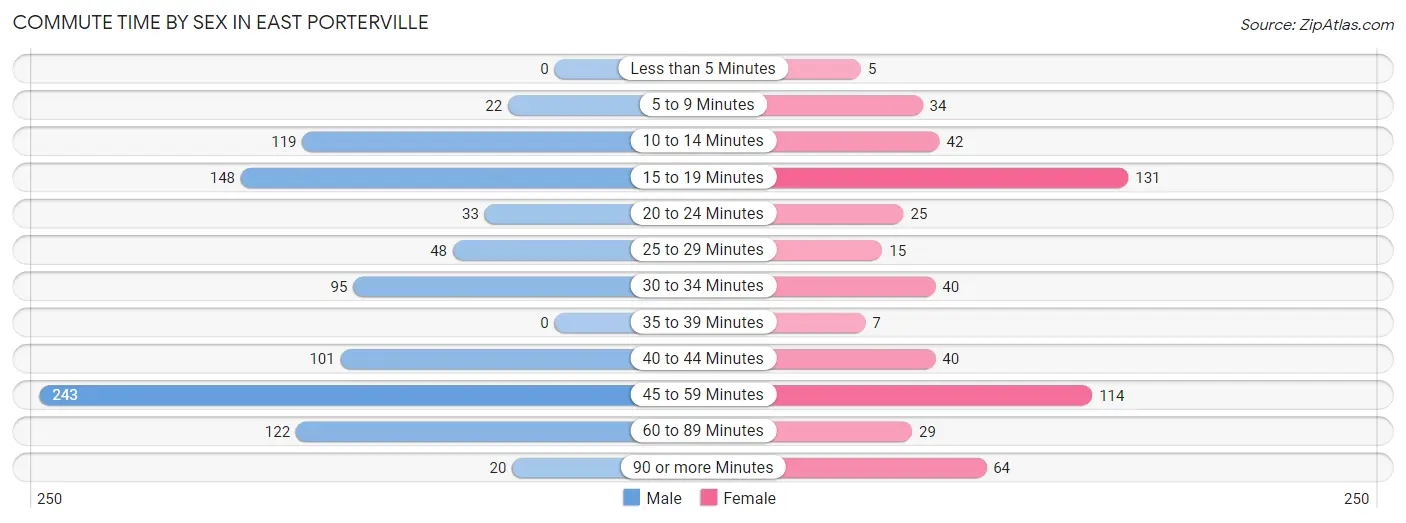
| Commute Time | Male | Female |
| Less than 5 Minutes | 0 (0.0%) | 5 (0.9%) |
| 5 to 9 Minutes | 22 (2.3%) | 34 (6.2%) |
| 10 to 14 Minutes | 119 (12.5%) | 42 (7.7%) |
| 15 to 19 Minutes | 148 (15.6%) | 131 (24.0%) |
| 20 to 24 Minutes | 33 (3.5%) | 25 (4.6%) |
| 25 to 29 Minutes | 48 (5.1%) | 15 (2.8%) |
| 30 to 34 Minutes | 95 (10.0%) | 40 (7.3%) |
| 35 to 39 Minutes | 0 (0.0%) | 7 (1.3%) |
| 40 to 44 Minutes | 101 (10.6%) | 40 (7.3%) |
| 45 to 59 Minutes | 243 (25.6%) | 114 (20.9%) |
| 60 to 89 Minutes | 122 (12.8%) | 29 (5.3%) |
| 90 or more Minutes | 20 (2.1%) | 64 (11.7%) |
Time of Departure to Work by Sex in East Porterville
The most frequent times of departure to work in East Porterville are 5:00 AM to 5:29 AM (262, 27.6%) for males and 5:00 AM to 5:29 AM (147, 26.9%) for females.
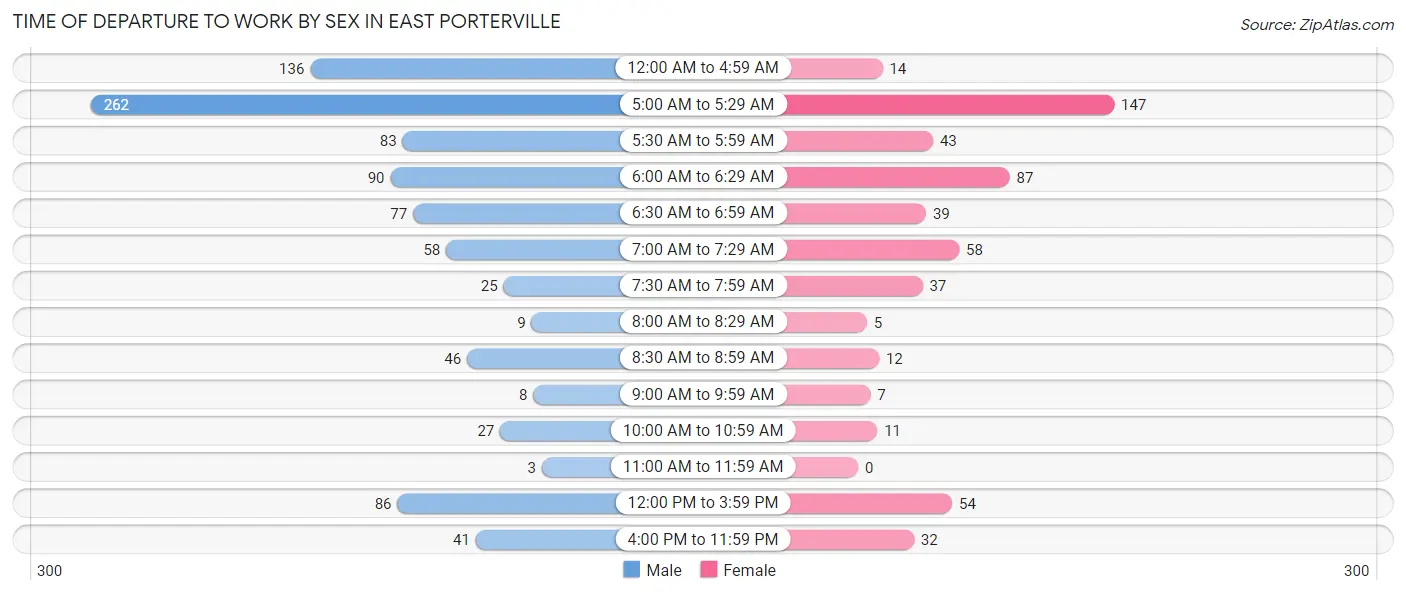
| Time of Departure | Male | Female |
| 12:00 AM to 4:59 AM | 136 (14.3%) | 14 (2.6%) |
| 5:00 AM to 5:29 AM | 262 (27.6%) | 147 (26.9%) |
| 5:30 AM to 5:59 AM | 83 (8.7%) | 43 (7.9%) |
| 6:00 AM to 6:29 AM | 90 (9.5%) | 87 (15.9%) |
| 6:30 AM to 6:59 AM | 77 (8.1%) | 39 (7.1%) |
| 7:00 AM to 7:29 AM | 58 (6.1%) | 58 (10.6%) |
| 7:30 AM to 7:59 AM | 25 (2.6%) | 37 (6.8%) |
| 8:00 AM to 8:29 AM | 9 (0.9%) | 5 (0.9%) |
| 8:30 AM to 8:59 AM | 46 (4.8%) | 12 (2.2%) |
| 9:00 AM to 9:59 AM | 8 (0.8%) | 7 (1.3%) |
| 10:00 AM to 10:59 AM | 27 (2.8%) | 11 (2.0%) |
| 11:00 AM to 11:59 AM | 3 (0.3%) | 0 (0.0%) |
| 12:00 PM to 3:59 PM | 86 (9.0%) | 54 (9.9%) |
| 4:00 PM to 11:59 PM | 41 (4.3%) | 32 (5.9%) |
| Total | 951 (100.0%) | 546 (100.0%) |
Housing Occupancy in East Porterville
Occupancy by Ownership in East Porterville
Of the total 1,258 dwellings in East Porterville, owner-occupied units account for 591 (47.0%), while renter-occupied units make up 667 (53.0%).
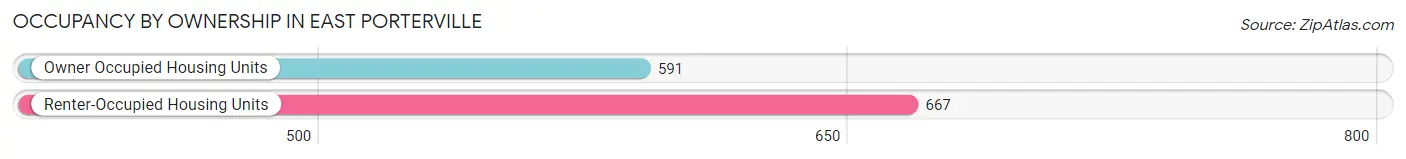
| Occupancy | # Housing Units | % Housing Units |
| Owner Occupied Housing Units | 591 | 47.0% |
| Renter-Occupied Housing Units | 667 | 53.0% |
| Total Occupied Housing Units | 1,258 | 100.0% |
Occupancy by Household Size in East Porterville
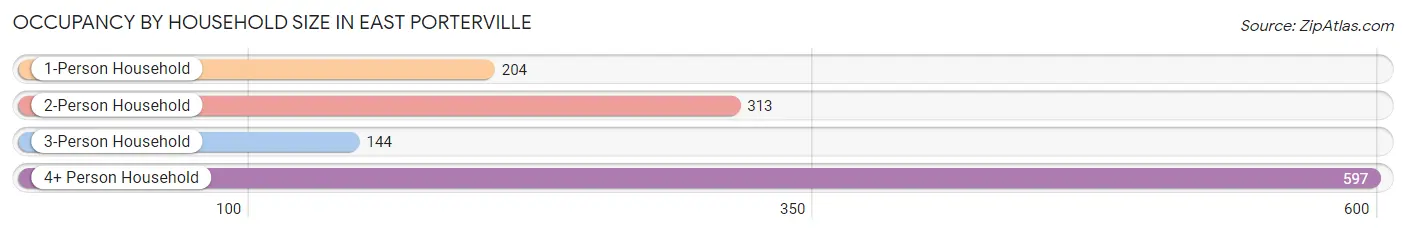
| Household Size | # Housing Units | % Housing Units |
| 1-Person Household | 204 | 16.2% |
| 2-Person Household | 313 | 24.9% |
| 3-Person Household | 144 | 11.5% |
| 4+ Person Household | 597 | 47.5% |
| Total Housing Units | 1,258 | 100.0% |
Occupancy by Ownership by Household Size in East Porterville
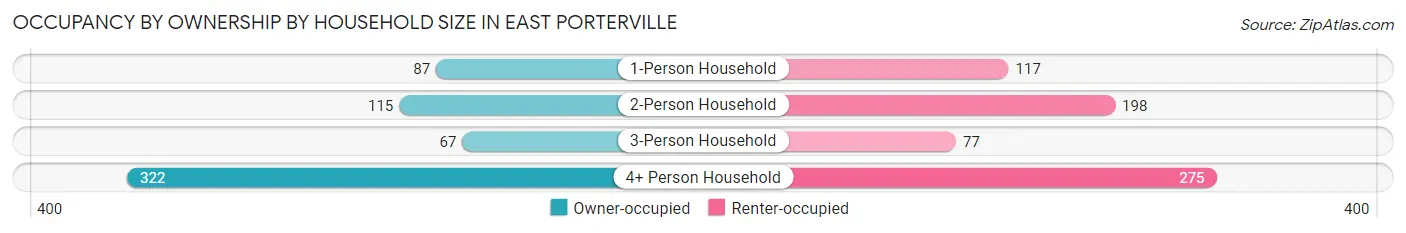
| Household Size | Owner-occupied | Renter-occupied |
| 1-Person Household | 87 (42.6%) | 117 (57.4%) |
| 2-Person Household | 115 (36.7%) | 198 (63.3%) |
| 3-Person Household | 67 (46.5%) | 77 (53.5%) |
| 4+ Person Household | 322 (53.9%) | 275 (46.1%) |
| Total Housing Units | 591 (47.0%) | 667 (53.0%) |
Occupancy by Educational Attainment in East Porterville
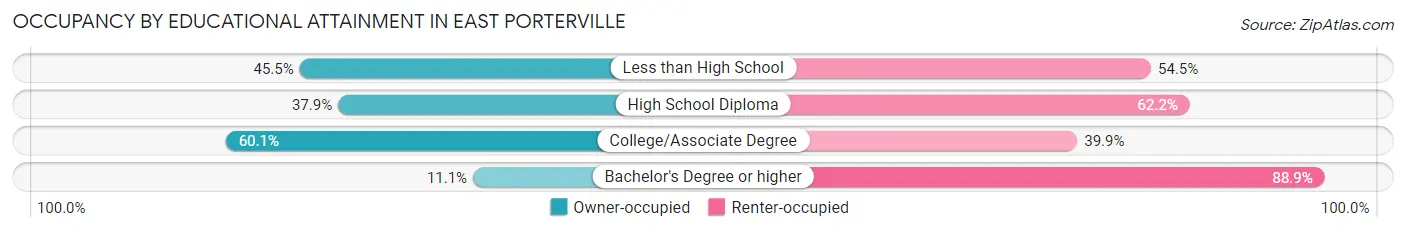
| Household Size | Owner-occupied | Renter-occupied |
| Less than High School | 267 (45.5%) | 320 (54.5%) |
| High School Diploma | 120 (37.9%) | 197 (62.2%) |
| College/Associate Degree | 202 (60.1%) | 134 (39.9%) |
| Bachelor's Degree or higher | 2 (11.1%) | 16 (88.9%) |
Occupancy by Age of Householder in East Porterville
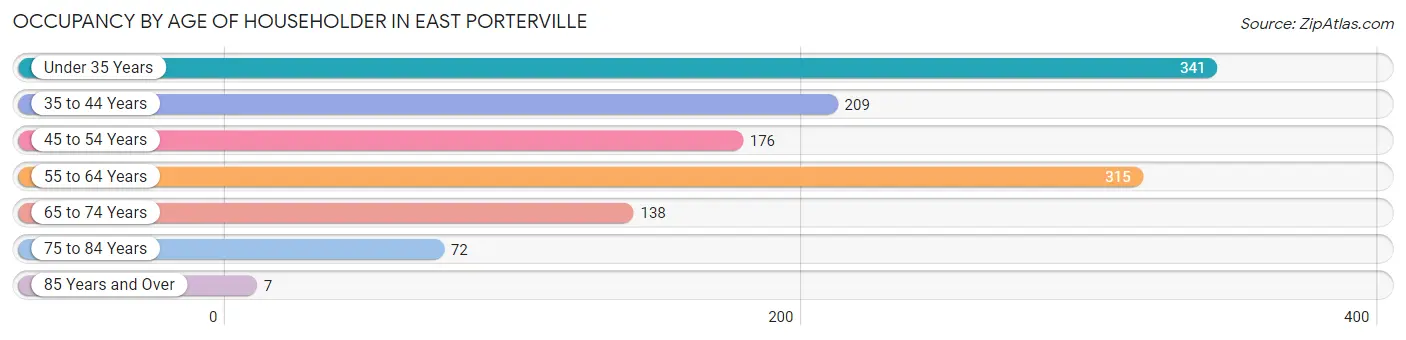
| Age Bracket | # Households | % Households |
| Under 35 Years | 341 | 27.1% |
| 35 to 44 Years | 209 | 16.6% |
| 45 to 54 Years | 176 | 14.0% |
| 55 to 64 Years | 315 | 25.0% |
| 65 to 74 Years | 138 | 11.0% |
| 75 to 84 Years | 72 | 5.7% |
| 85 Years and Over | 7 | 0.6% |
| Total | 1,258 | 100.0% |
Housing Finances in East Porterville
Median Income by Occupancy in East Porterville
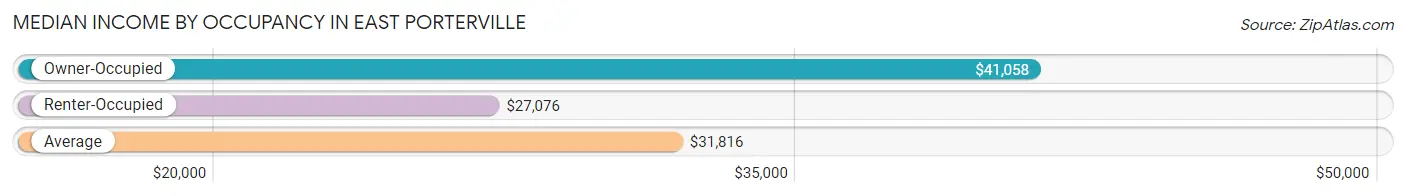
| Occupancy Type | # Households | Median Income |
| Owner-Occupied | 591 (47.0%) | $41,058 |
| Renter-Occupied | 667 (53.0%) | $27,076 |
| Average | 1,258 (100.0%) | $31,816 |
Occupancy by Householder Income Bracket in East Porterville
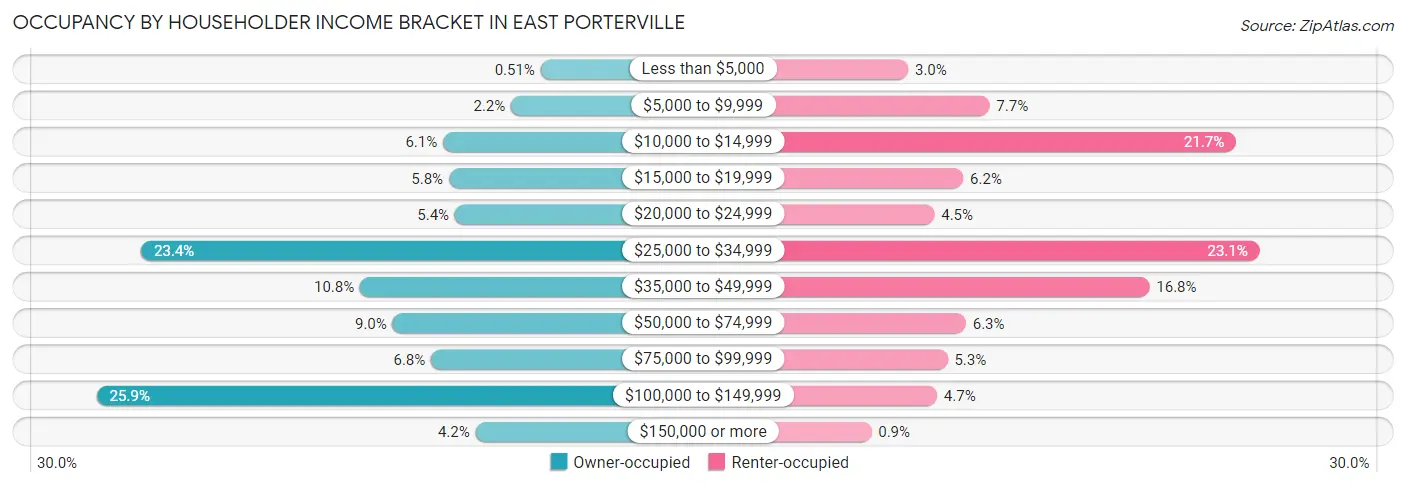
| Income Bracket | Owner-occupied | Renter-occupied |
| Less than $5,000 | 3 (0.5%) | 20 (3.0%) |
| $5,000 to $9,999 | 13 (2.2%) | 51 (7.6%) |
| $10,000 to $14,999 | 36 (6.1%) | 145 (21.7%) |
| $15,000 to $19,999 | 34 (5.8%) | 41 (6.1%) |
| $20,000 to $24,999 | 32 (5.4%) | 30 (4.5%) |
| $25,000 to $34,999 | 138 (23.4%) | 154 (23.1%) |
| $35,000 to $49,999 | 64 (10.8%) | 112 (16.8%) |
| $50,000 to $74,999 | 53 (9.0%) | 42 (6.3%) |
| $75,000 to $99,999 | 40 (6.8%) | 35 (5.2%) |
| $100,000 to $149,999 | 153 (25.9%) | 31 (4.6%) |
| $150,000 or more | 25 (4.2%) | 6 (0.9%) |
| Total | 591 (100.0%) | 667 (100.0%) |
Monthly Housing Cost Tiers in East Porterville
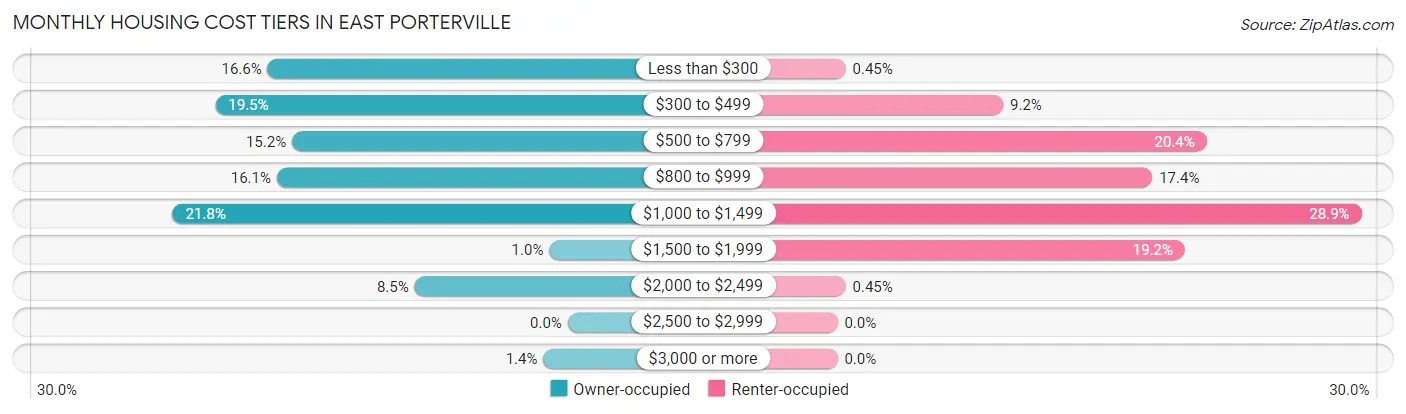
| Monthly Cost | Owner-occupied | Renter-occupied |
| Less than $300 | 98 (16.6%) | 3 (0.4%) |
| $300 to $499 | 115 (19.5%) | 61 (9.1%) |
| $500 to $799 | 90 (15.2%) | 136 (20.4%) |
| $800 to $999 | 95 (16.1%) | 116 (17.4%) |
| $1,000 to $1,499 | 129 (21.8%) | 193 (28.9%) |
| $1,500 to $1,999 | 6 (1.0%) | 128 (19.2%) |
| $2,000 to $2,499 | 50 (8.5%) | 3 (0.4%) |
| $2,500 to $2,999 | 0 (0.0%) | 0 (0.0%) |
| $3,000 or more | 8 (1.3%) | 0 (0.0%) |
| Total | 591 (100.0%) | 667 (100.0%) |
Physical Housing Characteristics in East Porterville
Housing Structures in East Porterville
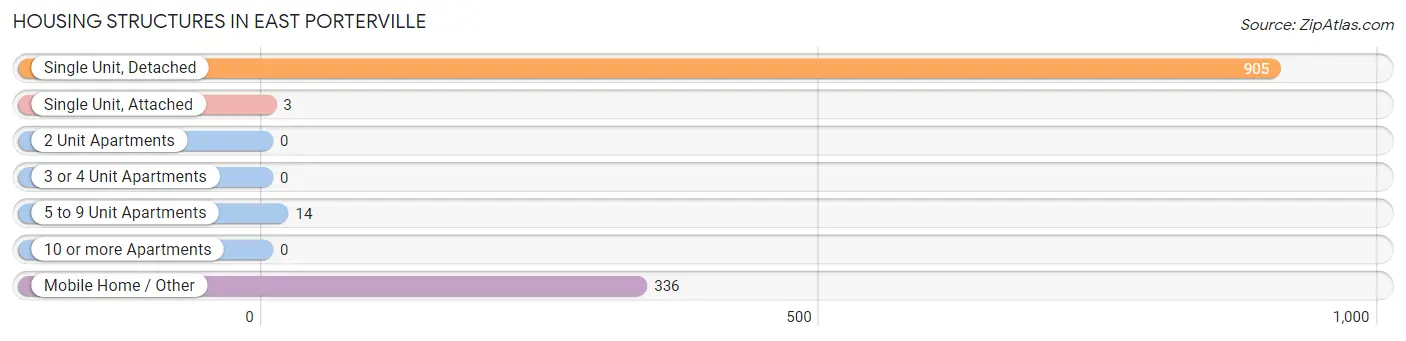
| Structure Type | # Housing Units | % Housing Units |
| Single Unit, Detached | 905 | 71.9% |
| Single Unit, Attached | 3 | 0.2% |
| 2 Unit Apartments | 0 | 0.0% |
| 3 or 4 Unit Apartments | 0 | 0.0% |
| 5 to 9 Unit Apartments | 14 | 1.1% |
| 10 or more Apartments | 0 | 0.0% |
| Mobile Home / Other | 336 | 26.7% |
| Total | 1,258 | 100.0% |
Housing Structures by Occupancy in East Porterville
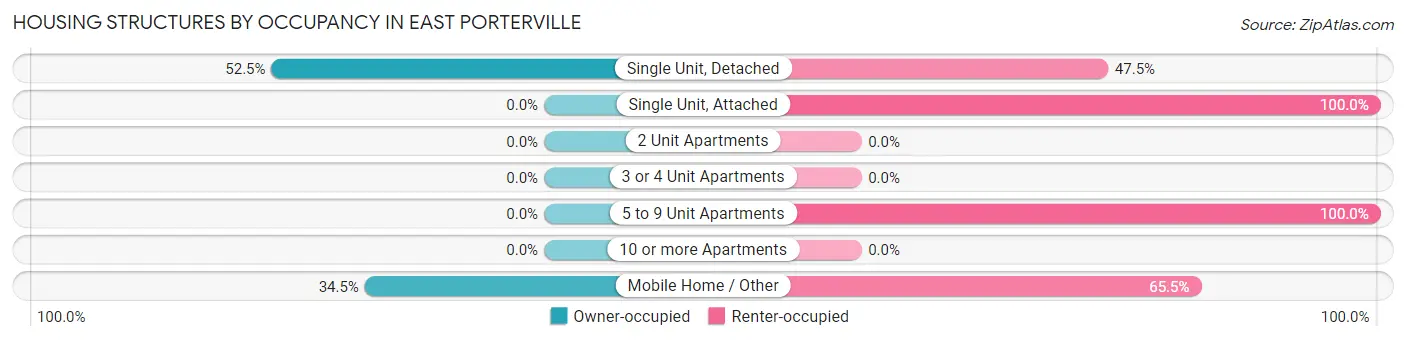
| Structure Type | Owner-occupied | Renter-occupied |
| Single Unit, Detached | 475 (52.5%) | 430 (47.5%) |
| Single Unit, Attached | 0 (0.0%) | 3 (100.0%) |
| 2 Unit Apartments | 0 (0.0%) | 0 (0.0%) |
| 3 or 4 Unit Apartments | 0 (0.0%) | 0 (0.0%) |
| 5 to 9 Unit Apartments | 0 (0.0%) | 14 (100.0%) |
| 10 or more Apartments | 0 (0.0%) | 0 (0.0%) |
| Mobile Home / Other | 116 (34.5%) | 220 (65.5%) |
| Total | 591 (47.0%) | 667 (53.0%) |
Housing Structures by Number of Rooms in East Porterville
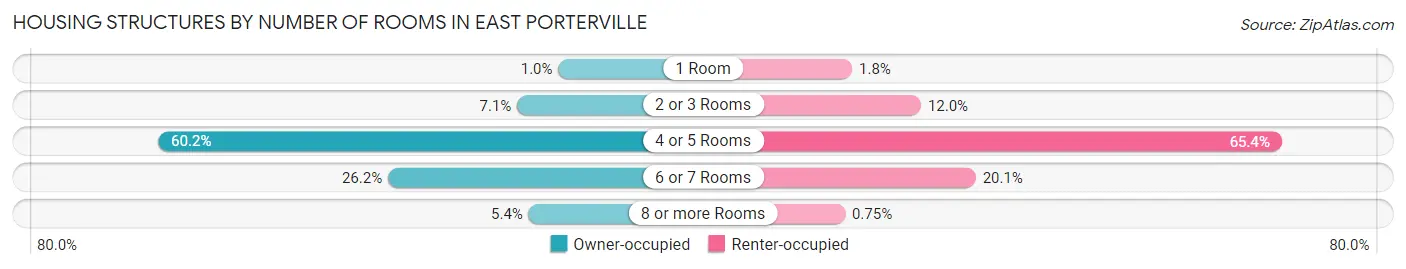
| Number of Rooms | Owner-occupied | Renter-occupied |
| 1 Room | 6 (1.0%) | 12 (1.8%) |
| 2 or 3 Rooms | 42 (7.1%) | 80 (12.0%) |
| 4 or 5 Rooms | 356 (60.2%) | 436 (65.4%) |
| 6 or 7 Rooms | 155 (26.2%) | 134 (20.1%) |
| 8 or more Rooms | 32 (5.4%) | 5 (0.7%) |
| Total | 591 (100.0%) | 667 (100.0%) |
Housing Structure by Heating Type in East Porterville
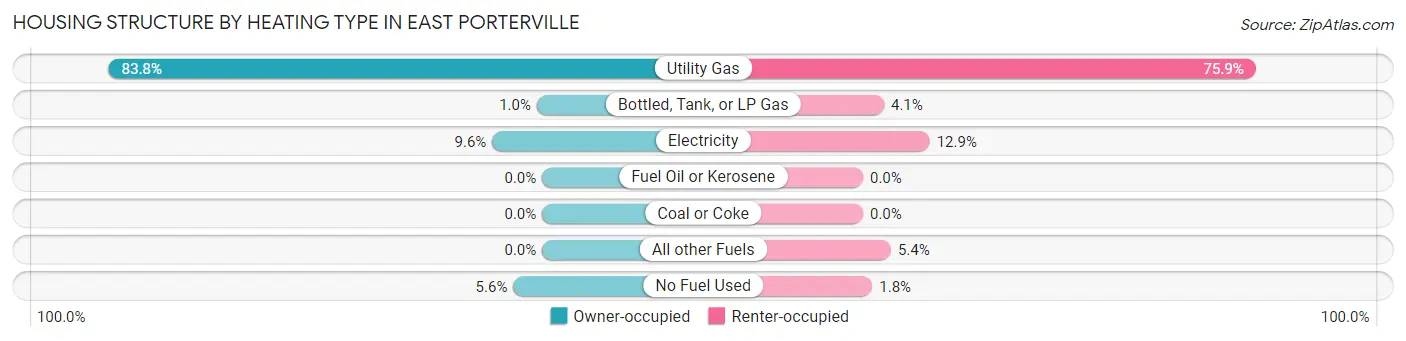
| Heating Type | Owner-occupied | Renter-occupied |
| Utility Gas | 495 (83.8%) | 506 (75.9%) |
| Bottled, Tank, or LP Gas | 6 (1.0%) | 27 (4.1%) |
| Electricity | 57 (9.6%) | 86 (12.9%) |
| Fuel Oil or Kerosene | 0 (0.0%) | 0 (0.0%) |
| Coal or Coke | 0 (0.0%) | 0 (0.0%) |
| All other Fuels | 0 (0.0%) | 36 (5.4%) |
| No Fuel Used | 33 (5.6%) | 12 (1.8%) |
| Total | 591 (100.0%) | 667 (100.0%) |
Household Vehicle Usage in East Porterville
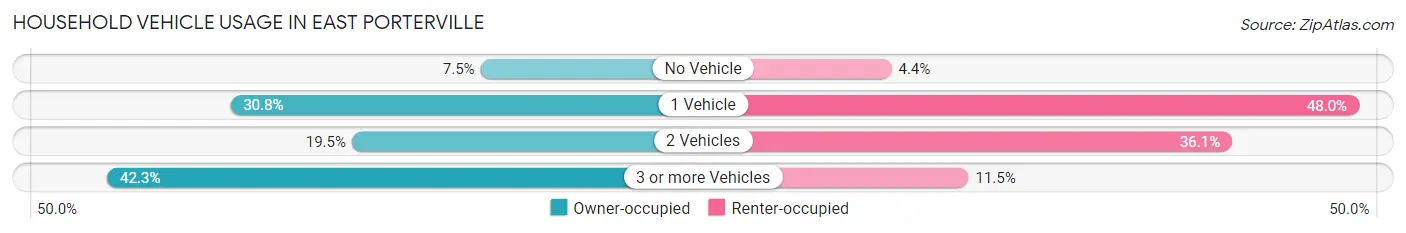
| Vehicles per Household | Owner-occupied | Renter-occupied |
| No Vehicle | 44 (7.4%) | 29 (4.3%) |
| 1 Vehicle | 182 (30.8%) | 320 (48.0%) |
| 2 Vehicles | 115 (19.5%) | 241 (36.1%) |
| 3 or more Vehicles | 250 (42.3%) | 77 (11.5%) |
| Total | 591 (100.0%) | 667 (100.0%) |
Real Estate & Mortgages in East Porterville
Real Estate and Mortgage Overview in East Porterville
| Characteristic | Without Mortgage | With Mortgage |
| Housing Units | 304 | 287 |
| Median Property Value | $144,300 | $164,700 |
| Median Household Income | $33,403 | $7 |
| Monthly Housing Costs | $367 | $8 |
| Real Estate Taxes | $1,089 | $0 |
Property Value by Mortgage Status in East Porterville
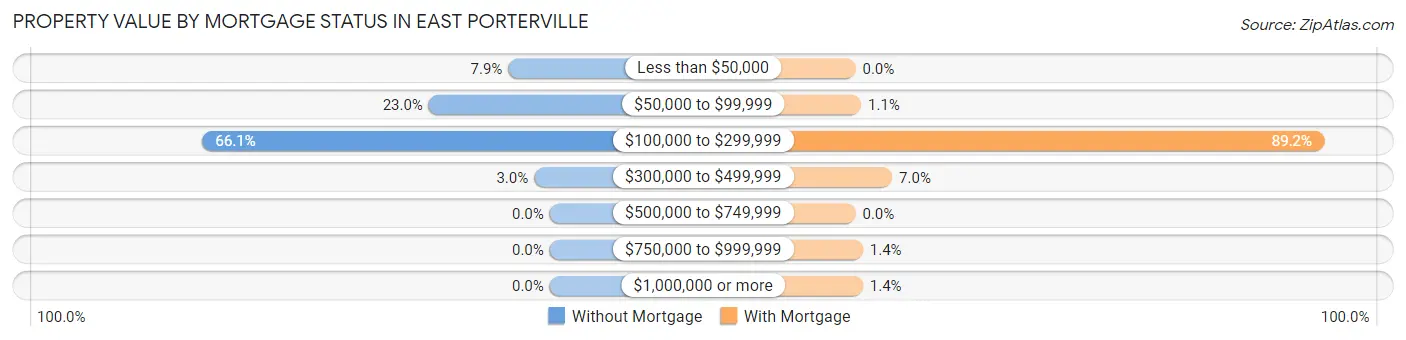
| Property Value | Without Mortgage | With Mortgage |
| Less than $50,000 | 24 (7.9%) | 0 (0.0%) |
| $50,000 to $99,999 | 70 (23.0%) | 3 (1.1%) |
| $100,000 to $299,999 | 201 (66.1%) | 256 (89.2%) |
| $300,000 to $499,999 | 9 (3.0%) | 20 (7.0%) |
| $500,000 to $749,999 | 0 (0.0%) | 0 (0.0%) |
| $750,000 to $999,999 | 0 (0.0%) | 4 (1.4%) |
| $1,000,000 or more | 0 (0.0%) | 4 (1.4%) |
| Total | 304 (100.0%) | 287 (100.0%) |
Household Income by Mortgage Status in East Porterville
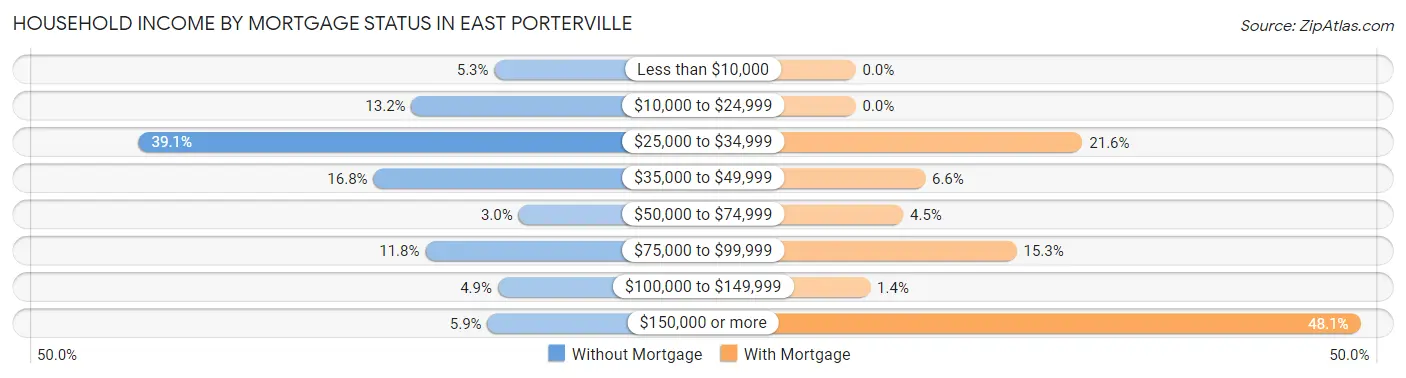
| Household Income | Without Mortgage | With Mortgage |
| Less than $10,000 | 16 (5.3%) | 0 (0.0%) |
| $10,000 to $24,999 | 40 (13.2%) | 0 (0.0%) |
| $25,000 to $34,999 | 119 (39.1%) | 62 (21.6%) |
| $35,000 to $49,999 | 51 (16.8%) | 19 (6.6%) |
| $50,000 to $74,999 | 9 (3.0%) | 13 (4.5%) |
| $75,000 to $99,999 | 36 (11.8%) | 44 (15.3%) |
| $100,000 to $149,999 | 15 (4.9%) | 4 (1.4%) |
| $150,000 or more | 18 (5.9%) | 138 (48.1%) |
| Total | 304 (100.0%) | 287 (100.0%) |
Property Value to Household Income Ratio in East Porterville
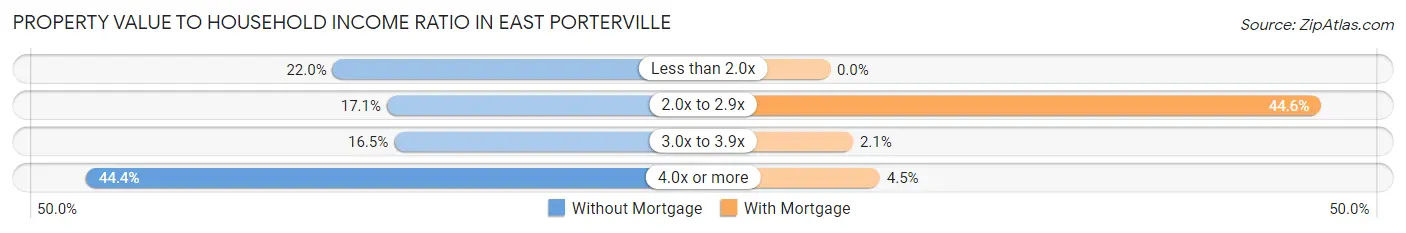
| Value-to-Income Ratio | Without Mortgage | With Mortgage |
| Less than 2.0x | 67 (22.0%) | 0 (0.0%) |
| 2.0x to 2.9x | 52 (17.1%) | 128 (44.6%) |
| 3.0x to 3.9x | 50 (16.5%) | 6 (2.1%) |
| 4.0x or more | 135 (44.4%) | 13 (4.5%) |
| Total | 304 (100.0%) | 287 (100.0%) |
Real Estate Taxes by Mortgage Status in East Porterville
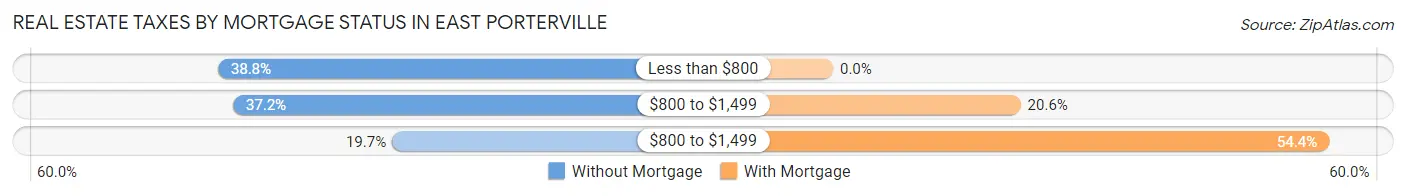
| Property Taxes | Without Mortgage | With Mortgage |
| Less than $800 | 118 (38.8%) | 0 (0.0%) |
| $800 to $1,499 | 113 (37.2%) | 59 (20.6%) |
| $800 to $1,499 | 60 (19.7%) | 156 (54.4%) |
| Total | 304 (100.0%) | 287 (100.0%) |
Health & Disability in East Porterville
Health Insurance Coverage by Age in East Porterville
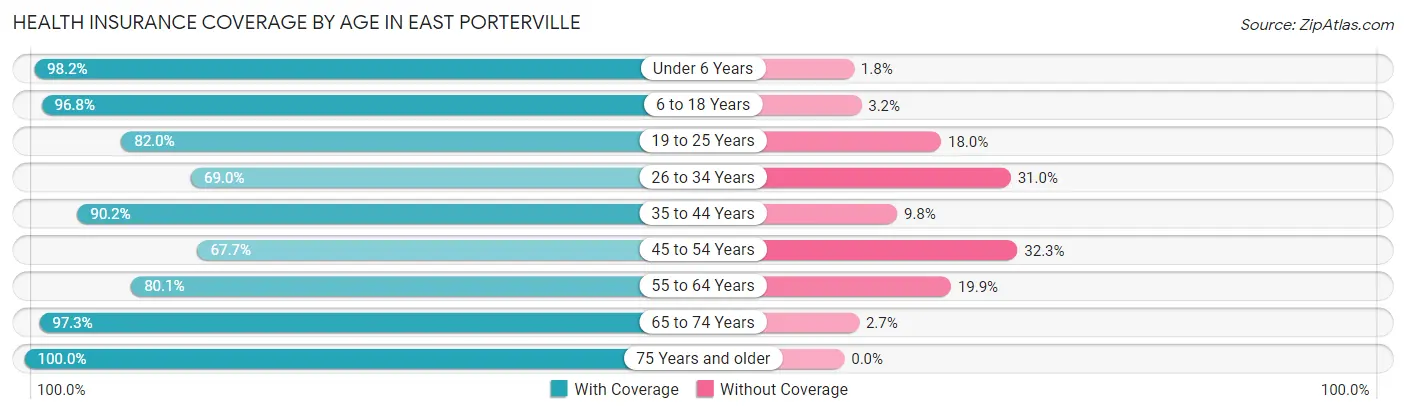
| Age Bracket | With Coverage | Without Coverage |
| Under 6 Years | 549 (98.2%) | 10 (1.8%) |
| 6 to 18 Years | 1,404 (96.8%) | 46 (3.2%) |
| 19 to 25 Years | 459 (82.0%) | 101 (18.0%) |
| 26 to 34 Years | 602 (69.0%) | 271 (31.0%) |
| 35 to 44 Years | 504 (90.2%) | 55 (9.8%) |
| 45 to 54 Years | 277 (67.7%) | 132 (32.3%) |
| 55 to 64 Years | 443 (80.1%) | 110 (19.9%) |
| 65 to 74 Years | 213 (97.3%) | 6 (2.7%) |
| 75 Years and older | 242 (100.0%) | 0 (0.0%) |
| Total | 4,693 (86.5%) | 731 (13.5%) |
Health Insurance Coverage by Citizenship Status in East Porterville
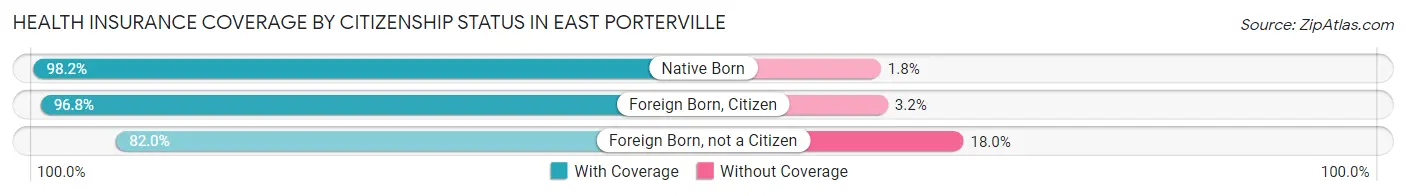
| Citizenship Status | With Coverage | Without Coverage |
| Native Born | 549 (98.2%) | 10 (1.8%) |
| Foreign Born, Citizen | 1,404 (96.8%) | 46 (3.2%) |
| Foreign Born, not a Citizen | 459 (82.0%) | 101 (18.0%) |
Health Insurance Coverage by Household Income in East Porterville
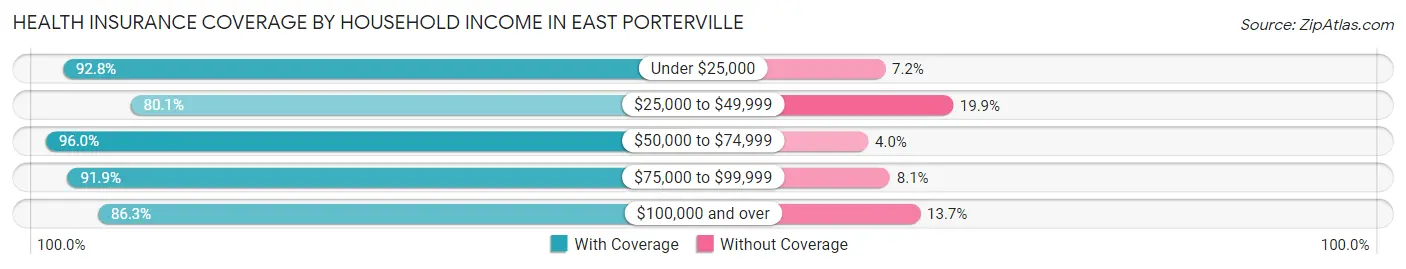
| Household Income | With Coverage | Without Coverage |
| Under $25,000 | 956 (92.8%) | 74 (7.2%) |
| $25,000 to $49,999 | 1,585 (80.1%) | 393 (19.9%) |
| $50,000 to $74,999 | 433 (96.0%) | 18 (4.0%) |
| $75,000 to $99,999 | 342 (91.9%) | 30 (8.1%) |
| $100,000 and over | 1,357 (86.3%) | 216 (13.7%) |
Public vs Private Health Insurance Coverage by Age in East Porterville
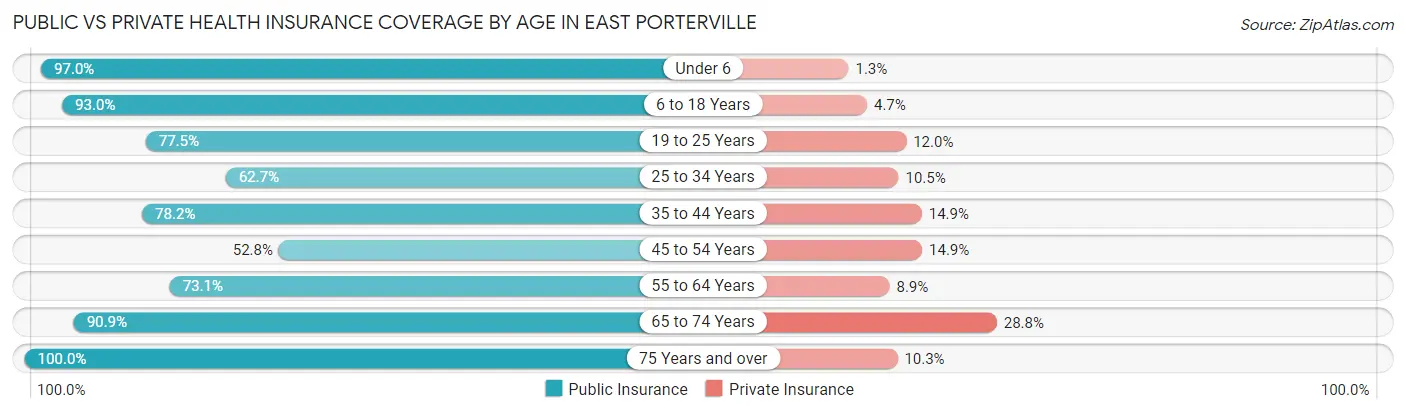
| Age Bracket | Public Insurance | Private Insurance |
| Under 6 | 542 (97.0%) | 7 (1.3%) |
| 6 to 18 Years | 1,349 (93.0%) | 68 (4.7%) |
| 19 to 25 Years | 434 (77.5%) | 67 (12.0%) |
| 25 to 34 Years | 547 (62.7%) | 92 (10.5%) |
| 35 to 44 Years | 437 (78.2%) | 83 (14.8%) |
| 45 to 54 Years | 216 (52.8%) | 61 (14.9%) |
| 55 to 64 Years | 404 (73.1%) | 49 (8.9%) |
| 65 to 74 Years | 199 (90.9%) | 63 (28.8%) |
| 75 Years and over | 242 (100.0%) | 25 (10.3%) |
| Total | 4,370 (80.6%) | 515 (9.5%) |
Disability Status by Sex by Age in East Porterville
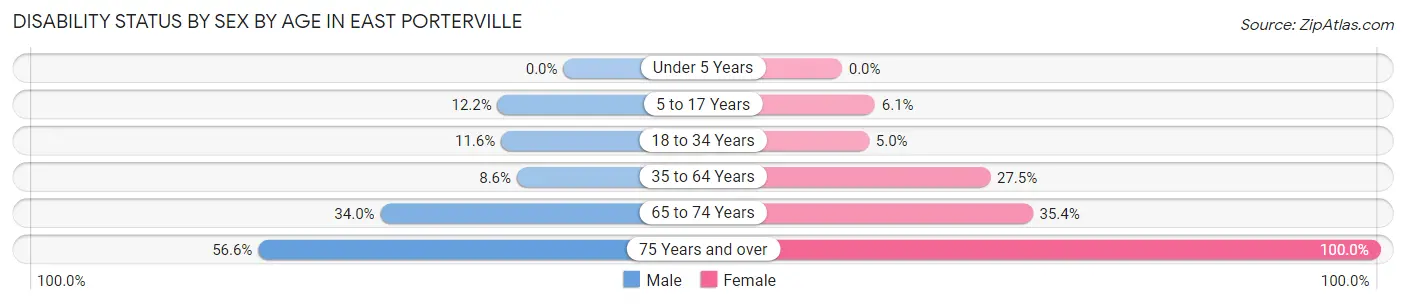
| Age Bracket | Male | Female |
| Under 5 Years | 0 (0.0%) | 0 (0.0%) |
| 5 to 17 Years | 92 (12.2%) | 41 (6.1%) |
| 18 to 34 Years | 93 (11.6%) | 42 (5.0%) |
| 35 to 64 Years | 67 (8.6%) | 205 (27.5%) |
| 65 to 74 Years | 36 (34.0%) | 40 (35.4%) |
| 75 Years and over | 81 (56.6%) | 99 (100.0%) |
Disability Class by Sex by Age in East Porterville
Disability Class: Hearing Difficulty
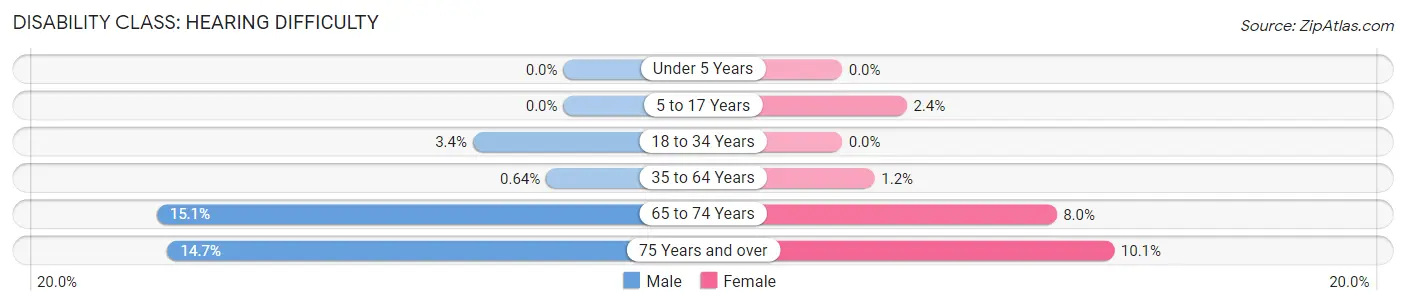
| Age Bracket | Male | Female |
| Under 5 Years | 0 (0.0%) | 0 (0.0%) |
| 5 to 17 Years | 0 (0.0%) | 16 (2.4%) |
| 18 to 34 Years | 27 (3.4%) | 0 (0.0%) |
| 35 to 64 Years | 5 (0.6%) | 9 (1.2%) |
| 65 to 74 Years | 16 (15.1%) | 9 (8.0%) |
| 75 Years and over | 21 (14.7%) | 10 (10.1%) |
Disability Class: Vision Difficulty
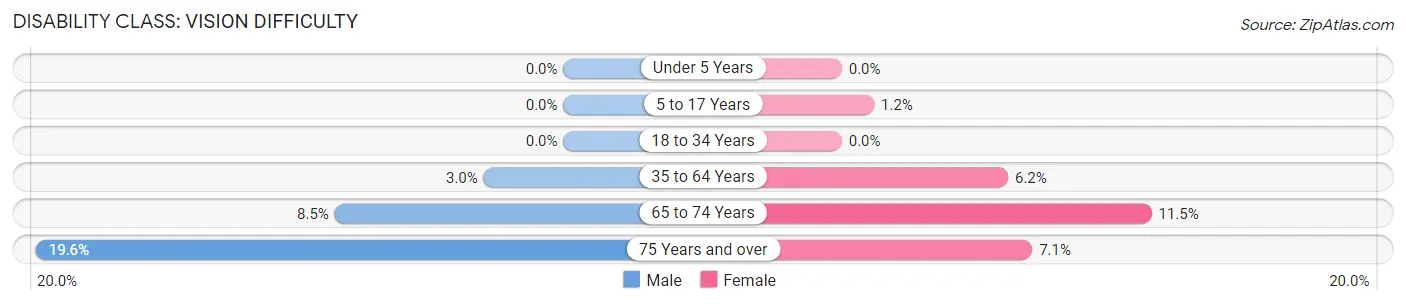
| Age Bracket | Male | Female |
| Under 5 Years | 0 (0.0%) | 0 (0.0%) |
| 5 to 17 Years | 0 (0.0%) | 8 (1.2%) |
| 18 to 34 Years | 0 (0.0%) | 0 (0.0%) |
| 35 to 64 Years | 23 (3.0%) | 46 (6.2%) |
| 65 to 74 Years | 9 (8.5%) | 13 (11.5%) |
| 75 Years and over | 28 (19.6%) | 7 (7.1%) |
Disability Class: Cognitive Difficulty
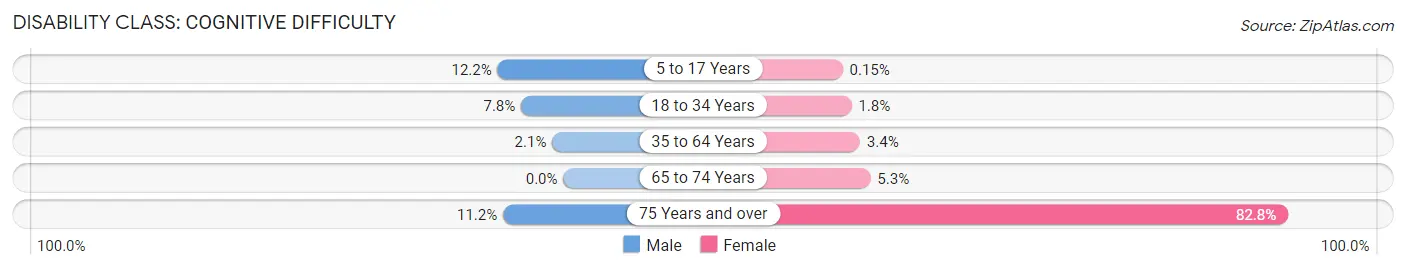
| Age Bracket | Male | Female |
| 5 to 17 Years | 92 (12.2%) | 1 (0.2%) |
| 18 to 34 Years | 63 (7.8%) | 15 (1.8%) |
| 35 to 64 Years | 16 (2.1%) | 25 (3.4%) |
| 65 to 74 Years | 0 (0.0%) | 6 (5.3%) |
| 75 Years and over | 16 (11.2%) | 82 (82.8%) |
Disability Class: Ambulatory Difficulty
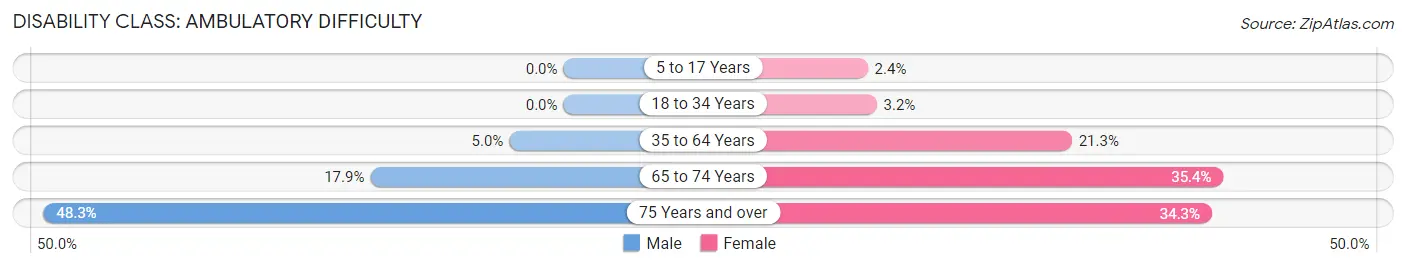
| Age Bracket | Male | Female |
| 5 to 17 Years | 0 (0.0%) | 16 (2.4%) |
| 18 to 34 Years | 0 (0.0%) | 27 (3.2%) |
| 35 to 64 Years | 39 (5.0%) | 159 (21.3%) |
| 65 to 74 Years | 19 (17.9%) | 40 (35.4%) |
| 75 Years and over | 69 (48.2%) | 34 (34.3%) |
Disability Class: Self-Care Difficulty
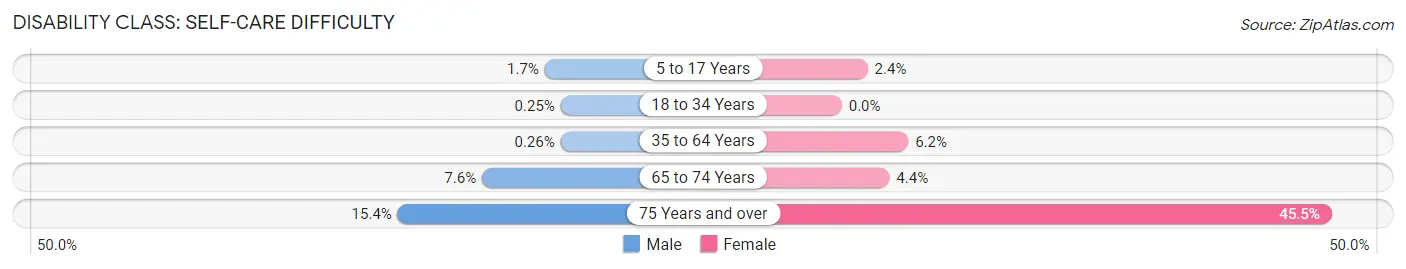
| Age Bracket | Male | Female |
| 5 to 17 Years | 13 (1.7%) | 16 (2.4%) |
| 18 to 34 Years | 2 (0.3%) | 0 (0.0%) |
| 35 to 64 Years | 2 (0.3%) | 46 (6.2%) |
| 65 to 74 Years | 8 (7.5%) | 5 (4.4%) |
| 75 Years and over | 22 (15.4%) | 45 (45.5%) |
Technology Access in East Porterville
Computing Device Access in East Porterville
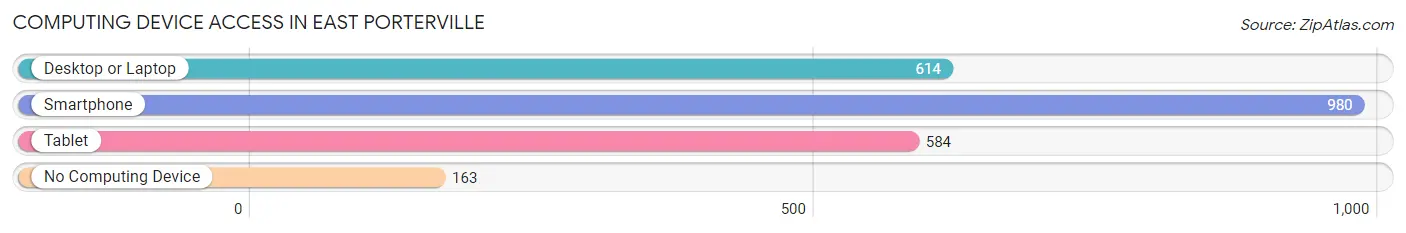
| Device Type | # Households | % Households |
| Desktop or Laptop | 614 | 48.8% |
| Smartphone | 980 | 77.9% |
| Tablet | 584 | 46.4% |
| No Computing Device | 163 | 13.0% |
| Total | 1,258 | 100.0% |
Internet Access in East Porterville
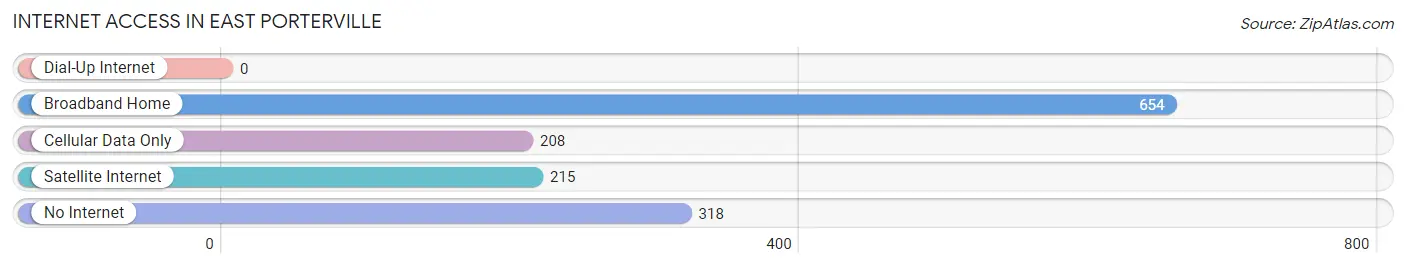
| Internet Type | # Households | % Households |
| Dial-Up Internet | 0 | 0.0% |
| Broadband Home | 654 | 52.0% |
| Cellular Data Only | 208 | 16.5% |
| Satellite Internet | 215 | 17.1% |
| No Internet | 318 | 25.3% |
| Total | 1,258 | 100.0% |
East Porterville Summary
History
East Porterville is a small unincorporated community located in Tulare County, California. It is situated in the foothills of the Sierra Nevada Mountains, approximately 10 miles east of Porterville. The area was first settled in the late 1800s by ranchers and farmers, and the town was officially established in the early 1900s.
The town was originally known as East Porterville, but the name was changed to East Porterville in the 1950s. The town was named after the nearby Porterville, which was named after Benjamin Porter, a local rancher.
East Porterville has a long and rich history. It was once a thriving agricultural community, with many farms and ranches in the area. The town was also home to a number of businesses, including a general store, a blacksmith shop, a post office, and a school.
In the late 1960s, the town began to decline as the local economy shifted away from agriculture. Many of the businesses closed, and the population began to decline. In the 1980s, the town was hit hard by the drought, and many of the farms and ranches were abandoned.
In the 1990s, the town began to experience a resurgence. The population began to grow again, and new businesses began to open. Today, East Porterville is a small but vibrant community, with a population of approximately 2,000 people.
Geography
East Porterville is located in the foothills of the Sierra Nevada Mountains, approximately 10 miles east of Porterville. The town is situated at an elevation of 1,400 feet, and is surrounded by rolling hills and oak trees. The climate is mild, with hot summers and cool winters.
The town is located in the Central Valley of California, and is part of the Tulare County. The nearest major cities are Fresno, Bakersfield, and Visalia.
Economy
East Porterville is a small, rural community with a population of approximately 2,000 people. The local economy is largely based on agriculture, with many farms and ranches in the area. The town is also home to a number of small businesses, including a general store, a post office, and a school.
The town is also home to a number of small manufacturing businesses, including a furniture factory and a metal fabrication shop. The town is also home to a number of service businesses, including a gas station, a restaurant, and a bar.
Demographics
As of the 2010 census, the population of East Porterville was 2,000 people. The racial makeup of the town was 75.3% White, 0.7% African American, 0.3% Native American, 0.3% Asian, 0.1% Pacific Islander, and 22.6% from other races. The median household income was $30,000, and the median age was 33.
East Porterville is a small, rural community with a diverse population. The town is home to a number of different cultures, including Mexican, Filipino, and Native American. The town is also home to a number of churches, including Catholic, Baptist, and Methodist.
Common Questions
What is the Total Population of East Porterville?
Total Population of East Porterville is 5,424.
What is the Total Male Population of East Porterville?
Total Male Population of East Porterville is 2,840.
What is the Total Female Population of East Porterville?
Total Female Population of East Porterville is 2,584.
What is the Ratio of Males per 100 Females in East Porterville?
There are 109.91 Males per 100 Females in East Porterville.
What is the Ratio of Females per 100 Males in East Porterville?
There are 90.99 Females per 100 Males in East Porterville.
What is the Median Population Age in East Porterville?
Median Population Age in East Porterville is 28.3 Years.
What is the Average Family Size in East Porterville
Average Family Size in East Porterville is 4.9 People.
What is the Average Household Size in East Porterville
Average Household Size in East Porterville is 4.3 People.
What is Per Capita Income in East Porterville?
Per Capita income in East Porterville is $12,588.
What is the Median Family Income in East Porterville?
Median Family Income in East Porterville is $35,606.
What is the Median Household income in East Porterville?
Median Household Income in East Porterville is $31,816.
What is Income or Wage Gap in East Porterville?
Income or Wage Gap in East Porterville is 6.2%.
Women in East Porterville earn 93.8 cents for every dollar earned by a man.
What is Family Income Deficit in East Porterville?
Family Income Deficit in East Porterville is $9,225.
Families that are below poverty line in East Porterville earn $9,225 less on average than the poverty threshold level.
What is Inequality or Gini Index in East Porterville?
Inequality or Gini Index in East Porterville is 0.48.
How Large is the Labor Force in East Porterville?
There are 2,127 People in the Labor Forcein in East Porterville.
What is the Percentage of People in the Labor Force in East Porterville?
55.0% of People are in the Labor Force in East Porterville.
What is the Unemployment Rate in East Porterville?
Unemployment Rate in East Porterville is 25.4%.