Del Rey Oaks, CA
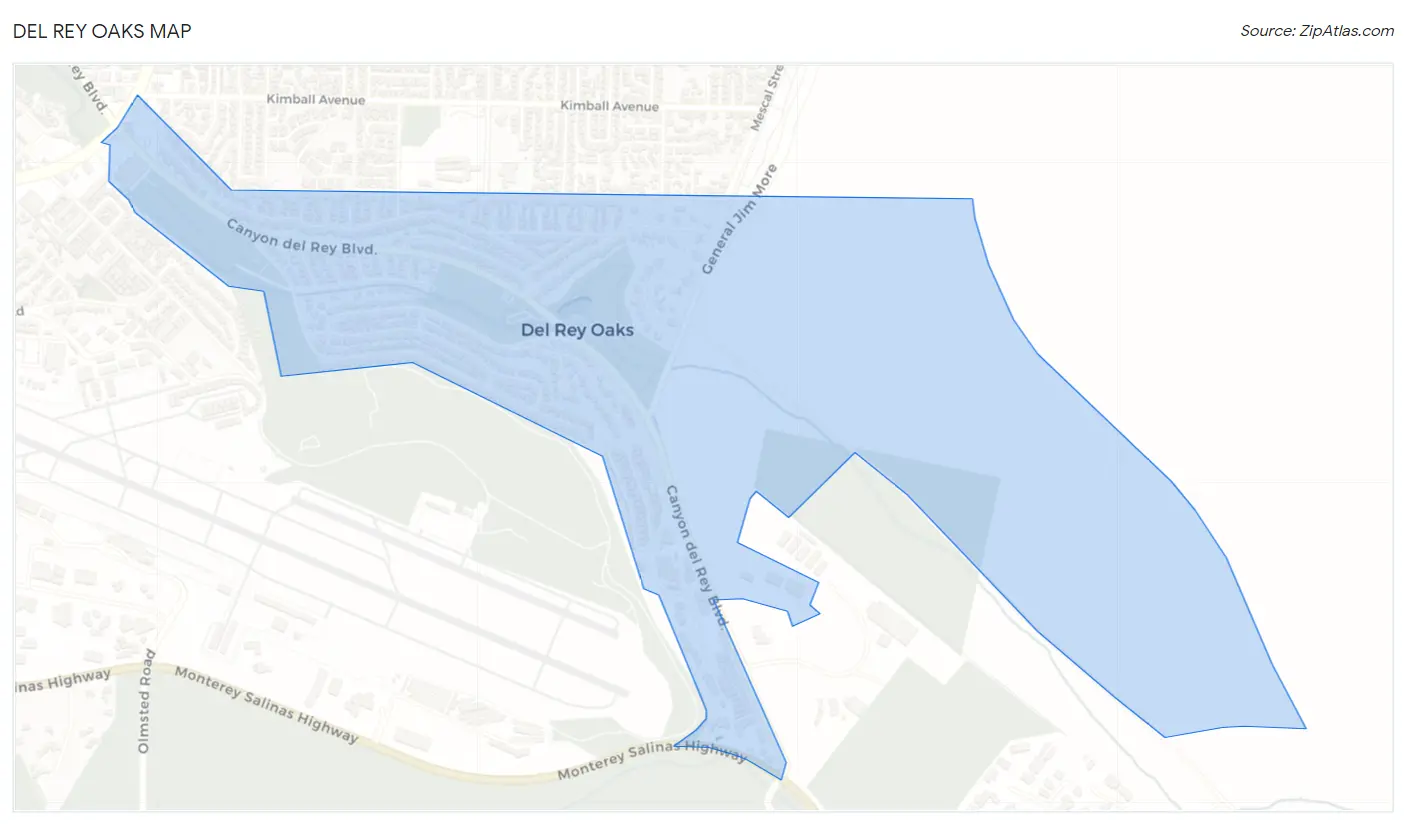
Del Rey Oaks Map
Del Rey Oaks Overview
1,611
TOTAL POPULATION
732
MALE POPULATION
879
FEMALE POPULATION
83.28
MALES / 100 FEMALES
120.08
FEMALES / 100 MALES
49.9
MEDIAN AGE
3.0
AVG FAMILY SIZE
2.5
AVG HOUSEHOLD SIZE
$58,890
PER CAPITA INCOME
$131,875
AVG FAMILY INCOME
$121,667
AVG HOUSEHOLD INCOME
25.3%
WAGE / INCOME GAP [ % ]
74.7¢/ $1
WAGE / INCOME GAP [ $ ]
0.39
INEQUALITY / GINI INDEX
951
LABOR FORCE [ PEOPLE ]
67.0%
PERCENT IN LABOR FORCE
11.3%
UNEMPLOYMENT RATE
Del Rey Oaks Area Codes
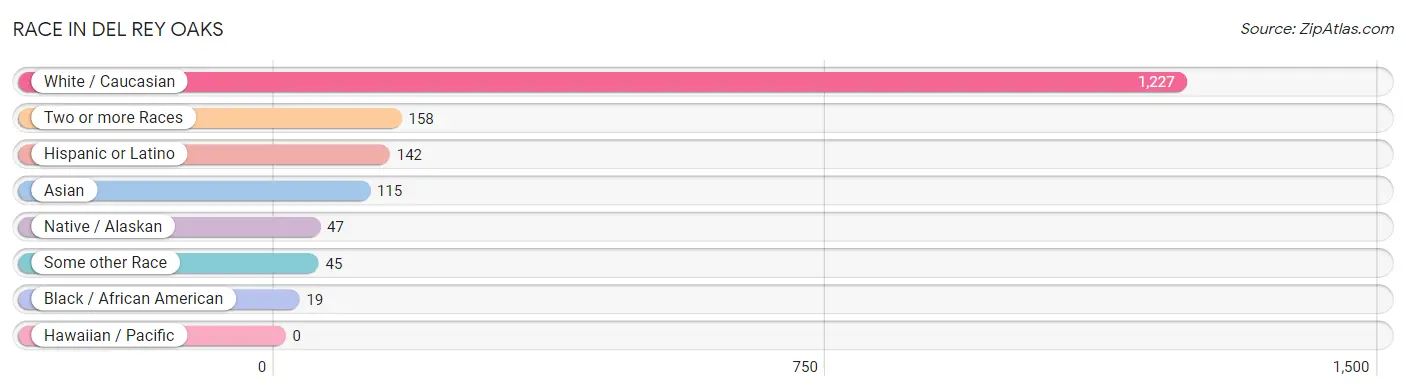
Race in Del Rey Oaks
The most populous races in Del Rey Oaks are White / Caucasian (1,227 | 76.2%), Two or more Races (158 | 9.8%), and Hispanic or Latino (142 | 8.8%).
| Race | # Population | % Population |
| Asian | 115 | 7.1% |
| Black / African American | 19 | 1.2% |
| Hawaiian / Pacific | 0 | 0.0% |
| Hispanic or Latino | 142 | 8.8% |
| Native / Alaskan | 47 | 2.9% |
| White / Caucasian | 1,227 | 76.2% |
| Two or more Races | 158 | 9.8% |
| Some other Race | 45 | 2.8% |
| Total | 1,611 | 100.0% |
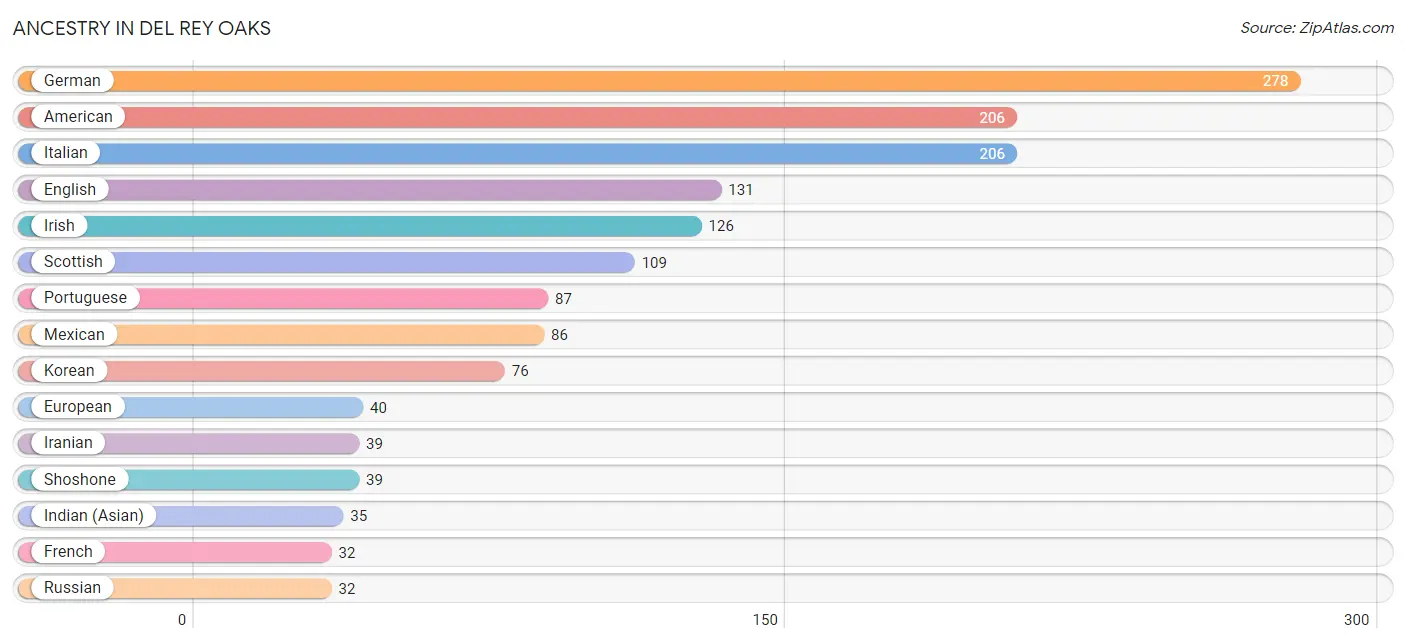
Ancestry in Del Rey Oaks
The most populous ancestries reported in Del Rey Oaks are German (278 | 17.3%), American (206 | 12.8%), Italian (206 | 12.8%), English (131 | 8.1%), and Irish (126 | 7.8%), together accounting for 58.8% of all Del Rey Oaks residents.
| Ancestry | # Population | % Population |
| African | 14 | 0.9% |
| American | 206 | 12.8% |
| Arab | 2 | 0.1% |
| Argentinean | 12 | 0.7% |
| Armenian | 15 | 0.9% |
| Austrian | 13 | 0.8% |
| Basque | 7 | 0.4% |
| Belgian | 2 | 0.1% |
| Bhutanese | 21 | 1.3% |
| Brazilian | 4 | 0.3% |
| British | 22 | 1.4% |
| Burmese | 7 | 0.4% |
| Canadian | 12 | 0.7% |
| Central American | 4 | 0.3% |
| Central American Indian | 11 | 0.7% |
| Cherokee | 15 | 0.9% |
| Choctaw | 4 | 0.3% |
| Colombian | 7 | 0.4% |
| Croatian | 3 | 0.2% |
| Czech | 3 | 0.2% |
| Czechoslovakian | 3 | 0.2% |
| Dutch | 9 | 0.6% |
| English | 131 | 8.1% |
| European | 40 | 2.5% |
| French | 32 | 2.0% |
| French Canadian | 9 | 0.6% |
| German | 278 | 17.3% |
| Greek | 4 | 0.3% |
| Guamanian / Chamorro | 3 | 0.2% |
| Guatemalan | 4 | 0.3% |
| Hungarian | 16 | 1.0% |
| Indian (Asian) | 35 | 2.2% |
| Iranian | 39 | 2.4% |
| Irish | 126 | 7.8% |
| Italian | 206 | 12.8% |
| Korean | 76 | 4.7% |
| Laotian | 2 | 0.1% |
| Latvian | 3 | 0.2% |
| Mexican | 86 | 5.3% |
| Mexican American Indian | 8 | 0.5% |
| Navajo | 5 | 0.3% |
| Northern European | 12 | 0.7% |
| Norwegian | 16 | 1.0% |
| Polish | 12 | 0.7% |
| Portuguese | 87 | 5.4% |
| Puerto Rican | 3 | 0.2% |
| Russian | 32 | 2.0% |
| Scotch-Irish | 9 | 0.6% |
| Scottish | 109 | 6.8% |
| Shoshone | 39 | 2.4% |
| South American | 19 | 1.2% |
| Spaniard | 11 | 0.7% |
| Spanish | 15 | 0.9% |
| Sri Lankan | 8 | 0.5% |
| Subsaharan African | 14 | 0.9% |
| Swedish | 20 | 1.2% |
| Swiss | 3 | 0.2% |
| Turkish | 5 | 0.3% |
| Ukrainian | 3 | 0.2% |
| Welsh | 6 | 0.4% |
| Yugoslavian | 3 | 0.2% | View All 61 Rows |
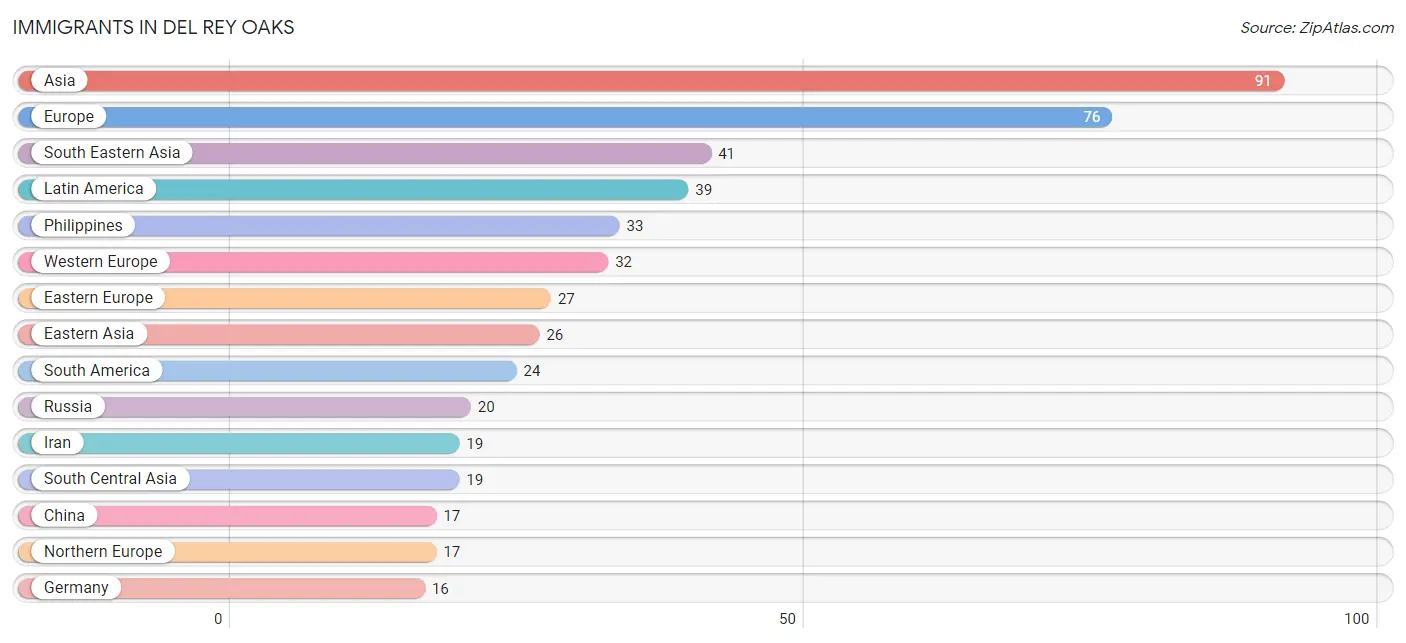
Immigrants in Del Rey Oaks
The most numerous immigrant groups reported in Del Rey Oaks came from Asia (91 | 5.7%), Europe (76 | 4.7%), South Eastern Asia (41 | 2.5%), Latin America (39 | 2.4%), and Philippines (33 | 2.1%), together accounting for 17.4% of all Del Rey Oaks residents.
| Immigration Origin | # Population | % Population |
| Africa | 2 | 0.1% |
| Argentina | 13 | 0.8% |
| Asia | 91 | 5.7% |
| Austria | 9 | 0.6% |
| Belgium | 2 | 0.1% |
| Brazil | 4 | 0.3% |
| Canada | 3 | 0.2% |
| Central America | 15 | 0.9% |
| China | 17 | 1.1% |
| Colombia | 7 | 0.4% |
| Eastern Asia | 26 | 1.6% |
| Eastern Europe | 27 | 1.7% |
| El Salvador | 4 | 0.3% |
| England | 8 | 0.5% |
| Europe | 76 | 4.7% |
| France | 3 | 0.2% |
| Germany | 16 | 1.0% |
| Guatemala | 4 | 0.3% |
| Hungary | 3 | 0.2% |
| Indonesia | 2 | 0.1% |
| Iran | 19 | 1.2% |
| Ireland | 3 | 0.2% |
| Japan | 2 | 0.1% |
| Korea | 7 | 0.4% |
| Latin America | 39 | 2.4% |
| Mexico | 7 | 0.4% |
| Netherlands | 2 | 0.1% |
| Northern Europe | 17 | 1.1% |
| Philippines | 33 | 2.1% |
| Russia | 20 | 1.2% |
| South America | 24 | 1.5% |
| South Central Asia | 19 | 1.2% |
| South Eastern Asia | 41 | 2.5% |
| Taiwan | 4 | 0.3% |
| Turkey | 5 | 0.3% |
| Vietnam | 6 | 0.4% |
| Western Asia | 5 | 0.3% |
| Western Europe | 32 | 2.0% | View All 38 Rows |
Sex and Age in Del Rey Oaks
Sex and Age in Del Rey Oaks
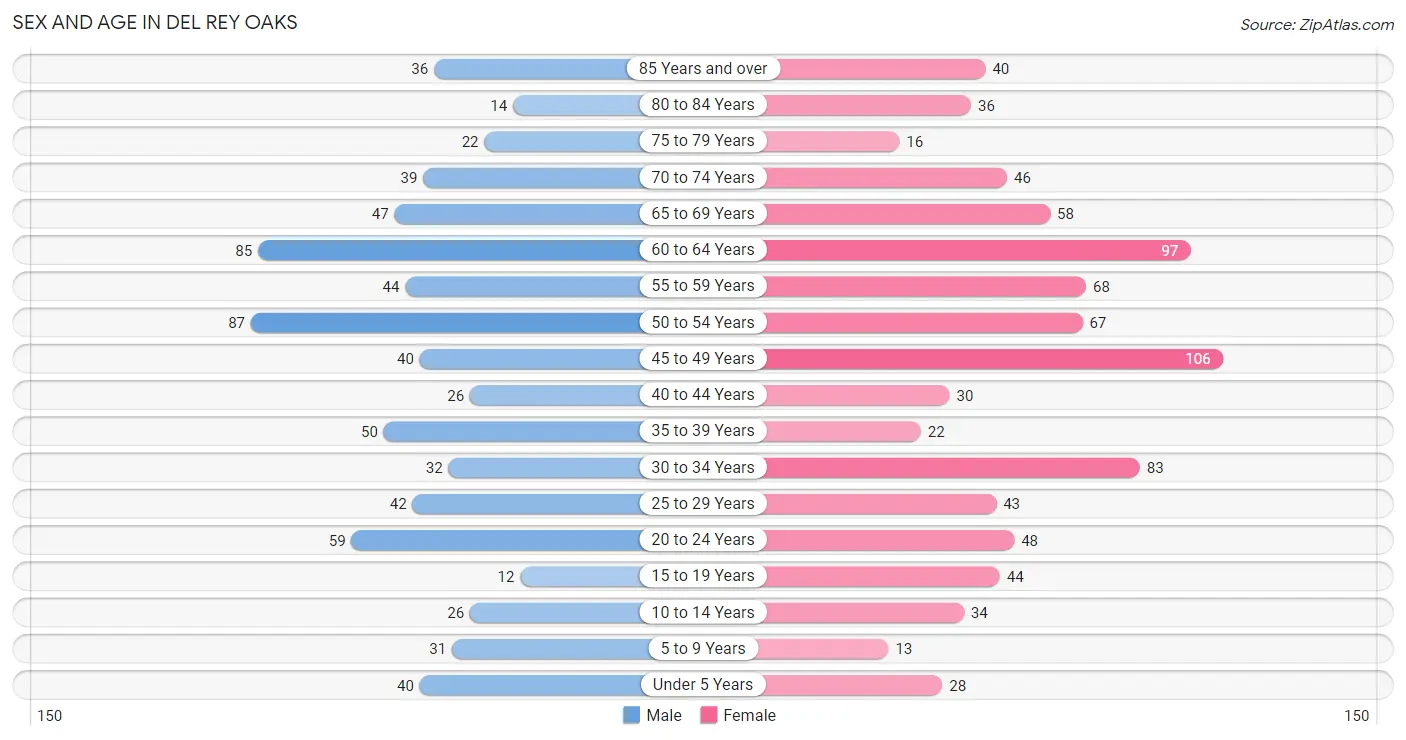
The most populous age groups in Del Rey Oaks are 50 to 54 Years (87 | 11.9%) for men and 45 to 49 Years (106 | 12.1%) for women.
| Age Bracket | Male | Female |
| Under 5 Years | 40 (5.5%) | 28 (3.2%) |
| 5 to 9 Years | 31 (4.2%) | 13 (1.5%) |
| 10 to 14 Years | 26 (3.5%) | 34 (3.9%) |
| 15 to 19 Years | 12 (1.6%) | 44 (5.0%) |
| 20 to 24 Years | 59 (8.1%) | 48 (5.5%) |
| 25 to 29 Years | 42 (5.7%) | 43 (4.9%) |
| 30 to 34 Years | 32 (4.4%) | 83 (9.4%) |
| 35 to 39 Years | 50 (6.8%) | 22 (2.5%) |
| 40 to 44 Years | 26 (3.5%) | 30 (3.4%) |
| 45 to 49 Years | 40 (5.5%) | 106 (12.1%) |
| 50 to 54 Years | 87 (11.9%) | 67 (7.6%) |
| 55 to 59 Years | 44 (6.0%) | 68 (7.7%) |
| 60 to 64 Years | 85 (11.6%) | 97 (11.0%) |
| 65 to 69 Years | 47 (6.4%) | 58 (6.6%) |
| 70 to 74 Years | 39 (5.3%) | 46 (5.2%) |
| 75 to 79 Years | 22 (3.0%) | 16 (1.8%) |
| 80 to 84 Years | 14 (1.9%) | 36 (4.1%) |
| 85 Years and over | 36 (4.9%) | 40 (4.5%) |
| Total | 732 (100.0%) | 879 (100.0%) |
Families and Households in Del Rey Oaks
Median Family Size in Del Rey Oaks
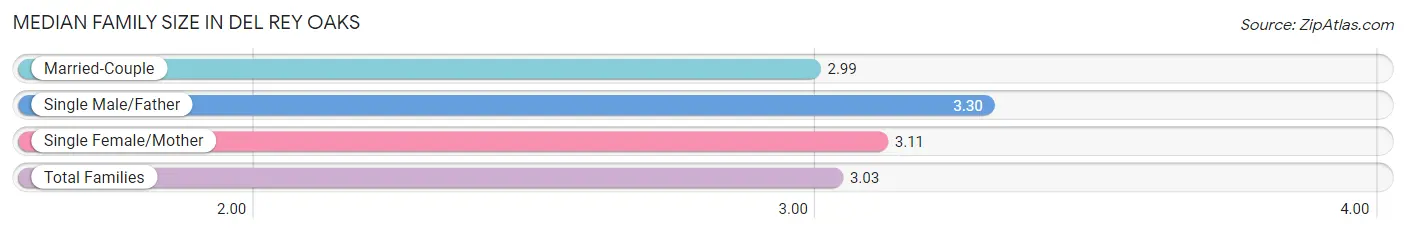
The median family size in Del Rey Oaks is 3.03 persons per family, with single male/father families (27 | 6.5%) accounting for the largest median family size of 3.3 persons per family. On the other hand, married-couple families (322 | 77.6%) represent the smallest median family size with 2.99 persons per family.
| Family Type | # Families | Family Size |
| Married-Couple | 322 (77.6%) | 2.99 |
| Single Male/Father | 27 (6.5%) | 3.30 |
| Single Female/Mother | 66 (15.9%) | 3.11 |
| Total Families | 415 (100.0%) | 3.03 |
Median Household Size in Del Rey Oaks
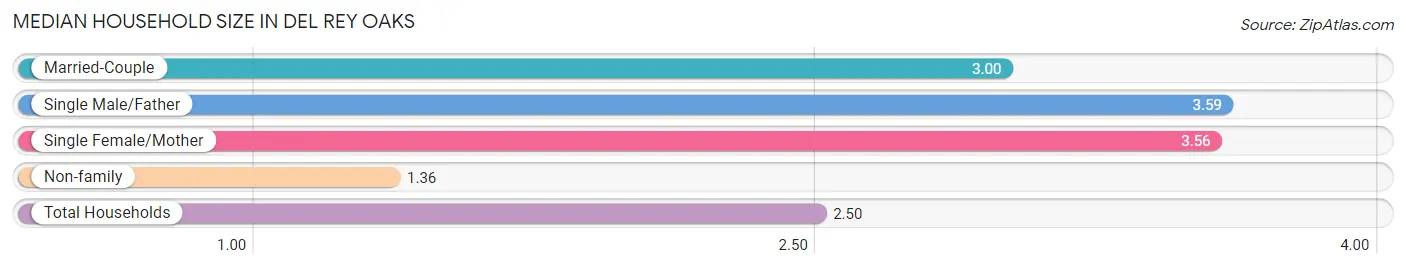
The median household size in Del Rey Oaks is 2.50 persons per household, with single male/father households (27 | 4.2%) accounting for the largest median household size of 3.59 persons per household. non-family households (229 | 35.6%) represent the smallest median household size with 1.36 persons per household.
| Household Type | # Households | Household Size |
| Married-Couple | 322 (50.0%) | 3.00 |
| Single Male/Father | 27 (4.2%) | 3.59 |
| Single Female/Mother | 66 (10.2%) | 3.56 |
| Non-family | 229 (35.6%) | 1.36 |
| Total Households | 644 (100.0%) | 2.50 |
Household Size by Marriage Status in Del Rey Oaks
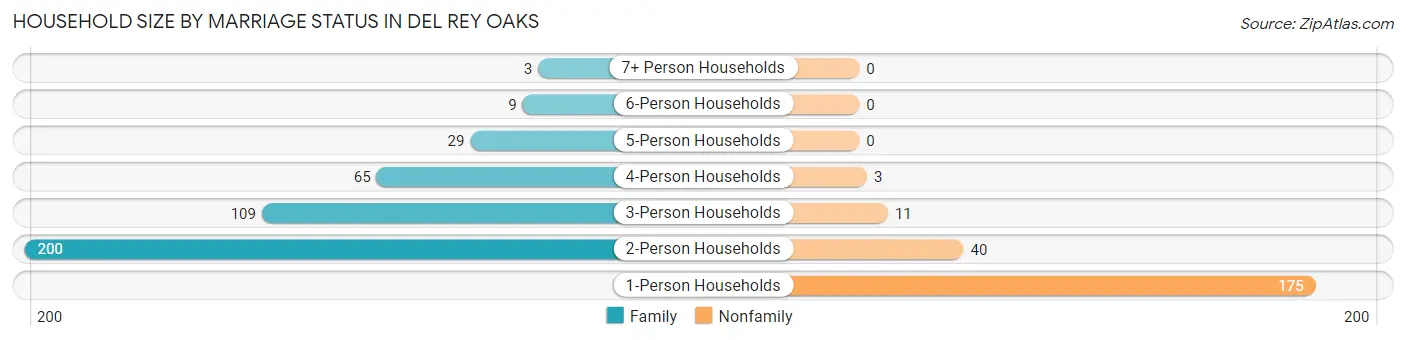
Out of a total of 644 households in Del Rey Oaks, 415 (64.4%) are family households, while 229 (35.6%) are nonfamily households. The most numerous type of family households are 2-person households, comprising 200, and the most common type of nonfamily households are 1-person households, comprising 175.
| Household Size | Family Households | Nonfamily Households |
| 1-Person Households | - | 175 (27.2%) |
| 2-Person Households | 200 (31.1%) | 40 (6.2%) |
| 3-Person Households | 109 (16.9%) | 11 (1.7%) |
| 4-Person Households | 65 (10.1%) | 3 (0.5%) |
| 5-Person Households | 29 (4.5%) | 0 (0.0%) |
| 6-Person Households | 9 (1.4%) | 0 (0.0%) |
| 7+ Person Households | 3 (0.5%) | 0 (0.0%) |
| Total | 415 (64.4%) | 229 (35.6%) |
Female Fertility in Del Rey Oaks
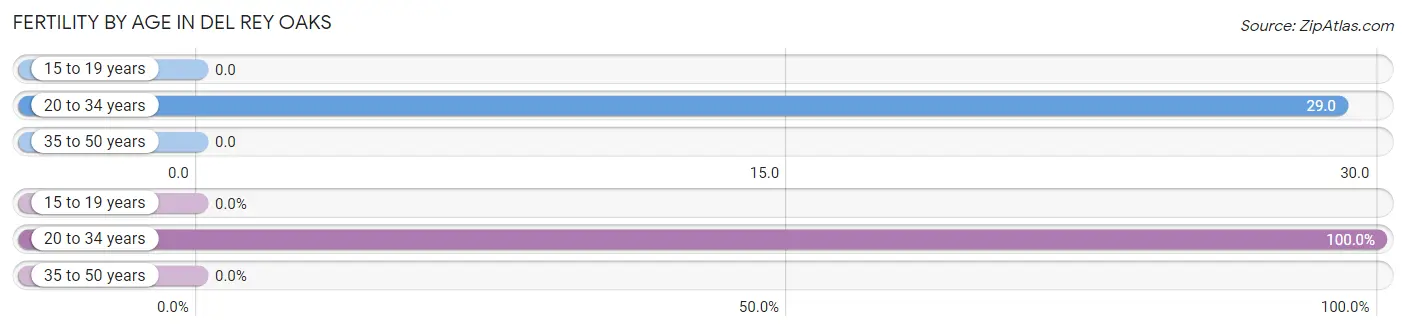
Fertility by Age in Del Rey Oaks
Average fertility rate in Del Rey Oaks is 13.0 births per 1,000 women. Women in the age bracket of 20 to 34 years have the highest fertility rate with 29.0 births per 1,000 women. Women in the age bracket of 20 to 34 years acount for 100.0% of all women with births.
| Age Bracket | Women with Births | Births / 1,000 Women |
| 15 to 19 years | 0 (0.0%) | 0.0 |
| 20 to 34 years | 5 (100.0%) | 29.0 |
| 35 to 50 years | 0 (0.0%) | 0.0 |
| Total | 5 (100.0%) | 13.0 |
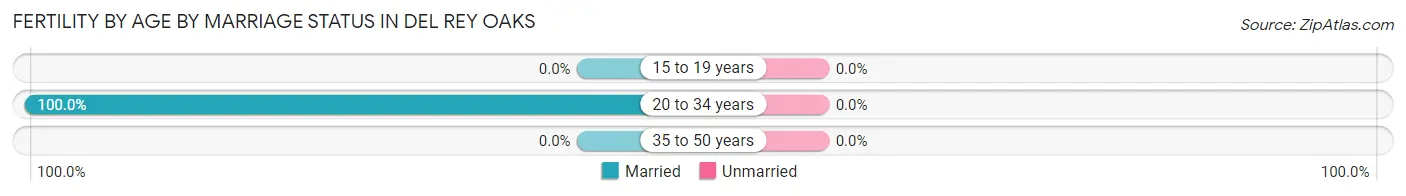
Fertility by Age by Marriage Status in Del Rey Oaks
| Age Bracket | Married | Unmarried |
| 15 to 19 years | 0 (0.0%) | 0 (0.0%) |
| 20 to 34 years | 5 (100.0%) | 0 (0.0%) |
| 35 to 50 years | 0 (0.0%) | 0 (0.0%) |
| Total | 5 (100.0%) | 0 (0.0%) |
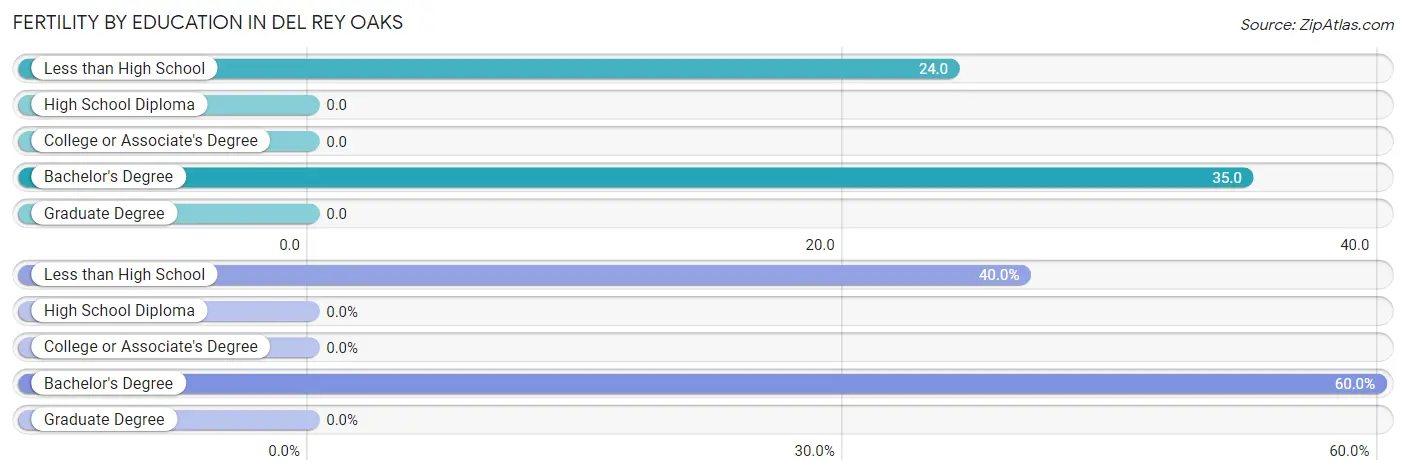
Fertility by Education in Del Rey Oaks
| Educational Attainment | Women with Births | Births / 1,000 Women |
| Less than High School | 2 (40.0%) | 24.0 |
| High School Diploma | 0 (0.0%) | 0.0 |
| College or Associate's Degree | 0 (0.0%) | 0.0 |
| Bachelor's Degree | 3 (60.0%) | 35.0 |
| Graduate Degree | 0 (0.0%) | 0.0 |
| Total | 5 (100.0%) | 13.0 |
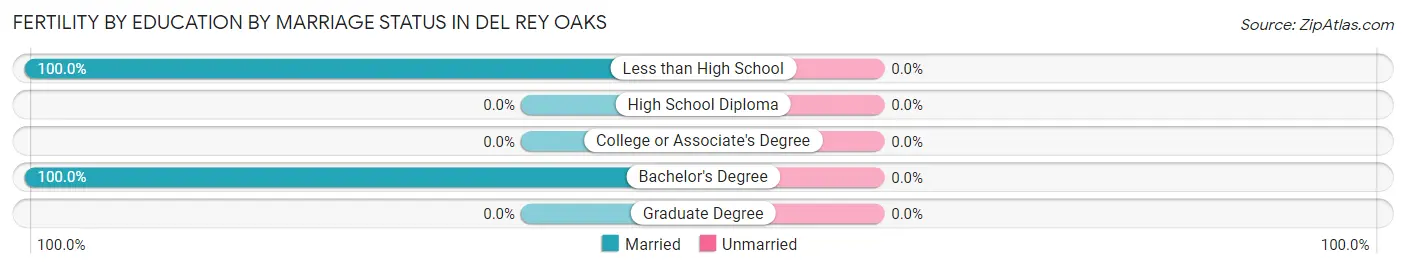
Fertility by Education by Marriage Status in Del Rey Oaks
| Educational Attainment | Married | Unmarried |
| Less than High School | 2 (100.0%) | 0 (0.0%) |
| High School Diploma | 0 (0.0%) | 0 (0.0%) |
| College or Associate's Degree | 0 (0.0%) | 0 (0.0%) |
| Bachelor's Degree | 3 (100.0%) | 0 (0.0%) |
| Graduate Degree | 0 (0.0%) | 0 (0.0%) |
| Total | 5 (100.0%) | 0 (0.0%) |
Income in Del Rey Oaks
Income Overview in Del Rey Oaks
Per Capita Income in Del Rey Oaks is $58,890, while median incomes of families and households are $131,875 and $121,667 respectively.
| Characteristic | Number | Measure |
| Per Capita Income | 1,611 | $58,890 |
| Median Family Income | 415 | $131,875 |
| Mean Family Income | 415 | $162,503 |
| Median Household Income | 644 | $121,667 |
| Mean Household Income | 644 | $142,050 |
| Income Deficit | 415 | $0 |
| Wage / Income Gap (%) | 1,611 | 25.32% |
| Wage / Income Gap ($) | 1,611 | 74.68¢ per $1 |
| Gini / Inequality Index | 1,611 | 0.39 |
Earnings by Sex in Del Rey Oaks
Average Earnings in Del Rey Oaks are $58,315, $69,464 for men and $51,875 for women, a difference of 25.3%.
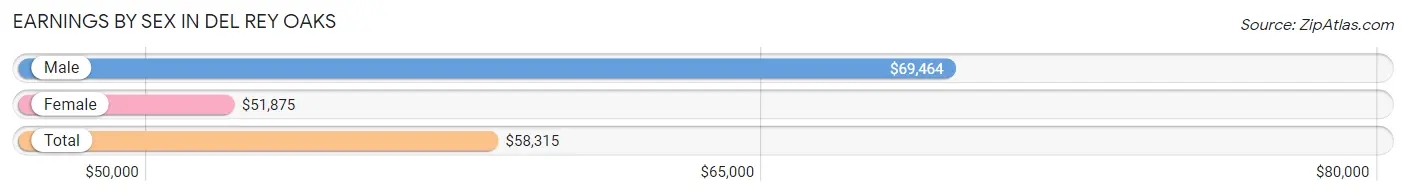
| Sex | Number | Average Earnings |
| Male | 505 (49.7%) | $69,464 |
| Female | 511 (50.3%) | $51,875 |
| Total | 1,016 (100.0%) | $58,315 |
Earnings by Sex by Income Bracket in Del Rey Oaks
The most common earnings brackets in Del Rey Oaks are $100,000+ for men (178 | 35.2%) and $100,000+ for women (97 | 19.0%).
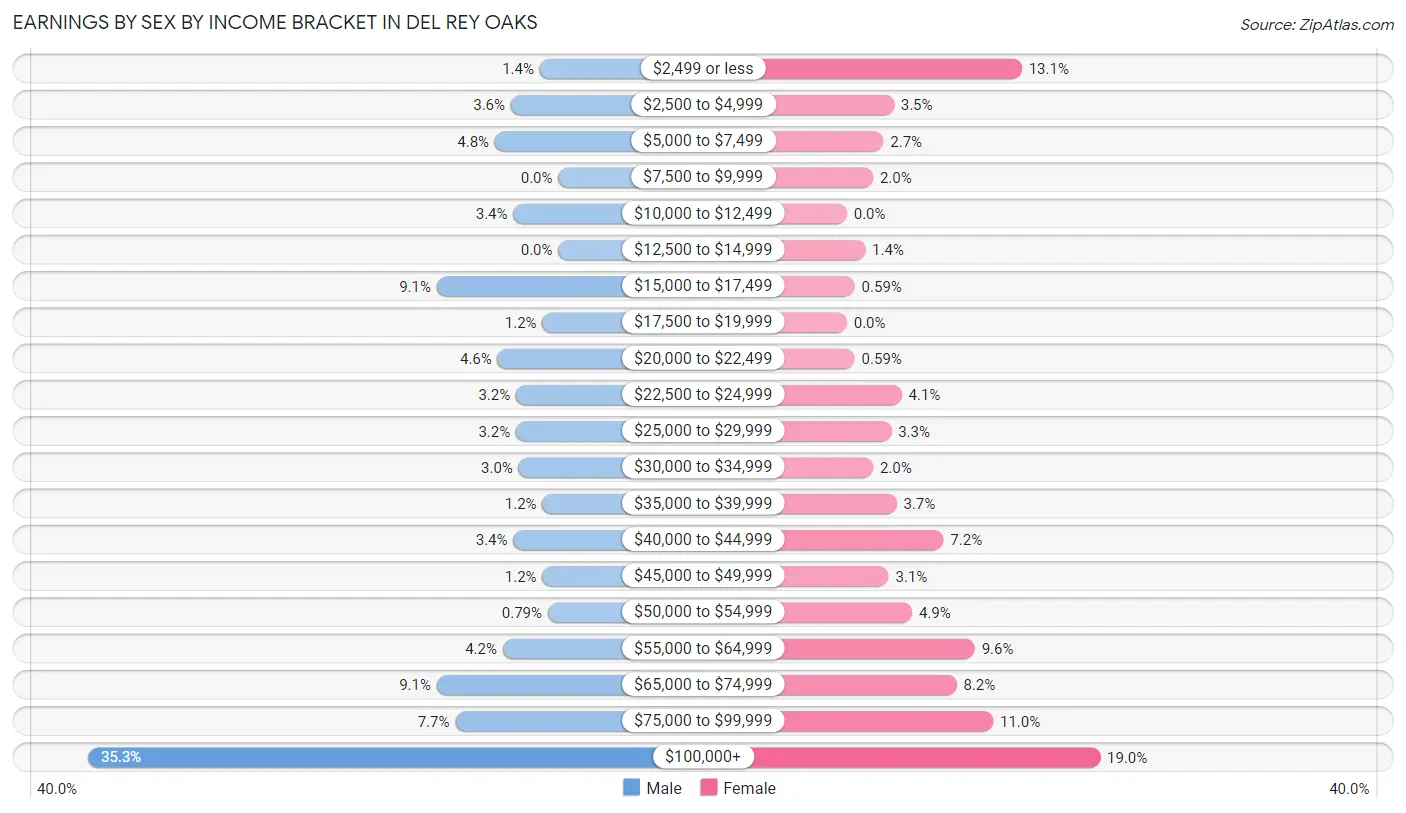
| Income | Male | Female |
| $2,499 or less | 7 (1.4%) | 67 (13.1%) |
| $2,500 to $4,999 | 18 (3.6%) | 18 (3.5%) |
| $5,000 to $7,499 | 24 (4.8%) | 14 (2.7%) |
| $7,500 to $9,999 | 0 (0.0%) | 10 (2.0%) |
| $10,000 to $12,499 | 17 (3.4%) | 0 (0.0%) |
| $12,500 to $14,999 | 0 (0.0%) | 7 (1.4%) |
| $15,000 to $17,499 | 46 (9.1%) | 3 (0.6%) |
| $17,500 to $19,999 | 6 (1.2%) | 0 (0.0%) |
| $20,000 to $22,499 | 23 (4.5%) | 3 (0.6%) |
| $22,500 to $24,999 | 16 (3.2%) | 21 (4.1%) |
| $25,000 to $29,999 | 16 (3.2%) | 17 (3.3%) |
| $30,000 to $34,999 | 15 (3.0%) | 10 (2.0%) |
| $35,000 to $39,999 | 6 (1.2%) | 19 (3.7%) |
| $40,000 to $44,999 | 17 (3.4%) | 37 (7.2%) |
| $45,000 to $49,999 | 6 (1.2%) | 16 (3.1%) |
| $50,000 to $54,999 | 4 (0.8%) | 25 (4.9%) |
| $55,000 to $64,999 | 21 (4.2%) | 49 (9.6%) |
| $65,000 to $74,999 | 46 (9.1%) | 42 (8.2%) |
| $75,000 to $99,999 | 39 (7.7%) | 56 (11.0%) |
| $100,000+ | 178 (35.2%) | 97 (19.0%) |
| Total | 505 (100.0%) | 511 (100.0%) |
Earnings by Sex by Educational Attainment in Del Rey Oaks
Average earnings in Del Rey Oaks are $72,258 for men and $58,201 for women, a difference of 19.5%. Men with an educational attainment of graduate degree enjoy the highest average annual earnings of $106,250, while those with high school diploma education earn the least with $52,500. Women with an educational attainment of graduate degree earn the most with the average annual earnings of $96,827, while those with less than high school education have the smallest earnings of $36,250.
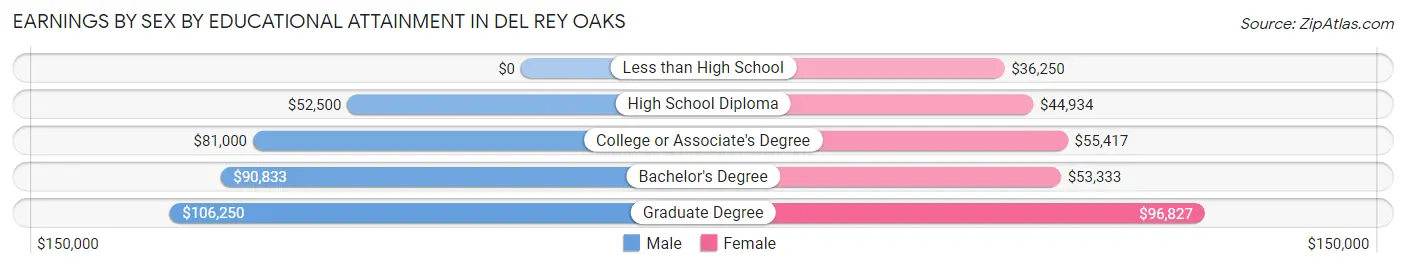
| Educational Attainment | Male Income | Female Income |
| Less than High School | - | - |
| High School Diploma | $52,500 | $44,934 |
| College or Associate's Degree | $81,000 | $55,417 |
| Bachelor's Degree | $90,833 | $53,333 |
| Graduate Degree | $106,250 | $96,827 |
| Total | $72,258 | $58,201 |
Family Income in Del Rey Oaks
Family Income Brackets in Del Rey Oaks
According to the Del Rey Oaks family income data, there are 136 families falling into the $200,000+ income range, which is the most common income bracket and makes up 32.8% of all families. Conversely, the $15,000 to $24,999 income bracket is the least frequent group with only 3 families (0.7%) belonging to this category.
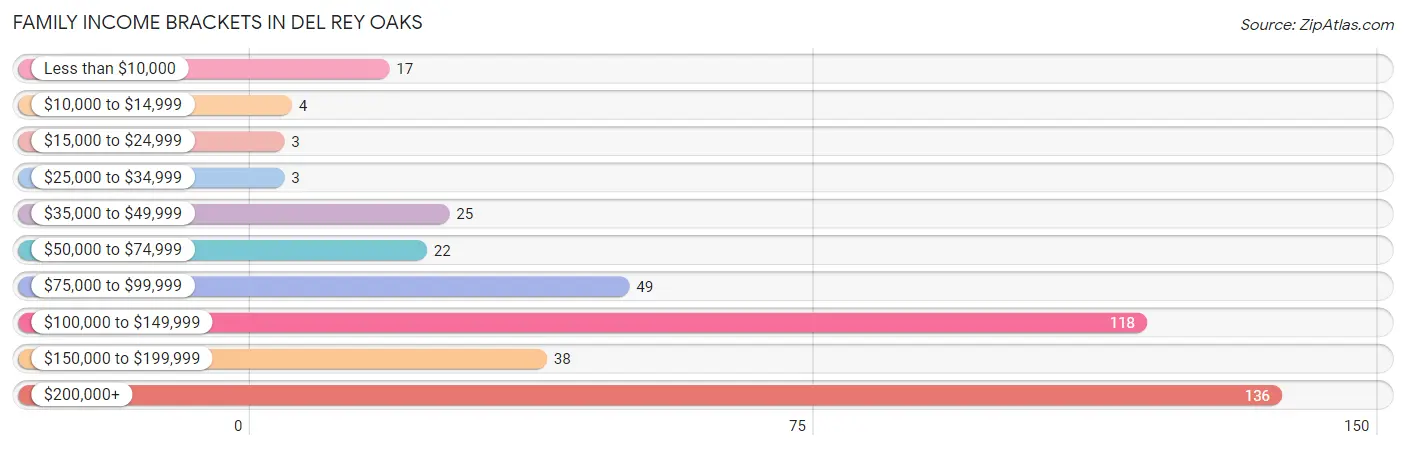
| Income Bracket | # Families | % Families |
| Less than $10,000 | 17 | 4.1% |
| $10,000 to $14,999 | 4 | 1.0% |
| $15,000 to $24,999 | 3 | 0.7% |
| $25,000 to $34,999 | 3 | 0.7% |
| $35,000 to $49,999 | 25 | 6.0% |
| $50,000 to $74,999 | 22 | 5.3% |
| $75,000 to $99,999 | 49 | 11.8% |
| $100,000 to $149,999 | 118 | 28.4% |
| $150,000 to $199,999 | 38 | 9.2% |
| $200,000+ | 136 | 32.8% |
Family Income by Famaliy Size in Del Rey Oaks
4-person families (62 | 14.9%) account for the highest median family income in Del Rey Oaks with $220,833 per family, while 2-person families (211 | 50.8%) have the highest median income of $65,798 per family member.
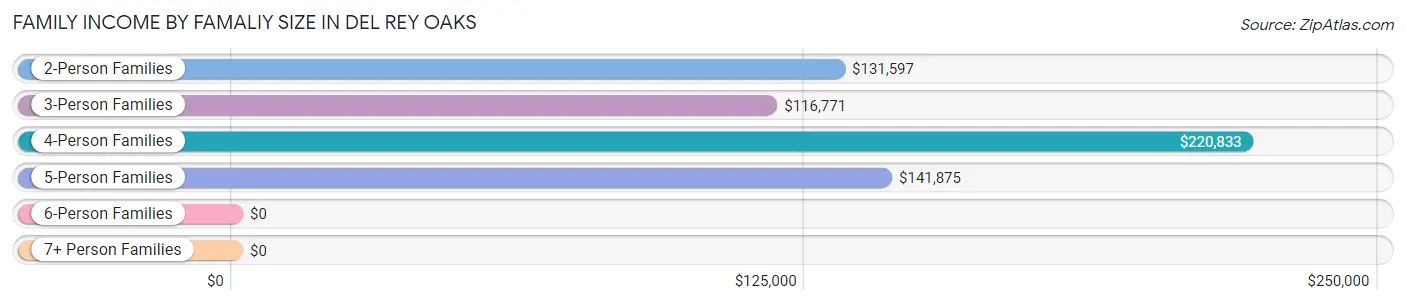
| Income Bracket | # Families | Median Income |
| 2-Person Families | 211 (50.8%) | $131,597 |
| 3-Person Families | 113 (27.2%) | $116,771 |
| 4-Person Families | 62 (14.9%) | $220,833 |
| 5-Person Families | 17 (4.1%) | $141,875 |
| 6-Person Families | 9 (2.2%) | $0 |
| 7+ Person Families | 3 (0.7%) | $0 |
| Total | 415 (100.0%) | $131,875 |
Family Income by Number of Earners in Del Rey Oaks
The median family income in Del Rey Oaks is $131,875, with families comprising 3+ earners (69) having the highest median family income of $222,917, while families with no earners (67) have the lowest median family income of $67,083, accounting for 16.6% and 16.1% of families, respectively.
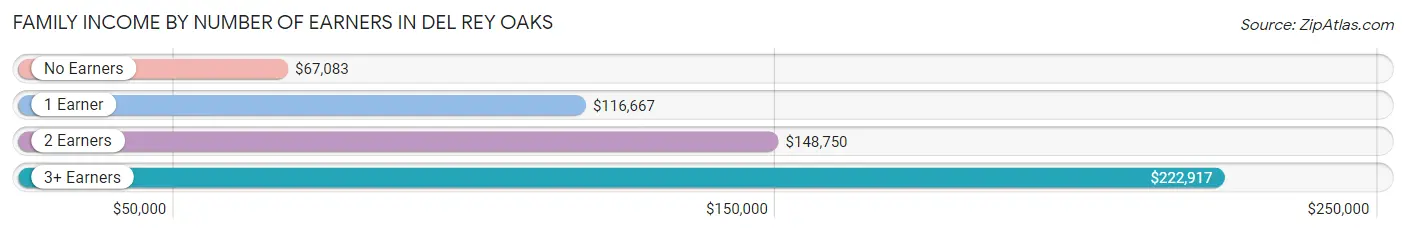
| Number of Earners | # Families | Median Income |
| No Earners | 67 (16.1%) | $67,083 |
| 1 Earner | 92 (22.2%) | $116,667 |
| 2 Earners | 187 (45.1%) | $148,750 |
| 3+ Earners | 69 (16.6%) | $222,917 |
| Total | 415 (100.0%) | $131,875 |
Household Income in Del Rey Oaks
Household Income Brackets in Del Rey Oaks
With 174 households falling in the category, the $200,000+ income range is the most frequent in Del Rey Oaks, accounting for 27.0% of all households. In contrast, only 10 households (1.5%) fall into the $10,000 to $14,999 income bracket, making it the least populous group.
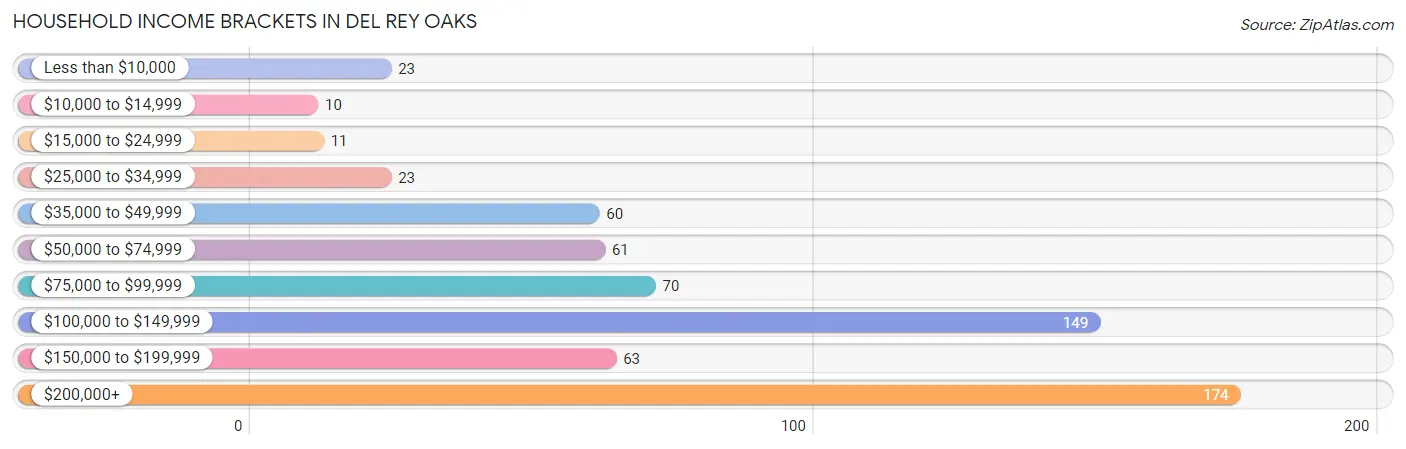
| Income Bracket | # Households | % Households |
| Less than $10,000 | 23 | 3.6% |
| $10,000 to $14,999 | 10 | 1.6% |
| $15,000 to $24,999 | 11 | 1.7% |
| $25,000 to $34,999 | 23 | 3.6% |
| $35,000 to $49,999 | 60 | 9.3% |
| $50,000 to $74,999 | 61 | 9.5% |
| $75,000 to $99,999 | 70 | 10.9% |
| $100,000 to $149,999 | 149 | 23.1% |
| $150,000 to $199,999 | 63 | 9.8% |
| $200,000+ | 174 | 27.0% |
Household Income by Householder Age in Del Rey Oaks
The median household income in Del Rey Oaks is $121,667, with the highest median household income of $162,917 found in the 45 to 64 years age bracket for the primary householder. A total of 260 households (40.4%) fall into this category. Meanwhile, the 15 to 24 years age bracket for the primary householder has the lowest median household income of $0, with 9 households (1.4%) in this group.
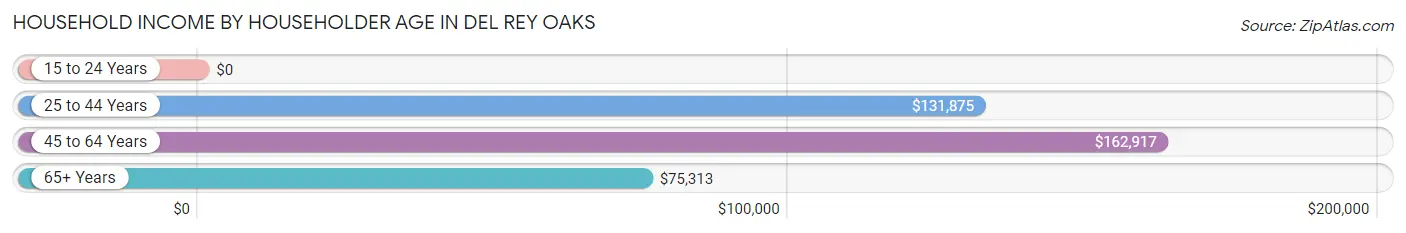
| Income Bracket | # Households | Median Income |
| 15 to 24 Years | 9 (1.4%) | $0 |
| 25 to 44 Years | 128 (19.9%) | $131,875 |
| 45 to 64 Years | 260 (40.4%) | $162,917 |
| 65+ Years | 247 (38.4%) | $75,313 |
| Total | 644 (100.0%) | $121,667 |
Poverty in Del Rey Oaks
Income Below Poverty by Sex and Age in Del Rey Oaks
With 2.2% poverty level for males and 8.5% for females among the residents of Del Rey Oaks, 45 to 54 year old males and 15 year old females are the most vulnerable to poverty, with 10 males (7.9%) and 13 females (81.2%) in their respective age groups living below the poverty level.
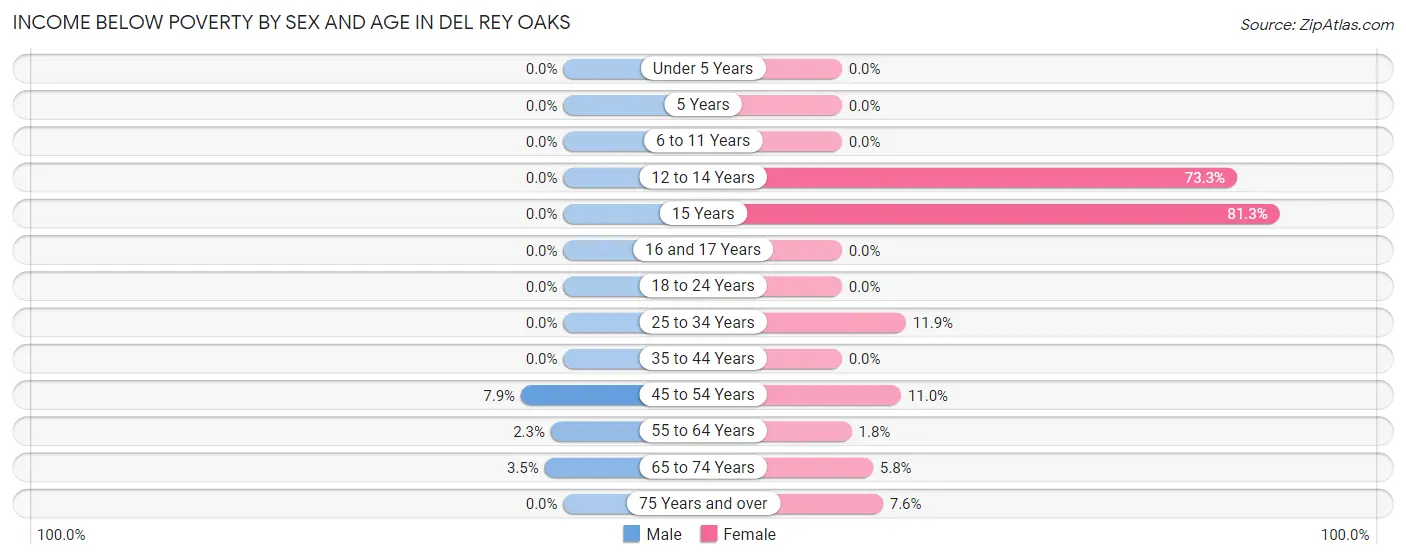
| Age Bracket | Male | Female |
| Under 5 Years | 0 (0.0%) | 0 (0.0%) |
| 5 Years | 0 (0.0%) | 0 (0.0%) |
| 6 to 11 Years | 0 (0.0%) | 0 (0.0%) |
| 12 to 14 Years | 0 (0.0%) | 11 (73.3%) |
| 15 Years | 0 (0.0%) | 13 (81.2%) |
| 16 and 17 Years | 0 (0.0%) | 0 (0.0%) |
| 18 to 24 Years | 0 (0.0%) | 0 (0.0%) |
| 25 to 34 Years | 0 (0.0%) | 15 (11.9%) |
| 35 to 44 Years | 0 (0.0%) | 0 (0.0%) |
| 45 to 54 Years | 10 (7.9%) | 19 (11.0%) |
| 55 to 64 Years | 3 (2.3%) | 3 (1.8%) |
| 65 to 74 Years | 3 (3.5%) | 6 (5.8%) |
| 75 Years and over | 0 (0.0%) | 7 (7.6%) |
| Total | 16 (2.2%) | 74 (8.5%) |
Income Above Poverty by Sex and Age in Del Rey Oaks
According to the poverty statistics in Del Rey Oaks, males aged under 5 years and females aged under 5 years are the age groups that are most secure financially, with 100.0% of males and 100.0% of females in these age groups living above the poverty line.
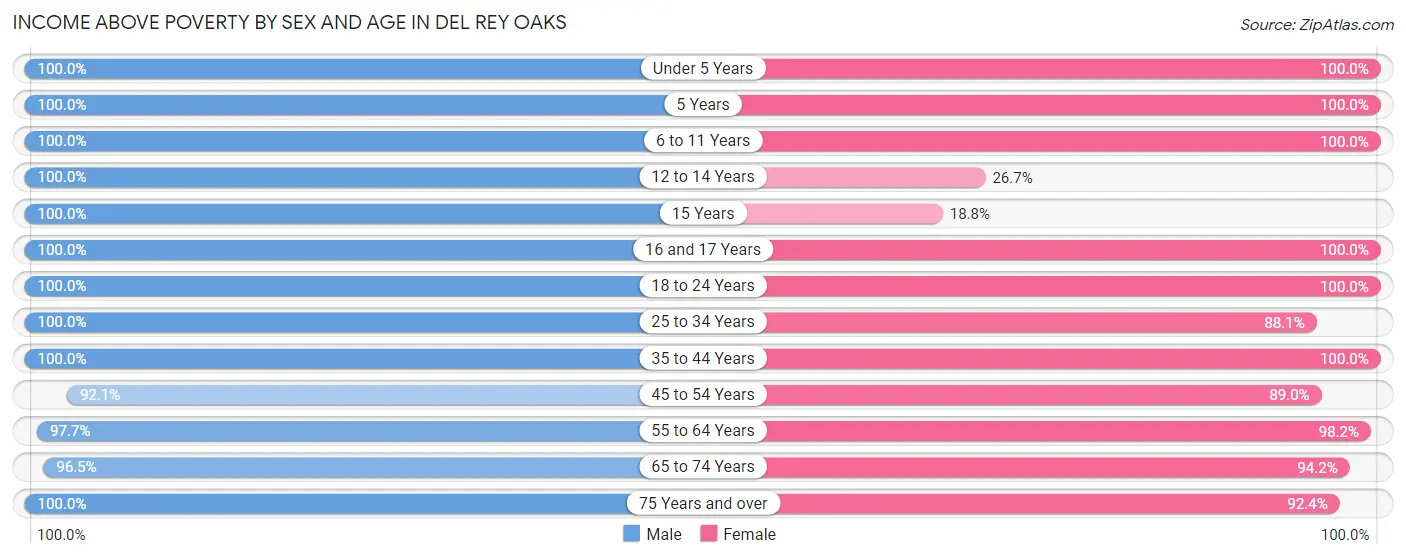
| Age Bracket | Male | Female |
| Under 5 Years | 40 (100.0%) | 28 (100.0%) |
| 5 Years | 6 (100.0%) | 7 (100.0%) |
| 6 to 11 Years | 25 (100.0%) | 22 (100.0%) |
| 12 to 14 Years | 26 (100.0%) | 4 (26.7%) |
| 15 Years | 4 (100.0%) | 3 (18.8%) |
| 16 and 17 Years | 8 (100.0%) | 10 (100.0%) |
| 18 to 24 Years | 59 (100.0%) | 66 (100.0%) |
| 25 to 34 Years | 74 (100.0%) | 111 (88.1%) |
| 35 to 44 Years | 76 (100.0%) | 52 (100.0%) |
| 45 to 54 Years | 117 (92.1%) | 154 (89.0%) |
| 55 to 64 Years | 126 (97.7%) | 162 (98.2%) |
| 65 to 74 Years | 83 (96.5%) | 98 (94.2%) |
| 75 Years and over | 72 (100.0%) | 85 (92.4%) |
| Total | 716 (97.8%) | 802 (91.5%) |
Income Below Poverty Among Married-Couple Families in Del Rey Oaks
The poverty statistics for married-couple families in Del Rey Oaks show that 0.9% or 3 of the total 322 families live below the poverty line. Families with no children have the highest poverty rate of 1.3%, comprising of 3 families. On the other hand, families with 1 or 2 children have the lowest poverty rate of 0.0%, which includes 0 families.
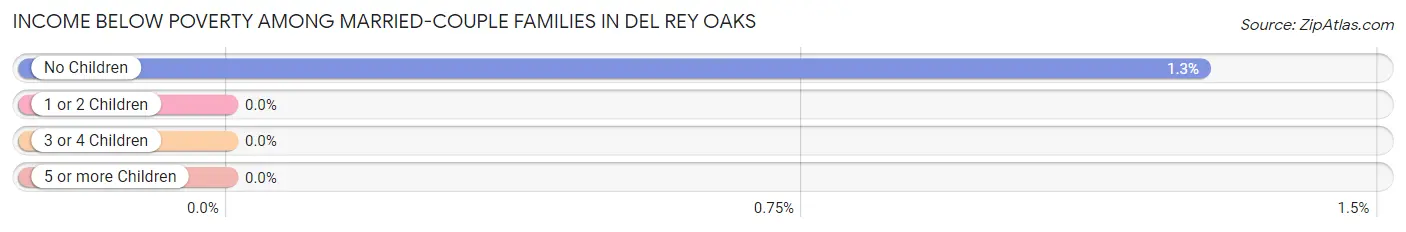
| Children | Above Poverty | Below Poverty |
| No Children | 234 (98.7%) | 3 (1.3%) |
| 1 or 2 Children | 80 (100.0%) | 0 (0.0%) |
| 3 or 4 Children | 5 (100.0%) | 0 (0.0%) |
| 5 or more Children | 0 (0.0%) | 0 (0.0%) |
| Total | 319 (99.1%) | 3 (0.9%) |
Income Below Poverty Among Single-Parent Households in Del Rey Oaks
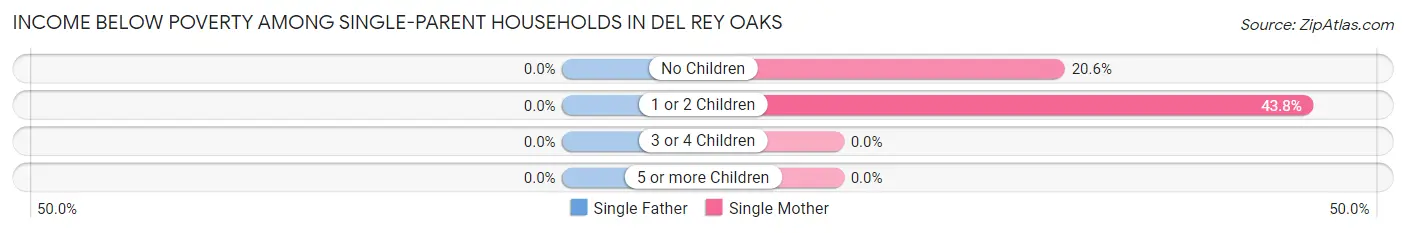
| Children | Single Father | Single Mother |
| No Children | 0 (0.0%) | 7 (20.6%) |
| 1 or 2 Children | 0 (0.0%) | 14 (43.8%) |
| 3 or 4 Children | 0 (0.0%) | 0 (0.0%) |
| 5 or more Children | 0 (0.0%) | 0 (0.0%) |
| Total | 0 (0.0%) | 21 (31.8%) |
Income Below Poverty Among Married-Couple vs Single-Parent Households in Del Rey Oaks
The poverty data for Del Rey Oaks shows that 3 of the married-couple family households (0.9%) and 21 of the single-parent households (22.6%) are living below the poverty level. Within the married-couple family households, those with no children have the highest poverty rate, with 3 households (1.3%) falling below the poverty line. Among the single-parent households, those with 1 or 2 children have the highest poverty rate, with 14 household (37.8%) living below poverty.
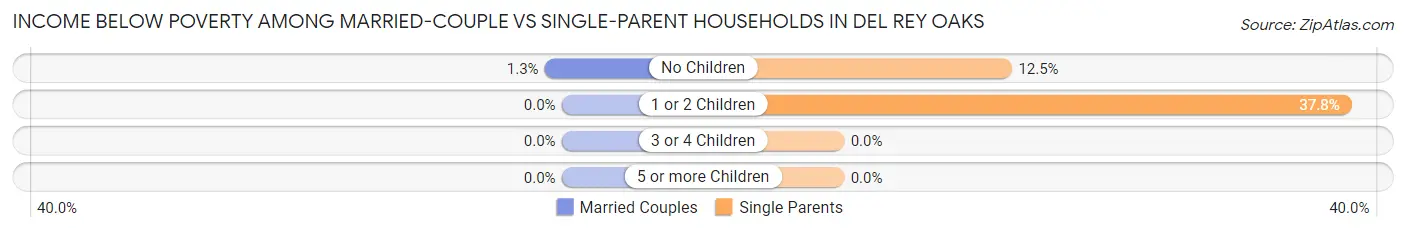
| Children | Married-Couple Families | Single-Parent Households |
| No Children | 3 (1.3%) | 7 (12.5%) |
| 1 or 2 Children | 0 (0.0%) | 14 (37.8%) |
| 3 or 4 Children | 0 (0.0%) | 0 (0.0%) |
| 5 or more Children | 0 (0.0%) | 0 (0.0%) |
| Total | 3 (0.9%) | 21 (22.6%) |
Employment Characteristics in Del Rey Oaks
Employment by Class of Employer in Del Rey Oaks
Among the 816 employed individuals in Del Rey Oaks, private company employees (469 | 57.5%), local government employees (120 | 14.7%), and self-employed (not incorporated) (72 | 8.8%) make up the most common classes of employment.
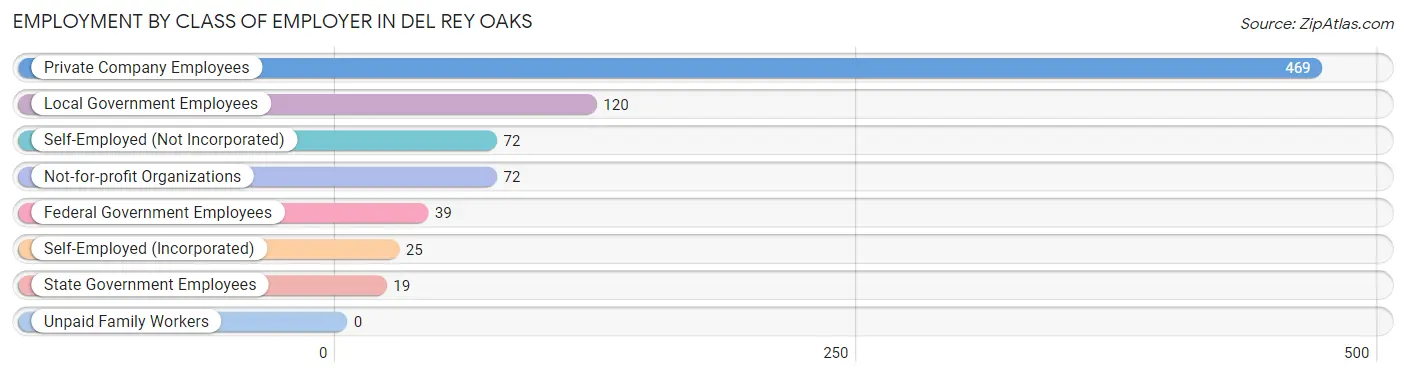
| Employer Class | # Employees | % Employees |
| Private Company Employees | 469 | 57.5% |
| Self-Employed (Incorporated) | 25 | 3.1% |
| Self-Employed (Not Incorporated) | 72 | 8.8% |
| Not-for-profit Organizations | 72 | 8.8% |
| Local Government Employees | 120 | 14.7% |
| State Government Employees | 19 | 2.3% |
| Federal Government Employees | 39 | 4.8% |
| Unpaid Family Workers | 0 | 0.0% |
| Total | 816 | 100.0% |
Employment Status by Age in Del Rey Oaks
According to the labor force statistics for Del Rey Oaks, out of the total population over 16 years of age (1,419), 67.0% or 951 individuals are in the labor force, with 11.3% or 107 of them unemployed. The age group with the highest labor force participation rate is 35 to 44 years, with 97.7% or 125 individuals in the labor force. Within the labor force, the 20 to 24 years age range has the highest percentage of unemployed individuals, with 71.1% or 59 of them being unemployed.
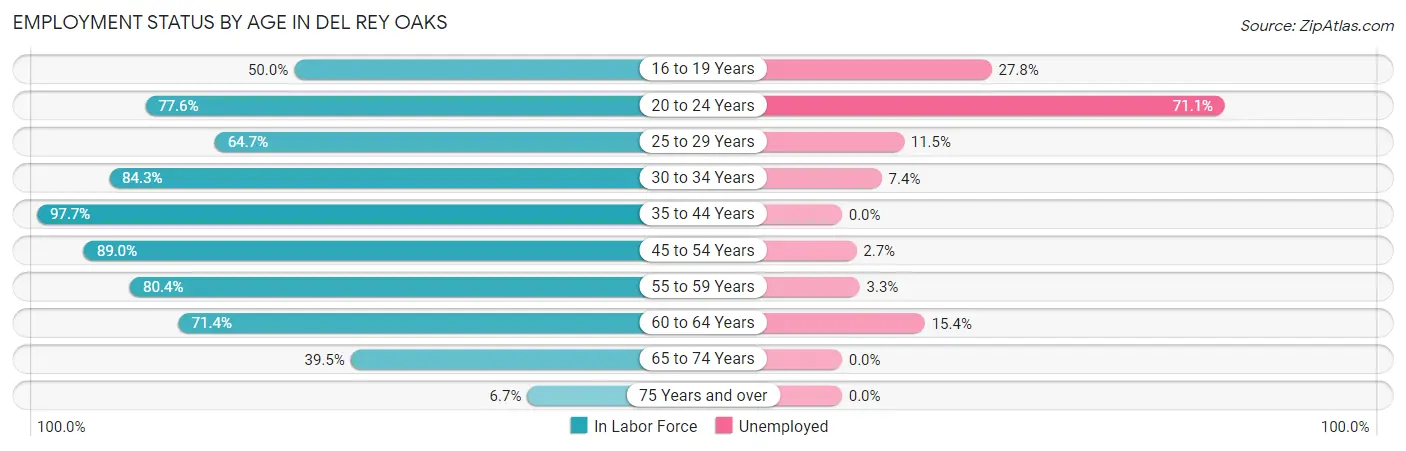
| Age Bracket | In Labor Force | Unemployed |
| 16 to 19 Years | 18 (50.0%) | 5 (27.8%) |
| 20 to 24 Years | 83 (77.6%) | 59 (71.1%) |
| 25 to 29 Years | 55 (64.7%) | 6 (11.5%) |
| 30 to 34 Years | 97 (84.3%) | 7 (7.4%) |
| 35 to 44 Years | 125 (97.7%) | 0 (0.0%) |
| 45 to 54 Years | 267 (89.0%) | 7 (2.7%) |
| 55 to 59 Years | 90 (80.4%) | 3 (3.3%) |
| 60 to 64 Years | 130 (71.4%) | 20 (15.4%) |
| 65 to 74 Years | 75 (39.5%) | 0 (0.0%) |
| 75 Years and over | 11 (6.7%) | 0 (0.0%) |
| Total | 951 (67.0%) | 107 (11.3%) |
Employment Status by Educational Attainment in Del Rey Oaks
According to labor force statistics for Del Rey Oaks, 82.9% of individuals (764) out of the total population between 25 and 64 years of age (922) are in the labor force, with 5.7% or 44 of them being unemployed. The group with the highest labor force participation rate are those with the educational attainment of less than high school, with 96.4% or 53 individuals in the labor force. Within the labor force, individuals with college / associate degree education have the highest percentage of unemployment, with 9.1% or 25 of them being unemployed.
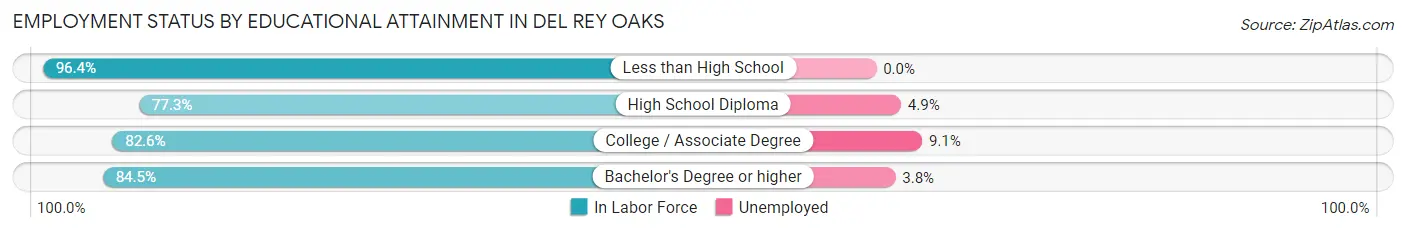
| Educational Attainment | In Labor Force | Unemployed |
| Less than High School | 53 (96.4%) | 0 (0.0%) |
| High School Diploma | 163 (77.3%) | 10 (4.9%) |
| College / Associate Degree | 276 (82.6%) | 30 (9.1%) |
| Bachelor's Degree or higher | 272 (84.5%) | 12 (3.8%) |
| Total | 764 (82.9%) | 53 (5.7%) |
Employment Occupations by Sex in Del Rey Oaks
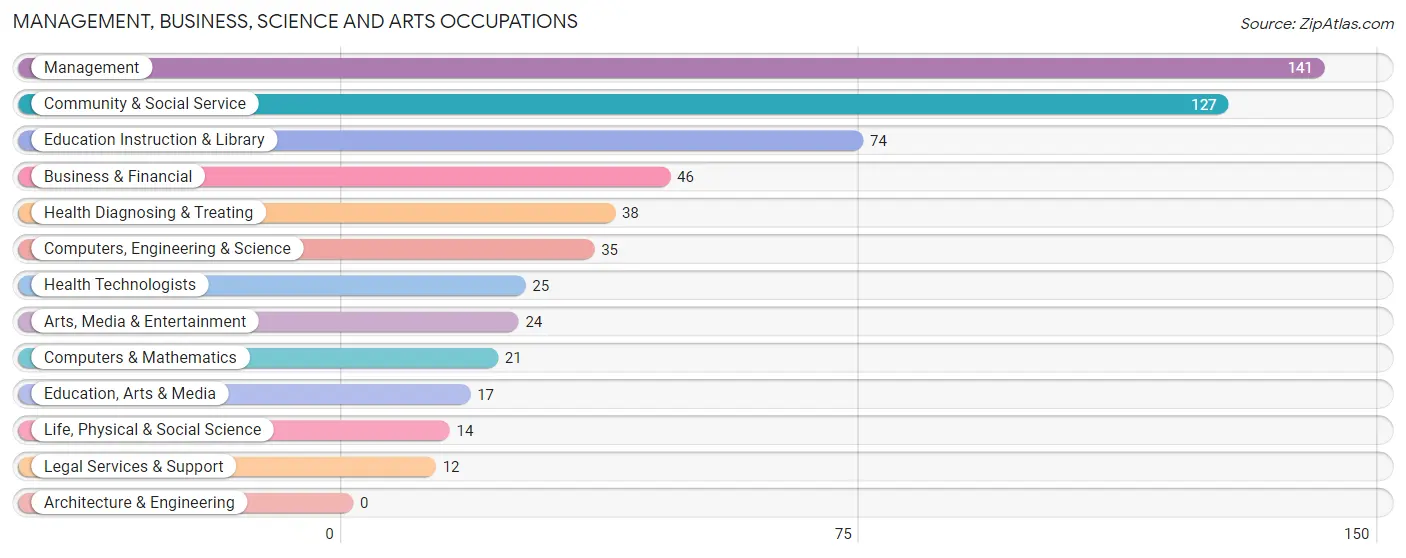
Management, Business, Science and Arts Occupations
The most common Management, Business, Science and Arts occupations in Del Rey Oaks are Management (141 | 16.9%), Community & Social Service (127 | 15.2%), Education Instruction & Library (74 | 8.8%), Business & Financial (46 | 5.5%), and Health Diagnosing & Treating (38 | 4.5%).
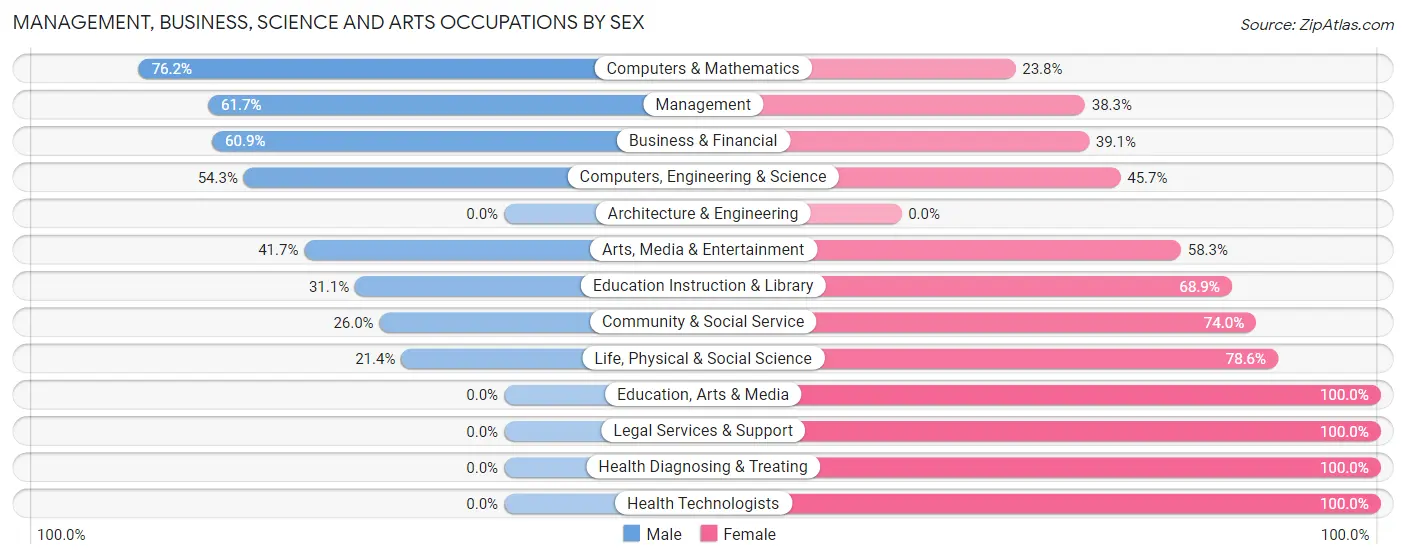
Management, Business, Science and Arts Occupations by Sex
Within the Management, Business, Science and Arts occupations in Del Rey Oaks, the most male-oriented occupations are Computers & Mathematics (76.2%), Management (61.7%), and Business & Financial (60.9%), while the most female-oriented occupations are Education, Arts & Media (100.0%), Legal Services & Support (100.0%), and Health Diagnosing & Treating (100.0%).
| Occupation | Male | Female |
| Management | 87 (61.7%) | 54 (38.3%) |
| Business & Financial | 28 (60.9%) | 18 (39.1%) |
| Computers, Engineering & Science | 19 (54.3%) | 16 (45.7%) |
| Computers & Mathematics | 16 (76.2%) | 5 (23.8%) |
| Architecture & Engineering | 0 (0.0%) | 0 (0.0%) |
| Life, Physical & Social Science | 3 (21.4%) | 11 (78.6%) |
| Community & Social Service | 33 (26.0%) | 94 (74.0%) |
| Education, Arts & Media | 0 (0.0%) | 17 (100.0%) |
| Legal Services & Support | 0 (0.0%) | 12 (100.0%) |
| Education Instruction & Library | 23 (31.1%) | 51 (68.9%) |
| Arts, Media & Entertainment | 10 (41.7%) | 14 (58.3%) |
| Health Diagnosing & Treating | 0 (0.0%) | 38 (100.0%) |
| Health Technologists | 0 (0.0%) | 25 (100.0%) |
| Total (Category) | 167 (43.1%) | 220 (56.9%) |
| Total (Overall) | 395 (47.2%) | 441 (52.7%) |
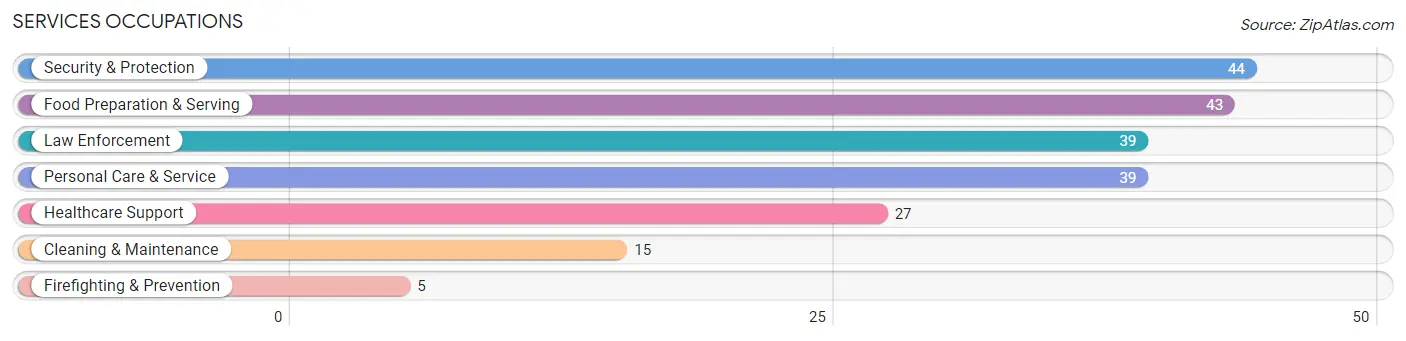
Services Occupations
The most common Services occupations in Del Rey Oaks are Security & Protection (44 | 5.3%), Food Preparation & Serving (43 | 5.1%), Law Enforcement (39 | 4.7%), Personal Care & Service (39 | 4.7%), and Healthcare Support (27 | 3.2%).
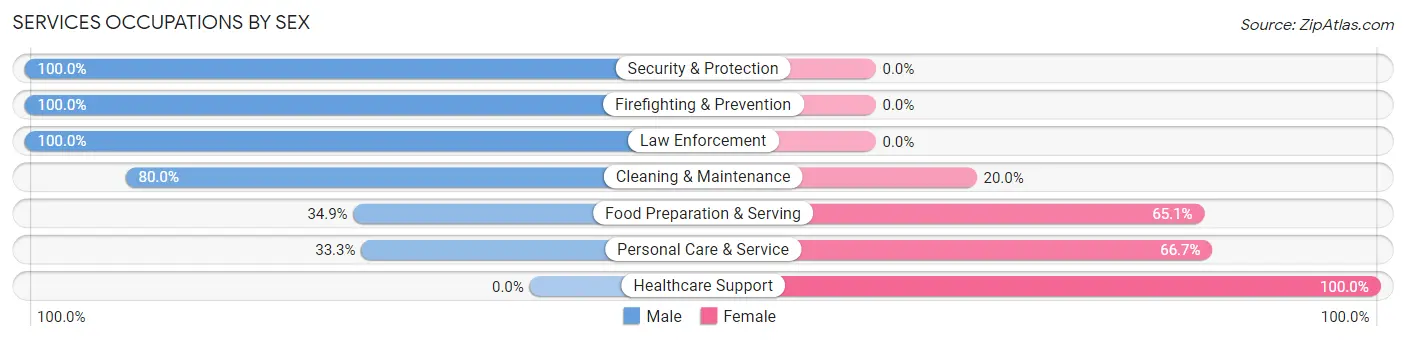
Services Occupations by Sex
Within the Services occupations in Del Rey Oaks, the most male-oriented occupations are Security & Protection (100.0%), Firefighting & Prevention (100.0%), and Law Enforcement (100.0%), while the most female-oriented occupations are Healthcare Support (100.0%), Personal Care & Service (66.7%), and Food Preparation & Serving (65.1%).
| Occupation | Male | Female |
| Healthcare Support | 0 (0.0%) | 27 (100.0%) |
| Security & Protection | 44 (100.0%) | 0 (0.0%) |
| Firefighting & Prevention | 5 (100.0%) | 0 (0.0%) |
| Law Enforcement | 39 (100.0%) | 0 (0.0%) |
| Food Preparation & Serving | 15 (34.9%) | 28 (65.1%) |
| Cleaning & Maintenance | 12 (80.0%) | 3 (20.0%) |
| Personal Care & Service | 13 (33.3%) | 26 (66.7%) |
| Total (Category) | 84 (50.0%) | 84 (50.0%) |
| Total (Overall) | 395 (47.2%) | 441 (52.7%) |
Sales and Office Occupations
The most common Sales and Office occupations in Del Rey Oaks are Office & Administration (132 | 15.8%), and Sales & Related (53 | 6.3%).
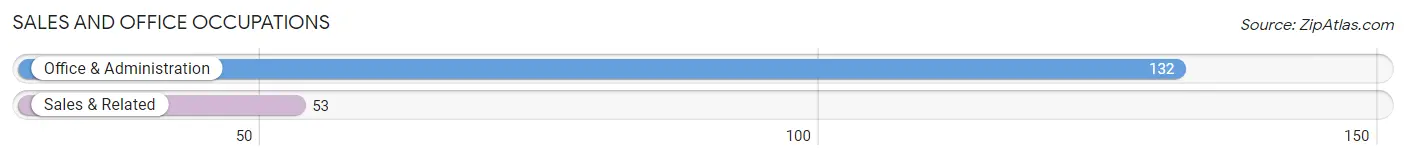
Sales and Office Occupations by Sex
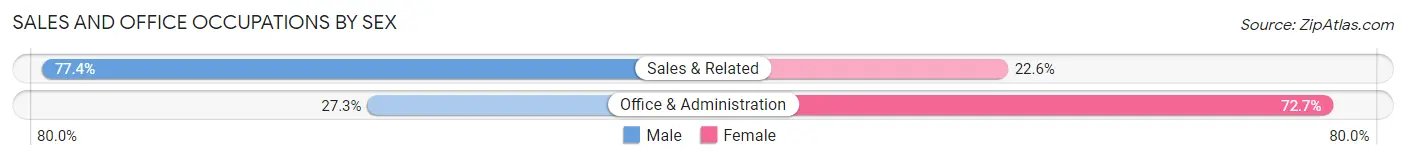
| Occupation | Male | Female |
| Sales & Related | 41 (77.4%) | 12 (22.6%) |
| Office & Administration | 36 (27.3%) | 96 (72.7%) |
| Total (Category) | 77 (41.6%) | 108 (58.4%) |
| Total (Overall) | 395 (47.2%) | 441 (52.7%) |
Natural Resources, Construction and Maintenance Occupations
The most common Natural Resources, Construction and Maintenance occupations in Del Rey Oaks are Construction & Extraction (13 | 1.6%), and Installation, Maintenance & Repair (11 | 1.3%).
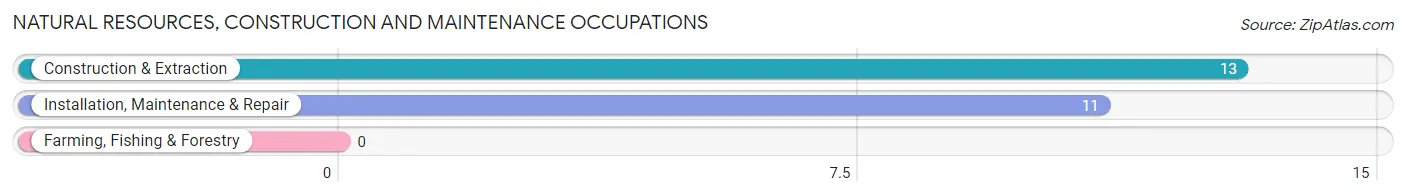
Natural Resources, Construction and Maintenance Occupations by Sex
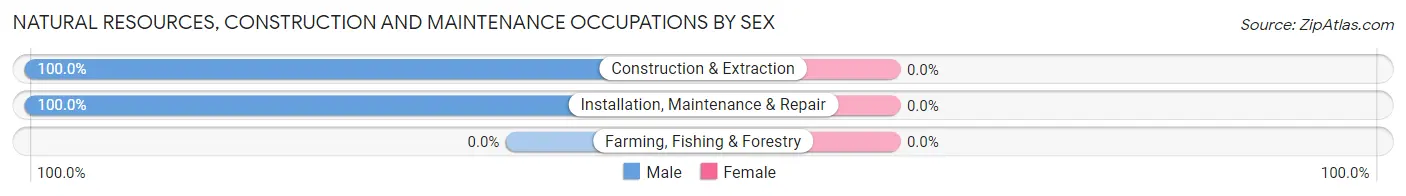
| Occupation | Male | Female |
| Farming, Fishing & Forestry | 0 (0.0%) | 0 (0.0%) |
| Construction & Extraction | 13 (100.0%) | 0 (0.0%) |
| Installation, Maintenance & Repair | 11 (100.0%) | 0 (0.0%) |
| Total (Category) | 24 (100.0%) | 0 (0.0%) |
| Total (Overall) | 395 (47.2%) | 441 (52.7%) |
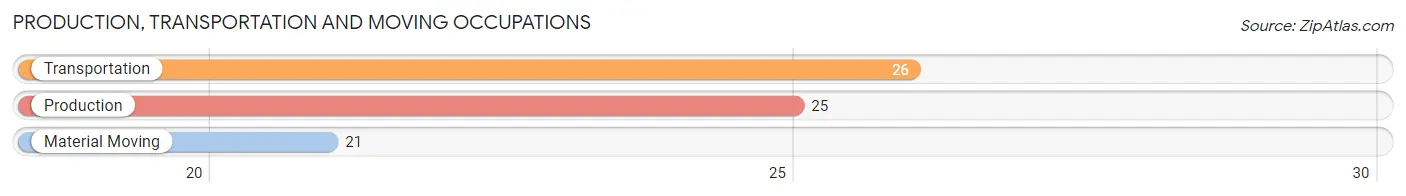
Production, Transportation and Moving Occupations
The most common Production, Transportation and Moving occupations in Del Rey Oaks are Transportation (26 | 3.1%), Production (25 | 3.0%), and Material Moving (21 | 2.5%).
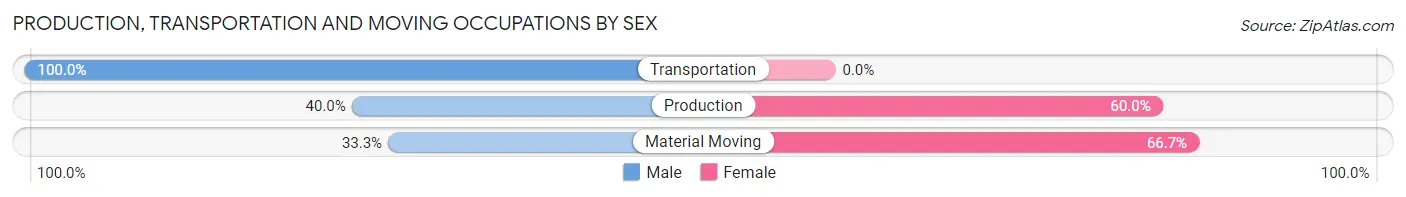
Production, Transportation and Moving Occupations by Sex
| Occupation | Male | Female |
| Production | 10 (40.0%) | 15 (60.0%) |
| Transportation | 26 (100.0%) | 0 (0.0%) |
| Material Moving | 7 (33.3%) | 14 (66.7%) |
| Total (Category) | 43 (59.7%) | 29 (40.3%) |
| Total (Overall) | 395 (47.2%) | 441 (52.7%) |
Employment Industries by Sex in Del Rey Oaks
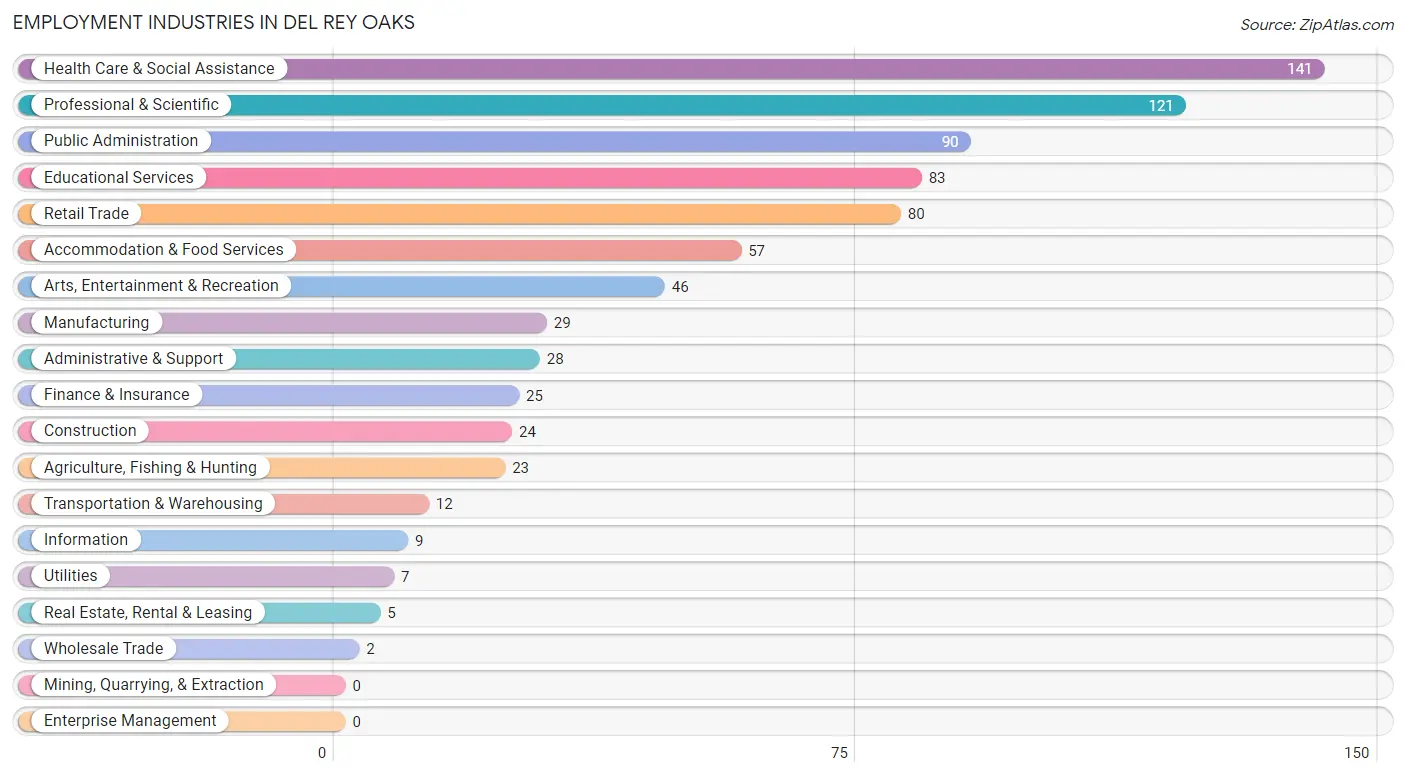
Employment Industries in Del Rey Oaks
The major employment industries in Del Rey Oaks include Health Care & Social Assistance (141 | 16.9%), Professional & Scientific (121 | 14.5%), Public Administration (90 | 10.8%), Educational Services (83 | 9.9%), and Retail Trade (80 | 9.6%).
Employment Industries by Sex in Del Rey Oaks
The Del Rey Oaks industries that see more men than women are Agriculture, Fishing & Hunting (100.0%), Wholesale Trade (100.0%), and Transportation & Warehousing (100.0%), whereas the industries that tend to have a higher number of women are Health Care & Social Assistance (83.0%), Educational Services (77.1%), and Professional & Scientific (62.8%).
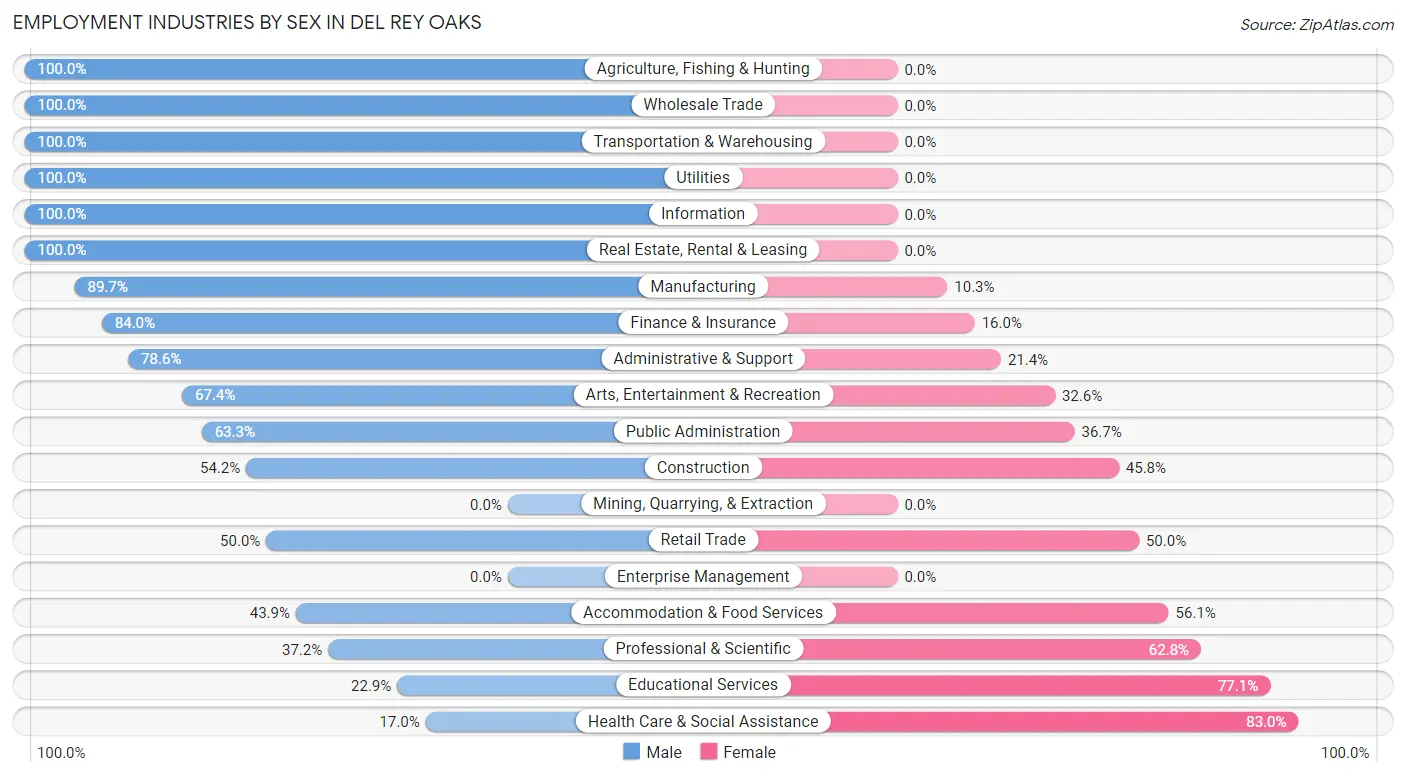
| Industry | Male | Female |
| Agriculture, Fishing & Hunting | 23 (100.0%) | 0 (0.0%) |
| Mining, Quarrying, & Extraction | 0 (0.0%) | 0 (0.0%) |
| Construction | 13 (54.2%) | 11 (45.8%) |
| Manufacturing | 26 (89.7%) | 3 (10.3%) |
| Wholesale Trade | 2 (100.0%) | 0 (0.0%) |
| Retail Trade | 40 (50.0%) | 40 (50.0%) |
| Transportation & Warehousing | 12 (100.0%) | 0 (0.0%) |
| Utilities | 7 (100.0%) | 0 (0.0%) |
| Information | 9 (100.0%) | 0 (0.0%) |
| Finance & Insurance | 21 (84.0%) | 4 (16.0%) |
| Real Estate, Rental & Leasing | 5 (100.0%) | 0 (0.0%) |
| Professional & Scientific | 45 (37.2%) | 76 (62.8%) |
| Enterprise Management | 0 (0.0%) | 0 (0.0%) |
| Administrative & Support | 22 (78.6%) | 6 (21.4%) |
| Educational Services | 19 (22.9%) | 64 (77.1%) |
| Health Care & Social Assistance | 24 (17.0%) | 117 (83.0%) |
| Arts, Entertainment & Recreation | 31 (67.4%) | 15 (32.6%) |
| Accommodation & Food Services | 25 (43.9%) | 32 (56.1%) |
| Public Administration | 57 (63.3%) | 33 (36.7%) |
| Total | 395 (47.2%) | 441 (52.7%) |
Education in Del Rey Oaks
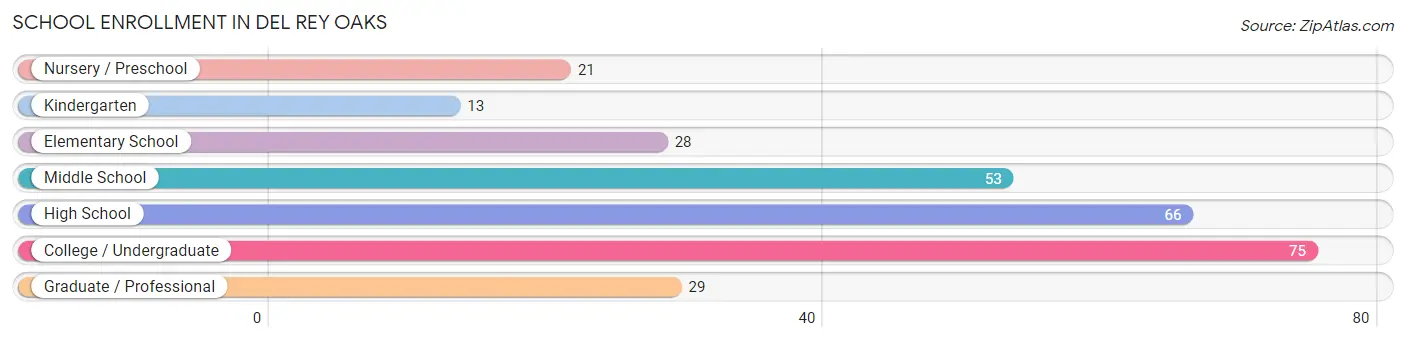
School Enrollment in Del Rey Oaks
The most common levels of schooling among the 285 students in Del Rey Oaks are college / undergraduate (75 | 26.3%), high school (66 | 23.2%), and middle school (53 | 18.6%).
| School Level | # Students | % Students |
| Nursery / Preschool | 21 | 7.4% |
| Kindergarten | 13 | 4.6% |
| Elementary School | 28 | 9.8% |
| Middle School | 53 | 18.6% |
| High School | 66 | 23.2% |
| College / Undergraduate | 75 | 26.3% |
| Graduate / Professional | 29 | 10.2% |
| Total | 285 | 100.0% |
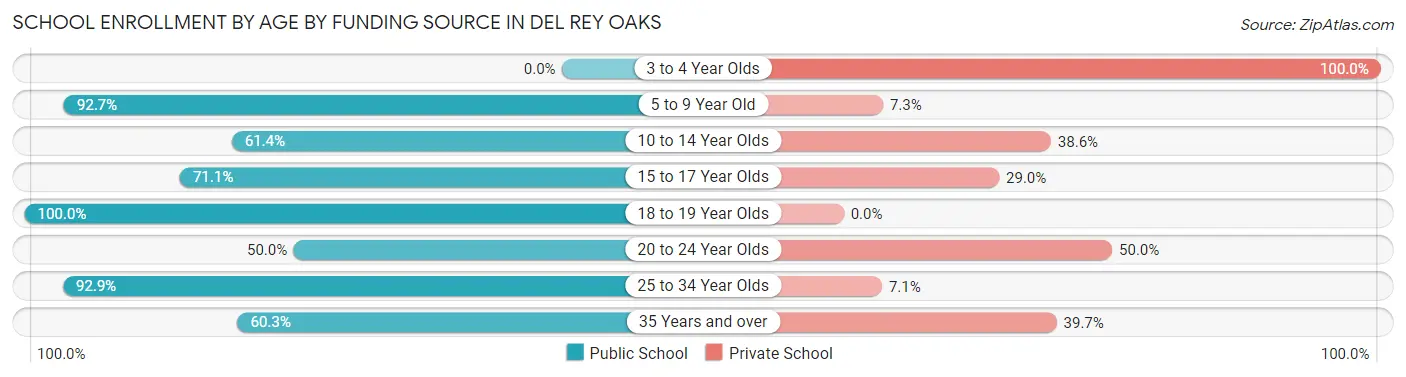
School Enrollment by Age by Funding Source in Del Rey Oaks
Out of a total of 285 students who are enrolled in schools in Del Rey Oaks, 94 (33.0%) attend a private institution, while the remaining 191 (67.0%) are enrolled in public schools. The age group of 3 to 4 year olds has the highest likelihood of being enrolled in private schools, with 21 (100.0% in the age bracket) enrolled. Conversely, the age group of 18 to 19 year olds has the lowest likelihood of being enrolled in a private school, with 18 (100.0% in the age bracket) attending a public institution.
| Age Bracket | Public School | Private School |
| 3 to 4 Year Olds | 0 (0.0%) | 21 (100.0%) |
| 5 to 9 Year Old | 38 (92.7%) | 3 (7.3%) |
| 10 to 14 Year Olds | 35 (61.4%) | 22 (38.6%) |
| 15 to 17 Year Olds | 27 (71.1%) | 11 (28.9%) |
| 18 to 19 Year Olds | 18 (100.0%) | 0 (0.0%) |
| 20 to 24 Year Olds | 12 (50.0%) | 12 (50.0%) |
| 25 to 34 Year Olds | 26 (92.9%) | 2 (7.1%) |
| 35 Years and over | 35 (60.3%) | 23 (39.7%) |
| Total | 191 (67.0%) | 94 (33.0%) |
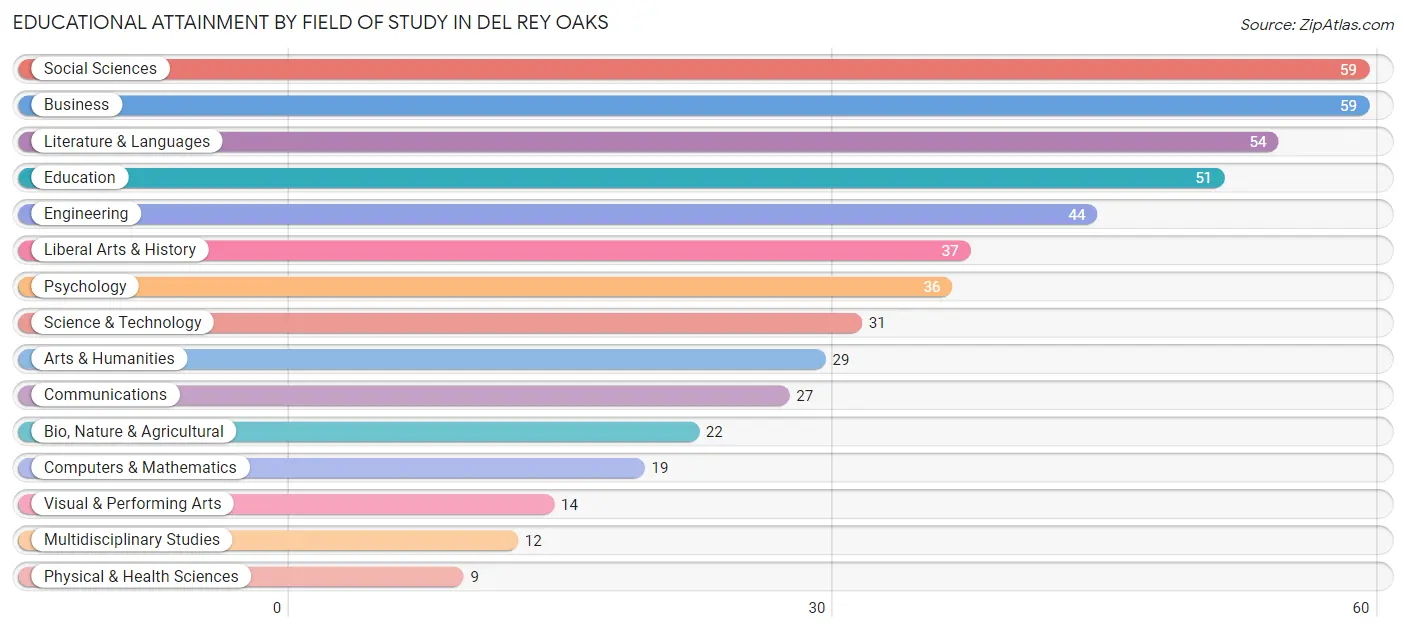
Educational Attainment by Field of Study in Del Rey Oaks
Social sciences (59 | 11.7%), business (59 | 11.7%), literature & languages (54 | 10.7%), education (51 | 10.1%), and engineering (44 | 8.7%) are the most common fields of study among 503 individuals in Del Rey Oaks who have obtained a bachelor's degree or higher.
| Field of Study | # Graduates | % Graduates |
| Computers & Mathematics | 19 | 3.8% |
| Bio, Nature & Agricultural | 22 | 4.4% |
| Physical & Health Sciences | 9 | 1.8% |
| Psychology | 36 | 7.2% |
| Social Sciences | 59 | 11.7% |
| Engineering | 44 | 8.7% |
| Multidisciplinary Studies | 12 | 2.4% |
| Science & Technology | 31 | 6.2% |
| Business | 59 | 11.7% |
| Education | 51 | 10.1% |
| Literature & Languages | 54 | 10.7% |
| Liberal Arts & History | 37 | 7.4% |
| Visual & Performing Arts | 14 | 2.8% |
| Communications | 27 | 5.4% |
| Arts & Humanities | 29 | 5.8% |
| Total | 503 | 100.0% |
Transportation & Commute in Del Rey Oaks
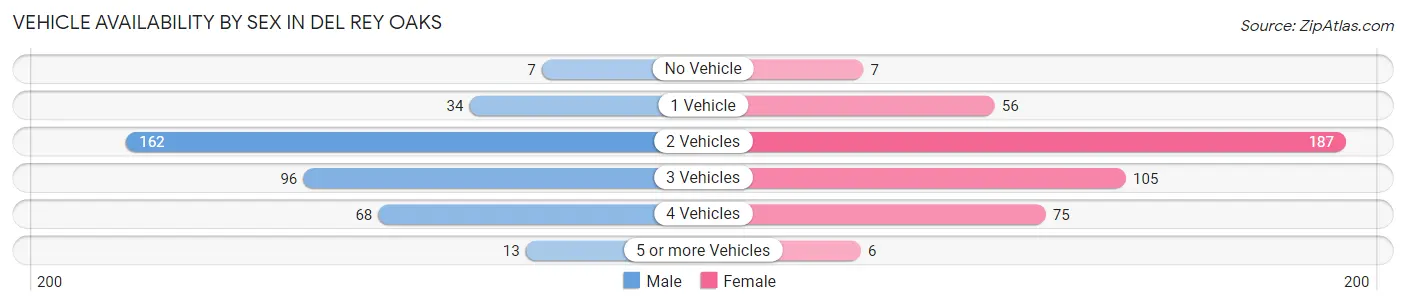
Vehicle Availability by Sex in Del Rey Oaks
The most prevalent vehicle ownership categories in Del Rey Oaks are males with 2 vehicles (162, accounting for 42.6%) and females with 2 vehicles (187, making up 37.2%).
| Vehicles Available | Male | Female |
| No Vehicle | 7 (1.8%) | 7 (1.6%) |
| 1 Vehicle | 34 (8.9%) | 56 (12.8%) |
| 2 Vehicles | 162 (42.6%) | 187 (42.9%) |
| 3 Vehicles | 96 (25.3%) | 105 (24.1%) |
| 4 Vehicles | 68 (17.9%) | 75 (17.2%) |
| 5 or more Vehicles | 13 (3.4%) | 6 (1.4%) |
| Total | 380 (100.0%) | 436 (100.0%) |
Commute Time in Del Rey Oaks
The most frequently occuring commute durations in Del Rey Oaks are 10 to 14 minutes (207 commuters, 27.0%), 15 to 19 minutes (163 commuters, 21.2%), and 5 to 9 minutes (111 commuters, 14.5%).
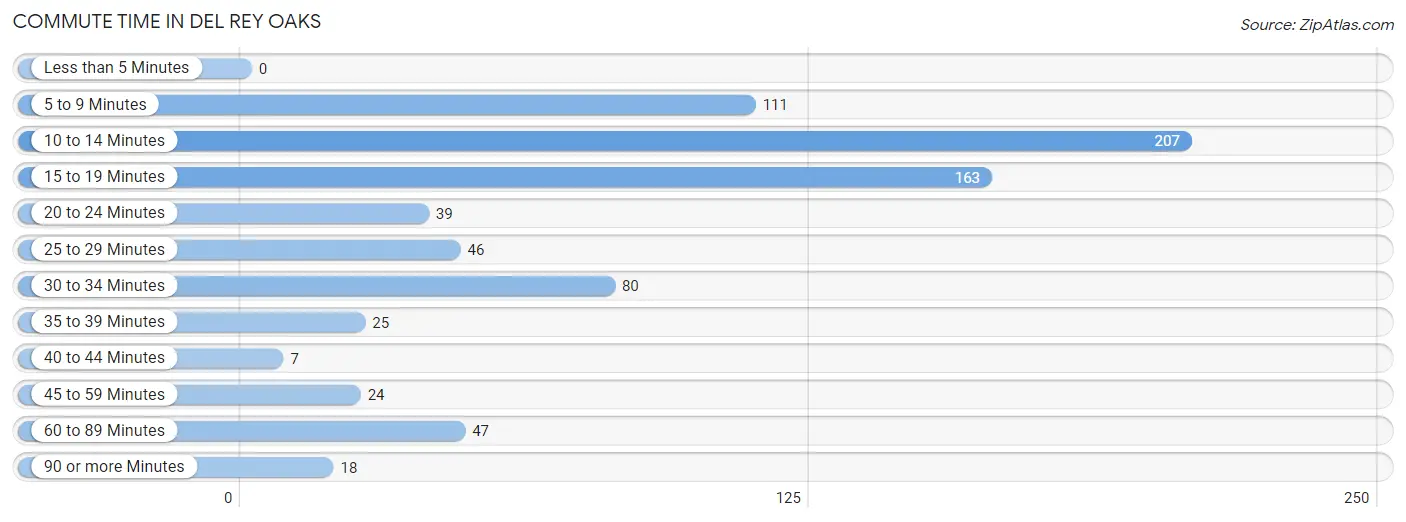
| Commute Time | # Commuters | % Commuters |
| Less than 5 Minutes | 0 | 0.0% |
| 5 to 9 Minutes | 111 | 14.5% |
| 10 to 14 Minutes | 207 | 27.0% |
| 15 to 19 Minutes | 163 | 21.2% |
| 20 to 24 Minutes | 39 | 5.1% |
| 25 to 29 Minutes | 46 | 6.0% |
| 30 to 34 Minutes | 80 | 10.4% |
| 35 to 39 Minutes | 25 | 3.3% |
| 40 to 44 Minutes | 7 | 0.9% |
| 45 to 59 Minutes | 24 | 3.1% |
| 60 to 89 Minutes | 47 | 6.1% |
| 90 or more Minutes | 18 | 2.4% |
Commute Time by Sex in Del Rey Oaks
The most common commute times in Del Rey Oaks are 10 to 14 minutes (125 commuters, 34.5%) for males and 15 to 19 minutes (102 commuters, 25.2%) for females.
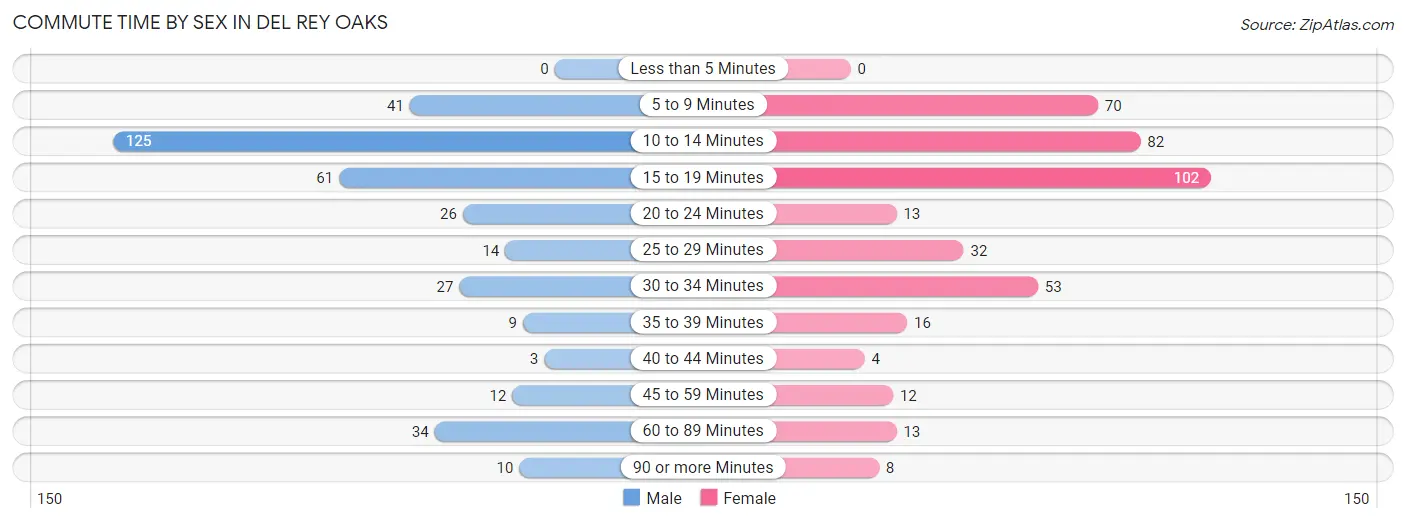
| Commute Time | Male | Female |
| Less than 5 Minutes | 0 (0.0%) | 0 (0.0%) |
| 5 to 9 Minutes | 41 (11.3%) | 70 (17.3%) |
| 10 to 14 Minutes | 125 (34.5%) | 82 (20.3%) |
| 15 to 19 Minutes | 61 (16.9%) | 102 (25.2%) |
| 20 to 24 Minutes | 26 (7.2%) | 13 (3.2%) |
| 25 to 29 Minutes | 14 (3.9%) | 32 (7.9%) |
| 30 to 34 Minutes | 27 (7.5%) | 53 (13.1%) |
| 35 to 39 Minutes | 9 (2.5%) | 16 (4.0%) |
| 40 to 44 Minutes | 3 (0.8%) | 4 (1.0%) |
| 45 to 59 Minutes | 12 (3.3%) | 12 (3.0%) |
| 60 to 89 Minutes | 34 (9.4%) | 13 (3.2%) |
| 90 or more Minutes | 10 (2.8%) | 8 (2.0%) |
Time of Departure to Work by Sex in Del Rey Oaks
The most frequent times of departure to work in Del Rey Oaks are 7:00 AM to 7:29 AM (80, 22.1%) for males and 8:00 AM to 8:29 AM (89, 22.0%) for females.
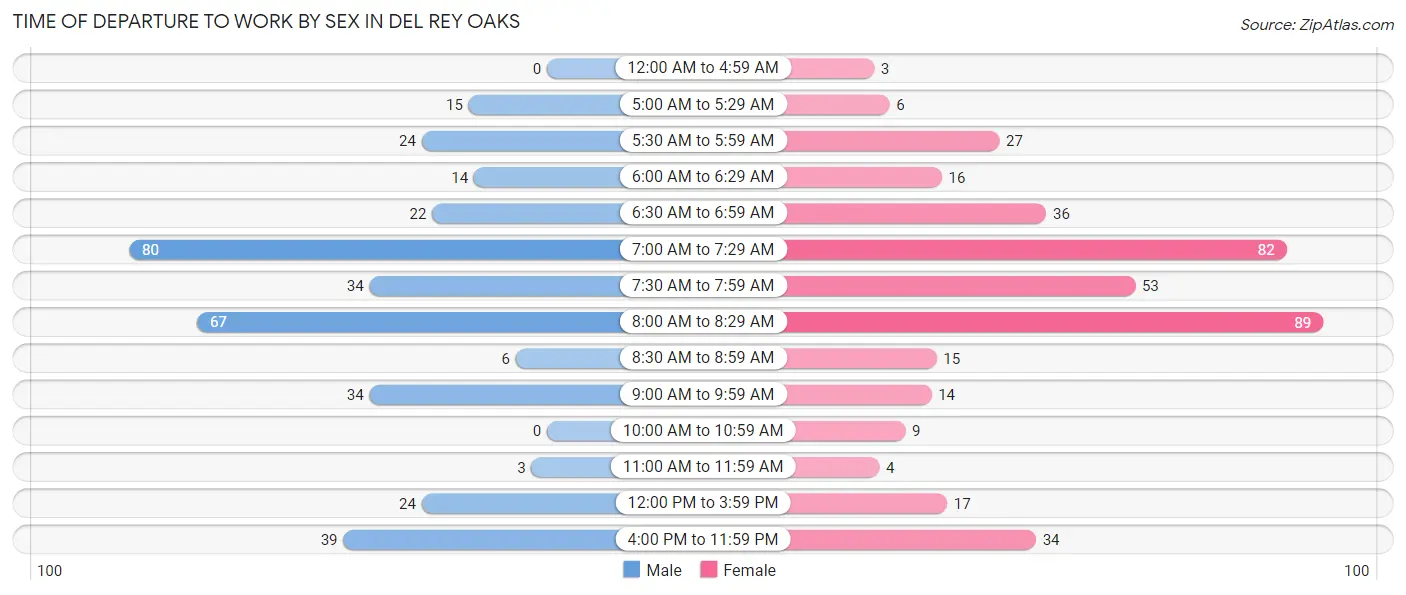
| Time of Departure | Male | Female |
| 12:00 AM to 4:59 AM | 0 (0.0%) | 3 (0.7%) |
| 5:00 AM to 5:29 AM | 15 (4.1%) | 6 (1.5%) |
| 5:30 AM to 5:59 AM | 24 (6.6%) | 27 (6.7%) |
| 6:00 AM to 6:29 AM | 14 (3.9%) | 16 (4.0%) |
| 6:30 AM to 6:59 AM | 22 (6.1%) | 36 (8.9%) |
| 7:00 AM to 7:29 AM | 80 (22.1%) | 82 (20.3%) |
| 7:30 AM to 7:59 AM | 34 (9.4%) | 53 (13.1%) |
| 8:00 AM to 8:29 AM | 67 (18.5%) | 89 (22.0%) |
| 8:30 AM to 8:59 AM | 6 (1.7%) | 15 (3.7%) |
| 9:00 AM to 9:59 AM | 34 (9.4%) | 14 (3.5%) |
| 10:00 AM to 10:59 AM | 0 (0.0%) | 9 (2.2%) |
| 11:00 AM to 11:59 AM | 3 (0.8%) | 4 (1.0%) |
| 12:00 PM to 3:59 PM | 24 (6.6%) | 17 (4.2%) |
| 4:00 PM to 11:59 PM | 39 (10.8%) | 34 (8.4%) |
| Total | 362 (100.0%) | 405 (100.0%) |
Housing Occupancy in Del Rey Oaks
Occupancy by Ownership in Del Rey Oaks
Of the total 644 dwellings in Del Rey Oaks, owner-occupied units account for 485 (75.3%), while renter-occupied units make up 159 (24.7%).
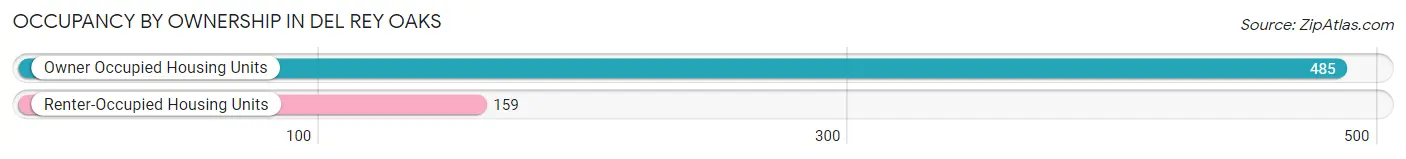
| Occupancy | # Housing Units | % Housing Units |
| Owner Occupied Housing Units | 485 | 75.3% |
| Renter-Occupied Housing Units | 159 | 24.7% |
| Total Occupied Housing Units | 644 | 100.0% |
Occupancy by Household Size in Del Rey Oaks
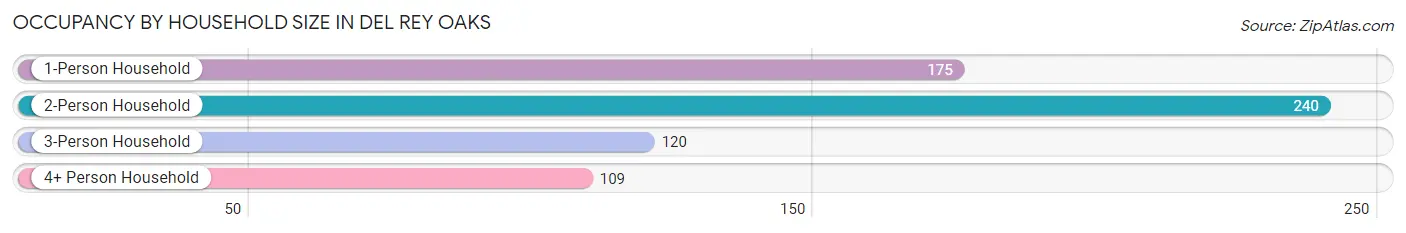
| Household Size | # Housing Units | % Housing Units |
| 1-Person Household | 175 | 27.2% |
| 2-Person Household | 240 | 37.3% |
| 3-Person Household | 120 | 18.6% |
| 4+ Person Household | 109 | 16.9% |
| Total Housing Units | 644 | 100.0% |
Occupancy by Ownership by Household Size in Del Rey Oaks
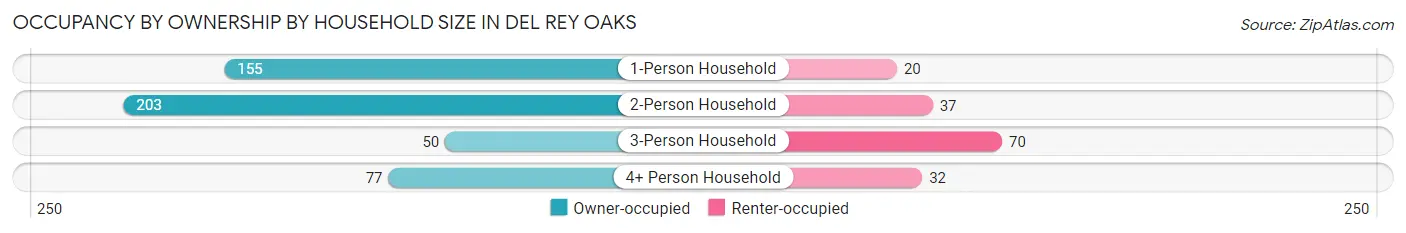
| Household Size | Owner-occupied | Renter-occupied |
| 1-Person Household | 155 (88.6%) | 20 (11.4%) |
| 2-Person Household | 203 (84.6%) | 37 (15.4%) |
| 3-Person Household | 50 (41.7%) | 70 (58.3%) |
| 4+ Person Household | 77 (70.6%) | 32 (29.4%) |
| Total Housing Units | 485 (75.3%) | 159 (24.7%) |
Occupancy by Educational Attainment in Del Rey Oaks
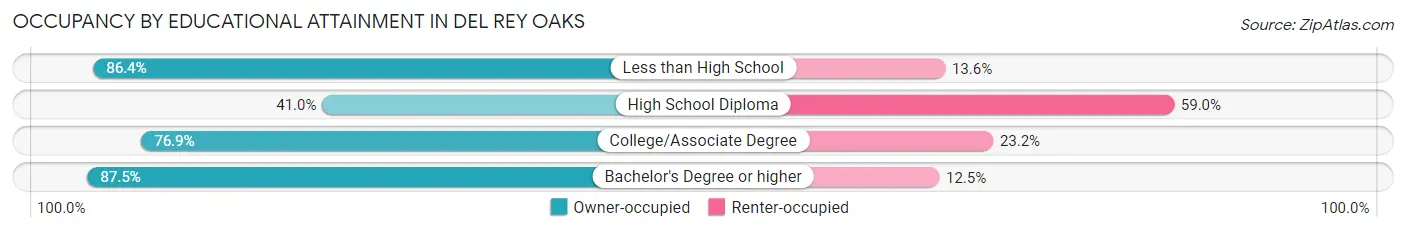
| Household Size | Owner-occupied | Renter-occupied |
| Less than High School | 19 (86.4%) | 3 (13.6%) |
| High School Diploma | 50 (41.0%) | 72 (59.0%) |
| College/Associate Degree | 156 (76.8%) | 47 (23.2%) |
| Bachelor's Degree or higher | 260 (87.5%) | 37 (12.5%) |
Occupancy by Age of Householder in Del Rey Oaks
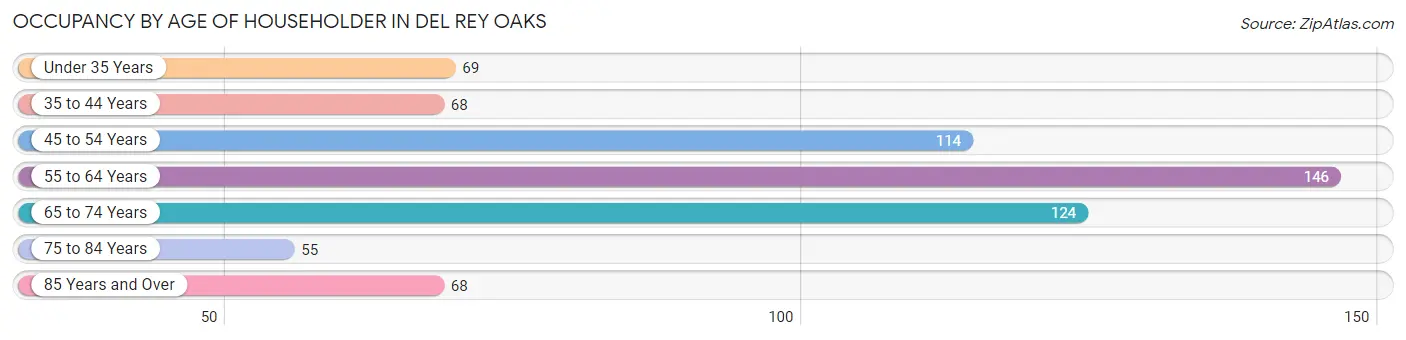
| Age Bracket | # Households | % Households |
| Under 35 Years | 69 | 10.7% |
| 35 to 44 Years | 68 | 10.6% |
| 45 to 54 Years | 114 | 17.7% |
| 55 to 64 Years | 146 | 22.7% |
| 65 to 74 Years | 124 | 19.3% |
| 75 to 84 Years | 55 | 8.5% |
| 85 Years and Over | 68 | 10.6% |
| Total | 644 | 100.0% |
Housing Finances in Del Rey Oaks
Median Income by Occupancy in Del Rey Oaks
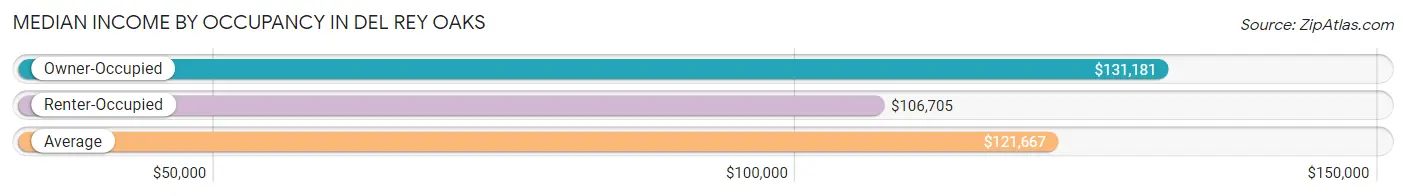
| Occupancy Type | # Households | Median Income |
| Owner-Occupied | 485 (75.3%) | $131,181 |
| Renter-Occupied | 159 (24.7%) | $106,705 |
| Average | 644 (100.0%) | $121,667 |
Occupancy by Householder Income Bracket in Del Rey Oaks
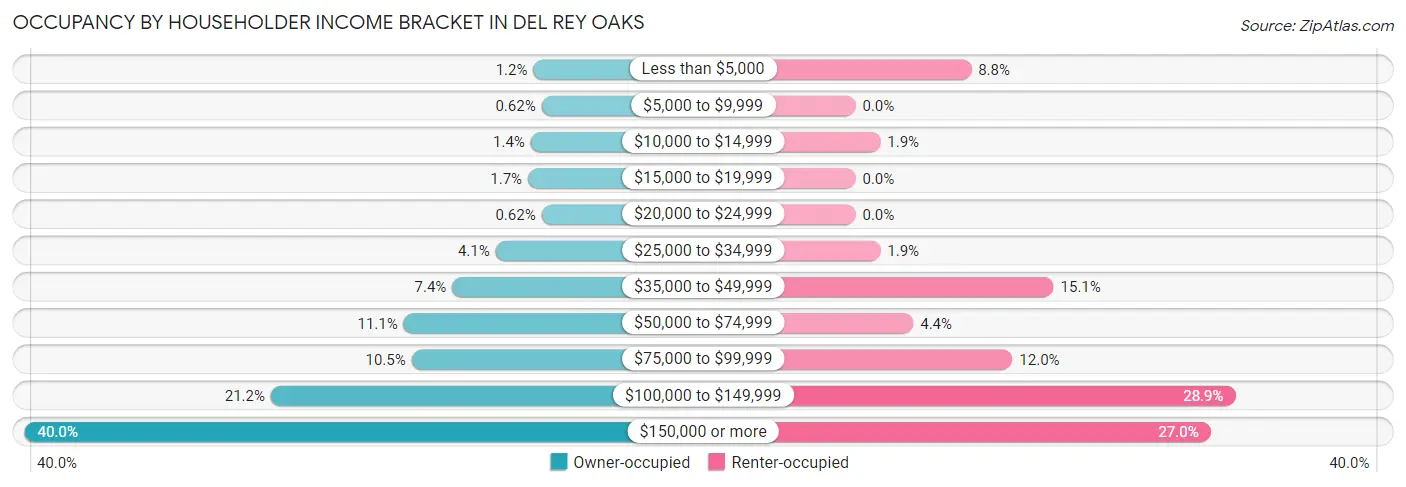
| Income Bracket | Owner-occupied | Renter-occupied |
| Less than $5,000 | 6 (1.2%) | 14 (8.8%) |
| $5,000 to $9,999 | 3 (0.6%) | 0 (0.0%) |
| $10,000 to $14,999 | 7 (1.4%) | 3 (1.9%) |
| $15,000 to $19,999 | 8 (1.7%) | 0 (0.0%) |
| $20,000 to $24,999 | 3 (0.6%) | 0 (0.0%) |
| $25,000 to $34,999 | 20 (4.1%) | 3 (1.9%) |
| $35,000 to $49,999 | 36 (7.4%) | 24 (15.1%) |
| $50,000 to $74,999 | 54 (11.1%) | 7 (4.4%) |
| $75,000 to $99,999 | 51 (10.5%) | 19 (11.9%) |
| $100,000 to $149,999 | 103 (21.2%) | 46 (28.9%) |
| $150,000 or more | 194 (40.0%) | 43 (27.0%) |
| Total | 485 (100.0%) | 159 (100.0%) |
Monthly Housing Cost Tiers in Del Rey Oaks
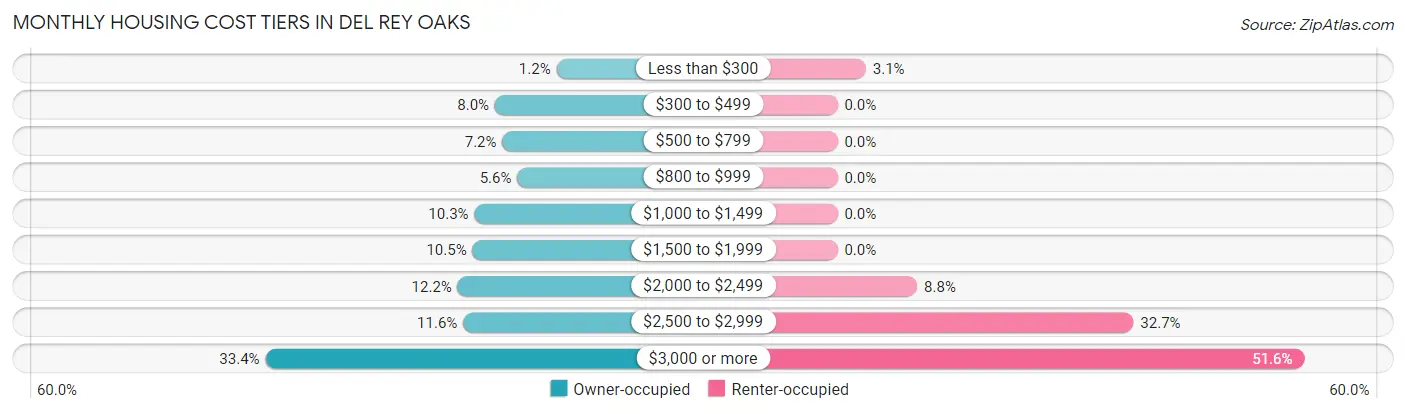
| Monthly Cost | Owner-occupied | Renter-occupied |
| Less than $300 | 6 (1.2%) | 5 (3.1%) |
| $300 to $499 | 39 (8.0%) | 0 (0.0%) |
| $500 to $799 | 35 (7.2%) | 0 (0.0%) |
| $800 to $999 | 27 (5.6%) | 0 (0.0%) |
| $1,000 to $1,499 | 50 (10.3%) | 0 (0.0%) |
| $1,500 to $1,999 | 51 (10.5%) | 0 (0.0%) |
| $2,000 to $2,499 | 59 (12.2%) | 14 (8.8%) |
| $2,500 to $2,999 | 56 (11.6%) | 52 (32.7%) |
| $3,000 or more | 162 (33.4%) | 82 (51.6%) |
| Total | 485 (100.0%) | 159 (100.0%) |
Physical Housing Characteristics in Del Rey Oaks
Housing Structures in Del Rey Oaks
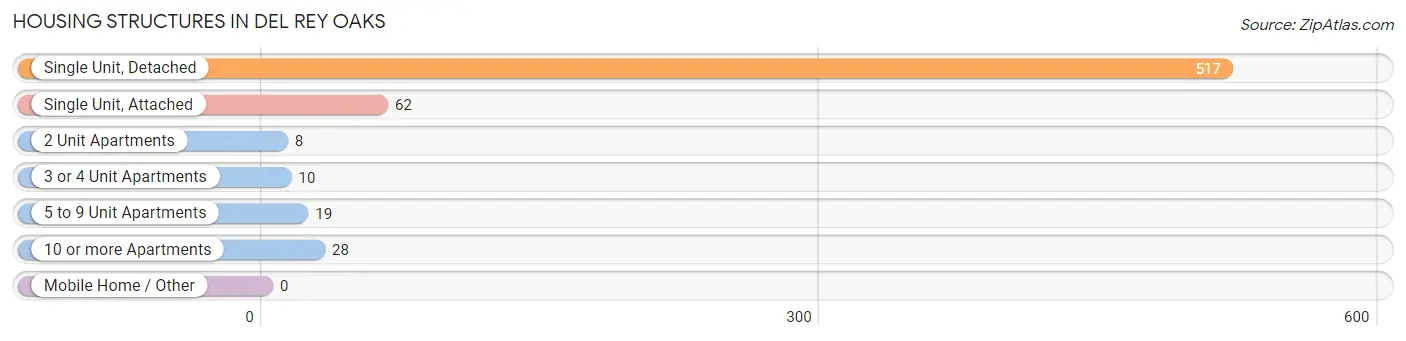
| Structure Type | # Housing Units | % Housing Units |
| Single Unit, Detached | 517 | 80.3% |
| Single Unit, Attached | 62 | 9.6% |
| 2 Unit Apartments | 8 | 1.2% |
| 3 or 4 Unit Apartments | 10 | 1.5% |
| 5 to 9 Unit Apartments | 19 | 2.9% |
| 10 or more Apartments | 28 | 4.3% |
| Mobile Home / Other | 0 | 0.0% |
| Total | 644 | 100.0% |
Housing Structures by Occupancy in Del Rey Oaks
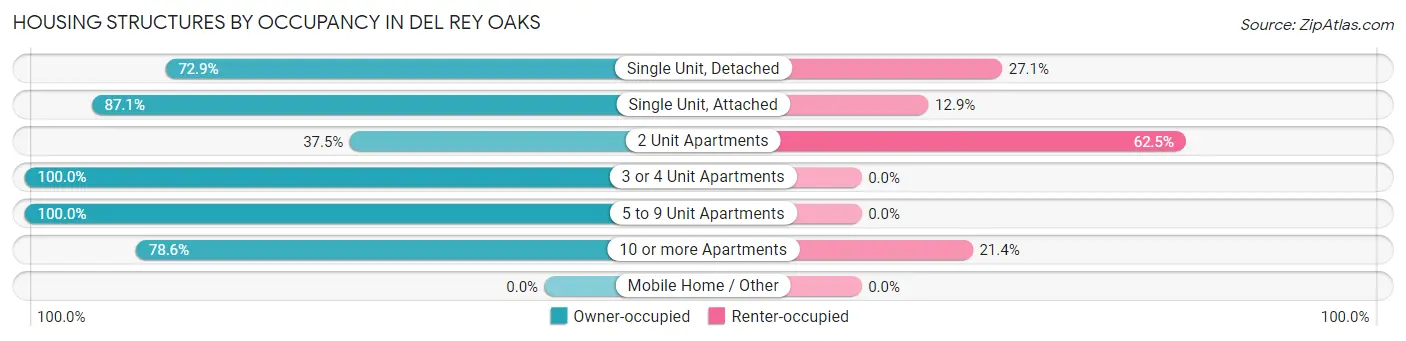
| Structure Type | Owner-occupied | Renter-occupied |
| Single Unit, Detached | 377 (72.9%) | 140 (27.1%) |
| Single Unit, Attached | 54 (87.1%) | 8 (12.9%) |
| 2 Unit Apartments | 3 (37.5%) | 5 (62.5%) |
| 3 or 4 Unit Apartments | 10 (100.0%) | 0 (0.0%) |
| 5 to 9 Unit Apartments | 19 (100.0%) | 0 (0.0%) |
| 10 or more Apartments | 22 (78.6%) | 6 (21.4%) |
| Mobile Home / Other | 0 (0.0%) | 0 (0.0%) |
| Total | 485 (75.3%) | 159 (24.7%) |
Housing Structures by Number of Rooms in Del Rey Oaks
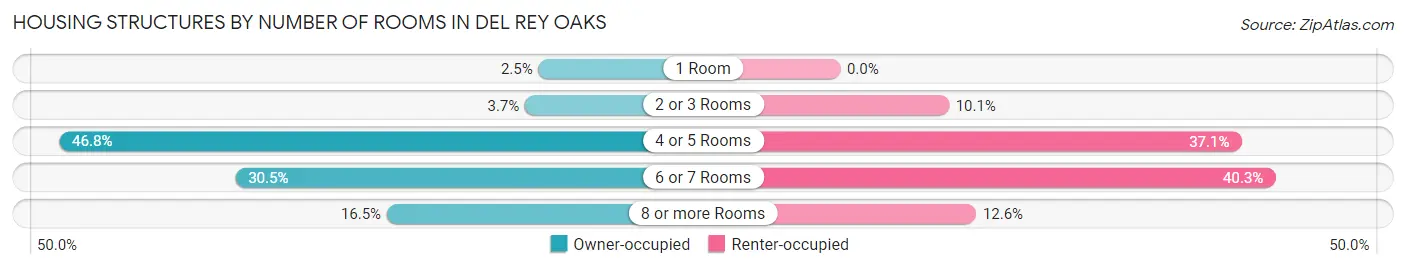
| Number of Rooms | Owner-occupied | Renter-occupied |
| 1 Room | 12 (2.5%) | 0 (0.0%) |
| 2 or 3 Rooms | 18 (3.7%) | 16 (10.1%) |
| 4 or 5 Rooms | 227 (46.8%) | 59 (37.1%) |
| 6 or 7 Rooms | 148 (30.5%) | 64 (40.3%) |
| 8 or more Rooms | 80 (16.5%) | 20 (12.6%) |
| Total | 485 (100.0%) | 159 (100.0%) |
Housing Structure by Heating Type in Del Rey Oaks
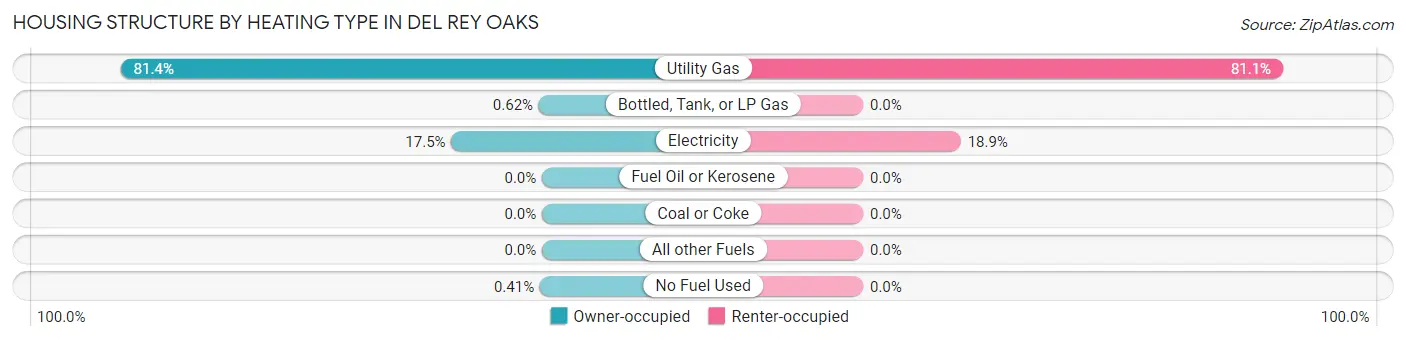
| Heating Type | Owner-occupied | Renter-occupied |
| Utility Gas | 395 (81.4%) | 129 (81.1%) |
| Bottled, Tank, or LP Gas | 3 (0.6%) | 0 (0.0%) |
| Electricity | 85 (17.5%) | 30 (18.9%) |
| Fuel Oil or Kerosene | 0 (0.0%) | 0 (0.0%) |
| Coal or Coke | 0 (0.0%) | 0 (0.0%) |
| All other Fuels | 0 (0.0%) | 0 (0.0%) |
| No Fuel Used | 2 (0.4%) | 0 (0.0%) |
| Total | 485 (100.0%) | 159 (100.0%) |
Household Vehicle Usage in Del Rey Oaks
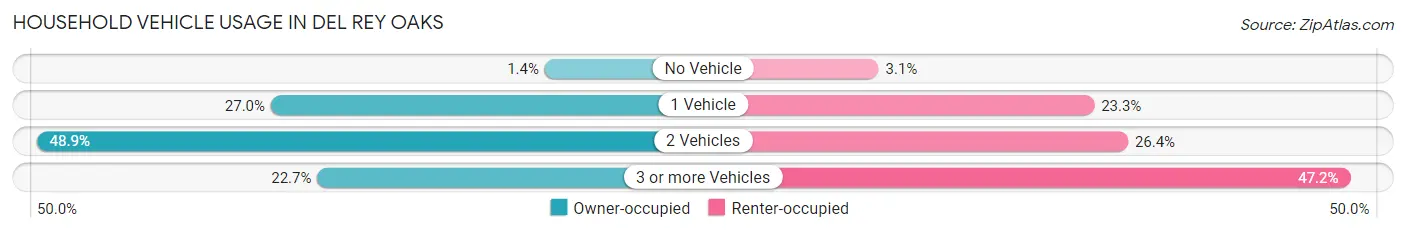
| Vehicles per Household | Owner-occupied | Renter-occupied |
| No Vehicle | 7 (1.4%) | 5 (3.1%) |
| 1 Vehicle | 131 (27.0%) | 37 (23.3%) |
| 2 Vehicles | 237 (48.9%) | 42 (26.4%) |
| 3 or more Vehicles | 110 (22.7%) | 75 (47.2%) |
| Total | 485 (100.0%) | 159 (100.0%) |
Real Estate & Mortgages in Del Rey Oaks
Real Estate and Mortgage Overview in Del Rey Oaks
| Characteristic | Without Mortgage | With Mortgage |
| Housing Units | 137 | 348 |
| Median Property Value | $805,800 | $804,300 |
| Median Household Income | $79,107 | $167 |
| Monthly Housing Costs | $765 | $162 |
| Real Estate Taxes | $3,538 | $7 |
Property Value by Mortgage Status in Del Rey Oaks
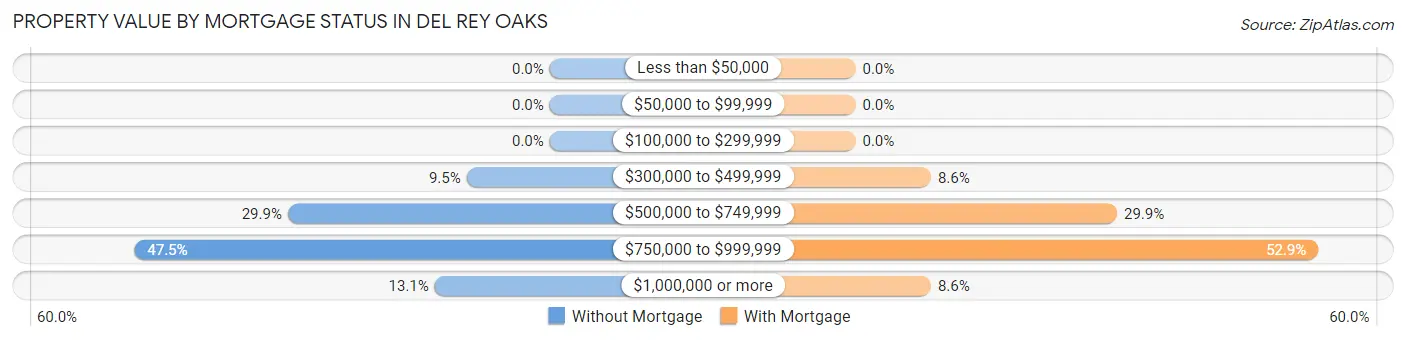
| Property Value | Without Mortgage | With Mortgage |
| Less than $50,000 | 0 (0.0%) | 0 (0.0%) |
| $50,000 to $99,999 | 0 (0.0%) | 0 (0.0%) |
| $100,000 to $299,999 | 0 (0.0%) | 0 (0.0%) |
| $300,000 to $499,999 | 13 (9.5%) | 30 (8.6%) |
| $500,000 to $749,999 | 41 (29.9%) | 104 (29.9%) |
| $750,000 to $999,999 | 65 (47.4%) | 184 (52.9%) |
| $1,000,000 or more | 18 (13.1%) | 30 (8.6%) |
| Total | 137 (100.0%) | 348 (100.0%) |
Household Income by Mortgage Status in Del Rey Oaks
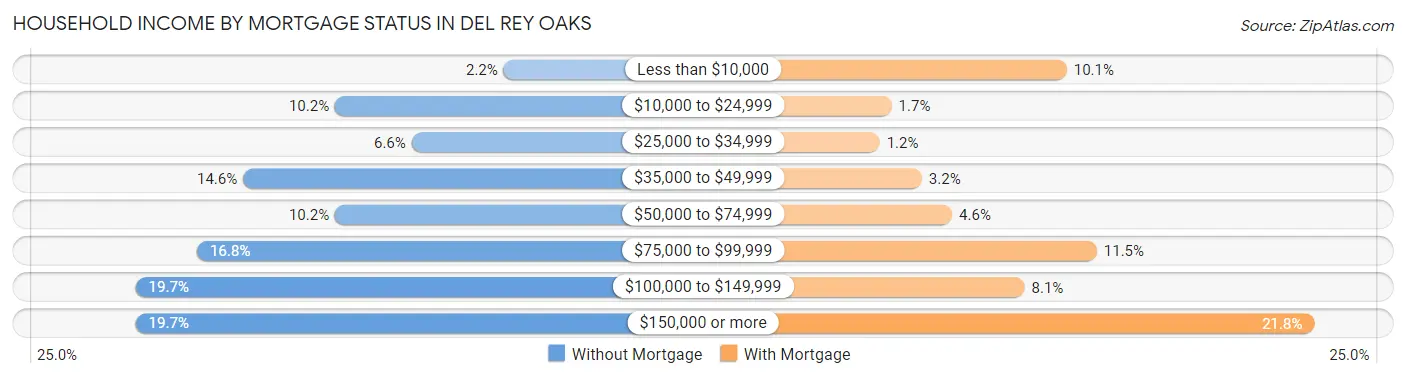
| Household Income | Without Mortgage | With Mortgage |
| Less than $10,000 | 3 (2.2%) | 35 (10.1%) |
| $10,000 to $24,999 | 14 (10.2%) | 6 (1.7%) |
| $25,000 to $34,999 | 9 (6.6%) | 4 (1.1%) |
| $35,000 to $49,999 | 20 (14.6%) | 11 (3.2%) |
| $50,000 to $74,999 | 14 (10.2%) | 16 (4.6%) |
| $75,000 to $99,999 | 23 (16.8%) | 40 (11.5%) |
| $100,000 to $149,999 | 27 (19.7%) | 28 (8.1%) |
| $150,000 or more | 27 (19.7%) | 76 (21.8%) |
| Total | 137 (100.0%) | 348 (100.0%) |
Property Value to Household Income Ratio in Del Rey Oaks
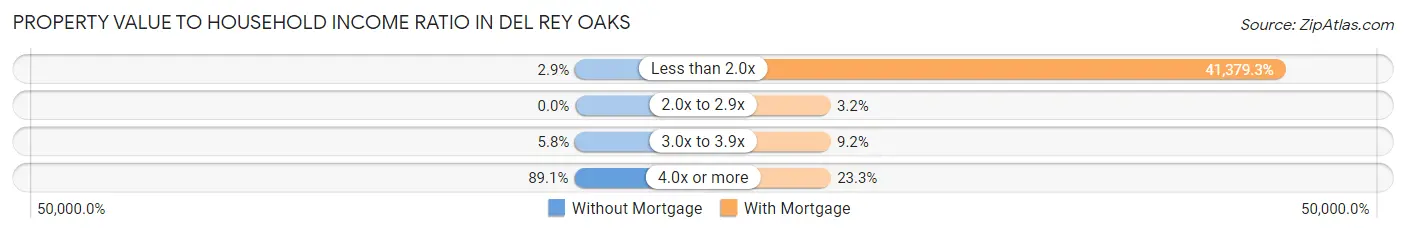
| Value-to-Income Ratio | Without Mortgage | With Mortgage |
| Less than 2.0x | 4 (2.9%) | 144,000 (41,379.3%) |
| 2.0x to 2.9x | 0 (0.0%) | 11 (3.2%) |
| 3.0x to 3.9x | 8 (5.8%) | 32 (9.2%) |
| 4.0x or more | 122 (89.0%) | 81 (23.3%) |
| Total | 137 (100.0%) | 348 (100.0%) |
Real Estate Taxes by Mortgage Status in Del Rey Oaks
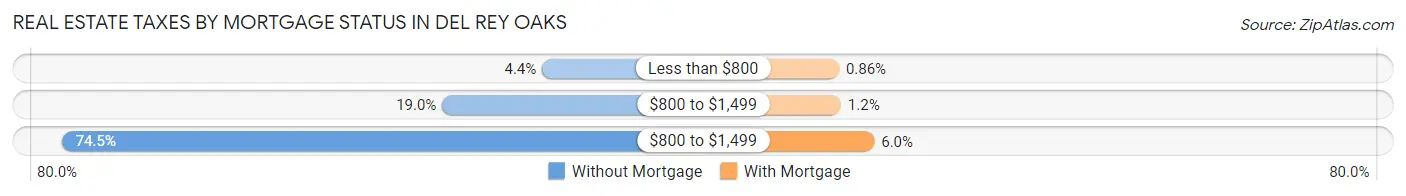
| Property Taxes | Without Mortgage | With Mortgage |
| Less than $800 | 6 (4.4%) | 3 (0.9%) |
| $800 to $1,499 | 26 (19.0%) | 4 (1.1%) |
| $800 to $1,499 | 102 (74.5%) | 21 (6.0%) |
| Total | 137 (100.0%) | 348 (100.0%) |
Health & Disability in Del Rey Oaks
Health Insurance Coverage by Age in Del Rey Oaks
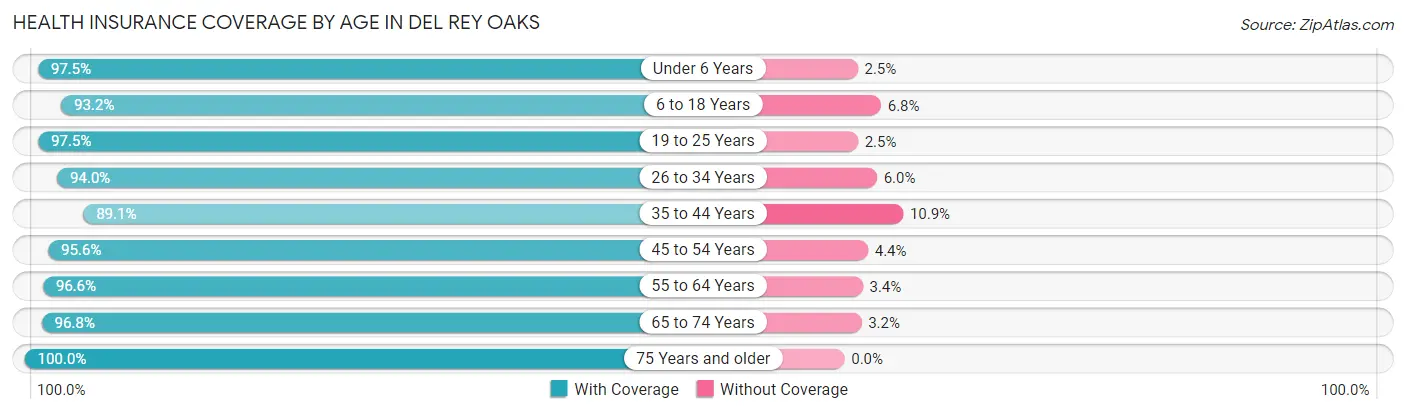
| Age Bracket | With Coverage | Without Coverage |
| Under 6 Years | 79 (97.5%) | 2 (2.5%) |
| 6 to 18 Years | 137 (93.2%) | 10 (6.8%) |
| 19 to 25 Years | 117 (97.5%) | 3 (2.5%) |
| 26 to 34 Years | 171 (94.0%) | 11 (6.0%) |
| 35 to 44 Years | 114 (89.1%) | 14 (10.9%) |
| 45 to 54 Years | 284 (95.6%) | 13 (4.4%) |
| 55 to 64 Years | 284 (96.6%) | 10 (3.4%) |
| 65 to 74 Years | 184 (96.8%) | 6 (3.2%) |
| 75 Years and older | 164 (100.0%) | 0 (0.0%) |
| Total | 1,534 (95.7%) | 69 (4.3%) |
Health Insurance Coverage by Citizenship Status in Del Rey Oaks
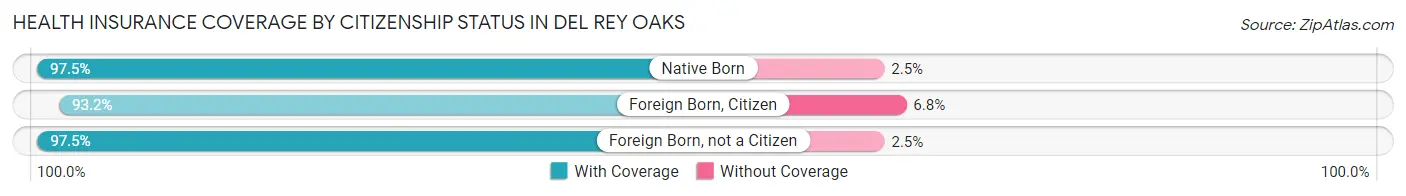
| Citizenship Status | With Coverage | Without Coverage |
| Native Born | 79 (97.5%) | 2 (2.5%) |
| Foreign Born, Citizen | 137 (93.2%) | 10 (6.8%) |
| Foreign Born, not a Citizen | 117 (97.5%) | 3 (2.5%) |
Health Insurance Coverage by Household Income in Del Rey Oaks
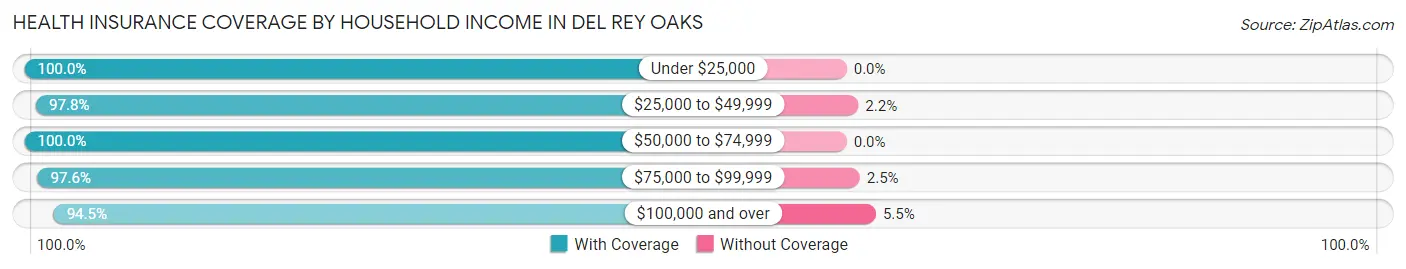
| Household Income | With Coverage | Without Coverage |
| Under $25,000 | 75 (100.0%) | 0 (0.0%) |
| $25,000 to $49,999 | 135 (97.8%) | 3 (2.2%) |
| $50,000 to $74,999 | 94 (100.0%) | 0 (0.0%) |
| $75,000 to $99,999 | 159 (97.6%) | 4 (2.5%) |
| $100,000 and over | 1,071 (94.5%) | 62 (5.5%) |
Public vs Private Health Insurance Coverage by Age in Del Rey Oaks
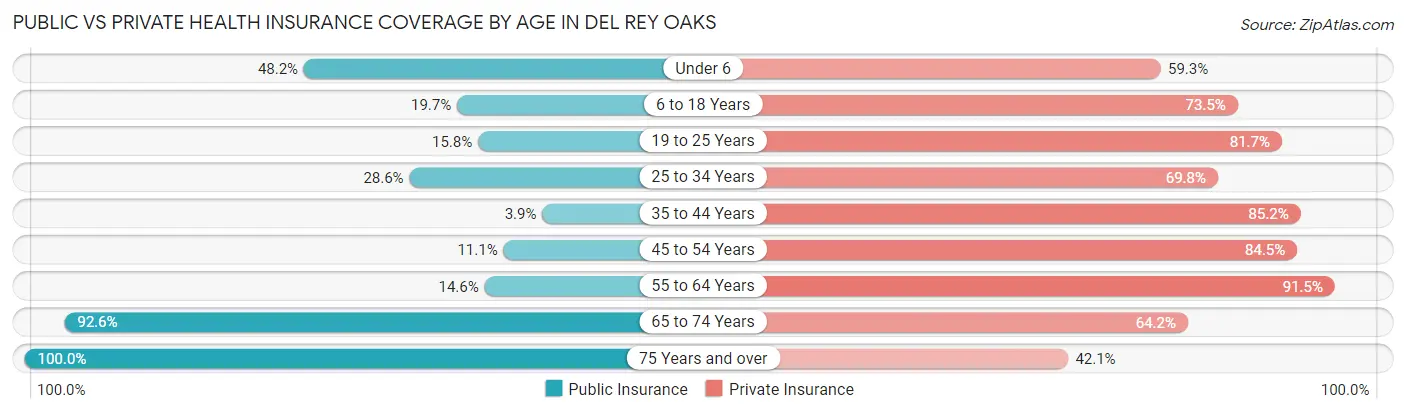
| Age Bracket | Public Insurance | Private Insurance |
| Under 6 | 39 (48.1%) | 48 (59.3%) |
| 6 to 18 Years | 29 (19.7%) | 108 (73.5%) |
| 19 to 25 Years | 19 (15.8%) | 98 (81.7%) |
| 25 to 34 Years | 52 (28.6%) | 127 (69.8%) |
| 35 to 44 Years | 5 (3.9%) | 109 (85.2%) |
| 45 to 54 Years | 33 (11.1%) | 251 (84.5%) |
| 55 to 64 Years | 43 (14.6%) | 269 (91.5%) |
| 65 to 74 Years | 176 (92.6%) | 122 (64.2%) |
| 75 Years and over | 164 (100.0%) | 69 (42.1%) |
| Total | 560 (34.9%) | 1,201 (74.9%) |
Disability Status by Sex by Age in Del Rey Oaks
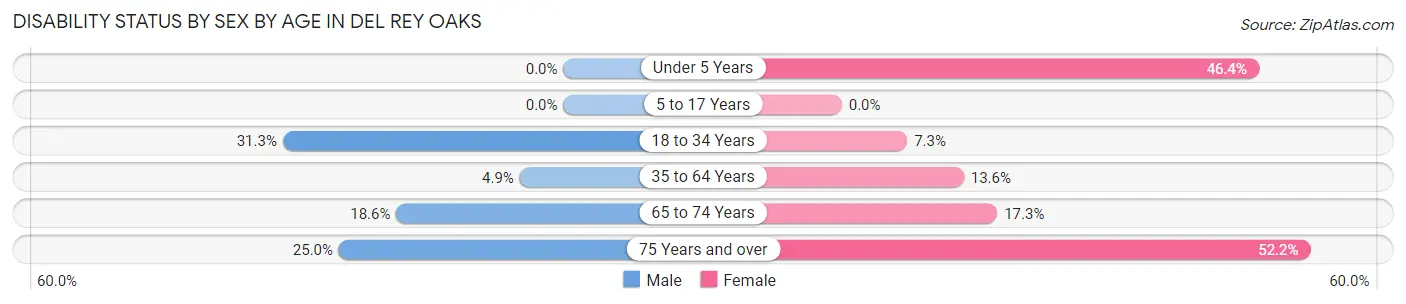
| Age Bracket | Male | Female |
| Under 5 Years | 0 (0.0%) | 13 (46.4%) |
| 5 to 17 Years | 0 (0.0%) | 0 (0.0%) |
| 18 to 34 Years | 40 (31.2%) | 14 (7.3%) |
| 35 to 64 Years | 16 (4.9%) | 53 (13.6%) |
| 65 to 74 Years | 16 (18.6%) | 18 (17.3%) |
| 75 Years and over | 18 (25.0%) | 48 (52.2%) |
Disability Class by Sex by Age in Del Rey Oaks
Disability Class: Hearing Difficulty
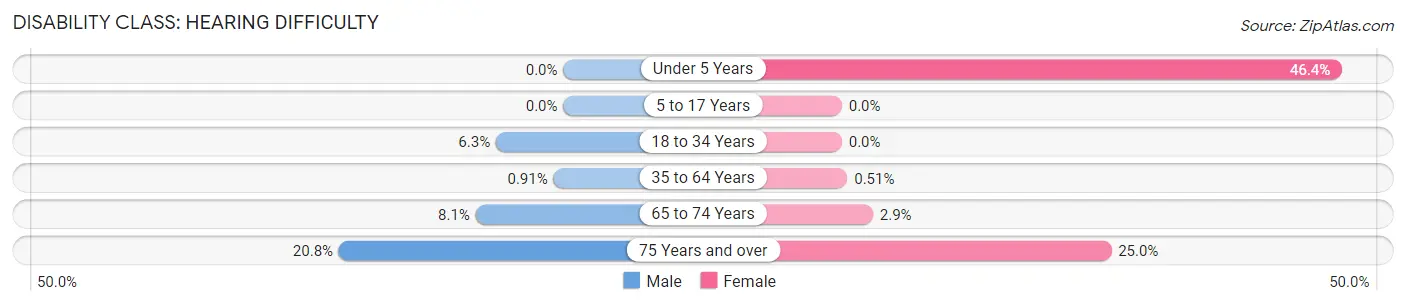
| Age Bracket | Male | Female |
| Under 5 Years | 0 (0.0%) | 13 (46.4%) |
| 5 to 17 Years | 0 (0.0%) | 0 (0.0%) |
| 18 to 34 Years | 8 (6.2%) | 0 (0.0%) |
| 35 to 64 Years | 3 (0.9%) | 2 (0.5%) |
| 65 to 74 Years | 7 (8.1%) | 3 (2.9%) |
| 75 Years and over | 15 (20.8%) | 23 (25.0%) |
Disability Class: Vision Difficulty
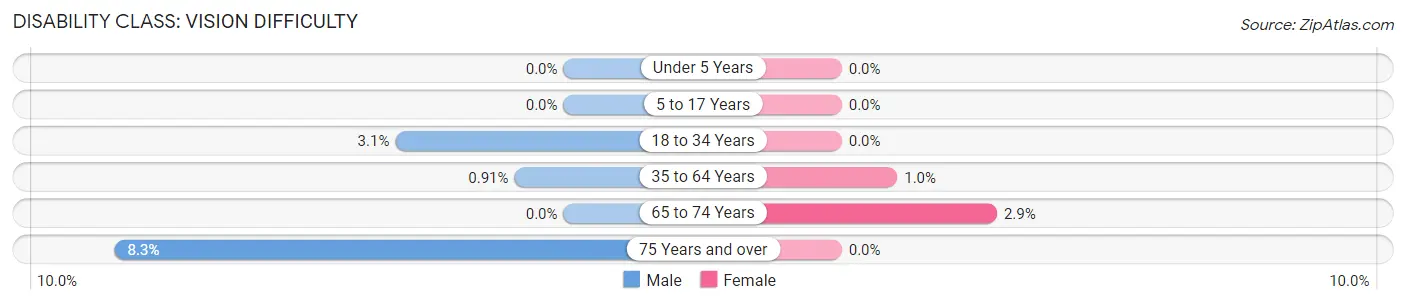
| Age Bracket | Male | Female |
| Under 5 Years | 0 (0.0%) | 0 (0.0%) |
| 5 to 17 Years | 0 (0.0%) | 0 (0.0%) |
| 18 to 34 Years | 4 (3.1%) | 0 (0.0%) |
| 35 to 64 Years | 3 (0.9%) | 4 (1.0%) |
| 65 to 74 Years | 0 (0.0%) | 3 (2.9%) |
| 75 Years and over | 6 (8.3%) | 0 (0.0%) |
Disability Class: Cognitive Difficulty
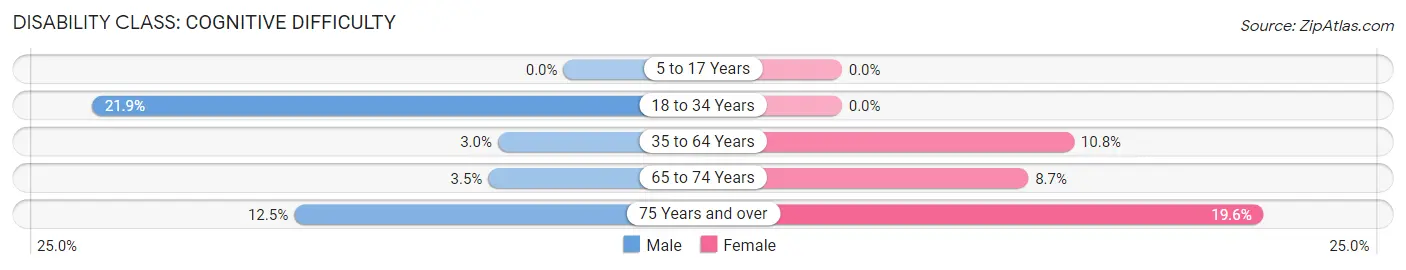
| Age Bracket | Male | Female |
| 5 to 17 Years | 0 (0.0%) | 0 (0.0%) |
| 18 to 34 Years | 28 (21.9%) | 0 (0.0%) |
| 35 to 64 Years | 10 (3.0%) | 42 (10.8%) |
| 65 to 74 Years | 3 (3.5%) | 9 (8.6%) |
| 75 Years and over | 9 (12.5%) | 18 (19.6%) |
Disability Class: Ambulatory Difficulty
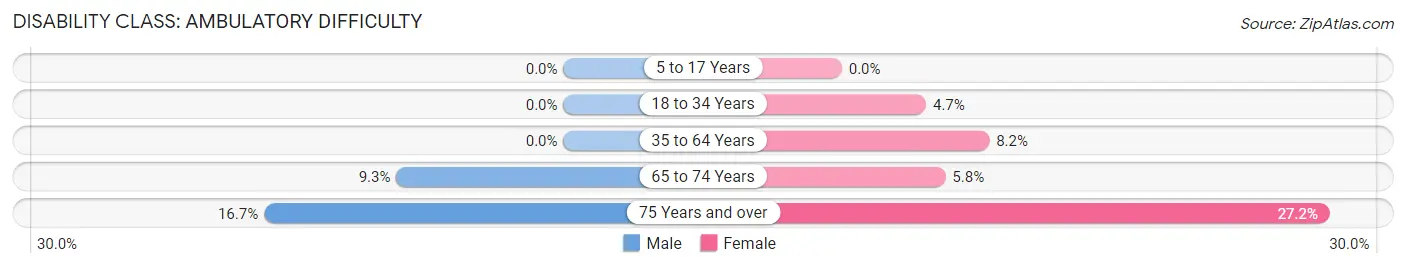
| Age Bracket | Male | Female |
| 5 to 17 Years | 0 (0.0%) | 0 (0.0%) |
| 18 to 34 Years | 0 (0.0%) | 9 (4.7%) |
| 35 to 64 Years | 0 (0.0%) | 32 (8.2%) |
| 65 to 74 Years | 8 (9.3%) | 6 (5.8%) |
| 75 Years and over | 12 (16.7%) | 25 (27.2%) |
Disability Class: Self-Care Difficulty
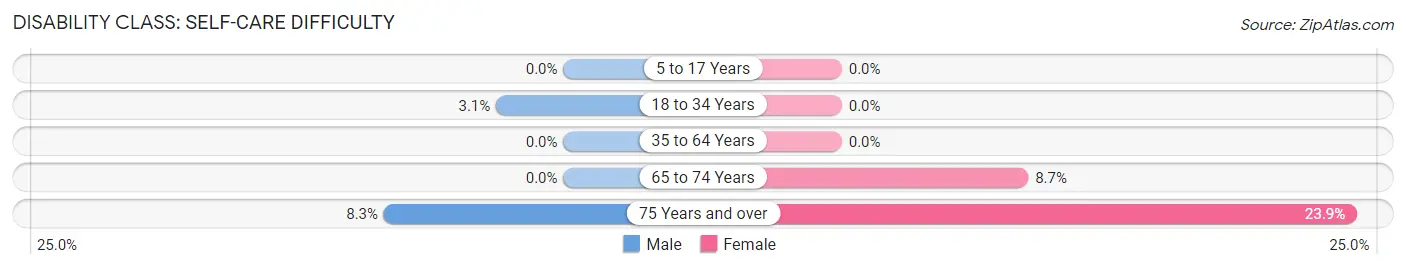
| Age Bracket | Male | Female |
| 5 to 17 Years | 0 (0.0%) | 0 (0.0%) |
| 18 to 34 Years | 4 (3.1%) | 0 (0.0%) |
| 35 to 64 Years | 0 (0.0%) | 0 (0.0%) |
| 65 to 74 Years | 0 (0.0%) | 9 (8.6%) |
| 75 Years and over | 6 (8.3%) | 22 (23.9%) |
Technology Access in Del Rey Oaks
Computing Device Access in Del Rey Oaks
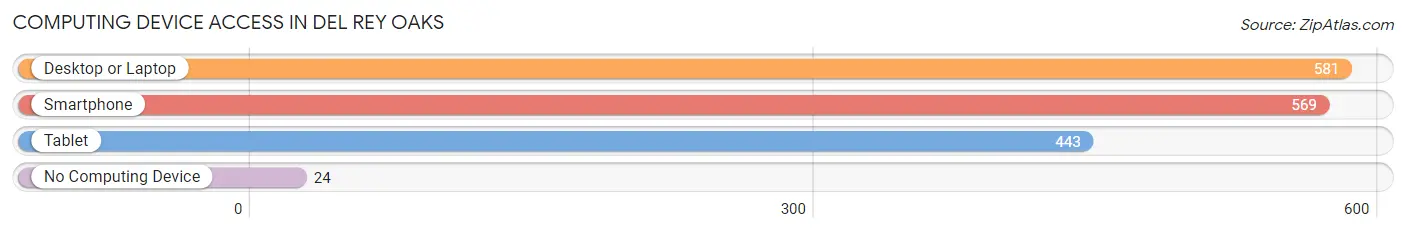
| Device Type | # Households | % Households |
| Desktop or Laptop | 581 | 90.2% |
| Smartphone | 569 | 88.3% |
| Tablet | 443 | 68.8% |
| No Computing Device | 24 | 3.7% |
| Total | 644 | 100.0% |
Internet Access in Del Rey Oaks
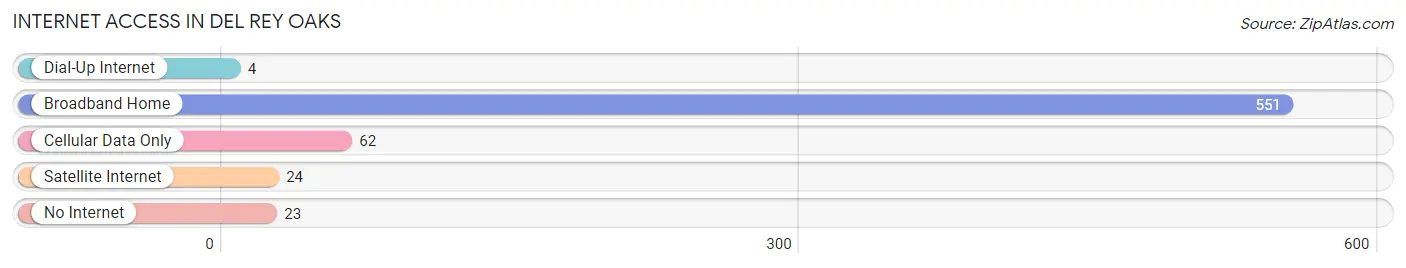
| Internet Type | # Households | % Households |
| Dial-Up Internet | 4 | 0.6% |
| Broadband Home | 551 | 85.6% |
| Cellular Data Only | 62 | 9.6% |
| Satellite Internet | 24 | 3.7% |
| No Internet | 23 | 3.6% |
| Total | 644 | 100.0% |
Del Rey Oaks Summary
Del Rey Oaks is a small city located in Monterey County, California. It is situated on the Monterey Peninsula, just south of the city of Monterey and north of the city of Seaside. The city was incorporated in 1959 and has a population of approximately 1,621 people as of the 2010 census.
History
Del Rey Oaks was originally part of the Rancho El Sur land grant, which was granted to Don Jose Abrego in 1834. The land was later sold to the Del Rey Land Company in 1887, and the area was developed as a residential community. The Del Rey Land Company was owned by the Del Rey family, who were prominent in the area. The Del Rey family owned a large amount of land in the area, and they were responsible for the development of the city.
In 1959, the residents of the area voted to incorporate the city of Del Rey Oaks. The city was named after the Del Rey family, who had been instrumental in the development of the area.
Geography
Del Rey Oaks is located on the Monterey Peninsula, just south of the city of Monterey and north of the city of Seaside. The city is situated on the Monterey Bay, and is bordered by the cities of Monterey, Seaside, and Pacific Grove. The city covers an area of 1.2 square miles, and has a population density of 1,364 people per square mile.
The city is located in a temperate climate, with mild temperatures year-round. The average high temperature in the summer is around 75 degrees Fahrenheit, and the average low temperature in the winter is around 50 degrees Fahrenheit.
Economy
Del Rey Oaks is a small city, and the economy is largely based on tourism and service industries. The city is home to several hotels and restaurants, as well as a number of retail stores. The city is also home to a number of government offices, including the Monterey County Sheriff's Office and the Monterey County Health Department.
The city is also home to a number of small businesses, including a number of professional services firms. The city is also home to a number of technology companies, including a number of software development firms.
Demographics
As of the 2010 census, the population of Del Rey Oaks was 1,621 people. The population is largely white, with a small percentage of African Americans, Asians, and Hispanics. The median household income in the city is $63,917, and the median age is 44.
The city is home to a number of educational institutions, including the Del Rey Oaks Elementary School and the Del Rey Oaks Middle School. The city is also home to a number of churches, including the Del Rey Oaks Community Church and the Del Rey Oaks Presbyterian Church.
Conclusion
Del Rey Oaks is a small city located on the Monterey Peninsula in California. The city was incorporated in 1959 and has a population of approximately 1,621 people as of the 2010 census. The economy of the city is largely based on tourism and service industries, and the city is home to a number of small businesses. The population of the city is largely white, with a small percentage of African Americans, Asians, and Hispanics. The city is home to a number of educational institutions, churches, and government offices.
Common Questions
What is the Total Population of Del Rey Oaks?
Total Population of Del Rey Oaks is 1,611.
What is the Total Male Population of Del Rey Oaks?
Total Male Population of Del Rey Oaks is 732.
What is the Total Female Population of Del Rey Oaks?
Total Female Population of Del Rey Oaks is 879.
What is the Ratio of Males per 100 Females in Del Rey Oaks?
There are 83.28 Males per 100 Females in Del Rey Oaks.
What is the Ratio of Females per 100 Males in Del Rey Oaks?
There are 120.08 Females per 100 Males in Del Rey Oaks.
What is the Median Population Age in Del Rey Oaks?
Median Population Age in Del Rey Oaks is 49.9 Years.
What is the Average Family Size in Del Rey Oaks
Average Family Size in Del Rey Oaks is 3.0 People.
What is the Average Household Size in Del Rey Oaks
Average Household Size in Del Rey Oaks is 2.5 People.
What is Per Capita Income in Del Rey Oaks?
Per Capita income in Del Rey Oaks is $58,890.
What is the Median Family Income in Del Rey Oaks?
Median Family Income in Del Rey Oaks is $131,875.
What is the Median Household income in Del Rey Oaks?
Median Household Income in Del Rey Oaks is $121,667.
What is Income or Wage Gap in Del Rey Oaks?
Income or Wage Gap in Del Rey Oaks is 25.3%.
Women in Del Rey Oaks earn 74.7 cents for every dollar earned by a man.
What is Inequality or Gini Index in Del Rey Oaks?
Inequality or Gini Index in Del Rey Oaks is 0.39.
How Large is the Labor Force in Del Rey Oaks?
There are 951 People in the Labor Forcein in Del Rey Oaks.
What is the Percentage of People in the Labor Force in Del Rey Oaks?
67.0% of People are in the Labor Force in Del Rey Oaks.
What is the Unemployment Rate in Del Rey Oaks?
Unemployment Rate in Del Rey Oaks is 11.3%.