Cleone, CA
Cleone Map
Cleone Overview
774
TOTAL POPULATION
371
MALE POPULATION
403
FEMALE POPULATION
92.06
MALES / 100 FEMALES
108.63
FEMALES / 100 MALES
44.1
MEDIAN AGE
2.9
AVG FAMILY SIZE
2.6
AVG HOUSEHOLD SIZE
$40,397
PER CAPITA INCOME
0.44
INEQUALITY / GINI INDEX
449
LABOR FORCE [ PEOPLE ]
66.9%
PERCENT IN LABOR FORCE
22.5%
UNEMPLOYMENT RATE
Race in Cleone
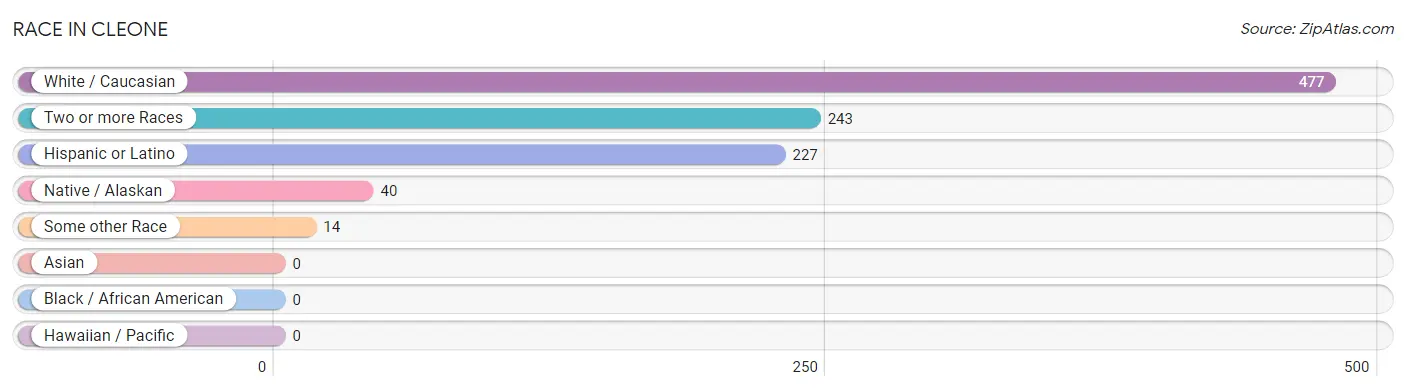
The most populous races in Cleone are White / Caucasian (477 | 61.6%), Two or more Races (243 | 31.4%), and Hispanic or Latino (227 | 29.3%).
| Race | # Population | % Population |
| Asian | 0 | 0.0% |
| Black / African American | 0 | 0.0% |
| Hawaiian / Pacific | 0 | 0.0% |
| Hispanic or Latino | 227 | 29.3% |
| Native / Alaskan | 40 | 5.2% |
| White / Caucasian | 477 | 61.6% |
| Two or more Races | 243 | 31.4% |
| Some other Race | 14 | 1.8% |
| Total | 774 | 100.0% |
Ancestry in Cleone
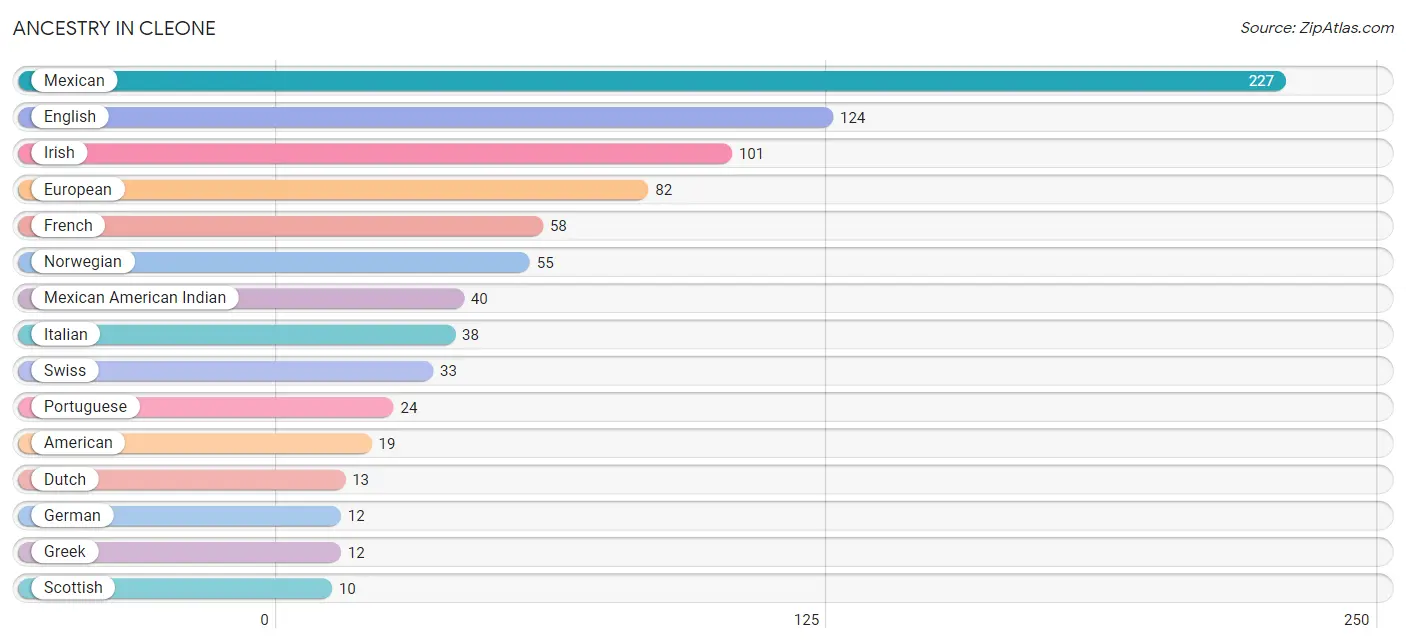
The most populous ancestries reported in Cleone are Mexican (227 | 29.3%), English (124 | 16.0%), Irish (101 | 13.1%), European (82 | 10.6%), and French (58 | 7.5%), together accounting for 76.5% of all Cleone residents.
| Ancestry | # Population | % Population |
| American | 19 | 2.5% |
| Basque | 8 | 1.0% |
| Dutch | 13 | 1.7% |
| English | 124 | 16.0% |
| European | 82 | 10.6% |
| Finnish | 8 | 1.0% |
| French | 58 | 7.5% |
| German | 12 | 1.5% |
| Greek | 12 | 1.5% |
| Irish | 101 | 13.1% |
| Italian | 38 | 4.9% |
| Latvian | 9 | 1.2% |
| Mexican | 227 | 29.3% |
| Mexican American Indian | 40 | 5.2% |
| Norwegian | 55 | 7.1% |
| Polish | 7 | 0.9% |
| Portuguese | 24 | 3.1% |
| Scottish | 10 | 1.3% |
| Swiss | 33 | 4.3% | View All 19 Rows |
Immigrants in Cleone
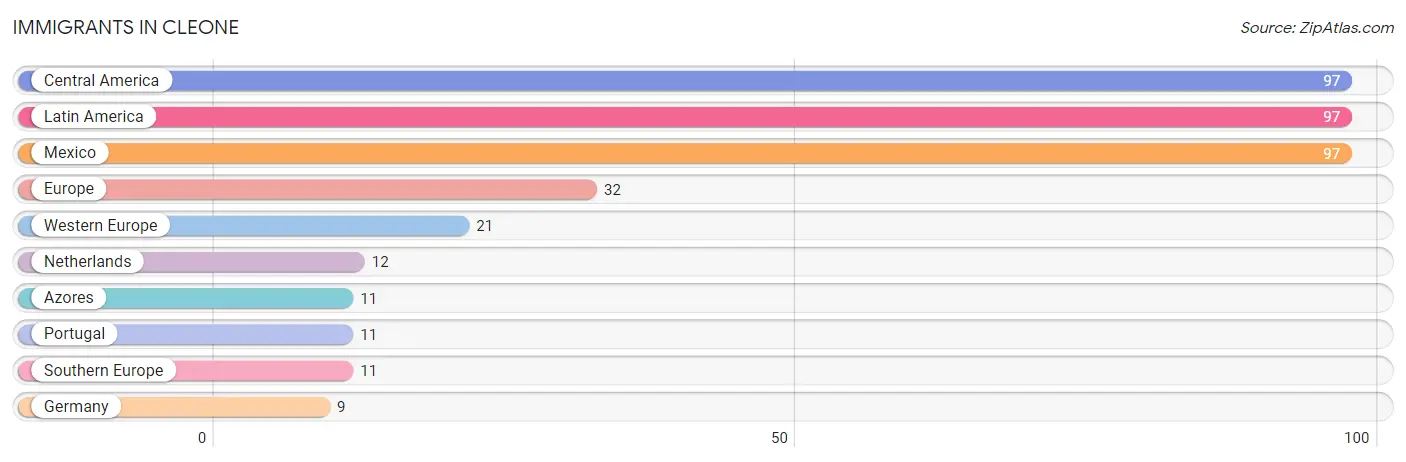
The most numerous immigrant groups reported in Cleone came from Central America (97 | 12.5%), Latin America (97 | 12.5%), Mexico (97 | 12.5%), Europe (32 | 4.1%), and Western Europe (21 | 2.7%), together accounting for 44.4% of all Cleone residents.
| Immigration Origin | # Population | % Population |
| Azores | 11 | 1.4% |
| Central America | 97 | 12.5% |
| Europe | 32 | 4.1% |
| Germany | 9 | 1.2% |
| Latin America | 97 | 12.5% |
| Mexico | 97 | 12.5% |
| Netherlands | 12 | 1.5% |
| Portugal | 11 | 1.4% |
| Southern Europe | 11 | 1.4% |
| Western Europe | 21 | 2.7% | View All 10 Rows |
Sex and Age in Cleone
Sex and Age in Cleone
The most populous age groups in Cleone are 40 to 44 Years (114 | 30.7%) for men and 10 to 14 Years (80 | 19.9%) for women.
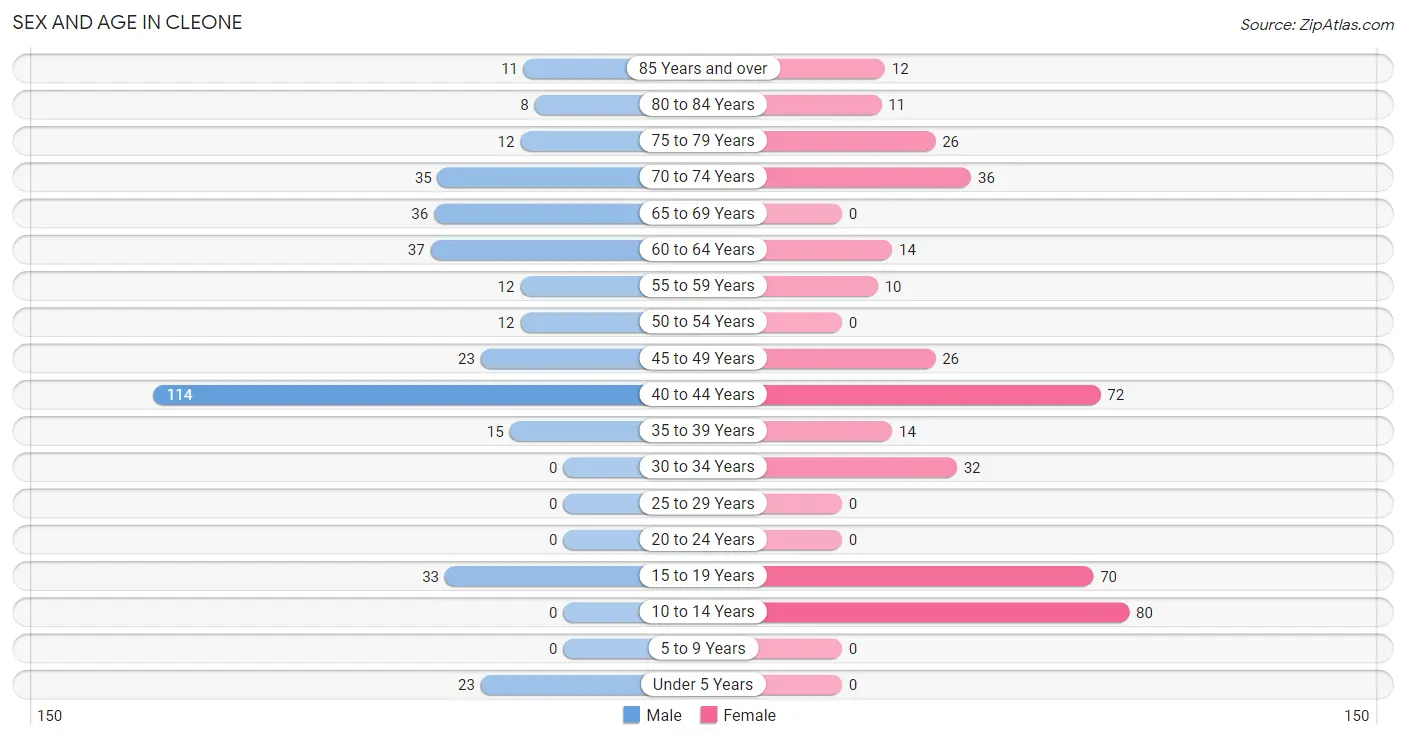
| Age Bracket | Male | Female |
| Under 5 Years | 23 (6.2%) | 0 (0.0%) |
| 5 to 9 Years | 0 (0.0%) | 0 (0.0%) |
| 10 to 14 Years | 0 (0.0%) | 80 (19.9%) |
| 15 to 19 Years | 33 (8.9%) | 70 (17.4%) |
| 20 to 24 Years | 0 (0.0%) | 0 (0.0%) |
| 25 to 29 Years | 0 (0.0%) | 0 (0.0%) |
| 30 to 34 Years | 0 (0.0%) | 32 (7.9%) |
| 35 to 39 Years | 15 (4.0%) | 14 (3.5%) |
| 40 to 44 Years | 114 (30.7%) | 72 (17.9%) |
| 45 to 49 Years | 23 (6.2%) | 26 (6.5%) |
| 50 to 54 Years | 12 (3.2%) | 0 (0.0%) |
| 55 to 59 Years | 12 (3.2%) | 10 (2.5%) |
| 60 to 64 Years | 37 (10.0%) | 14 (3.5%) |
| 65 to 69 Years | 36 (9.7%) | 0 (0.0%) |
| 70 to 74 Years | 35 (9.4%) | 36 (8.9%) |
| 75 to 79 Years | 12 (3.2%) | 26 (6.5%) |
| 80 to 84 Years | 8 (2.2%) | 11 (2.7%) |
| 85 Years and over | 11 (3.0%) | 12 (3.0%) |
| Total | 371 (100.0%) | 403 (100.0%) |
Families and Households in Cleone
Median Family Size in Cleone
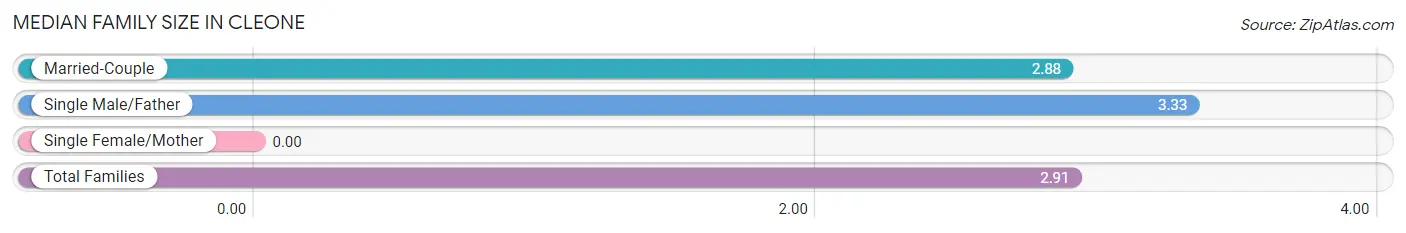
| Family Type | # Families | Family Size |
| Married-Couple | 220 (94.8%) | 2.88 |
| Single Male/Father | 12 (5.2%) | 3.33 |
| Single Female/Mother | 0 (0.0%) | - |
| Total Families | 232 (100.0%) | 2.91 |
Median Household Size in Cleone
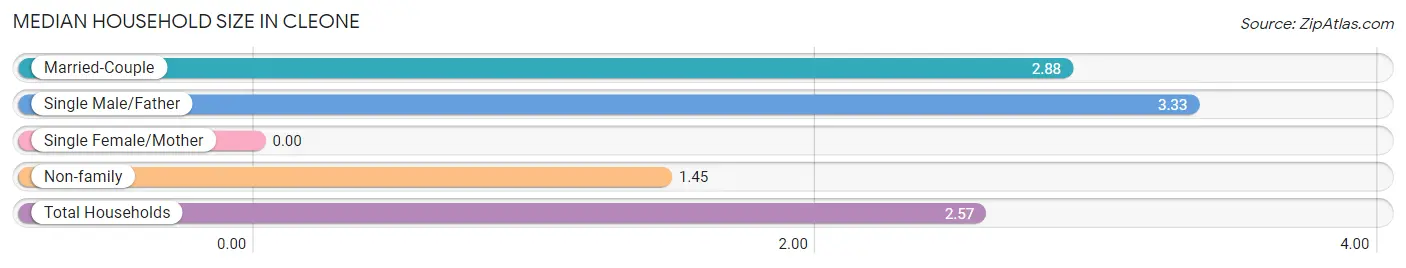
| Household Type | # Households | Household Size |
| Married-Couple | 220 (73.1%) | 2.88 |
| Single Male/Father | 12 (4.0%) | 3.33 |
| Single Female/Mother | 0 (0.0%) | - |
| Non-family | 69 (22.9%) | 1.45 |
| Total Households | 301 (100.0%) | 2.57 |
Household Size by Marriage Status in Cleone
Out of a total of 301 households in Cleone, 232 (77.1%) are family households, while 69 (22.9%) are nonfamily households. The most numerous type of family households are 3-person households, comprising 94, and the most common type of nonfamily households are 1-person households, comprising 48.
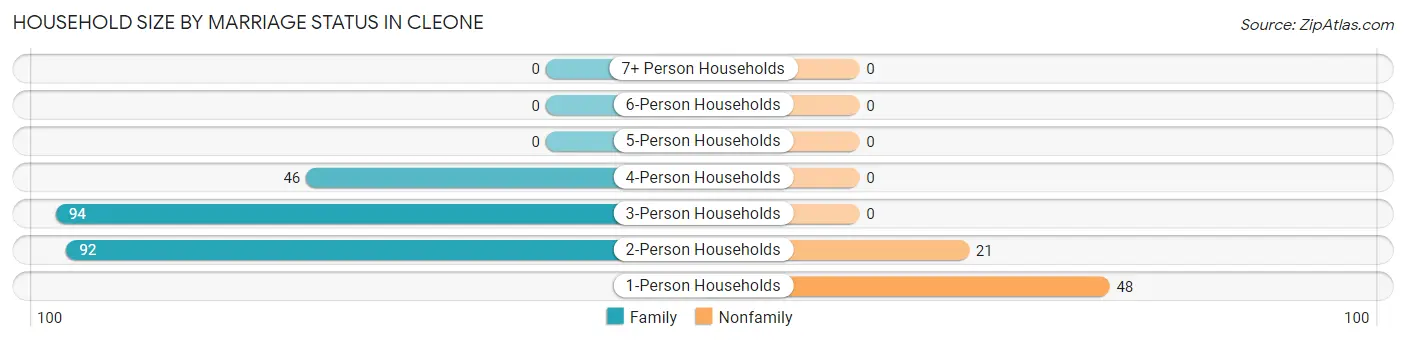
| Household Size | Family Households | Nonfamily Households |
| 1-Person Households | - | 48 (16.0%) |
| 2-Person Households | 92 (30.6%) | 21 (7.0%) |
| 3-Person Households | 94 (31.2%) | 0 (0.0%) |
| 4-Person Households | 46 (15.3%) | 0 (0.0%) |
| 5-Person Households | 0 (0.0%) | 0 (0.0%) |
| 6-Person Households | 0 (0.0%) | 0 (0.0%) |
| 7+ Person Households | 0 (0.0%) | 0 (0.0%) |
| Total | 232 (77.1%) | 69 (22.9%) |
Female Fertility in Cleone
Fertility by Age in Cleone
| Age Bracket | Women with Births | Births / 1,000 Women |
| 15 to 19 years | 0 (0.0%) | 0.0 |
| 20 to 34 years | 0 (0.0%) | 0.0 |
| 35 to 50 years | 0 (0.0%) | 0.0 |
| Total | 0 (0.0%) | 0.0 |
Fertility by Age by Marriage Status in Cleone
| Age Bracket | Married | Unmarried |
| 15 to 19 years | 0 (0.0%) | 0 (0.0%) |
| 20 to 34 years | 0 (0.0%) | 0 (0.0%) |
| 35 to 50 years | 0 (0.0%) | 0 (0.0%) |
| Total | 0 (0.0%) | 0 (0.0%) |
Fertility by Education in Cleone
| Educational Attainment | Women with Births | Births / 1,000 Women |
| Less than High School | 0 (0.0%) | 0.0 |
| High School Diploma | 0 (0.0%) | 0.0 |
| College or Associate's Degree | 0 (0.0%) | 0.0 |
| Bachelor's Degree | 0 (0.0%) | 0.0 |
| Graduate Degree | 0 (0.0%) | 0.0 |
| Total | 0 (0.0%) | 0.0 |
Fertility by Education by Marriage Status in Cleone
| Educational Attainment | Married | Unmarried |
| Less than High School | 0 (0.0%) | 0 (0.0%) |
| High School Diploma | 0 (0.0%) | 0 (0.0%) |
| College or Associate's Degree | 0 (0.0%) | 0 (0.0%) |
| Bachelor's Degree | 0 (0.0%) | 0 (0.0%) |
| Graduate Degree | 0 (0.0%) | 0 (0.0%) |
| Total | 0 (0.0%) | 0 (0.0%) |
Income in Cleone
Income Overview in Cleone
| Characteristic | Number | Measure |
| Per Capita Income | 774 | $40,397 |
| Median Family Income | 232 | $0 |
| Mean Family Income | 232 | $94,913 |
| Median Household Income | 301 | $0 |
| Mean Household Income | 301 | $98,768 |
| Income Deficit | 232 | $0 |
| Wage / Income Gap (%) | 774 | 0.00% |
| Wage / Income Gap ($) | 774 | 100.00¢ per $1 |
| Gini / Inequality Index | 774 | 0.44 |
Earnings by Sex in Cleone
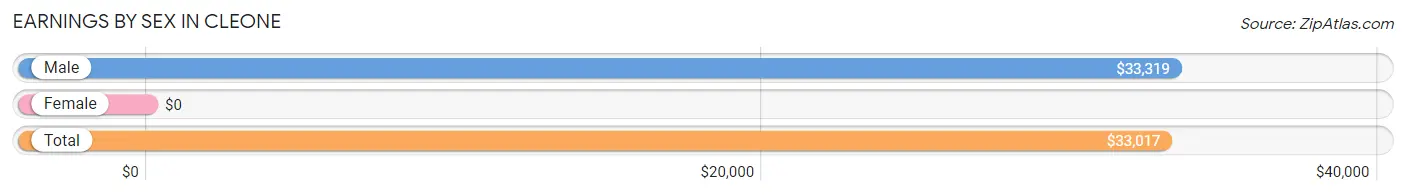
| Sex | Number | Average Earnings |
| Male | 190 (54.6%) | $33,319 |
| Female | 158 (45.4%) | $0 |
| Total | 348 (100.0%) | $33,017 |
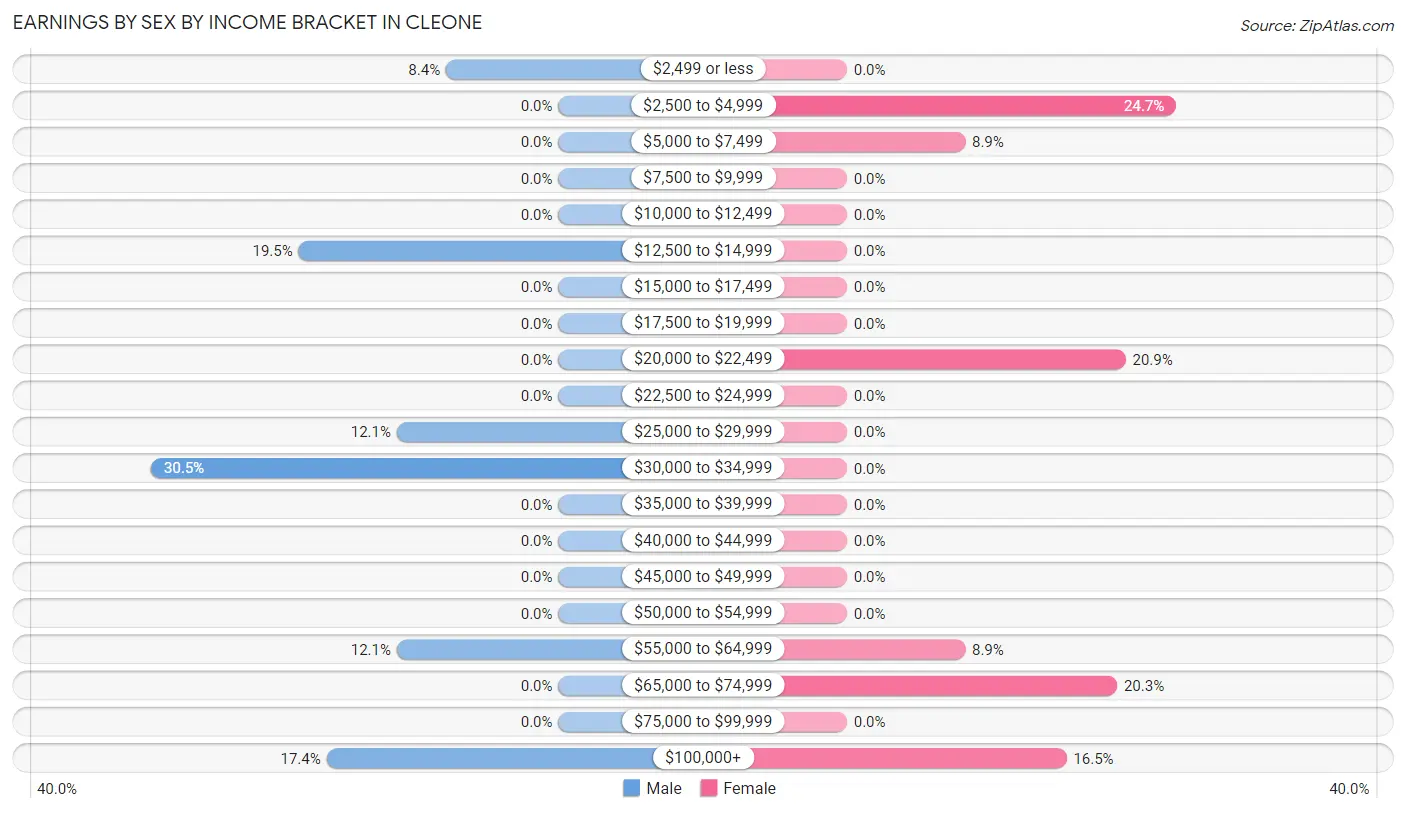
Earnings by Sex by Income Bracket in Cleone
The most common earnings brackets in Cleone are $30,000 to $34,999 for men (58 | 30.5%) and $2,500 to $4,999 for women (39 | 24.7%).
| Income | Male | Female |
| $2,499 or less | 16 (8.4%) | 0 (0.0%) |
| $2,500 to $4,999 | 0 (0.0%) | 39 (24.7%) |
| $5,000 to $7,499 | 0 (0.0%) | 14 (8.9%) |
| $7,500 to $9,999 | 0 (0.0%) | 0 (0.0%) |
| $10,000 to $12,499 | 0 (0.0%) | 0 (0.0%) |
| $12,500 to $14,999 | 37 (19.5%) | 0 (0.0%) |
| $15,000 to $17,499 | 0 (0.0%) | 0 (0.0%) |
| $17,500 to $19,999 | 0 (0.0%) | 0 (0.0%) |
| $20,000 to $22,499 | 0 (0.0%) | 33 (20.9%) |
| $22,500 to $24,999 | 0 (0.0%) | 0 (0.0%) |
| $25,000 to $29,999 | 23 (12.1%) | 0 (0.0%) |
| $30,000 to $34,999 | 58 (30.5%) | 0 (0.0%) |
| $35,000 to $39,999 | 0 (0.0%) | 0 (0.0%) |
| $40,000 to $44,999 | 0 (0.0%) | 0 (0.0%) |
| $45,000 to $49,999 | 0 (0.0%) | 0 (0.0%) |
| $50,000 to $54,999 | 0 (0.0%) | 0 (0.0%) |
| $55,000 to $64,999 | 23 (12.1%) | 14 (8.9%) |
| $65,000 to $74,999 | 0 (0.0%) | 32 (20.3%) |
| $75,000 to $99,999 | 0 (0.0%) | 0 (0.0%) |
| $100,000+ | 33 (17.4%) | 26 (16.5%) |
| Total | 190 (100.0%) | 158 (100.0%) |
Earnings by Sex by Educational Attainment in Cleone
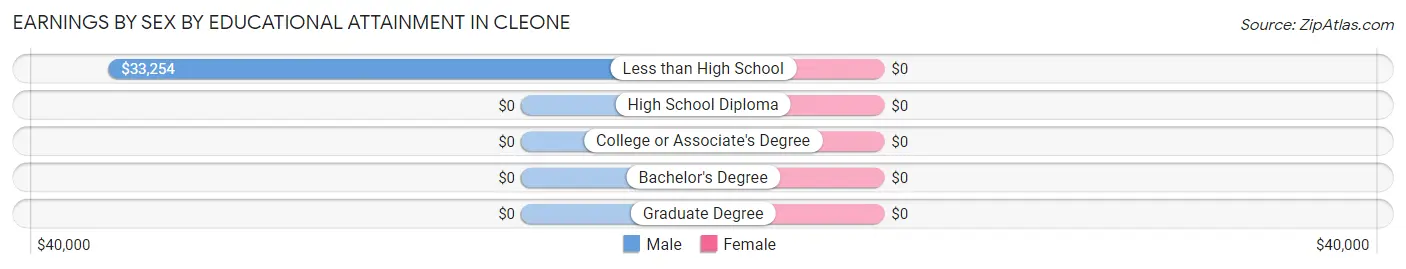
| Educational Attainment | Male Income | Female Income |
| Less than High School | $33,254 | $0 |
| High School Diploma | - | - |
| College or Associate's Degree | - | - |
| Bachelor's Degree | - | - |
| Graduate Degree | - | - |
| Total | $33,319 | $0 |
Family Income in Cleone
Family Income Brackets in Cleone
According to the Cleone family income data, there are 63 families falling into the $100,000 to $149,999 income range, which is the most common income bracket and makes up 27.2% of all families.
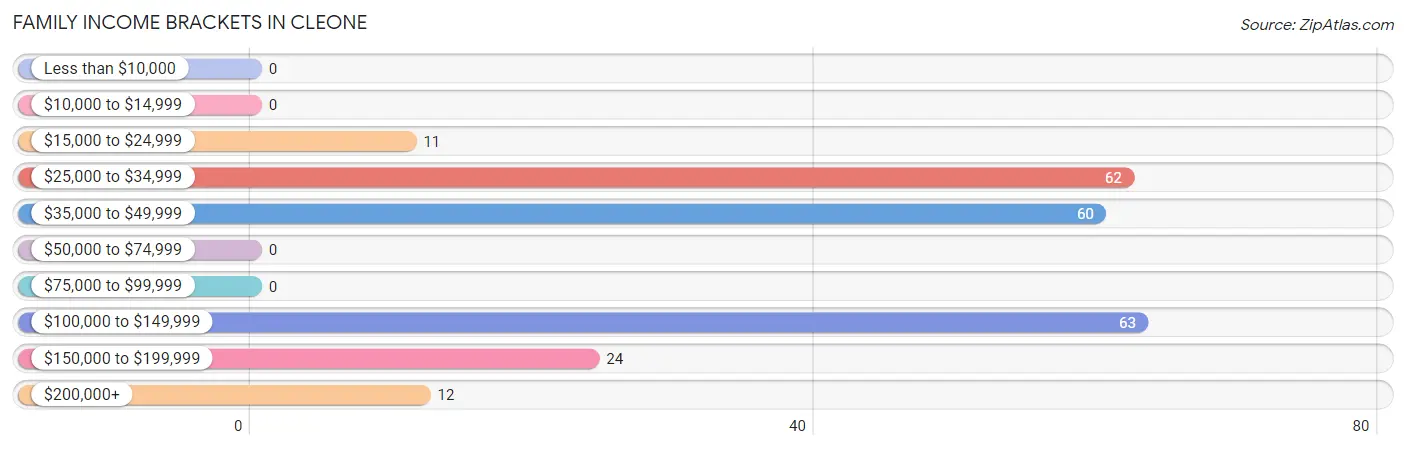
| Income Bracket | # Families | % Families |
| Less than $10,000 | 0 | 0.0% |
| $10,000 to $14,999 | 0 | 0.0% |
| $15,000 to $24,999 | 11 | 4.7% |
| $25,000 to $34,999 | 62 | 26.7% |
| $35,000 to $49,999 | 60 | 25.9% |
| $50,000 to $74,999 | 0 | 0.0% |
| $75,000 to $99,999 | 0 | 0.0% |
| $100,000 to $149,999 | 63 | 27.2% |
| $150,000 to $199,999 | 24 | 10.3% |
| $200,000+ | 12 | 5.2% |
Family Income by Famaliy Size in Cleone
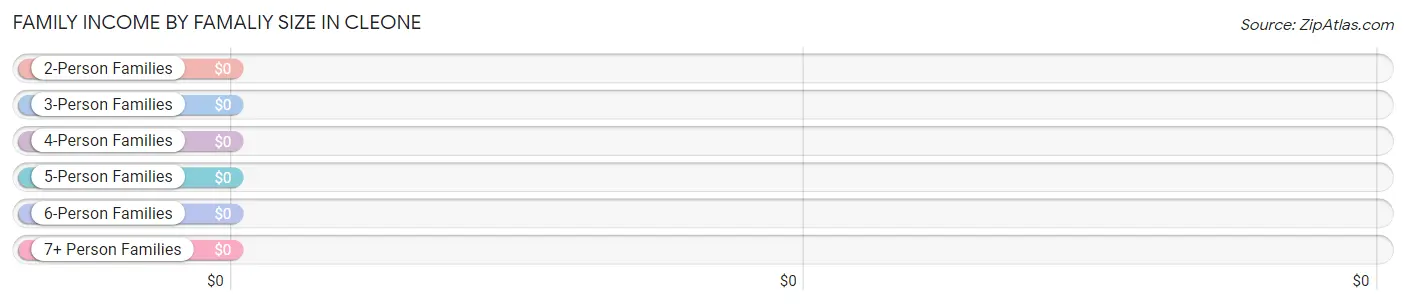
| Income Bracket | # Families | Median Income |
| 2-Person Families | 92 (39.7%) | $0 |
| 3-Person Families | 94 (40.5%) | $0 |
| 4-Person Families | 46 (19.8%) | $0 |
| 5-Person Families | 0 (0.0%) | $0 |
| 6-Person Families | 0 (0.0%) | $0 |
| 7+ Person Families | 0 (0.0%) | $0 |
| Total | 232 (100.0%) | $0 |
Family Income by Number of Earners in Cleone
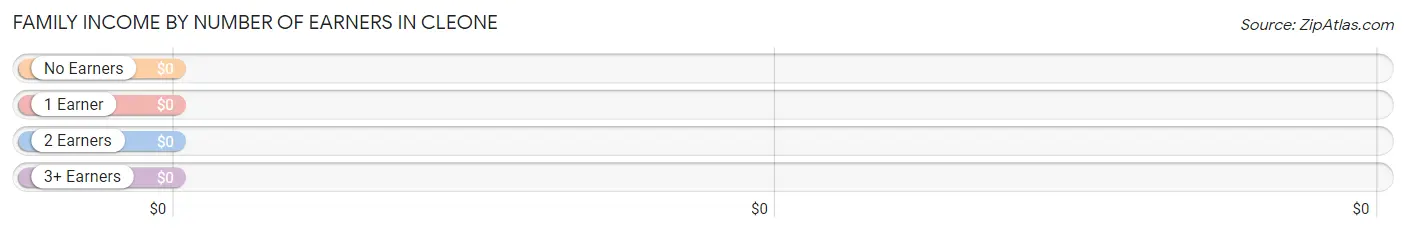
| Number of Earners | # Families | Median Income |
| No Earners | 70 (30.2%) | $0 |
| 1 Earner | 22 (9.5%) | $0 |
| 2 Earners | 124 (53.4%) | $0 |
| 3+ Earners | 16 (6.9%) | $0 |
| Total | 232 (100.0%) | $0 |
Household Income in Cleone
Household Income Brackets in Cleone
With 84 households falling in the category, the $100,000 to $149,999 income range is the most frequent in Cleone, accounting for 27.9% of all households.
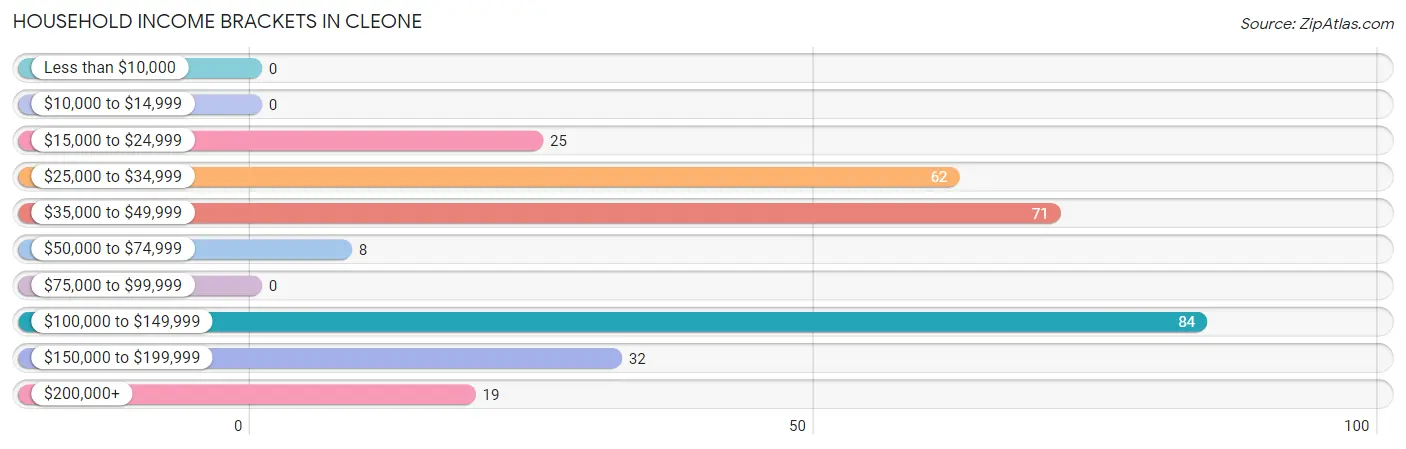
| Income Bracket | # Households | % Households |
| Less than $10,000 | 0 | 0.0% |
| $10,000 to $14,999 | 0 | 0.0% |
| $15,000 to $24,999 | 25 | 8.3% |
| $25,000 to $34,999 | 62 | 20.6% |
| $35,000 to $49,999 | 71 | 23.6% |
| $50,000 to $74,999 | 8 | 2.7% |
| $75,000 to $99,999 | 0 | 0.0% |
| $100,000 to $149,999 | 84 | 27.9% |
| $150,000 to $199,999 | 32 | 10.6% |
| $200,000+ | 19 | 6.3% |
Household Income by Householder Age in Cleone
The median household income in Cleone is $0, with the highest median household income of $134,875 found in the 45 to 64 years age bracket for the primary householder. A total of 85 households (28.2%) fall into this category.
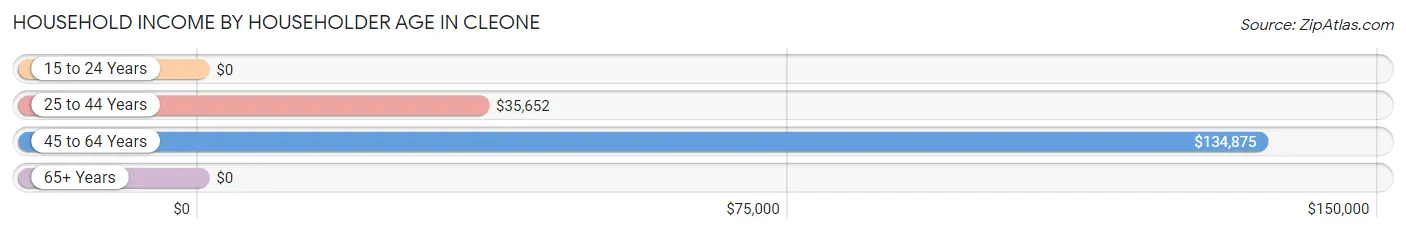
| Income Bracket | # Households | Median Income |
| 15 to 24 Years | 0 (0.0%) | $0 |
| 25 to 44 Years | 98 (32.6%) | $35,652 |
| 45 to 64 Years | 85 (28.2%) | $134,875 |
| 65+ Years | 118 (39.2%) | $0 |
| Total | 301 (100.0%) | $0 |
Poverty in Cleone
Income Below Poverty by Sex and Age in Cleone
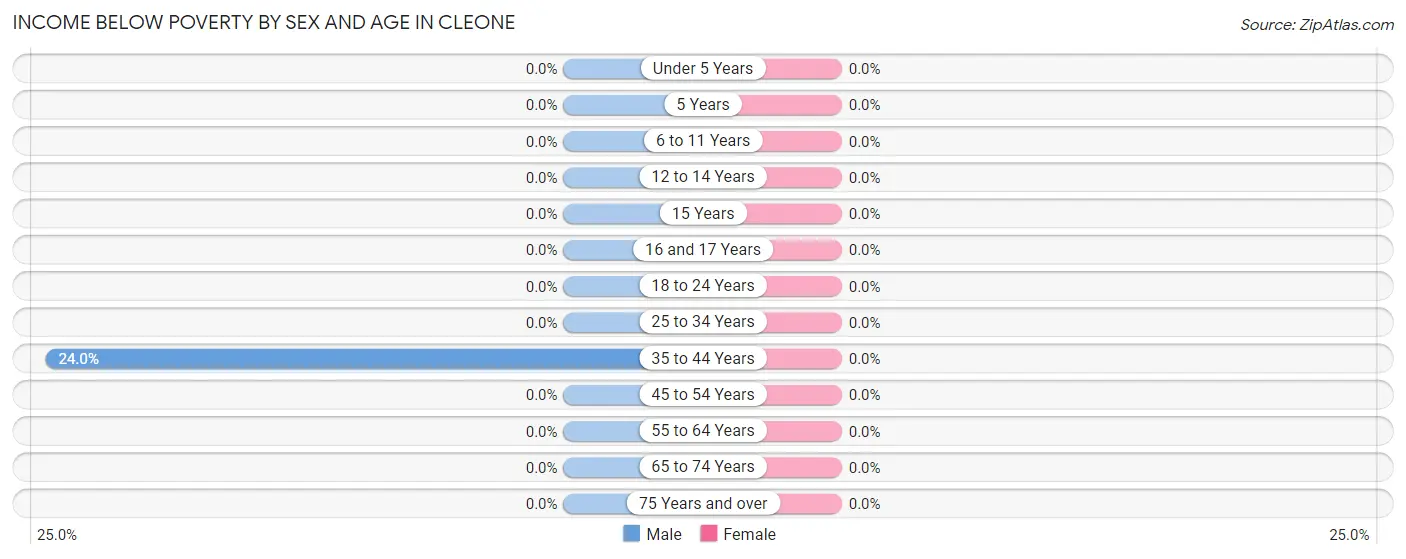
| Age Bracket | Male | Female |
| Under 5 Years | 0 (0.0%) | 0 (0.0%) |
| 5 Years | 0 (0.0%) | 0 (0.0%) |
| 6 to 11 Years | 0 (0.0%) | 0 (0.0%) |
| 12 to 14 Years | 0 (0.0%) | 0 (0.0%) |
| 15 Years | 0 (0.0%) | 0 (0.0%) |
| 16 and 17 Years | 0 (0.0%) | 0 (0.0%) |
| 18 to 24 Years | 0 (0.0%) | 0 (0.0%) |
| 25 to 34 Years | 0 (0.0%) | 0 (0.0%) |
| 35 to 44 Years | 31 (24.0%) | 0 (0.0%) |
| 45 to 54 Years | 0 (0.0%) | 0 (0.0%) |
| 55 to 64 Years | 0 (0.0%) | 0 (0.0%) |
| 65 to 74 Years | 0 (0.0%) | 0 (0.0%) |
| 75 Years and over | 0 (0.0%) | 0 (0.0%) |
| Total | 31 (8.4%) | 0 (0.0%) |
Income Above Poverty by Sex and Age in Cleone
According to the poverty statistics in Cleone, males aged under 5 years and females aged 12 to 14 years are the age groups that are most secure financially, with 100.0% of males and 100.0% of females in these age groups living above the poverty line.
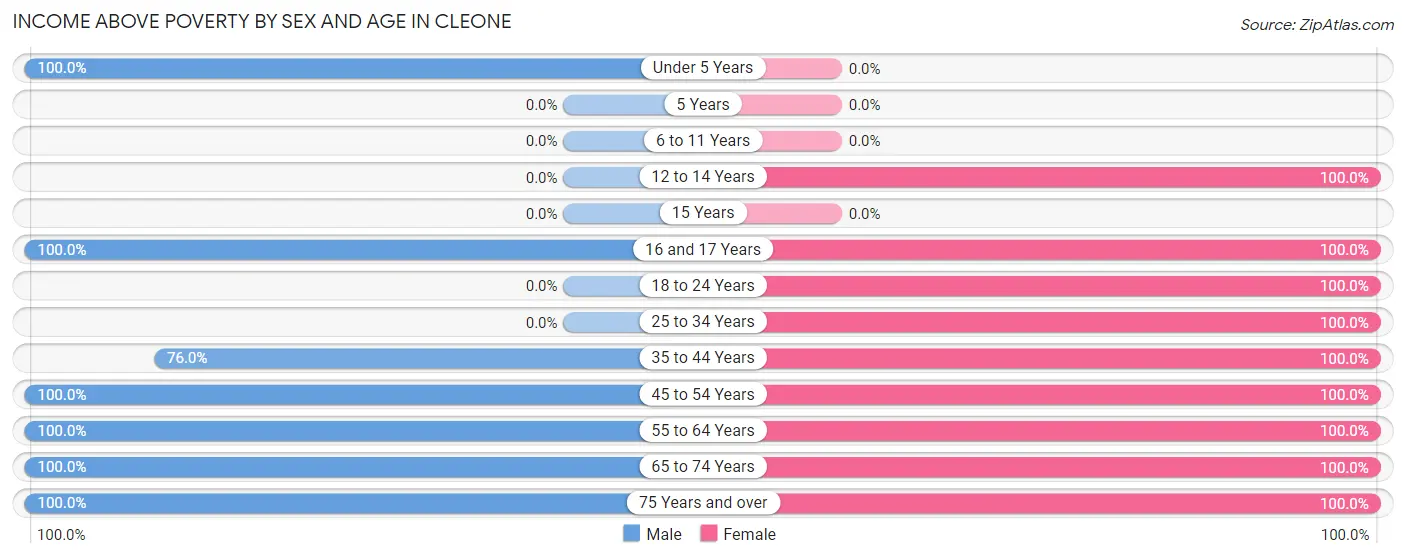
| Age Bracket | Male | Female |
| Under 5 Years | 23 (100.0%) | 0 (0.0%) |
| 5 Years | 0 (0.0%) | 0 (0.0%) |
| 6 to 11 Years | 0 (0.0%) | 0 (0.0%) |
| 12 to 14 Years | 0 (0.0%) | 80 (100.0%) |
| 15 Years | 0 (0.0%) | 0 (0.0%) |
| 16 and 17 Years | 33 (100.0%) | 42 (100.0%) |
| 18 to 24 Years | 0 (0.0%) | 28 (100.0%) |
| 25 to 34 Years | 0 (0.0%) | 32 (100.0%) |
| 35 to 44 Years | 98 (76.0%) | 86 (100.0%) |
| 45 to 54 Years | 35 (100.0%) | 26 (100.0%) |
| 55 to 64 Years | 49 (100.0%) | 24 (100.0%) |
| 65 to 74 Years | 71 (100.0%) | 36 (100.0%) |
| 75 Years and over | 31 (100.0%) | 49 (100.0%) |
| Total | 340 (91.6%) | 403 (100.0%) |
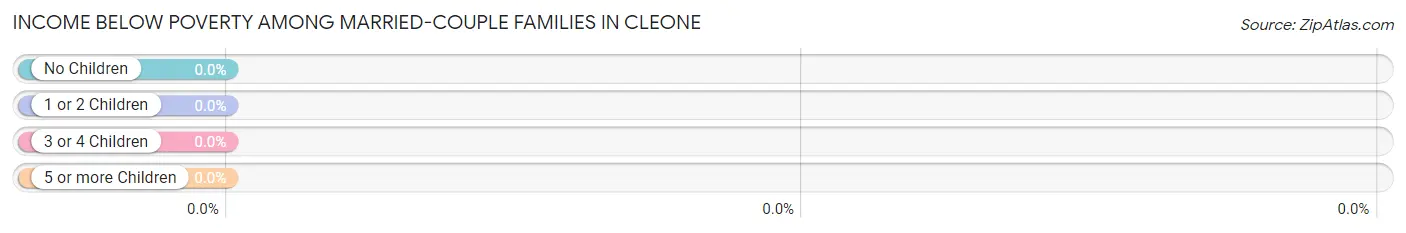
Income Below Poverty Among Married-Couple Families in Cleone
| Children | Above Poverty | Below Poverty |
| No Children | 96 (100.0%) | 0 (0.0%) |
| 1 or 2 Children | 124 (100.0%) | 0 (0.0%) |
| 3 or 4 Children | 0 (0.0%) | 0 (0.0%) |
| 5 or more Children | 0 (0.0%) | 0 (0.0%) |
| Total | 220 (100.0%) | 0 (0.0%) |
Income Below Poverty Among Single-Parent Households in Cleone
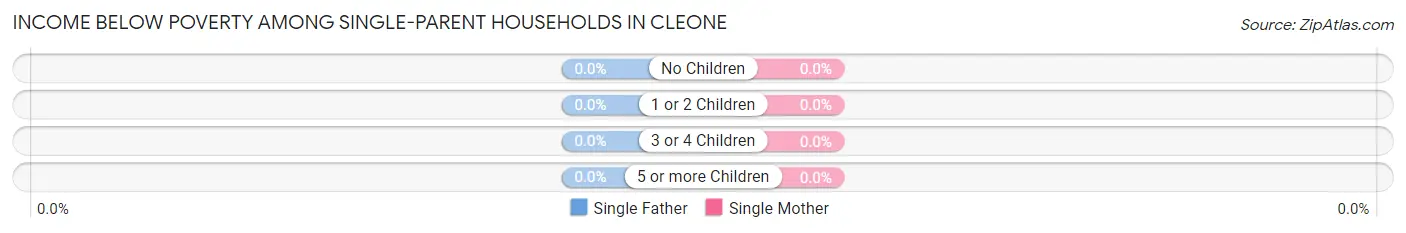
| Children | Single Father | Single Mother |
| No Children | 0 (0.0%) | 0 (0.0%) |
| 1 or 2 Children | 0 (0.0%) | 0 (0.0%) |
| 3 or 4 Children | 0 (0.0%) | 0 (0.0%) |
| 5 or more Children | 0 (0.0%) | 0 (0.0%) |
| Total | 0 (0.0%) | 0 (0.0%) |
Income Below Poverty Among Married-Couple vs Single-Parent Households in Cleone
| Children | Married-Couple Families | Single-Parent Households |
| No Children | 0 (0.0%) | 0 (0.0%) |
| 1 or 2 Children | 0 (0.0%) | 0 (0.0%) |
| 3 or 4 Children | 0 (0.0%) | 0 (0.0%) |
| 5 or more Children | 0 (0.0%) | 0 (0.0%) |
| Total | 0 (0.0%) | 0 (0.0%) |
Employment Characteristics in Cleone
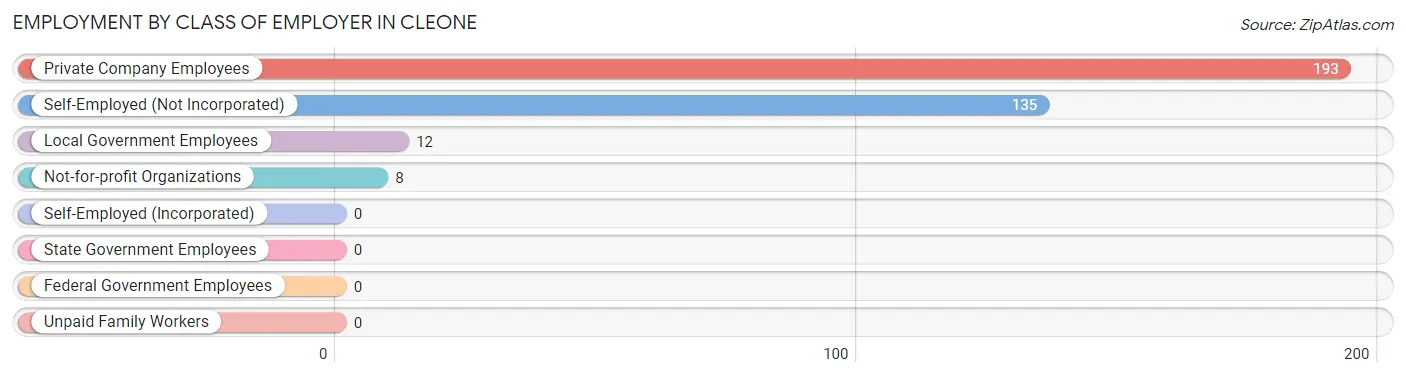
Employment by Class of Employer in Cleone
Among the 348 employed individuals in Cleone, private company employees (193 | 55.5%), self-employed (not incorporated) (135 | 38.8%), and local government employees (12 | 3.5%) make up the most common classes of employment.
| Employer Class | # Employees | % Employees |
| Private Company Employees | 193 | 55.5% |
| Self-Employed (Incorporated) | 0 | 0.0% |
| Self-Employed (Not Incorporated) | 135 | 38.8% |
| Not-for-profit Organizations | 8 | 2.3% |
| Local Government Employees | 12 | 3.5% |
| State Government Employees | 0 | 0.0% |
| Federal Government Employees | 0 | 0.0% |
| Unpaid Family Workers | 0 | 0.0% |
| Total | 348 | 100.0% |
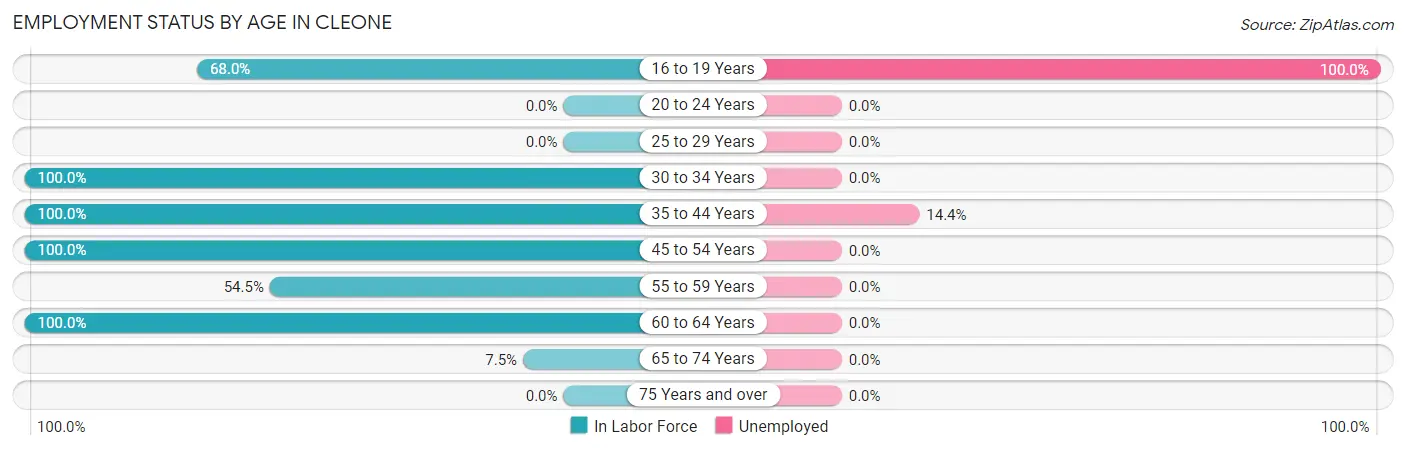
Employment Status by Age in Cleone
According to the labor force statistics for Cleone, out of the total population over 16 years of age (671), 66.9% or 449 individuals are in the labor force, with 22.5% or 101 of them unemployed. The age group with the highest labor force participation rate is 30 to 34 years, with 100.0% or 32 individuals in the labor force. Within the labor force, the 16 to 19 years age range has the highest percentage of unemployed individuals, with 100.0% or 70 of them being unemployed.
| Age Bracket | In Labor Force | Unemployed |
| 16 to 19 Years | 70 (68.0%) | 70 (100.0%) |
| 20 to 24 Years | 0 (0.0%) | 0 (0.0%) |
| 25 to 29 Years | 0 (0.0%) | 0 (0.0%) |
| 30 to 34 Years | 32 (100.0%) | 0 (0.0%) |
| 35 to 44 Years | 215 (100.0%) | 31 (14.4%) |
| 45 to 54 Years | 61 (100.0%) | 0 (0.0%) |
| 55 to 59 Years | 12 (54.5%) | 0 (0.0%) |
| 60 to 64 Years | 51 (100.0%) | 0 (0.0%) |
| 65 to 74 Years | 8 (7.5%) | 0 (0.0%) |
| 75 Years and over | 0 (0.0%) | 0 (0.0%) |
| Total | 449 (66.9%) | 101 (22.5%) |
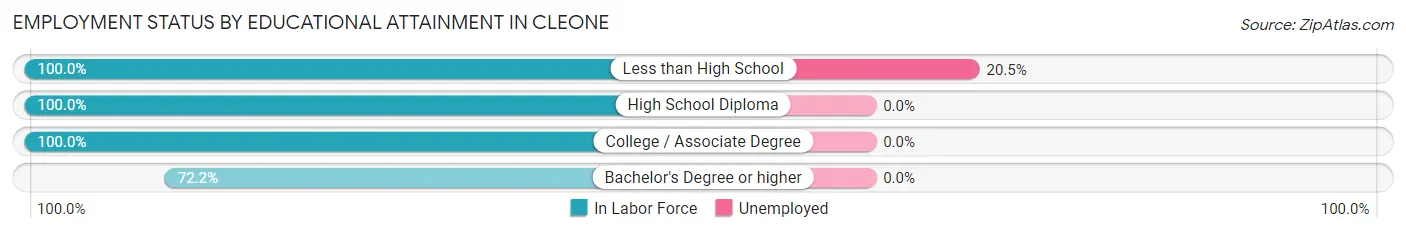
Employment Status by Educational Attainment in Cleone
According to labor force statistics for Cleone, 97.4% of individuals (371) out of the total population between 25 and 64 years of age (381) are in the labor force, with 8.4% or 31 of them being unemployed. The group with the highest labor force participation rate are those with the educational attainment of less than high school, with 100.0% or 151 individuals in the labor force. Within the labor force, individuals with less than high school education have the highest percentage of unemployment, with 20.5% or 31 of them being unemployed.
| Educational Attainment | In Labor Force | Unemployed |
| Less than High School | 151 (100.0%) | 31 (20.5%) |
| High School Diploma | 27 (100.0%) | 0 (0.0%) |
| College / Associate Degree | 167 (100.0%) | 0 (0.0%) |
| Bachelor's Degree or higher | 26 (72.2%) | 0 (0.0%) |
| Total | 371 (97.4%) | 32 (8.4%) |
Employment Occupations by Sex in Cleone
Management, Business, Science and Arts Occupations
The most common Management, Business, Science and Arts occupations in Cleone are Management (141 | 40.5%), and Business & Financial (14 | 4.0%).
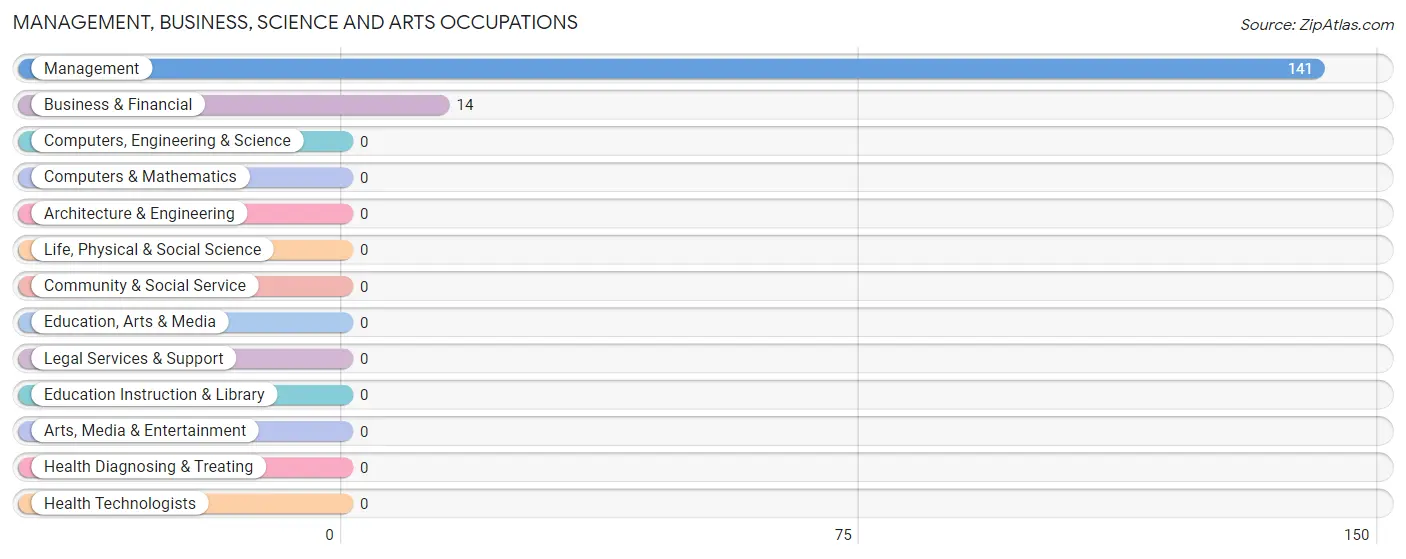
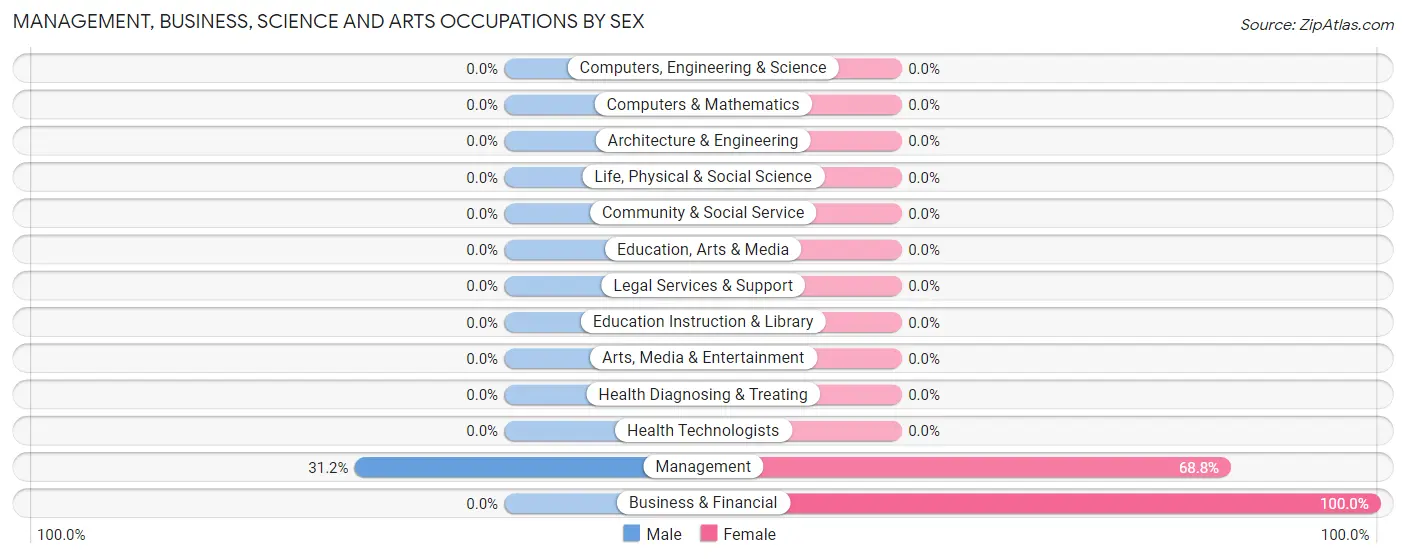
Management, Business, Science and Arts Occupations by Sex
| Occupation | Male | Female |
| Management | 44 (31.2%) | 97 (68.8%) |
| Business & Financial | 0 (0.0%) | 14 (100.0%) |
| Computers, Engineering & Science | 0 (0.0%) | 0 (0.0%) |
| Computers & Mathematics | 0 (0.0%) | 0 (0.0%) |
| Architecture & Engineering | 0 (0.0%) | 0 (0.0%) |
| Life, Physical & Social Science | 0 (0.0%) | 0 (0.0%) |
| Community & Social Service | 0 (0.0%) | 0 (0.0%) |
| Education, Arts & Media | 0 (0.0%) | 0 (0.0%) |
| Legal Services & Support | 0 (0.0%) | 0 (0.0%) |
| Education Instruction & Library | 0 (0.0%) | 0 (0.0%) |
| Arts, Media & Entertainment | 0 (0.0%) | 0 (0.0%) |
| Health Diagnosing & Treating | 0 (0.0%) | 0 (0.0%) |
| Health Technologists | 0 (0.0%) | 0 (0.0%) |
| Total (Category) | 44 (28.4%) | 111 (71.6%) |
| Total (Overall) | 190 (54.6%) | 158 (45.4%) |
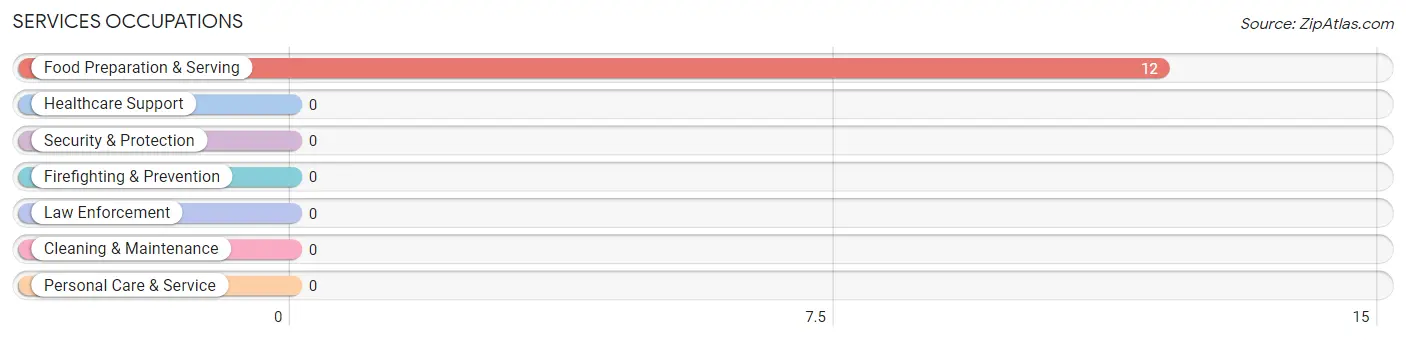
Services Occupations
The most common Services occupations in Cleone are , and Food Preparation & Serving (12 | 3.5%).
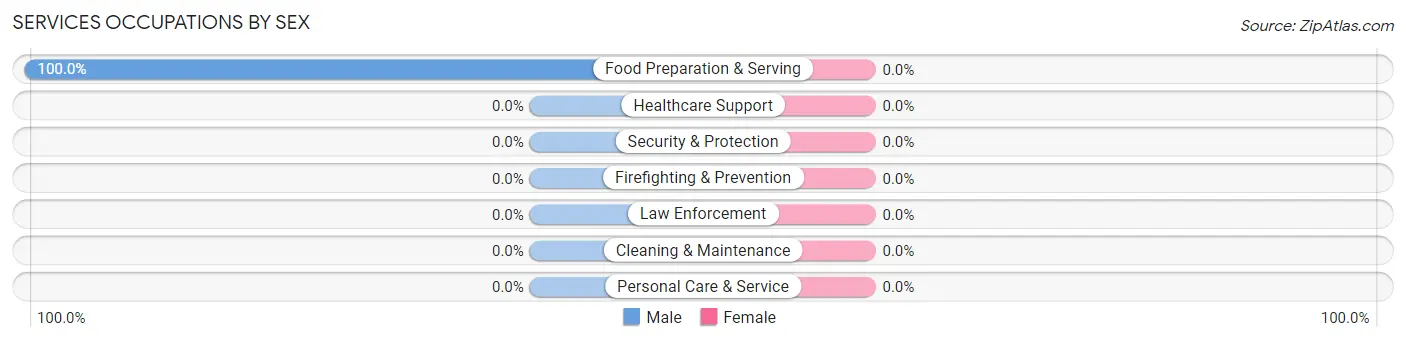
Services Occupations by Sex
| Occupation | Male | Female |
| Healthcare Support | 0 (0.0%) | 0 (0.0%) |
| Security & Protection | 0 (0.0%) | 0 (0.0%) |
| Firefighting & Prevention | 0 (0.0%) | 0 (0.0%) |
| Law Enforcement | 0 (0.0%) | 0 (0.0%) |
| Food Preparation & Serving | 12 (100.0%) | 0 (0.0%) |
| Cleaning & Maintenance | 0 (0.0%) | 0 (0.0%) |
| Personal Care & Service | 0 (0.0%) | 0 (0.0%) |
| Total (Category) | 12 (100.0%) | 0 (0.0%) |
| Total (Overall) | 190 (54.6%) | 158 (45.4%) |
Sales and Office Occupations
The most common Sales and Office occupations in Cleone are , and Office & Administration (55 | 15.8%).
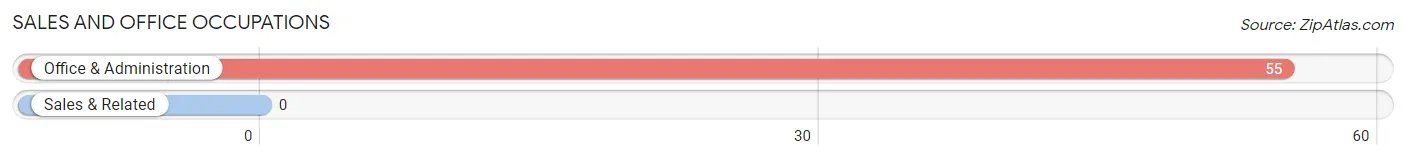
Sales and Office Occupations by Sex
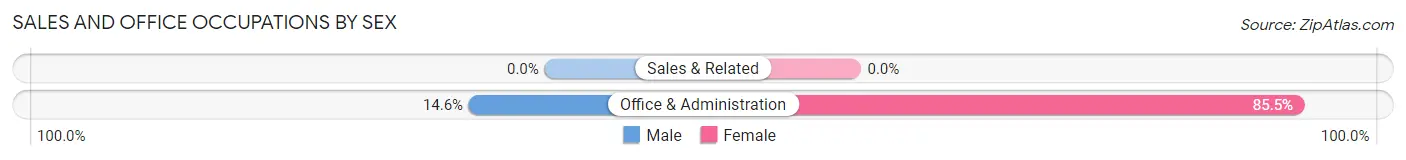
| Occupation | Male | Female |
| Sales & Related | 0 (0.0%) | 0 (0.0%) |
| Office & Administration | 8 (14.5%) | 47 (85.5%) |
| Total (Category) | 8 (14.5%) | 47 (85.5%) |
| Total (Overall) | 190 (54.6%) | 158 (45.4%) |
Natural Resources, Construction and Maintenance Occupations
The most common Natural Resources, Construction and Maintenance occupations in Cleone are Construction & Extraction (27 | 7.8%), and Installation, Maintenance & Repair (16 | 4.6%).
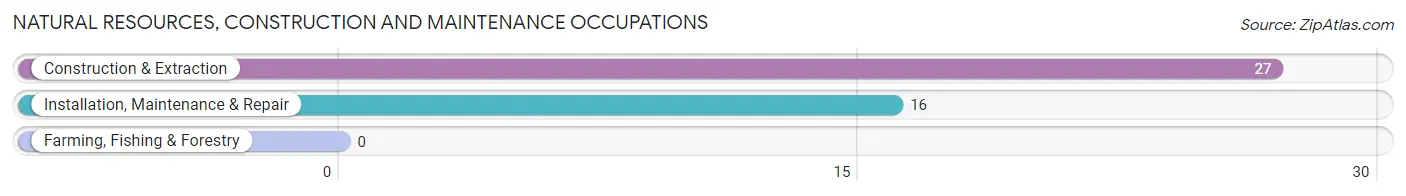
Natural Resources, Construction and Maintenance Occupations by Sex
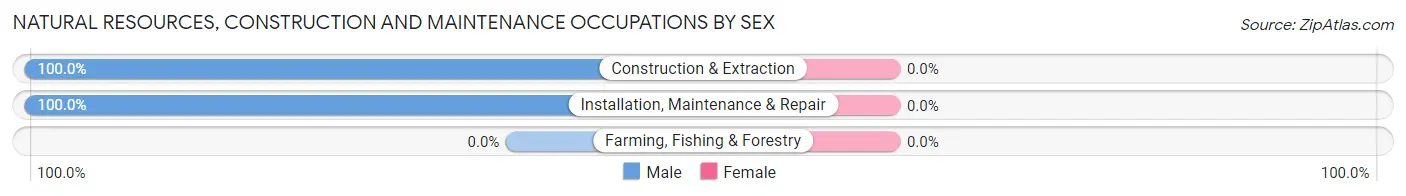
| Occupation | Male | Female |
| Farming, Fishing & Forestry | 0 (0.0%) | 0 (0.0%) |
| Construction & Extraction | 27 (100.0%) | 0 (0.0%) |
| Installation, Maintenance & Repair | 16 (100.0%) | 0 (0.0%) |
| Total (Category) | 43 (100.0%) | 0 (0.0%) |
| Total (Overall) | 190 (54.6%) | 158 (45.4%) |
Production, Transportation and Moving Occupations
The most common Production, Transportation and Moving occupations in Cleone are , and Production (83 | 23.8%).
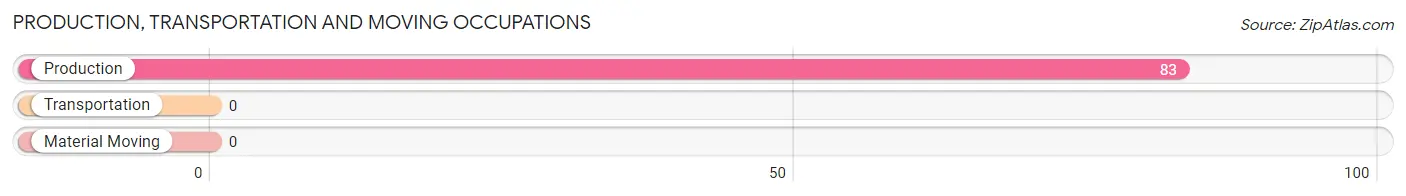
Production, Transportation and Moving Occupations by Sex
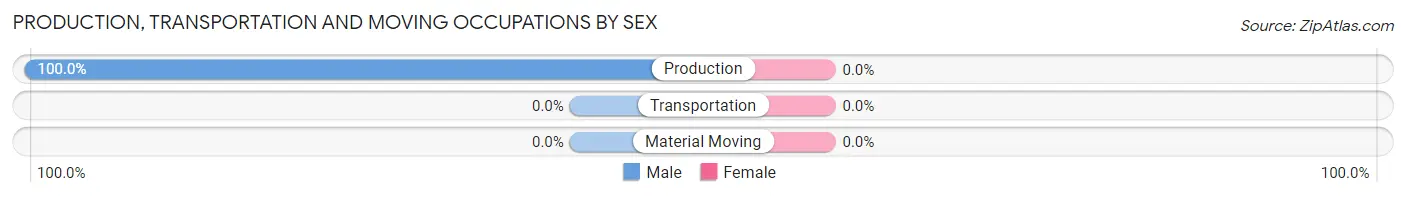
| Occupation | Male | Female |
| Production | 83 (100.0%) | 0 (0.0%) |
| Transportation | 0 (0.0%) | 0 (0.0%) |
| Material Moving | 0 (0.0%) | 0 (0.0%) |
| Total (Category) | 83 (100.0%) | 0 (0.0%) |
| Total (Overall) | 190 (54.6%) | 158 (45.4%) |
Employment Industries by Sex in Cleone
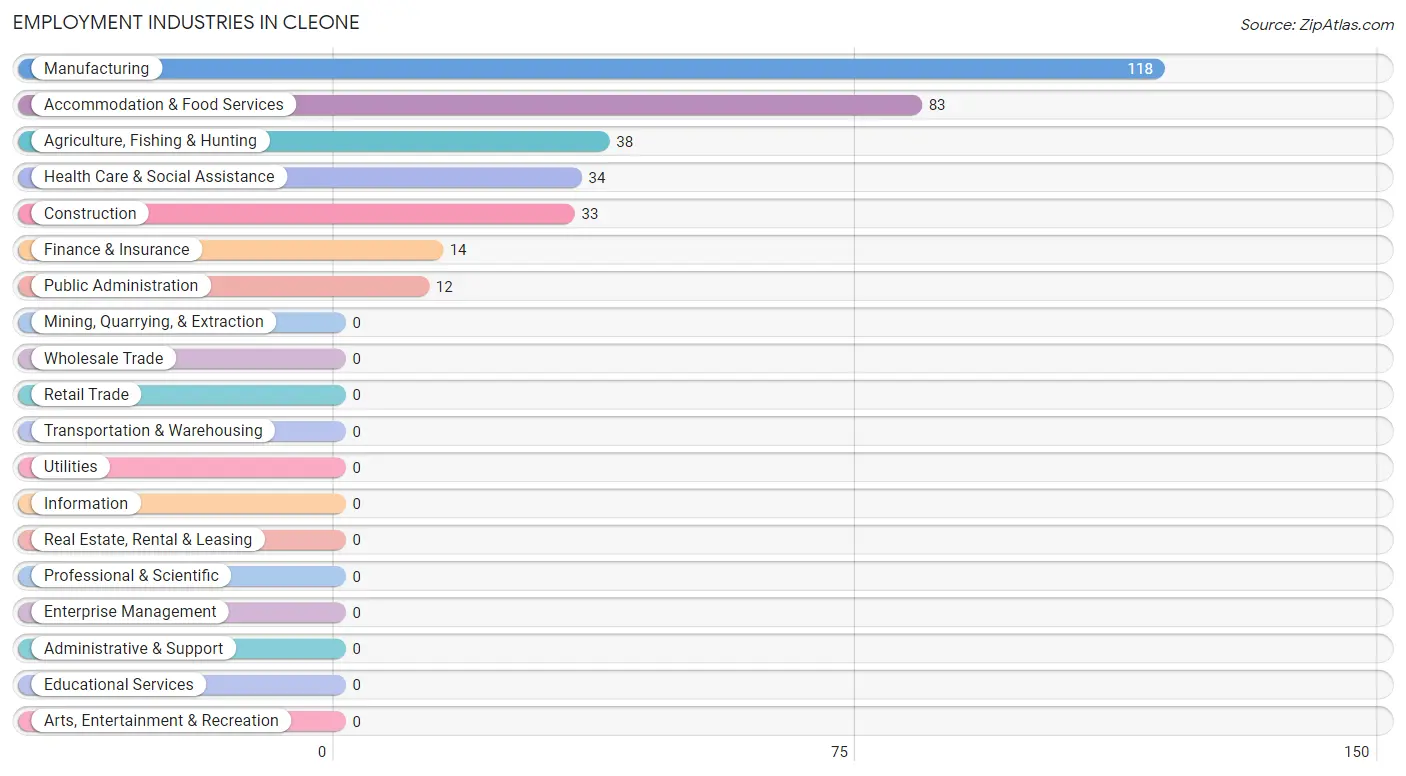
Employment Industries in Cleone
The major employment industries in Cleone include Manufacturing (118 | 33.9%), Accommodation & Food Services (83 | 23.8%), Agriculture, Fishing & Hunting (38 | 10.9%), Health Care & Social Assistance (34 | 9.8%), and Construction (33 | 9.5%).
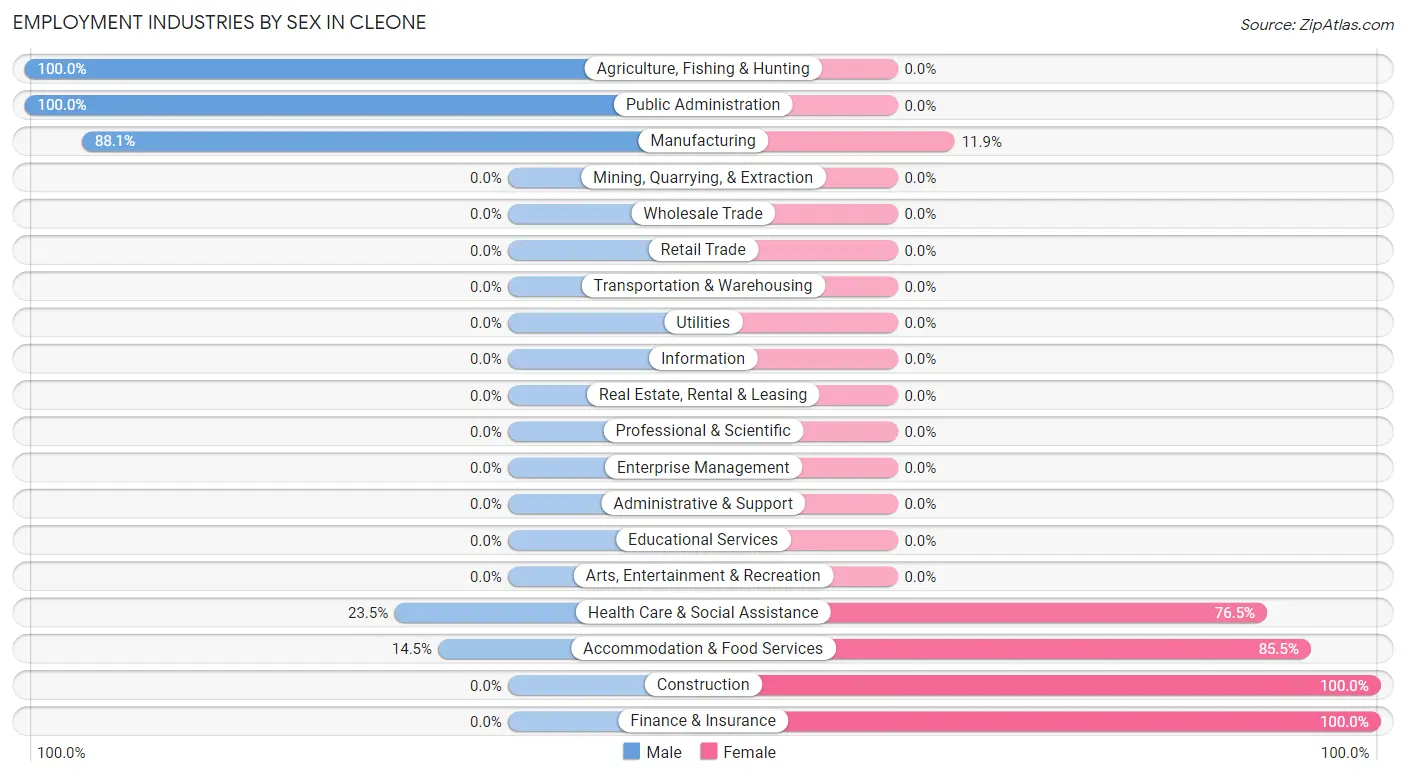
Employment Industries by Sex in Cleone
The Cleone industries that see more men than women are Agriculture, Fishing & Hunting (100.0%), Public Administration (100.0%), and Manufacturing (88.1%), whereas the industries that tend to have a higher number of women are Construction (100.0%), Finance & Insurance (100.0%), and Accommodation & Food Services (85.5%).
| Industry | Male | Female |
| Agriculture, Fishing & Hunting | 38 (100.0%) | 0 (0.0%) |
| Mining, Quarrying, & Extraction | 0 (0.0%) | 0 (0.0%) |
| Construction | 0 (0.0%) | 33 (100.0%) |
| Manufacturing | 104 (88.1%) | 14 (11.9%) |
| Wholesale Trade | 0 (0.0%) | 0 (0.0%) |
| Retail Trade | 0 (0.0%) | 0 (0.0%) |
| Transportation & Warehousing | 0 (0.0%) | 0 (0.0%) |
| Utilities | 0 (0.0%) | 0 (0.0%) |
| Information | 0 (0.0%) | 0 (0.0%) |
| Finance & Insurance | 0 (0.0%) | 14 (100.0%) |
| Real Estate, Rental & Leasing | 0 (0.0%) | 0 (0.0%) |
| Professional & Scientific | 0 (0.0%) | 0 (0.0%) |
| Enterprise Management | 0 (0.0%) | 0 (0.0%) |
| Administrative & Support | 0 (0.0%) | 0 (0.0%) |
| Educational Services | 0 (0.0%) | 0 (0.0%) |
| Health Care & Social Assistance | 8 (23.5%) | 26 (76.5%) |
| Arts, Entertainment & Recreation | 0 (0.0%) | 0 (0.0%) |
| Accommodation & Food Services | 12 (14.5%) | 71 (85.5%) |
| Public Administration | 12 (100.0%) | 0 (0.0%) |
| Total | 190 (54.6%) | 158 (45.4%) |
Education in Cleone
School Enrollment in Cleone
The most common levels of schooling among the 223 students in Cleone are high school (103 | 46.2%), middle school (80 | 35.9%), and graduate / professional (26 | 11.7%).
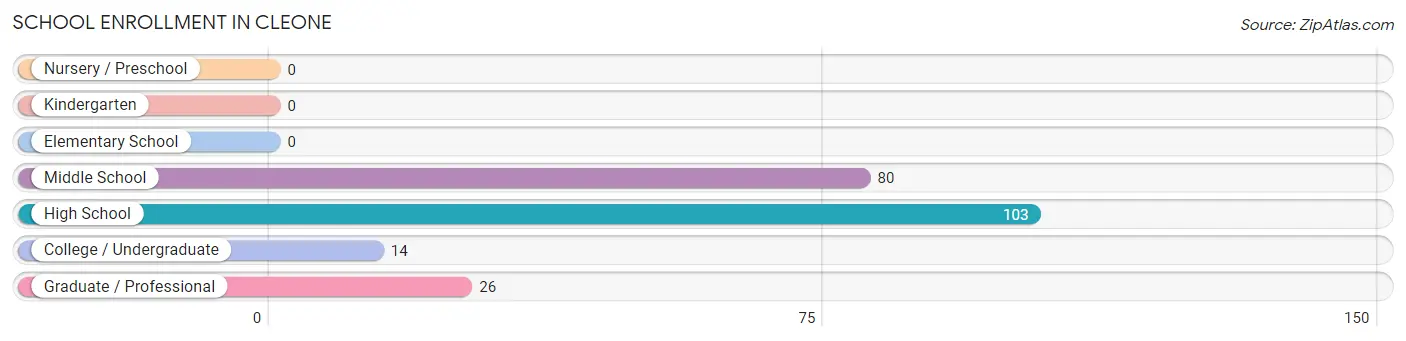
| School Level | # Students | % Students |
| Nursery / Preschool | 0 | 0.0% |
| Kindergarten | 0 | 0.0% |
| Elementary School | 0 | 0.0% |
| Middle School | 80 | 35.9% |
| High School | 103 | 46.2% |
| College / Undergraduate | 14 | 6.3% |
| Graduate / Professional | 26 | 11.7% |
| Total | 223 | 100.0% |
School Enrollment by Age by Funding Source in Cleone
Out of a total of 223 students who are enrolled in schools in Cleone, 54 (24.2%) attend a private institution, while the remaining 169 (75.8%) are enrolled in public schools. The age group of 18 to 19 year olds has the highest likelihood of being enrolled in private schools, with 28 (100.0% in the age bracket) enrolled. Conversely, the age group of 10 to 14 year olds has the lowest likelihood of being enrolled in a private school, with 80 (100.0% in the age bracket) attending a public institution.
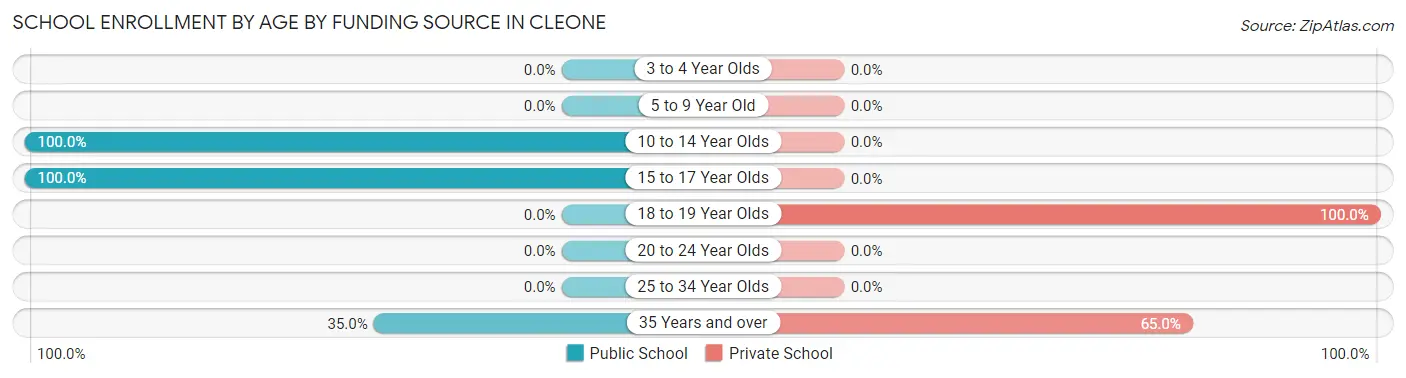
| Age Bracket | Public School | Private School |
| 3 to 4 Year Olds | 0 (0.0%) | 0 (0.0%) |
| 5 to 9 Year Old | 0 (0.0%) | 0 (0.0%) |
| 10 to 14 Year Olds | 80 (100.0%) | 0 (0.0%) |
| 15 to 17 Year Olds | 75 (100.0%) | 0 (0.0%) |
| 18 to 19 Year Olds | 0 (0.0%) | 28 (100.0%) |
| 20 to 24 Year Olds | 0 (0.0%) | 0 (0.0%) |
| 25 to 34 Year Olds | 0 (0.0%) | 0 (0.0%) |
| 35 Years and over | 14 (35.0%) | 26 (65.0%) |
| Total | 169 (75.8%) | 54 (24.2%) |
Educational Attainment by Field of Study in Cleone
Education (30 | 29.1%), science & technology (26 | 25.2%), liberal arts & history (12 | 11.7%), social sciences (11 | 10.7%), and engineering (9 | 8.7%) are the most common fields of study among 103 individuals in Cleone who have obtained a bachelor's degree or higher.
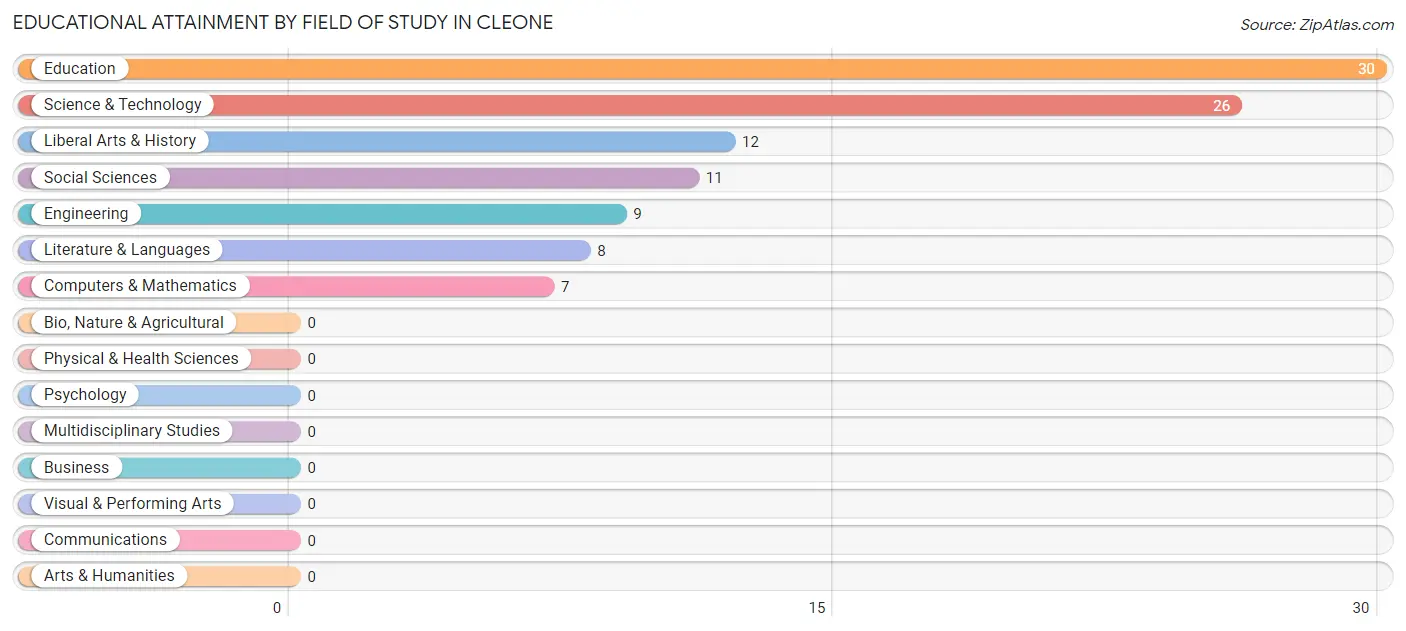
| Field of Study | # Graduates | % Graduates |
| Computers & Mathematics | 7 | 6.8% |
| Bio, Nature & Agricultural | 0 | 0.0% |
| Physical & Health Sciences | 0 | 0.0% |
| Psychology | 0 | 0.0% |
| Social Sciences | 11 | 10.7% |
| Engineering | 9 | 8.7% |
| Multidisciplinary Studies | 0 | 0.0% |
| Science & Technology | 26 | 25.2% |
| Business | 0 | 0.0% |
| Education | 30 | 29.1% |
| Literature & Languages | 8 | 7.8% |
| Liberal Arts & History | 12 | 11.7% |
| Visual & Performing Arts | 0 | 0.0% |
| Communications | 0 | 0.0% |
| Arts & Humanities | 0 | 0.0% |
| Total | 103 | 100.0% |
Transportation & Commute in Cleone
Vehicle Availability by Sex in Cleone
The most prevalent vehicle ownership categories in Cleone are males with 3 vehicles (96, accounting for 50.5%) and females with 3 vehicles (79, making up 60.8%).
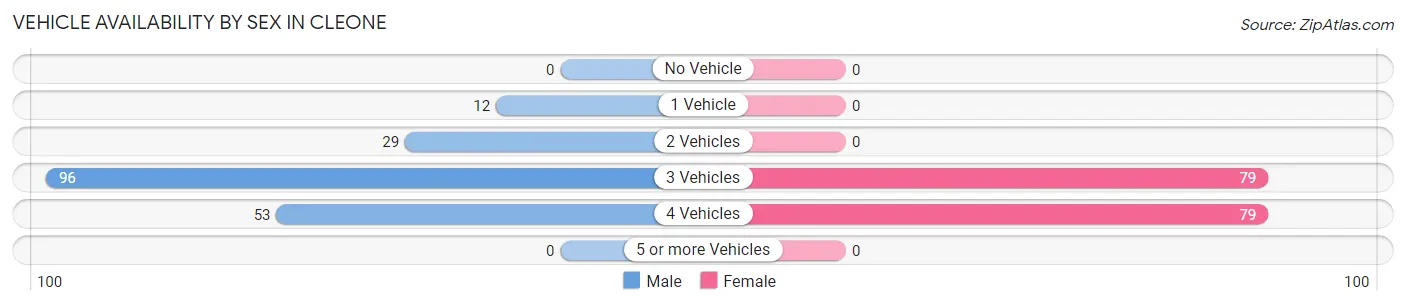
| Vehicles Available | Male | Female |
| No Vehicle | 0 (0.0%) | 0 (0.0%) |
| 1 Vehicle | 12 (6.3%) | 0 (0.0%) |
| 2 Vehicles | 29 (15.3%) | 0 (0.0%) |
| 3 Vehicles | 96 (50.5%) | 79 (50.0%) |
| 4 Vehicles | 53 (27.9%) | 79 (50.0%) |
| 5 or more Vehicles | 0 (0.0%) | 0 (0.0%) |
| Total | 190 (100.0%) | 158 (100.0%) |
Commute Time in Cleone
The most frequently occuring commute durations in Cleone are 60 to 89 minutes (85 commuters, 24.4%), 45 to 59 minutes (78 commuters, 22.4%), and 10 to 14 minutes (65 commuters, 18.7%).
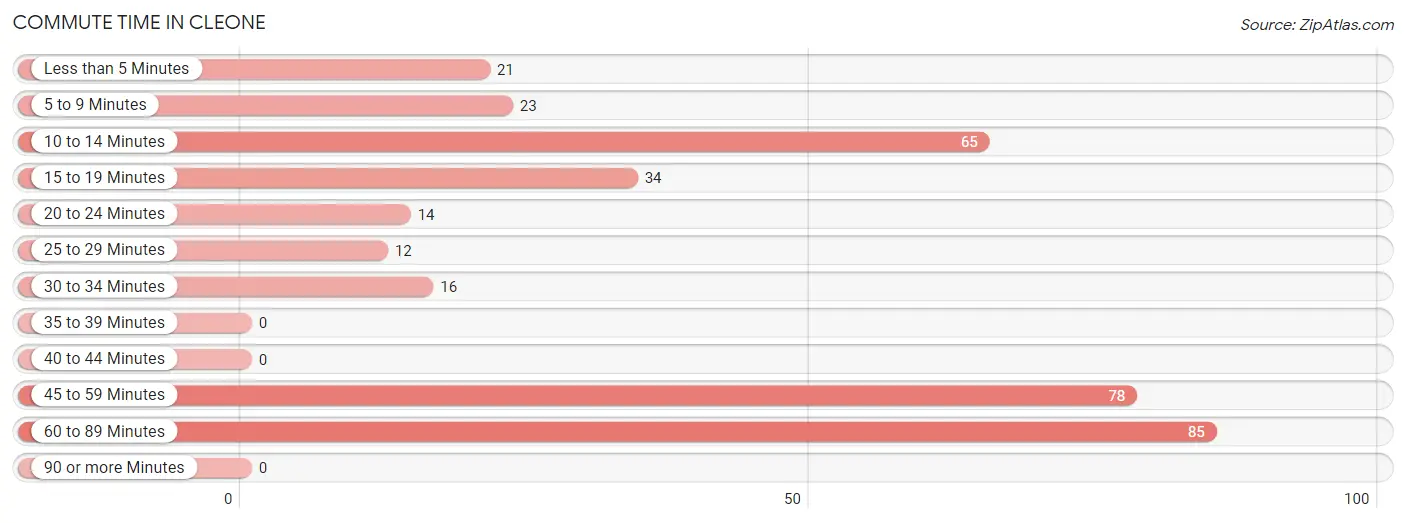
| Commute Time | # Commuters | % Commuters |
| Less than 5 Minutes | 21 | 6.0% |
| 5 to 9 Minutes | 23 | 6.6% |
| 10 to 14 Minutes | 65 | 18.7% |
| 15 to 19 Minutes | 34 | 9.8% |
| 20 to 24 Minutes | 14 | 4.0% |
| 25 to 29 Minutes | 12 | 3.5% |
| 30 to 34 Minutes | 16 | 4.6% |
| 35 to 39 Minutes | 0 | 0.0% |
| 40 to 44 Minutes | 0 | 0.0% |
| 45 to 59 Minutes | 78 | 22.4% |
| 60 to 89 Minutes | 85 | 24.4% |
| 90 or more Minutes | 0 | 0.0% |
Commute Time by Sex in Cleone
The most common commute times in Cleone are 60 to 89 minutes (52 commuters, 27.4%) for males and 10 to 14 minutes (65 commuters, 41.1%) for females.
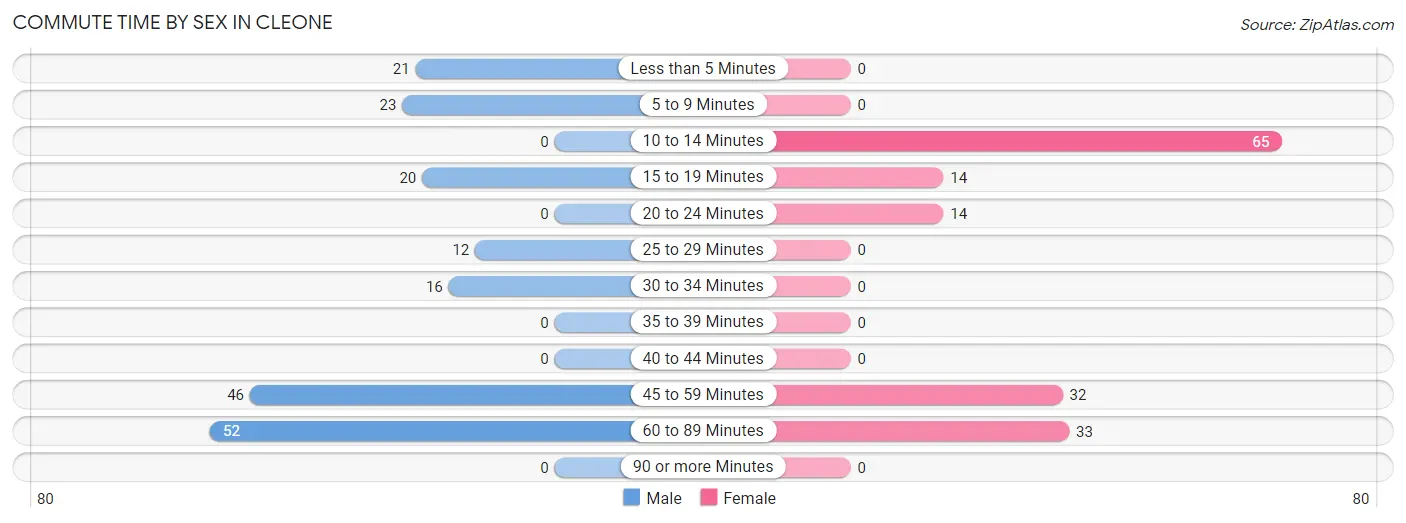
| Commute Time | Male | Female |
| Less than 5 Minutes | 21 (11.1%) | 0 (0.0%) |
| 5 to 9 Minutes | 23 (12.1%) | 0 (0.0%) |
| 10 to 14 Minutes | 0 (0.0%) | 65 (41.1%) |
| 15 to 19 Minutes | 20 (10.5%) | 14 (8.9%) |
| 20 to 24 Minutes | 0 (0.0%) | 14 (8.9%) |
| 25 to 29 Minutes | 12 (6.3%) | 0 (0.0%) |
| 30 to 34 Minutes | 16 (8.4%) | 0 (0.0%) |
| 35 to 39 Minutes | 0 (0.0%) | 0 (0.0%) |
| 40 to 44 Minutes | 0 (0.0%) | 0 (0.0%) |
| 45 to 59 Minutes | 46 (24.2%) | 32 (20.3%) |
| 60 to 89 Minutes | 52 (27.4%) | 33 (20.9%) |
| 90 or more Minutes | 0 (0.0%) | 0 (0.0%) |
Time of Departure to Work by Sex in Cleone
The most frequent times of departure to work in Cleone are 7:00 AM to 7:29 AM (54, 28.4%) for males and 7:30 AM to 7:59 AM (73, 46.2%) for females.
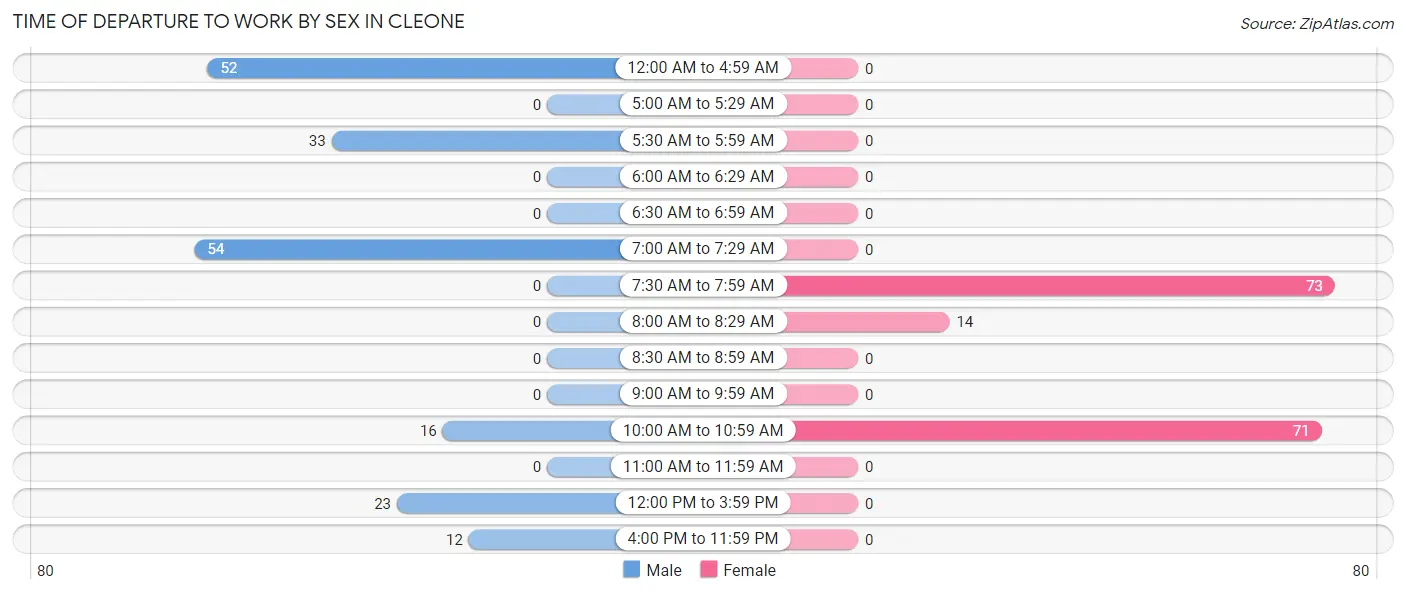
| Time of Departure | Male | Female |
| 12:00 AM to 4:59 AM | 52 (27.4%) | 0 (0.0%) |
| 5:00 AM to 5:29 AM | 0 (0.0%) | 0 (0.0%) |
| 5:30 AM to 5:59 AM | 33 (17.4%) | 0 (0.0%) |
| 6:00 AM to 6:29 AM | 0 (0.0%) | 0 (0.0%) |
| 6:30 AM to 6:59 AM | 0 (0.0%) | 0 (0.0%) |
| 7:00 AM to 7:29 AM | 54 (28.4%) | 0 (0.0%) |
| 7:30 AM to 7:59 AM | 0 (0.0%) | 73 (46.2%) |
| 8:00 AM to 8:29 AM | 0 (0.0%) | 14 (8.9%) |
| 8:30 AM to 8:59 AM | 0 (0.0%) | 0 (0.0%) |
| 9:00 AM to 9:59 AM | 0 (0.0%) | 0 (0.0%) |
| 10:00 AM to 10:59 AM | 16 (8.4%) | 71 (44.9%) |
| 11:00 AM to 11:59 AM | 0 (0.0%) | 0 (0.0%) |
| 12:00 PM to 3:59 PM | 23 (12.1%) | 0 (0.0%) |
| 4:00 PM to 11:59 PM | 12 (6.3%) | 0 (0.0%) |
| Total | 190 (100.0%) | 158 (100.0%) |
Housing Occupancy in Cleone
Occupancy by Ownership in Cleone
Of the total 301 dwellings in Cleone, owner-occupied units account for 234 (77.7%), while renter-occupied units make up 67 (22.3%).
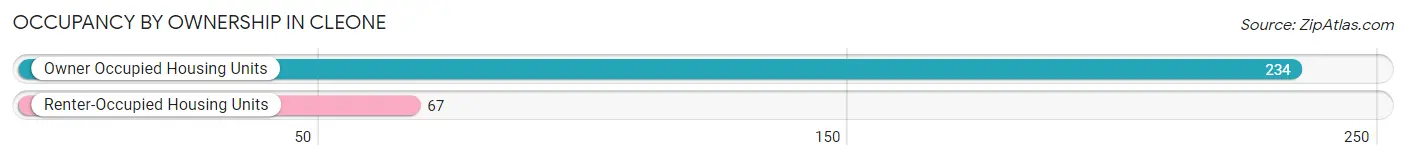
| Occupancy | # Housing Units | % Housing Units |
| Owner Occupied Housing Units | 234 | 77.7% |
| Renter-Occupied Housing Units | 67 | 22.3% |
| Total Occupied Housing Units | 301 | 100.0% |
Occupancy by Household Size in Cleone
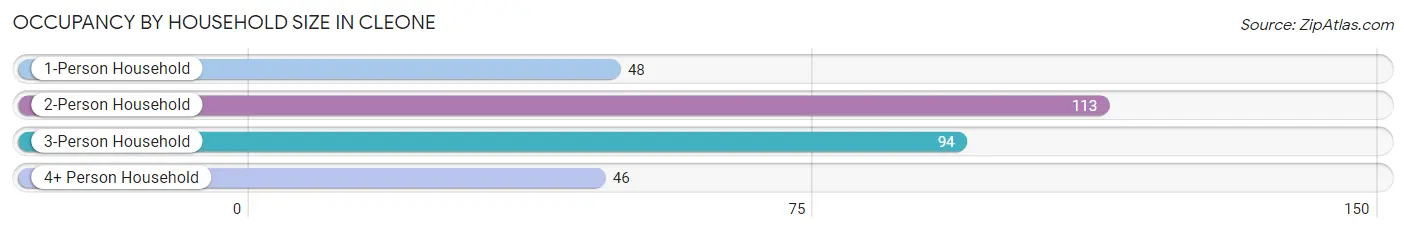
| Household Size | # Housing Units | % Housing Units |
| 1-Person Household | 48 | 16.0% |
| 2-Person Household | 113 | 37.5% |
| 3-Person Household | 94 | 31.2% |
| 4+ Person Household | 46 | 15.3% |
| Total Housing Units | 301 | 100.0% |
Occupancy by Ownership by Household Size in Cleone
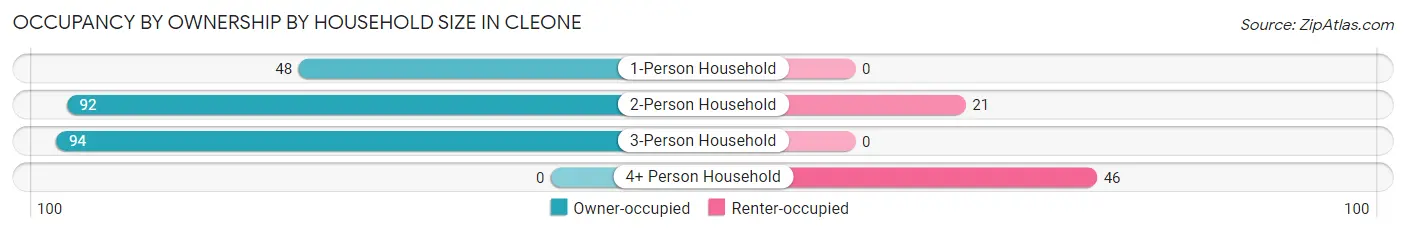
| Household Size | Owner-occupied | Renter-occupied |
| 1-Person Household | 48 (100.0%) | 0 (0.0%) |
| 2-Person Household | 92 (81.4%) | 21 (18.6%) |
| 3-Person Household | 94 (100.0%) | 0 (0.0%) |
| 4+ Person Household | 0 (0.0%) | 46 (100.0%) |
| Total Housing Units | 234 (77.7%) | 67 (22.3%) |
Occupancy by Educational Attainment in Cleone
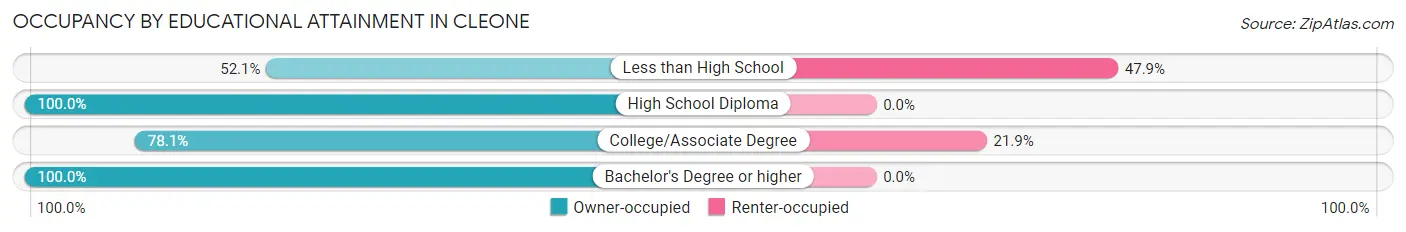
| Household Size | Owner-occupied | Renter-occupied |
| Less than High School | 50 (52.1%) | 46 (47.9%) |
| High School Diploma | 27 (100.0%) | 0 (0.0%) |
| College/Associate Degree | 75 (78.1%) | 21 (21.9%) |
| Bachelor's Degree or higher | 82 (100.0%) | 0 (0.0%) |
Occupancy by Age of Householder in Cleone
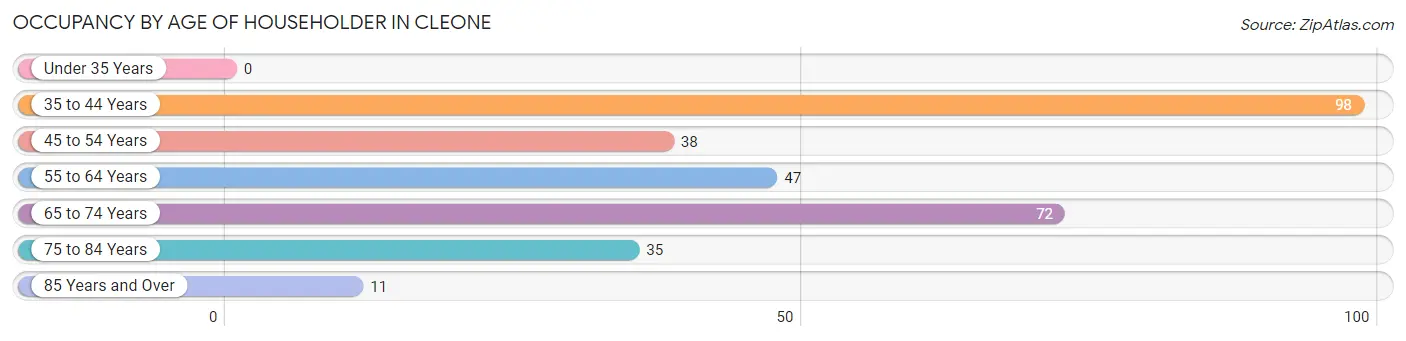
| Age Bracket | # Households | % Households |
| Under 35 Years | 0 | 0.0% |
| 35 to 44 Years | 98 | 32.6% |
| 45 to 54 Years | 38 | 12.6% |
| 55 to 64 Years | 47 | 15.6% |
| 65 to 74 Years | 72 | 23.9% |
| 75 to 84 Years | 35 | 11.6% |
| 85 Years and Over | 11 | 3.6% |
| Total | 301 | 100.0% |
Housing Finances in Cleone
Median Income by Occupancy in Cleone
| Occupancy Type | # Households | Median Income |
| Owner-Occupied | 234 (77.7%) | $0 |
| Renter-Occupied | 67 (22.3%) | $0 |
| Average | 301 (100.0%) | $0 |
Occupancy by Householder Income Bracket in Cleone
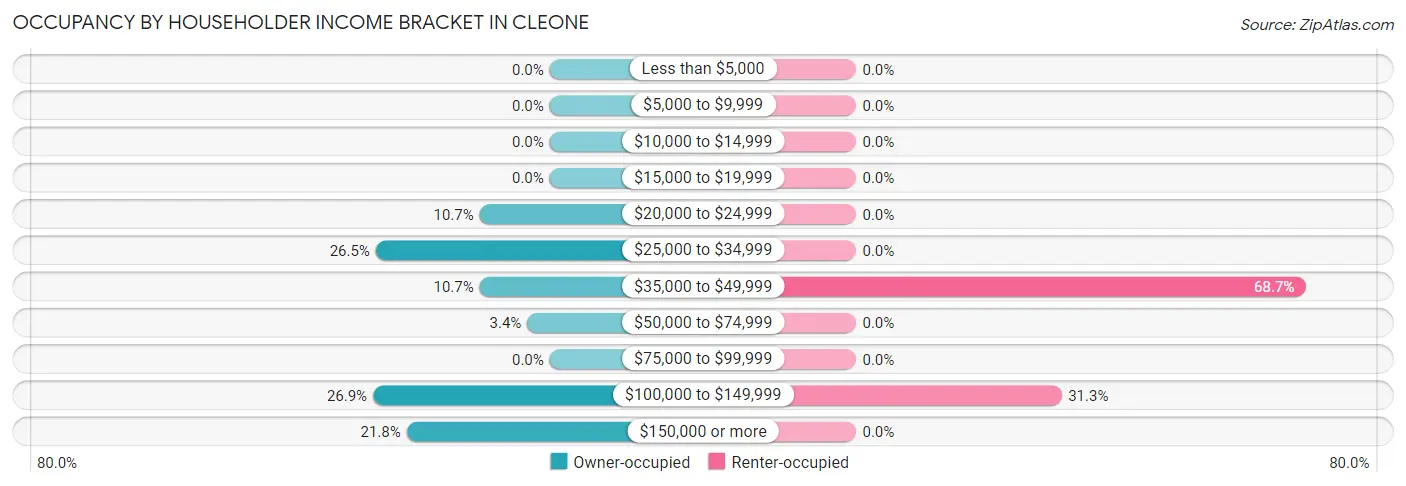
| Income Bracket | Owner-occupied | Renter-occupied |
| Less than $5,000 | 0 (0.0%) | 0 (0.0%) |
| $5,000 to $9,999 | 0 (0.0%) | 0 (0.0%) |
| $10,000 to $14,999 | 0 (0.0%) | 0 (0.0%) |
| $15,000 to $19,999 | 0 (0.0%) | 0 (0.0%) |
| $20,000 to $24,999 | 25 (10.7%) | 0 (0.0%) |
| $25,000 to $34,999 | 62 (26.5%) | 0 (0.0%) |
| $35,000 to $49,999 | 25 (10.7%) | 46 (68.7%) |
| $50,000 to $74,999 | 8 (3.4%) | 0 (0.0%) |
| $75,000 to $99,999 | 0 (0.0%) | 0 (0.0%) |
| $100,000 to $149,999 | 63 (26.9%) | 21 (31.3%) |
| $150,000 or more | 51 (21.8%) | 0 (0.0%) |
| Total | 234 (100.0%) | 67 (100.0%) |
Monthly Housing Cost Tiers in Cleone
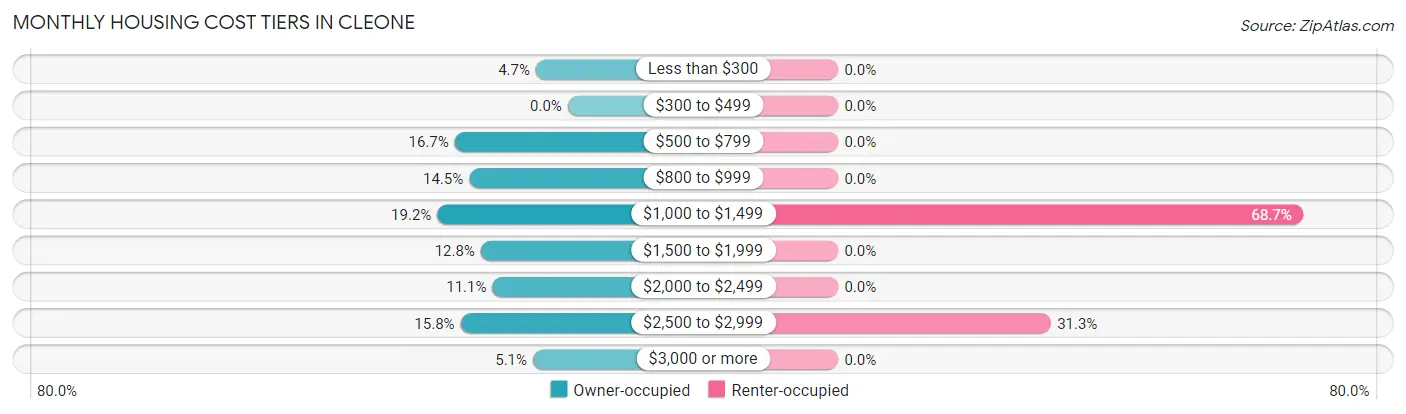
| Monthly Cost | Owner-occupied | Renter-occupied |
| Less than $300 | 11 (4.7%) | 0 (0.0%) |
| $300 to $499 | 0 (0.0%) | 0 (0.0%) |
| $500 to $799 | 39 (16.7%) | 0 (0.0%) |
| $800 to $999 | 34 (14.5%) | 0 (0.0%) |
| $1,000 to $1,499 | 45 (19.2%) | 46 (68.7%) |
| $1,500 to $1,999 | 30 (12.8%) | 0 (0.0%) |
| $2,000 to $2,499 | 26 (11.1%) | 0 (0.0%) |
| $2,500 to $2,999 | 37 (15.8%) | 21 (31.3%) |
| $3,000 or more | 12 (5.1%) | 0 (0.0%) |
| Total | 234 (100.0%) | 67 (100.0%) |
Physical Housing Characteristics in Cleone
Housing Structures in Cleone
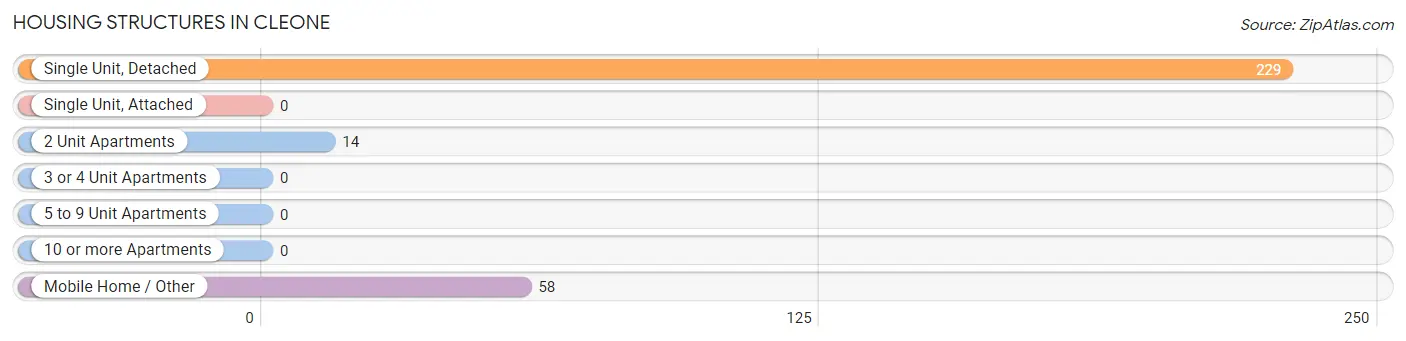
| Structure Type | # Housing Units | % Housing Units |
| Single Unit, Detached | 229 | 76.1% |
| Single Unit, Attached | 0 | 0.0% |
| 2 Unit Apartments | 14 | 4.6% |
| 3 or 4 Unit Apartments | 0 | 0.0% |
| 5 to 9 Unit Apartments | 0 | 0.0% |
| 10 or more Apartments | 0 | 0.0% |
| Mobile Home / Other | 58 | 19.3% |
| Total | 301 | 100.0% |
Housing Structures by Occupancy in Cleone
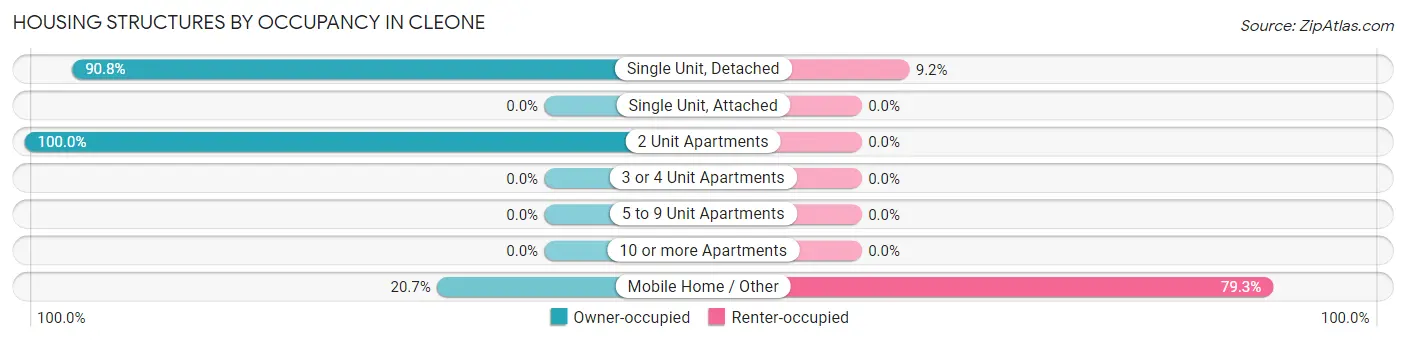
| Structure Type | Owner-occupied | Renter-occupied |
| Single Unit, Detached | 208 (90.8%) | 21 (9.2%) |
| Single Unit, Attached | 0 (0.0%) | 0 (0.0%) |
| 2 Unit Apartments | 14 (100.0%) | 0 (0.0%) |
| 3 or 4 Unit Apartments | 0 (0.0%) | 0 (0.0%) |
| 5 to 9 Unit Apartments | 0 (0.0%) | 0 (0.0%) |
| 10 or more Apartments | 0 (0.0%) | 0 (0.0%) |
| Mobile Home / Other | 12 (20.7%) | 46 (79.3%) |
| Total | 234 (77.7%) | 67 (22.3%) |
Housing Structures by Number of Rooms in Cleone
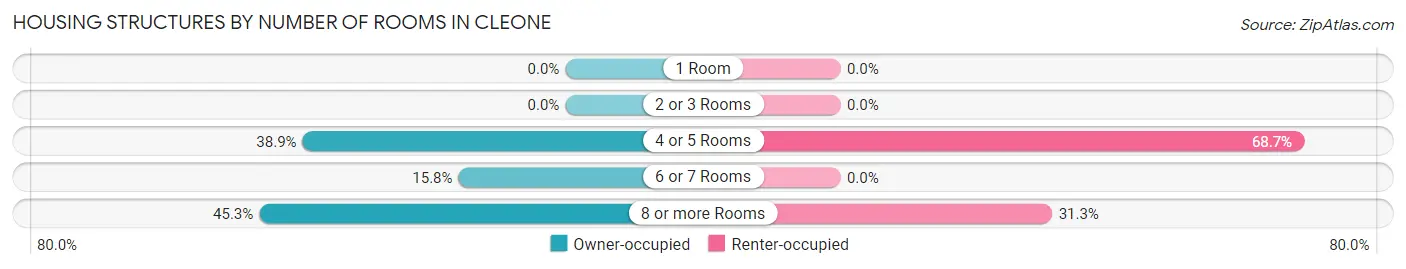
| Number of Rooms | Owner-occupied | Renter-occupied |
| 1 Room | 0 (0.0%) | 0 (0.0%) |
| 2 or 3 Rooms | 0 (0.0%) | 0 (0.0%) |
| 4 or 5 Rooms | 91 (38.9%) | 46 (68.7%) |
| 6 or 7 Rooms | 37 (15.8%) | 0 (0.0%) |
| 8 or more Rooms | 106 (45.3%) | 21 (31.3%) |
| Total | 234 (100.0%) | 67 (100.0%) |
Housing Structure by Heating Type in Cleone
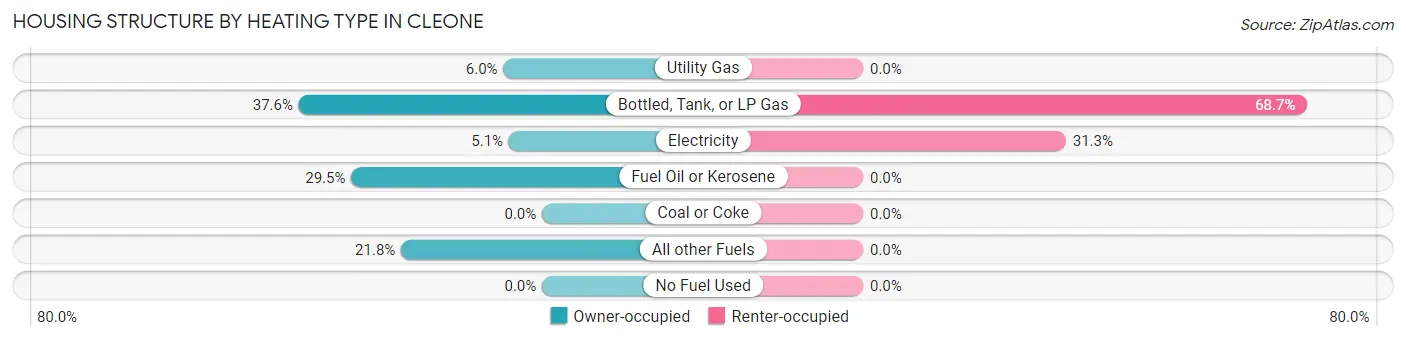
| Heating Type | Owner-occupied | Renter-occupied |
| Utility Gas | 14 (6.0%) | 0 (0.0%) |
| Bottled, Tank, or LP Gas | 88 (37.6%) | 46 (68.7%) |
| Electricity | 12 (5.1%) | 21 (31.3%) |
| Fuel Oil or Kerosene | 69 (29.5%) | 0 (0.0%) |
| Coal or Coke | 0 (0.0%) | 0 (0.0%) |
| All other Fuels | 51 (21.8%) | 0 (0.0%) |
| No Fuel Used | 0 (0.0%) | 0 (0.0%) |
| Total | 234 (100.0%) | 67 (100.0%) |
Household Vehicle Usage in Cleone
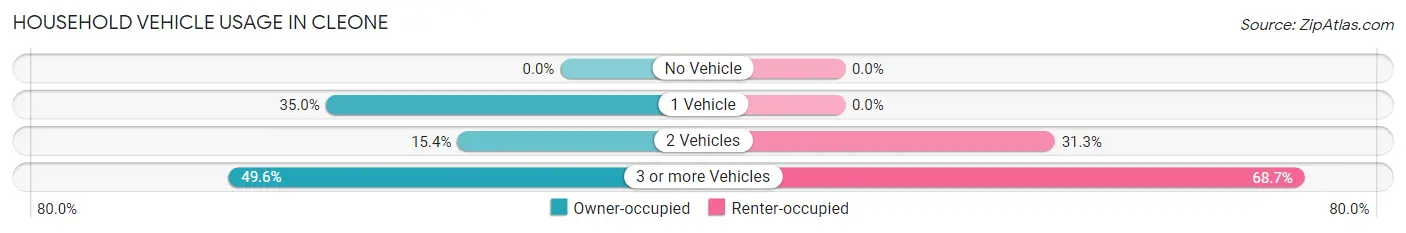
| Vehicles per Household | Owner-occupied | Renter-occupied |
| No Vehicle | 0 (0.0%) | 0 (0.0%) |
| 1 Vehicle | 82 (35.0%) | 0 (0.0%) |
| 2 Vehicles | 36 (15.4%) | 21 (31.3%) |
| 3 or more Vehicles | 116 (49.6%) | 46 (68.7%) |
| Total | 234 (100.0%) | 67 (100.0%) |
Real Estate & Mortgages in Cleone
Real Estate and Mortgage Overview in Cleone
| Characteristic | Without Mortgage | With Mortgage |
| Housing Units | 113 | 121 |
| Median Property Value | $446,400 | $630,400 |
| Median Household Income | - | - |
| Monthly Housing Costs | $846 | $12 |
| Real Estate Taxes | $3,688 | $12 |
Property Value by Mortgage Status in Cleone
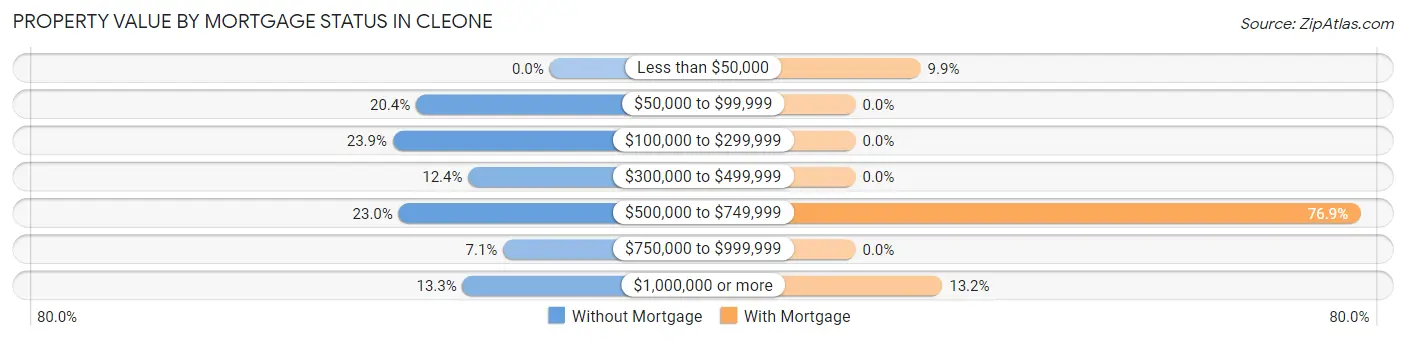
| Property Value | Without Mortgage | With Mortgage |
| Less than $50,000 | 0 (0.0%) | 12 (9.9%) |
| $50,000 to $99,999 | 23 (20.3%) | 0 (0.0%) |
| $100,000 to $299,999 | 27 (23.9%) | 0 (0.0%) |
| $300,000 to $499,999 | 14 (12.4%) | 0 (0.0%) |
| $500,000 to $749,999 | 26 (23.0%) | 93 (76.9%) |
| $750,000 to $999,999 | 8 (7.1%) | 0 (0.0%) |
| $1,000,000 or more | 15 (13.3%) | 16 (13.2%) |
| Total | 113 (100.0%) | 121 (100.0%) |
Household Income by Mortgage Status in Cleone
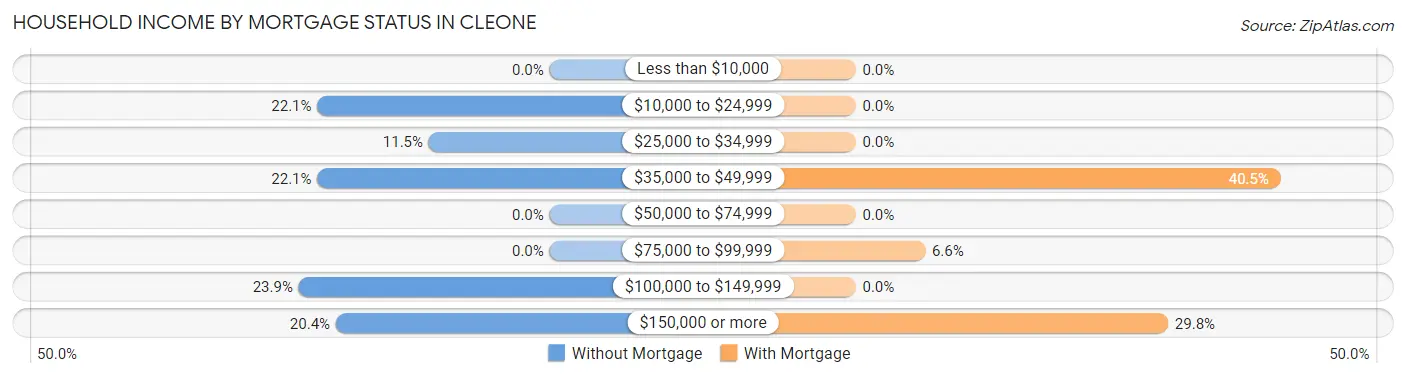
| Household Income | Without Mortgage | With Mortgage |
| Less than $10,000 | 0 (0.0%) | 0 (0.0%) |
| $10,000 to $24,999 | 25 (22.1%) | 0 (0.0%) |
| $25,000 to $34,999 | 13 (11.5%) | 0 (0.0%) |
| $35,000 to $49,999 | 25 (22.1%) | 49 (40.5%) |
| $50,000 to $74,999 | 0 (0.0%) | 0 (0.0%) |
| $75,000 to $99,999 | 0 (0.0%) | 8 (6.6%) |
| $100,000 to $149,999 | 27 (23.9%) | 0 (0.0%) |
| $150,000 or more | 23 (20.3%) | 36 (29.7%) |
| Total | 113 (100.0%) | 121 (100.0%) |
Property Value to Household Income Ratio in Cleone
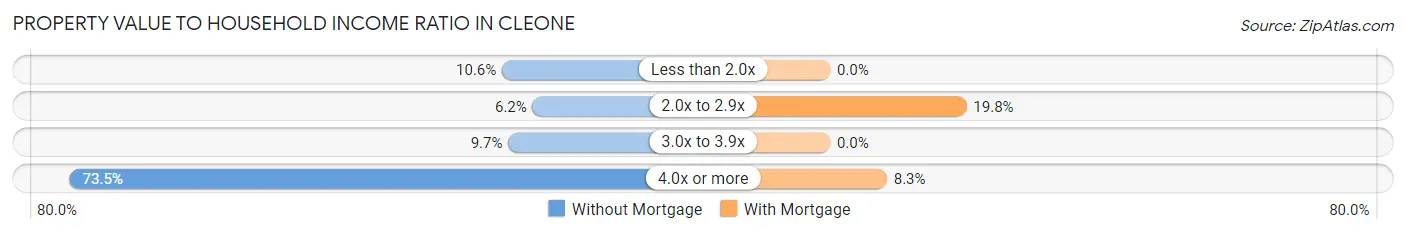
| Value-to-Income Ratio | Without Mortgage | With Mortgage |
| Less than 2.0x | 12 (10.6%) | 0 (0.0%) |
| 2.0x to 2.9x | 7 (6.2%) | 24 (19.8%) |
| 3.0x to 3.9x | 11 (9.7%) | 0 (0.0%) |
| 4.0x or more | 83 (73.5%) | 10 (8.3%) |
| Total | 113 (100.0%) | 121 (100.0%) |
Real Estate Taxes by Mortgage Status in Cleone
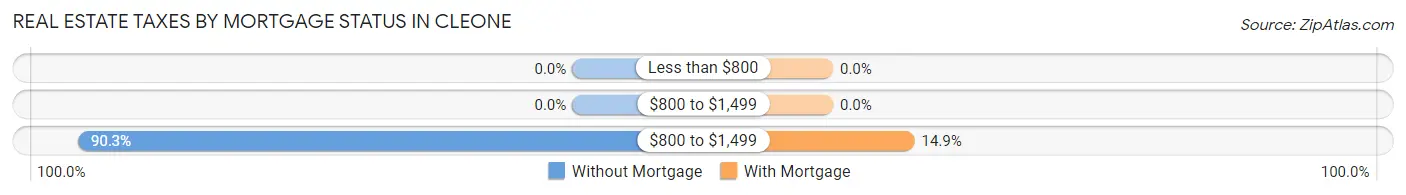
| Property Taxes | Without Mortgage | With Mortgage |
| Less than $800 | 0 (0.0%) | 0 (0.0%) |
| $800 to $1,499 | 0 (0.0%) | 0 (0.0%) |
| $800 to $1,499 | 102 (90.3%) | 18 (14.9%) |
| Total | 113 (100.0%) | 121 (100.0%) |
Health & Disability in Cleone
Health Insurance Coverage by Age in Cleone
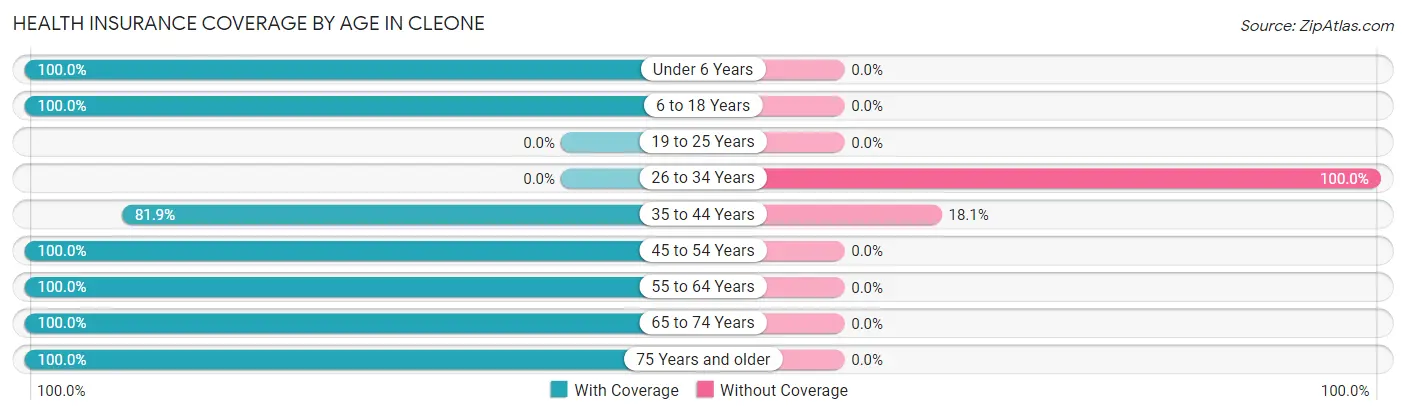
| Age Bracket | With Coverage | Without Coverage |
| Under 6 Years | 23 (100.0%) | 0 (0.0%) |
| 6 to 18 Years | 183 (100.0%) | 0 (0.0%) |
| 19 to 25 Years | 0 (0.0%) | 0 (0.0%) |
| 26 to 34 Years | 0 (0.0%) | 32 (100.0%) |
| 35 to 44 Years | 176 (81.9%) | 39 (18.1%) |
| 45 to 54 Years | 61 (100.0%) | 0 (0.0%) |
| 55 to 64 Years | 73 (100.0%) | 0 (0.0%) |
| 65 to 74 Years | 107 (100.0%) | 0 (0.0%) |
| 75 Years and older | 80 (100.0%) | 0 (0.0%) |
| Total | 703 (90.8%) | 71 (9.2%) |
Health Insurance Coverage by Citizenship Status in Cleone
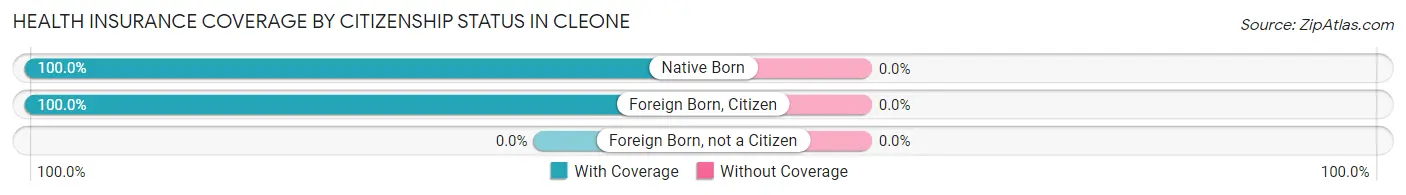
| Citizenship Status | With Coverage | Without Coverage |
| Native Born | 23 (100.0%) | 0 (0.0%) |
| Foreign Born, Citizen | 183 (100.0%) | 0 (0.0%) |
| Foreign Born, not a Citizen | 0 (0.0%) | 0 (0.0%) |
Health Insurance Coverage by Household Income in Cleone
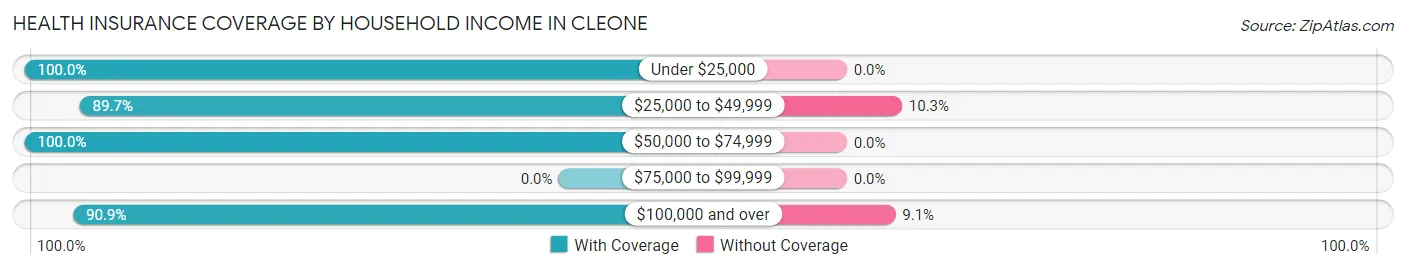
| Household Income | With Coverage | Without Coverage |
| Under $25,000 | 36 (100.0%) | 0 (0.0%) |
| $25,000 to $49,999 | 339 (89.7%) | 39 (10.3%) |
| $50,000 to $74,999 | 8 (100.0%) | 0 (0.0%) |
| $75,000 to $99,999 | 0 (0.0%) | 0 (0.0%) |
| $100,000 and over | 320 (90.9%) | 32 (9.1%) |
Public vs Private Health Insurance Coverage by Age in Cleone
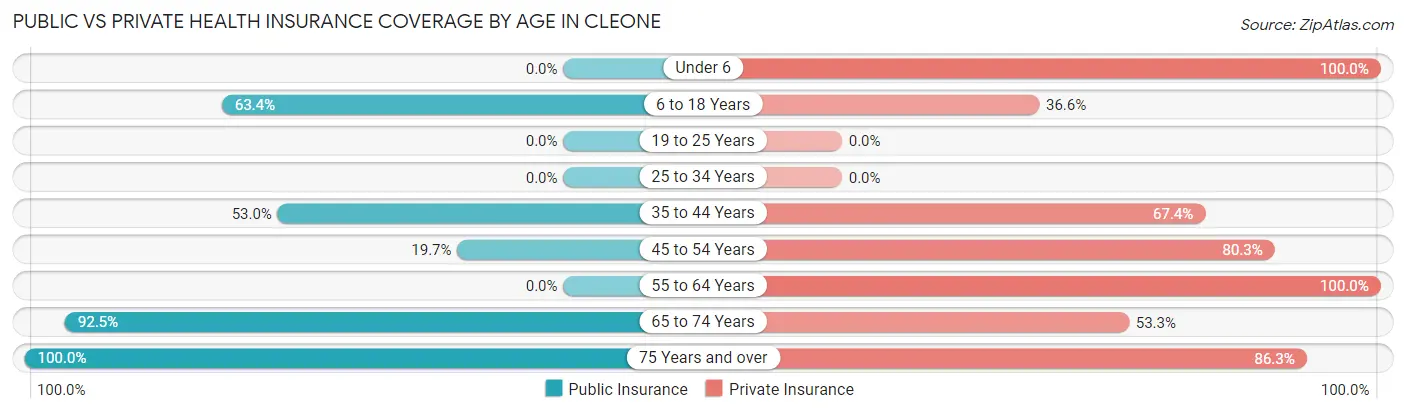
| Age Bracket | Public Insurance | Private Insurance |
| Under 6 | 0 (0.0%) | 23 (100.0%) |
| 6 to 18 Years | 116 (63.4%) | 67 (36.6%) |
| 19 to 25 Years | 0 (0.0%) | 0 (0.0%) |
| 25 to 34 Years | 0 (0.0%) | 0 (0.0%) |
| 35 to 44 Years | 114 (53.0%) | 145 (67.4%) |
| 45 to 54 Years | 12 (19.7%) | 49 (80.3%) |
| 55 to 64 Years | 0 (0.0%) | 73 (100.0%) |
| 65 to 74 Years | 99 (92.5%) | 57 (53.3%) |
| 75 Years and over | 80 (100.0%) | 69 (86.3%) |
| Total | 421 (54.4%) | 483 (62.4%) |
Disability Status by Sex by Age in Cleone
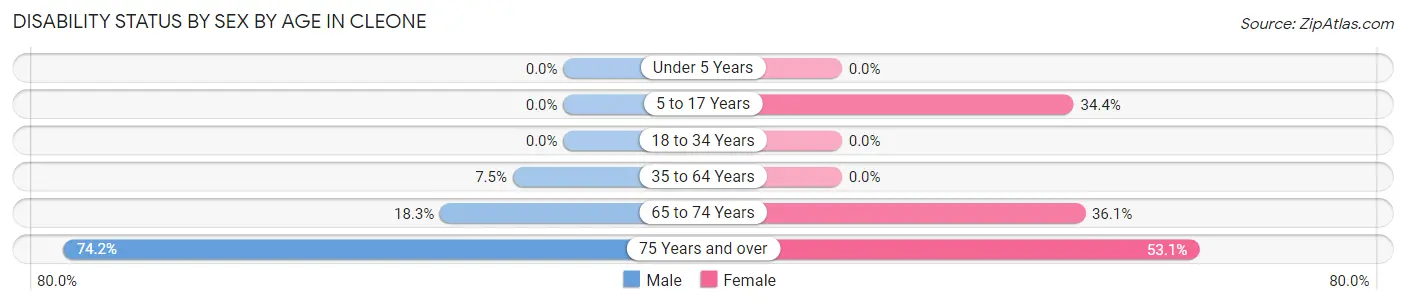
| Age Bracket | Male | Female |
| Under 5 Years | 0 (0.0%) | 0 (0.0%) |
| 5 to 17 Years | 0 (0.0%) | 42 (34.4%) |
| 18 to 34 Years | 0 (0.0%) | 0 (0.0%) |
| 35 to 64 Years | 16 (7.5%) | 0 (0.0%) |
| 65 to 74 Years | 13 (18.3%) | 13 (36.1%) |
| 75 Years and over | 23 (74.2%) | 26 (53.1%) |
Disability Class by Sex by Age in Cleone
Disability Class: Hearing Difficulty
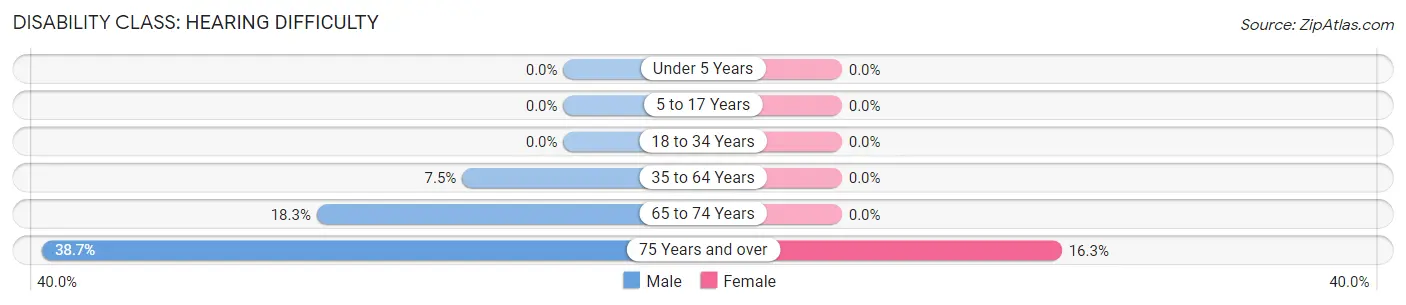
| Age Bracket | Male | Female |
| Under 5 Years | 0 (0.0%) | 0 (0.0%) |
| 5 to 17 Years | 0 (0.0%) | 0 (0.0%) |
| 18 to 34 Years | 0 (0.0%) | 0 (0.0%) |
| 35 to 64 Years | 16 (7.5%) | 0 (0.0%) |
| 65 to 74 Years | 13 (18.3%) | 0 (0.0%) |
| 75 Years and over | 12 (38.7%) | 8 (16.3%) |
Disability Class: Vision Difficulty
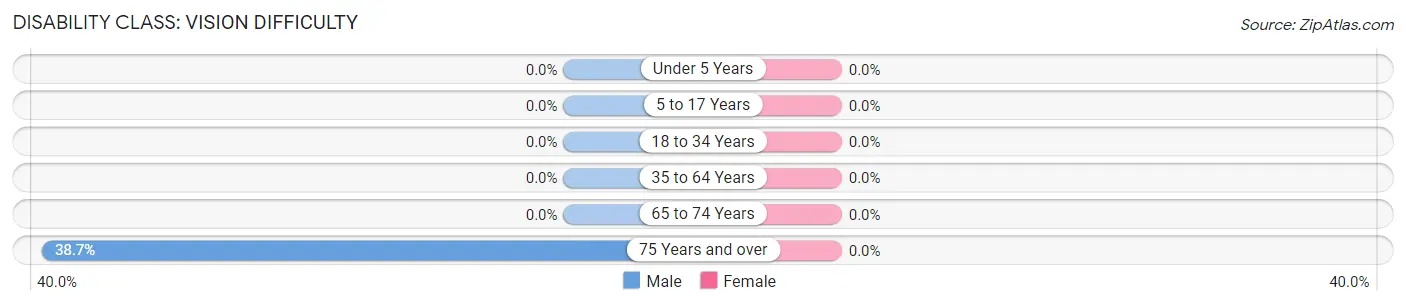
| Age Bracket | Male | Female |
| Under 5 Years | 0 (0.0%) | 0 (0.0%) |
| 5 to 17 Years | 0 (0.0%) | 0 (0.0%) |
| 18 to 34 Years | 0 (0.0%) | 0 (0.0%) |
| 35 to 64 Years | 0 (0.0%) | 0 (0.0%) |
| 65 to 74 Years | 0 (0.0%) | 0 (0.0%) |
| 75 Years and over | 12 (38.7%) | 0 (0.0%) |
Disability Class: Cognitive Difficulty
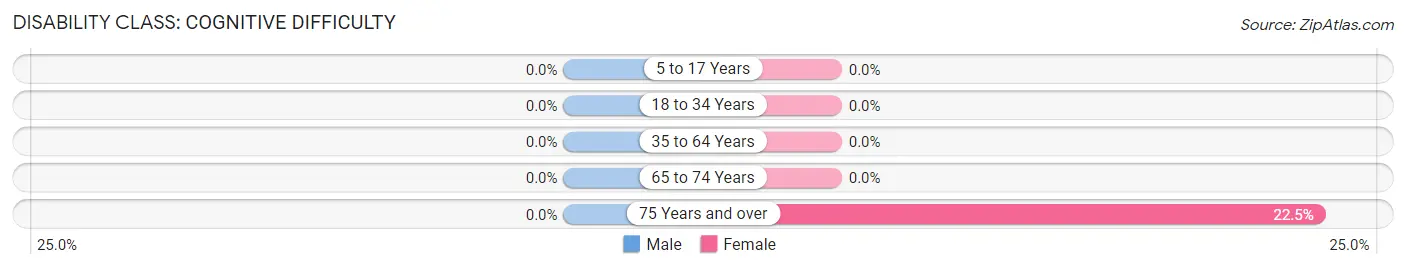
| Age Bracket | Male | Female |
| 5 to 17 Years | 0 (0.0%) | 0 (0.0%) |
| 18 to 34 Years | 0 (0.0%) | 0 (0.0%) |
| 35 to 64 Years | 0 (0.0%) | 0 (0.0%) |
| 65 to 74 Years | 0 (0.0%) | 0 (0.0%) |
| 75 Years and over | 0 (0.0%) | 11 (22.5%) |
Disability Class: Ambulatory Difficulty
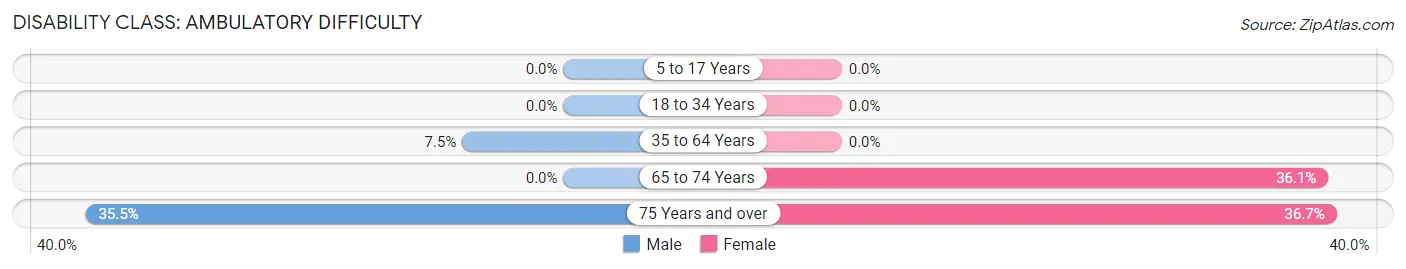
| Age Bracket | Male | Female |
| 5 to 17 Years | 0 (0.0%) | 0 (0.0%) |
| 18 to 34 Years | 0 (0.0%) | 0 (0.0%) |
| 35 to 64 Years | 16 (7.5%) | 0 (0.0%) |
| 65 to 74 Years | 0 (0.0%) | 13 (36.1%) |
| 75 Years and over | 11 (35.5%) | 18 (36.7%) |
Disability Class: Self-Care Difficulty
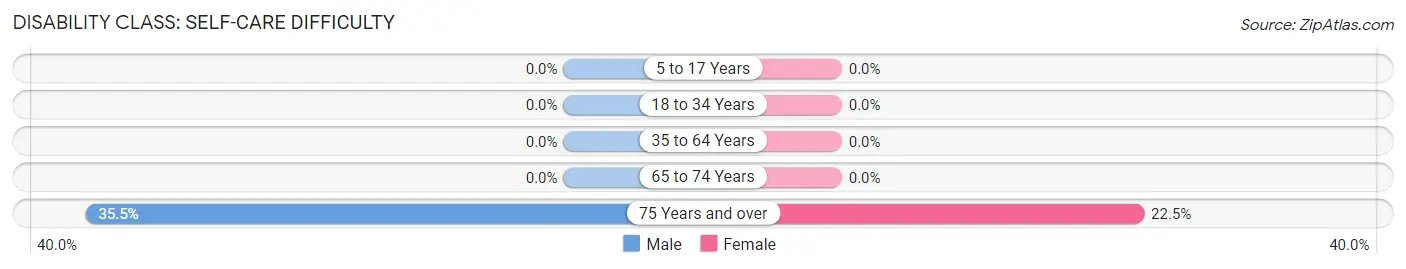
| Age Bracket | Male | Female |
| 5 to 17 Years | 0 (0.0%) | 0 (0.0%) |
| 18 to 34 Years | 0 (0.0%) | 0 (0.0%) |
| 35 to 64 Years | 0 (0.0%) | 0 (0.0%) |
| 65 to 74 Years | 0 (0.0%) | 0 (0.0%) |
| 75 Years and over | 11 (35.5%) | 11 (22.5%) |
Technology Access in Cleone
Computing Device Access in Cleone
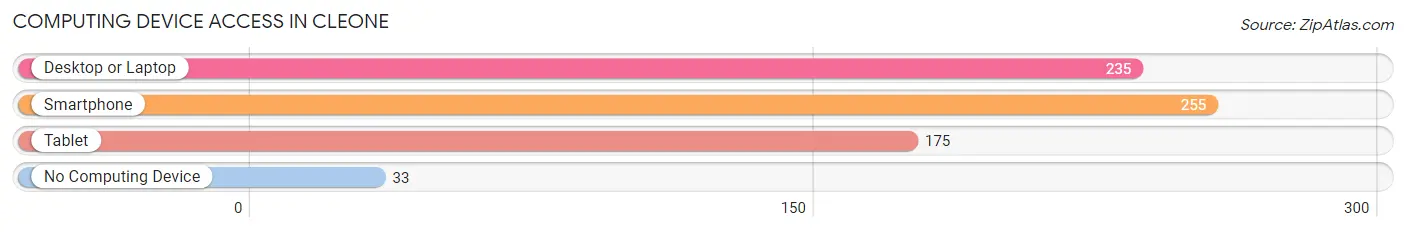
| Device Type | # Households | % Households |
| Desktop or Laptop | 235 | 78.1% |
| Smartphone | 255 | 84.7% |
| Tablet | 175 | 58.1% |
| No Computing Device | 33 | 11.0% |
| Total | 301 | 100.0% |
Internet Access in Cleone
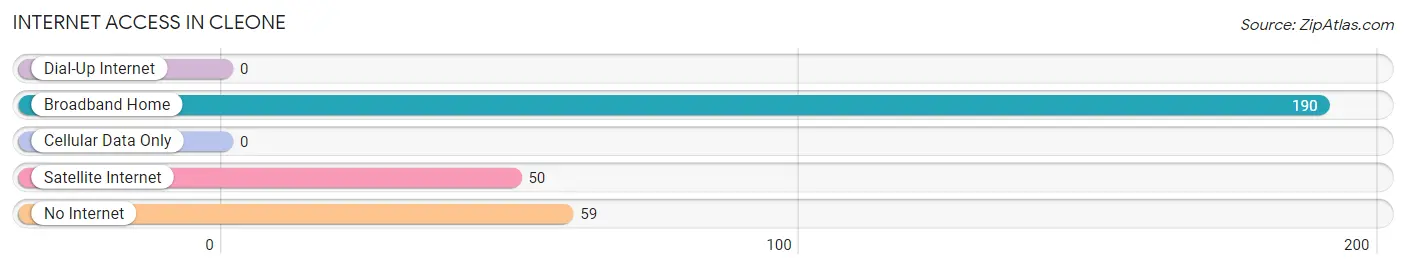
| Internet Type | # Households | % Households |
| Dial-Up Internet | 0 | 0.0% |
| Broadband Home | 190 | 63.1% |
| Cellular Data Only | 0 | 0.0% |
| Satellite Internet | 50 | 16.6% |
| No Internet | 59 | 19.6% |
| Total | 301 | 100.0% |
Cleone Summary
Cleone is a small unincorporated community located in Mendocino County, California. It is situated on the Pacific Coast, approximately 10 miles north of Fort Bragg and about 200 miles north of San Francisco. The population of Cleone was estimated to be around 200 people in 2000.
History
The area now known as Cleone was originally inhabited by the Pomo people, who were the original inhabitants of the area. The first European settlers arrived in the area in the late 1800s, and the town was officially founded in 1885. The town was named after Cleone, the daughter of a local rancher.
The town was initially a small fishing village, and the local economy was largely based on fishing and logging. In the early 1900s, the town began to grow as a tourist destination, and it became a popular spot for vacationers from San Francisco and other nearby cities.
Geography
Cleone is located on the Pacific Coast, approximately 10 miles north of Fort Bragg and about 200 miles north of San Francisco. The town is situated on a small peninsula, surrounded by the Pacific Ocean on three sides. The town is located in a temperate climate, with mild temperatures year-round.
The town is surrounded by a variety of natural features, including the Pacific Ocean, the Noyo River, and the Mendocino National Forest. The town is also located near several state parks, including MacKerricher State Park and Jug Handle State Reserve.
Economy
The economy of Cleone is largely based on tourism and fishing. The town is a popular destination for vacationers from San Francisco and other nearby cities, and it is also a popular spot for fishing and other outdoor activities.
The town is also home to several small businesses, including restaurants, shops, and galleries. The town is also home to a small marina, which provides access to the Pacific Ocean for fishing and other activities.
Demographics
The population of Cleone was estimated to be around 200 people in 2000. The town is predominantly white, with a small Hispanic population. The median household income in Cleone is around $50,000, and the median home value is around $250,000.
Conclusion
Cleone is a small unincorporated community located in Mendocino County, California. It is situated on the Pacific Coast, approximately 10 miles north of Fort Bragg and about 200 miles north of San Francisco. The population of Cleone was estimated to be around 200 people in 2000. The economy of Cleone is largely based on tourism and fishing, and the town is a popular destination for vacationers from San Francisco and other nearby cities. The town is predominantly white, with a small Hispanic population, and the median household income in Cleone is around $50,000.
Common Questions
What is the Total Population of Cleone?
Total Population of Cleone is 774.
What is the Total Male Population of Cleone?
Total Male Population of Cleone is 371.
What is the Total Female Population of Cleone?
Total Female Population of Cleone is 403.
What is the Ratio of Males per 100 Females in Cleone?
There are 92.06 Males per 100 Females in Cleone.
What is the Ratio of Females per 100 Males in Cleone?
There are 108.63 Females per 100 Males in Cleone.
What is the Median Population Age in Cleone?
Median Population Age in Cleone is 44.1 Years.
What is the Average Family Size in Cleone
Average Family Size in Cleone is 2.9 People.
What is the Average Household Size in Cleone
Average Household Size in Cleone is 2.6 People.
What is Per Capita Income in Cleone?
Per Capita income in Cleone is $40,397.
What is Inequality or Gini Index in Cleone?
Inequality or Gini Index in Cleone is 0.44.
How Large is the Labor Force in Cleone?
There are 449 People in the Labor Forcein in Cleone.
What is the Percentage of People in the Labor Force in Cleone?
66.9% of People are in the Labor Force in Cleone.
What is the Unemployment Rate in Cleone?
Unemployment Rate in Cleone is 22.5%.