Clay, CA
Clay Map
Clay Overview
1,121
TOTAL POPULATION
571
MALE POPULATION
550
FEMALE POPULATION
103.82
MALES / 100 FEMALES
96.32
FEMALES / 100 MALES
40.9
MEDIAN AGE
3.4
AVG FAMILY SIZE
3.0
AVG HOUSEHOLD SIZE
$42,689
PER CAPITA INCOME
$137,250
AVG FAMILY INCOME
$118,000
AVG HOUSEHOLD INCOME
41.4%
WAGE / INCOME GAP [ % ]
58.6¢/ $1
WAGE / INCOME GAP [ $ ]
0.33
INEQUALITY / GINI INDEX
506
LABOR FORCE [ PEOPLE ]
53.6%
PERCENT IN LABOR FORCE
7.7%
UNEMPLOYMENT RATE
Race in Clay
The most populous races in Clay are White / Caucasian (893 | 79.7%), Hispanic or Latino (234 | 20.9%), and Two or more Races (179 | 16.0%).
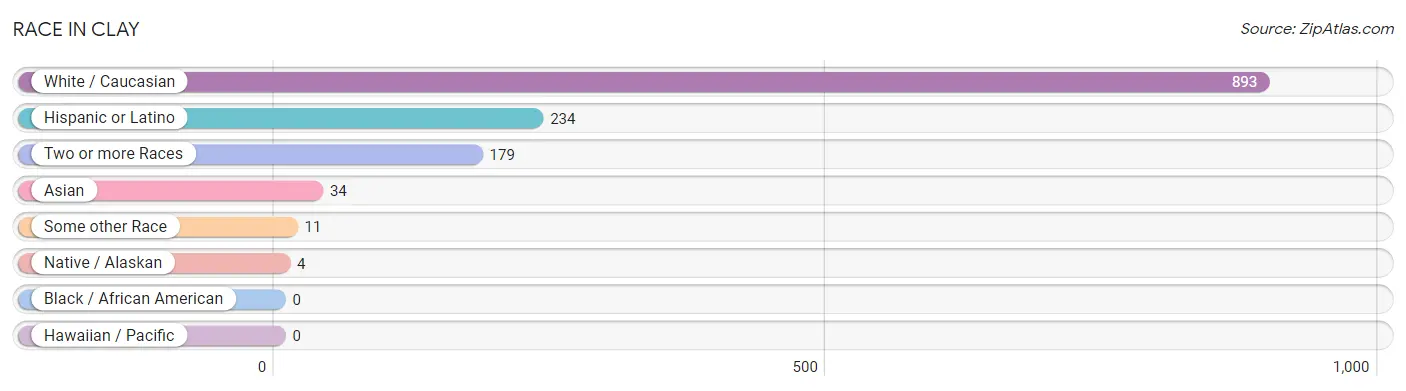
| Race | # Population | % Population |
| Asian | 34 | 3.0% |
| Black / African American | 0 | 0.0% |
| Hawaiian / Pacific | 0 | 0.0% |
| Hispanic or Latino | 234 | 20.9% |
| Native / Alaskan | 4 | 0.4% |
| White / Caucasian | 893 | 79.7% |
| Two or more Races | 179 | 16.0% |
| Some other Race | 11 | 1.0% |
| Total | 1,121 | 100.0% |
Ancestry in Clay
The most populous ancestries reported in Clay are German (196 | 17.5%), English (190 | 17.0%), Mexican (127 | 11.3%), Portuguese (121 | 10.8%), and Irish (108 | 9.6%), together accounting for 66.2% of all Clay residents.
| Ancestry | # Population | % Population |
| American | 35 | 3.1% |
| Arab | 4 | 0.4% |
| Bhutanese | 13 | 1.2% |
| British | 8 | 0.7% |
| Burmese | 7 | 0.6% |
| Croatian | 14 | 1.3% |
| Czech | 3 | 0.3% |
| Danish | 19 | 1.7% |
| Dutch | 42 | 3.7% |
| English | 190 | 17.0% |
| Filipino | 9 | 0.8% |
| French | 73 | 6.5% |
| French Canadian | 3 | 0.3% |
| German | 196 | 17.5% |
| Guamanian / Chamorro | 4 | 0.4% |
| Haitian | 4 | 0.4% |
| Indian (Asian) | 22 | 2.0% |
| Irish | 108 | 9.6% |
| Italian | 68 | 6.1% |
| Korean | 91 | 8.1% |
| Latvian | 5 | 0.4% |
| Lebanese | 4 | 0.4% |
| Mexican | 127 | 11.3% |
| Native Hawaiian | 4 | 0.4% |
| New Zealander | 6 | 0.5% |
| Norwegian | 76 | 6.8% |
| Polish | 6 | 0.5% |
| Portuguese | 121 | 10.8% |
| Scottish | 11 | 1.0% |
| Spaniard | 73 | 6.5% |
| Spanish | 34 | 3.0% |
| Sri Lankan | 4 | 0.4% |
| Swedish | 32 | 2.9% |
| Swiss | 4 | 0.4% |
| Thai | 4 | 0.4% | View All 35 Rows |
Immigrants in Clay
The most numerous immigrant groups reported in Clay came from Asia (34 | 3.0%), South Eastern Asia (27 | 2.4%), Philippines (22 | 2.0%), Central America (11 | 1.0%), and Latin America (11 | 1.0%), together accounting for 9.4% of all Clay residents.
| Immigration Origin | # Population | % Population |
| Asia | 34 | 3.0% |
| Azores | 10 | 0.9% |
| Central America | 11 | 1.0% |
| Eastern Asia | 7 | 0.6% |
| Europe | 10 | 0.9% |
| Korea | 7 | 0.6% |
| Latin America | 11 | 1.0% |
| Mexico | 11 | 1.0% |
| Philippines | 22 | 2.0% |
| Portugal | 10 | 0.9% |
| South Eastern Asia | 27 | 2.4% |
| Southern Europe | 10 | 0.9% |
| Vietnam | 5 | 0.4% | View All 13 Rows |
Sex and Age in Clay
Sex and Age in Clay
The most populous age groups in Clay are 20 to 24 Years (67 | 11.7%) for men and 40 to 44 Years (67 | 12.2%) for women.
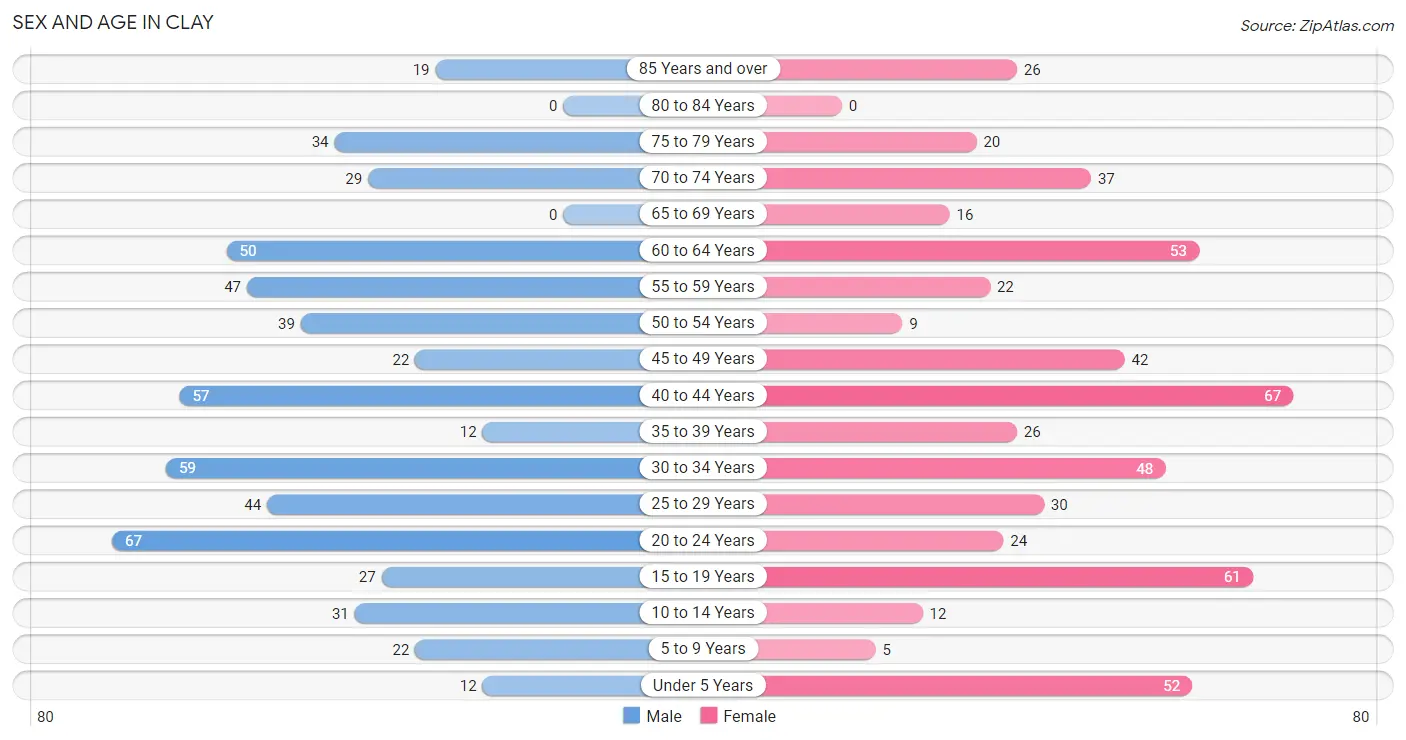
| Age Bracket | Male | Female |
| Under 5 Years | 12 (2.1%) | 52 (9.5%) |
| 5 to 9 Years | 22 (3.8%) | 5 (0.9%) |
| 10 to 14 Years | 31 (5.4%) | 12 (2.2%) |
| 15 to 19 Years | 27 (4.7%) | 61 (11.1%) |
| 20 to 24 Years | 67 (11.7%) | 24 (4.4%) |
| 25 to 29 Years | 44 (7.7%) | 30 (5.4%) |
| 30 to 34 Years | 59 (10.3%) | 48 (8.7%) |
| 35 to 39 Years | 12 (2.1%) | 26 (4.7%) |
| 40 to 44 Years | 57 (10.0%) | 67 (12.2%) |
| 45 to 49 Years | 22 (3.8%) | 42 (7.6%) |
| 50 to 54 Years | 39 (6.8%) | 9 (1.6%) |
| 55 to 59 Years | 47 (8.2%) | 22 (4.0%) |
| 60 to 64 Years | 50 (8.8%) | 53 (9.6%) |
| 65 to 69 Years | 0 (0.0%) | 16 (2.9%) |
| 70 to 74 Years | 29 (5.1%) | 37 (6.7%) |
| 75 to 79 Years | 34 (5.9%) | 20 (3.6%) |
| 80 to 84 Years | 0 (0.0%) | 0 (0.0%) |
| 85 Years and over | 19 (3.3%) | 26 (4.7%) |
| Total | 571 (100.0%) | 550 (100.0%) |
Families and Households in Clay
Median Family Size in Clay
The median family size in Clay is 3.35 persons per family, with single male/father families (15 | 5.6%) accounting for the largest median family size of 4.2 persons per family. On the other hand, married-couple families (208 | 77.6%) represent the smallest median family size with 3.24 persons per family.
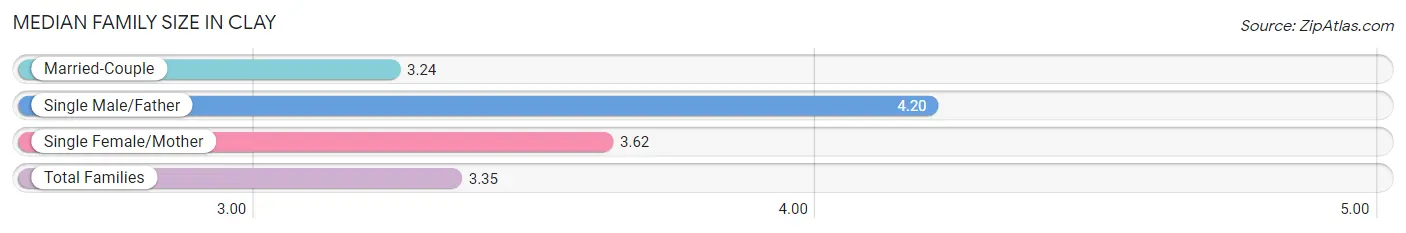
| Family Type | # Families | Family Size |
| Married-Couple | 208 (77.6%) | 3.24 |
| Single Male/Father | 15 (5.6%) | 4.20 |
| Single Female/Mother | 45 (16.8%) | 3.62 |
| Total Families | 268 (100.0%) | 3.35 |
Median Household Size in Clay
The median household size in Clay is 2.95 persons per household, with single female/mother households (45 | 11.8%) accounting for the largest median household size of 4.82 persons per household. non-family households (112 | 29.5%) represent the smallest median household size with 1.37 persons per household.
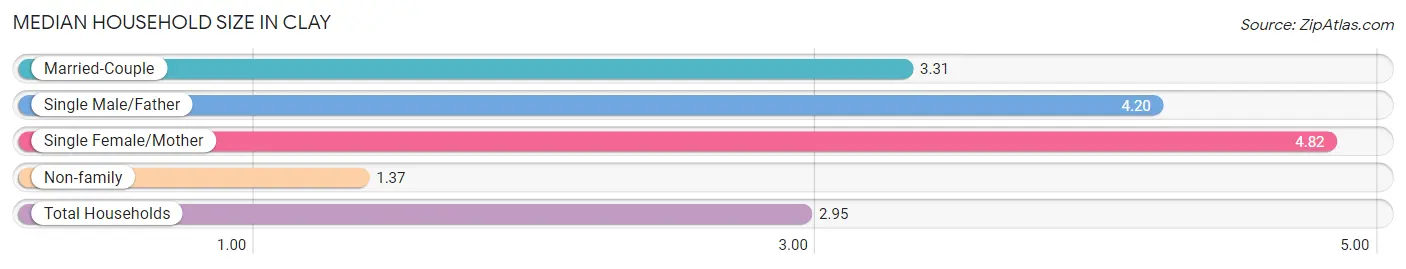
| Household Type | # Households | Household Size |
| Married-Couple | 208 (54.7%) | 3.31 |
| Single Male/Father | 15 (4.0%) | 4.20 |
| Single Female/Mother | 45 (11.8%) | 4.82 |
| Non-family | 112 (29.5%) | 1.37 |
| Total Households | 380 (100.0%) | 2.95 |
Household Size by Marriage Status in Clay
Out of a total of 380 households in Clay, 268 (70.5%) are family households, while 112 (29.5%) are nonfamily households. The most numerous type of family households are 4-person households, comprising 91, and the most common type of nonfamily households are 1-person households, comprising 95.
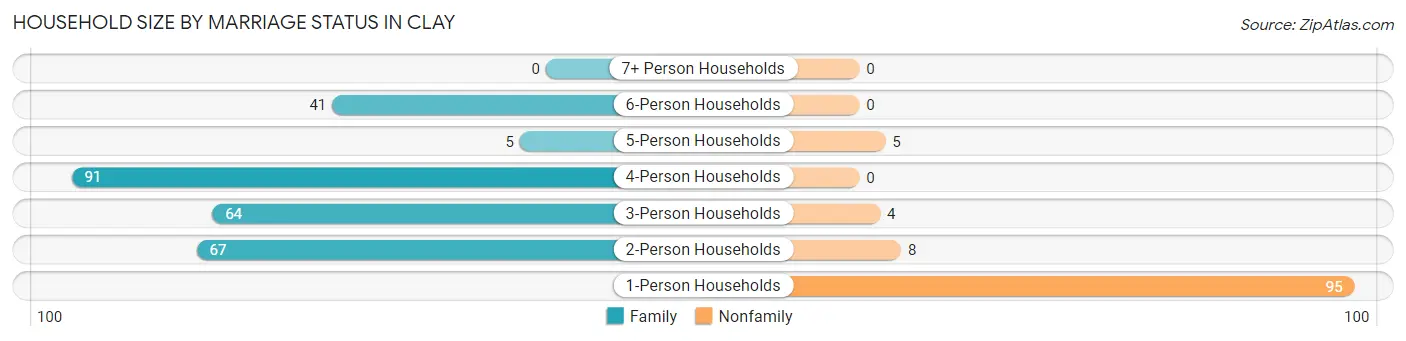
| Household Size | Family Households | Nonfamily Households |
| 1-Person Households | - | 95 (25.0%) |
| 2-Person Households | 67 (17.6%) | 8 (2.1%) |
| 3-Person Households | 64 (16.8%) | 4 (1.1%) |
| 4-Person Households | 91 (23.9%) | 0 (0.0%) |
| 5-Person Households | 5 (1.3%) | 5 (1.3%) |
| 6-Person Households | 41 (10.8%) | 0 (0.0%) |
| 7+ Person Households | 0 (0.0%) | 0 (0.0%) |
| Total | 268 (70.5%) | 112 (29.5%) |
Female Fertility in Clay
Fertility by Age in Clay
Average fertility rate in Clay is 138.0 births per 1,000 women. Women in the age bracket of 20 to 34 years have the highest fertility rate with 402.0 births per 1,000 women. Women in the age bracket of 20 to 34 years acount for 100.0% of all women with births.
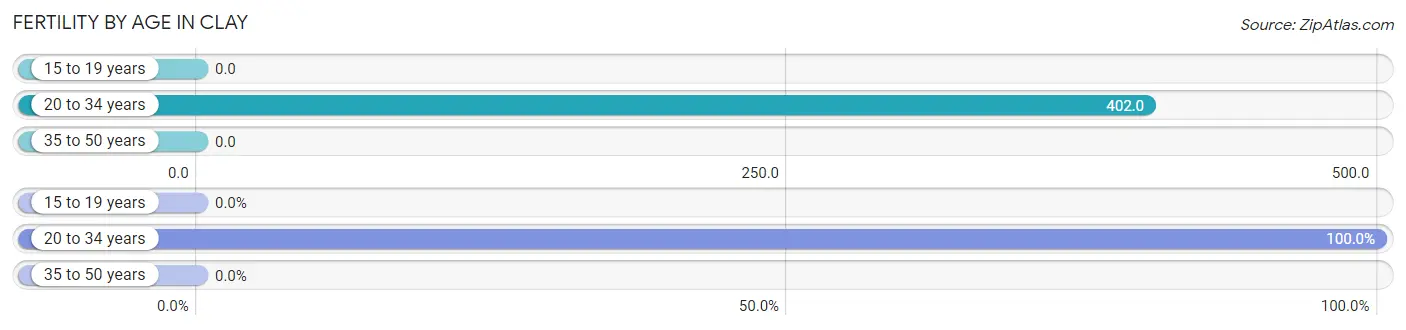
| Age Bracket | Women with Births | Births / 1,000 Women |
| 15 to 19 years | 0 (0.0%) | 0.0 |
| 20 to 34 years | 41 (100.0%) | 402.0 |
| 35 to 50 years | 0 (0.0%) | 0.0 |
| Total | 41 (100.0%) | 138.0 |
Fertility by Age by Marriage Status in Clay
39.0% of women with births (41) in Clay are married. The highest percentage of unmarried women with births falls into 20 to 34 years age bracket with 61.0% of them unmarried at the time of birth, while the lowest percentage of unmarried women with births belong to 20 to 34 years age bracket with 61.0% of them unmarried.
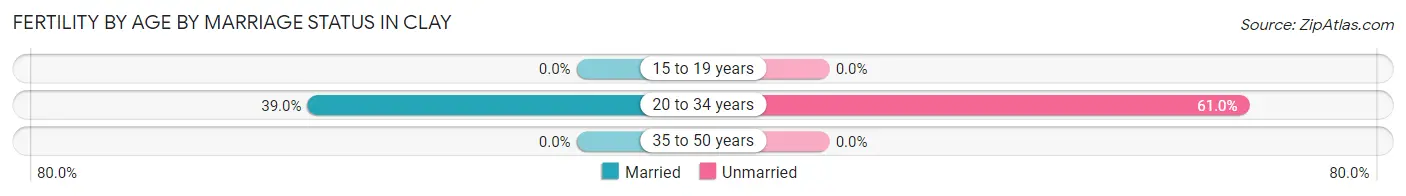
| Age Bracket | Married | Unmarried |
| 15 to 19 years | 0 (0.0%) | 0 (0.0%) |
| 20 to 34 years | 16 (39.0%) | 25 (61.0%) |
| 35 to 50 years | 0 (0.0%) | 0 (0.0%) |
| Total | 16 (39.0%) | 25 (61.0%) |
Fertility by Education in Clay
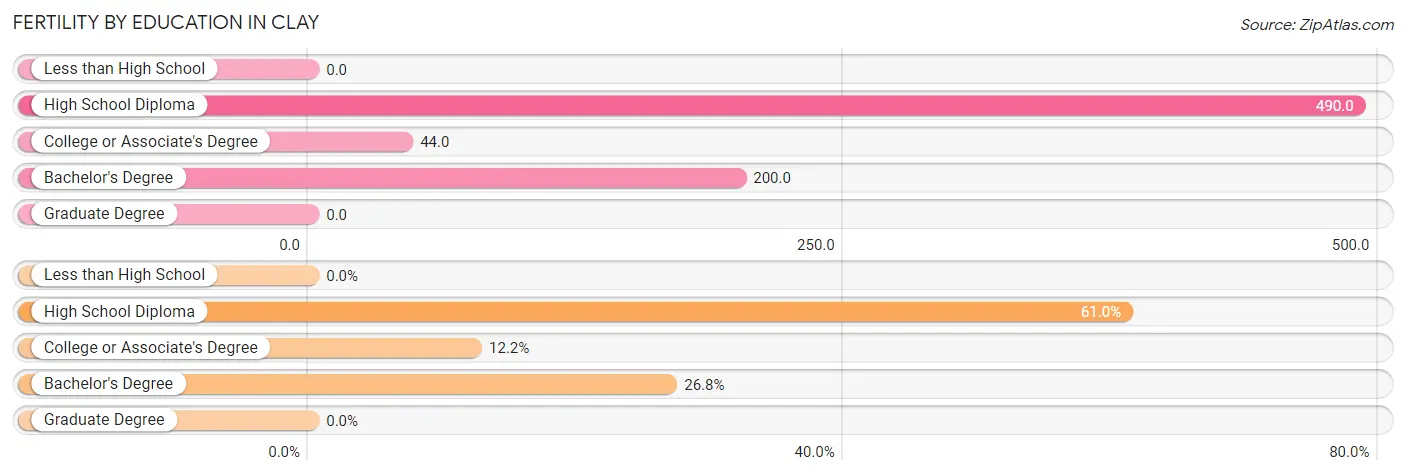
| Educational Attainment | Women with Births | Births / 1,000 Women |
| Less than High School | 0 (0.0%) | 0.0 |
| High School Diploma | 25 (61.0%) | 490.0 |
| College or Associate's Degree | 5 (12.2%) | 44.0 |
| Bachelor's Degree | 11 (26.8%) | 200.0 |
| Graduate Degree | 0 (0.0%) | 0.0 |
| Total | 41 (100.0%) | 138.0 |
Fertility by Education by Marriage Status in Clay
61.0% of women with births in Clay are unmarried. Women with the educational attainment of college or associate's degree are most likely to be married with 100.0% of them married at childbirth, while women with the educational attainment of high school diploma are least likely to be married with 100.0% of them unmarried at childbirth.
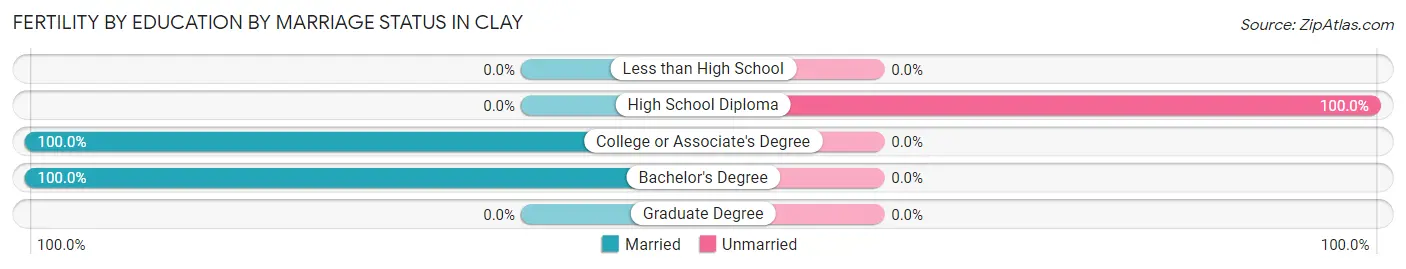
| Educational Attainment | Married | Unmarried |
| Less than High School | 0 (0.0%) | 0 (0.0%) |
| High School Diploma | 0 (0.0%) | 25 (100.0%) |
| College or Associate's Degree | 5 (100.0%) | 0 (0.0%) |
| Bachelor's Degree | 11 (100.0%) | 0 (0.0%) |
| Graduate Degree | 0 (0.0%) | 0 (0.0%) |
| Total | 16 (39.0%) | 25 (61.0%) |
Income in Clay
Income Overview in Clay
Per Capita Income in Clay is $42,689, while median incomes of families and households are $137,250 and $118,000 respectively.
| Characteristic | Number | Measure |
| Per Capita Income | 1,121 | $42,689 |
| Median Family Income | 268 | $137,250 |
| Mean Family Income | 268 | $134,803 |
| Median Household Income | 380 | $118,000 |
| Mean Household Income | 380 | $125,026 |
| Income Deficit | 268 | $0 |
| Wage / Income Gap (%) | 1,121 | 41.38% |
| Wage / Income Gap ($) | 1,121 | 58.62¢ per $1 |
| Gini / Inequality Index | 1,121 | 0.33 |
Earnings by Sex in Clay
Average Earnings in Clay are $48,750, $70,313 for men and $41,217 for women, a difference of 41.4%.
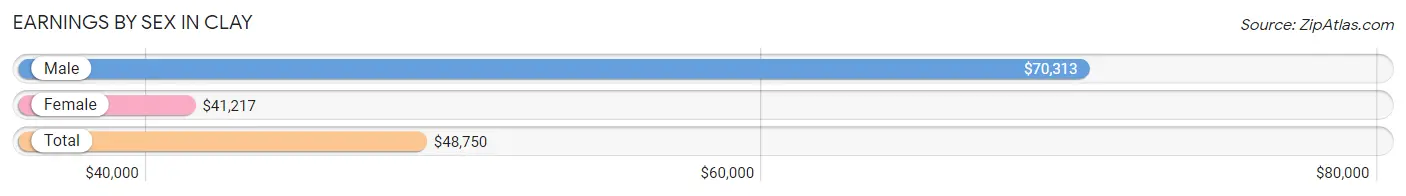
| Sex | Number | Average Earnings |
| Male | 285 (57.9%) | $70,313 |
| Female | 207 (42.1%) | $41,217 |
| Total | 492 (100.0%) | $48,750 |
Earnings by Sex by Income Bracket in Clay
The most common earnings brackets in Clay are $100,000+ for men (82 | 28.8%) and $100,000+ for women (48 | 23.2%).
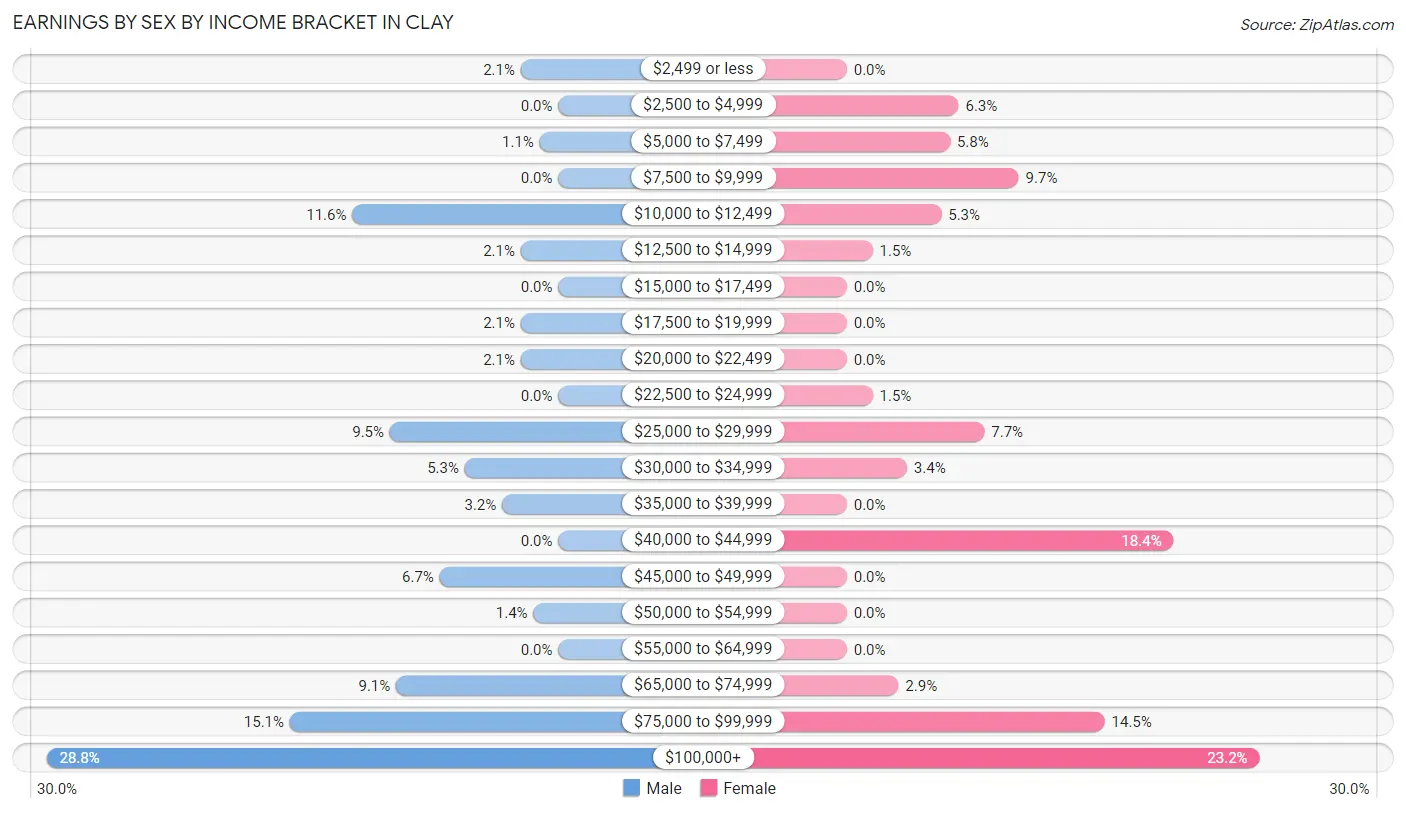
| Income | Male | Female |
| $2,499 or less | 6 (2.1%) | 0 (0.0%) |
| $2,500 to $4,999 | 0 (0.0%) | 13 (6.3%) |
| $5,000 to $7,499 | 3 (1.1%) | 12 (5.8%) |
| $7,500 to $9,999 | 0 (0.0%) | 20 (9.7%) |
| $10,000 to $12,499 | 33 (11.6%) | 11 (5.3%) |
| $12,500 to $14,999 | 6 (2.1%) | 3 (1.5%) |
| $15,000 to $17,499 | 0 (0.0%) | 0 (0.0%) |
| $17,500 to $19,999 | 6 (2.1%) | 0 (0.0%) |
| $20,000 to $22,499 | 6 (2.1%) | 0 (0.0%) |
| $22,500 to $24,999 | 0 (0.0%) | 3 (1.5%) |
| $25,000 to $29,999 | 27 (9.5%) | 16 (7.7%) |
| $30,000 to $34,999 | 15 (5.3%) | 7 (3.4%) |
| $35,000 to $39,999 | 9 (3.2%) | 0 (0.0%) |
| $40,000 to $44,999 | 0 (0.0%) | 38 (18.4%) |
| $45,000 to $49,999 | 19 (6.7%) | 0 (0.0%) |
| $50,000 to $54,999 | 4 (1.4%) | 0 (0.0%) |
| $55,000 to $64,999 | 0 (0.0%) | 0 (0.0%) |
| $65,000 to $74,999 | 26 (9.1%) | 6 (2.9%) |
| $75,000 to $99,999 | 43 (15.1%) | 30 (14.5%) |
| $100,000+ | 82 (28.8%) | 48 (23.2%) |
| Total | 285 (100.0%) | 207 (100.0%) |
Earnings by Sex by Educational Attainment in Clay
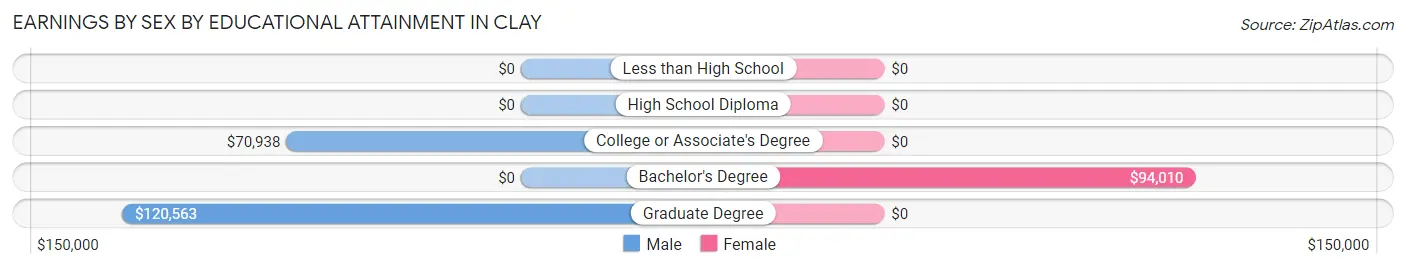
| Educational Attainment | Male Income | Female Income |
| Less than High School | - | - |
| High School Diploma | - | - |
| College or Associate's Degree | $70,938 | $0 |
| Bachelor's Degree | - | - |
| Graduate Degree | $120,563 | $0 |
| Total | $83,438 | $0 |
Family Income in Clay
Family Income Brackets in Clay
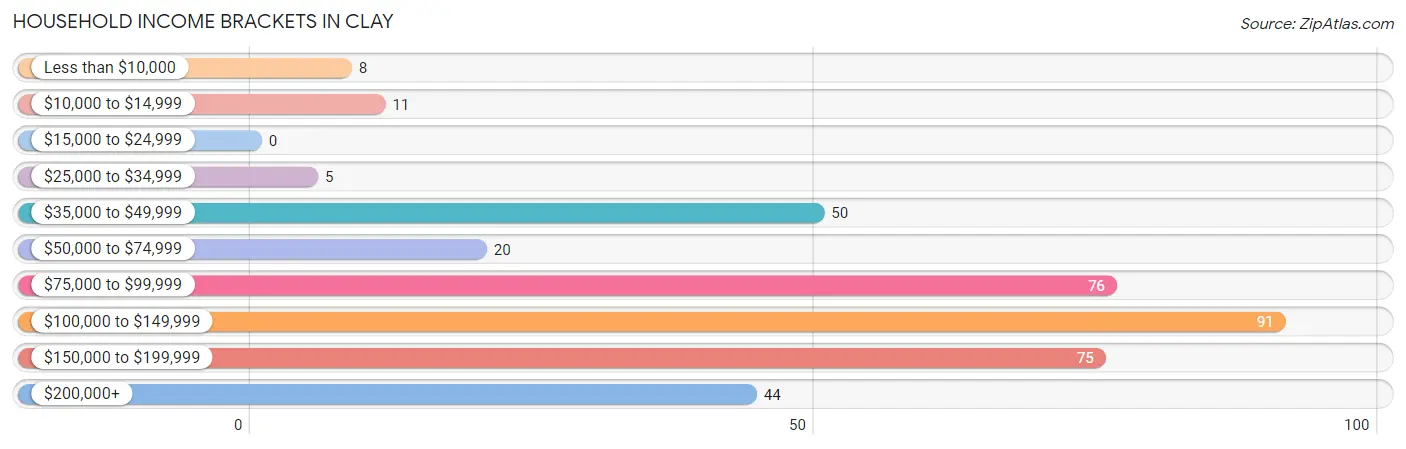
According to the Clay family income data, there are 98 families falling into the $100,000 to $149,999 income range, which is the most common income bracket and makes up 36.6% of all families.
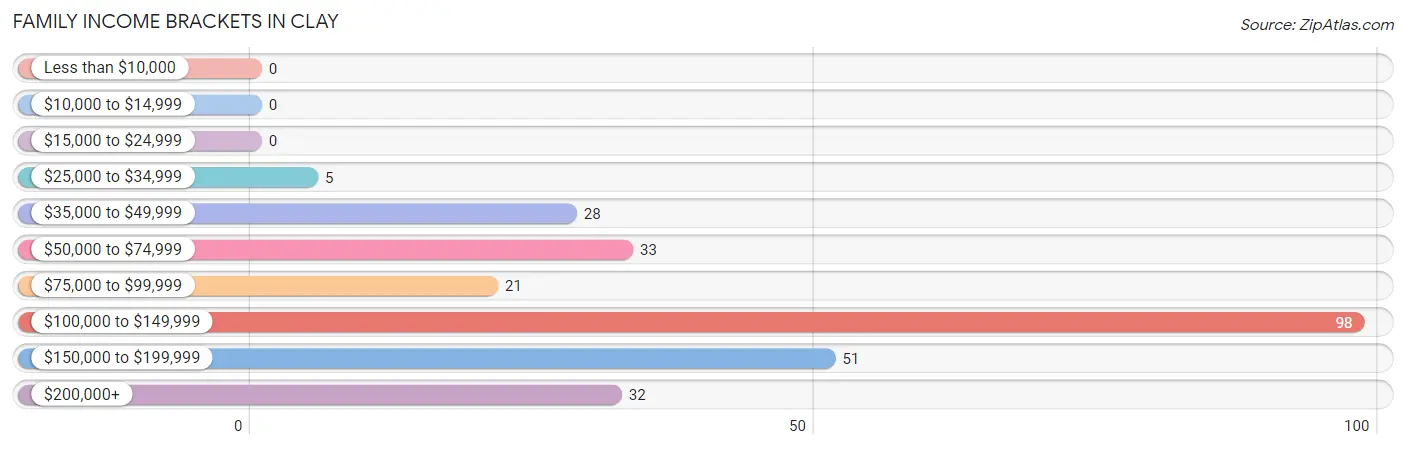
| Income Bracket | # Families | % Families |
| Less than $10,000 | 0 | 0.0% |
| $10,000 to $14,999 | 0 | 0.0% |
| $15,000 to $24,999 | 0 | 0.0% |
| $25,000 to $34,999 | 5 | 1.9% |
| $35,000 to $49,999 | 28 | 10.4% |
| $50,000 to $74,999 | 33 | 12.3% |
| $75,000 to $99,999 | 21 | 7.8% |
| $100,000 to $149,999 | 98 | 36.6% |
| $150,000 to $199,999 | 51 | 19.0% |
| $200,000+ | 32 | 11.9% |
Family Income by Famaliy Size in Clay
4-person families (104 | 38.8%) account for the highest median family income in Clay with $161,250 per family, while 3-person families (76 | 28.4%) have the highest median income of $46,080 per family member.
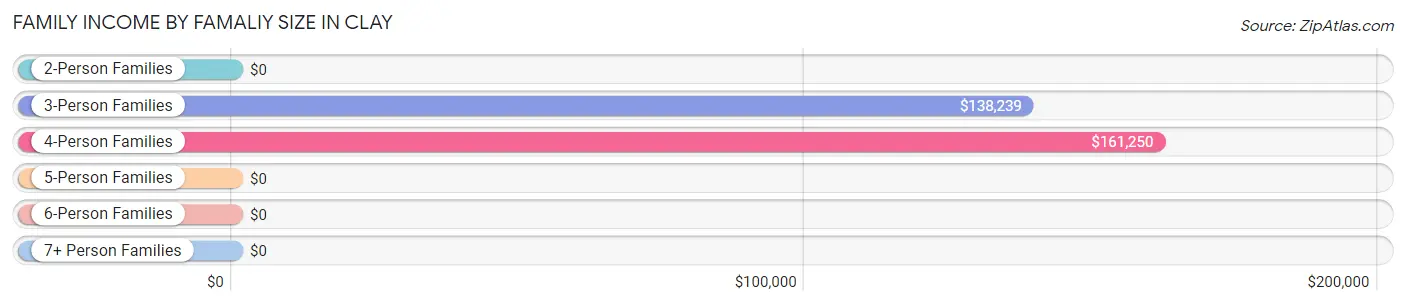
| Income Bracket | # Families | Median Income |
| 2-Person Families | 67 (25.0%) | $0 |
| 3-Person Families | 76 (28.4%) | $138,239 |
| 4-Person Families | 104 (38.8%) | $161,250 |
| 5-Person Families | 7 (2.6%) | $0 |
| 6-Person Families | 14 (5.2%) | $0 |
| 7+ Person Families | 0 (0.0%) | $0 |
| Total | 268 (100.0%) | $137,250 |
Family Income by Number of Earners in Clay
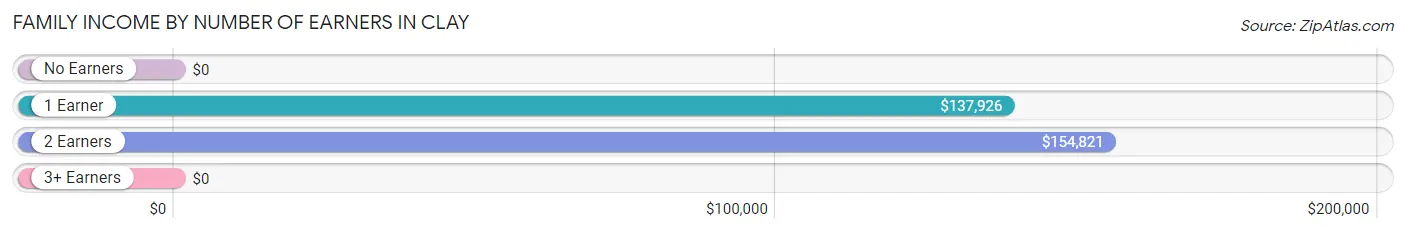
| Number of Earners | # Families | Median Income |
| No Earners | 40 (14.9%) | $0 |
| 1 Earner | 103 (38.4%) | $137,926 |
| 2 Earners | 89 (33.2%) | $154,821 |
| 3+ Earners | 36 (13.4%) | $0 |
| Total | 268 (100.0%) | $137,250 |
Household Income in Clay
Household Income Brackets in Clay
With 91 households falling in the category, the $100,000 to $149,999 income range is the most frequent in Clay, accounting for 23.9% of all households.
| Income Bracket | # Households | % Households |
| Less than $10,000 | 8 | 2.1% |
| $10,000 to $14,999 | 11 | 2.9% |
| $15,000 to $24,999 | 0 | 0.0% |
| $25,000 to $34,999 | 5 | 1.3% |
| $35,000 to $49,999 | 50 | 13.2% |
| $50,000 to $74,999 | 20 | 5.3% |
| $75,000 to $99,999 | 76 | 20.0% |
| $100,000 to $149,999 | 91 | 23.9% |
| $150,000 to $199,999 | 75 | 19.7% |
| $200,000+ | 44 | 11.6% |
Household Income by Householder Age in Clay
The median household income in Clay is $118,000, with the highest median household income of $138,324 found in the 25 to 44 years age bracket for the primary householder. A total of 119 households (31.3%) fall into this category. Meanwhile, the 15 to 24 years age bracket for the primary householder has the lowest median household income of $0, with 4 households (1.1%) in this group.
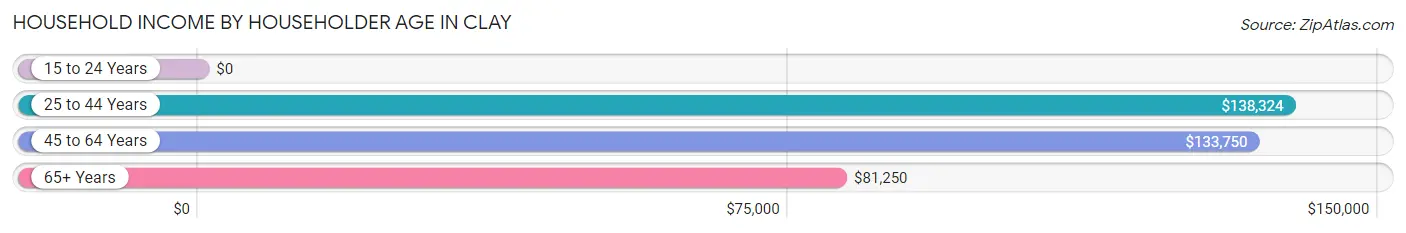
| Income Bracket | # Households | Median Income |
| 15 to 24 Years | 4 (1.1%) | $0 |
| 25 to 44 Years | 119 (31.3%) | $138,324 |
| 45 to 64 Years | 143 (37.6%) | $133,750 |
| 65+ Years | 114 (30.0%) | $81,250 |
| Total | 380 (100.0%) | $118,000 |
Poverty in Clay
Income Below Poverty by Sex and Age in Clay
With 2.6% poverty level for males and 8.5% for females among the residents of Clay, 45 to 54 year old males and 25 to 34 year old females are the most vulnerable to poverty, with 6 males (9.8%) and 25 females (32.1%) in their respective age groups living below the poverty level.
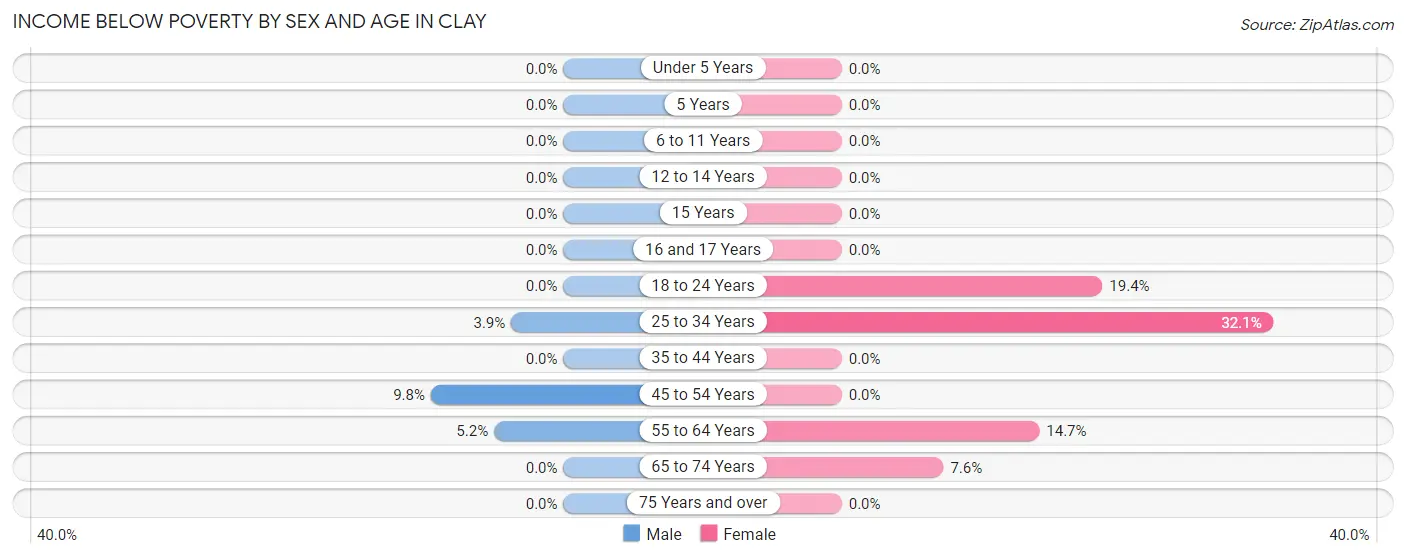
| Age Bracket | Male | Female |
| Under 5 Years | 0 (0.0%) | 0 (0.0%) |
| 5 Years | 0 (0.0%) | 0 (0.0%) |
| 6 to 11 Years | 0 (0.0%) | 0 (0.0%) |
| 12 to 14 Years | 0 (0.0%) | 0 (0.0%) |
| 15 Years | 0 (0.0%) | 0 (0.0%) |
| 16 and 17 Years | 0 (0.0%) | 0 (0.0%) |
| 18 to 24 Years | 0 (0.0%) | 6 (19.4%) |
| 25 to 34 Years | 4 (3.9%) | 25 (32.1%) |
| 35 to 44 Years | 0 (0.0%) | 0 (0.0%) |
| 45 to 54 Years | 6 (9.8%) | 0 (0.0%) |
| 55 to 64 Years | 5 (5.1%) | 11 (14.7%) |
| 65 to 74 Years | 0 (0.0%) | 4 (7.5%) |
| 75 Years and over | 0 (0.0%) | 0 (0.0%) |
| Total | 15 (2.6%) | 46 (8.5%) |
Income Above Poverty by Sex and Age in Clay
According to the poverty statistics in Clay, males aged under 5 years and females aged under 5 years are the age groups that are most secure financially, with 100.0% of males and 100.0% of females in these age groups living above the poverty line.
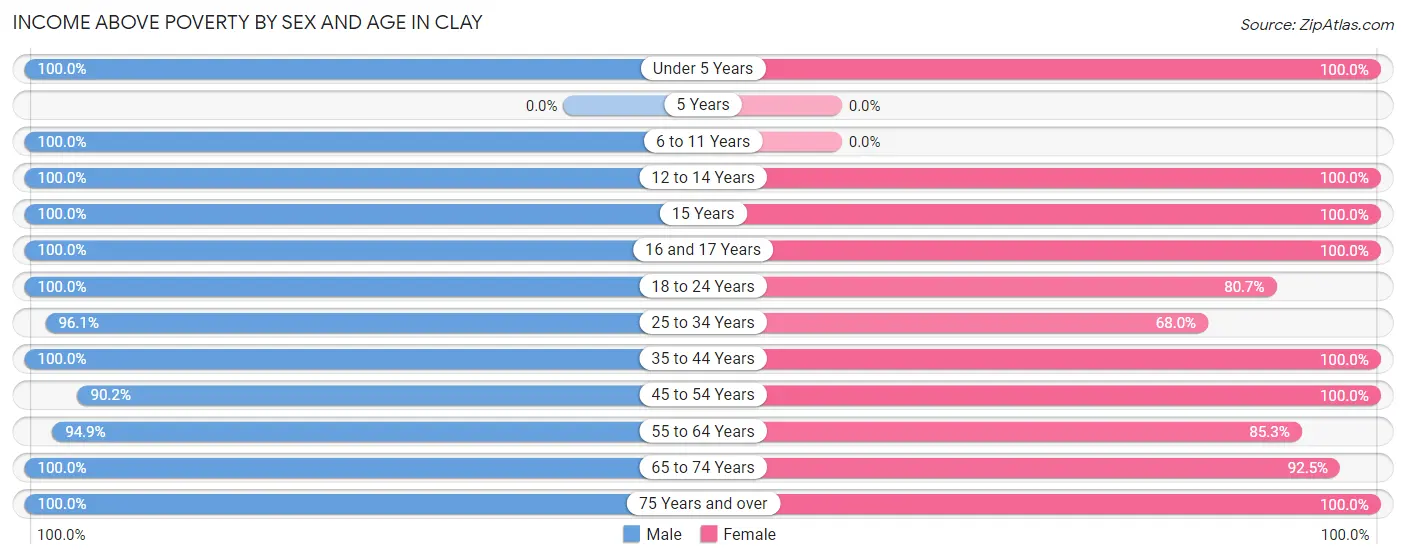
| Age Bracket | Male | Female |
| Under 5 Years | 12 (100.0%) | 48 (100.0%) |
| 5 Years | 0 (0.0%) | 0 (0.0%) |
| 6 to 11 Years | 35 (100.0%) | 0 (0.0%) |
| 12 to 14 Years | 18 (100.0%) | 12 (100.0%) |
| 15 Years | 9 (100.0%) | 34 (100.0%) |
| 16 and 17 Years | 18 (100.0%) | 20 (100.0%) |
| 18 to 24 Years | 67 (100.0%) | 25 (80.6%) |
| 25 to 34 Years | 99 (96.1%) | 53 (67.9%) |
| 35 to 44 Years | 69 (100.0%) | 93 (100.0%) |
| 45 to 54 Years | 55 (90.2%) | 51 (100.0%) |
| 55 to 64 Years | 92 (94.9%) | 64 (85.3%) |
| 65 to 74 Years | 29 (100.0%) | 49 (92.4%) |
| 75 Years and over | 53 (100.0%) | 46 (100.0%) |
| Total | 556 (97.4%) | 495 (91.5%) |
Income Below Poverty Among Married-Couple Families in Clay
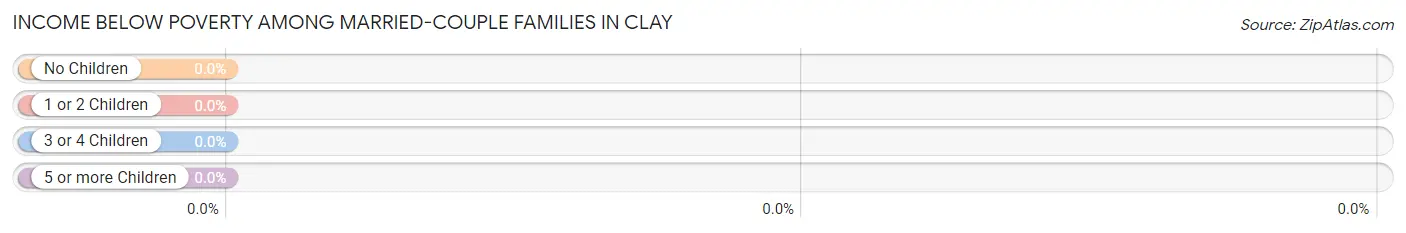
| Children | Above Poverty | Below Poverty |
| No Children | 113 (100.0%) | 0 (0.0%) |
| 1 or 2 Children | 81 (100.0%) | 0 (0.0%) |
| 3 or 4 Children | 14 (100.0%) | 0 (0.0%) |
| 5 or more Children | 0 (0.0%) | 0 (0.0%) |
| Total | 208 (100.0%) | 0 (0.0%) |
Income Below Poverty Among Single-Parent Households in Clay
| Children | Single Father | Single Mother |
| No Children | 0 (0.0%) | 0 (0.0%) |
| 1 or 2 Children | 0 (0.0%) | 0 (0.0%) |
| 3 or 4 Children | 0 (0.0%) | 0 (0.0%) |
| 5 or more Children | 0 (0.0%) | 0 (0.0%) |
| Total | 0 (0.0%) | 0 (0.0%) |
Income Below Poverty Among Married-Couple vs Single-Parent Households in Clay
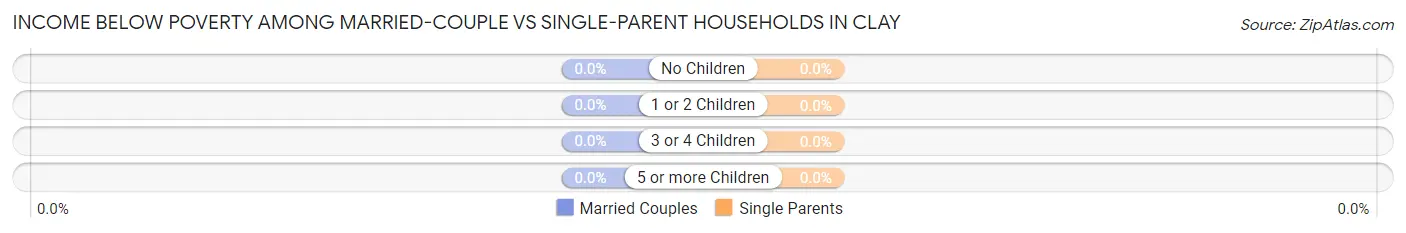
| Children | Married-Couple Families | Single-Parent Households |
| No Children | 0 (0.0%) | 0 (0.0%) |
| 1 or 2 Children | 0 (0.0%) | 0 (0.0%) |
| 3 or 4 Children | 0 (0.0%) | 0 (0.0%) |
| 5 or more Children | 0 (0.0%) | 0 (0.0%) |
| Total | 0 (0.0%) | 0 (0.0%) |
Employment Characteristics in Clay
Employment by Class of Employer in Clay
Among the 462 employed individuals in Clay, private company employees (197 | 42.6%), state government employees (73 | 15.8%), and self-employed (not incorporated) (47 | 10.2%) make up the most common classes of employment.
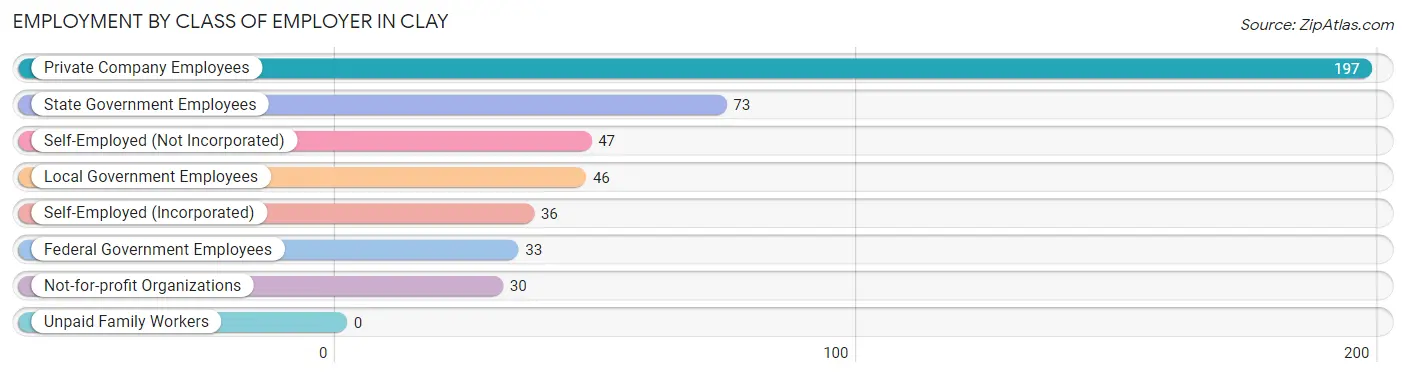
| Employer Class | # Employees | % Employees |
| Private Company Employees | 197 | 42.6% |
| Self-Employed (Incorporated) | 36 | 7.8% |
| Self-Employed (Not Incorporated) | 47 | 10.2% |
| Not-for-profit Organizations | 30 | 6.5% |
| Local Government Employees | 46 | 10.0% |
| State Government Employees | 73 | 15.8% |
| Federal Government Employees | 33 | 7.1% |
| Unpaid Family Workers | 0 | 0.0% |
| Total | 462 | 100.0% |
Employment Status by Age in Clay
According to the labor force statistics for Clay, out of the total population over 16 years of age (944), 53.6% or 506 individuals are in the labor force, with 7.7% or 39 of them unemployed. The age group with the highest labor force participation rate is 55 to 59 years, with 85.5% or 59 individuals in the labor force. Within the labor force, the 60 to 64 years age range has the highest percentage of unemployed individuals, with 78.6% or 22 of them being unemployed.
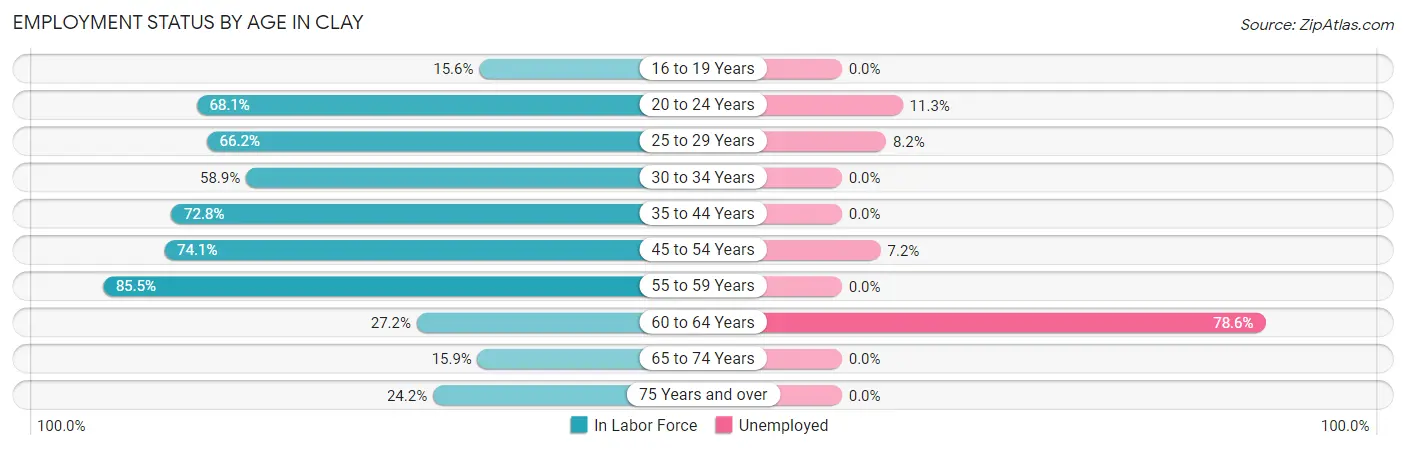
| Age Bracket | In Labor Force | Unemployed |
| 16 to 19 Years | 7 (15.6%) | 0 (0.0%) |
| 20 to 24 Years | 62 (68.1%) | 7 (11.3%) |
| 25 to 29 Years | 49 (66.2%) | 4 (8.2%) |
| 30 to 34 Years | 63 (58.9%) | 0 (0.0%) |
| 35 to 44 Years | 118 (72.8%) | 0 (0.0%) |
| 45 to 54 Years | 83 (74.1%) | 6 (7.2%) |
| 55 to 59 Years | 59 (85.5%) | 0 (0.0%) |
| 60 to 64 Years | 28 (27.2%) | 22 (78.6%) |
| 65 to 74 Years | 13 (15.9%) | 0 (0.0%) |
| 75 Years and over | 24 (24.2%) | 0 (0.0%) |
| Total | 506 (53.6%) | 39 (7.7%) |
Employment Status by Educational Attainment in Clay
According to labor force statistics for Clay, 63.8% of individuals (400) out of the total population between 25 and 64 years of age (627) are in the labor force, with 8.0% or 32 of them being unemployed. The group with the highest labor force participation rate are those with the educational attainment of bachelor's degree or higher, with 89.6% or 112 individuals in the labor force. Within the labor force, individuals with less than high school education have the highest percentage of unemployment, with 40.0% or 4 of them being unemployed.
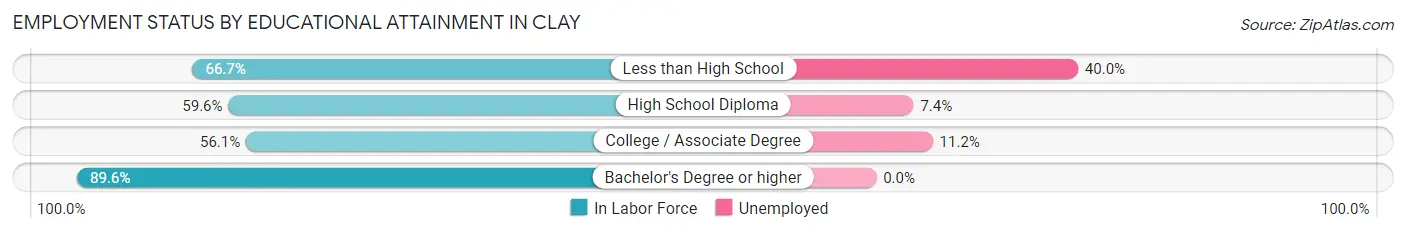
| Educational Attainment | In Labor Force | Unemployed |
| Less than High School | 10 (66.7%) | 6 (40.0%) |
| High School Diploma | 81 (59.6%) | 10 (7.4%) |
| College / Associate Degree | 197 (56.1%) | 39 (11.2%) |
| Bachelor's Degree or higher | 112 (89.6%) | 0 (0.0%) |
| Total | 400 (63.8%) | 50 (8.0%) |
Employment Occupations by Sex in Clay
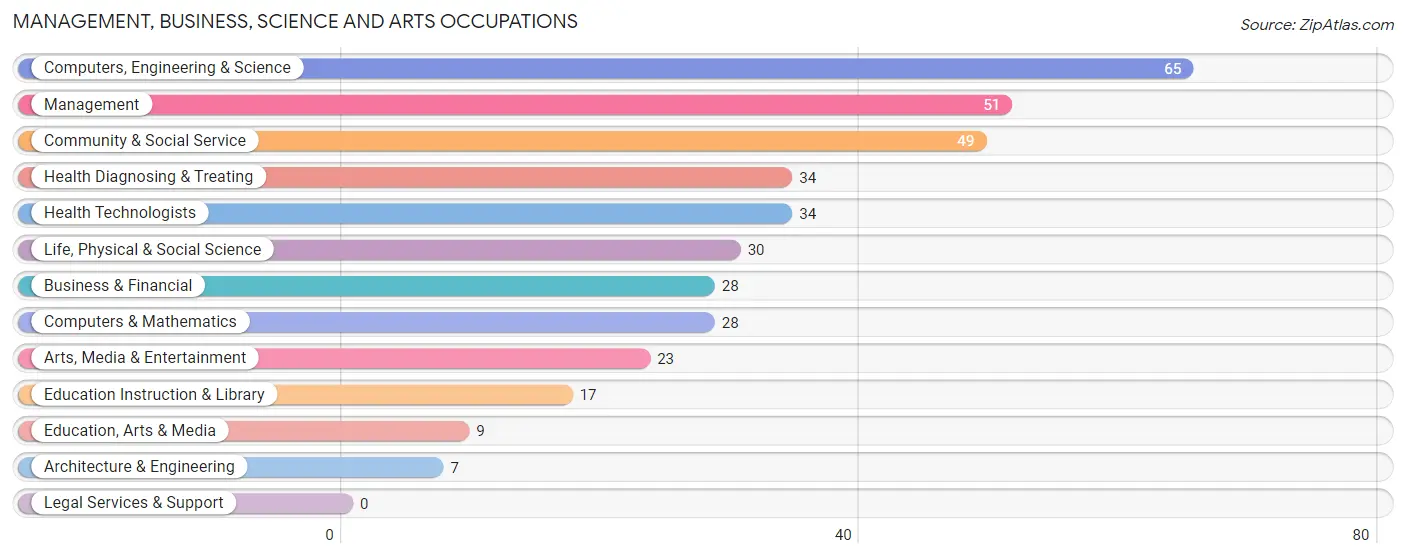
Management, Business, Science and Arts Occupations
The most common Management, Business, Science and Arts occupations in Clay are Computers, Engineering & Science (65 | 13.9%), Management (51 | 10.9%), Community & Social Service (49 | 10.5%), Health Diagnosing & Treating (34 | 7.3%), and Health Technologists (34 | 7.3%).
Management, Business, Science and Arts Occupations by Sex
Within the Management, Business, Science and Arts occupations in Clay, the most male-oriented occupations are Architecture & Engineering (100.0%), Education, Arts & Media (100.0%), and Arts, Media & Entertainment (100.0%), while the most female-oriented occupations are Life, Physical & Social Science (100.0%), Health Diagnosing & Treating (85.3%), and Health Technologists (85.3%).
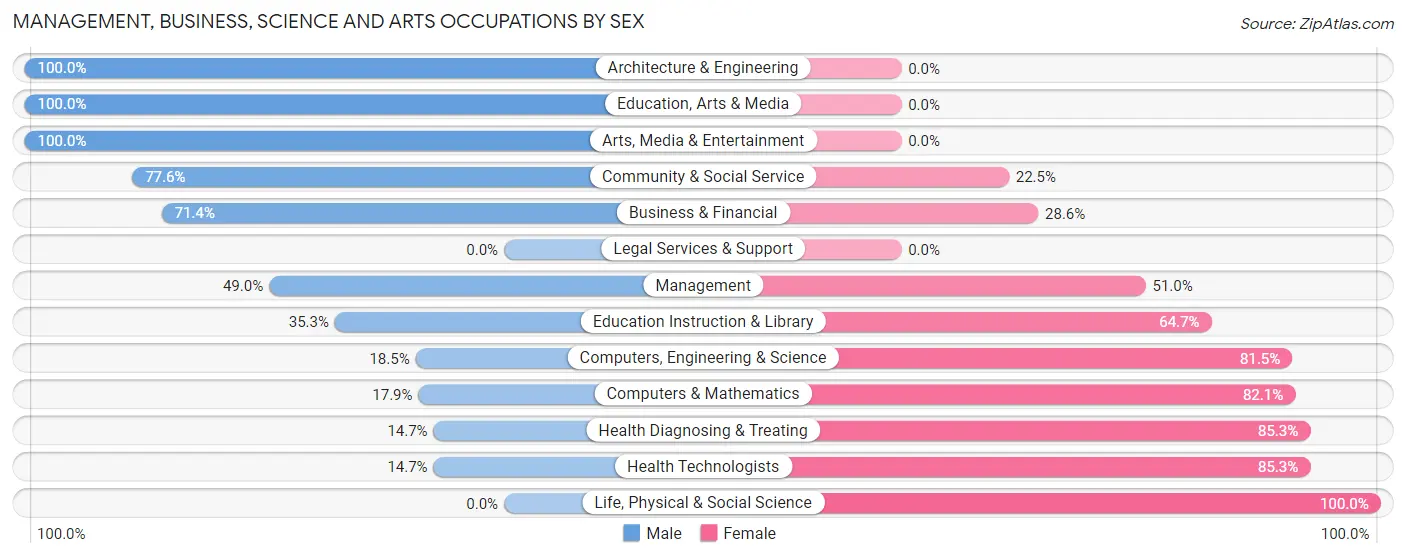
| Occupation | Male | Female |
| Management | 25 (49.0%) | 26 (51.0%) |
| Business & Financial | 20 (71.4%) | 8 (28.6%) |
| Computers, Engineering & Science | 12 (18.5%) | 53 (81.5%) |
| Computers & Mathematics | 5 (17.9%) | 23 (82.1%) |
| Architecture & Engineering | 7 (100.0%) | 0 (0.0%) |
| Life, Physical & Social Science | 0 (0.0%) | 30 (100.0%) |
| Community & Social Service | 38 (77.5%) | 11 (22.5%) |
| Education, Arts & Media | 9 (100.0%) | 0 (0.0%) |
| Legal Services & Support | 0 (0.0%) | 0 (0.0%) |
| Education Instruction & Library | 6 (35.3%) | 11 (64.7%) |
| Arts, Media & Entertainment | 23 (100.0%) | 0 (0.0%) |
| Health Diagnosing & Treating | 5 (14.7%) | 29 (85.3%) |
| Health Technologists | 5 (14.7%) | 29 (85.3%) |
| Total (Category) | 100 (44.1%) | 127 (55.9%) |
| Total (Overall) | 267 (57.2%) | 200 (42.8%) |
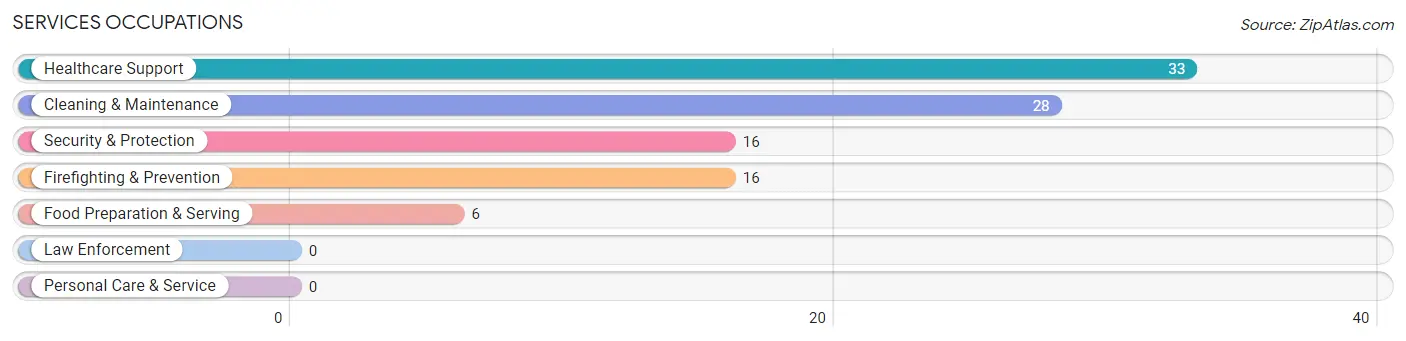
Services Occupations
The most common Services occupations in Clay are Healthcare Support (33 | 7.1%), Cleaning & Maintenance (28 | 6.0%), Security & Protection (16 | 3.4%), Firefighting & Prevention (16 | 3.4%), and Food Preparation & Serving (6 | 1.3%).
Services Occupations by Sex
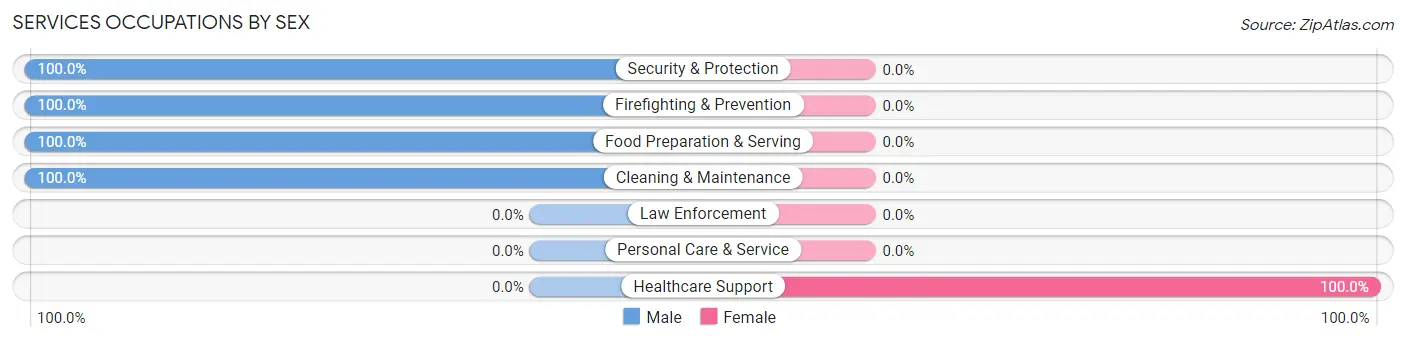
| Occupation | Male | Female |
| Healthcare Support | 0 (0.0%) | 33 (100.0%) |
| Security & Protection | 16 (100.0%) | 0 (0.0%) |
| Firefighting & Prevention | 16 (100.0%) | 0 (0.0%) |
| Law Enforcement | 0 (0.0%) | 0 (0.0%) |
| Food Preparation & Serving | 6 (100.0%) | 0 (0.0%) |
| Cleaning & Maintenance | 28 (100.0%) | 0 (0.0%) |
| Personal Care & Service | 0 (0.0%) | 0 (0.0%) |
| Total (Category) | 50 (60.2%) | 33 (39.8%) |
| Total (Overall) | 267 (57.2%) | 200 (42.8%) |
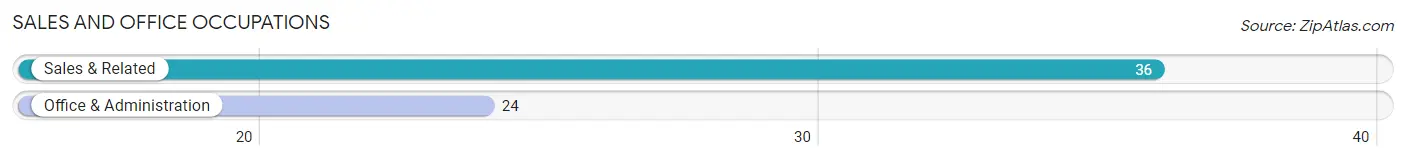
Sales and Office Occupations
The most common Sales and Office occupations in Clay are Sales & Related (36 | 7.7%), and Office & Administration (24 | 5.1%).
Sales and Office Occupations by Sex
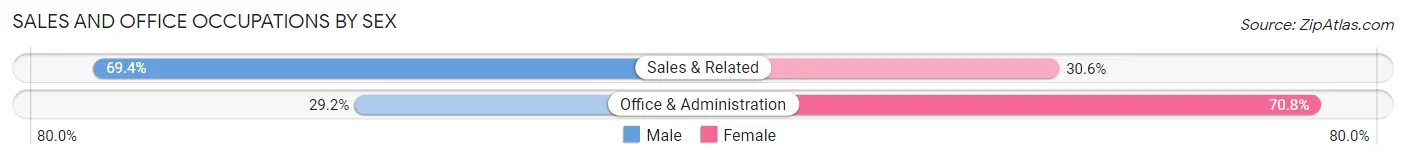
| Occupation | Male | Female |
| Sales & Related | 25 (69.4%) | 11 (30.6%) |
| Office & Administration | 7 (29.2%) | 17 (70.8%) |
| Total (Category) | 32 (53.3%) | 28 (46.7%) |
| Total (Overall) | 267 (57.2%) | 200 (42.8%) |
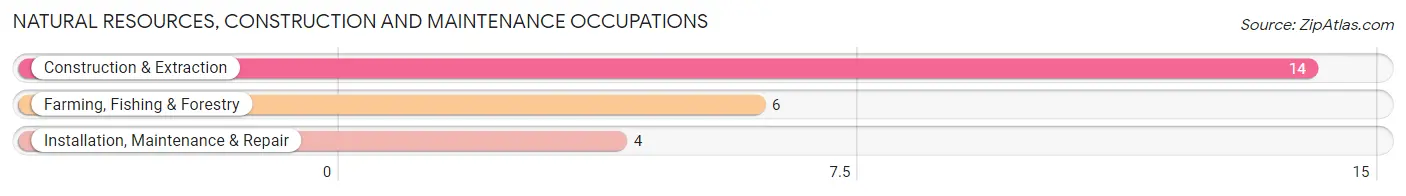
Natural Resources, Construction and Maintenance Occupations
The most common Natural Resources, Construction and Maintenance occupations in Clay are Construction & Extraction (14 | 3.0%), Farming, Fishing & Forestry (6 | 1.3%), and Installation, Maintenance & Repair (4 | 0.9%).
Natural Resources, Construction and Maintenance Occupations by Sex
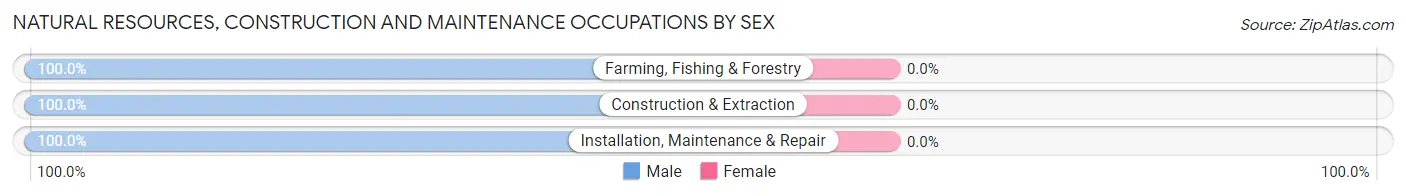
| Occupation | Male | Female |
| Farming, Fishing & Forestry | 6 (100.0%) | 0 (0.0%) |
| Construction & Extraction | 14 (100.0%) | 0 (0.0%) |
| Installation, Maintenance & Repair | 4 (100.0%) | 0 (0.0%) |
| Total (Category) | 24 (100.0%) | 0 (0.0%) |
| Total (Overall) | 267 (57.2%) | 200 (42.8%) |
Production, Transportation and Moving Occupations
The most common Production, Transportation and Moving occupations in Clay are Production (40 | 8.6%), Material Moving (17 | 3.6%), and Transportation (16 | 3.4%).
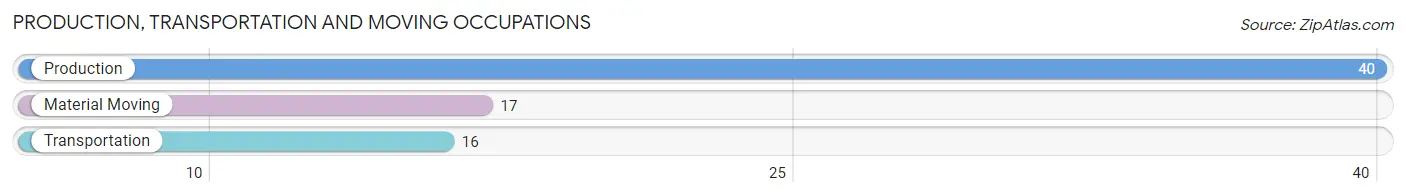
Production, Transportation and Moving Occupations by Sex
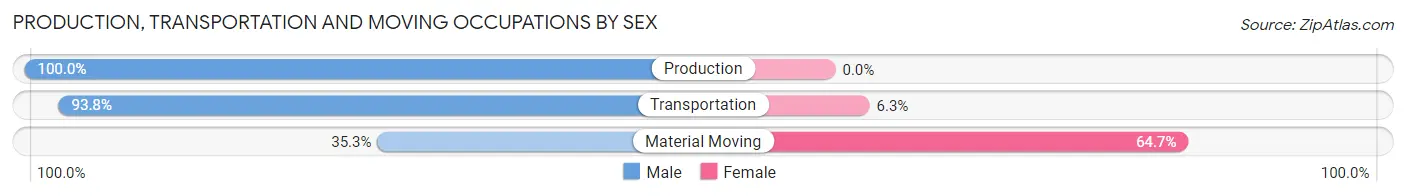
| Occupation | Male | Female |
| Production | 40 (100.0%) | 0 (0.0%) |
| Transportation | 15 (93.8%) | 1 (6.2%) |
| Material Moving | 6 (35.3%) | 11 (64.7%) |
| Total (Category) | 61 (83.6%) | 12 (16.4%) |
| Total (Overall) | 267 (57.2%) | 200 (42.8%) |
Employment Industries by Sex in Clay
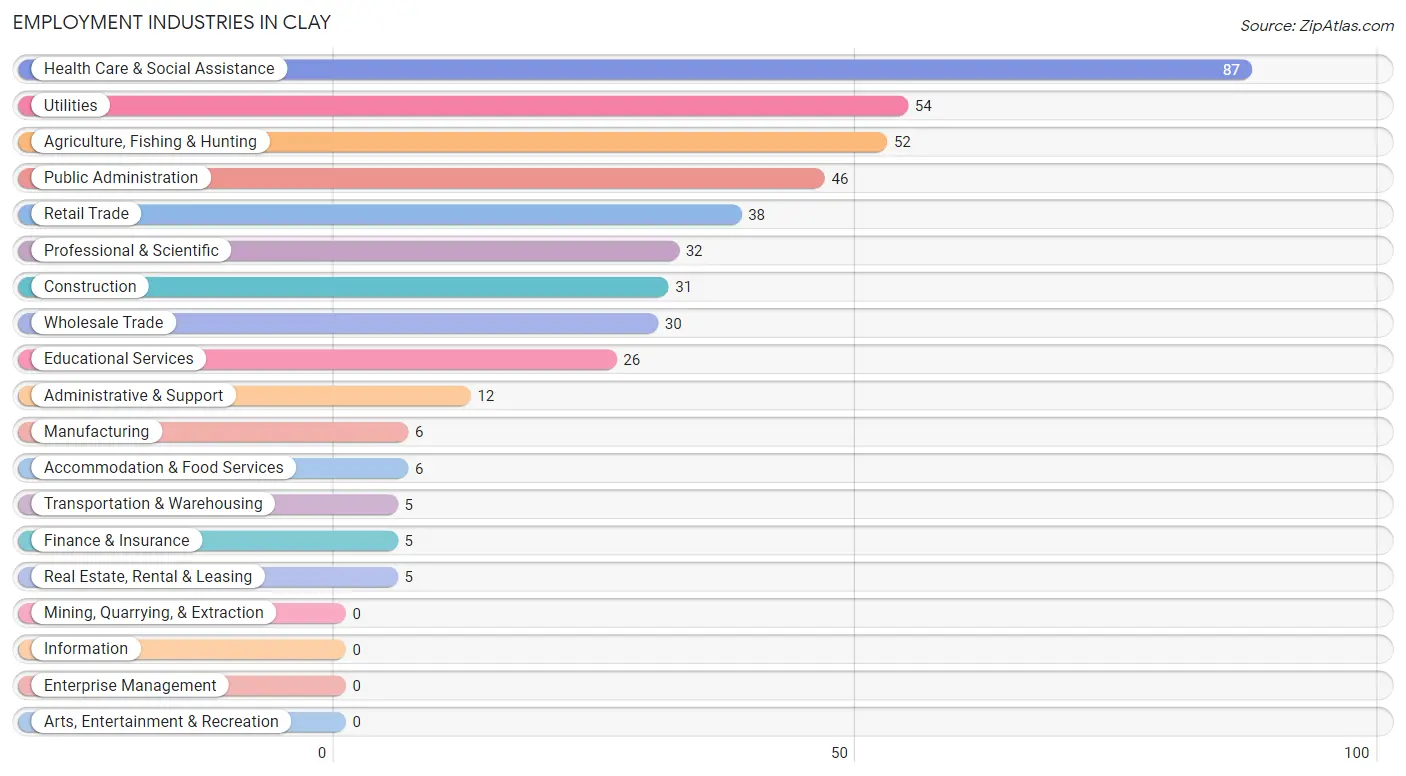
Employment Industries in Clay
The major employment industries in Clay include Health Care & Social Assistance (87 | 18.6%), Utilities (54 | 11.6%), Agriculture, Fishing & Hunting (52 | 11.1%), Public Administration (46 | 9.9%), and Retail Trade (38 | 8.1%).
Employment Industries by Sex in Clay
The Clay industries that see more men than women are Manufacturing (100.0%), Wholesale Trade (100.0%), and Transportation & Warehousing (100.0%), whereas the industries that tend to have a higher number of women are Real Estate, Rental & Leasing (100.0%), Professional & Scientific (78.1%), and Health Care & Social Assistance (71.3%).
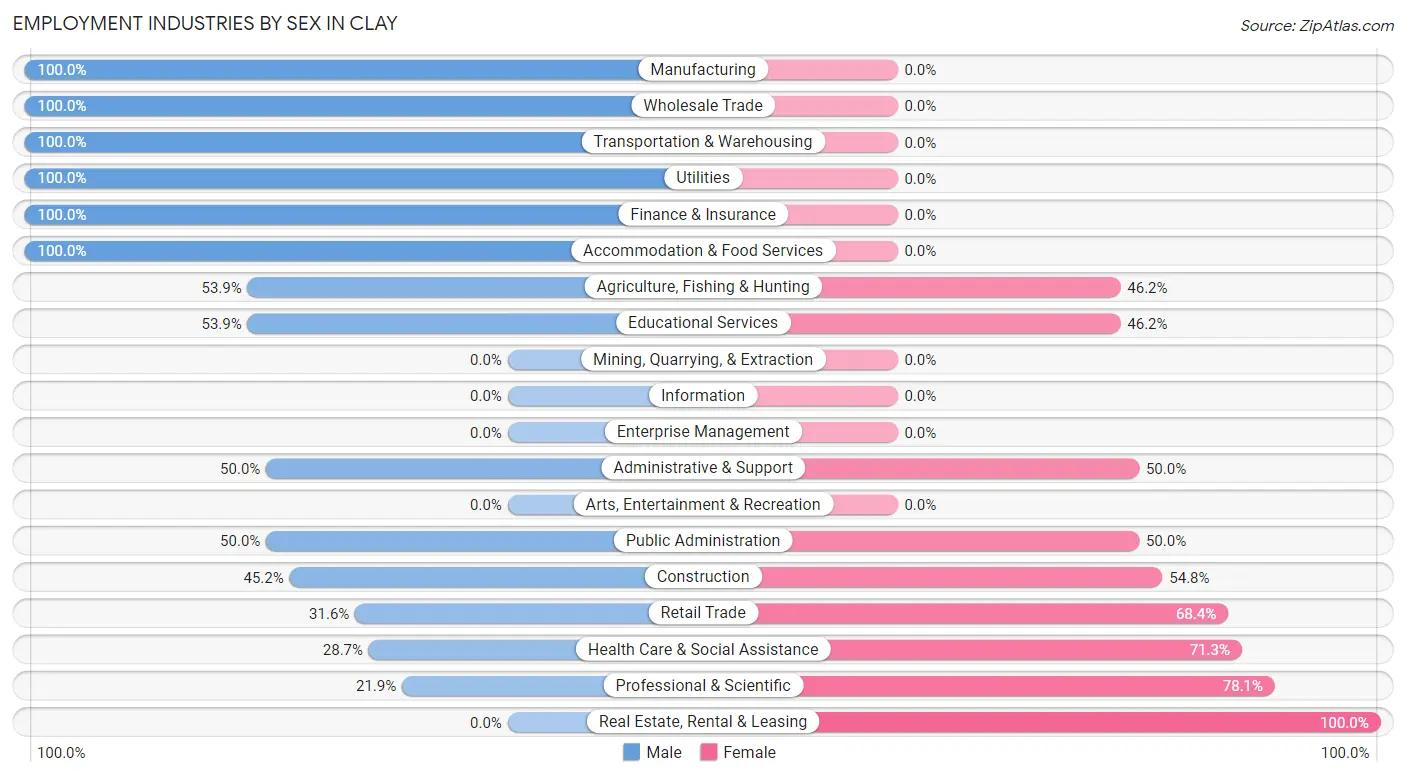
| Industry | Male | Female |
| Agriculture, Fishing & Hunting | 28 (53.8%) | 24 (46.2%) |
| Mining, Quarrying, & Extraction | 0 (0.0%) | 0 (0.0%) |
| Construction | 14 (45.2%) | 17 (54.8%) |
| Manufacturing | 6 (100.0%) | 0 (0.0%) |
| Wholesale Trade | 30 (100.0%) | 0 (0.0%) |
| Retail Trade | 12 (31.6%) | 26 (68.4%) |
| Transportation & Warehousing | 5 (100.0%) | 0 (0.0%) |
| Utilities | 54 (100.0%) | 0 (0.0%) |
| Information | 0 (0.0%) | 0 (0.0%) |
| Finance & Insurance | 5 (100.0%) | 0 (0.0%) |
| Real Estate, Rental & Leasing | 0 (0.0%) | 5 (100.0%) |
| Professional & Scientific | 7 (21.9%) | 25 (78.1%) |
| Enterprise Management | 0 (0.0%) | 0 (0.0%) |
| Administrative & Support | 6 (50.0%) | 6 (50.0%) |
| Educational Services | 14 (53.8%) | 12 (46.2%) |
| Health Care & Social Assistance | 25 (28.7%) | 62 (71.3%) |
| Arts, Entertainment & Recreation | 0 (0.0%) | 0 (0.0%) |
| Accommodation & Food Services | 6 (100.0%) | 0 (0.0%) |
| Public Administration | 23 (50.0%) | 23 (50.0%) |
| Total | 267 (57.2%) | 200 (42.8%) |
Education in Clay
School Enrollment in Clay
The most common levels of schooling among the 308 students in Clay are college / undergraduate (131 | 42.5%), high school (98 | 31.8%), and middle school (26 | 8.4%).
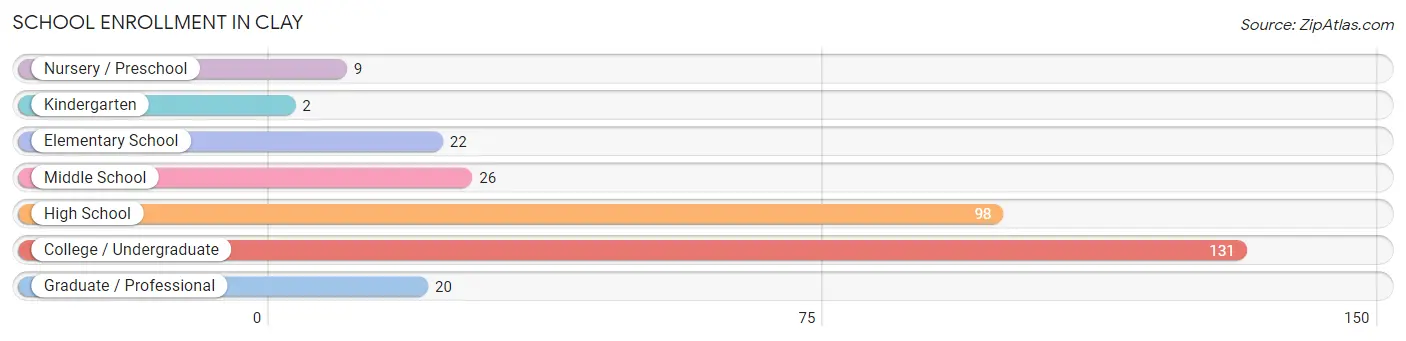
| School Level | # Students | % Students |
| Nursery / Preschool | 9 | 2.9% |
| Kindergarten | 2 | 0.6% |
| Elementary School | 22 | 7.1% |
| Middle School | 26 | 8.4% |
| High School | 98 | 31.8% |
| College / Undergraduate | 131 | 42.5% |
| Graduate / Professional | 20 | 6.5% |
| Total | 308 | 100.0% |
School Enrollment by Age by Funding Source in Clay
Out of a total of 308 students who are enrolled in schools in Clay, 54 (17.5%) attend a private institution, while the remaining 254 (82.5%) are enrolled in public schools. The age group of 35 years and over has the highest likelihood of being enrolled in private schools, with 41 (48.2% in the age bracket) enrolled. Conversely, the age group of 3 to 4 year olds has the lowest likelihood of being enrolled in a private school, with 6 (100.0% in the age bracket) attending a public institution.
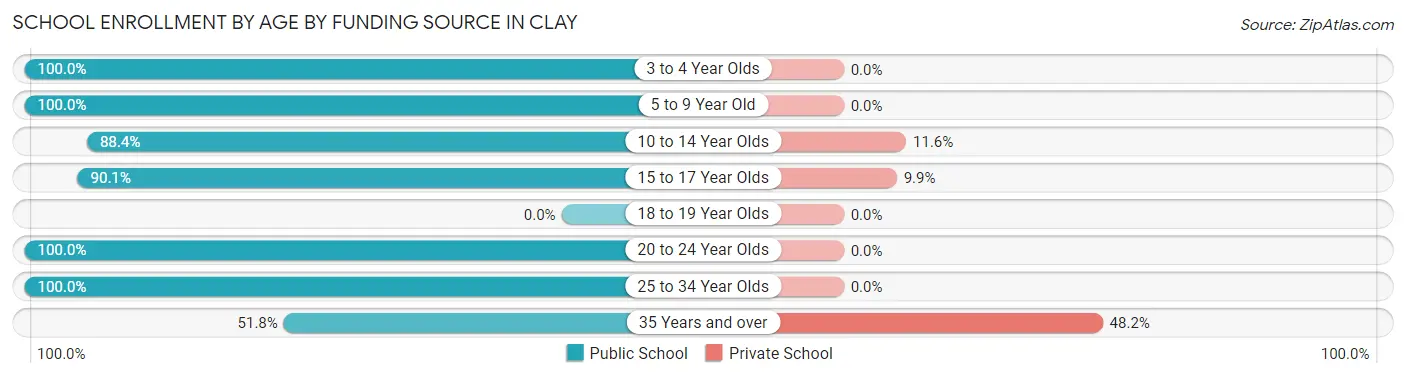
| Age Bracket | Public School | Private School |
| 3 to 4 Year Olds | 6 (100.0%) | 0 (0.0%) |
| 5 to 9 Year Old | 27 (100.0%) | 0 (0.0%) |
| 10 to 14 Year Olds | 38 (88.4%) | 5 (11.6%) |
| 15 to 17 Year Olds | 73 (90.1%) | 8 (9.9%) |
| 18 to 19 Year Olds | 0 (0.0%) | 0 (0.0%) |
| 20 to 24 Year Olds | 19 (100.0%) | 0 (0.0%) |
| 25 to 34 Year Olds | 47 (100.0%) | 0 (0.0%) |
| 35 Years and over | 44 (51.8%) | 41 (48.2%) |
| Total | 254 (82.5%) | 54 (17.5%) |
Educational Attainment by Field of Study in Clay
Science & technology (51 | 22.6%), bio, nature & agricultural (40 | 17.7%), education (39 | 17.3%), communications (31 | 13.7%), and multidisciplinary studies (13 | 5.8%) are the most common fields of study among 226 individuals in Clay who have obtained a bachelor's degree or higher.
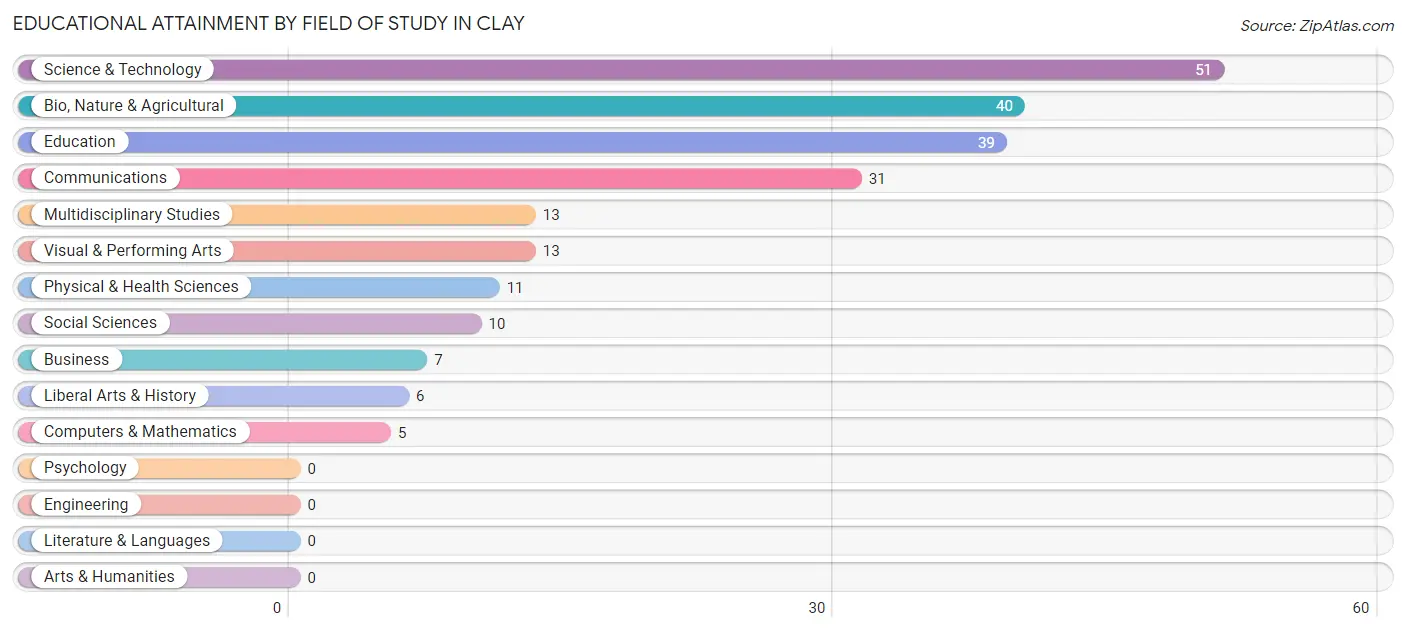
| Field of Study | # Graduates | % Graduates |
| Computers & Mathematics | 5 | 2.2% |
| Bio, Nature & Agricultural | 40 | 17.7% |
| Physical & Health Sciences | 11 | 4.9% |
| Psychology | 0 | 0.0% |
| Social Sciences | 10 | 4.4% |
| Engineering | 0 | 0.0% |
| Multidisciplinary Studies | 13 | 5.8% |
| Science & Technology | 51 | 22.6% |
| Business | 7 | 3.1% |
| Education | 39 | 17.3% |
| Literature & Languages | 0 | 0.0% |
| Liberal Arts & History | 6 | 2.6% |
| Visual & Performing Arts | 13 | 5.8% |
| Communications | 31 | 13.7% |
| Arts & Humanities | 0 | 0.0% |
| Total | 226 | 100.0% |
Transportation & Commute in Clay
Vehicle Availability by Sex in Clay
The most prevalent vehicle ownership categories in Clay are males with 4 vehicles (117, accounting for 43.8%) and females with 4 vehicles (44, making up 60.0%).
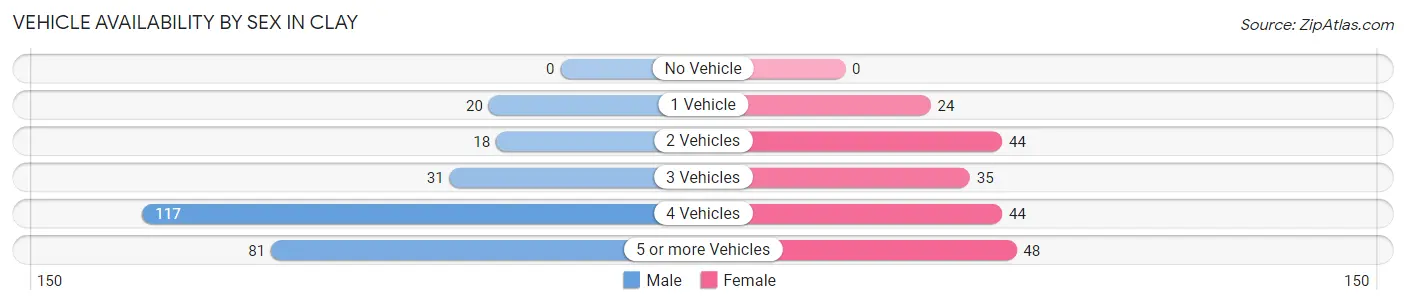
| Vehicles Available | Male | Female |
| No Vehicle | 0 (0.0%) | 0 (0.0%) |
| 1 Vehicle | 20 (7.5%) | 24 (12.3%) |
| 2 Vehicles | 18 (6.7%) | 44 (22.6%) |
| 3 Vehicles | 31 (11.6%) | 35 (17.9%) |
| 4 Vehicles | 117 (43.8%) | 44 (22.6%) |
| 5 or more Vehicles | 81 (30.3%) | 48 (24.6%) |
| Total | 267 (100.0%) | 195 (100.0%) |
Commute Time in Clay
The most frequently occuring commute durations in Clay are 45 to 59 minutes (96 commuters, 23.8%), 20 to 24 minutes (60 commuters, 14.8%), and 30 to 34 minutes (59 commuters, 14.6%).
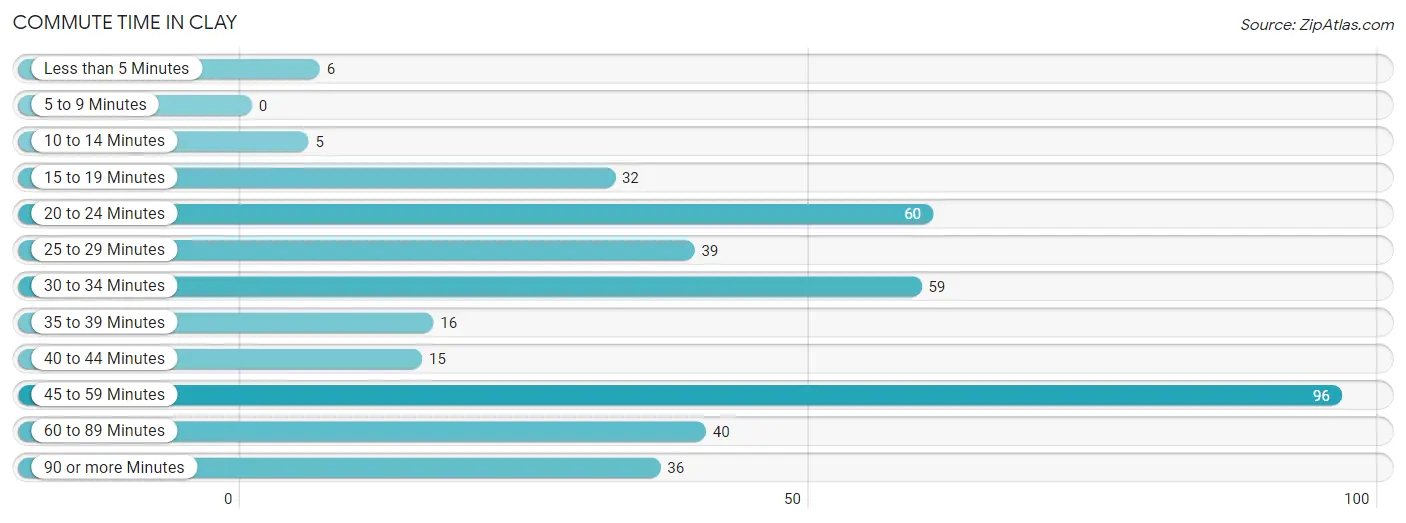
| Commute Time | # Commuters | % Commuters |
| Less than 5 Minutes | 6 | 1.5% |
| 5 to 9 Minutes | 0 | 0.0% |
| 10 to 14 Minutes | 5 | 1.2% |
| 15 to 19 Minutes | 32 | 7.9% |
| 20 to 24 Minutes | 60 | 14.8% |
| 25 to 29 Minutes | 39 | 9.7% |
| 30 to 34 Minutes | 59 | 14.6% |
| 35 to 39 Minutes | 16 | 4.0% |
| 40 to 44 Minutes | 15 | 3.7% |
| 45 to 59 Minutes | 96 | 23.8% |
| 60 to 89 Minutes | 40 | 9.9% |
| 90 or more Minutes | 36 | 8.9% |
Commute Time by Sex in Clay
The most common commute times in Clay are 45 to 59 minutes (55 commuters, 21.3%) for males and 45 to 59 minutes (41 commuters, 28.1%) for females.
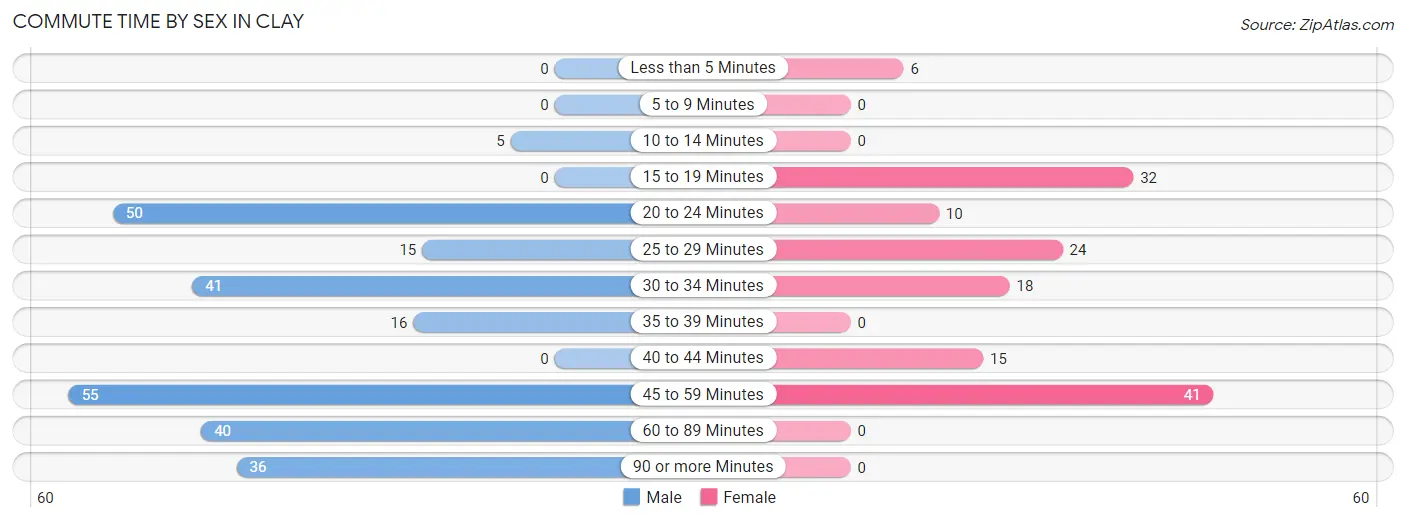
| Commute Time | Male | Female |
| Less than 5 Minutes | 0 (0.0%) | 6 (4.1%) |
| 5 to 9 Minutes | 0 (0.0%) | 0 (0.0%) |
| 10 to 14 Minutes | 5 (1.9%) | 0 (0.0%) |
| 15 to 19 Minutes | 0 (0.0%) | 32 (21.9%) |
| 20 to 24 Minutes | 50 (19.4%) | 10 (6.9%) |
| 25 to 29 Minutes | 15 (5.8%) | 24 (16.4%) |
| 30 to 34 Minutes | 41 (15.9%) | 18 (12.3%) |
| 35 to 39 Minutes | 16 (6.2%) | 0 (0.0%) |
| 40 to 44 Minutes | 0 (0.0%) | 15 (10.3%) |
| 45 to 59 Minutes | 55 (21.3%) | 41 (28.1%) |
| 60 to 89 Minutes | 40 (15.5%) | 0 (0.0%) |
| 90 or more Minutes | 36 (14.0%) | 0 (0.0%) |
Time of Departure to Work by Sex in Clay
The most frequent times of departure to work in Clay are 7:00 AM to 7:29 AM (91, 35.3%) for males and 7:00 AM to 7:29 AM (42, 28.8%) for females.
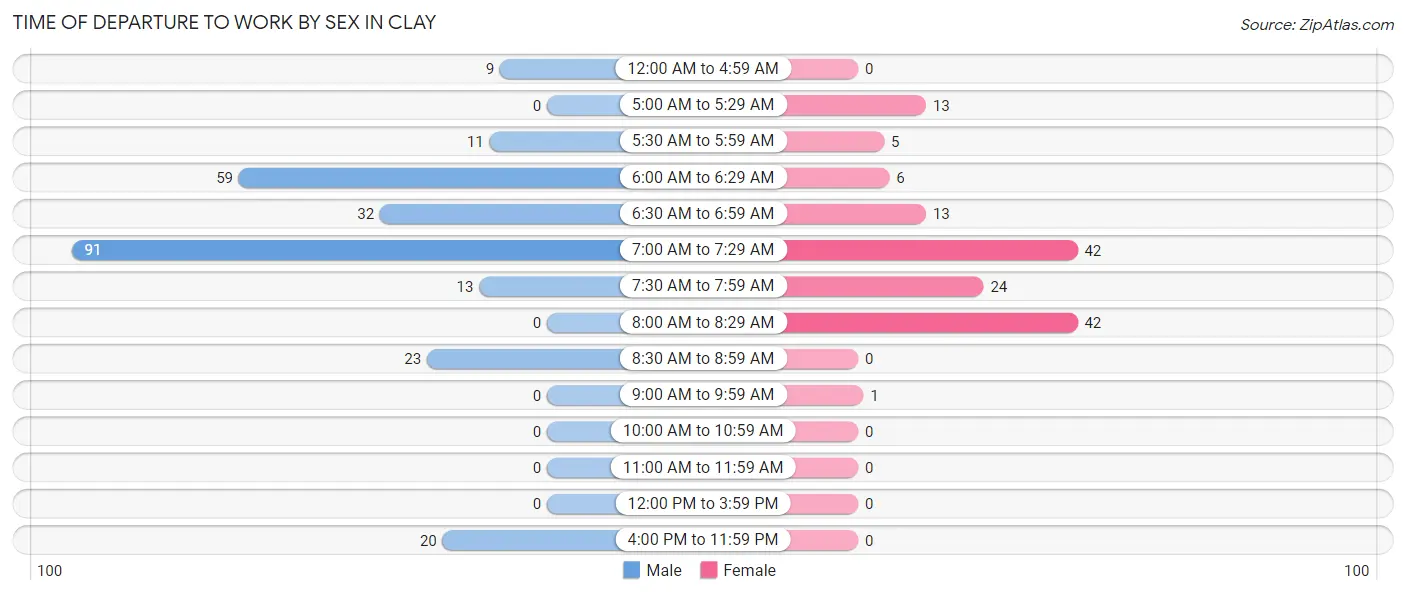
| Time of Departure | Male | Female |
| 12:00 AM to 4:59 AM | 9 (3.5%) | 0 (0.0%) |
| 5:00 AM to 5:29 AM | 0 (0.0%) | 13 (8.9%) |
| 5:30 AM to 5:59 AM | 11 (4.3%) | 5 (3.4%) |
| 6:00 AM to 6:29 AM | 59 (22.9%) | 6 (4.1%) |
| 6:30 AM to 6:59 AM | 32 (12.4%) | 13 (8.9%) |
| 7:00 AM to 7:29 AM | 91 (35.3%) | 42 (28.8%) |
| 7:30 AM to 7:59 AM | 13 (5.0%) | 24 (16.4%) |
| 8:00 AM to 8:29 AM | 0 (0.0%) | 42 (28.8%) |
| 8:30 AM to 8:59 AM | 23 (8.9%) | 0 (0.0%) |
| 9:00 AM to 9:59 AM | 0 (0.0%) | 1 (0.7%) |
| 10:00 AM to 10:59 AM | 0 (0.0%) | 0 (0.0%) |
| 11:00 AM to 11:59 AM | 0 (0.0%) | 0 (0.0%) |
| 12:00 PM to 3:59 PM | 0 (0.0%) | 0 (0.0%) |
| 4:00 PM to 11:59 PM | 20 (7.7%) | 0 (0.0%) |
| Total | 258 (100.0%) | 146 (100.0%) |
Housing Occupancy in Clay
Occupancy by Ownership in Clay
Of the total 380 dwellings in Clay, owner-occupied units account for 351 (92.4%), while renter-occupied units make up 29 (7.6%).
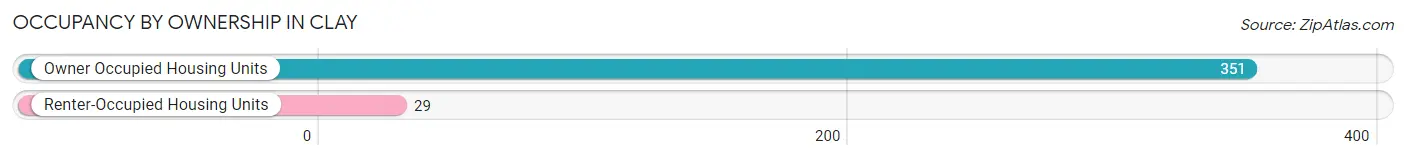
| Occupancy | # Housing Units | % Housing Units |
| Owner Occupied Housing Units | 351 | 92.4% |
| Renter-Occupied Housing Units | 29 | 7.6% |
| Total Occupied Housing Units | 380 | 100.0% |
Occupancy by Household Size in Clay
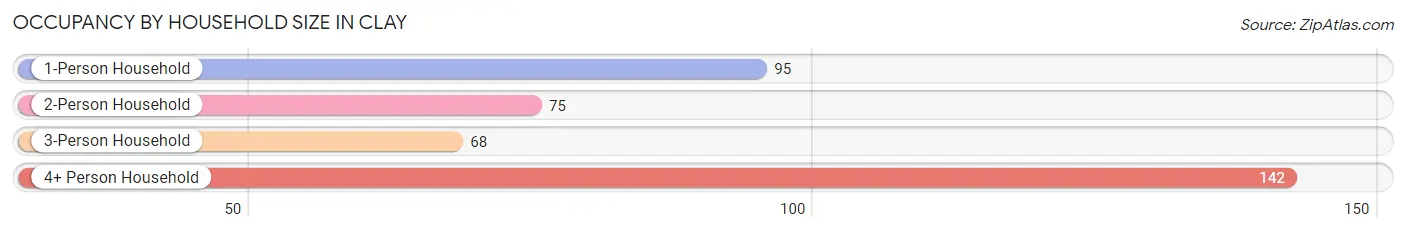
| Household Size | # Housing Units | % Housing Units |
| 1-Person Household | 95 | 25.0% |
| 2-Person Household | 75 | 19.7% |
| 3-Person Household | 68 | 17.9% |
| 4+ Person Household | 142 | 37.4% |
| Total Housing Units | 380 | 100.0% |
Occupancy by Ownership by Household Size in Clay
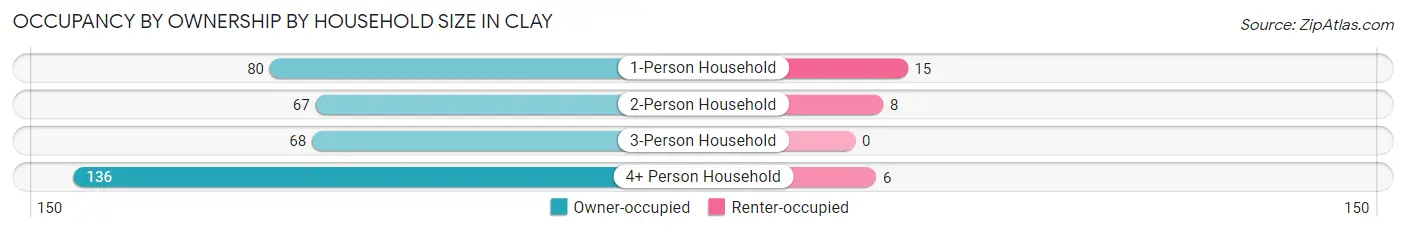
| Household Size | Owner-occupied | Renter-occupied |
| 1-Person Household | 80 (84.2%) | 15 (15.8%) |
| 2-Person Household | 67 (89.3%) | 8 (10.7%) |
| 3-Person Household | 68 (100.0%) | 0 (0.0%) |
| 4+ Person Household | 136 (95.8%) | 6 (4.2%) |
| Total Housing Units | 351 (92.4%) | 29 (7.6%) |
Occupancy by Educational Attainment in Clay
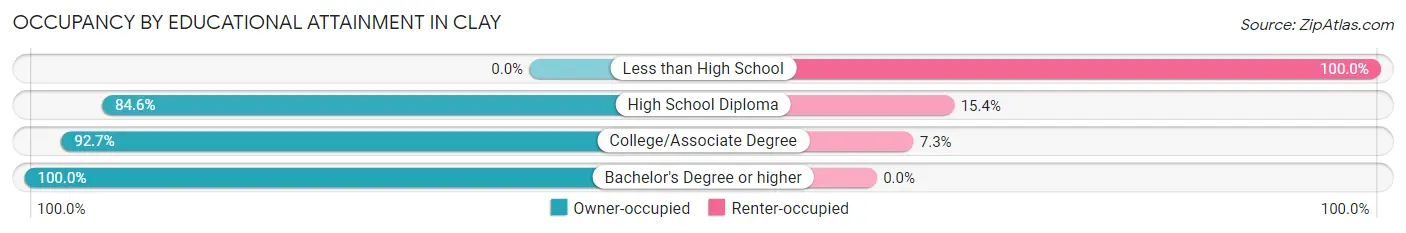
| Household Size | Owner-occupied | Renter-occupied |
| Less than High School | 0 (0.0%) | 10 (100.0%) |
| High School Diploma | 22 (84.6%) | 4 (15.4%) |
| College/Associate Degree | 191 (92.7%) | 15 (7.3%) |
| Bachelor's Degree or higher | 138 (100.0%) | 0 (0.0%) |
Occupancy by Age of Householder in Clay
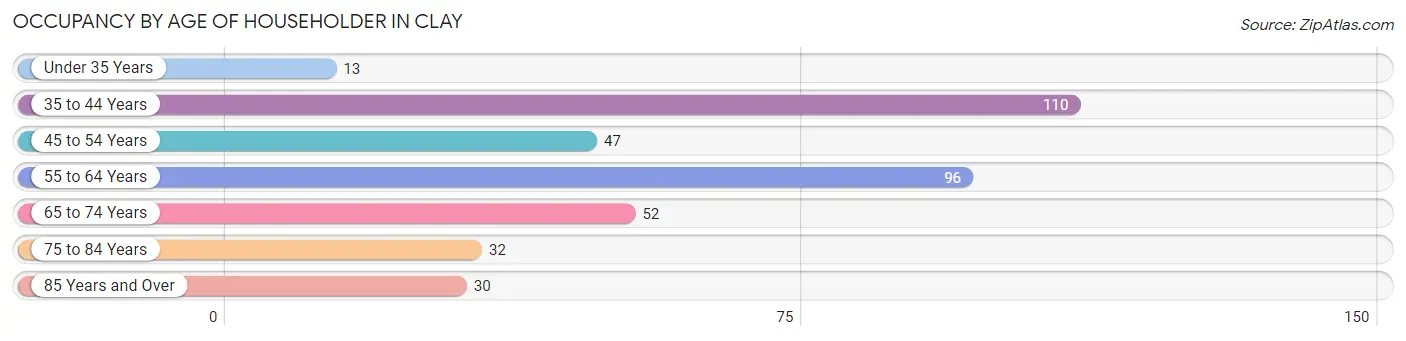
| Age Bracket | # Households | % Households |
| Under 35 Years | 13 | 3.4% |
| 35 to 44 Years | 110 | 28.9% |
| 45 to 54 Years | 47 | 12.4% |
| 55 to 64 Years | 96 | 25.3% |
| 65 to 74 Years | 52 | 13.7% |
| 75 to 84 Years | 32 | 8.4% |
| 85 Years and Over | 30 | 7.9% |
| Total | 380 | 100.0% |
Housing Finances in Clay
Median Income by Occupancy in Clay
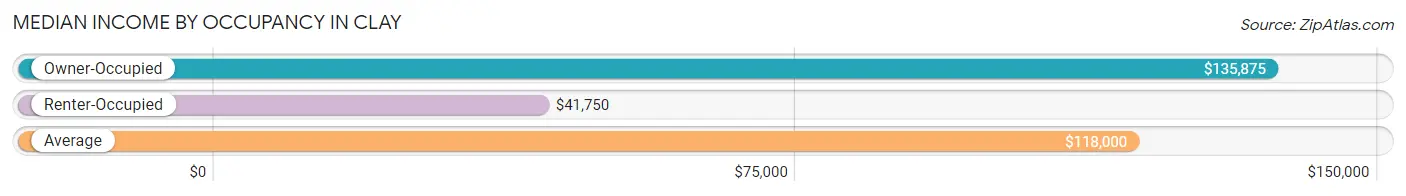
| Occupancy Type | # Households | Median Income |
| Owner-Occupied | 351 (92.4%) | $135,875 |
| Renter-Occupied | 29 (7.6%) | $41,750 |
| Average | 380 (100.0%) | $118,000 |
Occupancy by Householder Income Bracket in Clay
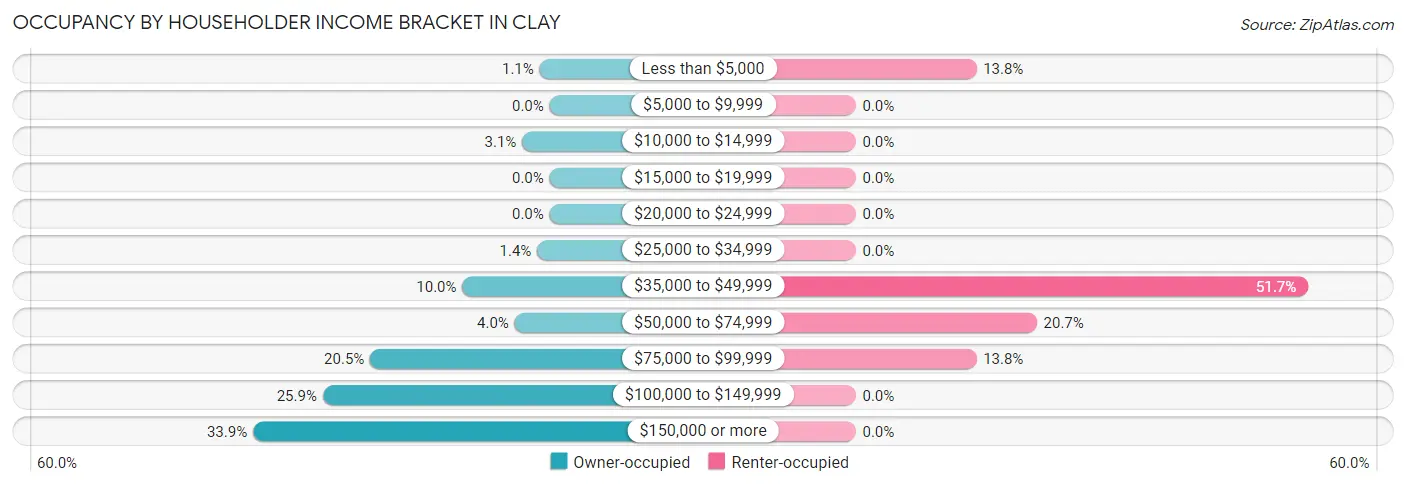
| Income Bracket | Owner-occupied | Renter-occupied |
| Less than $5,000 | 4 (1.1%) | 4 (13.8%) |
| $5,000 to $9,999 | 0 (0.0%) | 0 (0.0%) |
| $10,000 to $14,999 | 11 (3.1%) | 0 (0.0%) |
| $15,000 to $19,999 | 0 (0.0%) | 0 (0.0%) |
| $20,000 to $24,999 | 0 (0.0%) | 0 (0.0%) |
| $25,000 to $34,999 | 5 (1.4%) | 0 (0.0%) |
| $35,000 to $49,999 | 35 (10.0%) | 15 (51.7%) |
| $50,000 to $74,999 | 14 (4.0%) | 6 (20.7%) |
| $75,000 to $99,999 | 72 (20.5%) | 4 (13.8%) |
| $100,000 to $149,999 | 91 (25.9%) | 0 (0.0%) |
| $150,000 or more | 119 (33.9%) | 0 (0.0%) |
| Total | 351 (100.0%) | 29 (100.0%) |
Monthly Housing Cost Tiers in Clay
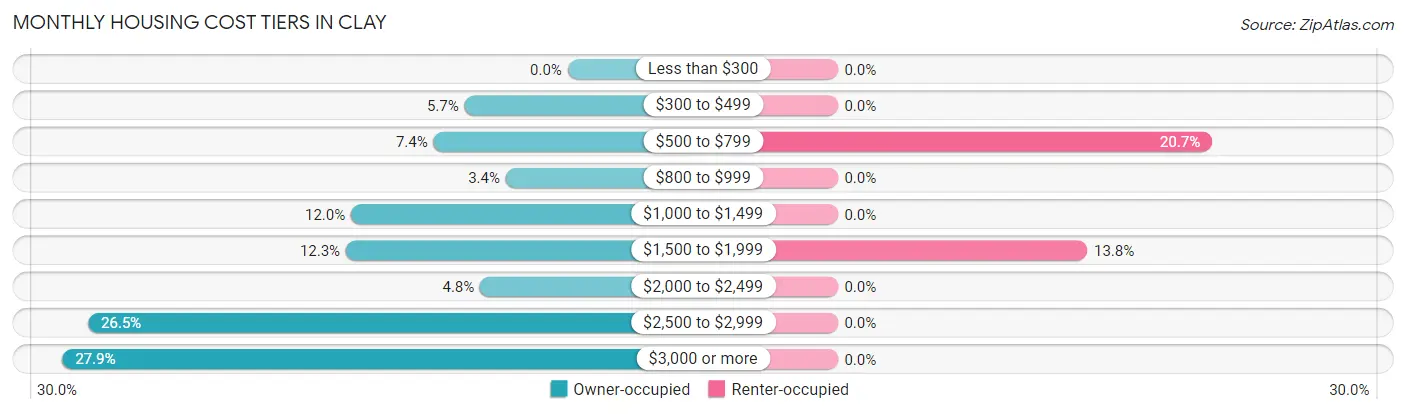
| Monthly Cost | Owner-occupied | Renter-occupied |
| Less than $300 | 0 (0.0%) | 0 (0.0%) |
| $300 to $499 | 20 (5.7%) | 0 (0.0%) |
| $500 to $799 | 26 (7.4%) | 6 (20.7%) |
| $800 to $999 | 12 (3.4%) | 0 (0.0%) |
| $1,000 to $1,499 | 42 (12.0%) | 0 (0.0%) |
| $1,500 to $1,999 | 43 (12.2%) | 4 (13.8%) |
| $2,000 to $2,499 | 17 (4.8%) | 0 (0.0%) |
| $2,500 to $2,999 | 93 (26.5%) | 0 (0.0%) |
| $3,000 or more | 98 (27.9%) | 0 (0.0%) |
| Total | 351 (100.0%) | 29 (100.0%) |
Physical Housing Characteristics in Clay
Housing Structures in Clay
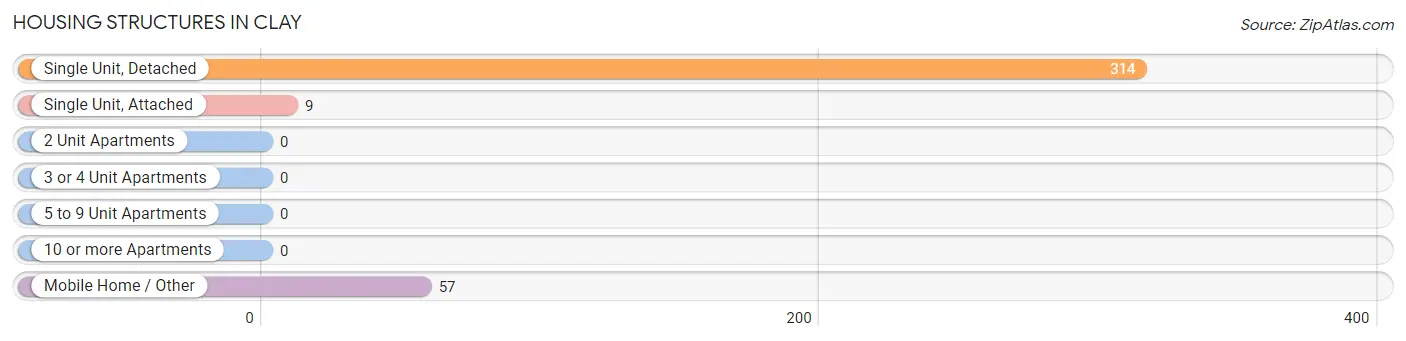
| Structure Type | # Housing Units | % Housing Units |
| Single Unit, Detached | 314 | 82.6% |
| Single Unit, Attached | 9 | 2.4% |
| 2 Unit Apartments | 0 | 0.0% |
| 3 or 4 Unit Apartments | 0 | 0.0% |
| 5 to 9 Unit Apartments | 0 | 0.0% |
| 10 or more Apartments | 0 | 0.0% |
| Mobile Home / Other | 57 | 15.0% |
| Total | 380 | 100.0% |
Housing Structures by Occupancy in Clay
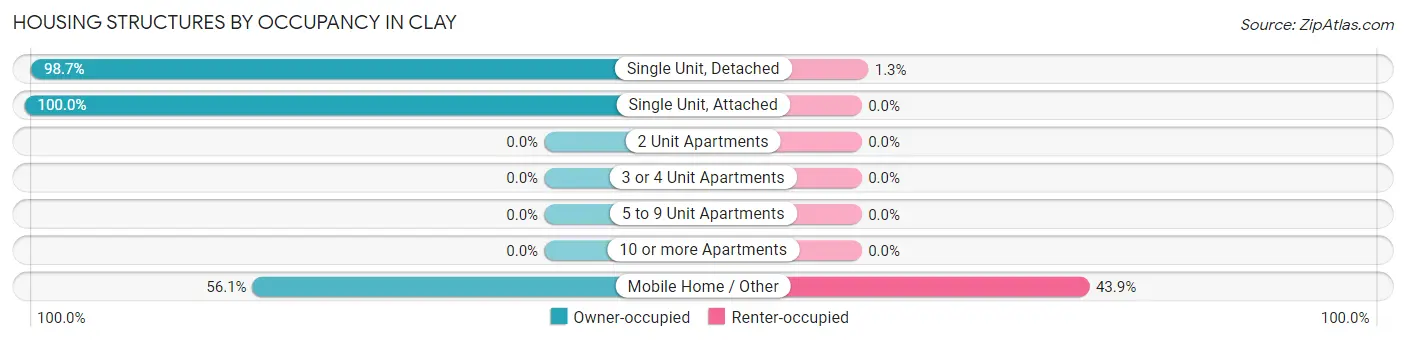
| Structure Type | Owner-occupied | Renter-occupied |
| Single Unit, Detached | 310 (98.7%) | 4 (1.3%) |
| Single Unit, Attached | 9 (100.0%) | 0 (0.0%) |
| 2 Unit Apartments | 0 (0.0%) | 0 (0.0%) |
| 3 or 4 Unit Apartments | 0 (0.0%) | 0 (0.0%) |
| 5 to 9 Unit Apartments | 0 (0.0%) | 0 (0.0%) |
| 10 or more Apartments | 0 (0.0%) | 0 (0.0%) |
| Mobile Home / Other | 32 (56.1%) | 25 (43.9%) |
| Total | 351 (92.4%) | 29 (7.6%) |
Housing Structures by Number of Rooms in Clay
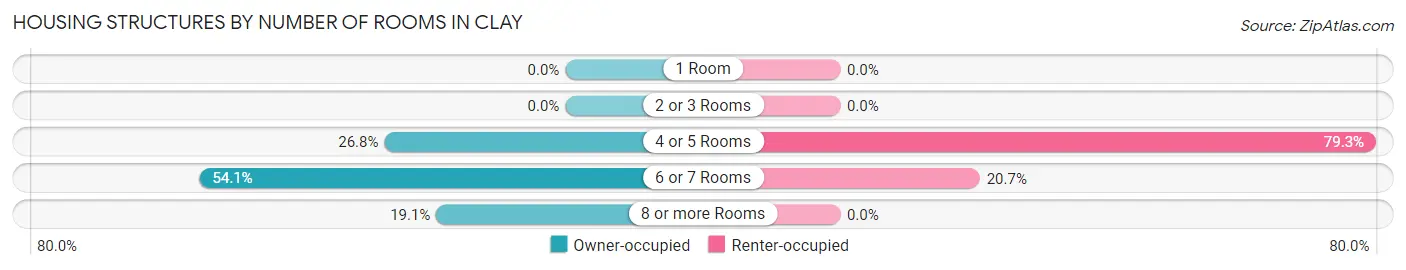
| Number of Rooms | Owner-occupied | Renter-occupied |
| 1 Room | 0 (0.0%) | 0 (0.0%) |
| 2 or 3 Rooms | 0 (0.0%) | 0 (0.0%) |
| 4 or 5 Rooms | 94 (26.8%) | 23 (79.3%) |
| 6 or 7 Rooms | 190 (54.1%) | 6 (20.7%) |
| 8 or more Rooms | 67 (19.1%) | 0 (0.0%) |
| Total | 351 (100.0%) | 29 (100.0%) |
Housing Structure by Heating Type in Clay
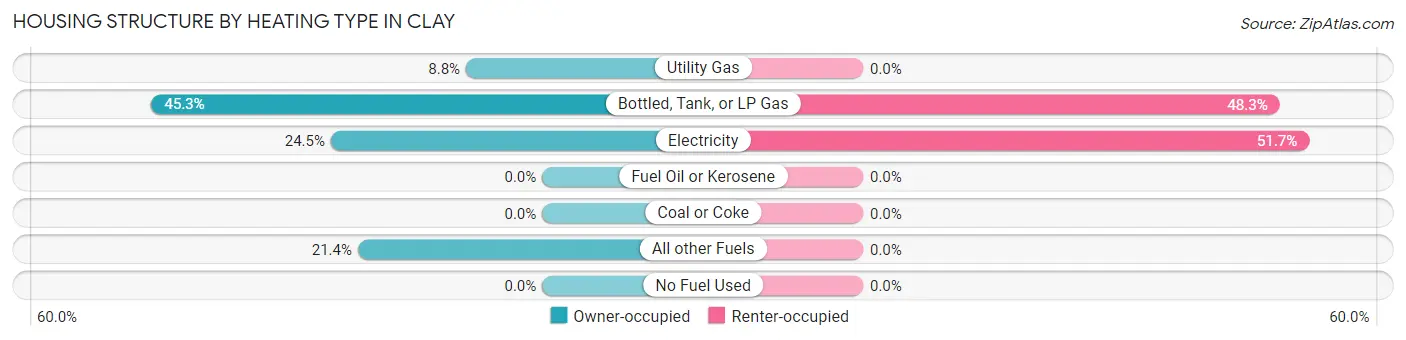
| Heating Type | Owner-occupied | Renter-occupied |
| Utility Gas | 31 (8.8%) | 0 (0.0%) |
| Bottled, Tank, or LP Gas | 159 (45.3%) | 14 (48.3%) |
| Electricity | 86 (24.5%) | 15 (51.7%) |
| Fuel Oil or Kerosene | 0 (0.0%) | 0 (0.0%) |
| Coal or Coke | 0 (0.0%) | 0 (0.0%) |
| All other Fuels | 75 (21.4%) | 0 (0.0%) |
| No Fuel Used | 0 (0.0%) | 0 (0.0%) |
| Total | 351 (100.0%) | 29 (100.0%) |
Household Vehicle Usage in Clay
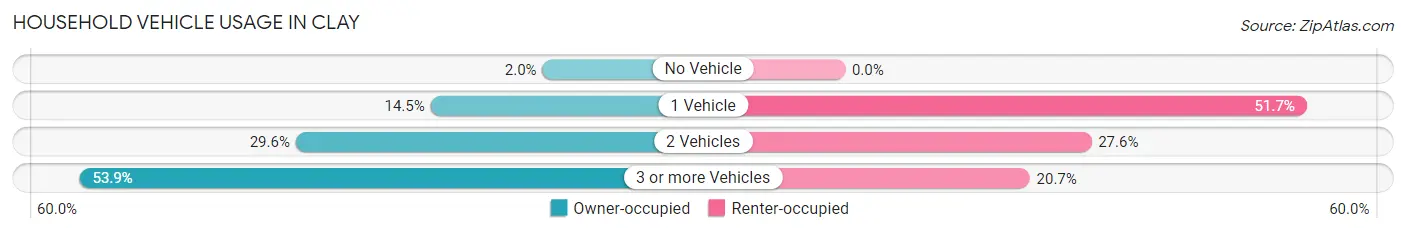
| Vehicles per Household | Owner-occupied | Renter-occupied |
| No Vehicle | 7 (2.0%) | 0 (0.0%) |
| 1 Vehicle | 51 (14.5%) | 15 (51.7%) |
| 2 Vehicles | 104 (29.6%) | 8 (27.6%) |
| 3 or more Vehicles | 189 (53.8%) | 6 (20.7%) |
| Total | 351 (100.0%) | 29 (100.0%) |
Real Estate & Mortgages in Clay
Real Estate and Mortgage Overview in Clay
| Characteristic | Without Mortgage | With Mortgage |
| Housing Units | 62 | 289 |
| Median Property Value | $695,700 | $754,700 |
| Median Household Income | $79,063 | $106 |
| Monthly Housing Costs | $579 | $94 |
| Real Estate Taxes | $3,000 | $0 |
Property Value by Mortgage Status in Clay
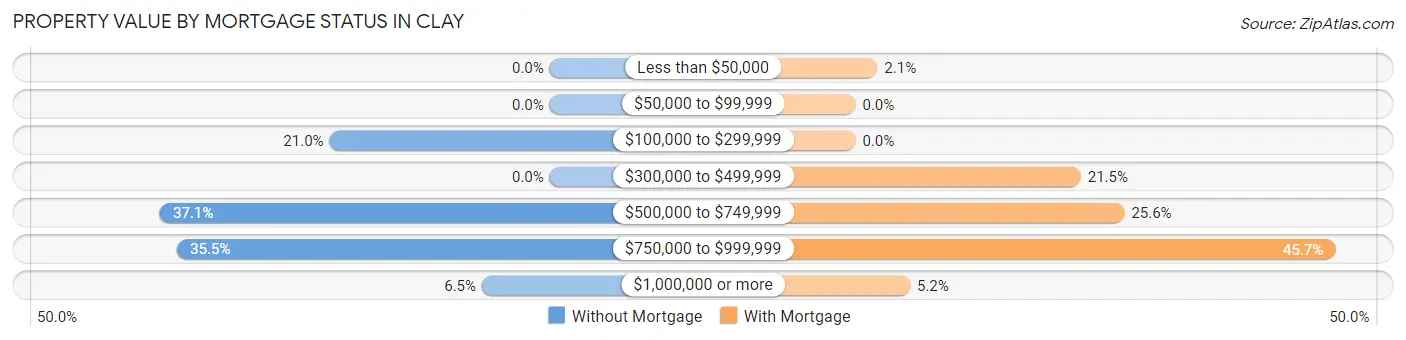
| Property Value | Without Mortgage | With Mortgage |
| Less than $50,000 | 0 (0.0%) | 6 (2.1%) |
| $50,000 to $99,999 | 0 (0.0%) | 0 (0.0%) |
| $100,000 to $299,999 | 13 (21.0%) | 0 (0.0%) |
| $300,000 to $499,999 | 0 (0.0%) | 62 (21.4%) |
| $500,000 to $749,999 | 23 (37.1%) | 74 (25.6%) |
| $750,000 to $999,999 | 22 (35.5%) | 132 (45.7%) |
| $1,000,000 or more | 4 (6.5%) | 15 (5.2%) |
| Total | 62 (100.0%) | 289 (100.0%) |
Household Income by Mortgage Status in Clay
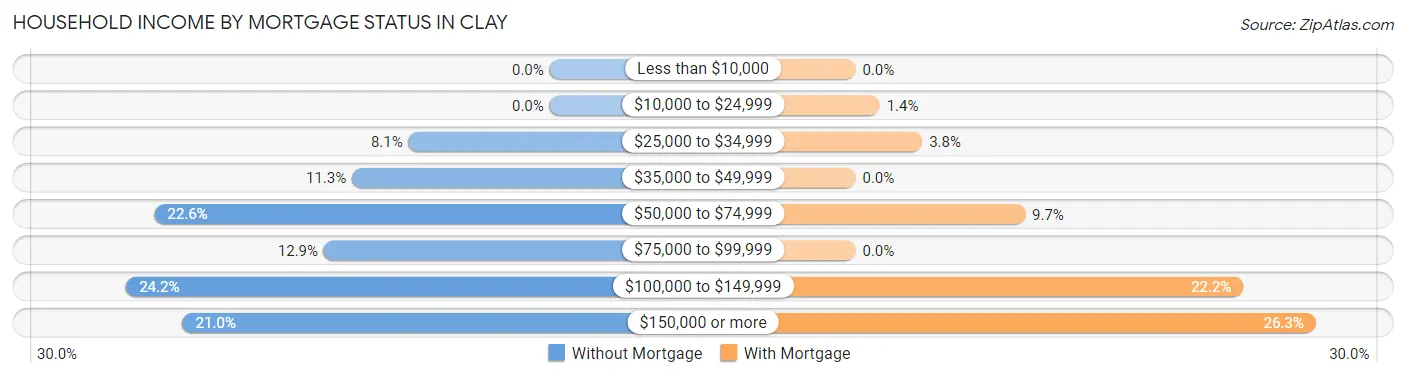
| Household Income | Without Mortgage | With Mortgage |
| Less than $10,000 | 0 (0.0%) | 0 (0.0%) |
| $10,000 to $24,999 | 0 (0.0%) | 4 (1.4%) |
| $25,000 to $34,999 | 5 (8.1%) | 11 (3.8%) |
| $35,000 to $49,999 | 7 (11.3%) | 0 (0.0%) |
| $50,000 to $74,999 | 14 (22.6%) | 28 (9.7%) |
| $75,000 to $99,999 | 8 (12.9%) | 0 (0.0%) |
| $100,000 to $149,999 | 15 (24.2%) | 64 (22.2%) |
| $150,000 or more | 13 (21.0%) | 76 (26.3%) |
| Total | 62 (100.0%) | 289 (100.0%) |
Property Value to Household Income Ratio in Clay
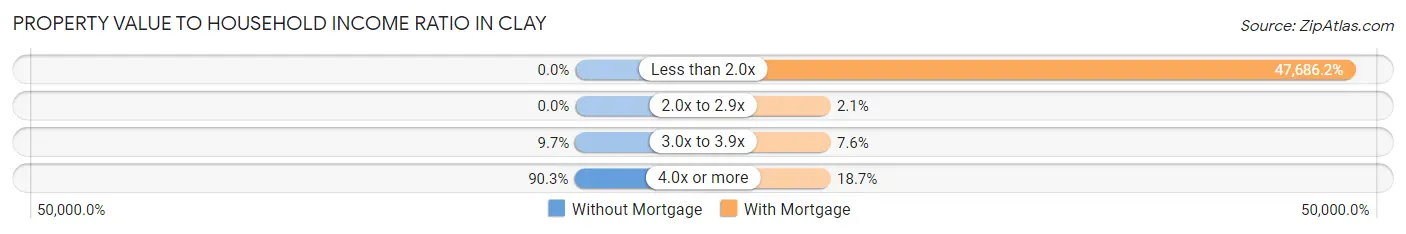
| Value-to-Income Ratio | Without Mortgage | With Mortgage |
| Less than 2.0x | 0 (0.0%) | 137,813 (47,686.2%) |
| 2.0x to 2.9x | 0 (0.0%) | 6 (2.1%) |
| 3.0x to 3.9x | 6 (9.7%) | 22 (7.6%) |
| 4.0x or more | 56 (90.3%) | 54 (18.7%) |
| Total | 62 (100.0%) | 289 (100.0%) |
Real Estate Taxes by Mortgage Status in Clay
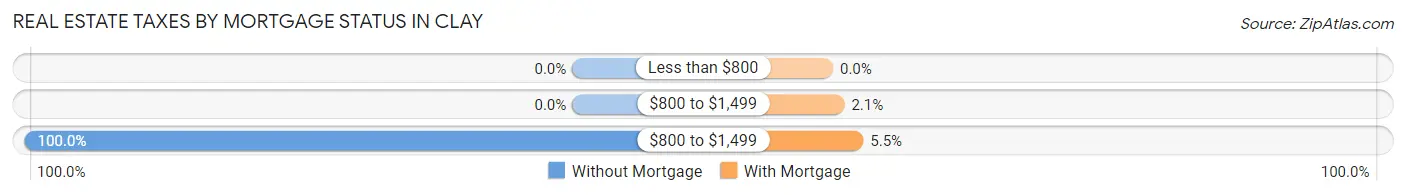
| Property Taxes | Without Mortgage | With Mortgage |
| Less than $800 | 0 (0.0%) | 0 (0.0%) |
| $800 to $1,499 | 0 (0.0%) | 6 (2.1%) |
| $800 to $1,499 | 62 (100.0%) | 16 (5.5%) |
| Total | 62 (100.0%) | 289 (100.0%) |
Health & Disability in Clay
Health Insurance Coverage by Age in Clay
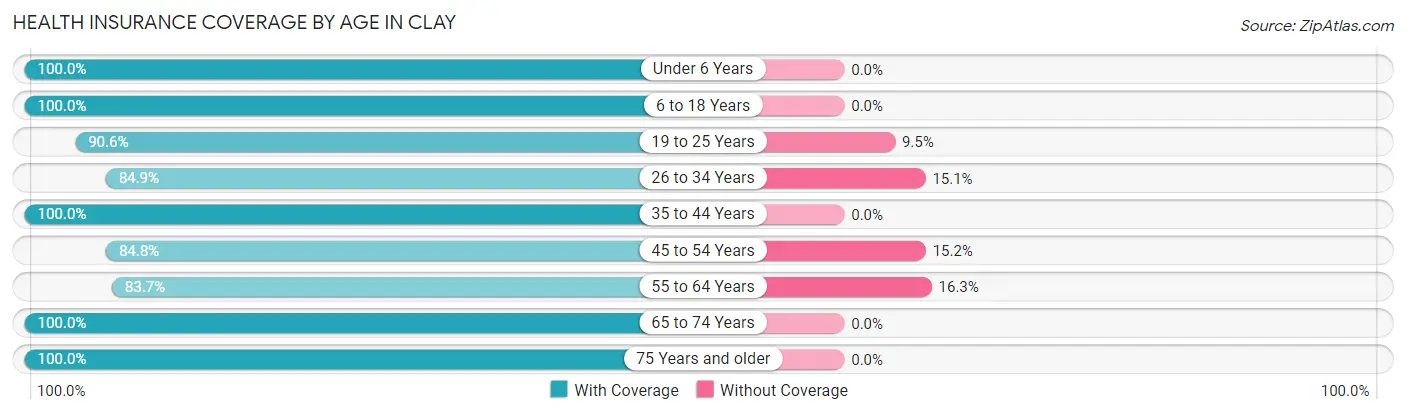
| Age Bracket | With Coverage | Without Coverage |
| Under 6 Years | 69 (100.0%) | 0 (0.0%) |
| 6 to 18 Years | 146 (100.0%) | 0 (0.0%) |
| 19 to 25 Years | 115 (90.5%) | 12 (9.5%) |
| 26 to 34 Years | 129 (84.9%) | 23 (15.1%) |
| 35 to 44 Years | 162 (100.0%) | 0 (0.0%) |
| 45 to 54 Years | 95 (84.8%) | 17 (15.2%) |
| 55 to 64 Years | 144 (83.7%) | 28 (16.3%) |
| 65 to 74 Years | 82 (100.0%) | 0 (0.0%) |
| 75 Years and older | 99 (100.0%) | 0 (0.0%) |
| Total | 1,041 (92.9%) | 80 (7.1%) |
Health Insurance Coverage by Citizenship Status in Clay
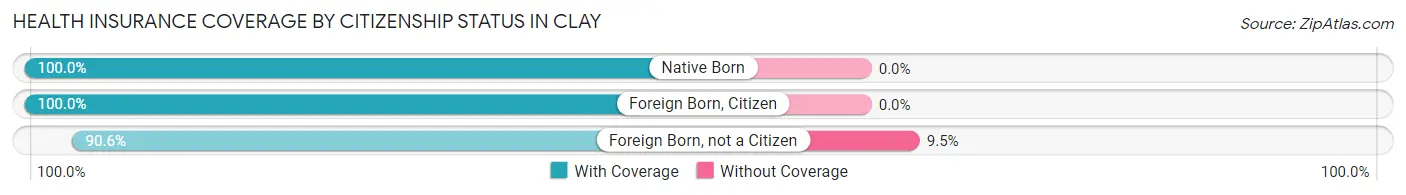
| Citizenship Status | With Coverage | Without Coverage |
| Native Born | 69 (100.0%) | 0 (0.0%) |
| Foreign Born, Citizen | 146 (100.0%) | 0 (0.0%) |
| Foreign Born, not a Citizen | 115 (90.5%) | 12 (9.5%) |
Health Insurance Coverage by Household Income in Clay
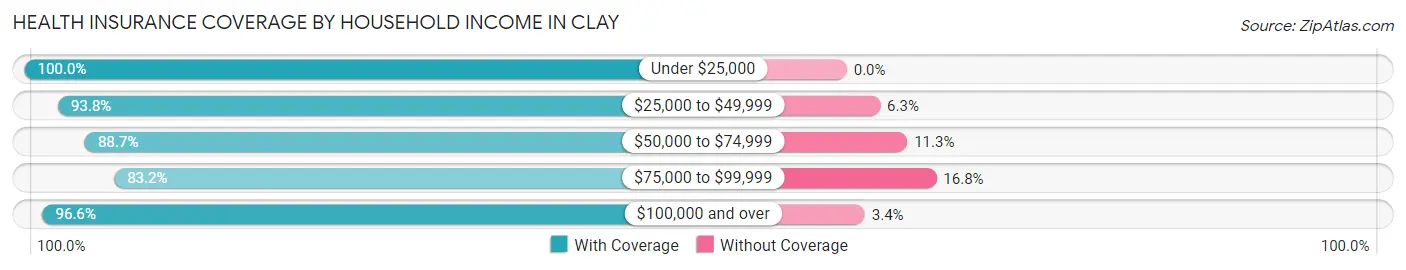
| Household Income | With Coverage | Without Coverage |
| Under $25,000 | 24 (100.0%) | 0 (0.0%) |
| $25,000 to $49,999 | 90 (93.8%) | 6 (6.2%) |
| $50,000 to $74,999 | 47 (88.7%) | 6 (11.3%) |
| $75,000 to $99,999 | 223 (83.2%) | 45 (16.8%) |
| $100,000 and over | 657 (96.6%) | 23 (3.4%) |
Public vs Private Health Insurance Coverage by Age in Clay
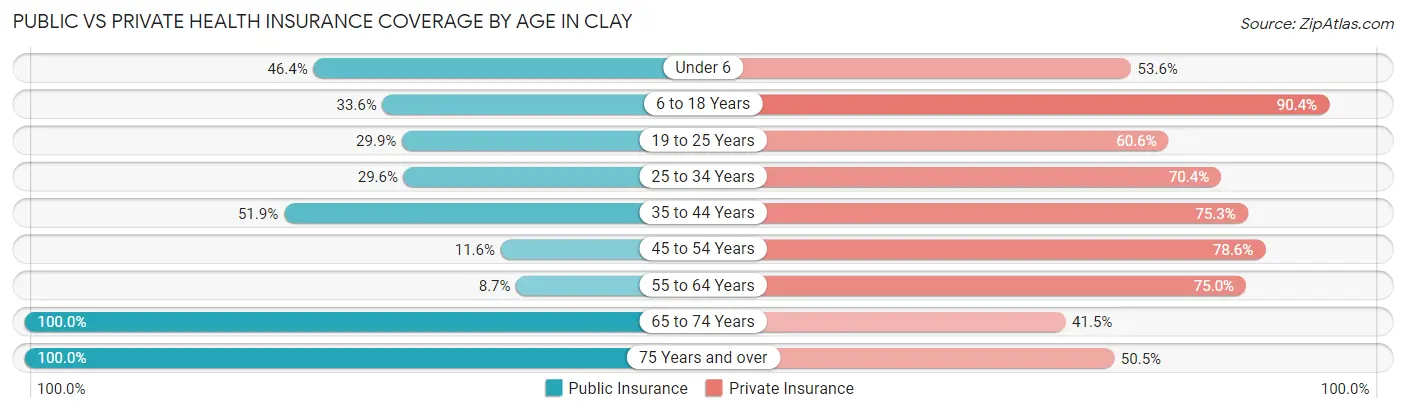
| Age Bracket | Public Insurance | Private Insurance |
| Under 6 | 32 (46.4%) | 37 (53.6%) |
| 6 to 18 Years | 49 (33.6%) | 132 (90.4%) |
| 19 to 25 Years | 38 (29.9%) | 77 (60.6%) |
| 25 to 34 Years | 45 (29.6%) | 107 (70.4%) |
| 35 to 44 Years | 84 (51.8%) | 122 (75.3%) |
| 45 to 54 Years | 13 (11.6%) | 88 (78.6%) |
| 55 to 64 Years | 15 (8.7%) | 129 (75.0%) |
| 65 to 74 Years | 82 (100.0%) | 34 (41.5%) |
| 75 Years and over | 99 (100.0%) | 50 (50.5%) |
| Total | 457 (40.8%) | 776 (69.2%) |
Disability Status by Sex by Age in Clay
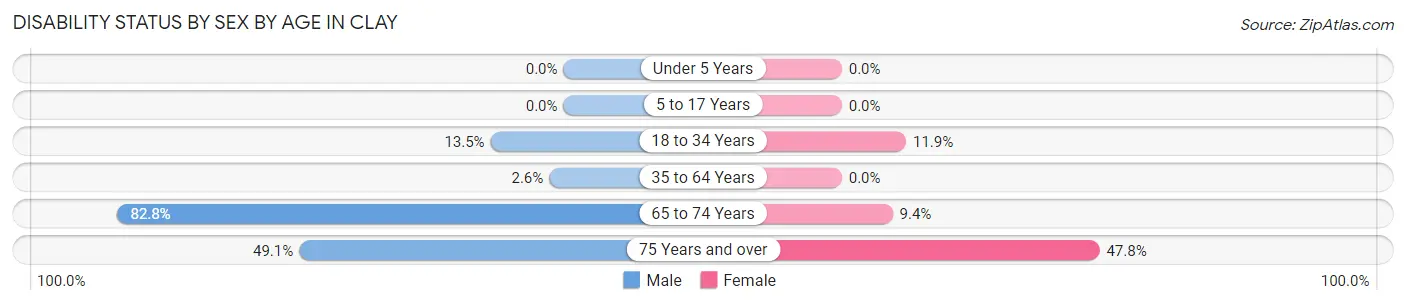
| Age Bracket | Male | Female |
| Under 5 Years | 0 (0.0%) | 0 (0.0%) |
| 5 to 17 Years | 0 (0.0%) | 0 (0.0%) |
| 18 to 34 Years | 23 (13.5%) | 13 (11.9%) |
| 35 to 64 Years | 6 (2.6%) | 0 (0.0%) |
| 65 to 74 Years | 24 (82.8%) | 5 (9.4%) |
| 75 Years and over | 26 (49.1%) | 22 (47.8%) |
Disability Class by Sex by Age in Clay
Disability Class: Hearing Difficulty
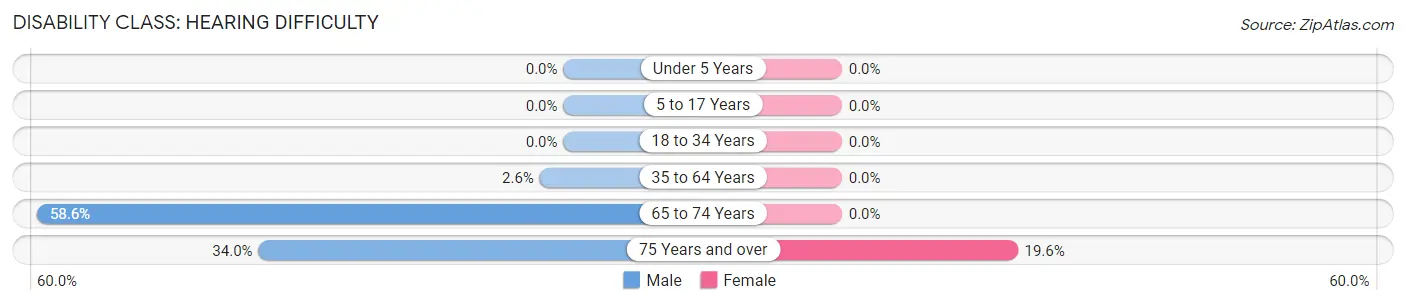
| Age Bracket | Male | Female |
| Under 5 Years | 0 (0.0%) | 0 (0.0%) |
| 5 to 17 Years | 0 (0.0%) | 0 (0.0%) |
| 18 to 34 Years | 0 (0.0%) | 0 (0.0%) |
| 35 to 64 Years | 6 (2.6%) | 0 (0.0%) |
| 65 to 74 Years | 17 (58.6%) | 0 (0.0%) |
| 75 Years and over | 18 (34.0%) | 9 (19.6%) |
Disability Class: Vision Difficulty
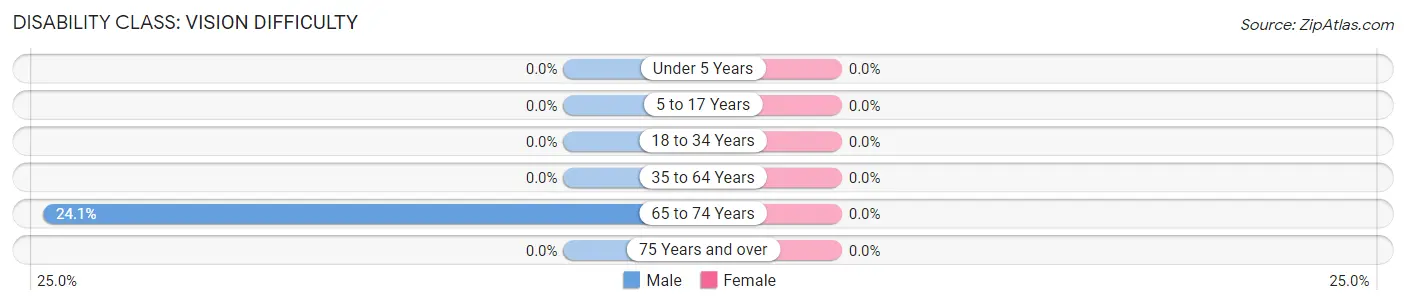
| Age Bracket | Male | Female |
| Under 5 Years | 0 (0.0%) | 0 (0.0%) |
| 5 to 17 Years | 0 (0.0%) | 0 (0.0%) |
| 18 to 34 Years | 0 (0.0%) | 0 (0.0%) |
| 35 to 64 Years | 0 (0.0%) | 0 (0.0%) |
| 65 to 74 Years | 7 (24.1%) | 0 (0.0%) |
| 75 Years and over | 0 (0.0%) | 0 (0.0%) |
Disability Class: Cognitive Difficulty
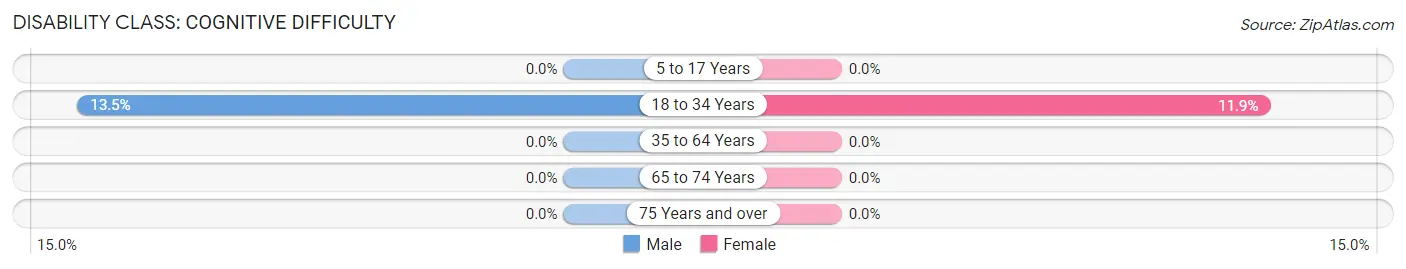
| Age Bracket | Male | Female |
| 5 to 17 Years | 0 (0.0%) | 0 (0.0%) |
| 18 to 34 Years | 23 (13.5%) | 13 (11.9%) |
| 35 to 64 Years | 0 (0.0%) | 0 (0.0%) |
| 65 to 74 Years | 0 (0.0%) | 0 (0.0%) |
| 75 Years and over | 0 (0.0%) | 0 (0.0%) |
Disability Class: Ambulatory Difficulty
| Age Bracket | Male | Female |
| 5 to 17 Years | 0 (0.0%) | 0 (0.0%) |
| 18 to 34 Years | 23 (13.5%) | 13 (11.9%) |
| 35 to 64 Years | 0 (0.0%) | 0 (0.0%) |
| 65 to 74 Years | 0 (0.0%) | 5 (9.4%) |
| 75 Years and over | 15 (28.3%) | 17 (37.0%) |
Disability Class: Self-Care Difficulty
| Age Bracket | Male | Female |
| 5 to 17 Years | 0 (0.0%) | 0 (0.0%) |
| 18 to 34 Years | 0 (0.0%) | 0 (0.0%) |
| 35 to 64 Years | 0 (0.0%) | 0 (0.0%) |
| 65 to 74 Years | 0 (0.0%) | 0 (0.0%) |
| 75 Years and over | 0 (0.0%) | 0 (0.0%) |
Technology Access in Clay
Computing Device Access in Clay
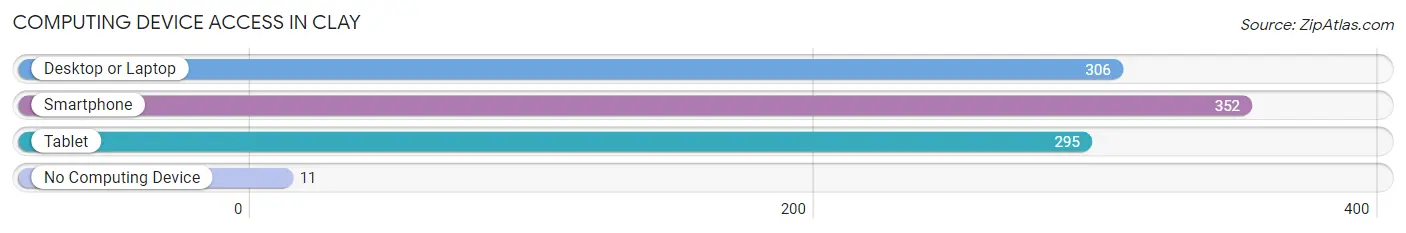
| Device Type | # Households | % Households |
| Desktop or Laptop | 306 | 80.5% |
| Smartphone | 352 | 92.6% |
| Tablet | 295 | 77.6% |
| No Computing Device | 11 | 2.9% |
| Total | 380 | 100.0% |
Internet Access in Clay
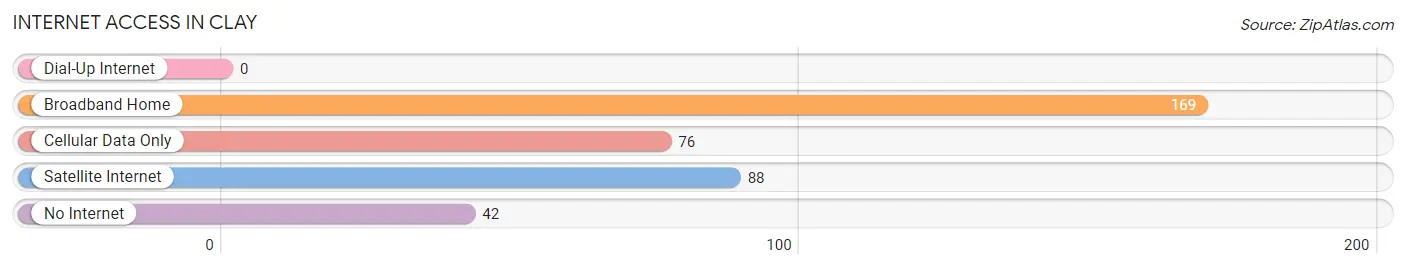
| Internet Type | # Households | % Households |
| Dial-Up Internet | 0 | 0.0% |
| Broadband Home | 169 | 44.5% |
| Cellular Data Only | 76 | 20.0% |
| Satellite Internet | 88 | 23.2% |
| No Internet | 42 | 11.1% |
| Total | 380 | 100.0% |
Clay Summary
Clay is a small unincorporated community located in the foothills of the Sierra Nevada Mountains in El Dorado County, California. It is situated at an elevation of 2,845 feet (867 m) and is located approximately 8 miles (13 km) east of Placerville. The population of Clay was estimated to be around 200 people in 2020.
History
Clay was originally known as “Clay’s Station” and was established in 1849 as a stagecoach stop along the Placerville-Sacramento Road. The town was named after the local clay deposits that were used to make bricks and pottery. In the late 1800s, Clay was a thriving community with a post office, general store, blacksmith shop, and several other businesses.
In the early 1900s, the town began to decline as the railroad bypassed Clay and the stagecoach line was discontinued. By the 1950s, Clay had become a virtual ghost town. In the 1970s, the town was revitalized when a group of local residents formed the Clay Community Association and began restoring the town’s historic buildings.
Geography
Clay is located in the foothills of the Sierra Nevada Mountains in El Dorado County, California. It is situated at an elevation of 2,845 feet (867 m) and is located approximately 8 miles (13 km) east of Placerville. The town is surrounded by rolling hills and is situated in a valley between two mountain ranges. The nearest major city is Sacramento, which is located approximately 50 miles (80 km) to the north.
Economy
Clay’s economy is largely based on tourism and agriculture. The town is home to several wineries, a brewery, and a distillery. There are also several small businesses in the area, including a general store, a cafe, and a bed and breakfast. The town also hosts several annual events, such as the Clay Country Fair and the Clay Music Festival.
Demographics
According to the 2010 census, the population of Clay was estimated to be around 200 people. The racial makeup of the town was 94.5% White, 0.5% African American, 0.5% Native American, 0.5% Asian, and 4% from other races. The median household income was $50,000 and the median age was 44.
Conclusion
Clay is a small unincorporated community located in the foothills of the Sierra Nevada Mountains in El Dorado County, California. It is situated at an elevation of 2,845 feet (867 m) and is located approximately 8 miles (13 km) east of Placerville. The population of Clay was estimated to be around 200 people in 2020. The town’s economy is largely based on tourism and agriculture, and it is home to several wineries, a brewery, and a distillery. The racial makeup of the town was 94.5% White, 0.5% African American, 0.5% Native American, 0.5% Asian, and 4% from other races. The median household income was $50,000 and the median age was 44. Clay is a charming and historic community that is worth visiting for its unique atmosphere and beautiful scenery.
Common Questions
What is the Total Population of Clay?
Total Population of Clay is 1,121.
What is the Total Male Population of Clay?
Total Male Population of Clay is 571.
What is the Total Female Population of Clay?
Total Female Population of Clay is 550.
What is the Ratio of Males per 100 Females in Clay?
There are 103.82 Males per 100 Females in Clay.
What is the Ratio of Females per 100 Males in Clay?
There are 96.32 Females per 100 Males in Clay.
What is the Median Population Age in Clay?
Median Population Age in Clay is 40.9 Years.
What is the Average Family Size in Clay
Average Family Size in Clay is 3.4 People.
What is the Average Household Size in Clay
Average Household Size in Clay is 3.0 People.
What is Per Capita Income in Clay?
Per Capita income in Clay is $42,689.
What is the Median Family Income in Clay?
Median Family Income in Clay is $137,250.
What is the Median Household income in Clay?
Median Household Income in Clay is $118,000.
What is Income or Wage Gap in Clay?
Income or Wage Gap in Clay is 41.4%.
Women in Clay earn 58.6 cents for every dollar earned by a man.
What is Inequality or Gini Index in Clay?
Inequality or Gini Index in Clay is 0.33.
How Large is the Labor Force in Clay?
There are 506 People in the Labor Forcein in Clay.
What is the Percentage of People in the Labor Force in Clay?
53.6% of People are in the Labor Force in Clay.
What is the Unemployment Rate in Clay?
Unemployment Rate in Clay is 7.7%.